Article

Rare Ellagic Acid Sulphate Derivatives from the Rhizome of Geum rivale L.—Structure, Cytotoxicity, and Validated HPLC-PDA Assay

by
Aleksandra Owczarek
1,*,
Marek Różalski
2,
Urszula Krajewska
2 and
Monika Anna Olszewska
1
1
Department of Pharmacognosy, Faculty of Pharmacy, Medical University of Lodz, 1 Muszynskiego St., 90-151 Lodz, Poland
2
Department of Pharmaceutical Biochemisty and Molecular Diagnostics, Faculty of Pharmacy, Medical University of Lodz, 1 Muszynskiego St., 90-151 Lodz, Poland
*
Author to whom correspondence should be addressed.
Appl. Sci. 2017, 7(4), 400; https://doi.org/10.3390/app7040400
Submission received: 8 March 2017 / Revised: 3 April 2017 / Accepted: 10 April 2017 / Published: 15 April 2017
(This article belongs to the Section Chemical and Molecular Sciences)

Abstract

:
Two rare sulphate ellagic acid derivatives were isolated from the rhizome of Geum rivale L. in three simple steps. Their structures were identified by comprehensive NMR studies (1H NMR, 13C NMR, 1H-1H COSY, HMBC, HSQC) as 3,3′-dimethoxy-4-sulphoxyellagic acid potassium salt (1) and 3,3′,4′-trimethoxy-4-sulphoxyellagic acid potassium salt (2). Subsequently, a new precise (RSD < 2.6%), accurate (recoveries in the range of 96.5–98.7%), and sensitive (LODs in the range of 0.15–0.16 μg/mL) HPLC-PDA procedure was developed for the simultaneous quantification of compounds 1 and 2 in plant material. The rhizome of G. rivale proved to be a good source of both compounds, with the content of 2.94 ± 0.03 and 5.45 ± 0.03 mg/g dw respectively, whereas at most, trace amounts were detected in related plant materials (aerial parts of G. rivale, rhizome and aerial parts of G. urbanum). The cytotoxicity of isolated compounds tested on human leukaemia (promyelocytic HL-60 and lymphoblastic NALM-6) and melanoma (WM 115) cell lines with IC50 values in the range of 306.4–473.8 μM was demonstrated to be lower than that of ellagic acid (IC50 = 62.3–300.6 μM).

Graphical Abstract

1. Introduction

Geum rivale L. (water avens, purple avens) is an herbaceous plant of Rosaceae family that is widespread in the regions of temperate climate of northern hemisphere [1]. Together with closely related G. urbanum L., it has been used in traditional medicine as astringent and antiseptic agent in the treatment of diarrhoea, digestive disorders, and haemorrhoids [2]. Isolation studies concerning the species have so far been limited to the aerial parts and led to the isolation and identification of triterpenoid, flavonoid, and phenolic acid derivatives [3,4]. The plant is also known to accumulate large amounts of tannins, especially in underground organs [5]. In previous studies, the authors of this paper demonstrated that the rhizome of G. rivale is particularly rich source of ellagic acid (60.6 mg/g dry weight (dw) of the plant material), found mainly in a bound form [6].
Ellagic acid is a bi-lactone compound occurring widely in plant kingdom. It has been broadly studied due to its strong antioxidant and chemopreventive potential and was demonstrated to have a variety of other biological effects, e.g., cytotoxic, antimicrobial, and anti-inflammatory activities [7]. It is formed in plants from hexahydroxydiphenic acid—a product of oxidative dimerization of two vicinal galloyl moieties in gallotannin molecules—and accumulated in a free form or transformed further into various derivatives, usually by methylation and glycosylation or very rarely by sulphation [7,8]. Because of the activity of the parent compound, these derivatives are often investigated to find out the impact of different substituents on its pharmacological properties.
Sulphate derivatives of ellagic acid are especially rare in nature. So far, they have been found in only eight species including Potentilla candicans Humb. and Bonpl. ex Nestl., Tamarix tetragyna Ehrenb., Tamarix amplexicaulis Ehrenb., Frankenia laevis L., Euphorbia sororia A. Schrenk, Langerstroemia speciosa (L.) Pers., and Reaumuria vermiculata L. [9,10,11,12,13,14,15]. Of particular interest and best recognized is their inhibitory activity towards aldose reductase—an enzyme taking part in the pathogenesis of diabetes complications. In fact, 3,3′,4-trimethoxy-4-sulphoxyellagic acid potassium salt isolated from Potentilla candicans is among the strongest aldose reductase inhibitors of natural origin (IC50 = 0.08 μM), and the presence of sulphate moiety was demonstrated to have crucial impact on its effectiveness, enhancing it over twice in comparison to ellagic acid (IC50 = 0.20 μM) [9]. However, the influence of sulphation on other activity parameters of ellagic acid such as cytotoxicity has not been investigated to date, despite the known direct apoptotic and anti-proliferative effects (IC50 = 37–72 μM) of the basic structure towards a number of cancer cell lines (Caco-2 colon, HT-29 colon, HTC 116 colon, MCF-7 breast, Hs 578T breast, DU 145 prostatic) [16,17].
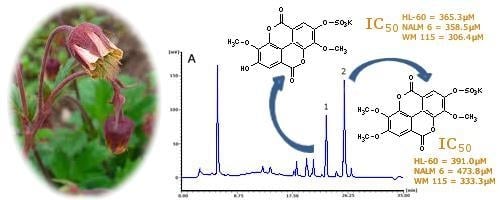
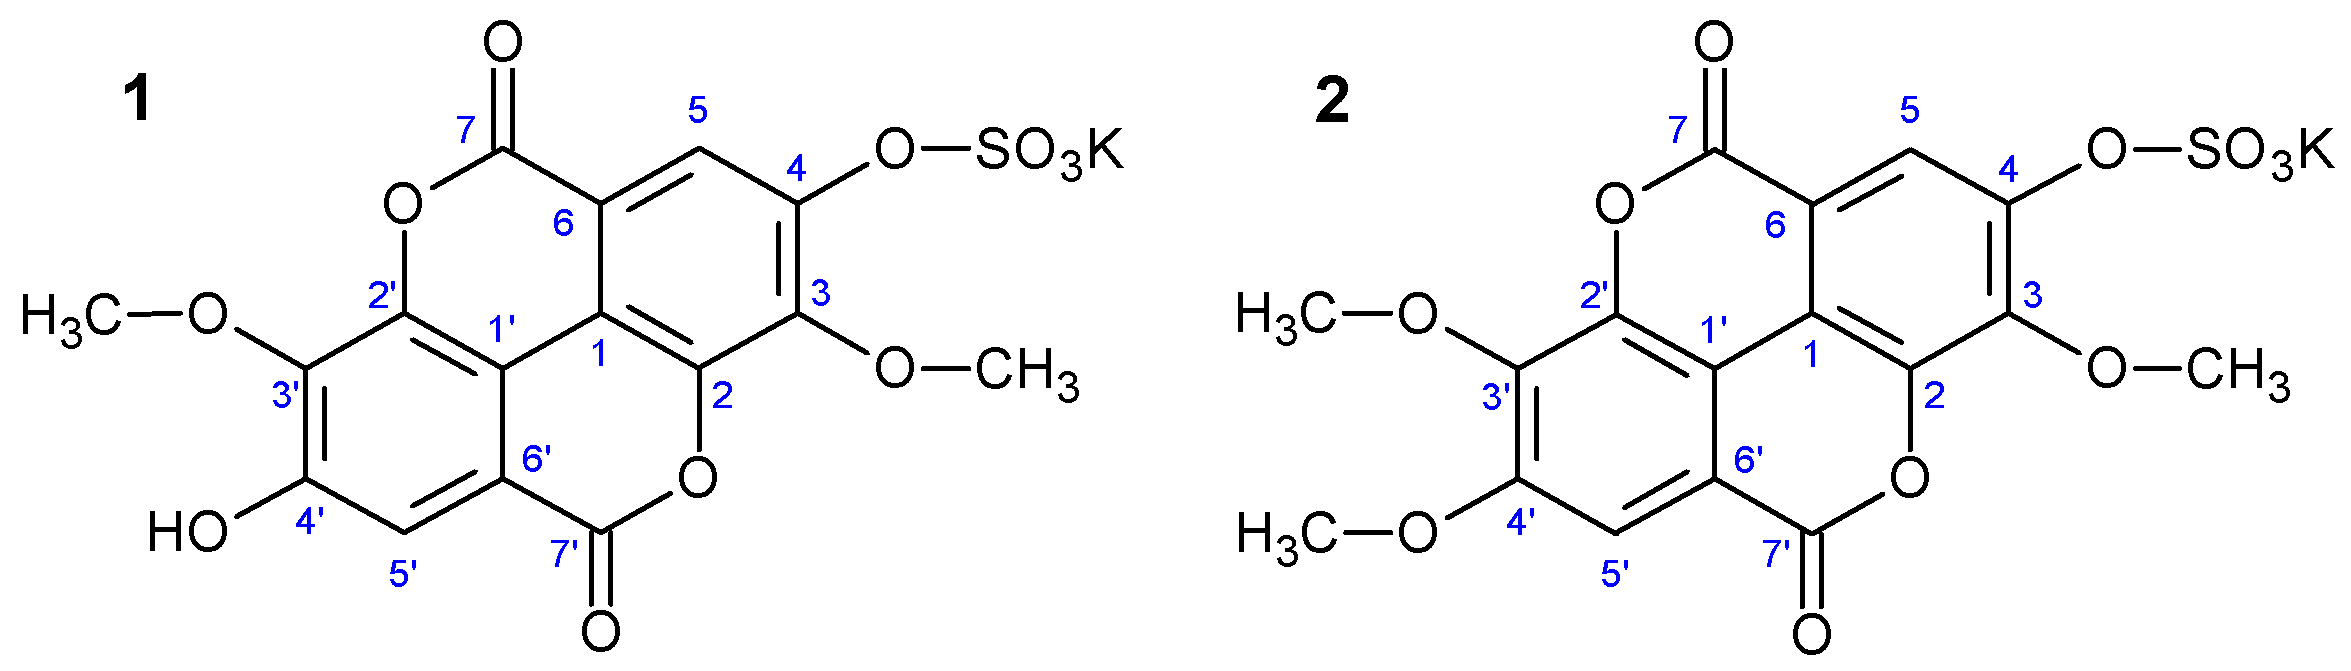
The research on this interesting class of compounds is undoubtedly hindered by their scant occurrence, and lack of the analytical methodology allowing their standardisation in plant tissues and selection of potential new natural sources. This work describes the isolation and identification of two of these rare derivatives—3,3′-dimethoxy-4-sulphoxyellagic acid potassium salt (1) and 3,3′,4′-trimethoxy-4-sulphoxyellagic acid potassium salt (2)—from the rhizome of a common European species G. rivale. Furthermore, HPLC-PDA methodology was optimized and validated to evaluate G. rivale rhizome as a source of sulphate derivatives of ellagic acid in comparison to related plant materials. The cytotoxicity of both isolates was also tested and compared with that of ellagic acid to assess the influence of the sulphate moiety on the anti-cancer activity of the parent compound.

2. Materials and Methods

2.1. General

UV-Vis spectra of the isolates 1 and 2 and the standard ellagic acid (Sigma-Aldrich, Seelze, Germany/St. Louis, MO, USA) were recorded in water at 25 °C on a Perkin-Elmer Lambda 25 spectrophotometer (Waltham, MA, USA). HR-ESI-TOF-MS spectra were measured on a MaldiSYNAPT G2-S HDMS spectrometer (Waters, Milford, MA, USA) with ESI as an ion source (operating in the negative-ion mode) and a TOF detector. 1H NMR, 13C NMR, 1H-1H COSY, HMQC, and HMBC spectra were recorded at 25 °C on a Bruker Avance III 600 spectrometer (Bruker BioSpin Co., Billerica, MA, USA) in D2O (600 MHz for 1 H and 150.9 MHz for 13C), with TMS as the internal standard. The TLC was performed on silica gel 60 G precoated plates (Merck, Darmstadt, Germany) using horizontal DC chambers (Chromdes, Lublin, Poland). Chromatograms were visualized by UV-Vis at 366 nm before and after spraying with diphenylboryloxyethylamine (Sigma-Aldrich). Sephadex LH-20 (50 g, Sigma-Aldrich, Germany/USA) was used for column chromatography. All solvents and chemicals of analytical grade used in the preparative studies were obtained from Chempur (Piekary Slaskie, Poland).

2.2. Plant Material

The rhizome of G. rivale as well as the aerial parts of G. rivale and the aerial parts and rhizome of G. urbanum were collected in Lodz in May 2012 from plants growing in natural habitats. The material was identified by Prof. Jan Gudej from the Department of Pharmacognosy, Medical University of Lodz, Poland. A voucher specimens (KFG/HB/05012-GRV, KFG/HB/05012-GUR) was deposited in the Department of Pharmacognosy, Medical University of Lodz, Poland. Prior to the analysis, the plant samples were powdered using an electric grinder, sieved through a 0.315-mm sieve, and stored in airtight containers at ambient temperature and in darkness until used.

2.3. Preparative Extraction and Isolation

A preparative sample (300 g) of the dried and grinded plant material was exhaustively extracted with acetone-water 70:30 (v/v) at room temperature (22–25 °C) by mechanical shaking (6 × 3 L × 8 h). The combined acetone-water extracts were concentrated in vacuum until complete removal of acetone and then extracted with ethyl acetate (6 × 100 mL) to remove less polar constituents. The water residue containing the compounds of interest was evaporated to dryness and resolved in boiling methanol (500 mL). After 24 h, the crystallised residue (12 g) containing compounds 1 and 2 was obtained. A portion of the precipitate (0.5 g) was subjected to open column gel permeation chromatography over Sephadex LH-20 and eluted with water. The eluates were monitored by TLC (ethyl acetate : methanol : formic acid, 18:1:1, v/v/v) on silica gel 60 G precoated plates. The fractions containing the separated analytes were combined and independently re-chromatographed over Sephadex LH-20 to obtain 35 mg of compound 1 and 40 mg of compound 2, respectively. The replicate rounds of chromatography of two further portions (2 × 0.5 g) of the precipitate confirmed the isolation yield of 2.80 mg/g and 3.20 mg/g dry weight (dw) of the plant material, respectively. The purity of the isolates assessed by HPLC-PDA was 97.3% and 98.1%, respectively.
3,3′-dimethoxy-4-sulphoxyellagic acid potassium salt (1)—whitish amorphous powder; UV (H2O) λmax: 245, 350sh, 362; HR-ESI-TOF-MS: 408.9869 [M–K] (calcd. for C16H9O11S, 408.9877), 329.0244 [M–KSO3]; 1H and 13C NMR data (D2O): see Table 1.
3,3′,4′-trimethoxy-4-sulphoxyellagic acid potassium salt (2)—whitish amorphous powder; UV (H2O) λmax: 246, 347sh, 361; HR-ESI-TOF-MS: 423.0009 [M–K] (calcd. for C17H11O11S, 423.0022), 343.0397 [M–KSO3]; 1H and 13C NMR data (D2O): see Table 1.

2.4. Quantitative HPLC-PDA Assay

2.4.1. HPLC-PDA Equipment and Methodology

Qualitative HPLC analyses were carried out using Waters 600E Multisolvent Delivery System (Waters, Milford, MA, USA) with a PDA detector (Waters 2998) scanning in the wavelength range of 220–450 nm, a model 7725 sample injection valve (Rheodyne, Pittsburgh, PA, USA) with a 20 μL injection loop, and an LC workstation equipped with Waters Empower 2 software for data collection and acquisition. A Nucleodur C18 HPLC column (250 × 4.6 mm i.d., 5 μm; Macherey-Nagel, Bethlehem, PA, USA) guarded by a C18 Hypersil ODS pre-column (5 mm, 4 mm × 4 mm, i.d.; Agilent Technologies, Palo Alto, CA, USA) was used. Constant temperature of the column was maintained at 25 °C using a Jetstream Plus 5480 thermostat (Peltier, Langenzersdorf, Austria). The phenolic compounds were separated using the mobile phase consisting of solvent A (0.5% water solution of orthophosphoric acid, w/v) and solvent B (methanol), with the elution profile as follows: 0–1 min, 20% (v/v) B; 1–25 min, 20–70% (v/v) B; 25–28 min, 70% (v/v) B; 28–29 min, 70–20% (v/v) B; 29–35 min, 20% (v/v) B (equilibration). All gradients were linear. Flow rate: 1.0 mL/min. Detection wavelength: 360 nm. All chemicals used in HPLC analyses including methanol (Avantor Performance Materials, Gliwice, Poland), water, and 85% (w/w) orthophosphoric acid (Merck, Darmstadt, Germany) were of HPLC grade.

2.4.2. Sample Preparation

An accurately weighted sample of the plant material (1000 mg) was extracted three times with deionised water by mechanical shaking (15 min for each run) using sequential volumes of 20 mL, 10 mL, and another 10 mL of the solvent. The obtained extracts were combined, diluted with water to 50 mL, filtered through the syringe filter (25 mm, 0.2 µm, Vitrum, Praha, Czech Republic) and directly subjected to the HPLC system (20 µL). Determinations were performed after three separate extractions of each sample, and each extract was injected in triplicate.

2.4.3. Method Validation

The analytical method was validated by determination of the selectivity, linearity, precision, accuracy, and stability of each analyte, according to the International Council for Harmonisation (ICH) Guidance for Industry [18] and some previous literature reports [19].
The standard stock solution of compounds 1 and 2 was prepared in triplicate in deionised water and serially diluted (in two replicates) with the same solvent to six concentration levels (2%, 10%, 25%, 50%, 75%, and 100% of the stock concentration) within the ranges of 2.98–149.30 μg/mL and 3.14–157.20 μg/mL, respectively. The replicate solutions were injected three times into the HPLC system. Calibration tests were run at the beginning, midpoint, and at the end of the analytical tests. A calibration graph was constructed by plotting the mean peak area versus concentration. The linearity was tested by the regression method of least squares and the statistical F- and t-tests at the 99% confidence level. The residuals from linear regression models were tested ex post to check the validity of the assumptions of normality, independence and homoscedasticity of the response variables. The possible matrix effects were evaluated by constructing the sensitivity plots for the standards dissolved in the real sample of the rhizome of G. rivale. Concentration ranges of the added standards were the same as those used for calibration. Statistical differences between the slopes of the matrix-matched linear regression equations and the calibration curves were tested by the Tukey’s honest significant difference (HSD) test at the 95% confidence level.
The limit of detection (LOD) and limit of quantitation (LOQ) values were estimated from the standard solution diluted with water to provide serial solutions with their concentrations decreasing to the smallest detectable peaks. The LODs were accepted with the 3-signal-to-noise (S/N) ratio, while the LOQs were accepted if the relative standard deviation (RSD) values for peak area were less than 15% for both intraday and inter-day variability with S/N ratio greater than 10, according to [20].
Stability of the standards was tested using standard stock solution. The solution was kept at 4 °C for 30 days and the content of compounds 1 and 2 was determined every fifth day and compared with the initial concentration.
The precision tests were performed in triplicate using standard solution at two concentration levels (10% and 100% of the stock concentration) and the real sample of the rhizome of G. rivale. The replicate solutions were injected three times into the HPLC system and the RSD values were calculated for both retention time and peak area, and considered as a measure of precision. The repeatability (intra-day variability) was determined by analysing each sample within 24 h, while the reproducibility (inter-day variability) was measured on three non-consecutive days.
The accuracy of the method was tested in the extract of G. rivale rhizome by means of the standard addition/recovery procedure at three different levels (0.25, 1.25, or 2.5 mg) of each standard, corresponding to the investigated analytical range. The samples were prepared in triplicate according to the procedure described above (Section 2.4.2) with the standards added to the plant material prior to the extraction. The replicate samples were injected in triplicate, and the accuracy was evaluated by calculating the mean recovery of the analytes from the spiked extracts versus the non-spiked samples.

2.4.4. Cytotoxic Activity Assay

Cytotoxicity of the compounds was assessed by the mitochondrial reduction assay [21] on two human leukaemia cell lines (promyelocytic HL-60 and lymphoblastic NALM-6) and on human melanoma cell line WM 115. Cells were purchased from the European Collection of Cell Cultures (ECACC, Salisbury, UK). Leukaemia cells were cultured in RPMI 1640 medium, while WM 115 cells in DMEM (Dulbecco’s Modified Eagle Medium), both supplemented with 10% heat-inactivated foetal bovine serum (Invitrogen, Paisley, UK) and antibiotics (100 mg/mL streptomycin and 100 U/mL penicillin). Cells were grown in 37°C, in a humidified atmosphere of 5% CO2 in air. Exponentially growing cells were seeded at 8 × 10³ per well on 96-well plates (Nunc, Roskilde, Denmark). After 24 h, the tested compounds (freshly prepared in DMSO and diluted with complete culture medium to obtain the concentration range from 0.1 to 1000 μM) were added and the plates were incubated for 48 h. Afterwards, 3-(4,5-dimethylthiazol-2-yl)-2,5-diphenyltetrazolium bromide (MTT, 5 mg/mL in PBS) was added and incubation was continued for 2 h. The metabolically active cells reduced MTT to blue formazan crystals. MTT-formazan crystals were dissolved in 20% SDS and 50% DMF at pH 4.7 and absorbance was read at 570 nm on an ELISA-plate reader (ELX 800, Bio-Tek, Winooski, VT, USA) and compared with that of the control (untreated cells). The IC50 values (the concentrations of the test compounds required to reduce the cells survival by 50% in comparison to the untreated cells) were calculated from concentration-response curves and used as a measure of cellular sensitivity to a given treatment. Unless stated otherwise, all reagents used in the cytotoxicity tests were from Sigma-Aldrich (Germany/USA).

2.4.5. Statistical and Data Analysis

The results were expressed as means ± standard deviation (SD) of replicate determinations. The statistical analyses (calculation of SD, one-way analysis of variance, HSD Tukey tests, linearity studies) were performed using the Statistica12 PL software for Windows (StatSoft, Krakow, Poland), with p values less than 0.05 being regarded as significant.

3. Results

3.1. Isolation and Structure Elucidation

Compounds 1 and 2 were isolated from acetone-water (70:30, v/v) extract of the rhizome of G. rivale in three simple steps. The extraction solvent was selected to limit co-extraction of ballast substances. The purification procedure was fairly uncomplicated due to the specific physical properties of the compounds, especially their solubility profile. The crude acetone-water extract was first fractionated by liquid-liquid partitioning with ethyl acetate to remove less polar constituents such as lipophilic terpenoids, free phenolic acids, flavonoids, and low molecular weight proanthocyanidins. The mixture of the target analytes was next obtained by spontaneous crystallisation from the water residue reconstituted beforehand in hot methanol. The pure compounds 1 and 2 were finally separated by open column gel permeation chromatography on Sephadex LH-20 with the recalculated isolation yield of 2.80 mg/g and 3.20 mg/g dw of the plant material, respectively.
Compounds 1 and 2 were obtained as whitish amorphous powders that were very soluble in water and hardly soluble in methanol. Their UV-Vis spectra with maxima at 245, 362 nm and 246, 361 nm, respectively, were closely similar to that of ellagic acid (253, 334 nm). The aqueous solution of both compounds revealed the presence of potassium ion by flame atomic absorption while aqueous hydrolysate after mild acidic hydrolysis (0.1 N HCl, 100 °C, 2 min) gave white precipitate with barium chloride (BaCl2) indicating the presence of a sulphate ion. These were strong indicators that both compounds are potassium salts of sulphate derivatives.
The molecular formula of compound 1 was established to be C169O11S by HR-ESI-TOF-MS (negative-ion mode) accurate mass measurement (observed 408.9869 [M–K], calculated 408.9877). The fragmentation ion resulting from the cleavage of a sulphate group [M–80] was also observed at 329.0129 m/z. The 1H NMR spectrum of 1 in D2O (Table 1) revealed the presence of four signals, including two resonances of aromatic protons at δH 7.8 (1H, s) and δH 7.0 (1H, s), which corresponded to H-C(5) and H-C(5′), respectively, as well as two three-proton singlets observed at δH 4.1 and δH 4.2, and identified as the signals of methoxy groups. The 1H-1H COSY spectrum showed no couplings between the protons. As compared to the corresponding resonances of free ellagic acid and its methyl ethers [12,14], the large downfield shift (ΔδH = + 0.4) observed for H-C(5) indicated the anisotropic effect of a strong electronegative group in the ortho-position and suggested thereby the substitution of the sulphate moiety at C(4) [14]. The HMQC spectrum of 1 displayed cross-peaks between the methoxy proton singlets listed above and carbon resonances found in the 13C NMR spectrum at δC 62.3 and δC 61.6, respectively. Both were located relatively downfield, suggesting their attachment to an aromatic ring carbon which has adjacent oxygenated ring carbons on both sides and thus confirming their position at C(3) and C(3′), respectively [12]. Based on the HMQC and HMBC spectra, the carbon resonances for C(1), C(1′), C(4), C(4′), C(5), and C(5′) were next unambiguously assigned (Table 1). As for the C-4 carbon signal the large upfield shift (ΔδC = −3.1) was found in comparison with that of the corresponding signal of free ellagic acid [12], the proposed substitution position of the sulphate group was further confirmed. The remaining assignments for aromatic carbons C(2), C(2′), C(6), and C(6′), as well as for carbonyl carbons C(7) and C(7′), were deduced by applying the known substituent parameters and basic additive rules [22] for predicting the chemical shifts of atomic nuclei in organic compounds. Eventually, compound 1 was identified as 3,3′-trimethoxy-4-sulphoxyellagic acid potassium salt (Figure 1).
The molecular formula of compound 2 was established to be C17H11O11S by HR-ESI-TOF-MS in the negative-ion mode (observed 423.0009 [M–K], calculated 423.0022). The NMR data of 2 were closely similar to that of 1 apart from the presence of additional three-proton (δH 3.9) and carbon (δC 56.7) signals correlated with each other in HMQC spectrum. Based on the HMBC spectrum it was established that the signals correspond to the methoxy group in C(4′) position (Table 1). Therefore, the structure of compound 2 was recognised as 3,3′,4’-dimethoxy-4-sulphoxyellagic acid potassium salt (Figure 1).
The present work is the third report on the occurrence of both sulphate derivatives in the plant kingdom, and in the case of compound 2, the first report on its full NMR data. In the previous studies, compound 2 was isolated from the root of Potentilla candicans, Rosaceae [9] and the aerial parts of Euphorbia sororia, Euphorbiaceae [13], while compound 1 was obtained from the latter tissue and the wood of Tamarix tetragyna, Tamaricaceae [10].

3.2. HPLC-PDA Quantitative Assay

Due to the lack of existing quantitative methods for the determination of sulphate ellagic acid derivatives in plant materials, all steps of the newly developed analytical procedure had to be optimised. First, the extraction procedure was elaborated to ensure the maximal recovery of the tested analytes 1 and 2. Among different solvents tested (water, methanol, and mixtures thereof), water proved to be the most efficient extractant (Figure 2), which is consistent with ionic character of the sulphates and their hydrophilicity. It was also found that increased temperature (higher than 30 °C) has a negative impact on the recovery of both analytes, which is most likely connected with their proneness to undergo hydrolysis. Finally, an extraction procedure was established that consisted of three successive extraction periods (15 min) with water (1 × 20 mL + 2 × 10 mL/1000 mg dw of the plant tissue) in room temperature (22–25 °C) with the aid of mechanical shaking.
Water plant extracts are usually complex substances containing a number of natural polar compounds, such as polysaccharides, saponins, and especially polyphenols including free phenolic acids, flavonoid glycosides, and tannins of a wide range of molecular weights, which form matrices difficult to separate by liquid chromatography and able to increase plug risks in column techniques. To overcome these problems in the G. rivale extract, the reverse phase (RP) HPLC technique (recommended mainly for low molecular weight analytes) and classic column (Nucleodur C18, 250 × 4.6 mm; Macherey-Nagel) packed with porous 5-µm particles (relatively resistant to plugging) were selected for the study. During the final method development, the gradient elution was optimised for satisfactory separation of the target compounds, the detection wavelength was set at λ = 360 nm to maximise sensitivity, and temperature was set at 25 °C as a compromise between the total separation time and stability of the critical analytes. Representative chromatograms (Figure 3) show good resolution of the matrix peaks and high selectivity of the developed method for the quantification of compounds 1 and 2.
The developed method was validated according to the International Council for Harmonisation (ICH) Guidance for Industry [18] and some previous literature reports [19] and was found to be satisfactory selective, precise, accurate, and sensitive. Selectivity of the method and peak purity were analysed by the comparison of retention times and UV-Vis spectra with the reference isolates 1 and 2 using an automated match system. The comparison of the spectra upslope, apex, and downslope, and between the peak spectral data at different wavelengths confirmed that all analyte peaks of the real samples eluted as pure bands. Calibration standards were prepared in water. Linearity of the calibration curves was tested using two linear regression models (y = ax + b; y = ax), and the F- and t-tests were applied to check statistical significance of the regression equations, slopes, and intercepts at the 99% confidence level. The correlation coefficient r of the accepted equations was not less than 0.99994 for both analytes, and the chromatographic responses were linear in wide concentration ranges (Table 2). Since no significant differences (p < 0.05) were found between the slopes of the calibration curves and the matrix-matched sensitivity plots, the calibration standards prepared in water were assumed to be appropriate for the quantification of the target sulphates in plant materials. The sensitivity of the method was demonstrated by the low LOD (0.15 μg/mL; 0.16 μg/mL) and LOQ (0.52 μg/mL; 0.54 μg/mL) values (Table 2). The LODs and LOQs of both compounds were similar, as were the slopes of their regression curves, which is consistent with their close structural similarity and, thus, similar UV-Vis absorption. Stability of the standards (expressed as recovery of the initial concentration) was tested at 4 °C during 30 days in five-day intervals. All analytes were found to be stable in water, with the 30th-day recovery >95%. Precision of the method was tested for the standard solution and real sample of the rhizome of G. rivale. The RSD values for intraday and inter-day variabilities were less than 1.5% and 2.6% for the retention times and peak areas, respectively (Table 3). Accuracy of the method was tested by determination of recovery by the standard addition technique, and the average total recovery was in the range of 96.5–98.7% for the both analytes, with RSDs less than 2.4% (Table 3).
All validation data demonstrated that the developed HPLC-PDA method is suitable for quantitation of compounds 1 and 2 in real plant samples. However, the optimisation tests revealed that the separation results were susceptible to variations in several analytical conditions, especially in mobile-phase composition, flow rate, and column temperature. Therefore, the main system suitability parameters such as the RSD values for retention times and peak areas should be regularly controlled using the standard solution to ensure that the validity of the proposed method is maintained, whenever used.
The developed method was next applied to the simultaneous determination of the sulphates 1 and 2 in the real samples of the rhizome of G. rivale and the related plant materials—G. rivale aerial parts, as well as the rhizome and aerial parts of G. urbanum. The contents of compounds 1 and 2 in the G. rivale rhizome were found to be 2.94 ± 0.03 and 5.45 ± 0.03 mg/g dw, respectively, whereas at most trace amounts (<LOQs) were detected in other investigated plant materials (Table 4).

3.3. Cytotoxic Activity

The cytotoxicity of the isolated compounds was tested on three different human cancer cell lines in a wide range of concentrations (0.1–1000 μM) and compared with the cytotoxicity of ellagic acid as the standard parent compound. The three analytes decreased viability of all model cell lines in a dose-dependent manner. The standard was found to be moderately cytotoxic towards all lines investigated with the lowest IC50 value at 62.3 ± 9.7 μM for melanoma cells WM 115. The cytotoxicity of compounds 1 and 2 was significantly lower, with the IC50 values in the range of 306.4–473.8 μM, and the highest activity was found also for the WM 115 line (Table 5). Despite this similarity, the sensitivity profile of the tested cancer cells on the sulphate derivatives was noticeably different as compared to ellagic acid. In the case of the standard, the cytotoxicity decreased significantly from the WM 115 line, through lymphoblastic leukaemia NALM-6 cell line (IC50 = 124.9 ± 50.5 μM), to promyelocytic cells HL-60 (IC50 = 300.6 ± 12.3 μM), whereas the anti-cancer activity of compounds 1 and 2 was similarly low for all tested cells.

4. Discussion

Due to their specific physicochemical and biological characteristics, sulphated phenolic conjugates are undoubtedly an interesting class of compounds. Unfortunately, they are generally not very common in nature. Sulphated flavonoids, which are by far the most prevalent group, have been found in over 250 species [23]. Some sulphate derivatives of phenolic acids, anthraquinones, and coumarins have also been identified [24]. Only eight species from five different families were reported to contain ellagic acid sulphates. This paper is the first report of that type of compounds in the genus Geum, and second in the Rosaceae family. Compound 1 has previously only been isolated from Tamarix tetragyna and Euphorbia sororia, whereas compound 2 has previously been isolated from the latter species and Potentilla candicans [9,10,13].
The results of quantitative analysis confirmed that the rhizome of G. rivale is a good source of the investigated compounds. On the other hand, only trace amounts of the analytes were found in the aerial parts of the plant, which demonstrates that accumulation of the sulphates is organ-specific. As the production of particular metabolites is often taxonomically dependent, the rhizome and aerial parts of closely related species—G. urbanum—were also investigated. The compounds were detectable only in the rhizome of G. urbanum, but the content below the quantification limit excludes the plant material as an alternative source of the analytes.
The relatively high yields from the isolation procedure (6.00 mg/g; 71.5% of the factual content) indicate that the developed simple separation procedure might be successfully applied for cost-effective production and purification of these natural chemicals. Previously, the highest yield was obtained from Potentilla candicans—1.6 g of compound 2 was isolated from 5 kg of dry plant material [9] which corresponds to the content of only 0.3 mg/g dw. However, the methods used in the study were multi-step general isolation procedures, not targeted at any particular compound. Thus, the recovery of those methods may underestimate the actual content of the isolates.
The role of phenolic sulphates in plant metabolism remains yet to be fully explained although some specific compounds were found to have significance in plant growth, development, and adaptation to stress [25,26]. It was postulated before for sulphated flavonoids that their occurrence in plants is rather an ecological adaptation than a taxonomical trait [27]. The differences in the sulphates content between two closely related species examined in our study seems to confirm this assumption. However, the most common hypothesis about their role in adaptation to water-stress [27,28], does not appear to be valid here—in contrast to many of the plants containing sulphate derivatives of ellagic acid, e.g., Tamarix sp., Reaumuria vermiculata, and Frankenia laevis that thrive on dry or salty soils [12,15,29], G. rivale prefers slow draining soils where water is in abundance [1].
As far as pharmacological effect on human organism is considered, several biological activities were found for sulphated phenolics including anticoagulant, antiviral, antitumor, antibacterial, and anti-inflammatory capacity. On the other hand, the knowledge on the biological properties of sulphate ellagic acid derivatives is very limited. Apart from considerable inhibitory activity towards aldose reductase noticed for compound 2 isolated from P. candicans [9], compounds 1 and 2 were also found to exhibit moderate antimicrobial potential against Bacillus subtilis and Staphylococcus aureus with MIC values in the range of 22.54–50.83 μg/mL [13]. They were, however, not effective against Escherichia coli [13]. So far, there has been no research about their cytotoxic activity.
Ellagic acid is a well-known chemopreventive agent protecting cells against DNA damage and mutations caused by various carcinogenic factors such as radiation, aflatoxins, benzo[a]pyrene, and N-nitrosobenzylmethylamine [7]. There are also plenty of data confirming its direct apoptotic and anticancer activity towards a number of human tumours including breast, colon, prostate, and oral carcinoma, although in most cases its cytotoxicity, with the IC50 values estimated in the range of 10–350 μM, was moderate as compared with cytostatics used in clinical practice [16,17]. This study’s results (Table 4) obtained for the free acid from leukaemia and melanoma cell lines are consistent with the above findings.
The data concerning substituted derivatives of ellagic acid in general are scarce and to some extent contradictory. Nesser et al. [30] found that methylation of hydroxyl groups in the molecule leads to reduction of the cytotoxicity towards mice macrophages and postulated it could be connected with substitution of hydroxyl groups at C-3 and C-3′ positions, important for inhibitory activity towards topoisomerases [31]. The more polar glycosidic methylated derivatives were even less effective [31]. Similar findings were presented by Manayi et al. [32]—glycosylated and methylated derivatives had very weak cytotoxicity with IC50 values in the range of 374.5–711.7 μg/mL (1.09–1.41 mM). On the other hand, 3,3′-dimethylellagic acid 4′-O-β-d-xylopyranoside from Euphorbia hylonoma has been claimed to be effective against HepG2 human hepatocellular carcinoma cell line [33]. As this research shows, methylation connected with sulphation has negative impact on ellagic acid cytotoxicity against leukaemia and melanoma cell lines, the present work generally confirmed the majority of previous studies. However, a more detailed study would be needed for a series of ellagic acid derivatives to differentiate activity effects between methoxy and sulphoxy groups at various positions. Nevertheless, the observed decrease in cytotoxicity might be indeed partly connected with blockage of hydroxyl groups responsible for intermolecular interactions and hydrogen bond formation. The difficulties in trans-membrane transport may also be the cause. As was found in the case of flavonoid derivatives, the conjugation with strong polar groups such as sugar or sulphate moieties decreases the lipid solubility, the partition coefficient and thus the probability of effective passage across cell membranes [34].

5. Conclusions

This study is the first report on the isolation of rare ellagic acid sulphate potassium salts from the rhizome of G. rivale and from the genus Geum in general. The sulphates are present in reasonable quantities in the investigated plant material but are absent from aerial parts and from closely related species G. urbanum. The RP-HPLC-PDA assay reported here represents a new, simple, fast, and sensitive analytical tool for simultaneous determination of two ellagic acid sulphates in the plant materials. High resolution achieved between the both analytes and matrix peaks suggests a possible application of the method to other plant species of similar phenolic pattern. The elaborated short isolation procedure is highly efficient and could be recommended for cost-effective production of sulphate derivatives from the tested plant tissue. As a valuable source of sulphates, the G. rivale rhizome might be of some interest for further studies of this class of compounds in both activity and ecological aspects. In the present study, low cytotoxicity was observed for these natural chemicals.

Acknowledgments

The authors would like to express their gratitude to Prof. Jan Gudej for identification of the plant material. This work is supported by the Medical University of Lodz grants 503/3-022-01/503-31-001, 502-03/3-022-01/502-34-011, and 503/3-015-02/503-31-001.

Author Contributions

A.O. and M.A.O. conceived and designed the experiments; A.O., M.R. and U.K. performed the experiments; A.O. and M.A.O. analysed the data; M.A.O., M.R. and U.K. contributed reagents/materials/analysis tools; A.O. and M.A.O. wrote the paper.

Conflicts of Interest

The authors declare no conflict of interest.

References

  1. Taylor, K. Geum rivale L. J. Ecol. 1997, 85, 721–731. [Google Scholar] [CrossRef]
  2. Gruenwald, J. PDR for Herbal Medicines; Medical Economics Company Inc.: Montvale, NJ, USA, 2000. [Google Scholar]
  3. Panizzi, L.; Catalano, S.; Miarelli, C.; Cioni, P.L.; Campeol, E. In vitro antimicrobial activity of extracts and isolated constituents of Geum rivale. Phytother. Res. 2000, 14, 561–563. [Google Scholar] [CrossRef]
  4. Ming, D.S.; Jiang, R.W.; But, P.P.H.; Towers, G.H.N.; Yu, D.Q. A new compound from Geum rivale L. J. Asian Nat. Prod. Res. 2002, 4, 217–220. [Google Scholar] [CrossRef] [PubMed]
  5. Owczarek, A.; Gudej, J. Investigation into biologically active constituents of Geum rivale L. Acta Pol. Pharm. 2013, 70, 111–114. [Google Scholar] [PubMed]
  6. Owczarek, A.; Olszewska, M.A.; Gudej, J. Quantitative determination of ellagic acid and gallic acid in Geum rivale L. and G. urbanum L. Acta Biol. Crac. Bot. 2014, 56/2, 74–78. [Google Scholar] [CrossRef]
  7. Vattem, D.A.; Shetty, K. Biological functionality of ellagic acid: A review. J. Food Biochem. 2005, 29, 234–266. [Google Scholar] [CrossRef]
  8. Sticher, O. Phenolische Verbindungen. In Pharmakognosie—Phytopharmazie; Hänsel, R., Sticher, O., Eds.; Springer Medizin Verlag: Heidelberg, Germany, 2010; pp. 1055–1059. [Google Scholar]
  9. Terashima, S.; Shimizu, M.; Nakayama, H.; Ishikura, M.; Ueda, Y.; Imai, K.; Suzui, A.; Morita, N. Studies on aldose reductase inhibitors from medicinal plant of “Sinfito”, Potentilla candicans, and further synthesis of their related compounds. Chem. Pharm. Bull. 1990, 38, 2733–2736. [Google Scholar] [CrossRef] [PubMed]
  10. Hussein, S.A.M. New dimeric phenolic conjugates from the wood of Tamarix tetragyna. Nat. Prod. Sci. 1997, 3, 127–134. [Google Scholar]
  11. Souleman, A.A.M.; Barakat, H.H.; Hussein, S.A.M.; El-Mousallamy, A.M.D.; Nawwar, M.A.M. Unique phenolic sulphate conjugates from the flowers of Tamarix amplexiacaulis. Nat. Prod. Sci. 1998, 4, 245–252. [Google Scholar]
  12. Hussein, S.A.M. Phenolic sodium sulphates of Frankenia laevis L. Pharmazie 2004, 59, 304–308. [Google Scholar] [PubMed]
  13. Zhang, W.-K.; Xu, J.-K.; Zhang, X.-Q.; Yao, X.-S.; Ye, W.-C. Chemical constituents with antibacterial activity from Euphorbia sororia. Nat. Prod. Res. 2008, 22, 353–359. [Google Scholar] [CrossRef] [PubMed]
  14. Bai, N.; He, K.; Roller, M.; Zheng, B.; Chen, X.; Shao, Z.; Peng, T.; Zheng, Q. Active Compounds from Lagerstroemia speciosa, Insulin-like Glucose Uptake-Stimulatory/Inhibitory and Adipocyte Differentiation- Inhibitory Activities in 3T3-L1 Cells. J. Agric. Food Chem. 2008, 56, 11668–11674. [Google Scholar] [CrossRef] [PubMed]
  15. Nawwar, M.A.; Ayoub, N.A.; El-Rai, M.A.; Bassyouny, F.; Mostafa, E.S.; Al-Abd, A.M.; Harms, M.; Wende, K.; Lindequist, U.; Linscheid, M.W. Cytotoxic ellagitannins from Reaumuria vermiculata. Fitoterapia 2012, 83, 1256–1266. [Google Scholar] [CrossRef] [PubMed]
  16. Losso, J.N.; Bansode, R.R.; Trappey, A.; Bawadi, H.A.; Truax, R. In vitro anti-proliferative activities of ellagic acid. J. Nutr. Biochem. 2004, 15, 672–678. [Google Scholar] [CrossRef] [PubMed]
  17. Seeram, N.P.; Adams, L.S.; Henning, S.M.; Niu, Y.; Zhang, Y.N.; Muraleedharan, G.; Heber, D. In vitro antiproliferative, apoptotic and antioxidant acitivities of punicalagin, ellagic acid and a total pomegranate tannin extract are enhanced in combination with other polyphenos as found in pomegranate juice. J. Nutr. Biochem. 2005, 16, 360–367. [Google Scholar] [CrossRef] [PubMed]
  18. ICH. Validation of Analytical Procedures: Text and Methodology; Q2(R1); ICH: Geneva, Switzerland, 2005; Available online: http://www.ich.org/fileadmin/Public_Web_Site/ICH_Products/Guidelines/Quality/Q2_R1/Step4/Q2_R1__Guideline.pdf (accessed on 2 March 2017).
  19. Olszewska, M.A. New validated high-performance liquid chromatographic method for simultaneous analysis of ten flavonoid aglycones in plant extracts using a C18 fused-core column and acetonitrile-tetrahydrofuran gradient. J. Sep. Sci. 2012, 35, 2174–2183. [Google Scholar] [CrossRef] [PubMed]
  20. Corley, J. Best practices in establishing detection and quantification limits for pesticide residues in foods. In Handbook of Residue Analytical Methods for Agrochemicals; Lee, P.W., Aizawa, H., Barefoot, A.C., Murphy, J.J., Eds.; Wiley: New York, NY, USA, 2003. [Google Scholar]
  21. Hansen, M.B.; Nielsen, S.E.; Berg, K.J. Re-examination and further development of a precise and rapid dye method for measuring cell growth/cell kill. Immunol. Methods 1989, 119, 203. [Google Scholar] [CrossRef]
  22. Richards, S.A.; Hollerton, J.C. Essential Practical NMR for Organic Chemistry; John Wiley & Sons, Ltd.: Chichester, UK, 2011. [Google Scholar]
  23. Barron, D.; Varin, L.; Ibrahim, R.K.; Harborne, J.B.; Williams, C.A. Sulfated flavonoids—An update. Phytochemistry 1988, 27, 2375–2395. [Google Scholar] [CrossRef]
  24. Correia-da-Silva, M.; Sousa, E.; Pinto, M.M.M. Emerging sulfated flavonoids and other polyphenols as drugs: Nature as an inspiration. Med. Res. Rev. 2014, 34, 223–279. [Google Scholar] [CrossRef] [PubMed]
  25. Varin, L.; Marsolais, F.; Richard, M.; Rouleau, M. Biochemistry and molecular biology of plant sulfotransferases. FASEB J. 1997, 11, 517–525. [Google Scholar] [PubMed]
  26. Faulkner, I.J.; Rubery, P.H. Flavonoids and flavonoid sulphates as probes of auxin-transport regulation in Cucurbita pepo hypocotyl segments and vesicles. Planta 1992, 186, 618–625. [Google Scholar] [CrossRef] [PubMed]
  27. Harborne, J.B. Flavonoid sulfates—New class of sulfur-compounds in higher-plants. Phytochemistry 1975, 14, 1147–1155. [Google Scholar] [CrossRef]
  28. Bohm, B.A.; Rajakaruna, N. The Lasthenia californica story: It started with flavonoids. Nat. Prod. Commun. 2006, 1, 1013–1022. [Google Scholar]
  29. Waisel, Y. Biology of Halophytes; Academic Press: New York, NY, USA, 1972. [Google Scholar]
  30. Nesser, A.L.M.; Carli, C.B.A.; Rodrigues, C.M.; Maia, D.C.G.; Carlos, I.Z.; Eberlin, M.N.; Hiruma-Lima, C.A.; Vilegas, W. Identification of ellagic acid derivatives in methanolic extracts from Qualea species. Z. Naturforsch. C 2008, 63, 754–800. [Google Scholar]
  31. Constantinou, A.; Stoner, G.D.; Mehta, R.; Rao, K.; Runyan, C.; Moon, R. The dietary anticancer agent ellagic acid is a potent inhibitor of DNA topoisomerases in vitro. Nutr. Cancer 1995, 23, 121–130. [Google Scholar] [CrossRef] [PubMed]
  32. Manayi, A.; Saeidnia, S.; Ostad, S.N.; Hadjiakhoondi, A.; Ardekani, M.R.; Vazirian, M.; Akhtar, Y.; Khanavi, M. Chemical constituents and cytotoxic effect of the main compounds of Lythrum salicaria L. Z. Naturforsch. C 2013, 68, 367–375. [Google Scholar] [CrossRef] [PubMed]
  33. Zhang, H.; Guo, Z.J.; Xu, W.M.; You, X.J.; Han, L.; Han, Y.X.; Dai, L.J. Antitumor effect and mechanism of an ellagic acid derivative on the HepG2 human hepatocellular carcinoma cell line. Oncol. Let. 2014, 7, 525–530. [Google Scholar]
  34. Williamson, G.; Barron, D.; Shimoi, K.; Terao, J. In vitro biological properties of flavonoid conjugates found in vivo. Free Radic. Res. 2005, 39, 457–469. [Google Scholar] [CrossRef] [PubMed]
Figure 1. The structure of isolated compounds.
Applsci 07 00400 g001
Figure 2. Extraction efficiency of compounds 1 and 2 from the rhizome of G. rivale by water, methanol and mixtures (v/v) thereof (1 × 20 mL + 2 × 10 mL, mechanical shaking). Data presented as means ± SD (n = 3). For each compound, different superscripts (A–E) indicate significant differences in the mean values at α = 0.05.
Applsci 07 00400 g002
Figure 3. Representative chromatograms at λ = 360 nm of: (A) rhizome of G. rivale (20 mg/mL); (B) standards at concentrations of 37.33 μg/mL (1), 39.30 μg/mL (2).
Applsci 07 00400 g003
Table 1. NMR spectral data of compounds 3,3′-dimethoxy-4-sulphoxyellagic acid potassium salt (1) and 3,3′,4′-trimethoxy-4-sulphoxyellagic acid potassium salt (2) in D2O (600 MHz for 1H and 150.9 MHz for 13C) a.
Position b12
δHδCδHδC
1 116.1 115.5
2 139.5 e 139.5 c
3 144.8 144.7
4 144.4 144.7
57.8 (1H, s)119.67.8 (1H, s)119.5
6 110.0 f 110.2 d
7 159.3 159.0
1′ 110.5 111.6
2′ 140.0 e 139.7 c
3′ 140.2 140.8
4′ 152.2 154.1
5′7.0 (1H, s)111.97.1 (1H, s)107.7
6′ 111.6 f 111.2 d
7′ 159.3 159.0
Me-34.2 (3H, s)62.34.2 (3H, s)62.4
Me-3′4.1 (3H, s)61.64.1 (3H, s)61.8
Me-4 3.9 (3H, s)56.7
a Data acquired with tetramethylsilane TMS as the internal standard, δ in ppm. Multiplicities and coupling constants (in Hz) are given in parentheses. Assignments confirmed by HMQC and HMBC experiments; b For trivial atom numbering, see chemical formulas of 1 and 2; c,d,e,f Signals marked with the same superscript letters may be interchanged.
Table 2. Linear regression and sensitivity data.
AnalyteLinearity Range [μg/mL]Linear Regression (n) arF-test Value for Linear Fit bLOD c [μg/mL (ng)]LOQ c [μg/mL (ng)]
12.98–149.30y = 35,275.78x (6)0.999940,184.700.154 (3.09)0.516 (10.32)
23.14–157.20y = 37,247.76x (6)0.999969,674.880.163 (3.26)0.543 (10.86)
a y, peak area; x, concentration of the standard in (μg/mL); n, number of data points (concentration levels); b Fisher variance ratio for the experimental data (the critical value at α = 0.01 is 8.5310 for n = 6); c Limits of detection (LOD) and quantitation (LOQ) in (μg/mL) and in (ng).
Table 3. Validation parameters of precision and accuracy.
AnalytePrecision (RSD%) aAccuracy b
Level [μg/mL]Intra-Day VariabilityInter-Day VariabilitySpiked Level [μg/mL]Recovery (RSD [%])
tRPeak AreatRPeak Area
1149.300.610.761.131.35597.76 (2.39)
59.410.530.731.341.482598.64 (1.45)
14.930.641.251.322.145098.34 (1.75)
2157.200.650.651.251.69596.55 (1.97)
108.630.490.781.461.532598.72 (1.60)
15.720.611.341.392.535097.24 (1.43)
a Values for the standard solution tested at 100% and 10% of the stock concentration and for the rhizome of G. rivale (nominal concentration of 59.41 μg/mL for 1, and 108.63 μg/mL for 2); b Spiked levels refer to the analyte amount added to the sample of the rhizome of G. rivale (nominal concentration of 59.41 μg/mL for 1, and 108.63 μg/mL for 2).
Table 4. Content of compound 1 and 2 (mg/g dw) in investigated plant materials.
AnalyteG. RivaleG. Urbanum
RhizomeAerial PartsRhizomeAerial Parts
12.94 ± 0.03<LOQ<LOQnd
25.45 ± 0.03<LOQ<LOQnd
Data presented as means ± SD (n = 3); LOQ—limit of quantification; nd—not detected.
Table 5. Cytotoxic activity of the isolated compounds 1 and 2 and ellagic acid.
AnalyteIC50 [μM] a
HL-60NALM-6WM 115
Ellagic acid300.6 ± 12.3 A124.9 ± 50.5 A62.3 ± 9.7 A
1365.3 ± 34.3 B358.4 ± 61.7 C306.4 ± 57.3 B
2391.0 ± 54.7 B473.8 ± 41.5 B333.3 ± 22.2 B
a The values are means ± SD of three independent experiments performed in duplicates. Different superscripts (capitals, A–C) in each column indicate significant differences in the means (p < 0.05).

