Article

Improved Imaging of Magnetically Labeled Cells Using Rotational Magnetomotive Optical Coherence Tomography

1
Anesthesiology and Intensive Care Medicine, Clinical Sensoring and Monitoring, Faculty of Medicine Carl Gustav Carus, Technische Universität Dresden, 01307 Dresden, Germany
2
DFG-Center for Regenerative Therapies Dresden (CRTD), Technische Universität Dresden, 01307 Dresden, Germany
3
Department of Medical Physics and Biomedical Engineering, Faculty of Medicine Carl Gustav Carus, Technische Universität Dresden, 01307 Dresden, Germany
4
Institute of Anatomy, Faculty of Medicine Carl Gustav Carus, Technische Universität Dresden, 01307 Dresden, Germany
5
Institute for Metallic Materials, Leibniz Institute for Solid State and Materials Research, 01069 Dresden, Germany
6
German Center for Neurodegenerative Diseases (DZNE), 01307 Dresden, Germany
*
Author to whom correspondence should be addressed.
Appl. Sci. 2017, 7(5), 444; https://doi.org/10.3390/app7050444
Submission received: 20 January 2017 / Revised: 13 April 2017 / Accepted: 14 April 2017 / Published: 27 April 2017
(This article belongs to the Special Issue Development and Application of Optical Coherence Tomography (OCT))

Abstract

:
In this paper, we present a reliable and robust method for magnetomotive optical coherence tomography (MM-OCT) imaging of single cells labeled with iron oxide particles. This method employs modulated longitudinal and transverse magnetic fields to evoke alignment and rotation of anisotropic magnetic structures in the sample volume. Experimental evidence suggests that magnetic particles assemble themselves in elongated chains when exposed to a permanent magnetic field. Magnetomotion in the intracellular space was detected and visualized by means of 3D OCT as well as laser speckle reflectometry as a 2D reference imaging method. Our experiments on mesenchymal stem cells embedded in agar scaffolds show that the magnetomotive signal in rotational MM-OCT is significantly increased by a factor of ~3 compared to previous pulsed MM-OCT, although the solenoid’s power consumption was 16 times lower. Finally, we use our novel method to image ARPE-19 cells, a human retinal pigment epithelium cell line. Our results permit magnetomotive imaging with higher sensitivity and the use of low power magnetic fields or larger working distances for future three-dimensional cell tracking in target tissues and organs.

1. Introduction

Magnetomotive optical coherence tomography (MM-OCT) is a promising imaging method for noninvasive three-dimensional (3D) tracking of magnetically labeled cells in target tissues or organs [1,2,3]. In this situation, selected cells are labeled with magnetic micro- or nanoparticles as dynamic contrast agents, which are excited into motion by a modulated external magnetic field. By analysis of OCT signal alterations, this motion can be detected and visualized for enhanced contrast of labeled cells.
In conventional MM-OCT, the external magnetic field is generated by a solenoid close to the sample. Ideally, magnetomotion is characterized by particle displacement towards the solenoid when the current is switched on, and return of the particle to its initial position when the current is switched off. Hence, besides the magnetic force, also the restoring force of the elastic tissue environment is essential for the retrieval of appropriate magnetomotive signals. To expand MM-OCT to applications and environments where no elastic restoring force is present, such as in liquids, dual-coil configurations were introduced, in which the particles are attracted alternately by a primary and an opposite secondary coil on a common axis [4]. Such a setup would also be convenient for cell imaging, since cells are characterized by viscoelastic properties rather than a true elastic behavior [5]. However, because of the limited space between the two solenoids, this method is restricted to small samples only. Therefore, we introduce an alternative method called rotational magnetomotive (rMM)-OCT which uses two magnets on the same side of the sample but with two different axes. This off-axis configuration allows the generation of modulated longitudinal and transverse magnetic fields, which cause magnetomotion by the alignment and rotation of anisotropic magnetic particles in the sample volume.
For our experiments, we used a multimodal imaging system presented recently by our group [6]. This system allows MM-OCT imaging in combination with light microscopy and laser speckle reflectometry for structural and motion analysis of single cells. For the implementation of rMM-OCT, we added a small permanent magnet to the existing setup to generate the transverse magnetic field. After analysis of magnetic field components and particle behavior, we provide proof-of-principle evidence for rMM-OCT imaging of single mesenchymal stem cells (MSCs) embedded in agar scaffolds and demonstrate the magnetomotive signal enhancement compared to previous pulsed MM-OCT. Finally, we use our method to image ARPE-19 cells [7], a human retinal pigment epithelium (RPE) cell line, in order to demonstrate the potential of rMM-OCT to track therapeutically relevant cell types, such as RPE cells transplanted into the retina [8,9].

2. Materials and Methods

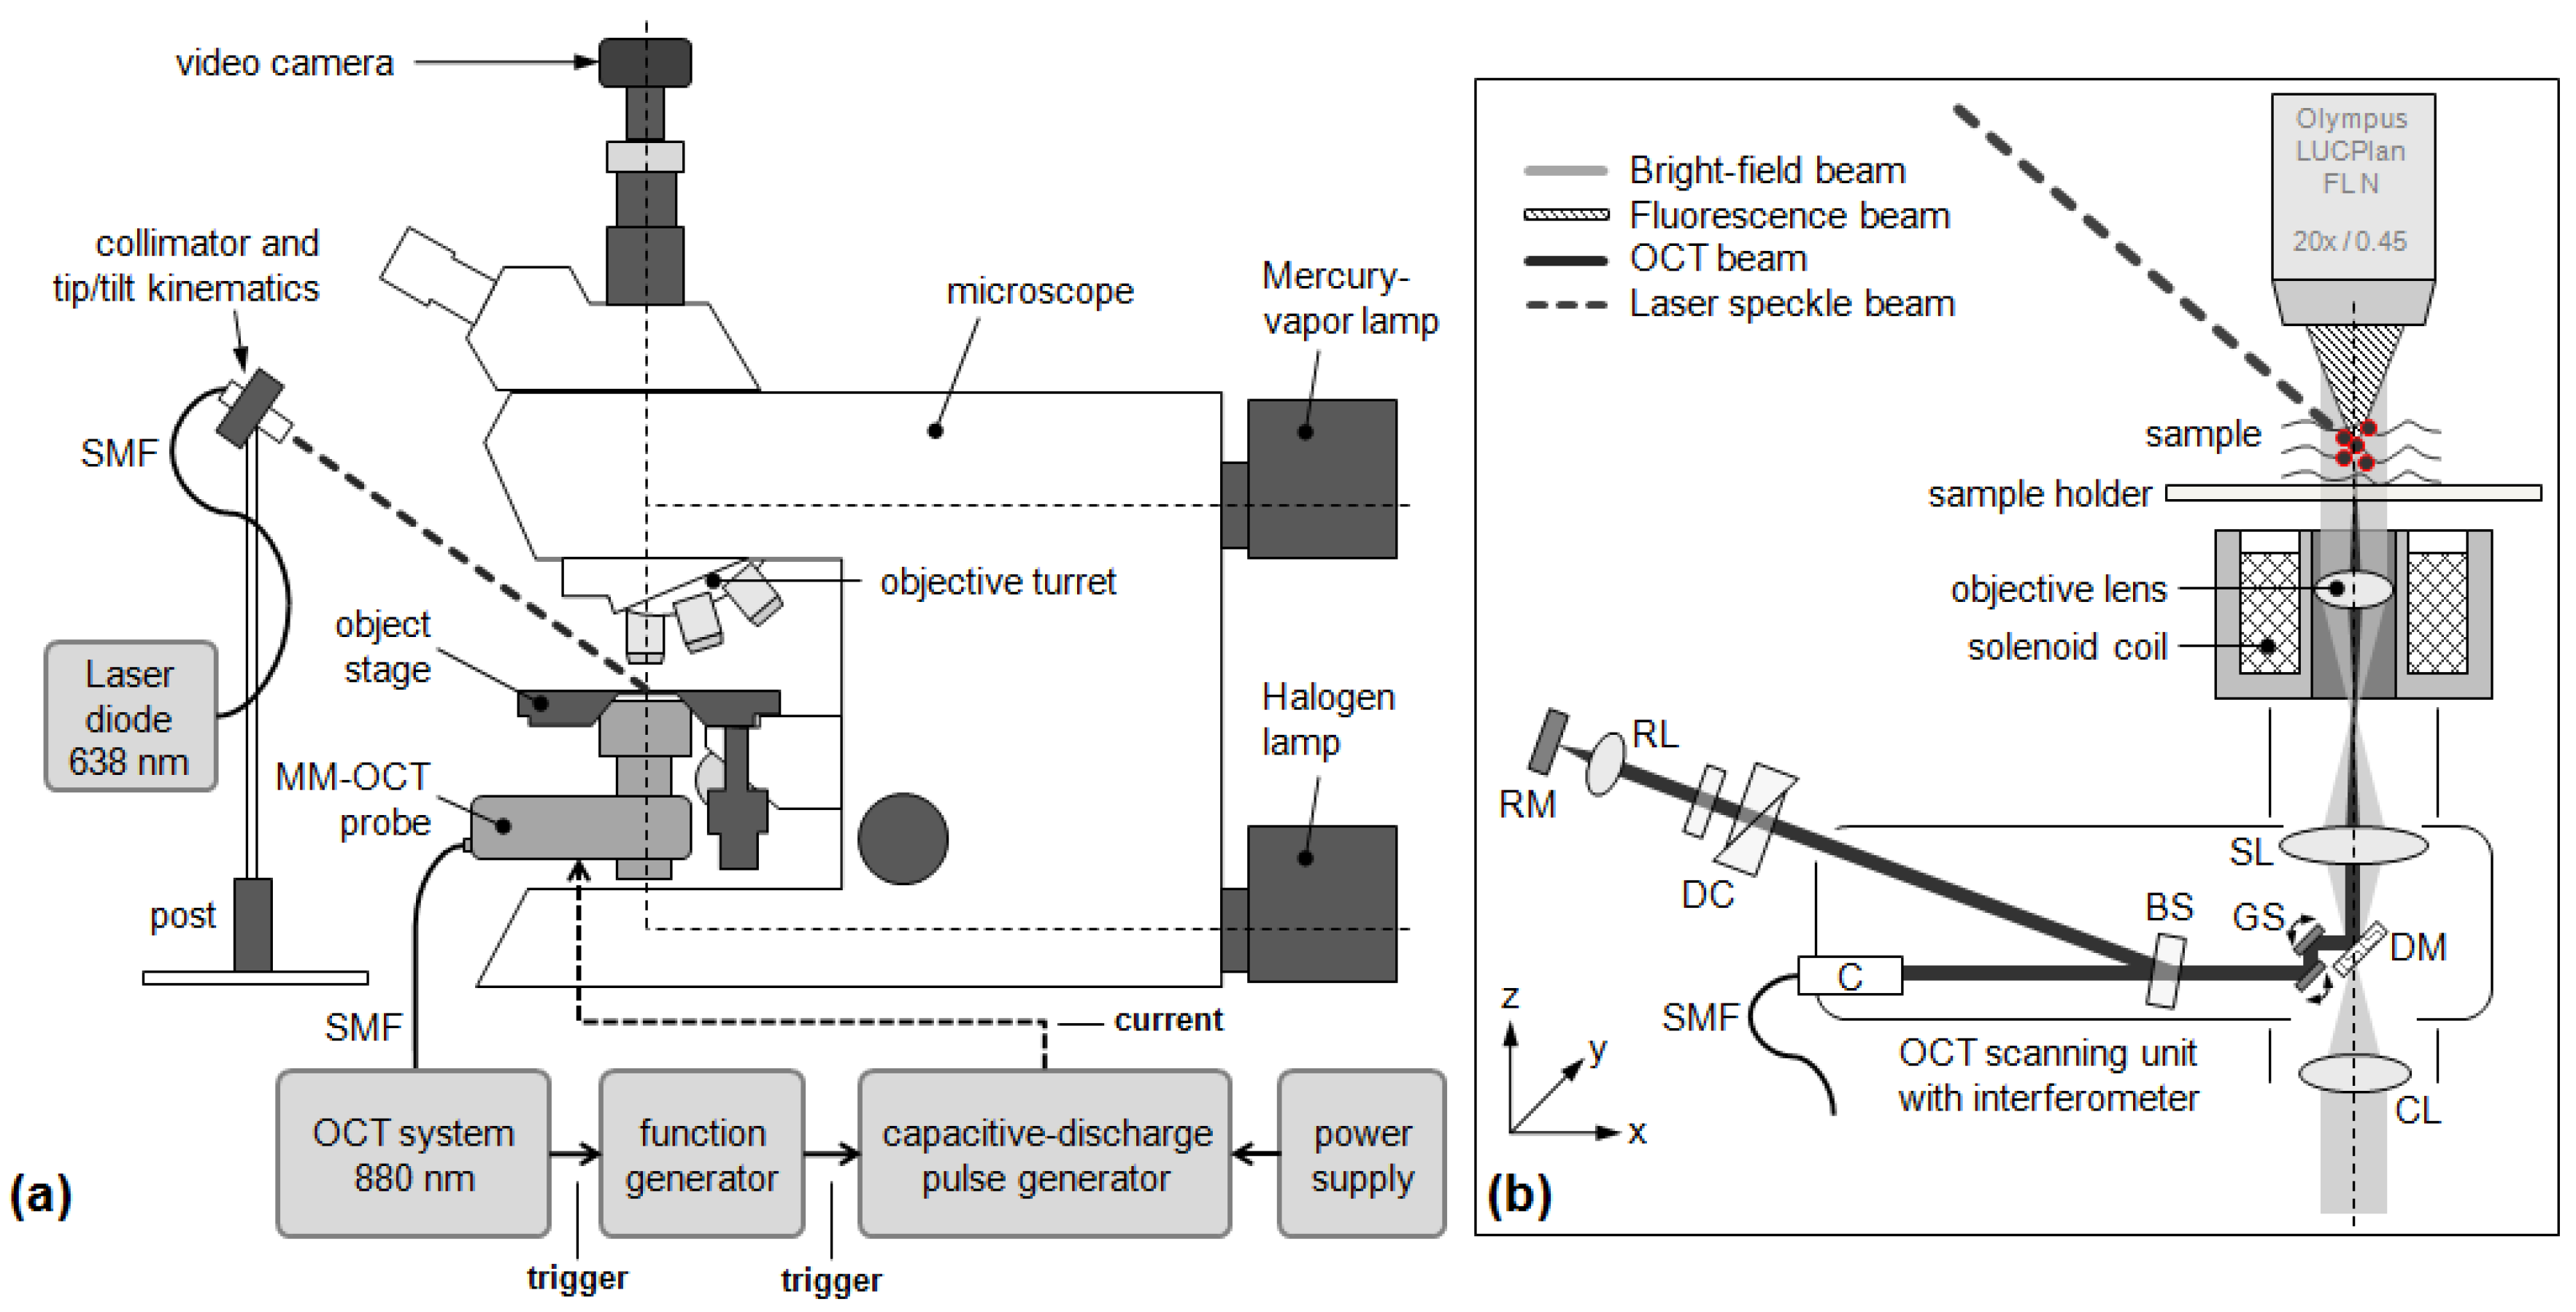
2.1. Experimental Setup for MM-OCT

All experiments were carried out with a multimodal imaging system for MM-OCT, laser speckle reflectometry and light microscopy, which was presented recently by our group [6]. In brief, the setup shown in Figure 1 consists of a conventional epi-fluorescence microscope (Leica DMRB, Leica Microsystems GmbH, Wetzlar, Germany) for bright-field transmission and multi-color fluorescence microscopy, an integrated MM-OCT probe including an electromagnet for magnetic field generation, and a dark-field laser illumination for laser speckle imaging. The setup allows parallel visualization of the same cells by means of two-dimensional (2D) light microscopy and 3D OCT, as well as investigation of sample motion by means of laser speckle variance analysis. Laser illumination of the sample is generated by a fiber-coupled laser diode at 638 nm (Lasiris PTL-500-635-1-2.0, Coherent Inc., Santa Clara, CA, USA) with an output power of 1 mW. Light microscopy and laser speckle images are detected by a video camera (1.3 megapixel monochrome CMOS, Sumix SMX-M71M, Sumix, Oceanside, CA, USA) mounted on the microscope. The microscope-integrated OCT probe is fiber-coupled to a self-developed spectral domain OCT system operating at 880 nm [10]. This system is equipped with a superluminescent diode (Exalos EXS8810-2411, Exalos AG, Schlieren, Switzerland) with a center wavelength of 876 nm and a spectral bandwidth of 64 nm (FWHM), and a linear-in-wavenumber spectrometer. In summary, the system allows OCT imaging at an axial depth scan (A-scan) rate of 11.9 kHz with an axial resolution of 6.7 µm in air, an optical imaging depth of 3 mm and a sensitivity of −102 dB.
The electromagnet for magnetic field generation (Intertec Components GmbH, ITS-MS 5030 12 VDC, Hallbergmoos, Germany) is attached to the distal end of the OCT probe with parts of the OCT imaging optics incorporated into a center bore of the solenoid’s ferromagnetic core. With a working distance of 6 mm and an imaging numerical aperture (NA) of 0.1 yielding a theoretical lateral resolution of 3.3 µm, this MM-OCT probe allows observation of single cells in a three-dimensional tissue-like environment. The field of view of the OCT probe in the focal plane is 1.5 mm in diameter.
The solenoid coil (18.5 Ω) is usually driven in pulsed operation mode by a self-developed capacitive-discharge pulse generator synchronized to the OCT system. Typically, the magnetic pulse length is set to 80 ms, which corresponds to the acquisition time of two tomographic images (B-scans), and the pulse repetition rate is set to 1 Hz. In the current setup, the maximum charging voltage of the capacitor is 120 V yielding a peak magnetic flux density of 0.2 T and an axial field gradient of 18 T/m in the sample region.

2.2. Additional Experimental Setup for Rotational MM-OCT

For the implementation of rMM-OCT, we added a permanent ring magnet (Conrad Electronic SE, 506014-62, Hirschau, Germany) with an internal remanent field of 1.35 T and a thickness of 2 mm on top of the electromagnet. This ring magnet is a highly textured NdFeB sinter magnet whose easy axis of magnetization is parallel to its rotational symmetry axis. As indicated in Figure 2, both magnets are not concentric but have a lateral axis offset of approximately 15 mm. Hence, as long as the solenoid is switched off (Figure 1b), the laterally displaced permanent magnet creates a magnetic field with a significant horizontal component in the sample region. This causes the anisotropic magnetic particles to align horizontally with their long axis in parallel to the field lines (such as a compass needle). However, when the solenoid is switched on (Figure 2c), the field of the permanent magnet is superimposed by the solenoid’s magnetic field, which has a significant vertical component in the sample region. Thus, the particles will rotate and align vertically. As a consequence, periodic switching of the solenoid, such as in pulsed operation mode, will create a nod-like motion of the particles, which should be detectable by OCT and laser speckle reflectometry.

3. Results

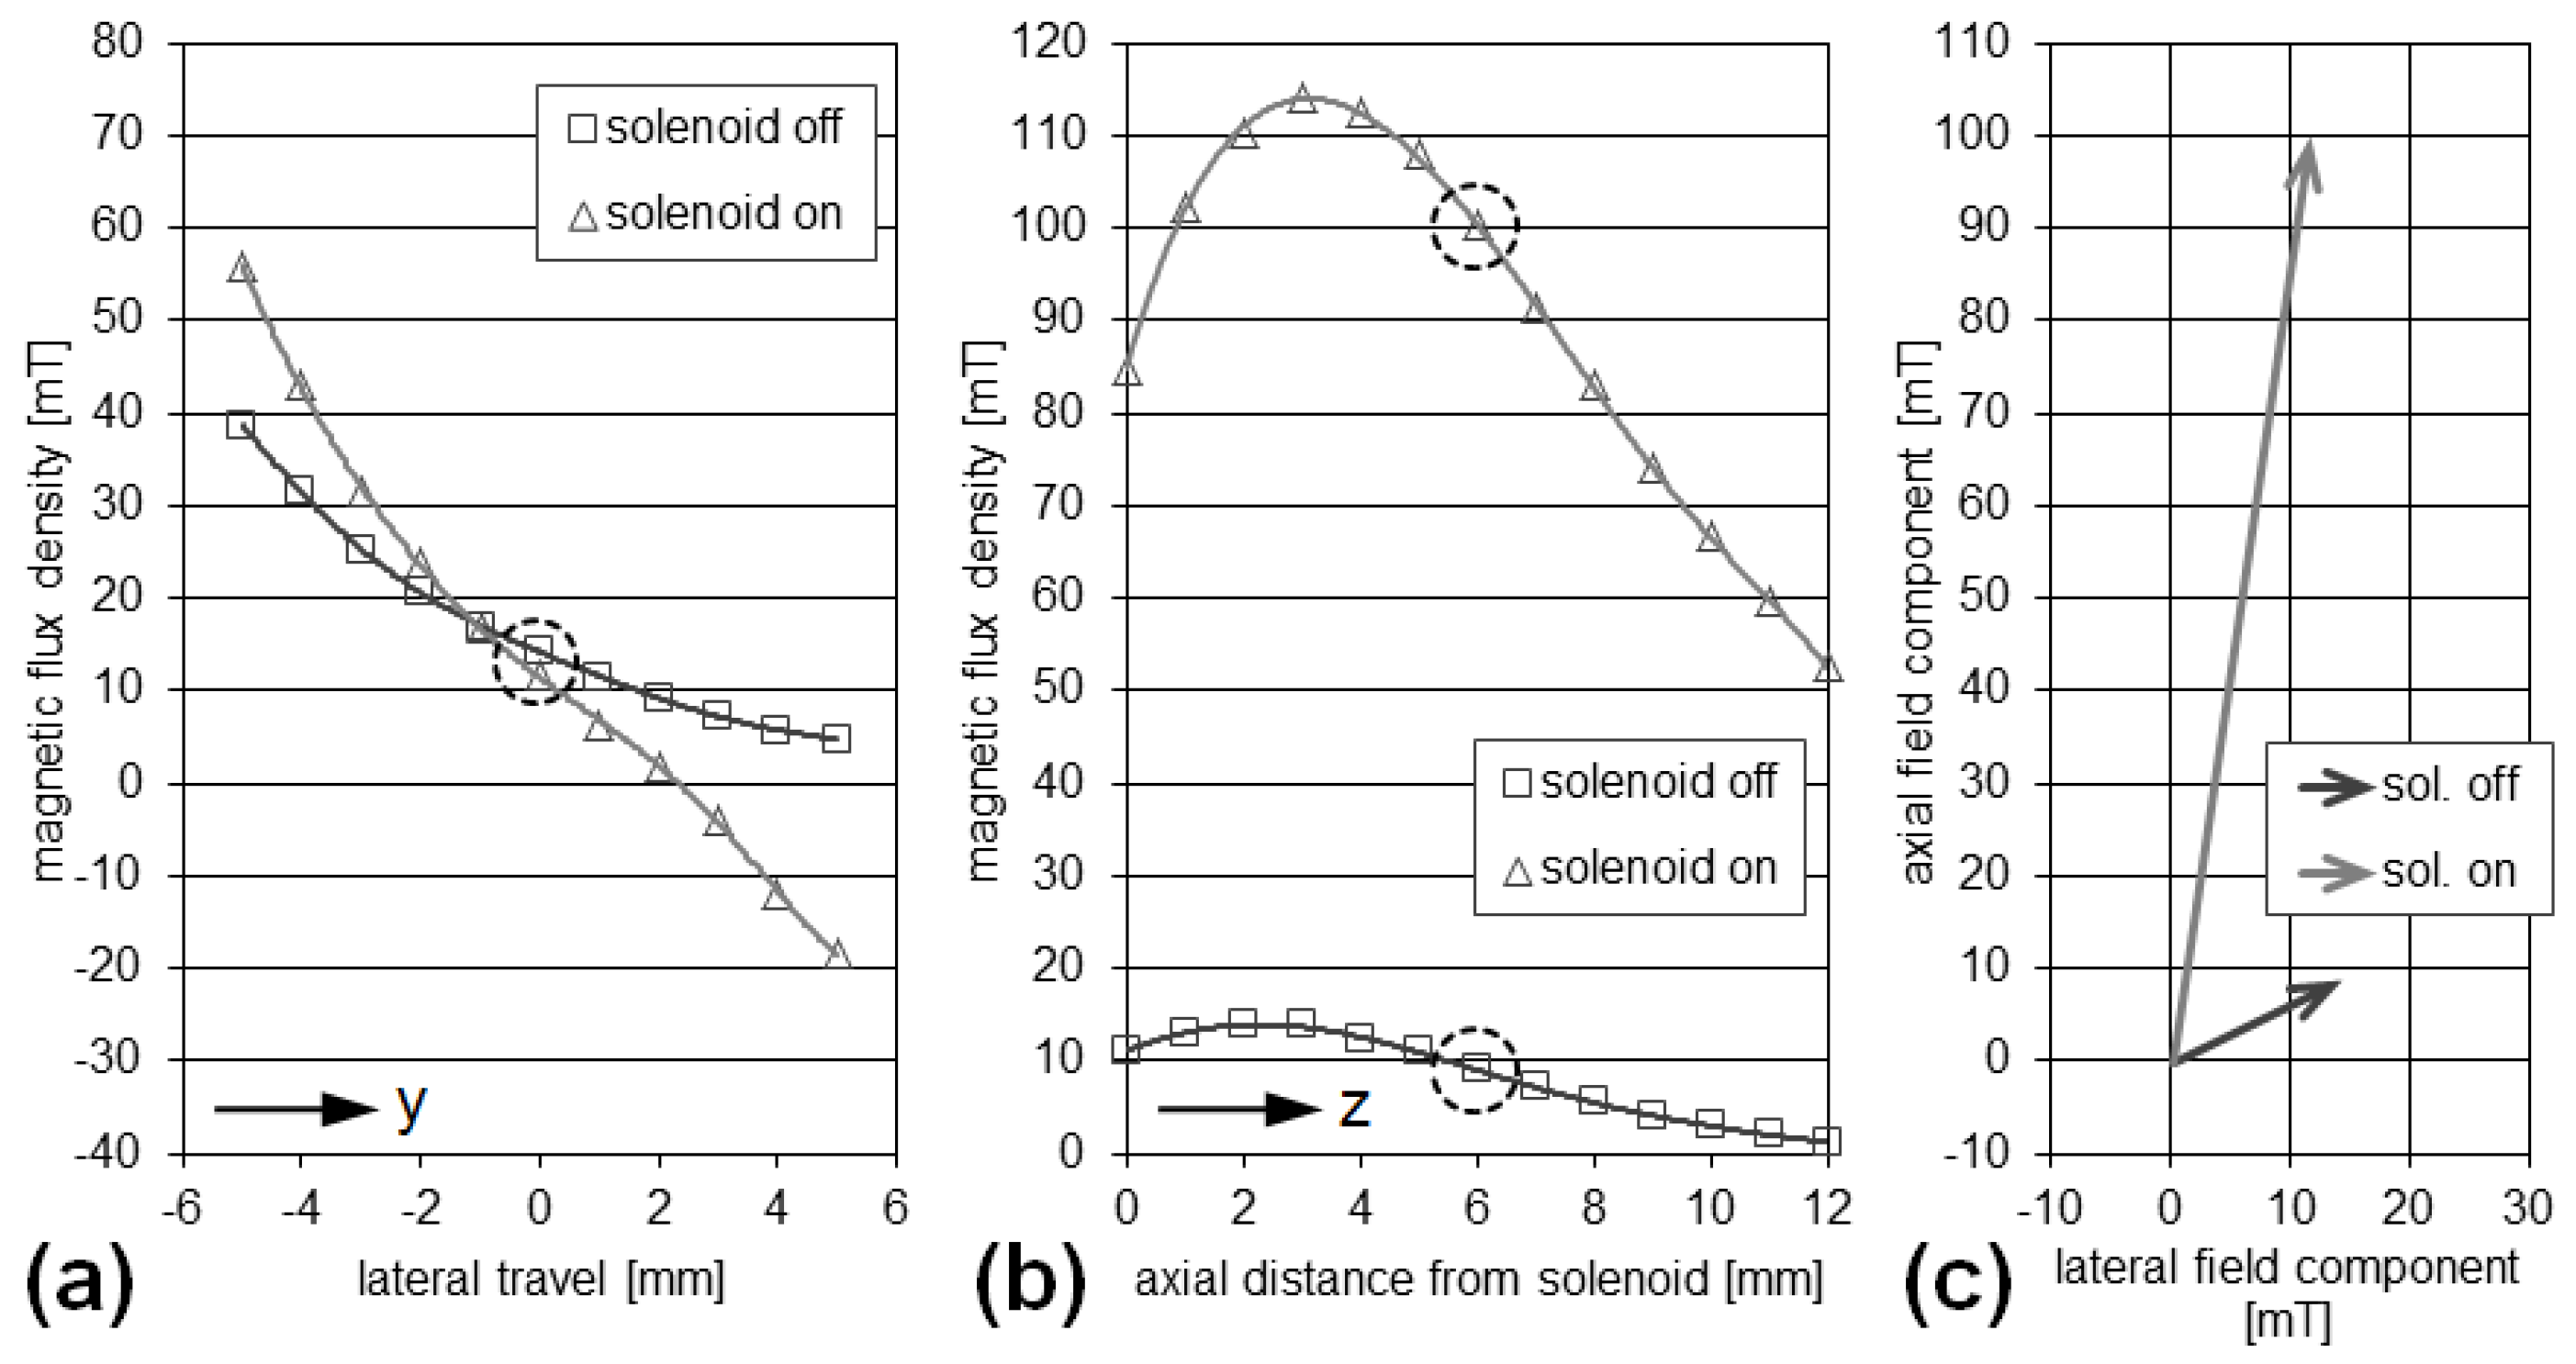
3.1. Validation of the Rotational Magnetomotive Concept
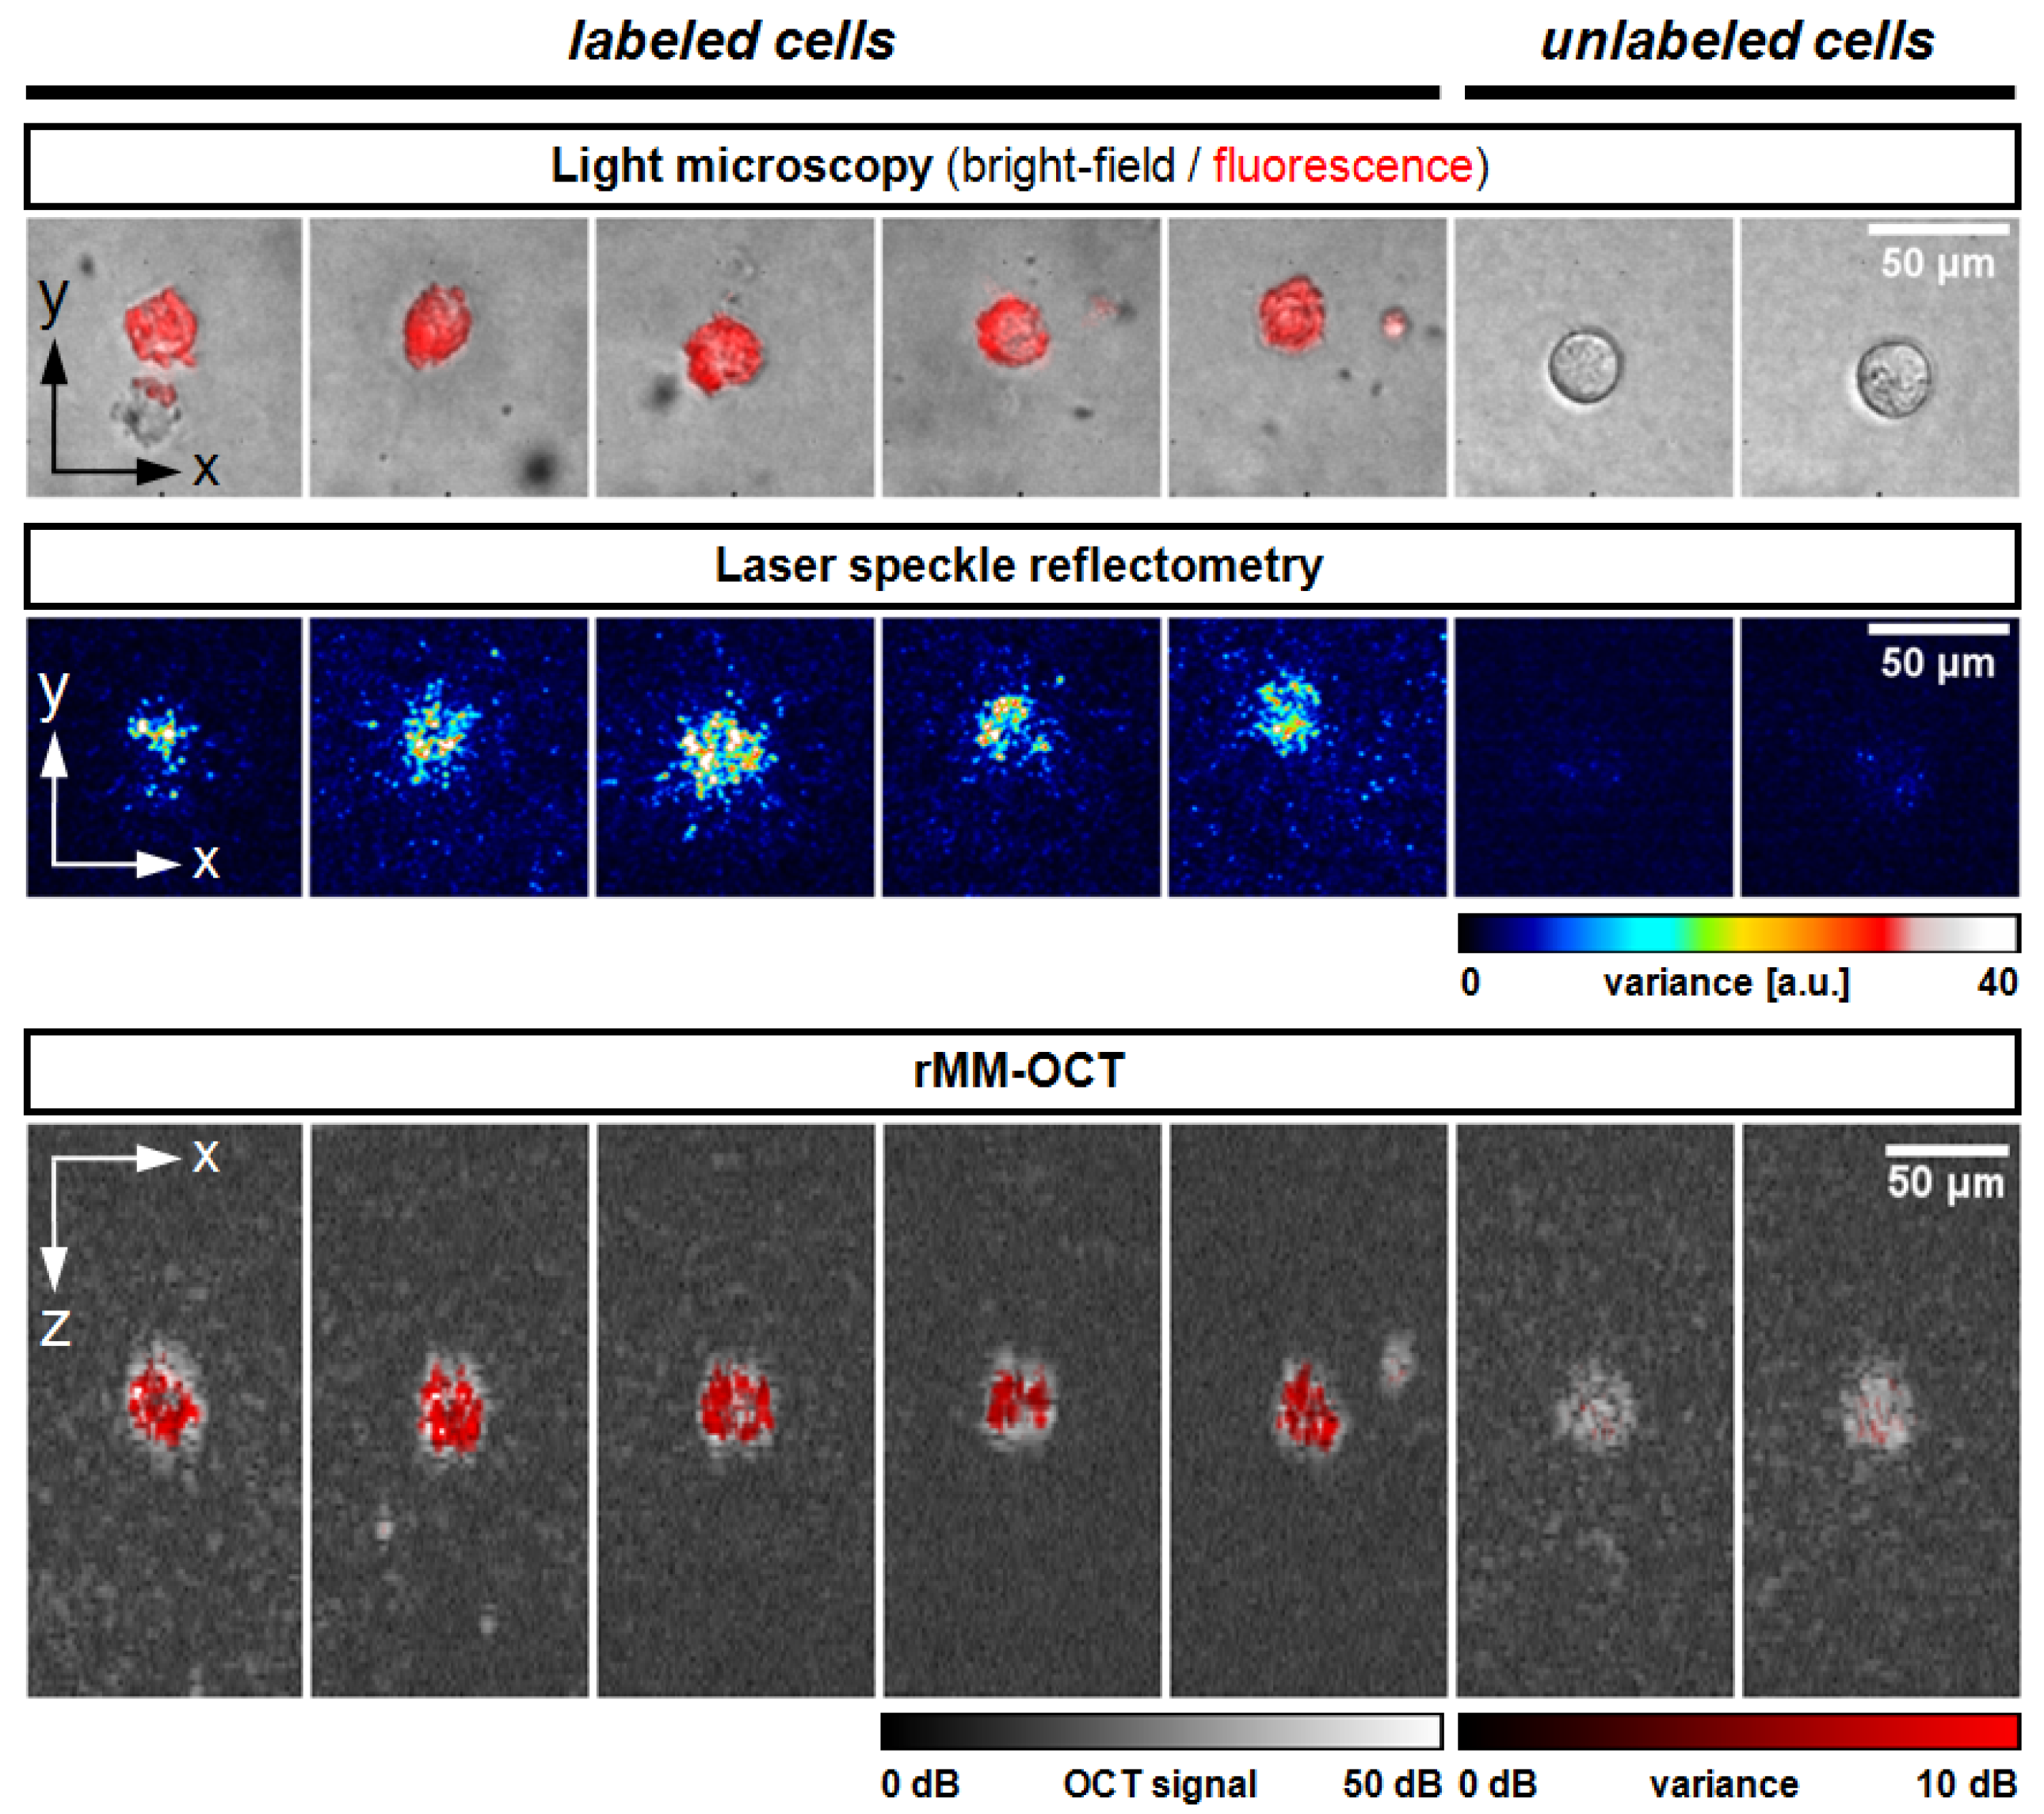
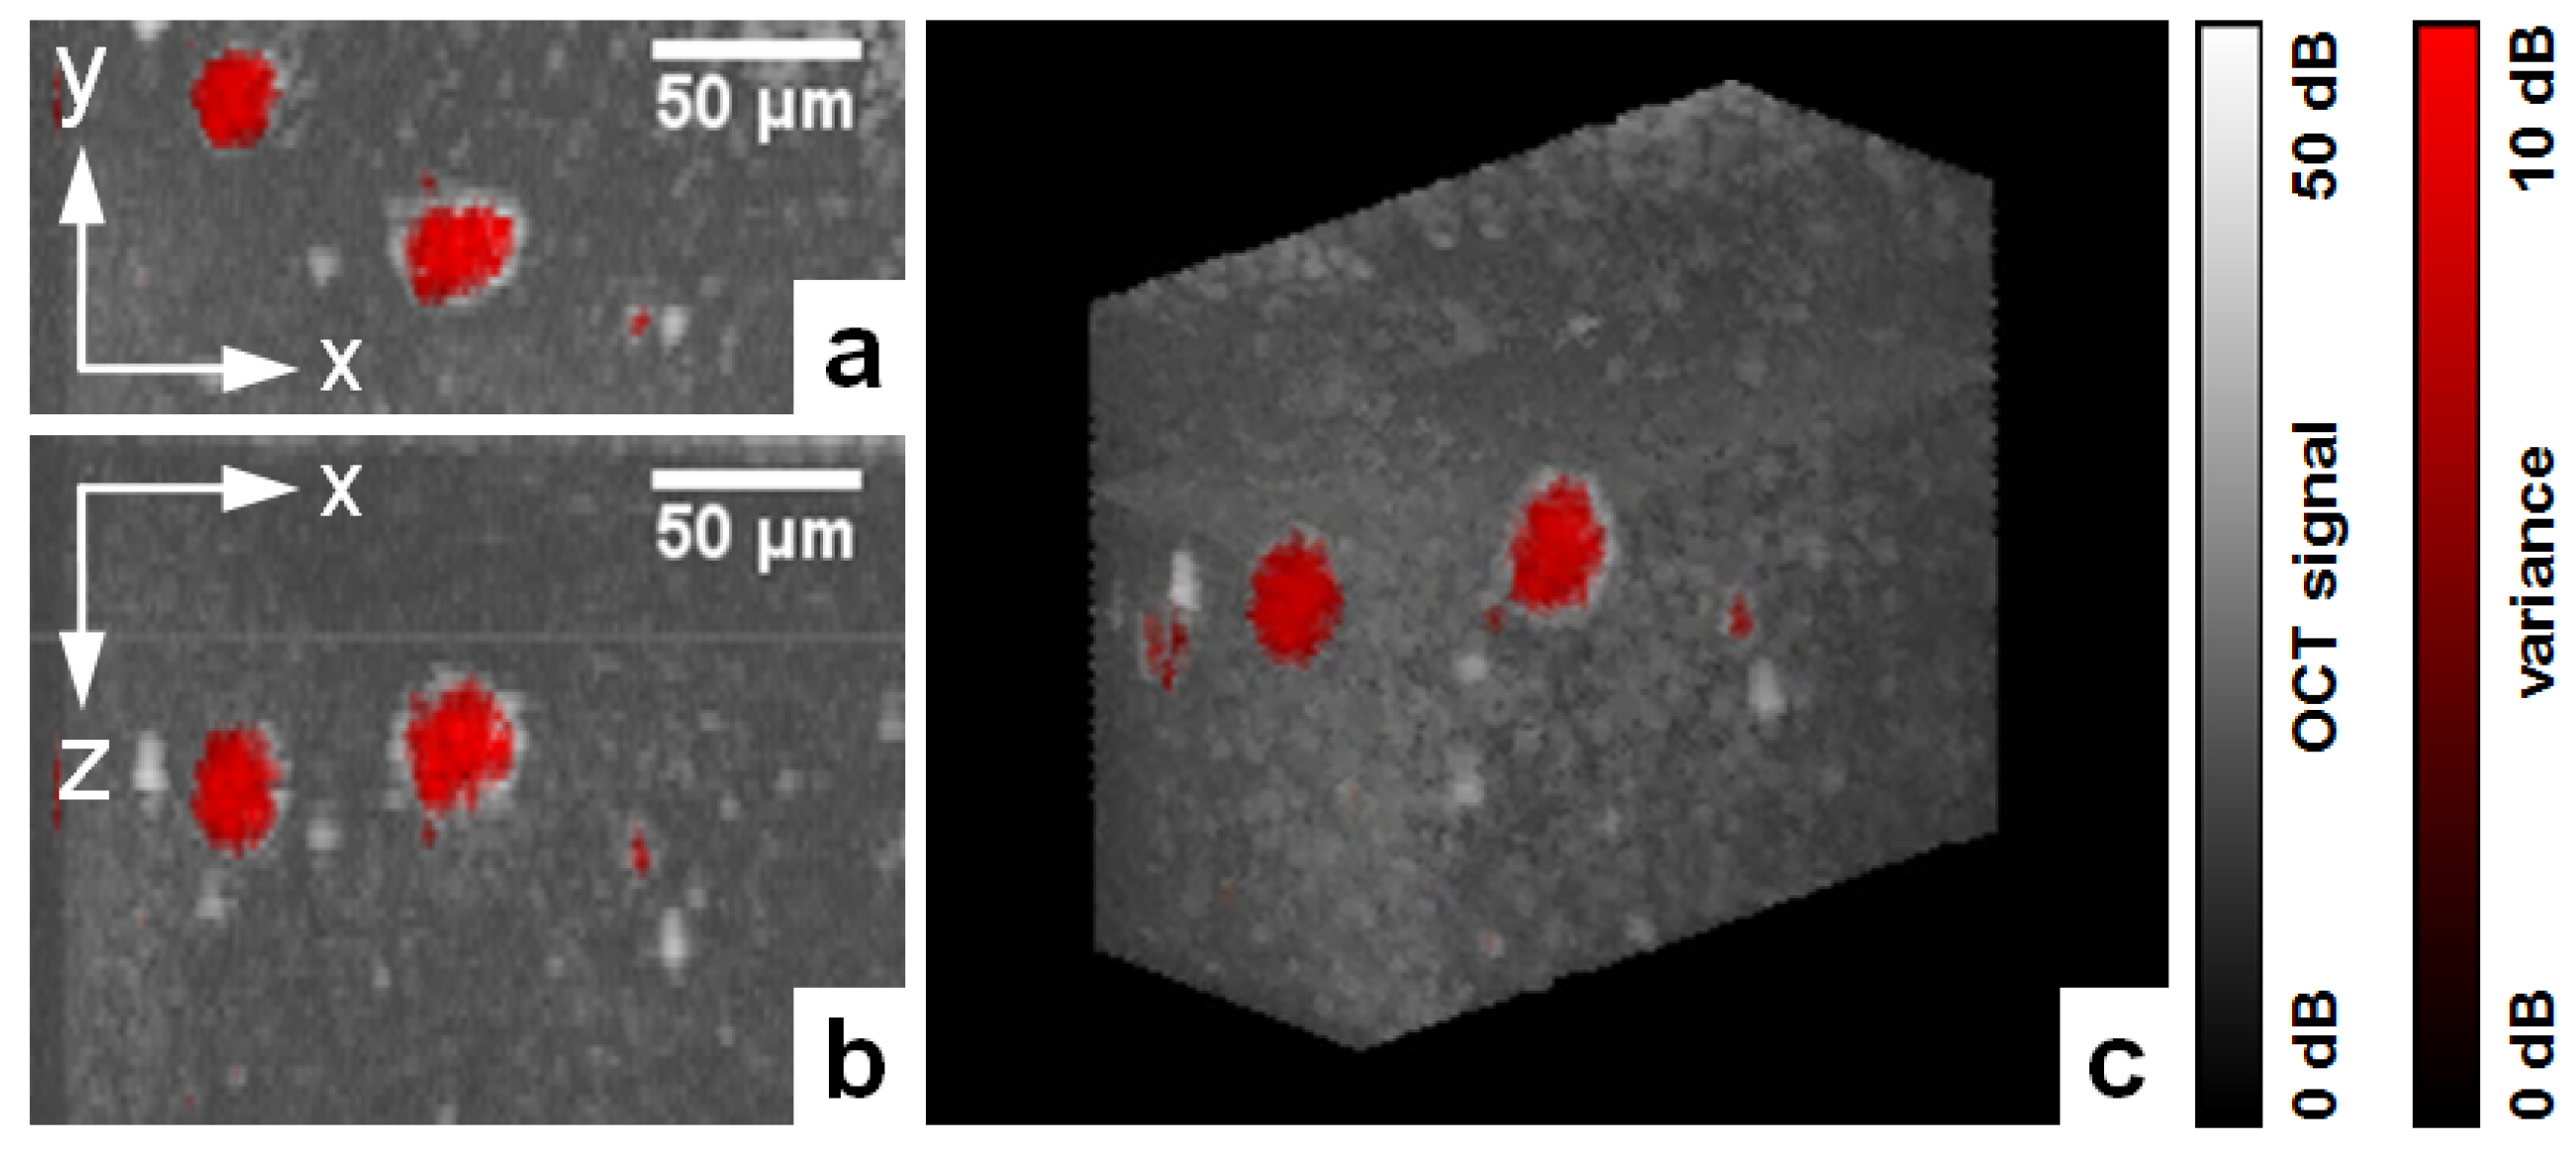
To validate the hypothesis mentioned above, we first analyzed the transverse and longitudinal magnetic field components of our rMM-OCT setup during the off- and on-states of the solenoid. For this experiment, we operated the solenoid in DC (direct current) mode and successively measured the field components (Figure 3a,b) using a conventional magnetometer (KOSHAVA 5, Wuntronic GmbH, München, Germany). In order to prevent the permanent magnet from being pushed off the solenoid during the on-state, we limited the supply voltage to 30 V. As it can be seen in Figure 3c, switching off the solenoid results in a varying magnetic field vector in the sample region, i.e., the focus region of the OCT beam. When the solenoid is switched on, the tilt angle of the field vector changes from 32° to 83°, thus, there is a dominant vertical field during the on-state compared to a rather horizontal field during the off-state. The magnitude of the field vector amounts to 17 mT in the off-state and 101 mT in the on-state. This significant difference between the two states is most likely due to the empirical and non-optimized character of our dual-magnet configuration. Ideally, one would assume that the best results will be obtained with equal field strengths in both states. However, the setup presented in this work is considered more a proof-of-principle rather than an optimized system. Related, the corresponding field gradient (in the direction of the respective tilt angle) is approximately 4 T/m and 9 T/m in the off- and on-states, respectively. However, we believe that the field gradient plays at least a minor role in this context, as the particles are supposed to rotate rather than move via a magnetic gradient force-induced displacement.
In a second step, we proved magnetic particle alignment and rotation in the switchable field. We dispersed magnetic particles in glycerin (0.5 mg/mL) and investigated them using the bright-field microscopy channel of our multimodal imaging setup in combination with a high-magnification objective (Leica C Plan L 40×/0.50). The particles were identical to the ones used for cell experiments in our previous study [6]; they are sub-micron particles with a nominal size of 200 nm (nano-screen MAG/R-DXS, Chemicell GmbH, Berlin, Germany) consisting of a magnetite core, a fluorescent shell emitting in the red visible spectral range, and a coating made of dextran-sulfate for biomolecule coupling.
As shown in Figure 4a, the magnetic particles are rather homogeneously distributed in the freshly prepared sample. However, after 30 min exposure to the permanent magnetic field, the particles have formed long chains that are transversally aligned towards the permanent magnet (y-direction, Figure 4b). Finally, when the electromagnet is switched on, these chains rotate and align longitudinally towards the solenoid (z-direction, Figure 4c). A corresponding time-lapse video of the particle movement is shown in Video S1. This type of chaining, alignment and rotation behavior is also reported in the literature for magnetic particles inside cells. Wilhelm, C. et al. [11] describe that magnetic particles internalized by cells are accommodated in “magnetic endosomes,” i.e., vesicles containing several magnetic particles. These magnetic endosomes cluster to elongated chains within single cells when exposed to a permanent magnetic field, and these chains also rotate when the direction of the magnetic field is changed.
Interestingly, as Figure 4b appears brighter than Figure 4c, the rotation of the magnetic particle chains also seems to influence the transparency of the sample.

3.2. Cell Imaging

Based on these findings, we applied rMM-OCT to cell imaging. For this, we magnetically labeled mesenchymal stem cells (MSCs) with the fluorescent magnetic particles, as mentioned in Section 3.1, and embedded them in agar scaffolds resembling the elastic properties of soft tissue, as described in [6]. Concerning cellular particle load and its effect on cell function, recent literature indicates that MSCs incubated with 200-nm magnetic particles coated with dextran-sulfate take up ~10 pg of iron oxide per cell, and show a cell viability of ~70% after 24 h [12]. After preparation, we placed the samples on the object stage of our multimodal imaging setup containing the permanent magnet and kept them under resting conditions for 30 min in order to provoke the formation and alignment of magnetic chains inside the cells. After that, we analyzed single cells using rMM-OCT in combination with light microscopy and laser speckle reflectometry. In this context, we applied bright-field transmission and fluorescence microscopy in order to identify single cells inside the sample volume and evaluated cell labeling using the fluorescent properties of the magnetic particles. Additionally, we applied laser speckle reflectometry as a 2D reference imaging method to evaluate the sample motion. This time, we operated the solenoid in pulsed mode (pulse duration 80 ms; repetition rate 1 Hz) in order to induce repetitive magnetomotion. According to our previous experiments, we set the capacitor charging voltage to 30 V, expecting the magnitude of the pulsed magnetic field to be similar to the values measured in DC mode (Figure 3a–c). Finally, we retrieved motion contrast from both OCT and laser speckle (LS) images (fOCT = fLS = 25 Hz) by calculating the temporal variance of the OCT signal amplitude and the laser speckle intensity over an interval of five B-scans and five video frames, respectively.
Exemplary imaging results for five labeled and two unlabeled control cells are shown in Figure 5. It can be seen that labeled cells are characterized by an intense red fluorescence signal in the microscopy channel originating from the fluorescent magnetic particles, as well as significant color-coded motion signals in the OCT and laser speckle channels resulting from magnetomotion. In comparison, unlabeled cells show no fluorescence and no motion contrast.
Hypothetically, the pulse length of 80 ms is not long enough to allow the sub-micron particles to fully respond to the magnetic field. However, we choose this pulse duration to make the results comparable to previous work [6].
In this context, we measured the magnetomotive signal of five different cells imaged with rMM-OCT and compared the results to our previous pulsed MM-OCT method. For measurement, we selected a region-of-interest (ROI) representing the cell, and calculated the normalized magnetomotive signal as the quotient of the ROI’s mean variance and the average amplitude of the OCT signal across the magnetic pulse. Similarly, we measured the magnetomotive signal in laser speckle reflectometry by calculating the mean laser speckle variance divided by the average laser speckle intensity. The results in Figure 6 show that the magnetomotive signal in rMM-OCT is significantly increased in both OCT and laser speckle analysis by a factor of 2.8 and 2.5, respectively. We note that the only differences of the rMM-OCT setup compared to the MM-OCT setup are the addition of the permanent magnetic ring and the lower charging voltage of the pulse generator capacitor (30 V compared to 120 V, respectively). However, rMM-OCT provides a significantly improved magnetomotive contrast compared to MM-OCT, although the charging voltage was four times smaller and, thus, the solenoid’s power consumption was 16 times lower.
In a final step, we tested our rMM-OCT imaging method on alternative cells next to MSCs that are used for retinal transplantation studies concerning the RPE, the ARPE-19 cell line [13,14,15]. These cells were labeled and embedded in agar scaffolds identical to MSCs, as described before. Representative OCT imaging results for labeled ARPE-19 cells are shown in Figure 7. It can be seen that the magnetomotive contrast is very similar to the MSCs shown in Figure 5.

4. Discussion

In conclusion, we have shown that rMM-OCT provides a higher magnetomotive signal at a lower power consumption compared to previous pulsed MM-OCT. This improvement was mostly achieved by adding a small permanent magnet in an off-axis configuration to the MM-OCT setup. The thickness of the permanent magnet is only 2 mm; hence, the reduction of working distance from 6 mm (relative to the surface of the solenoid) in the original setup to 4 mm (relative to the surface of the permanent magnet) in the new setup is still acceptable for retinal imaging in small animal models used in cell transplantation studies, such as mice (eye length 3 mm). Further, the dual-magnet configuration of rMM-OCT is a single-sided setup that circumvents the restrictions of previous dual-coil configurations to small samples.
In this context, we have also shown that rMM-OCT allows robust and reliable contrast-enhancement in different cell types, such as MSCs and transplantable ARPE-19 cells. We note that magnetomotion in cells can also be induced by other MM-OCT methods, such as pulsed MM-OCT using our previous setup. However, our results shown in Figure 6 imply that the magnetomotive signal of rMM-OCT is significantly higher compared to the previous pulsed MM-OCT. Besides particle chaining and rotation, this signal increase might be additionally supported by particle clumping induced by the permanent magnet leading to enhanced magnetic susceptibility of the contrast agent and, thus, improved displacement in response to the applied magnetic field. As a consequence, rMM-OCT permits higher sensitivity, the use of low power magnetic fields or corresponding larger working distances, and single-sided access to biological specimens. This makes it a promising method for future 3D cell tracking in target tissues and organs, such as the retina in small animal models, under in vivo conditions.
However, further investigation is required to adress several aspects of the method presented herein. Most important, as the induced magnetic particle changes to elongated chains (as shown in Figure 4) end up being very long in glycerin (~10 µm) and approach the diameters of cells, cell viability experiments are necessary to investigate whether particle chain formation and rotation during rMM-OCT imaging may be destructive to cells. Additionally, it is not yet clear what the size these chains in cells may reach, how controllable this is in conjunction with the magnetization time (currently 30 min), and what the minimum detectable concentration of magnetic particles is or the minimum detectable size of particle aggregates. In this context, the current magnetization time of 30 min is relatively long, especially with regards to prospective in vivo applications. Therefore, we plan further experiments in which we investigate the time-dependency of magnetic chain formation and the correlation with magnetomotive signal enhancement in order to find the minimum magnetization time appropriate for in vivo imaging.
As an alternative to further enhance the sensitivity of rotational magnetomotive measurements, particles with potentially increased anisotropy such as magnetic nanostars [16,17] could be applied. Moreover, for future in vivo application, faster imaging is desired. In this study, the magnetomotive imaging speed was limited by the fixed pulse repetition rate of 1 Hz in order to make the results comparable to previous work. However, the lower power consumption of the solenoid in this work facilitates the use of higher duty cycles, and thus faster pulse repetition rates. In this context, an adequate pulse generator for faster pulse series is the subject of current, ongoing investigation.

Supplementary Materials

The following are available online at https://www.mdpi.com/2076-3417/7/5/444/s1, Video S1: rMM-OCT magnetic particle movement.avi.

Acknowledgments

This research was supported by the TU Dresden CRTD (Center for Regenerative Therapies Dresden) Seed Grant Program and grants from the MeDDrive program of the Faculty of Medicine Carl Gustav Carus of the TU Dresden.

Author Contributions

All authors contributed to this work. Peter Cimalla conceived the method of rotational MM-OCT, designed the experimental setup and performed the imaging experiments; Claudia Mueller and Seba Almedawar performed the cell labeling experiments of the MSC and ARPE-19 cells; Peter Cimalla, Julia Walther and Edmund Koch processed and analyzed the data; Bernd Rellinghaus characterized the magnetic particles and analyzed the magnetic field; Dierk Wittig, Marius Ader, Mike O. Karl, Richard H. W. Funk and Michael Brand analyzed the cell labeling and the imaging data; Peter Cimalla and Julia Walther wrote the paper.

Conflicts of Interest

The authors declare no conflict of interest.

References

  1. Oldenburg, A.L.; Gunther, J.R.; Boppart, S.A. Imaging magnetically labeled cells with magnetomotive optical coherence tomography. Opt. Lett. 2005, 30, 747–749. [Google Scholar] [CrossRef] [PubMed]
  2. Oldenburg, A.L.; Gallippi, C.M.; Tsui, F.; Nichols, T.C.; Beicker, K.N.; Chhetri, R.K.; Spivak, D.; Richardson, A.; Fischer, T.H. Magnetic and contrast properties of labeled platelets for magnetomotive optical coherence tomography. Biophys. J. 2010, 99, 2374–2383. [Google Scholar] [CrossRef] [PubMed]
  3. Oldenburg, A.L.; Wu, G.; Spivak, D.; Tsui, F.; Wolberg, A.S.; Fischer, T.H. Imaging and elastometry of blood clots using magnetomotive optical coherence tomography and labeled platelets. IEEE J. Sel. Top. Quantum Electron. 2012, 18, 1100–1109. [Google Scholar] [CrossRef] [PubMed]
  4. Kim, J.; Ahmad, A.; Boppart, S.A. Dual-coil magnetomotive optical coherence tomography for contrast enhancement in liquids. Opt. Express 2013, 21, 7139–7147. [Google Scholar] [CrossRef] [PubMed]
  5. Nawaz, S.; Sanchez, P.; Bodensiek, K.; Li, S.; Simons, M.; Schaap, I.A.T. Cellvisco-elasticity measured with AFM and optical trapping at sub-micrometer deformations. PLoS ONE 2012, 7, e45297. [Google Scholar] [CrossRef] [PubMed]
  6. Cimalla, P.; Werner, T.; Winkler, K.; Mueller, C.; Wicht, S.; Gaertern, M.; Mehner, M.; Walther, J.; Rellinghaus, B.; Wittig, D.; et al. Imaging of nanoparticle-labeled stem cells using magnetomotive optical coherence tomography, laser speckle reflectometry, and light microscopy. J. Biomed. Opt. 2015, 20, 036018. [Google Scholar] [CrossRef] [PubMed]
  7. Dunn, K.C.; Aotaki-Keen, A.E.; Putkey, F.R.; Hjemeland, L.M. ARPE-19, a human retinal pigment epithelial cell line with differentiated properties. Exp. Eye Res. 1996, 62, 155–170. [Google Scholar] [CrossRef] [PubMed]
  8. Zhu, Y.; Carido, M.; Meinhardt, A.; Kurth, T.; Karl, M.O.; Ader, M.; Tanaka, E.M. Three-dimensional neuroepithelial culture from human embryonic stem cells and its use for quantitative conversion to retinal pigment epithelium. PLoS ONE 2013, 8, e54552. [Google Scholar] [CrossRef] [PubMed]
  9. Carido, M.; Zhu, Y.; Postel, K.; Benkner, B.; Cimalla, P.; Karl, M.O.; Kurth, T.; Paquet-Durand, F.; Koch, E.; Münch, T.A.; et al. Characterization of a mouse model with complete RPE loss and its use for RPE cell transplantation. Investig. Ophthalmol. Vis. Sci. 2014, 55, 5431–5444. [Google Scholar] [CrossRef] [PubMed]
  10. Burkhardt, A.; Walther, J.; Cimalla, P.; Mehner, M.; Koch, E. Endoscopic optical coherence tomography device for forward imaging with broad field of view. J. Biomed. Opt. 2012, 17, 071302. [Google Scholar] [CrossRef] [PubMed]
  11. Wilhelm, C.; Gazeau, F.; Bacri, J.C. Rotational magnetic endosome microrheology: Viscoelastic architecture inside living cells. Phys. Rev. E 2003, 67, 061908. [Google Scholar] [CrossRef] [PubMed]
  12. Yanai, A.; Häfeli, U.O.; Metcalfe, A.L.; Soema, P.; Addo, L.; Gregory-Evans, C.Y.; Po, K.; Shan, X.; Moritz, O.L.; Gregory-Evans, K. Focused magnetic stem cell targeting to the retina using superparamagnetic iron oxide nanoparticles. Cell Transplant. 2012, 21, 1137–1148. [Google Scholar] [CrossRef] [PubMed]
  13. Coffey, P.J.; Girman, S.; Wang, S.M.; Hetherington, L.; Adamson, P.; Greenwood, J.; Lund, R.D. Long-term preservation of cortically dependent visual function in RCS rats by transplantation. Nat. Neurosci. 2002, 5, 53–56. [Google Scholar] [CrossRef] [PubMed]
  14. Wang, S.; Lu, B.; Lund, R.D. Morphological changes in the Royal College of Surgeons rat retina during photoreceptor degeneration and after cell-based therapy. J. Comp. Neurol. 2005, 491, 400–417. [Google Scholar] [CrossRef] [PubMed]
  15. Pinilla, I.; Cuenca, N.; Sauvé, Y.; Wang, S.; Lund, R.D. Preservation of outer retina and its synaptic connectivity following subretinal injections of human RPE cells in the Royal College of Surgeons rat. Exp. Eye Res. 2007, 85, 381–392. [Google Scholar] [CrossRef] [PubMed]
  16. Wei, Q.; Song, H.M.; Leonov, A.P.; Hale, J.A.; Oh, D.; Ong, Q.K.; Ritchie, K.; Wei, A. Gyromagnetic imaging: Dynamic optical contrast using goldnanostars with magnetic cores. J. Am. Chem. Soc. 2009, 131, 9728–9734. [Google Scholar] [CrossRef] [PubMed]
  17. Song, H.M.; Wei, Q.; Ong, Q.K.; Wei, A. Plasmon-resonant nanoparticles and nanostars with magnetic cores: Synthesis and magnetomotive imaging. ACS Nano 2010, 4, 5163–5173. [Google Scholar] [CrossRef] [PubMed]
Figure 1. Multimodal imaging setup for magnetomotive OCT (MM-OCT), laser speckle reflectometry and light microscopy. (a) Light microscope with integrated MM-OCT probe and dark-field laser illumination for laser speckle imaging. The microscope is equipped with a halogen lamp for bright-field transmission imaging and a mercury-vapor lamp for epi-fluorescence imaging; (b) the inset shows a detailed view of the sample region and the OCT scanning unit with attached electromagnet. The coordinate system (x, y, z) indicates the orientation of the MM-OCT probe. The x-direction is the fast scanning direction of the OCT probe. Hence, cross-sectional OCT images (tomographic B-scans) are created in the xz plane Abbreviations: BS—beam splitter, C—collimator, CL—condensing lens, DC—dispersion compensation, DM—Vis/NIR dichroic mirror, GS—galvanometer scanners, RL—reference lens, RM—reference mirror, SL—scanning lens, SMF—single-mode fiber (color online).
Applsci 07 00444 g001
Figure 2. Principle of rotational magnetomotive OCT (rMM-OCT) using an electromagnet (solenoid) and a laterally displaced permanent magnet. (a) Top view and (b,c) side view of the dual-magnet configuration. When the solenoid is turned off (b), anisotropic magnetic particles in a soft sample are aligned horizontally (y-direction) towards the field of the permanent magnet; when the solenoid is turned on (c), particles are aligned vertically (z-direction) towards the field of the solenoid. Drawn magnetic field lines are a guide to the eye only. The indicated coordinate system (x, y, z) is identical to Figure 1b. The coordinate origin is at the optical axis of the OCT probe (x = y = 0) and the surface of the solenoid (z = 0) (color online).
Applsci 07 00444 g002
Figure 3. Magnetic field in the rMM-OCT setup. (a) Transverse magnetic field; and (b) longitudinal magnetic field measured with the solenoid turned off and on (30 V). The measurements were performed in the yz plane with x = 0, as indicated in Figure 2b,c. The coordinate origin is again at the optical axis of the OCT probe (x = y = 0 mm) and the surface of the solenoid (z = 0 mm). The transverse field in (a) was measured at the working distance of the OCT probe (z = 6 mm); The longitudinal field in (b) was measured along the optical axis of the OCT probe (x = y = 0 mm). The focus position of the OCT beam along the optical axis (x = y = 0 mm; z = 6 mm) is indicated by the dashed circles; (c) Resulting magnetic field vectors in the central OCT focus position (x = y = 0 mm; z = 6 mm) during off- and on-states of the solenoid. The field vectors were calculated from the respective transverse and longitudinal magnetic field components indicated by the dashed circles in (a,b).
Applsci 07 00444 g003
Scheme 1. Time-lapse video of the magnetic particle movement when the solenoid is turned on and off. (Left) Bright-field transmission image as shown in Figure 4; (Right) Three-fold magnified view of a single particle chain. The position of the magnified view is indicated by the dark rectangle. Due to the fluidic properties of glycerin, there is a certain drift of the particles caused by the gradient of the magnetic field.
Applsci 07 00444 sch001
Figure 4. Magnetic particle behavior in the switchable magnetic field. (a) Bright-field transmission microscopy of magnetic nanoparticles dispersed in glycerin (0.5 mg/mL) in a freshly prepared sample; (b) after 30 min exposure to the permanent magnetic field with the solenoid switched off; and (c) shortly after with the solenoid switched on (30 V). The dominant direction of the magnetic field is indicated by the symbols in the upper left corner of the images (↑—transverse, —longitudinal). The indicated coordinate system (x, y) is identical to Figure 2a. As illustrated by the magnified views (red rectangles), the particles in (b) have formed long chains that are aligned parallel to the image plane; when the solenoid is switched on in (c), these chains rotate and align perpendicular to the image plane. This rotation effect is reversible across many on/off cycles of the solenoid (see Scheme 1 and Video S1) (color online).
Applsci 07 00444 g004
Figure 5. Multimodal light microscopy, laser speckle and rMM-OCT imaging of labeled and unlabeled mesenchymal stem cells (MSCs) embedded in agar scaffolds. The labeled cells are characterized by an intense red fluorescence signal in the microscopy images and a significantly increased variance in both the laser speckle images and the OCT cross-sections, which is caused by magnetically induced motion. In contrast, the unlabeled control cells show no fluorescence and no motion signal (color online).
Applsci 07 00444 g005
Figure 6. Quantification of the cellular magnetomotive signal using OCT and laser speckle analysis. In each OCT (a) and laser speckle image (b) a region of interest (ROI) representing the cell is chosen and the mean magnetomotive signal is determined; (c) Magnetomotive signals retrieved from OCT data (left column) and laser speckle data (right column) for five different cells imaged with our previous pulsed MM-OCT setup (dark bars) and the novel rMM-OCT setup (bright bars) using a capacitor charging voltage of 120 V and 30 V, respectively. The magnetomotive signals represent the normalized mean variance in the ROI, i.e., the mean pixel variance divided by the average pixel intensity across the magnetic pulse. Data represents mean values ± standard deviation (color online).
Applsci 07 00444 g006
Figure 7. Volumetric rMM-OCT imaging of labeled ARPE-19 cells embedded in an agar scaffold. (a) Top view and (b) side view of a recorded 3D OCT image stack showing two cells next to each other. (c) 3D view of the two cells. All views represent maximum intensity projections of the 3D image data (color online).
Applsci 07 00444 g007

