
Vibration Control of a Power Transmission Tower with Pounding Tuned Mass Damper under Multi-Component Seismic Excitations

1
School of Civil Engineering, Shandong University, Jinan 250061, Shandong Province, China
2
Transportation Equipment and Ocean Engineering College, Dalian Maritime University, Dalian 116026, Liaoning Province, China
*
Author to whom correspondence should be addressed.
Appl. Sci. 2017, 7(5), 477; https://doi.org/10.3390/app7050477
Submission received: 7 March 2017
/
Revised: 22 April 2017
/
Accepted: 2 May 2017
/
Published: 5 May 2017
(This article belongs to the Special Issue Development and Application of Nonlinear Dissipative Device in Structural Vibration Control)
Abstract
:In this paper, the two-dimensional vibration controls of a power transmission tower with a pounding tuned mass damper (PTMD) under multi-component seismic excitations are analyzed. A three-dimensional finite element model of a practical power transmission tower is established in ABAQUS (Dassasult Simulia Company, Providence, RI, USA). The TMD (tuned mass damper) and PTMD are simulated by the finite element method. The response of the transmission tower with TMD and PTMD are analyzed, respectively. To achieve optimal design, the influence of the mass ratio, ground motion intensity, gap, and incident angle of seismic ground motion are investigated, respectively. The results show that the PTMD is very effective in reducing the vibration of the transmission tower in the longitudinal and transverse directions. The reduction ratio increases with the increase of the mass ratio. The ground motion intensity and gap have no obvious influence on the reduction ratio. However, the incident angle has a significant influence on the reduction ratio.
1. Introduction
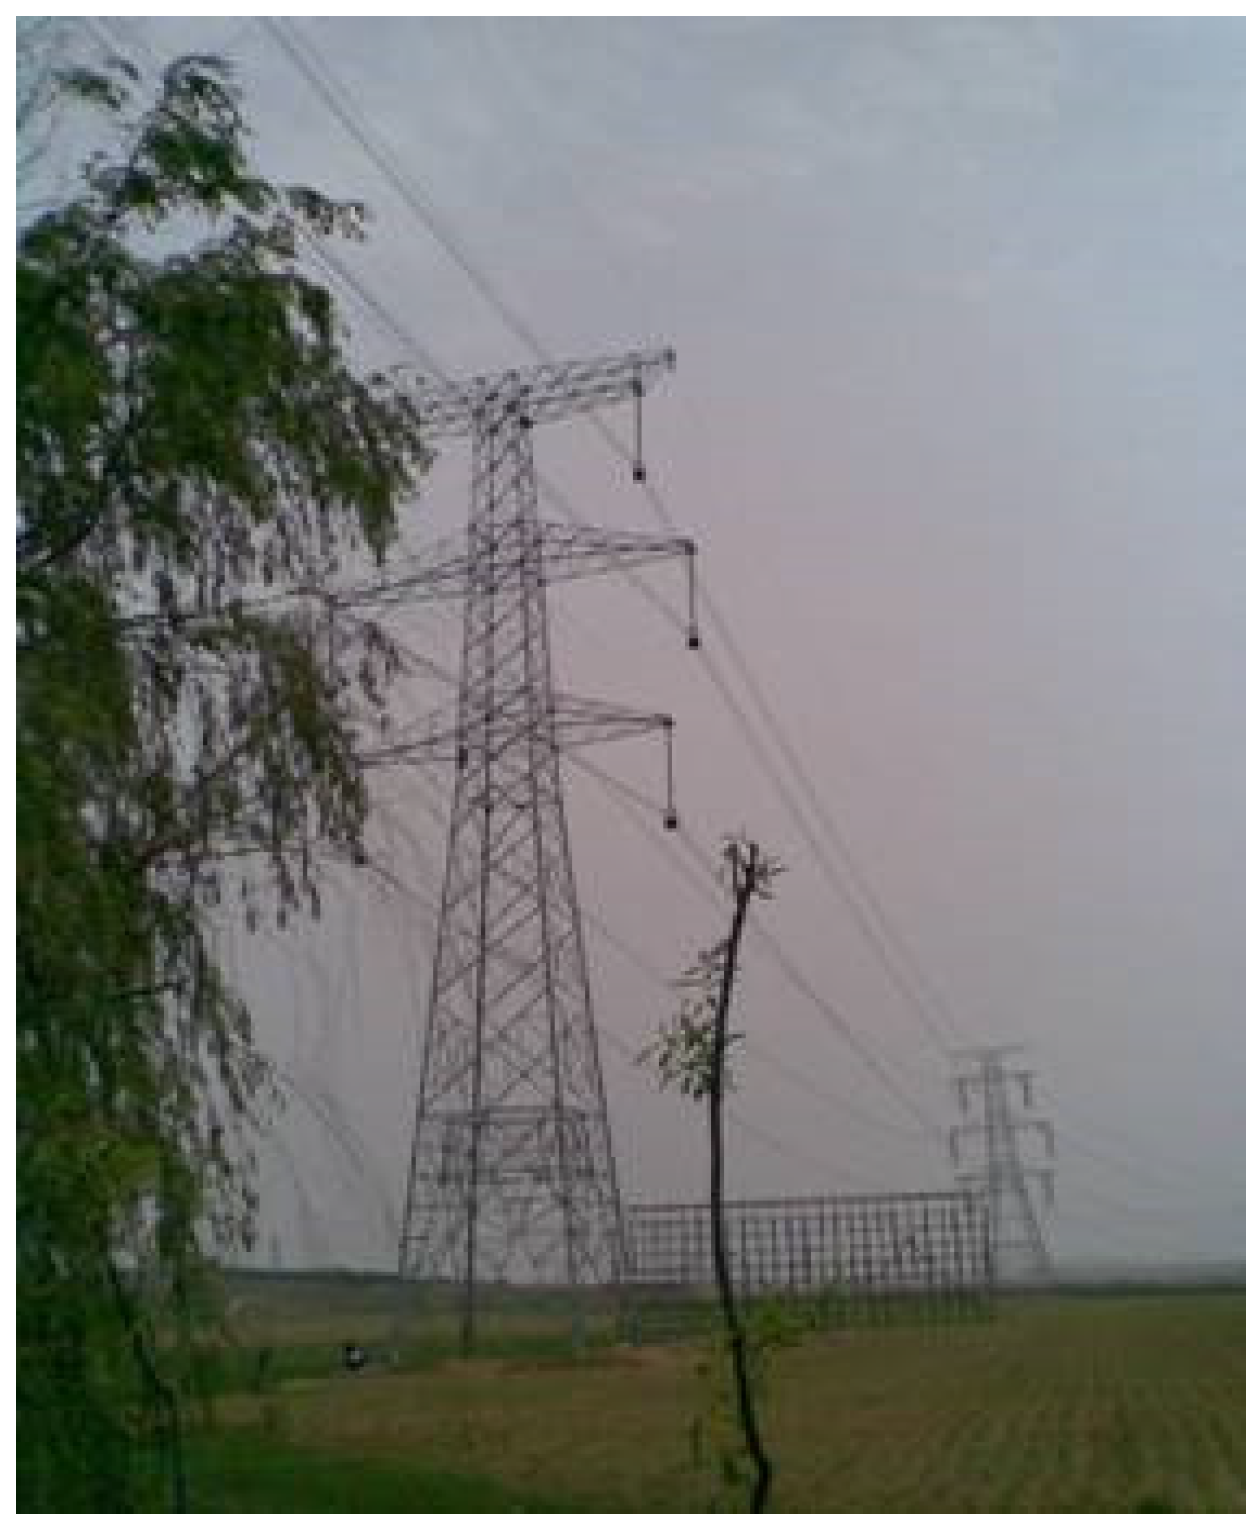
The transmission tower is an important component of the transmission line, and the power transmission tower-line system is an important lifeline facility. The damage of a power transmission tower-line system may lead to the paralysis of the power grid. With the increasing height of transmission towers and the span of the transmission line, the seismic risk has increased and several failures have been reported during the past decades. During the 1992 Landers earthquake, about 100 transmission lines, and several transmission towers, failed in the city of Los Angeles [1]. In the 1994 Northridge earthquake, a number of transmission towers were destroyed, and the power system was greatly damaged [1]. During the 1995 Kobe earthquake, more than 20 transmission towers were damaged [2]. In the 2008 Wenchuan earthquake, more than 20 towers collapsed and a 220 kV transmission line in Mao County was destroyed [3,4,5]. As shown in Figure 1, the 2010 Haiti earthquake caused damage to transmission towers. During the 2013 Lushan earthquake, more than 39 transmission lines were destroyed [6]. Therefore, studies on the vibration control of power transmission towers needs to be conducted to improve and guarantee the safety of transmission lines.
Some research about the vibration control of a transmission tower under wind loading has been conducted at home and abroad [7,8,9,10,11,12]. However, there are few studies about the vibration control of transmission towers under earthquake excitation. In recent years, researchers have conducted studies regarding impact dampers. Ema et al. [13] investigated the performance of impact dampers from free damped vibration generated when a step function input was supplied to a leaf spring with a free mass. Collete [14] studied the vibration control capability of a combined tuned absorber and impact damper under a random excitation using numerical and experimental methods. Cheng et al. [15] researched the free vibration of a vibratory system equipped with a resilient impact damper. The results presented above show that the impact damper can reduce the response of structures. Due to space limitations, vibration control devices are not suitable for transmission towers. Therefore, a new type of vibration control device has been developed which combines the impact damper and tuned mass damper (TMD). Zhang et al. [16] proposed a new type of TMD, the pounding tuned mass damper (PTMD), to upgrade the seismic resistance performance of a transmission tower. Compared with TMD, the bandwidth vibration suppression of PTMD is larger, so the vibration reduction effect of PTMD is better than that of TMD. The PTMD has also been applied for vibration control of subsea pipeline structures [17,18,19] and traffic poles [20], and both simulation results and experimental results have demonstrated the effectiveness of the PTMD. However, in the previous studies, the PTMD has been simulated by a modified Hertz-contact model. Since the Hertz-contact model cannot be established in finite element modelling (FEM) software, such as ABAQUS, the primary structures were all simulated by simplified multi-mass models.
Based on the above research, two-dimensional vibration controls of a power transmission tower with a PTMD under multi-component seismic excitations are performed. A three-dimensional finite element model is created in ABAQUS according to practical engineering. The vibration reduction mechanism of the PTMD is introduced, and the PTMD is simulated using finite element software. To compare with the vibration reduction effect of the PTMD, the vibration control of the TMD is also conducted. A parametric study of the PTMD is carried out to provide a reference for the optimal design of a transmission tower with a PTMD.
2. Vibration Reduction Mechanism of PTMD
The equations of motion of structures with a PTMD can be expressed as [16]:
where, , , and are the mass, damping, and stiffness of the structure, respectively; , , and are the vectors of the acceleration, velocity, and displacement of the structure, respectively; is the input ground motion acceleration in two horizontal directions; and is the pounding force, which can be calculated as follows:
where, is the pounding stiffness coefficient that is obtained by the least squares optimization algorithm; and are the displacements of the pounding motion limiting collar and the mass block, respectively; is the relative velocity; is the impact gap; and is the nonlinear impact damping coefficient, which can be expressed as follows:
where, and are the mass of the two impact bodies, respectively; is the hysteretic damping ratio, which can be defined as:
where, is the Newtonian velocity recovery coefficient and is obtained by the falling ball test.
As can be seen from Equation (1), is the location vector of the pounding force, and is the direction of the pounding force:
where, and are the displacement of the PTMD and top node of the structure, respectively.
3. Modeling of a Transmission Tower with a PTMD
3.1. Structural Model
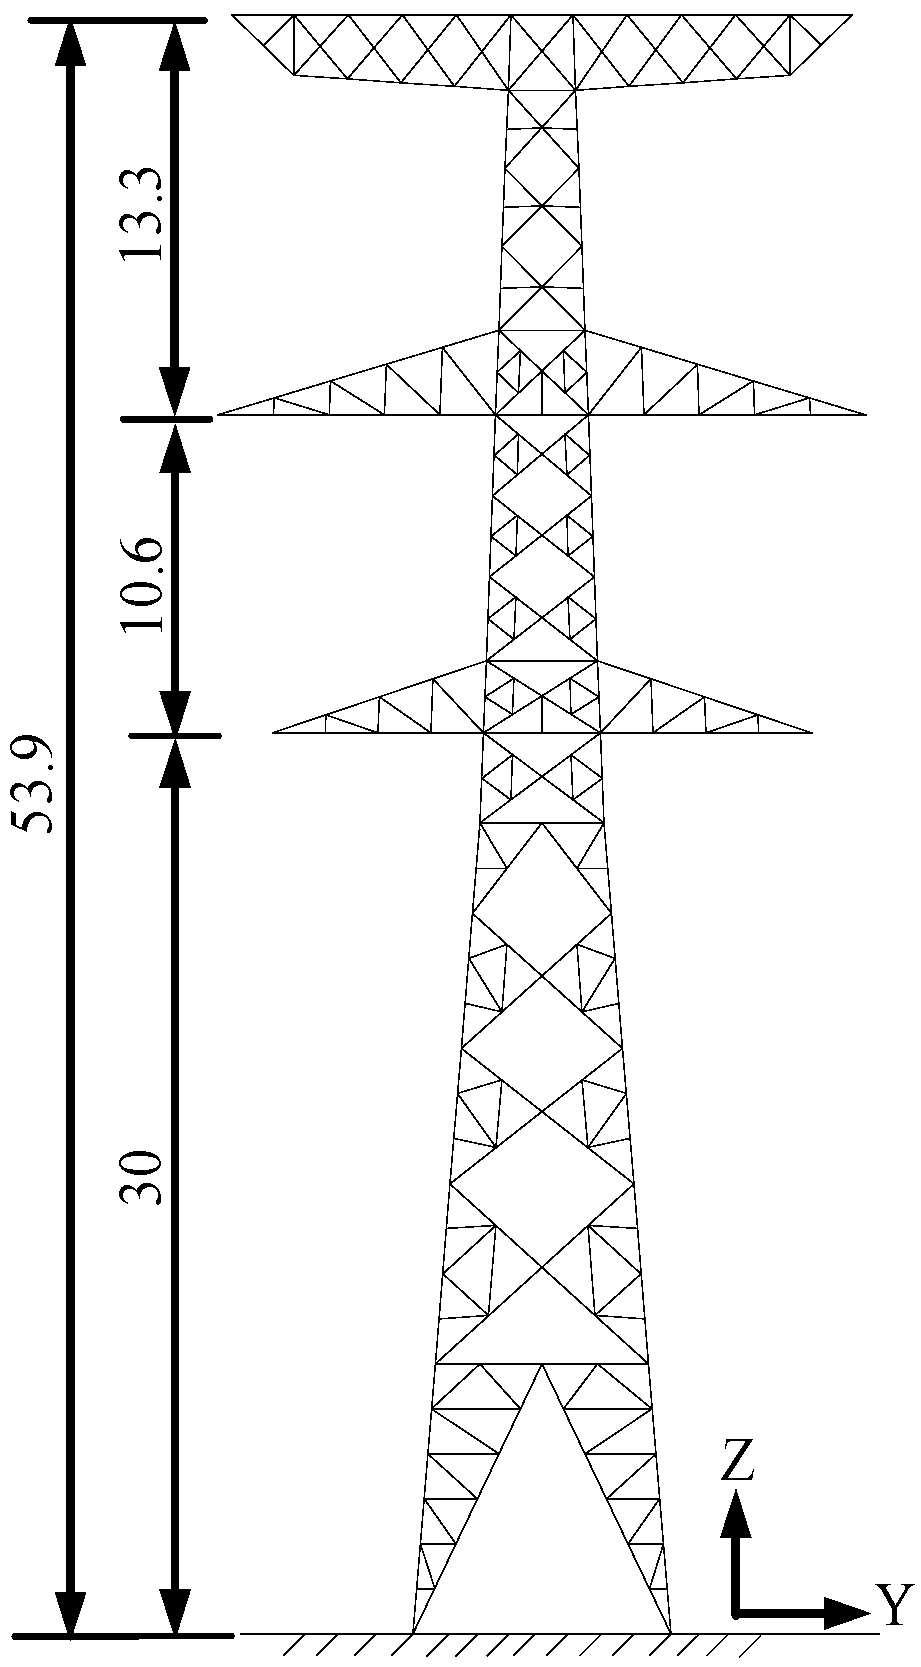
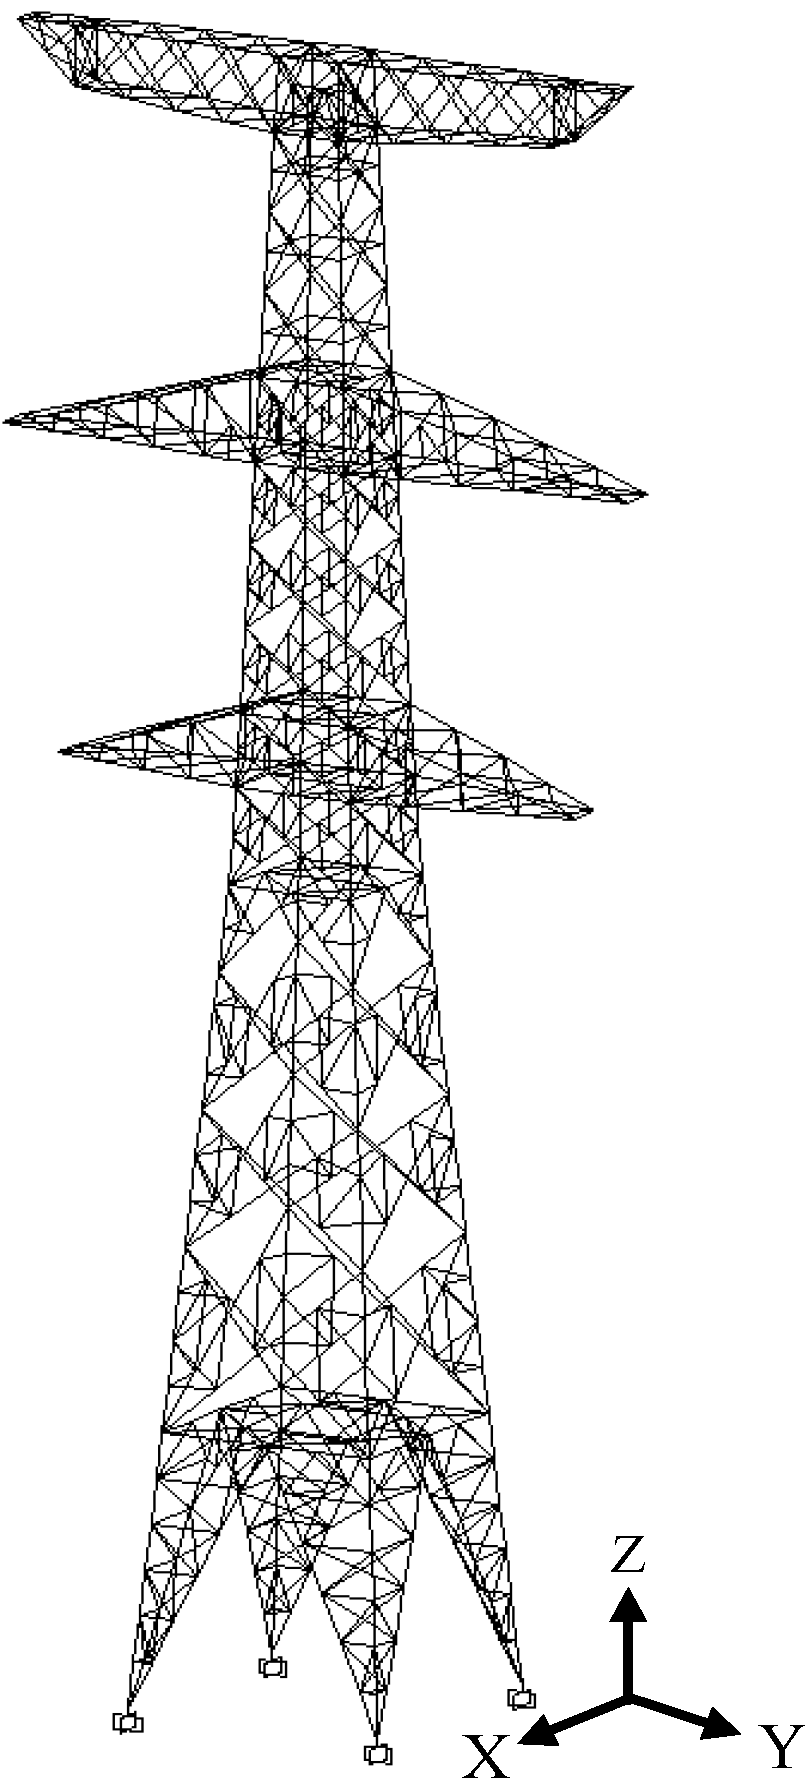
A SZ21-type transmission tower practical engineering example in Northeast China was selected as the research object. Figure 2 shows the practical graph of the transmission tower. The height of the tower is 53.9 m, and its weight is 20.23 tons. The tower size is shown in Figure 3. The main member and diagonal members of the transmission tower are made of Q235 and Q345 angle steels with elastic moduli of 206 GPa. A three-dimensional finite element model of the power transmission tower was established by using ABAQUS (Dassasult Simulia Company, Providence, RI, USA), as shown in Figure 4. The X, Y, and Z directions of the model are expressed as the longitudinal, transverse, and vertical directions of the structure, respectively. The members of the transmission tower are simulated by B31 elements, and the base nodes of the transmission tower are fixed at the ground. Based on the analysis of the dynamic characteristics, the frequencies in the Y and X directions of the transmission tower are analyzed. The first three natural frequencies in the Y direction are 1.768, 4.870, and 8.909 Hz, while the first natural frequencies in the X direction are 1.797, 4.954, and 9.774 Hz. The vibration modes that shape the transmission tower are shown in Figure 5.
3.2. Simulation of the PTMD
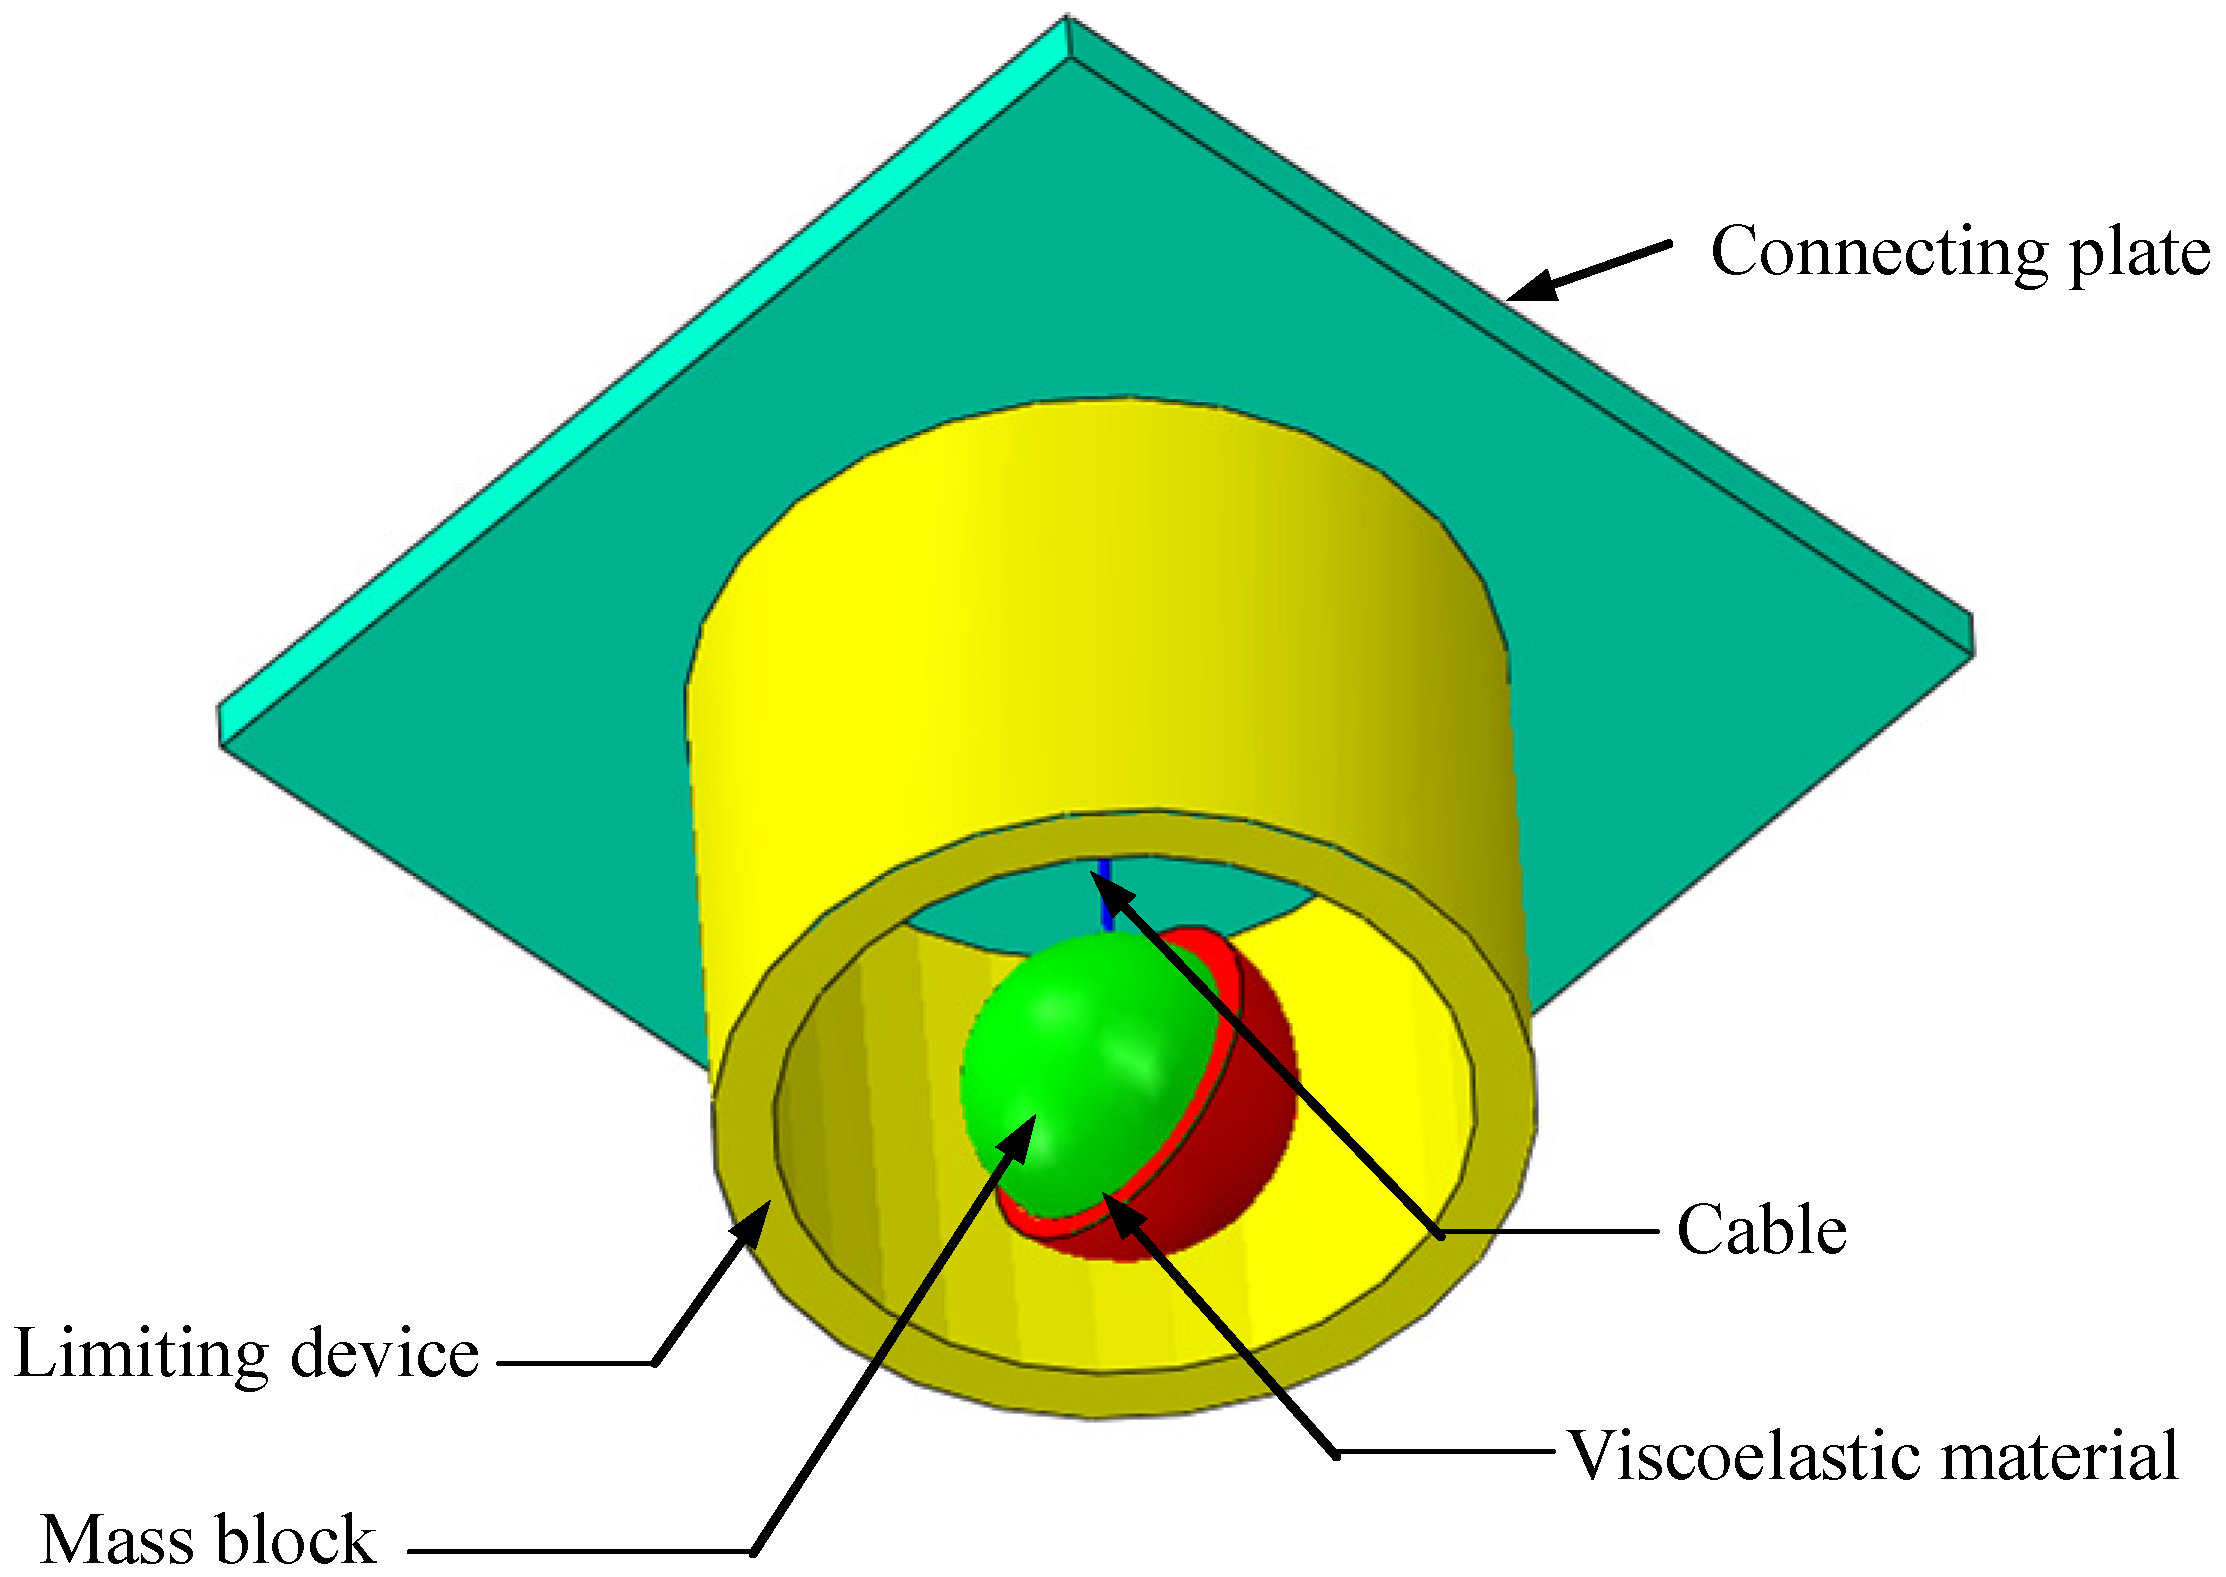
A PTMD can be obtained by the combination of a TMD and an impact damper, which has double the vibration reduction characteristics. The proposed PTMD is shown in Figure 6. The PTMD includes a cable, a mass block, a limiting device, and viscoelastic material, and the mass block is covered with viscoelastic material. The PTMD device is installed at the top of the tower by using the connecting plate, and the connecting plate is fixed on the angle steel of the tower by bolts. When the earthquake loads are small, the PTMD can be regarded as TMD. When the earthquake loads are large enough, the mass block will impact on the limiting device. Due to pounding energy dissipation, the PTMD has double the reduction characteristics, and the vibration reduction effect depends on the mass block, collision, and viscoelastic material.
The PTMD is simulated in ABAQUS. The mass ratio is 2%, and the mass of mass block is 404.7 kg. The mass block and limiting device are simulated by S3R elements. The spring element is adopted to simulate the cable, and the axial stiffness of the spring is 1900 kN/m. The axial stiffness of the spring is large enough so that the axial deformation can be ignored. The gap between the mass block and the limiting device is 0.02 m. The Mooney-Rivlin model is used for the viscoelastic material, and the mechanical constant C1 and C2 are 3.2 × 10⁶ Pa and 8.0 × 10⁵ Pa, respectively. The contact is defined as the surface-to-surface contact, and the penalty contact method is used as the contact algorithm. The length of the cable is determined by the natural period of the structure, which can be obtained from . Design guidelines of the optimal parameter of the PTMD are described in Figure 7.
To verify the accuracy of the finite element simulation of the PTMD, the finite element model of the transmission tower with the PTMD is compared to Zhang’s simplified model [16]. Figure 8 shows the time history curve of the top displacement of the transmission tower with the PTMD under the conditions of the El Centro earthquake. It can be seen that the two time history curves are slightly different, and the trend and maximum displacement are the same. Therefore, the finite element model of the PTMD is more accurate and can be used for further analysis.
4. Numerical Analysis and Discussion
4.1. Selection of Seismic Waves
Based on the Code for Seismic Design of Buildings [21], three typical natural seismic acceleration waves are selected, as listed in Table 1. The seismic category of the transmission tower is referred to as an eight-degree seismic design zone by the Code for Seismic Design of Buildings, so the peak ground acceleration is adjusted to 400 gal. Two horizontal components of seismic waves are applied along the longitudinal and transverse directions of the transmission tower simultaneously, and the maximum peak ground motion component of the seismic waves are input along the longitudinal direction of the structure.
4.2. Vibration Control of the PTMD
The response of the transmission tower is shown in Figure 5 and the PTMD under multi-component seismic excitations is analyzed. To compare with the vibration reduction effect of the PTMD, the response of the transmission tower with the TMD is also carried out. The mass ratio between the PTMD and the transmission tower is 2%. The length of the cable is 0.08 m. The gap between the mass block and limiting device is 0.02 m. The vibration reduction ratios of the TMD and PTMD can be expressed as follows:
where, , , and are the vibration reduction ratios of displacement, acceleration, and axial forces, respectively; , , and are the maximum response of the displacement, acceleration and axial force of the transmission tower without control, respectively. , , and are the maximum response of the displacement, acceleration, and axial force of the transmission tower with control, respectively.
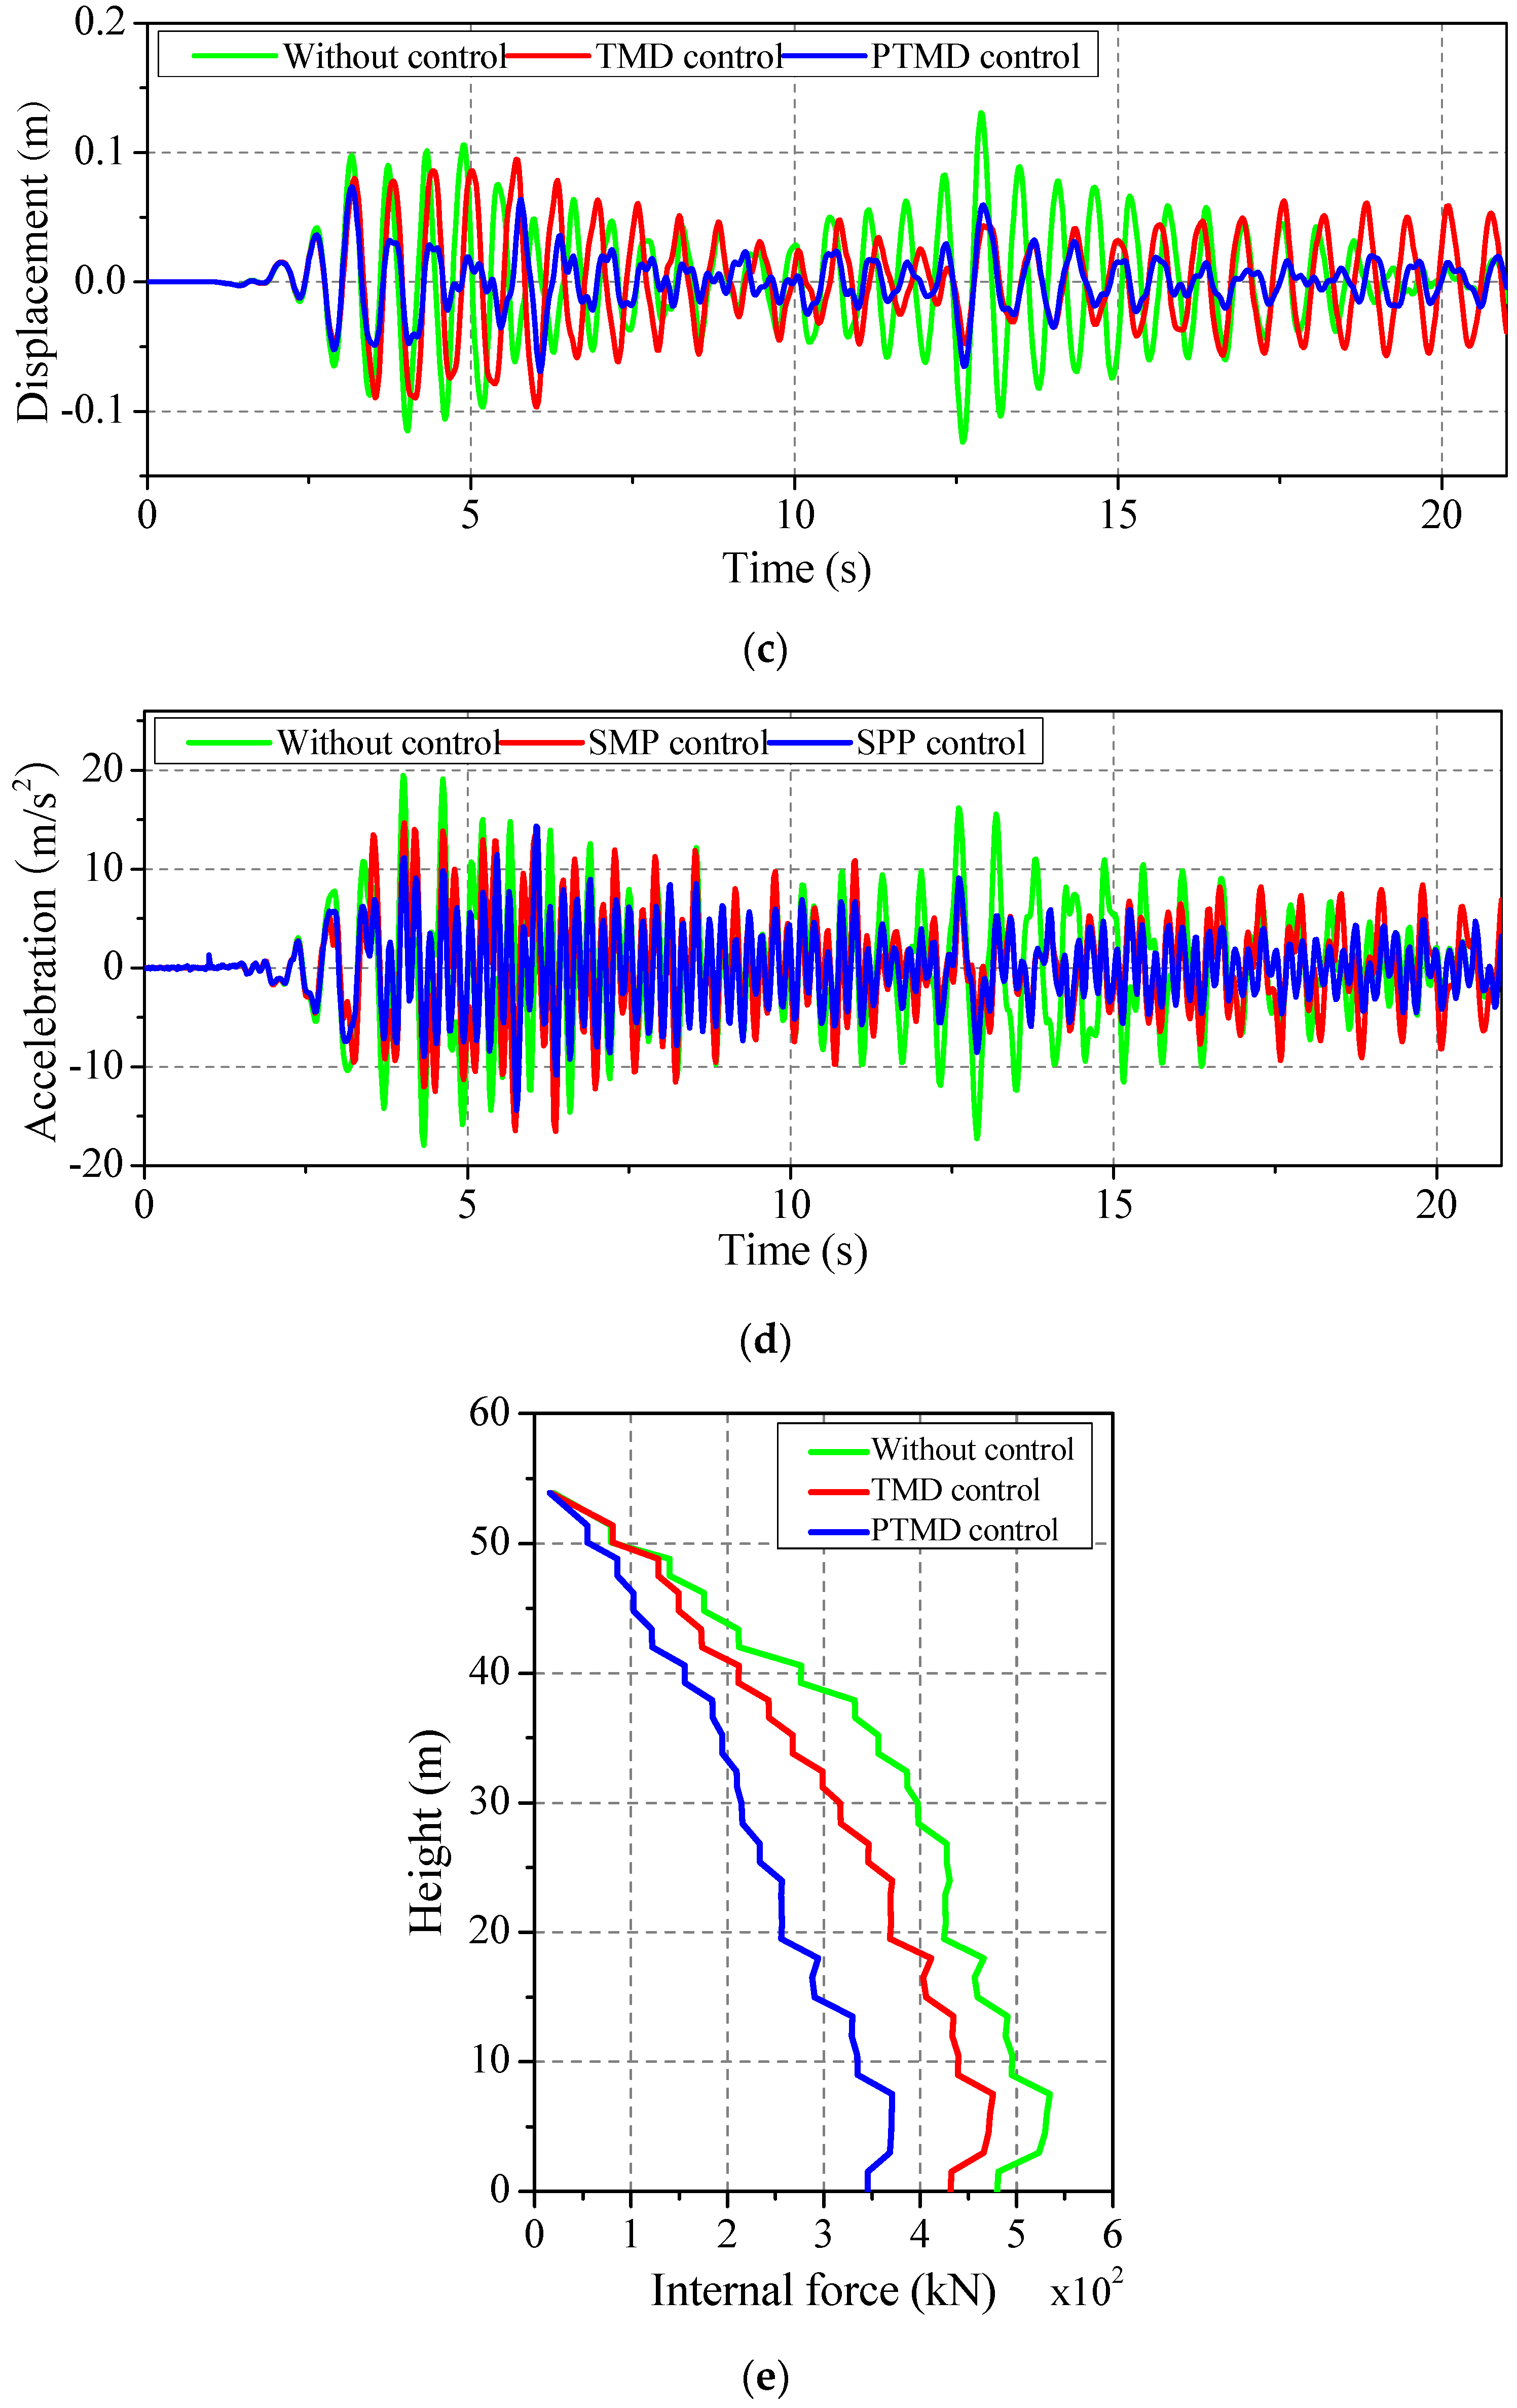
The responses of the transmission tower with the TMD, PTMD, and without control were subjected to the conditions of the El Centro earthquake and are shown in Figure 9. It can be seen from the displacement and acceleration time history curves at the top of the transmission tower that the PTMD can effectively reduce the response of the displacement and acceleration. Due to double the vibration control characteristics of the PTMD, the vibration reduction effect of the PTMD is better than that of the TMD, and the response of the transmission tower with PTMD is always smaller than that of the TMD. Note that the vibration control of the PTMD is stable. The PTMD can reduce the maximum axial force of the transmission tower, and the vibration reduction effect is different along the height of the transmission tower.
Table 2 listed the vibration reduction ratio of the transmission tower under multi-component seismic excitations. The vibration reduction ratios of the transmission tower under different seismic excitations are different. Analyzing the vibration reduction ratio of the transmission tower under the El Centro earthquake conditions, the TMD can effectively reduce the peak value of displacements in the longitudinal and transverse directions by 21% and 26%, but the vibration reduction ratios of 29% and 44% of the transmission tower with the PTMD are larger than those of with the TMD. The RMS (root mean square) reduction ratios of the displacements of the PTMD in the longitudinal and transverse directions are 54% and 54%, greater than those of the TMD which are 36% and 12%. The vibration reduction ratios of the acceleration peak values of the PTMD in the longitudinal and transverse directions are 37% and 26%, and the RMS reduction ratios in the longitudinal and transverse directions are 52% and 36%, which are larger than those of the TMD. In terms of axial force, the maximum axial force of the transmission tower with the PTMD is reduced by 28%, but the vibration reduction ratio of the TMD is only 10%. The results are similar to the response of the transmission tower under the Northridge and Kobe earthquake conditions shown in Table 2. It can be seen from the table that the reduction ratio of the PTMD is significantly larger than that of the TMD owing to the double reduction characteristics.
4.3. Parametric Study
To obtain an optimal design of the PTMD, the effect of the mass ratio between the PTMD and the transmission tower, the effect of the ground motion intensity, the effect of the gap between the mass block and the limiting device, and the effect of the incident angle of the seismic ground motion are investigated, respectively. The El Centro earthquake is selected in this section. Unless mentioned otherwise, the peak ground acceleration of the El Centro earthquake is adjusted to 400 gal, and the mass ratio and gap are 2% and 0.02 m, respectively.
4.3.1. Effect of Mass Ratio
To investigate the effect of the mass ratio, ten different mass ratios are considered in the analysis, and the mass ratios are selected as 0.5%–5%, in increments of 0.5%, to cover the range of the change of the mass ratio. Figure 10 shows the vibration reduction ratios of the maximum displacement with different ratios. The reduction ratio of the PTMD increases gradually with the increase of the mass ratio until 2%. However, the increase of the reduction ratio of the PTMD is slow when the mass ratio is larger than 2%. The reduction ratios in the longitudinal and transverse directions with the change of the mass ratio have the same trend. Therefore, considering the effect of the reduction ratio and economics, 2% is selected as the optimal result.
4.3.2. Effect of Seismic Intensity
To study the effect of the ground motion intensity, 125 cm/s2, 220 cm/s2, 400 cm/s2, and 620 cm/s2 peak ground acceleration are considered, respectively. The vibration reduction ratios of the maximum displacement with different intensities are shown in Figure 11. The reduction ratio decreases with the increase of the ground motion intensity. The reduction effect of the transmission tower with PTMD in the longitudinal direction is greater than that of in the transverse direction. The reduction ratio of the transmission tower with the PTMD is affected insignificantly by the change of the ground motion intensity.
4.3.3. Effect of the Gap
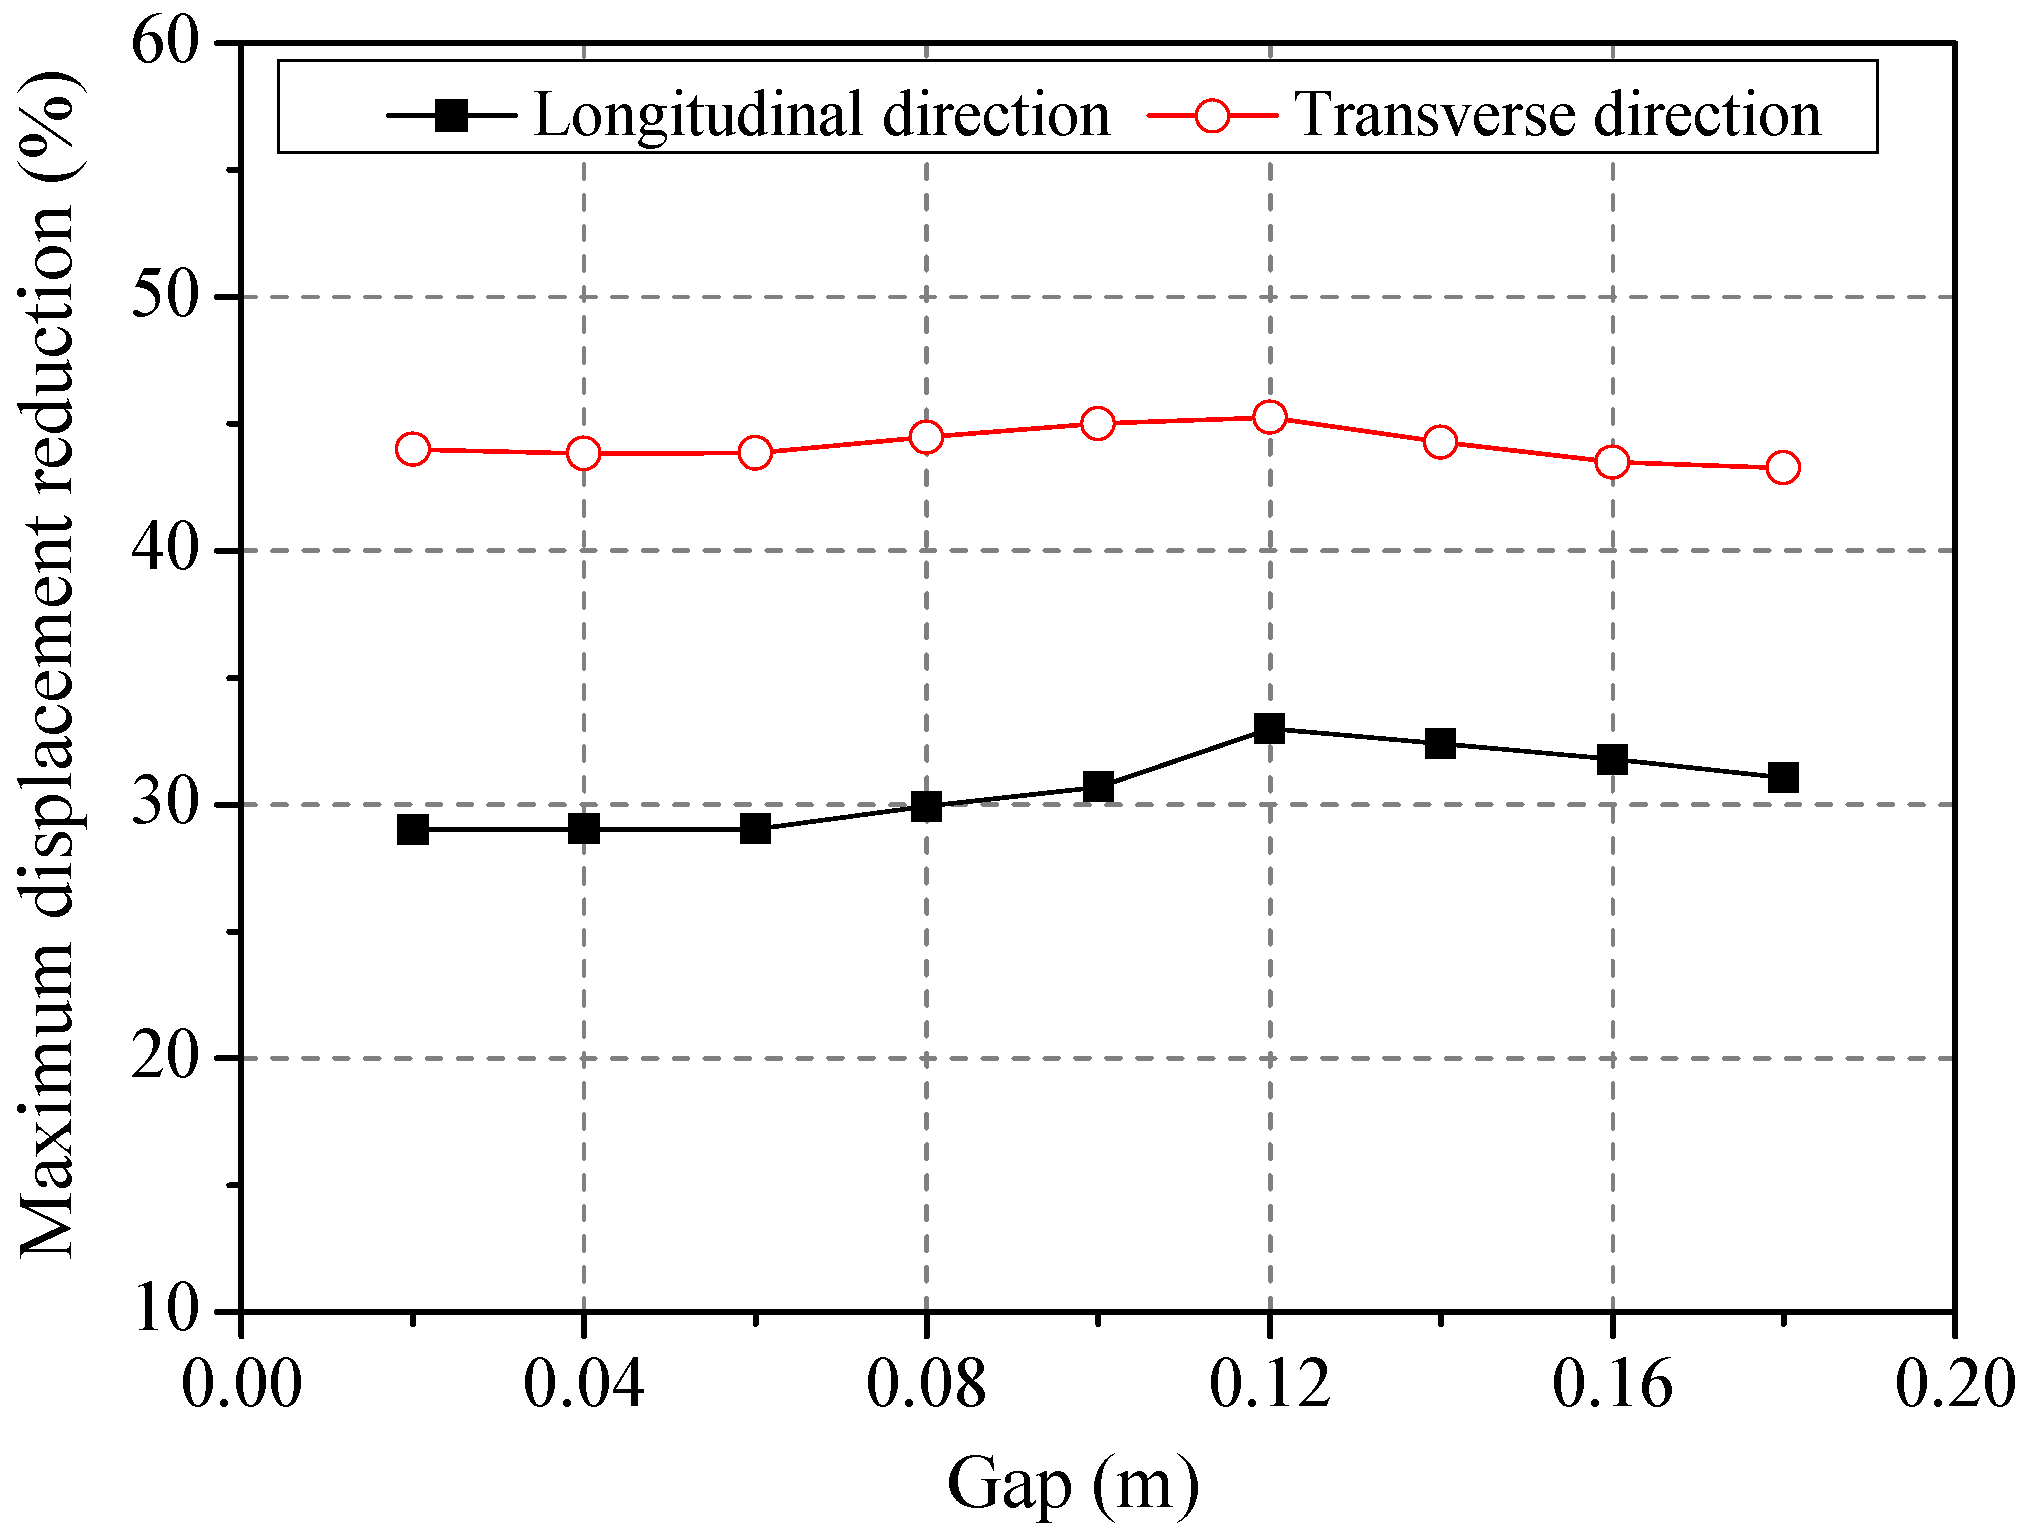
To obtain the effect of the gap between the mass block and the limiting device, nine different gaps are considered in this analysis, and the gaps are selected as 0.02–0.18 m, in increments of 0.02 m. Figure 12 shows variation in the reduction ratios of the maximum displacement with different gaps. It can be seen that the reduction ratio increases first, and then decreases with the increase of the size of the gap, but the change of the reduction ratio is not obvious. The reason for this phenomenon is that the pounding energy dissipation is limited with few collisions when the gap is large. Therefore, the influence of the gap on the control effect of the PTMD is not significant.
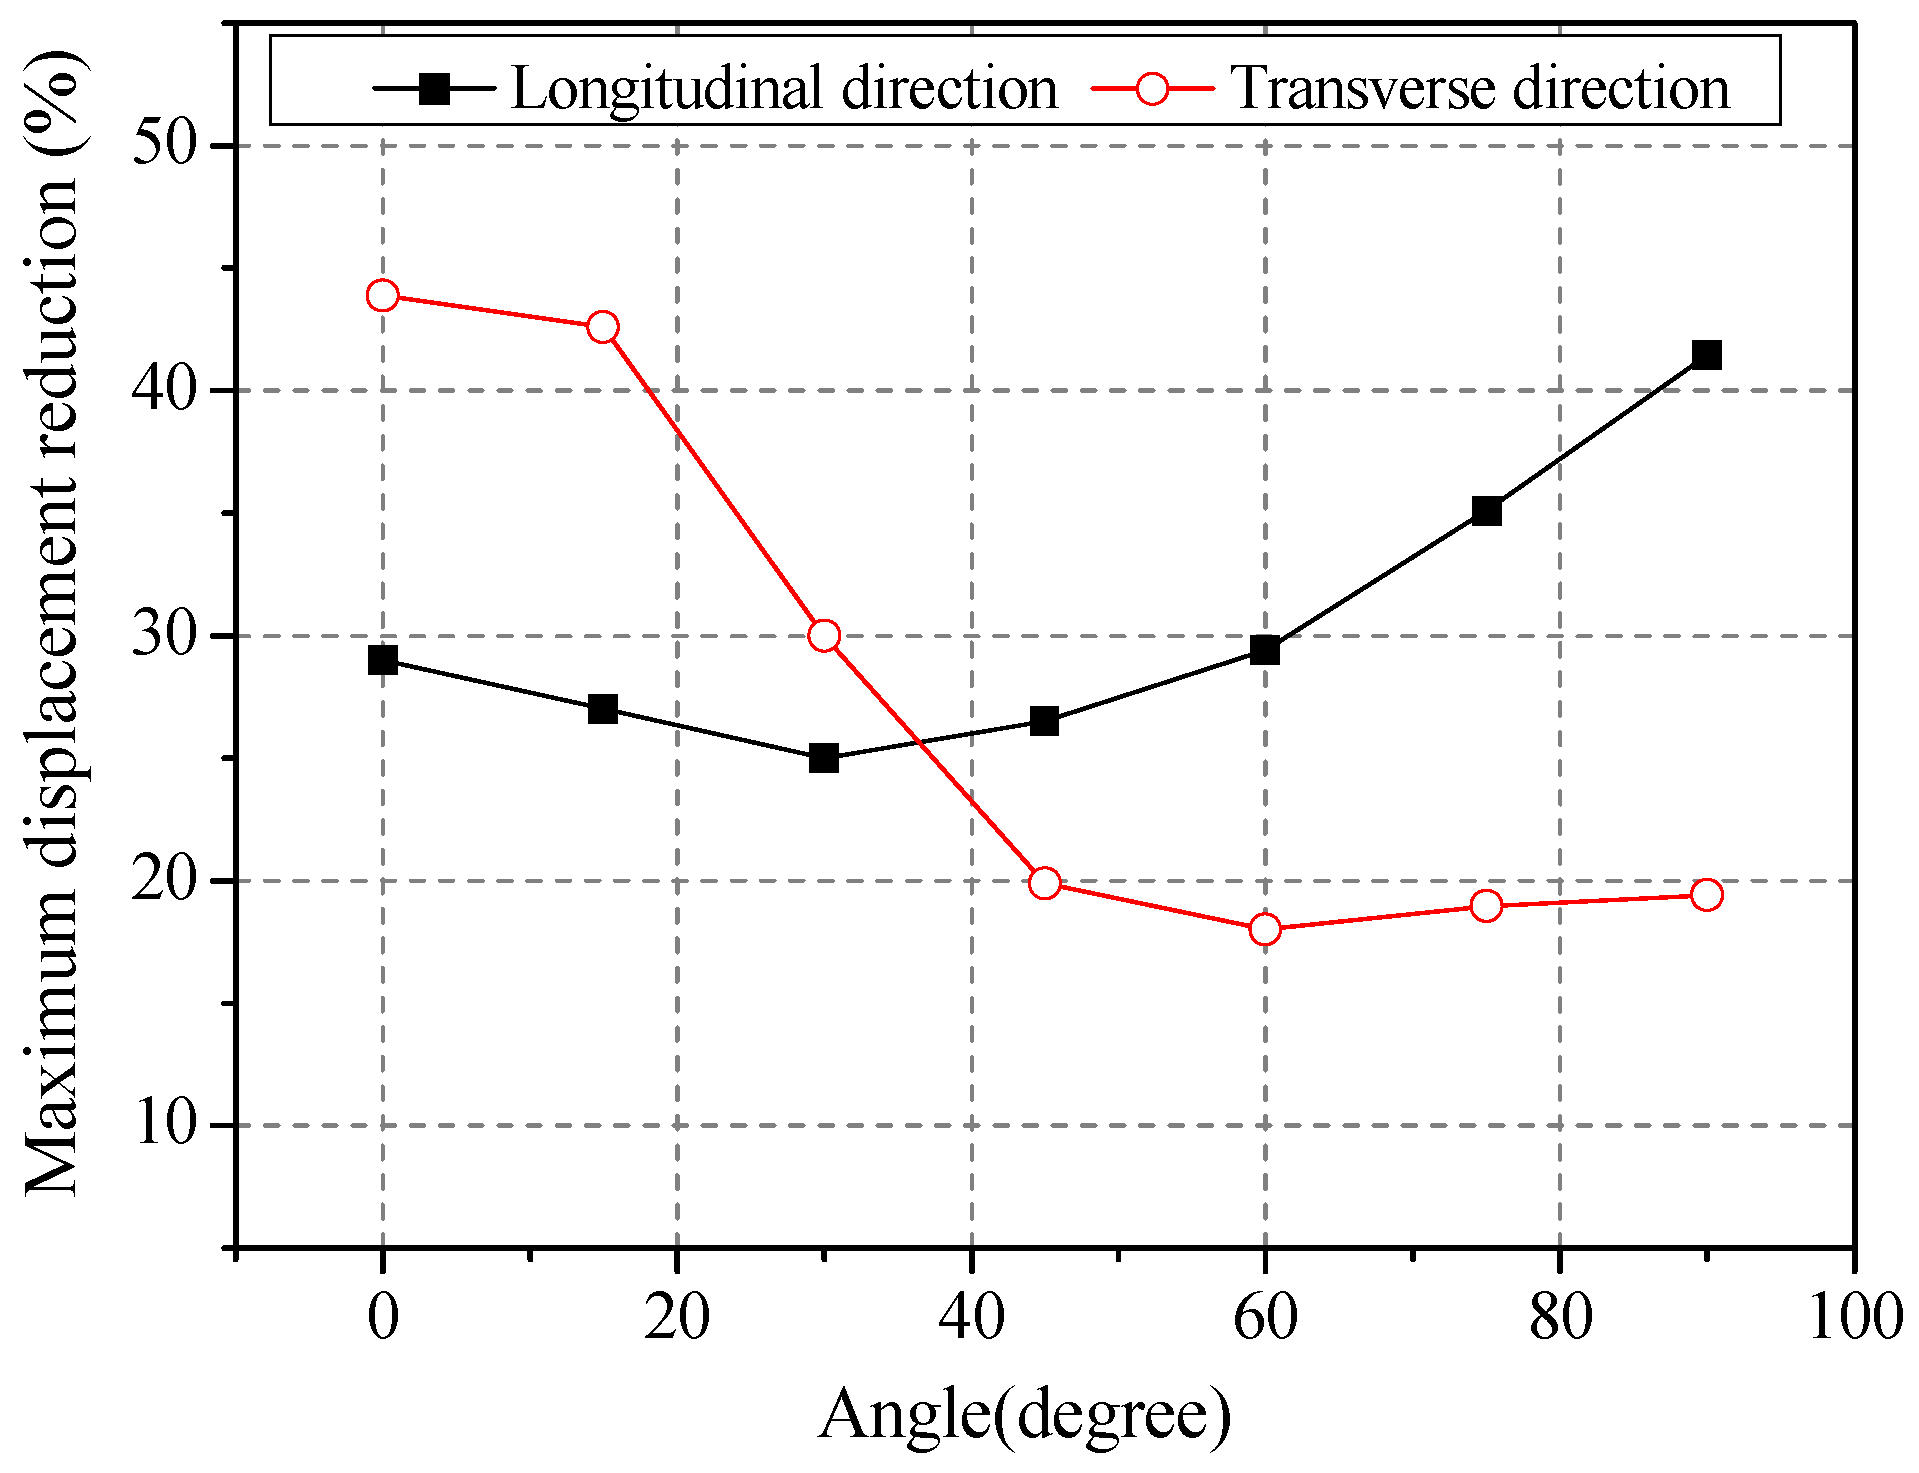
4.3.4. Effect of the Incident Angle
To investigate the effect of the incident angles, seven different incident angles are considered in the study, with the incident angle being from 0–90°, in increments of 15°. As can be seen in Figure 13, the vibration reduction ratios of the maximum displacement with different incident angles are given. With the increase of the incident angle, the reduction ratio in the longitudinal direction increases gradually owing to the decreasing ground motion intensity, and the maximum reduction ratio is 1.5 times that of the minimum reduction ratio. On the contrary, the reduction ratio in the transverse direction decreases with the increase of the incident angle, and the maximum reduction ratio is 3.0 times that of the minimum reduction ratio. Based on the above analysis, the incident angle has a significant influence on the reduction ratio. Therefore, the incident angle cannot be ignored for the analysis of the transmission tower with the PTMD.
5. Conclusions
According to a 500 kV transmission line practical engineering example, a three-dimensional finite element model of the power transmission tower is established. The PTMD is simulated in ABAQUS. The vibration reduction mechanism of PTMD is introduced. The response of the transmission tower with a TMD and PTMD are performed, respectively. Based on the above analysis results, the following conclusions are drawn:
- (1)
- Compared with the TMD, the PTMD is more effective in reducing the vibration of a transmission tower under multi-component seismic excitations. The vibration reduction ratios of the transmission tower with PTMD are varied with different seismic waves.
- (2)
- The reduction ratios of the transmission tower with PTMD in the longitudinal and transverse directions have the same trend with the increase of mass ratio until 2%. The mass ratio of 2% is the optimal result.
- (3)
- The reduction ratios of the transmission tower with the PTMD in the longitudinal and transverse directions decrease with the increase of the ground motion intensity, but the ground motion intensity has an insignificant influence on the reduction ratio.
- (4)
- The reduction ratio of the transmission tower with the PTMD in the longitudinal and transverse directions increases first, and then decreases with the increase of the gap. The influence of the gap on the control effect of the PTMD is not significant.
- (5)
- The reduction ratio in the longitudinal direction increases gradually with the increase of the incident angle. Compared with the reduction ratio in the longitudinal direction, the trend of the reduction ratio in the transverse direction is just the opposite. The incident angle has a significant influence on the reduction ratio.
Acknowledgments
This study were financially supported by the National Natural Science Foundation of China (No. 51578325 and 51208285), and Key Research and Development Plan of Shandong Province (No. 2016GGX104008).
Author Contributions
Li Tian and Kunjie Rong did the modelling work, analyzed the simulation date and wrote the paper. Peng Zhang and Yuping Liu revised and checked the paper.
Conflicts of Interest
The authors declare no conflict of interest.
References
- Hall, F.J. Northridge Earthquake of January 17, 1994: Reconnaissance Report; Earthquake Engineering Research Institute: Oakland, CA, USA, 1995; Volume 11, pp. 212–215. [Google Scholar]
- Luo, Q.F. Damages to life-line systems caused by Hyogoken Nanbu, Japan, earthquake and their recovery. J. Catastrophol. 1997, 12, 43–48. [Google Scholar]
- Zhang, Z.Y.; Zhao, B.; Cao, W.W. Investigation and Preliminary Analysis of Damages on the Power Grid in the Wenchuan Earthquake of M8.0. Electr. Power Technol. Econ. 2008, 20, 1–4. [Google Scholar]
- Yu, Y.Q. Investigation and Analysis of Electric Equipment Damage in Sichuan Power Grid Caused by Wenchuan Earthquake. Power Syst. Technol. 2008, 32, 1–6. [Google Scholar]
- Zhang, D.C.; Zhao, W.B.; Liu, M.Y. Analysis on seismic disaster damage cases and their causes of electric power equipment in 5.12 Wenchuan earthquake. J. Nanjing Univ. Technol. 2009, 31, 44–48. [Google Scholar]
- Liu, R.S.; Liu, J.L.; Yan, D.Q. Seismic damage investigation and analysis of electric power system in Lushan Ms 7.0 earthquake. J. Nat. Disasters 2013, 22, 83–90. [Google Scholar]
- Kilroe, N. Aerial method to mitigate vibration on transmission towers. In Proceedings of the 2000 IEEE ESMO—2000 IEEE 9th International Conference on Transmission and Distribution Construction, Operation and Live-Line Maintenance Proceedings, Montreal, QC, Canada, 8–12 October 2000; pp. 187–194. [Google Scholar]
- Battista, R.C.; Rodrigues, R.S.; Pfeil, M.S. Dynamic behavior and stability of transmission line towers under wind forces. J. Wind Eng. Ind. Aerodyn. 2003, 91, 1051–1067. [Google Scholar]
- Park, J.H.; Moon, B.W.; Min, K.W. Cyclic loading test of friction-type reinforcing members upgrading wind-resistant performance of transmission towers. Eng. Struct. 2007, 29, 3185–3196. [Google Scholar]
- Chen, B.; Zheng, J.; Qu, W. Control of wind-induced response of transmission tower-line system by using magnetorheological dampers. Int. J. Struct. Stab. Dyn. 2009, 9, 661–685. [Google Scholar]
- Li, L.; Cao, H.; Ye, K. Simulation of galloping and wind-induced vibration control. Noise Vib. Worldw. 2010, 41, 15–21. [Google Scholar]
- Tian, L.; Yu, Q.; Ma, R. Study on seismic control of power transmission tower-line coupled system under multicomponent excitations. Math. Probl. Eng. 2013, 2013, 1–12. [Google Scholar]
- Ema, S.; Marui, E. A fundamental study on impact dampers. Int. J. Mach. Tools Manuf. 1994, 34, 407–421. [Google Scholar]
- Collette, F.S. A combined tuned absorber and pendulum impact damper under random excitation. J. Sound Vib. 1998, 216, 199–213. [Google Scholar]
- Cheng, C.C.; Wang, J.Y. Free vibration analysis of a resilient impact damper. Int. J. Mech. Sci. 2003, 45, 589–604. [Google Scholar]
- Zhang, P.; Song, G.B.; Li, H.N. Seismic control of power transmission tower using pounding TMD. J. Eng. Mech. 2013, 139, 1395–1406. [Google Scholar]
- Zhang, P.; Li, L.; Patil, D.; Singla, M.; Li, H.N.; Mo, Y.L.; Song, G. Parametric study of pounding tuned mass damper for subsea jumpers. Smart Mater. Struct. 2016, 25, 15–28. [Google Scholar]
- Song, G.B.; Zhang, P.; Li, L.Y.; Singla, M.; Patil, D.; Li, H.N.; Mo, Y.L. Vibration control of a pipeline structure using pounding tuned mass damper. J. Eng. Mech. 2016, 142, 04016031. [Google Scholar]
- Li, H.N.; Zhang, P.; Song, G.; Patil, D.; Mo, Y. Robustness study of the pounding tuned mass damper for vibration control of subsea jumpers. Smart Mater. Struct. 2015, 24, 095001. [Google Scholar]
- Li, L.; Song, G.; Singla, M.; Mo, Y.L. Vibration control of a traffic signal pole using a pounding tuned mass damper with viscoelastic materials (II): Experimental verification. J. Vib. Control 2013, 21, 670–675. [Google Scholar]
- GB 50011-2010. In Code for Seismic Design of Buildings; Ministry of Construction of the People’s Republic of China and the State Quality Supervision and Quarantine Bureau: Beijing, China, 2010.
Figure 1.
The collapse of transmission towers during the Haiti earthquake.

Figure 2.
Practical graph of the transmission tower.

Figure 3.
Tower size (m).

Figure 4.
Three-dimensional finite element model of the transmission tower.

Figure 5.
Vibration mode shapes of the transmission tower. (a) The first modal shape in the Y direction; (b) The second modal shape in the Y direction; (c) The third modal shape in the Y direction; (d) The first modal shape in the X direction; (e) The second modal shape in the X direction; (f) The third modal shape in the X direction.
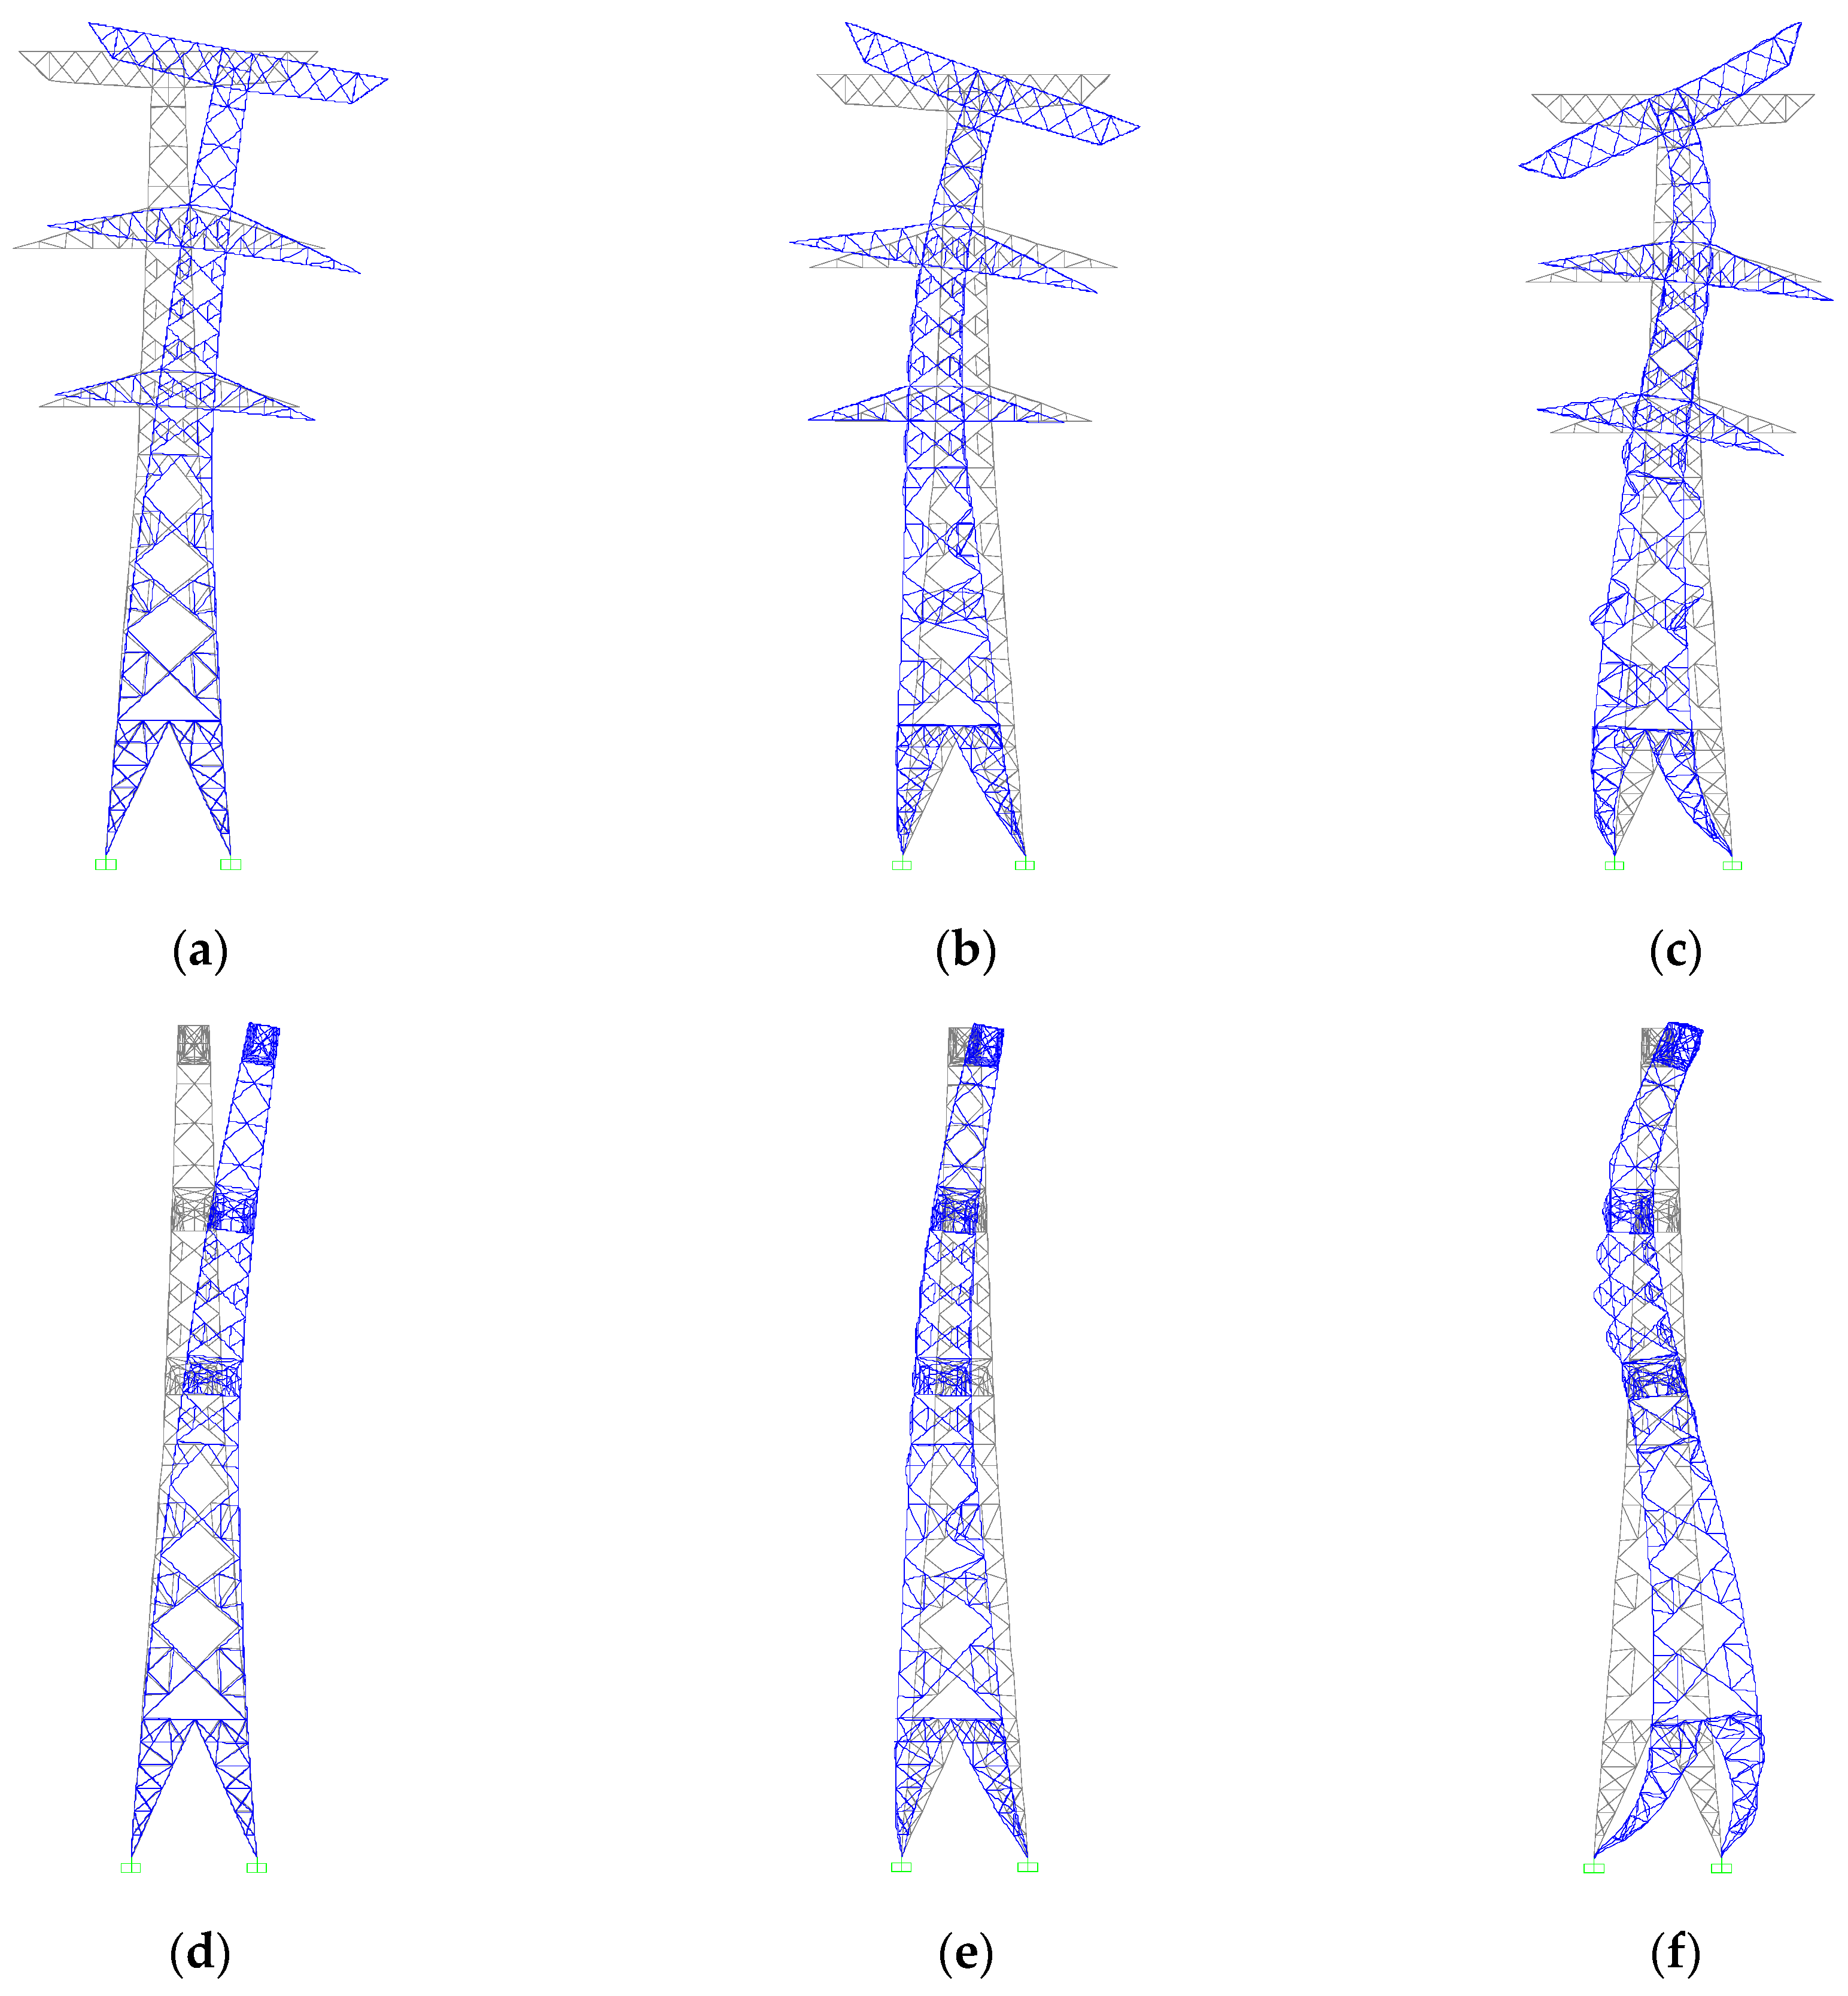
Figure 6.
Schematic diagram of the PTMD.

Figure 7.
Design guidelines of the optimal parameters of the PTMD.
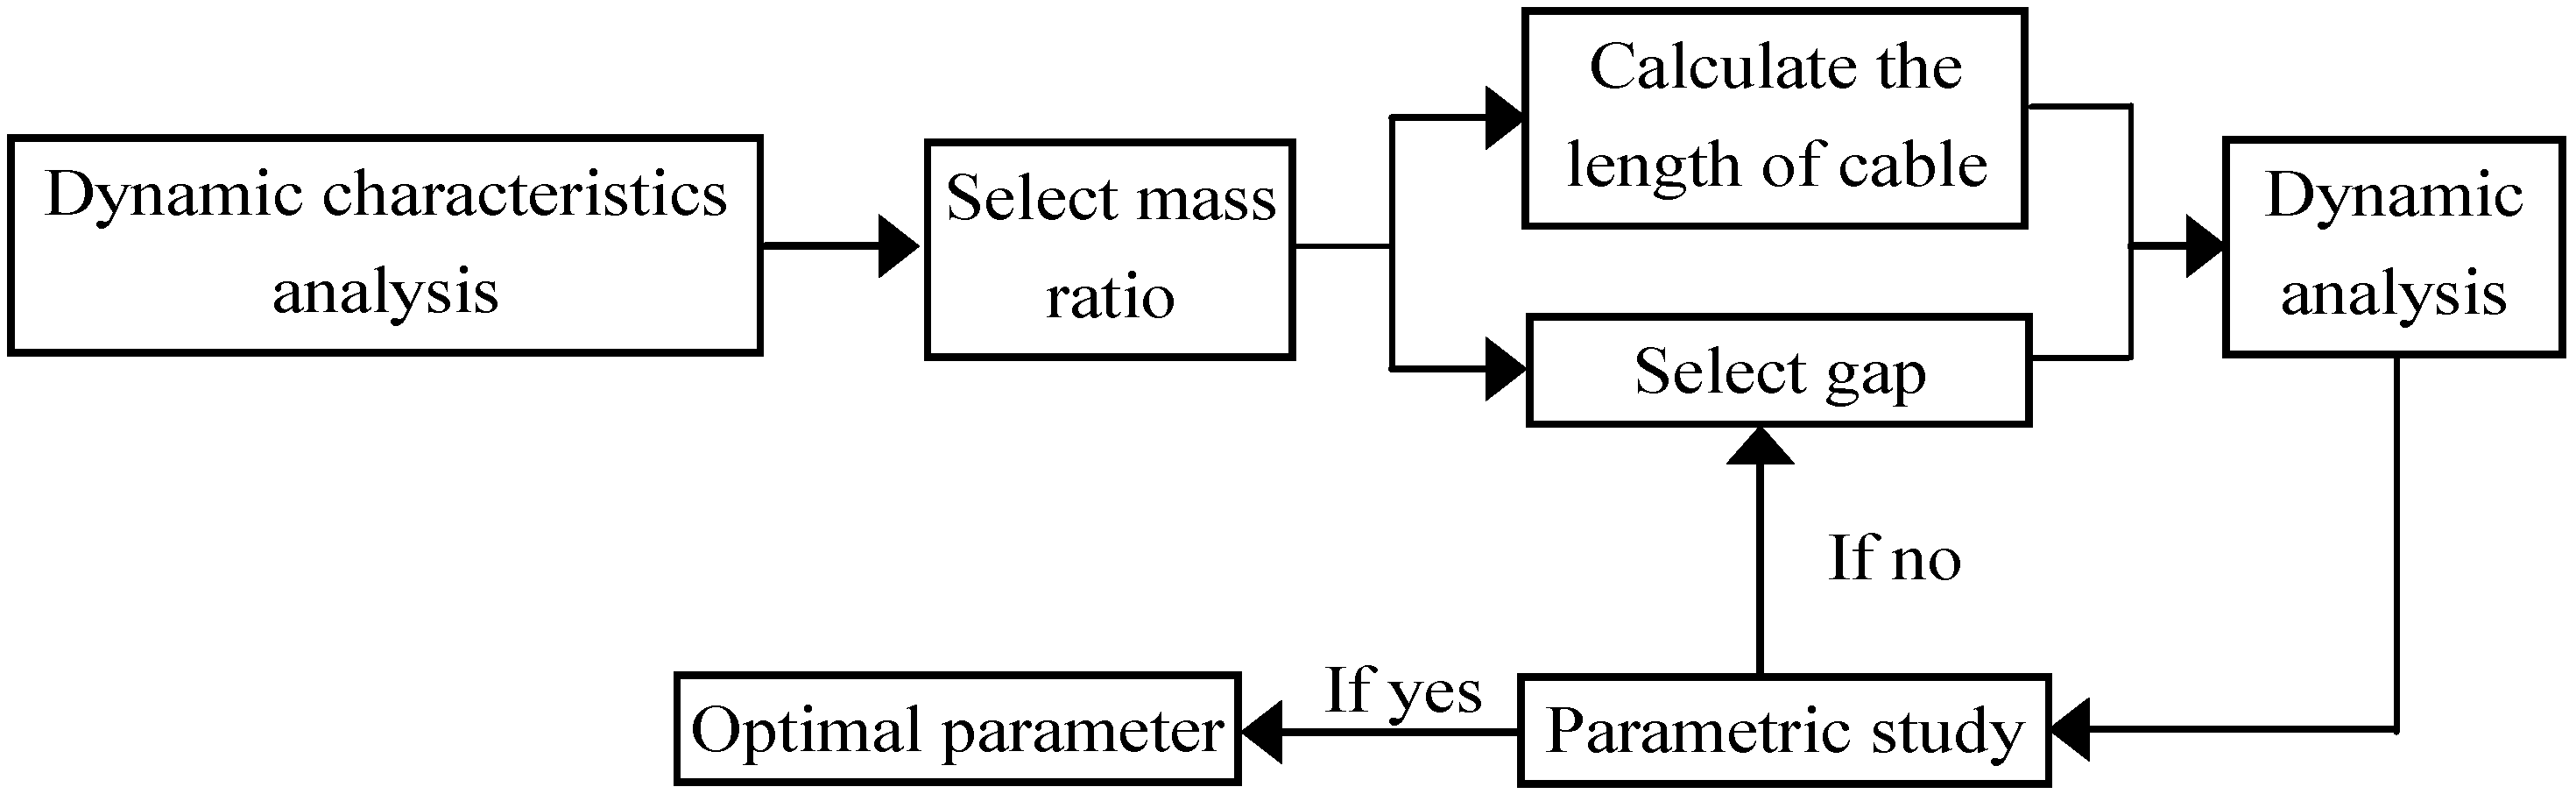
Figure 8.
Displacement response of the transmission tower with the PTMD under the conditions of the El Centro earthquake.
Figure 8.
Displacement response of the transmission tower with the PTMD under the conditions of the El Centro earthquake.
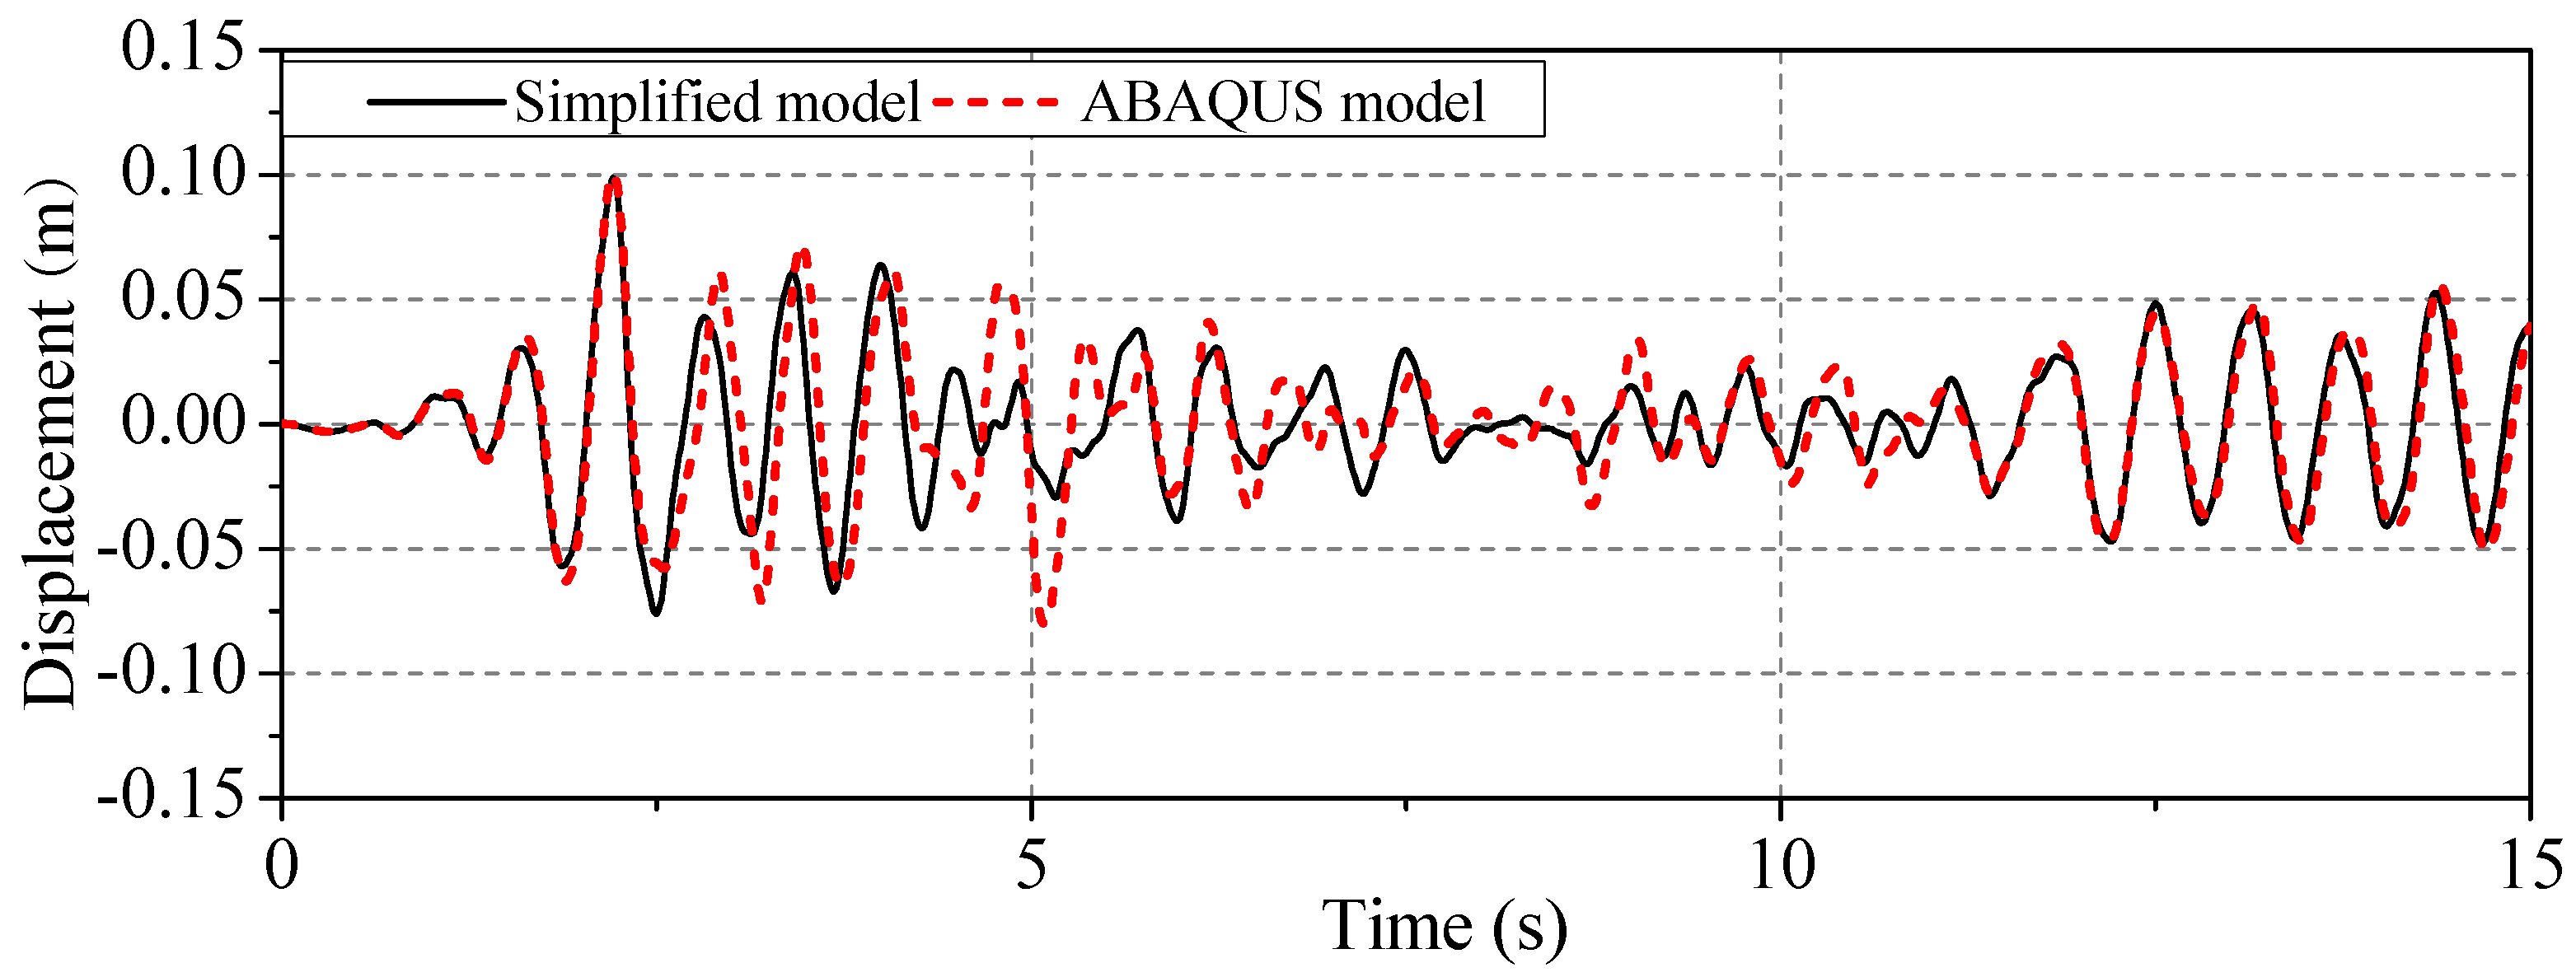
Figure 9.
Dynamic response under the El Centro earthquake conditions. (a) Longitudinal displacement; (b) Longitudinal acceleration; (c) Transverse displacement; (d) Transverse acceleration; (e) Axial internal force.
Figure 9.
Dynamic response under the El Centro earthquake conditions. (a) Longitudinal displacement; (b) Longitudinal acceleration; (c) Transverse displacement; (d) Transverse acceleration; (e) Axial internal force.
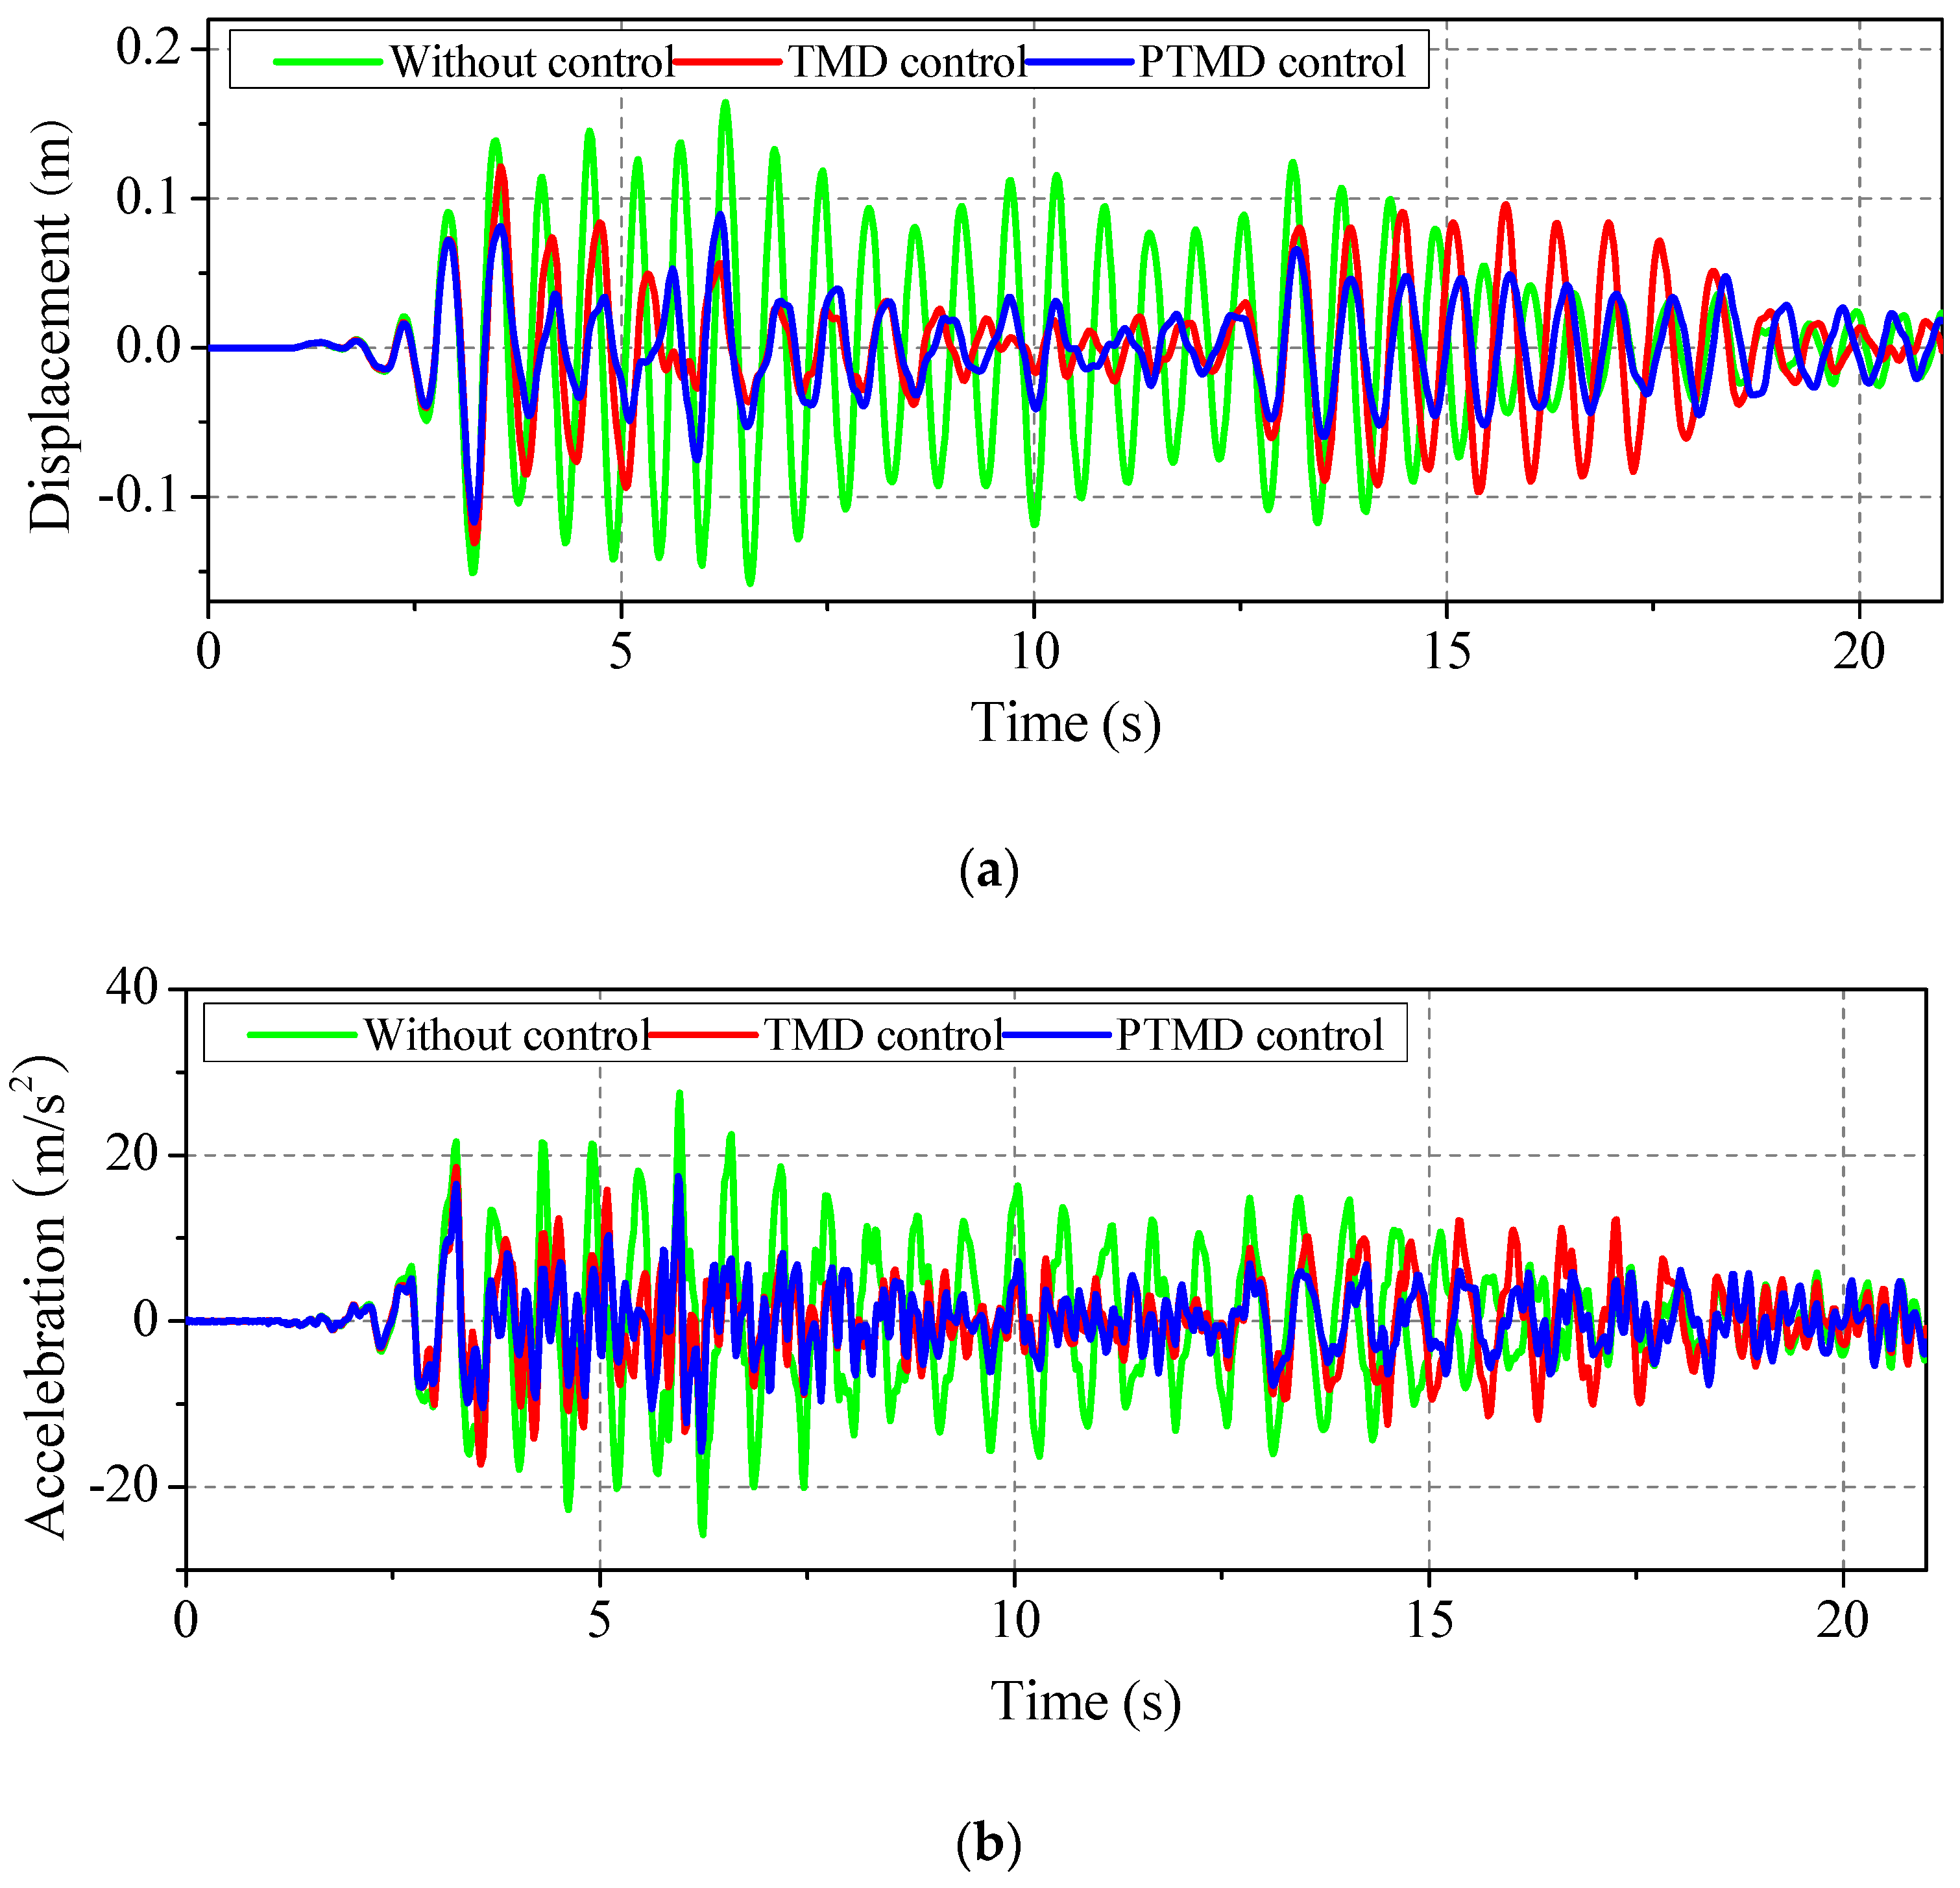

Figure 10.
Vibration reduction ratios of the maximum displacement with the different mass ratios.
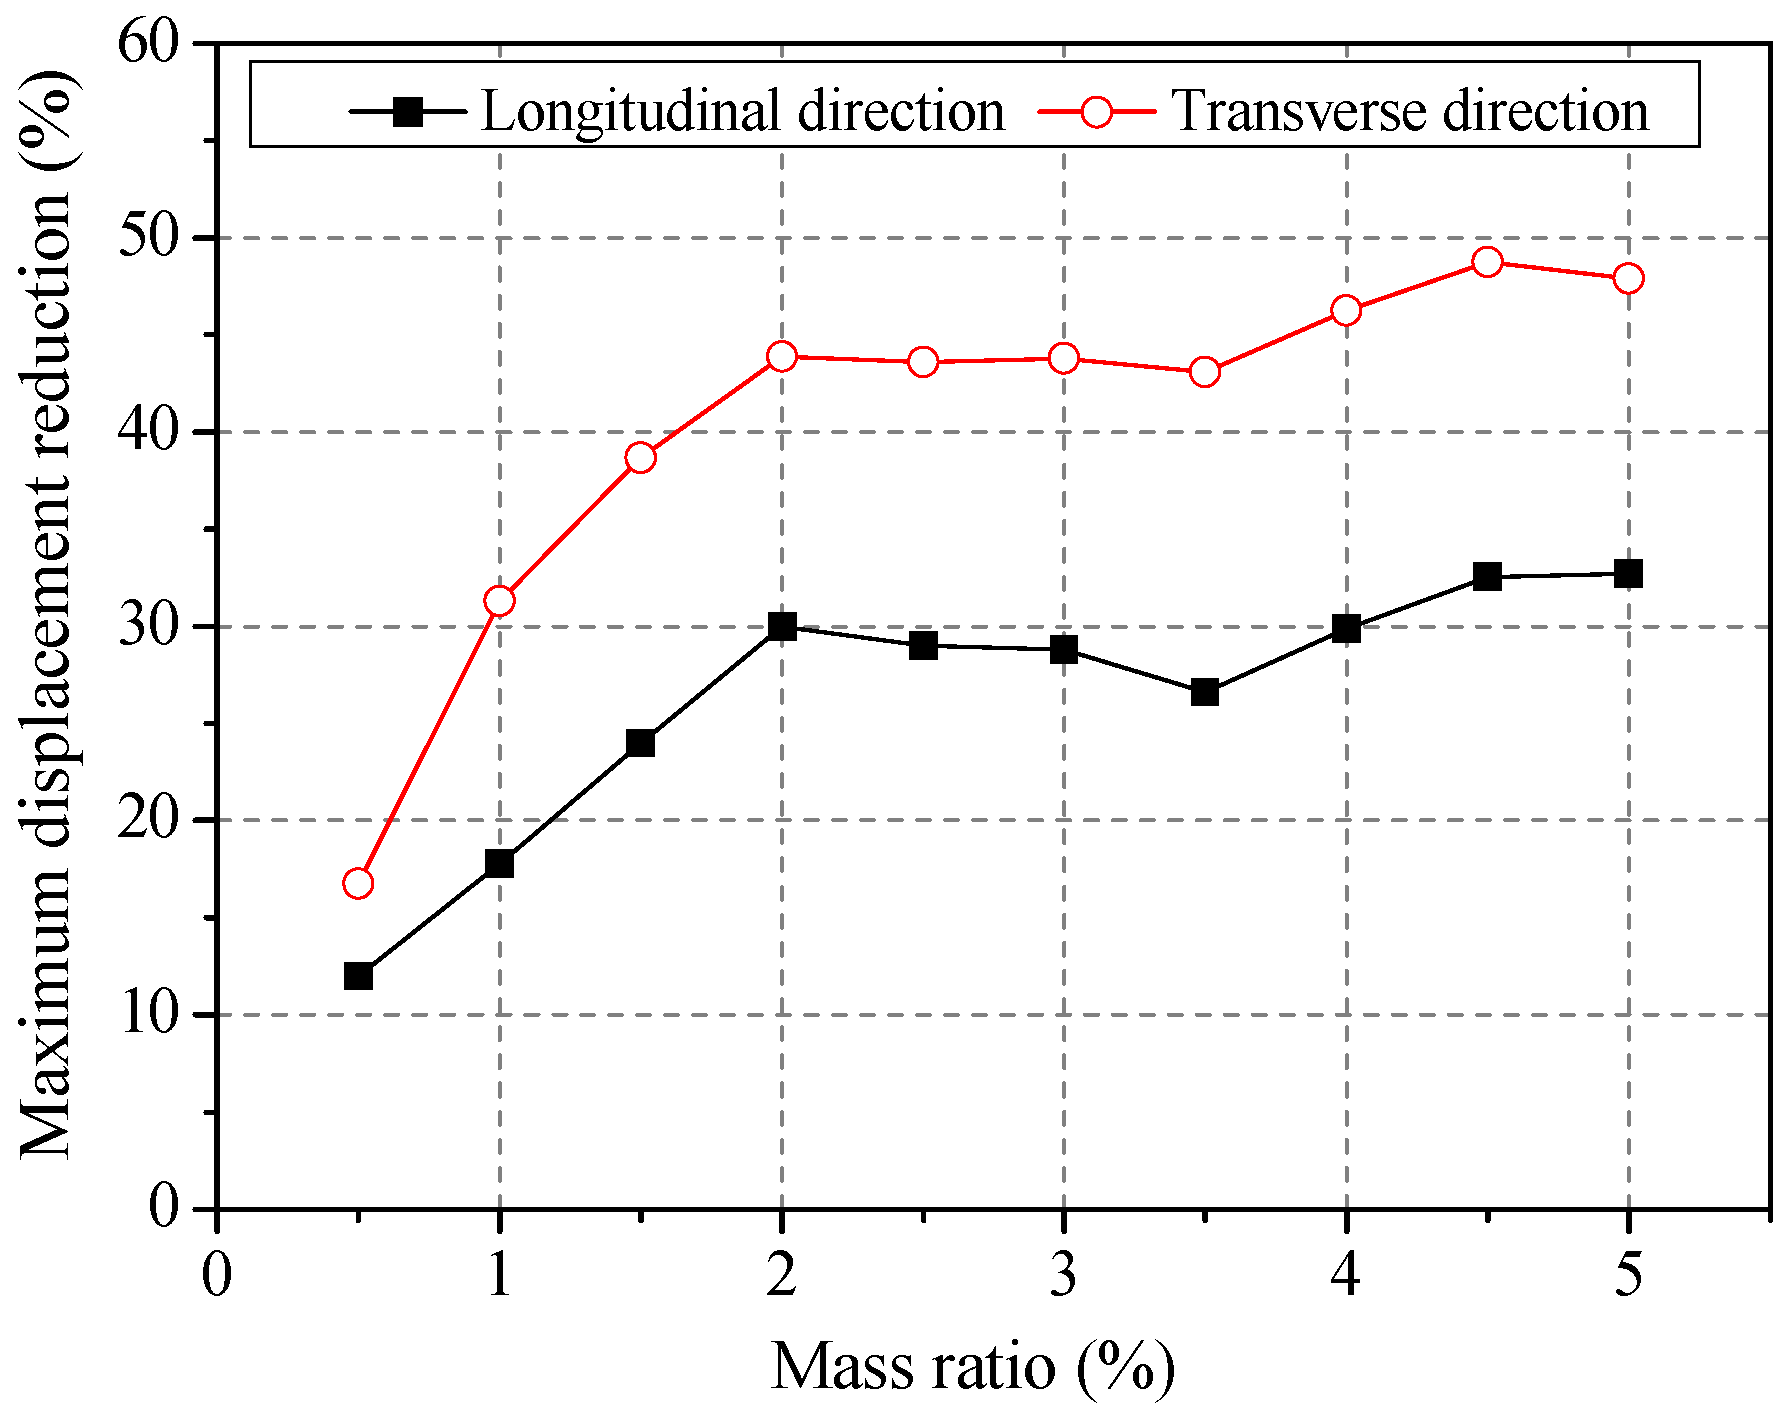
Figure 11.
Vibration reduction ratios of the maximum displacement with different intensities.
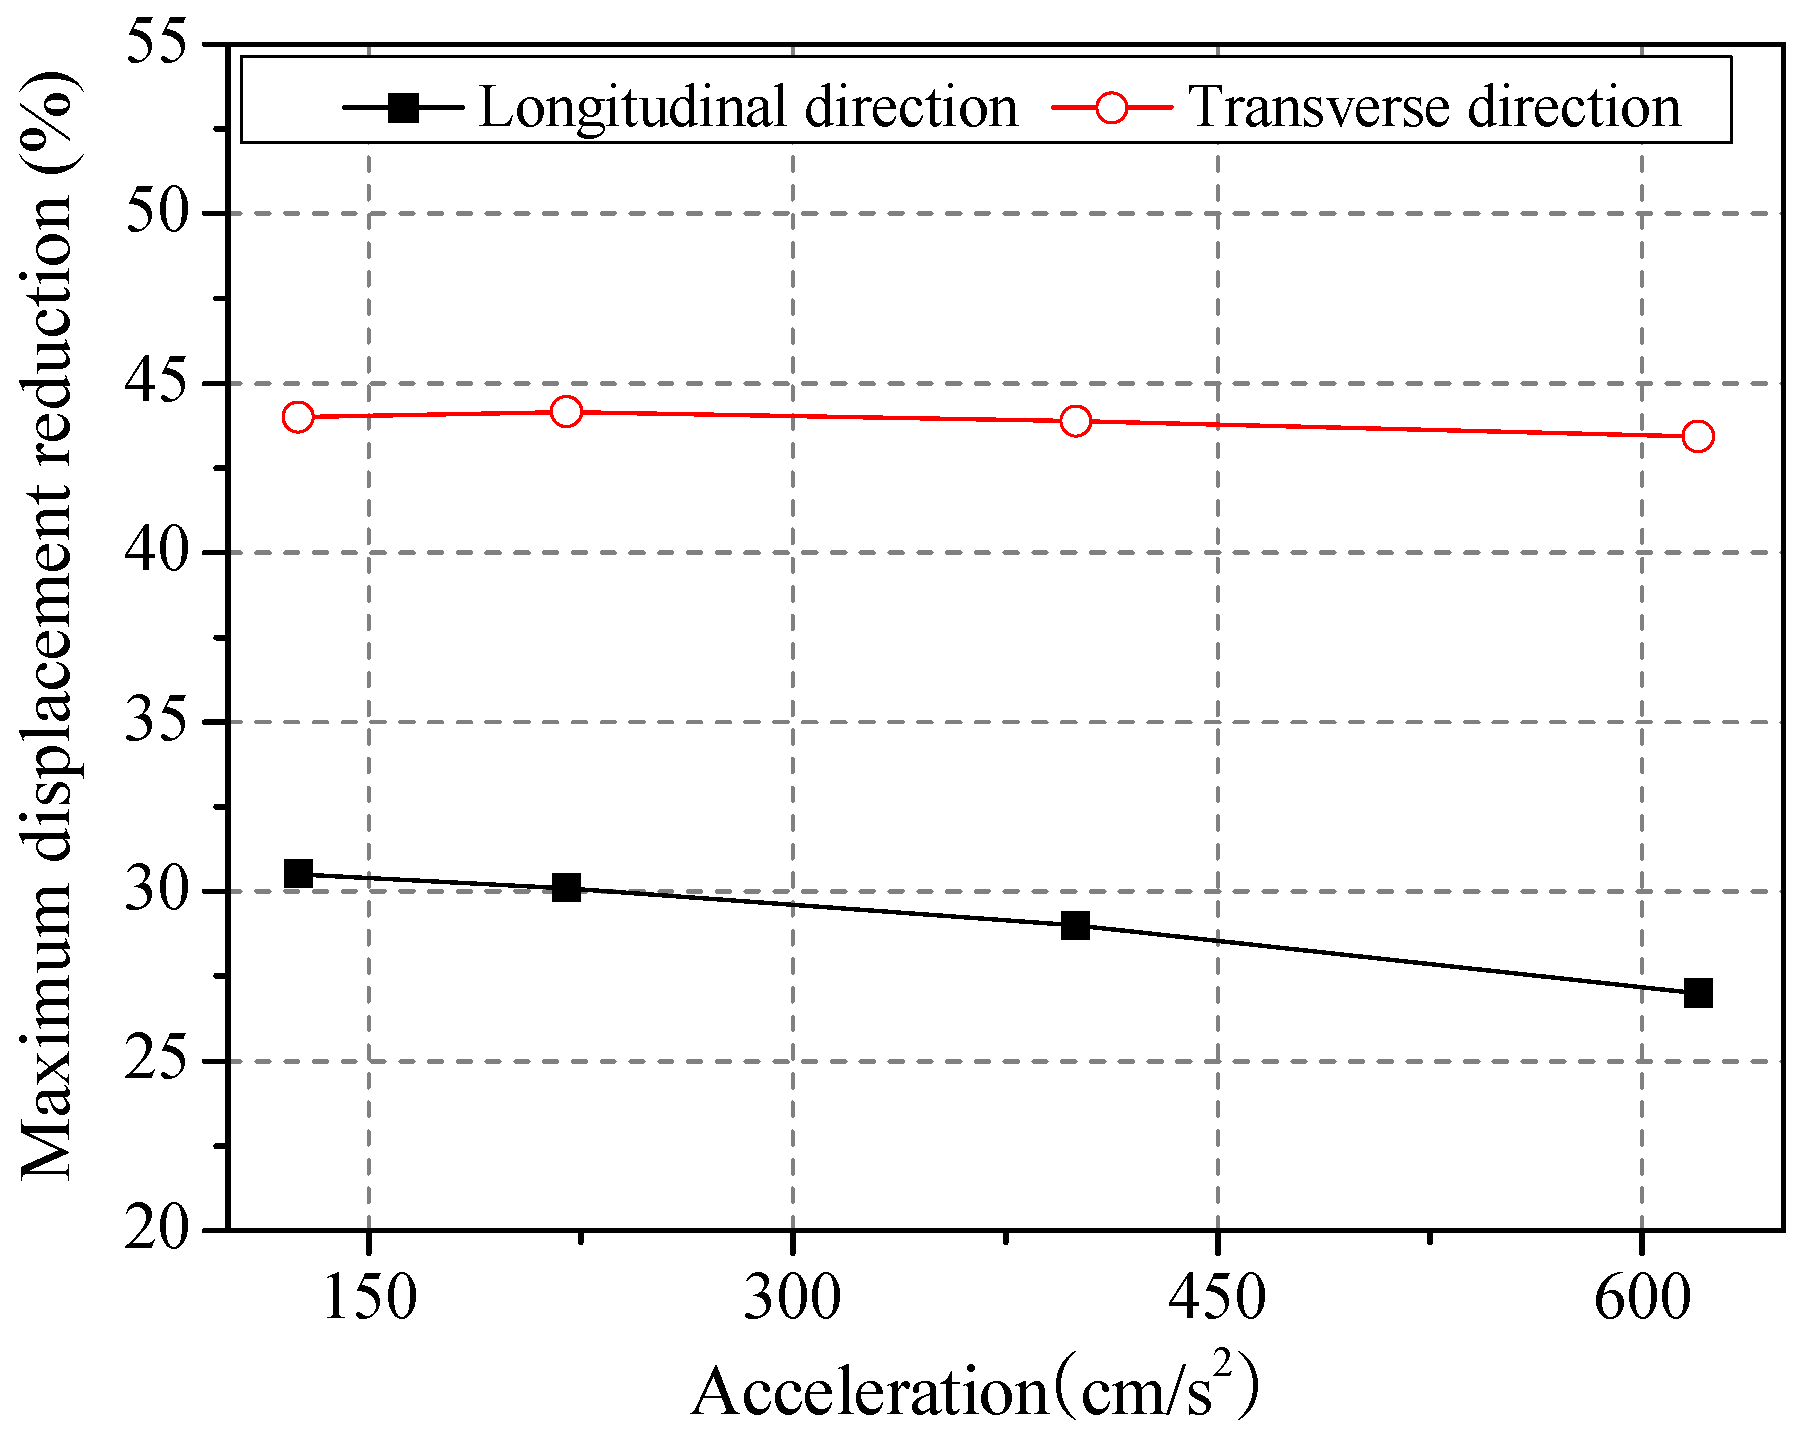
Figure 12.
Variation reduction ratios of the maximum displacement with different gap sizes.

Figure 13.
Vibration reduction ratios of the maximum displacement with different incident angles.

Table 1.
Seismic records.
| ID | Earthquake | Event Date | Magnitude | Station |
|---|---|---|---|---|
| EQ1 | Imperial Valley | 18 May 1940 | 6.9 | El Centro |
| EQ2 | Northridge | 17 January 1994 | 6.6 | La-Baldwin Hills |
| EQ3 | Kobe | 16 January 1995 | 6.9 | Oka |
Table 2.
Vibration reduction ratio of the transmission tower under multi-component seismic excitations.
Table 2.
Vibration reduction ratio of the transmission tower under multi-component seismic excitations.
| Seismic Records | Direction | Damper | Displacement | Acceleration | Damper | Axial Internal Force | |||
|---|---|---|---|---|---|---|---|---|---|
| Peak (%) | RMS (%) | Peak (%) | RMS (%) | Peak (%) | RMS (%) | ||||
| El Centro | X | TMD | 21 | 36 | 33 | 38 | TMD | 10 | 15 |
| PTMD | 29 | 54 | 37 | 52 | |||||
| Y | TMD | 26 | 12 | 15 | 16 | PTMD | 28 | 37 | |
| PTMD | 44 | 54 | 26 | 36 | |||||
| Northridge | X | TMD | 57 | 66 | 44 | 54 | TMD | 26 | 25 |
| PTMD | 63 | 71 | 51 | 58 | |||||
| Y | TMD | 39 | 33 | 23 | 13 | PTMD | 31 | 30 | |
| PTMD | 52 | 47 | 28 | 18 | |||||
| Kobe | X | TMD | 33 | 65 | 54 | 53 | TMD | 8.0 | 15 |
| PTMD | 47 | 74 | 70 | 54 | |||||
| Y | TMD | 30 | 26 | 36 | 28 | PTMD | 27 | 29 | |
| PTMD | 54 | 70 | 65 | 55 | |||||
© 2017 by the authors. Licensee MDPI, Basel, Switzerland. This article is an open access article distributed under the terms and conditions of the Creative Commons Attribution (CC BY) license (http://creativecommons.org/licenses/by/4.0/).
Share and Cite
MDPI and ACS Style
Tian, L.; Rong, K.; Zhang, P.; Liu, Y. Vibration Control of a Power Transmission Tower with Pounding Tuned Mass Damper under Multi-Component Seismic Excitations. Appl. Sci. 2017, 7, 477. https://doi.org/10.3390/app7050477
AMA Style
Tian L, Rong K, Zhang P, Liu Y. Vibration Control of a Power Transmission Tower with Pounding Tuned Mass Damper under Multi-Component Seismic Excitations. Applied Sciences. 2017; 7(5):477. https://doi.org/10.3390/app7050477
Chicago/Turabian StyleTian, Li, Kunjie Rong, Peng Zhang, and Yuping Liu. 2017. "Vibration Control of a Power Transmission Tower with Pounding Tuned Mass Damper under Multi-Component Seismic Excitations" Applied Sciences 7, no. 5: 477. https://doi.org/10.3390/app7050477
Note that from the first issue of 2016, this journal uses article numbers instead of page numbers. See further details here.