Discrimination of Aortic and Pulmonary Components from the Second Heart Sound Using Respiratory Modulation and Measurement of Respiratory Split


1
Department of Biomedical Engineering, Dalian University of Technology, No. 2, Linggong Road, Ganjingzi District, Dalian 116024, China
2
College of Information and Communication Engineering, Dalian Minzu University, No. 18, Liaohe West Road, Jinzhou New District, Dalian 116600, China
*
Author to whom correspondence should be addressed.
Appl. Sci. 2017, 7(7), 690; https://doi.org/10.3390/app7070690
Submission received: 15 June 2017
/
Revised: 3 July 2017
/
Accepted: 3 July 2017
/
Published: 4 July 2017
(This article belongs to the Special Issue Smart Healthcare)
Abstract
:Featured Application
This work proposes a method to measure the respiratory split in a quantitative way. Based on the assumption model, the aortic component can be extracted by average and the pulmonary component can be estimated by subtracting. The calculation of the split is performed by timing difference of the two components. The method can track the respiratory split and has applications in monitoring heart response to respiration.
Abstract
The second heart sound consists of aortic and pulmonary components. Analysis on the changes of the second heart sound waveform in respiration shows that the aortic component has little variation and the delay of the pulmonary component is modulated by respiration. This paper proposes a novel model to discriminate the aortic and pulmonary components using respiratory modulation. It is found that the aortic component could be simply extracted by averaging the second heart sounds over respiratory phase, and the pulmonary component could be extracted by subtraction. Hence, the split is measured by the timing difference of the two components. To validate the measurement, the method is applied to simulated second heart sounds with known varying splits. The simulation results show that the aortic and pulmonary components can be successfully extracted and the measured splits are close to the predefined splits. The method is further evaluated by data collected from 12 healthy subjects. Experimental results show that the respiratory split can be accurately measured. The minimum split generally occurs at the end of expiration and the split value is about 20 ms. Meanwhile, the maximum split is about 50 ms at the end of inspiration. Both the trend of split varying with respect to respiratory phase and the numerical range of split varying are comparable to the results disclosed by previous physiologists. The proposed method is compared to the two previous well known methods. The most attractive advantage of the proposed method is much less complexity. This method has potential applications in monitoring heart hemodynamic response to respiration.
1. Introduction
Heart sounds are a series of mechanical vibrations produced by the interplay between heart chambers, valves, great vessels, and blood flow therein. Normal heart sounds in a cardiac cycle, in general, consist of the first heart sounds (S1) and the second heart sounds (S2). Previous studies [1,2] disclosed that the components of S1 followed the onset of the left ventricular pressure rise and closure of the mitral, tricuspid valve. Hence, S1 is considered as the sum of two components called mitral and tricuspid component. Meanwhile, S2 is considered as the sum of two components, called aortic and pulmonary component, which coincide with the closure of the aortic and pulmonary valve. Asynchronous closure of the aortic and pulmonary valves yields splitting of S2. The splitting has become widely recognized as a physiologic finding in both adults and children.
Studies about how to distinguish the aortic, pulmonary components and how to detect the splitting of S2 have progressed in recent years. The chirp model was introduced to represent the aortic and pulmonary component and to separate them [3]. The time-frequency representation (TFR) method was used to analyze S2 to get the split [4]. It can be implemented by Short Time Fourier Transform (STFT). Hence, it is referred as the STFT method in this paper. Considering S2 is a nonstationary signal, a Wigner-Ville distribution (WVD) was adopted to analyze heart sounds [5]. To solve the interference terms of the WVD, the smoothed pseudo-Wigner Ville distribution (SPWVD) was used to obtain a better time-frequency resolution [5]. The SPWVD was improved by a reassignment method which can rearrange the coefficients of the SPWVD around new zero to yield a high resolution of TFR [6]. Combining Hilbert vibration decomposition (HVD) and SPWVD, Barma et al. obtained quantitative measurement of the split [7,8,9,10]. It is referred to as the HVD method in the following. In the HVD method, an S2 signal is decomposed into several phase-fixed components and SPWVD operation is performed to each component to extract timing information.
The authors propose a novel method to measure respiratory split using ensemble information embedded in S2 collection. The aortic component could be simply extracted by averaging and the pulmonary component could be extracted by subtracting. The findings show that the respiratory split can be accurately monitored and the split variations reflect the physiological relation between respiration and heart hemodynamic response.
2. Materials and Methods
2.1. Physiology of Respiratory Split in S2
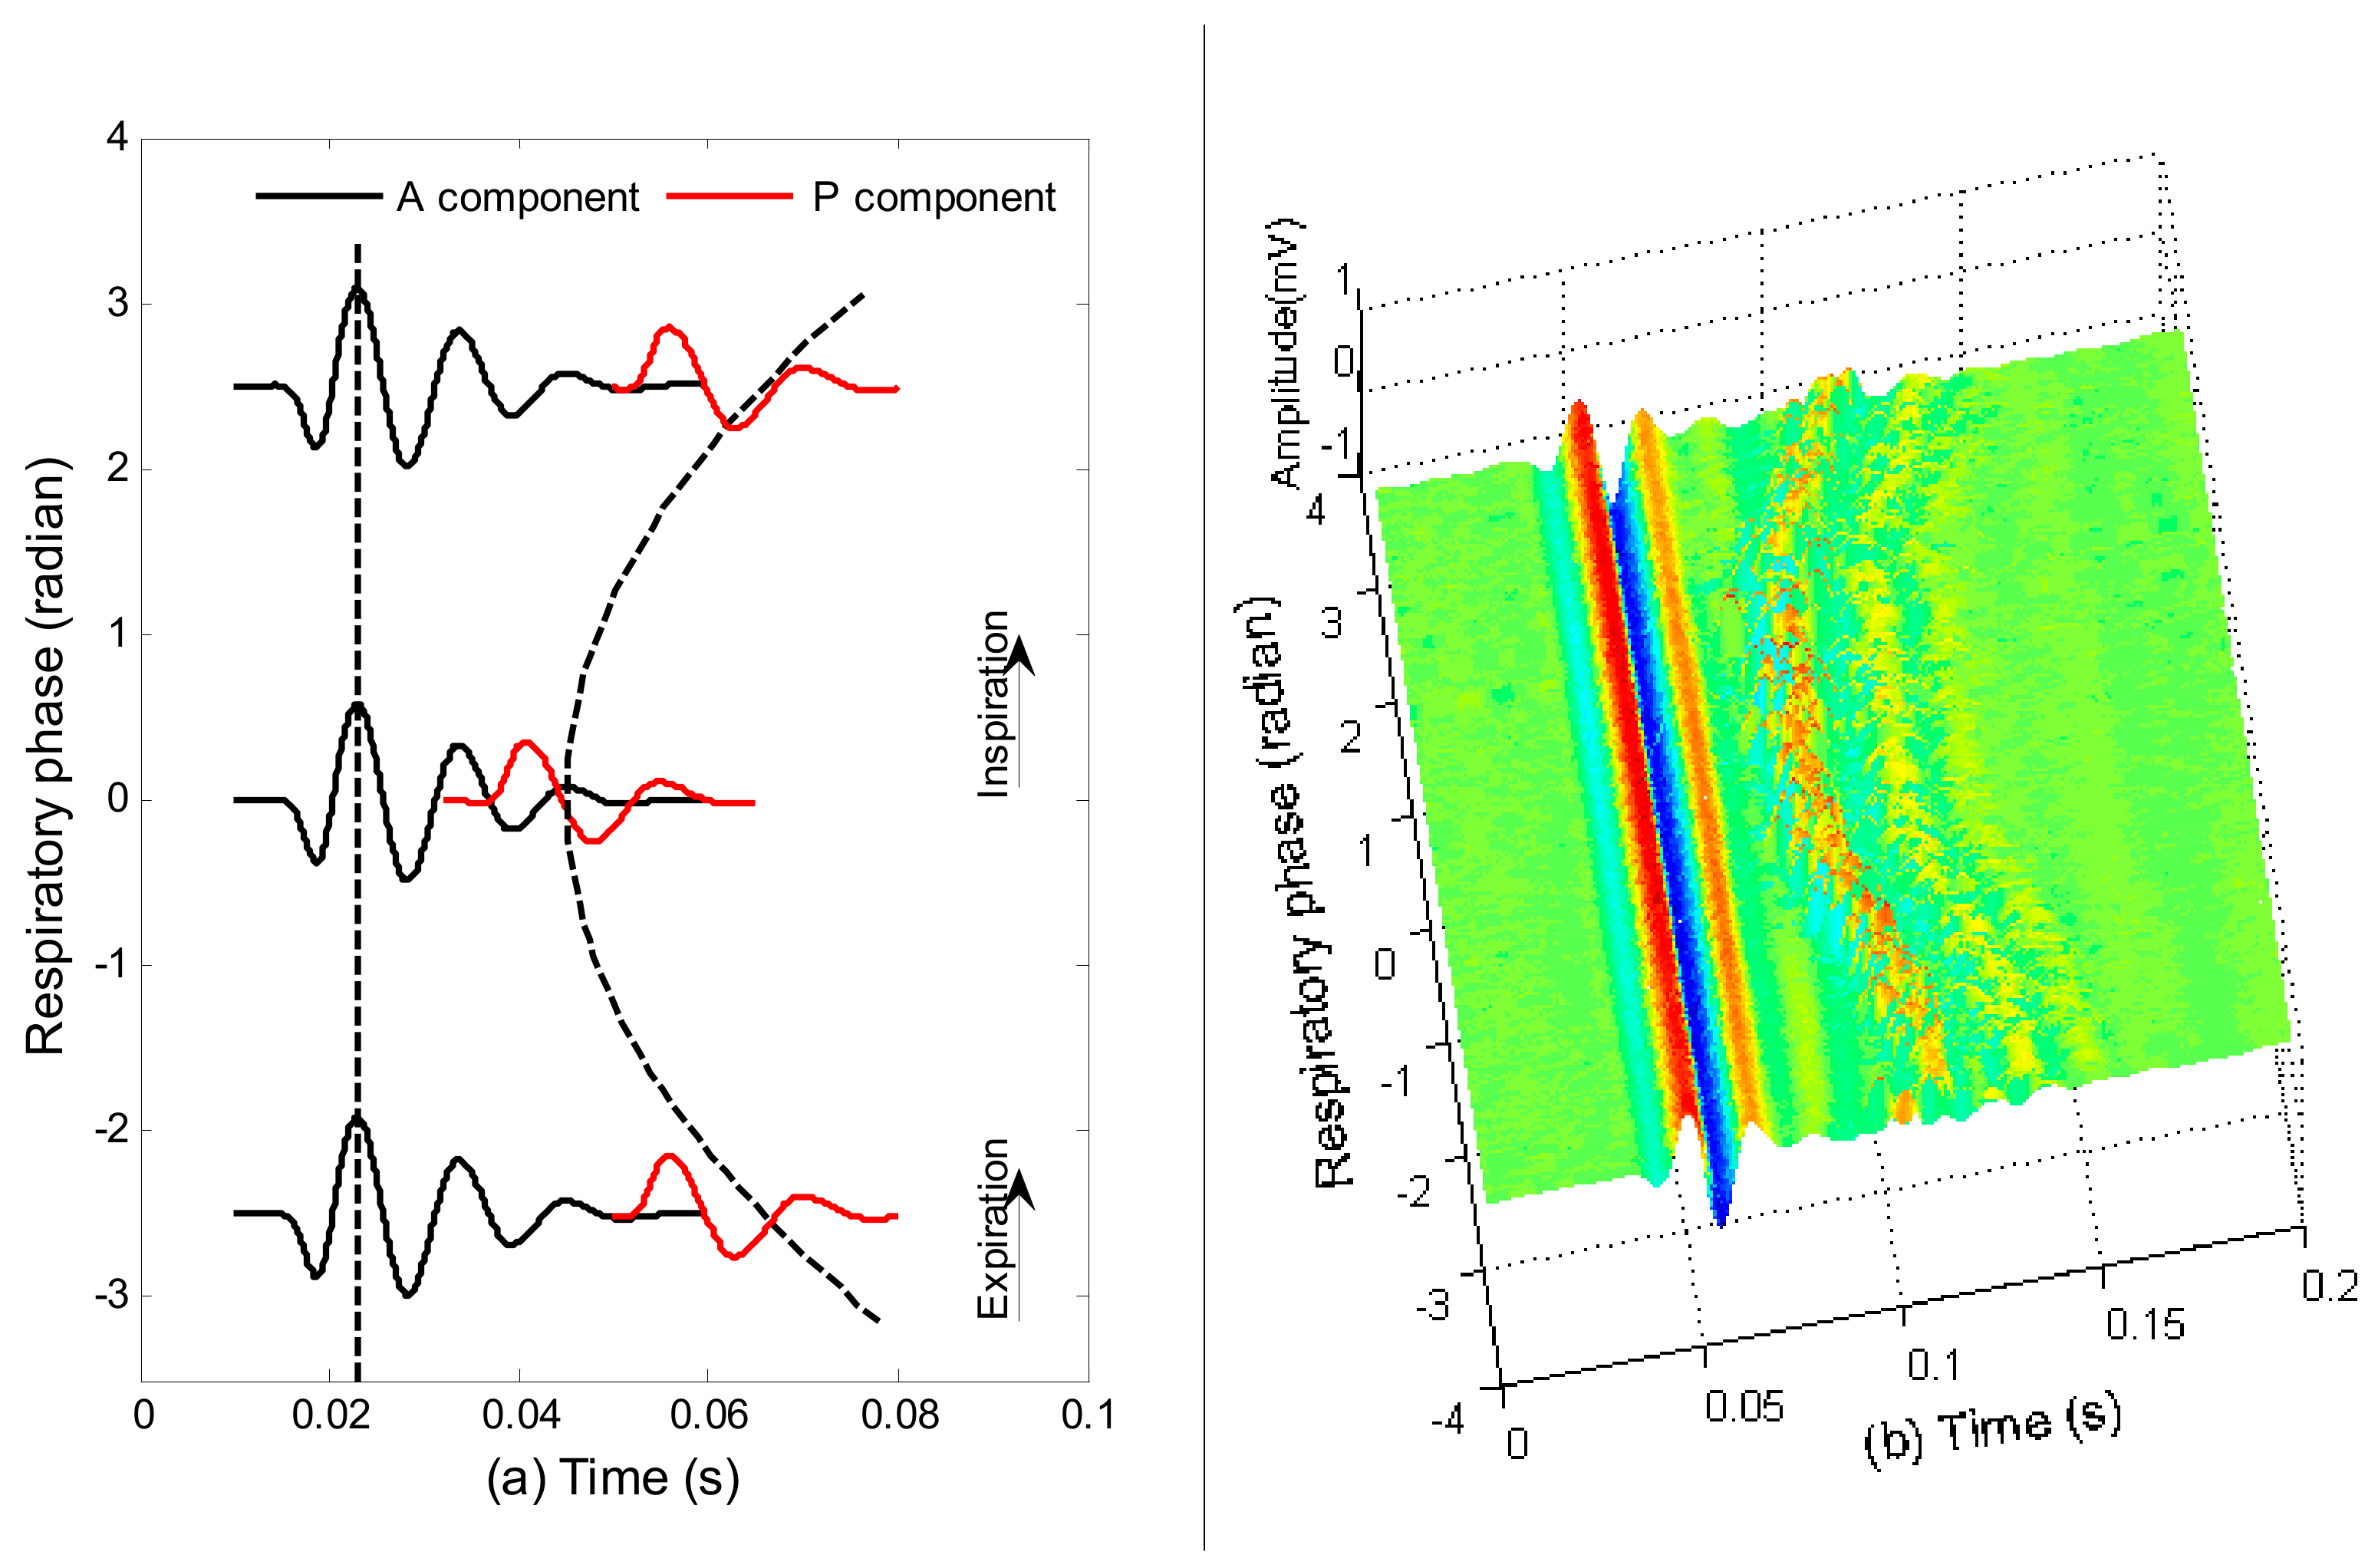
The usual explanation attributes the varying splitting to the changes of heart hemodynamics induced by respiration [11]. In inspiration, the extension of the pleura and thorax increases the volume of the thoracic cavity and lowers the pressure inside. Hence, the pressure gradient from the extra-thoracic regions to the right atrium increases, as illustrated in Figure 1. This increased gradient leads to increased blood filling of the right ventricle (RV). The increased RV end-diastolic volume (EDV) leads to an increased RV stroke volume (SV) via the Frank-Starling mechanism. The dilated RV causes the left ventricle (LV) to become less compliant by physical compression. The interventricular septum thus moves leftward, which results in reduced LV filling. Simultaneously, the distending lungs and their circulatory volume tend to reduce the pressure gradient and flow from the pulmonary veins to the LV, and the transmural diastolic aortic pressure, which is called the LV afterload, increases. These additive effects induced by respiration result in decreased LV-SV. Due to the effect of hemodynamic changes in inspiration, the aortic valve closes early and the pulmonary valve closes delay. Therefore, the splitting between the two components increases. The opposing process occurs during expiration in which RV-EDV and RV-SV decrease, while LV-EDV and LV-SV increase. So, the two components are closer, or even fused in expiration. With the opposite changes of heart hemodynamics in inspiration and expiration, the characteristics of respiratory variation in splitting is illustrated in Figure 2a. The morphology changes of heart sounds due to respiration have been investigated in recent years [12,13,14,15]. One real example of these variations of a healthy subject is shown in Figure 2b, where the S2s are sorted by respiratory phase. The aortic components are aligned in time domain to facilitate observation of the split. The respiratory variation is clearly observed.
In view point of physiology, the split in S2 reflects the effect of respiration to heart hemodynamics. So, it is important to measure the split quantitatively for monitoring hemodynamic response to respiration. This paper proposes a method to measure the respiratory split of S2. The findings show that the respiratory split variations can be accurately monitored and the variations of the split reflect the physiological relation between respiration and heart hemodynamic response.
2.2. Data Collection
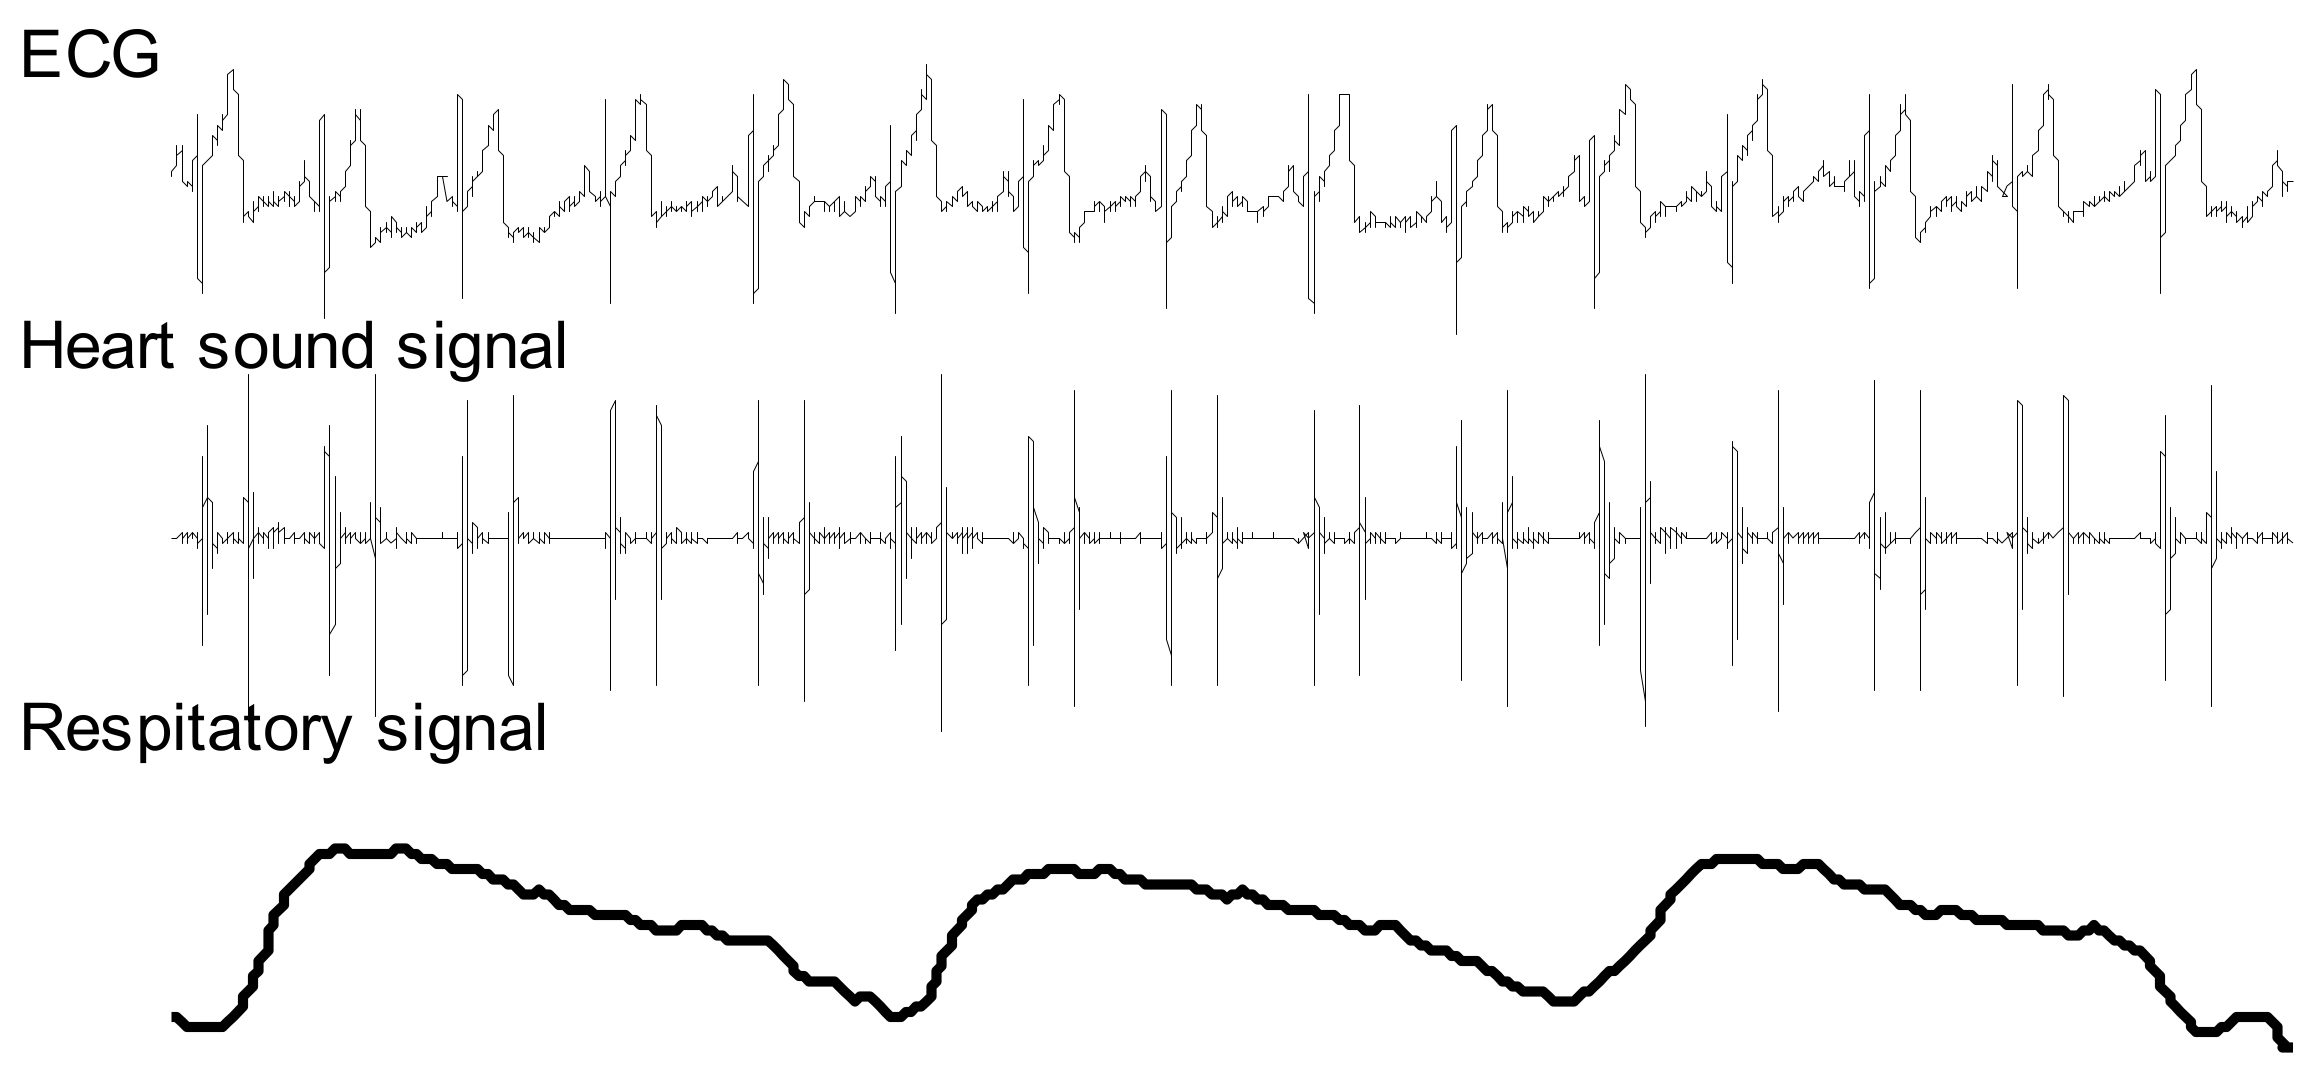
Twelve young male subjects aged 24 ± 1.8 years participated in the experiments. All subjects provided their consents to participate in the experiments. They were asked to remain at rest for 10 min before data collection. Each subject was asked to lie on his back in a bed during data collection. Heart sounds, ECG lead II, and respiratory signals were simultaneously recorded at a sampling frequency of 2 kHz (PowerLab 8/35, ADinstrument, New South Wales, Australia). A heart sound microphone sensor (MLT201, ADinstrument, Australia) was placed at the left third intercostal space. The breathing transducer (MLT1132, ADinstrument, New South Wales, Australia) was a belt sensor positioned at the boundary of the thorax and abdomen to record respiratory movement. The time length of each data recording is 150–180 s. The number of cardiac cycles involved in this work of each subject is illustrated in Table 1. One portion of a recording is shown in Figure 3.
2.3. System Overview
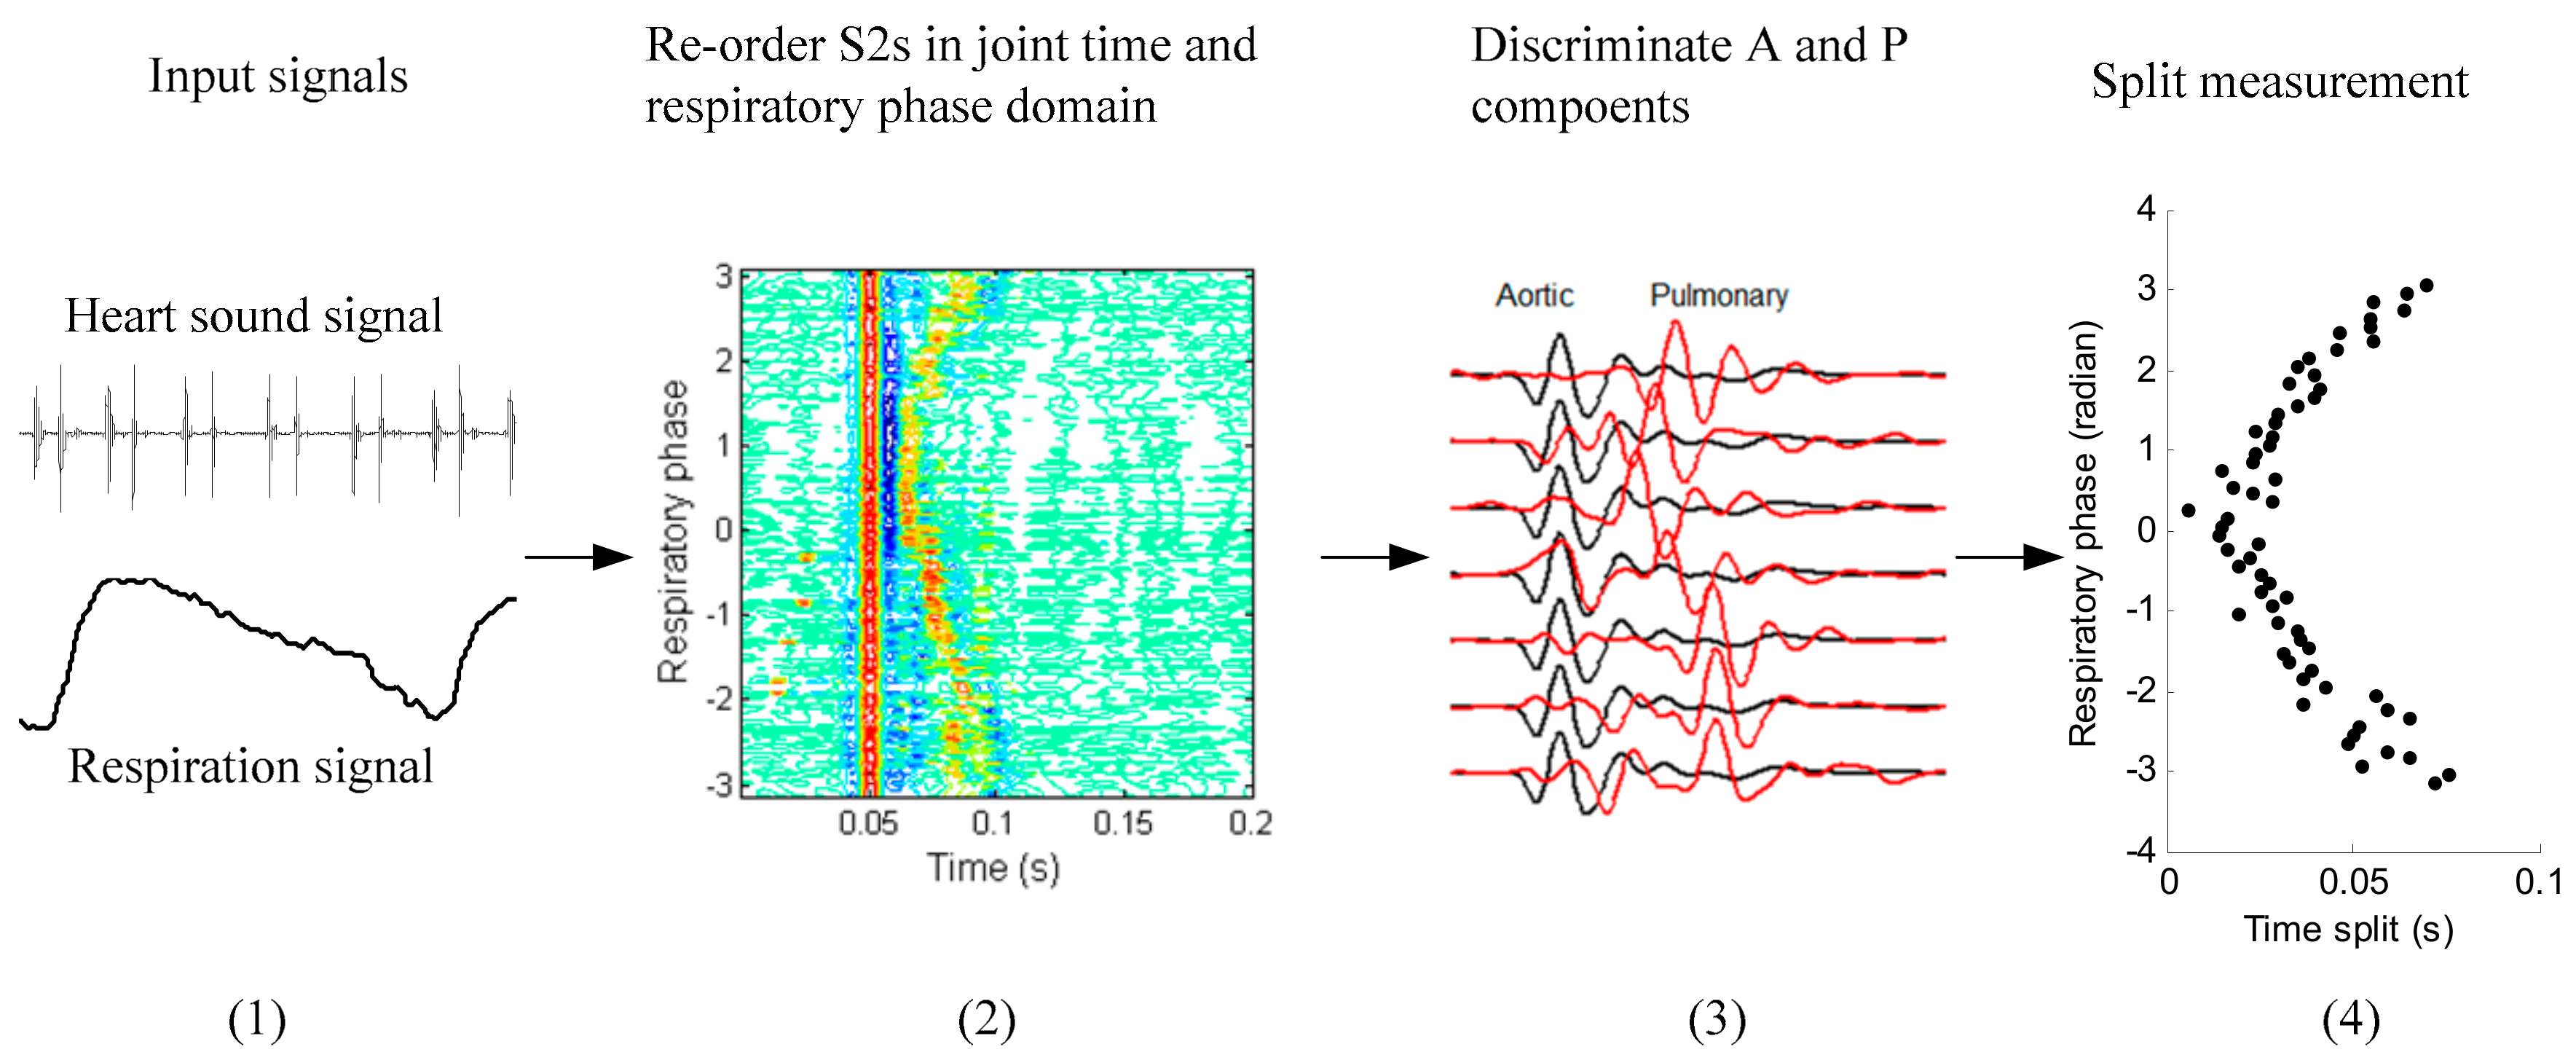
The overview of the system workflow is illustrated in Figure 4. First, the heart sound signal and synchronous respiratory signal are bandpass filtered with zero-phase delay in the frequency band 5–200 Hz and 0.05–1 Hz, respectively. Second, all S2s from the heart sound signal were segmented and re-ordered in joint time and respiratory phase domain. Third, aortic and pulmonary components were discriminated. Fourth, the splits were measured by weighted timing.
2.4. Respiratory Phase
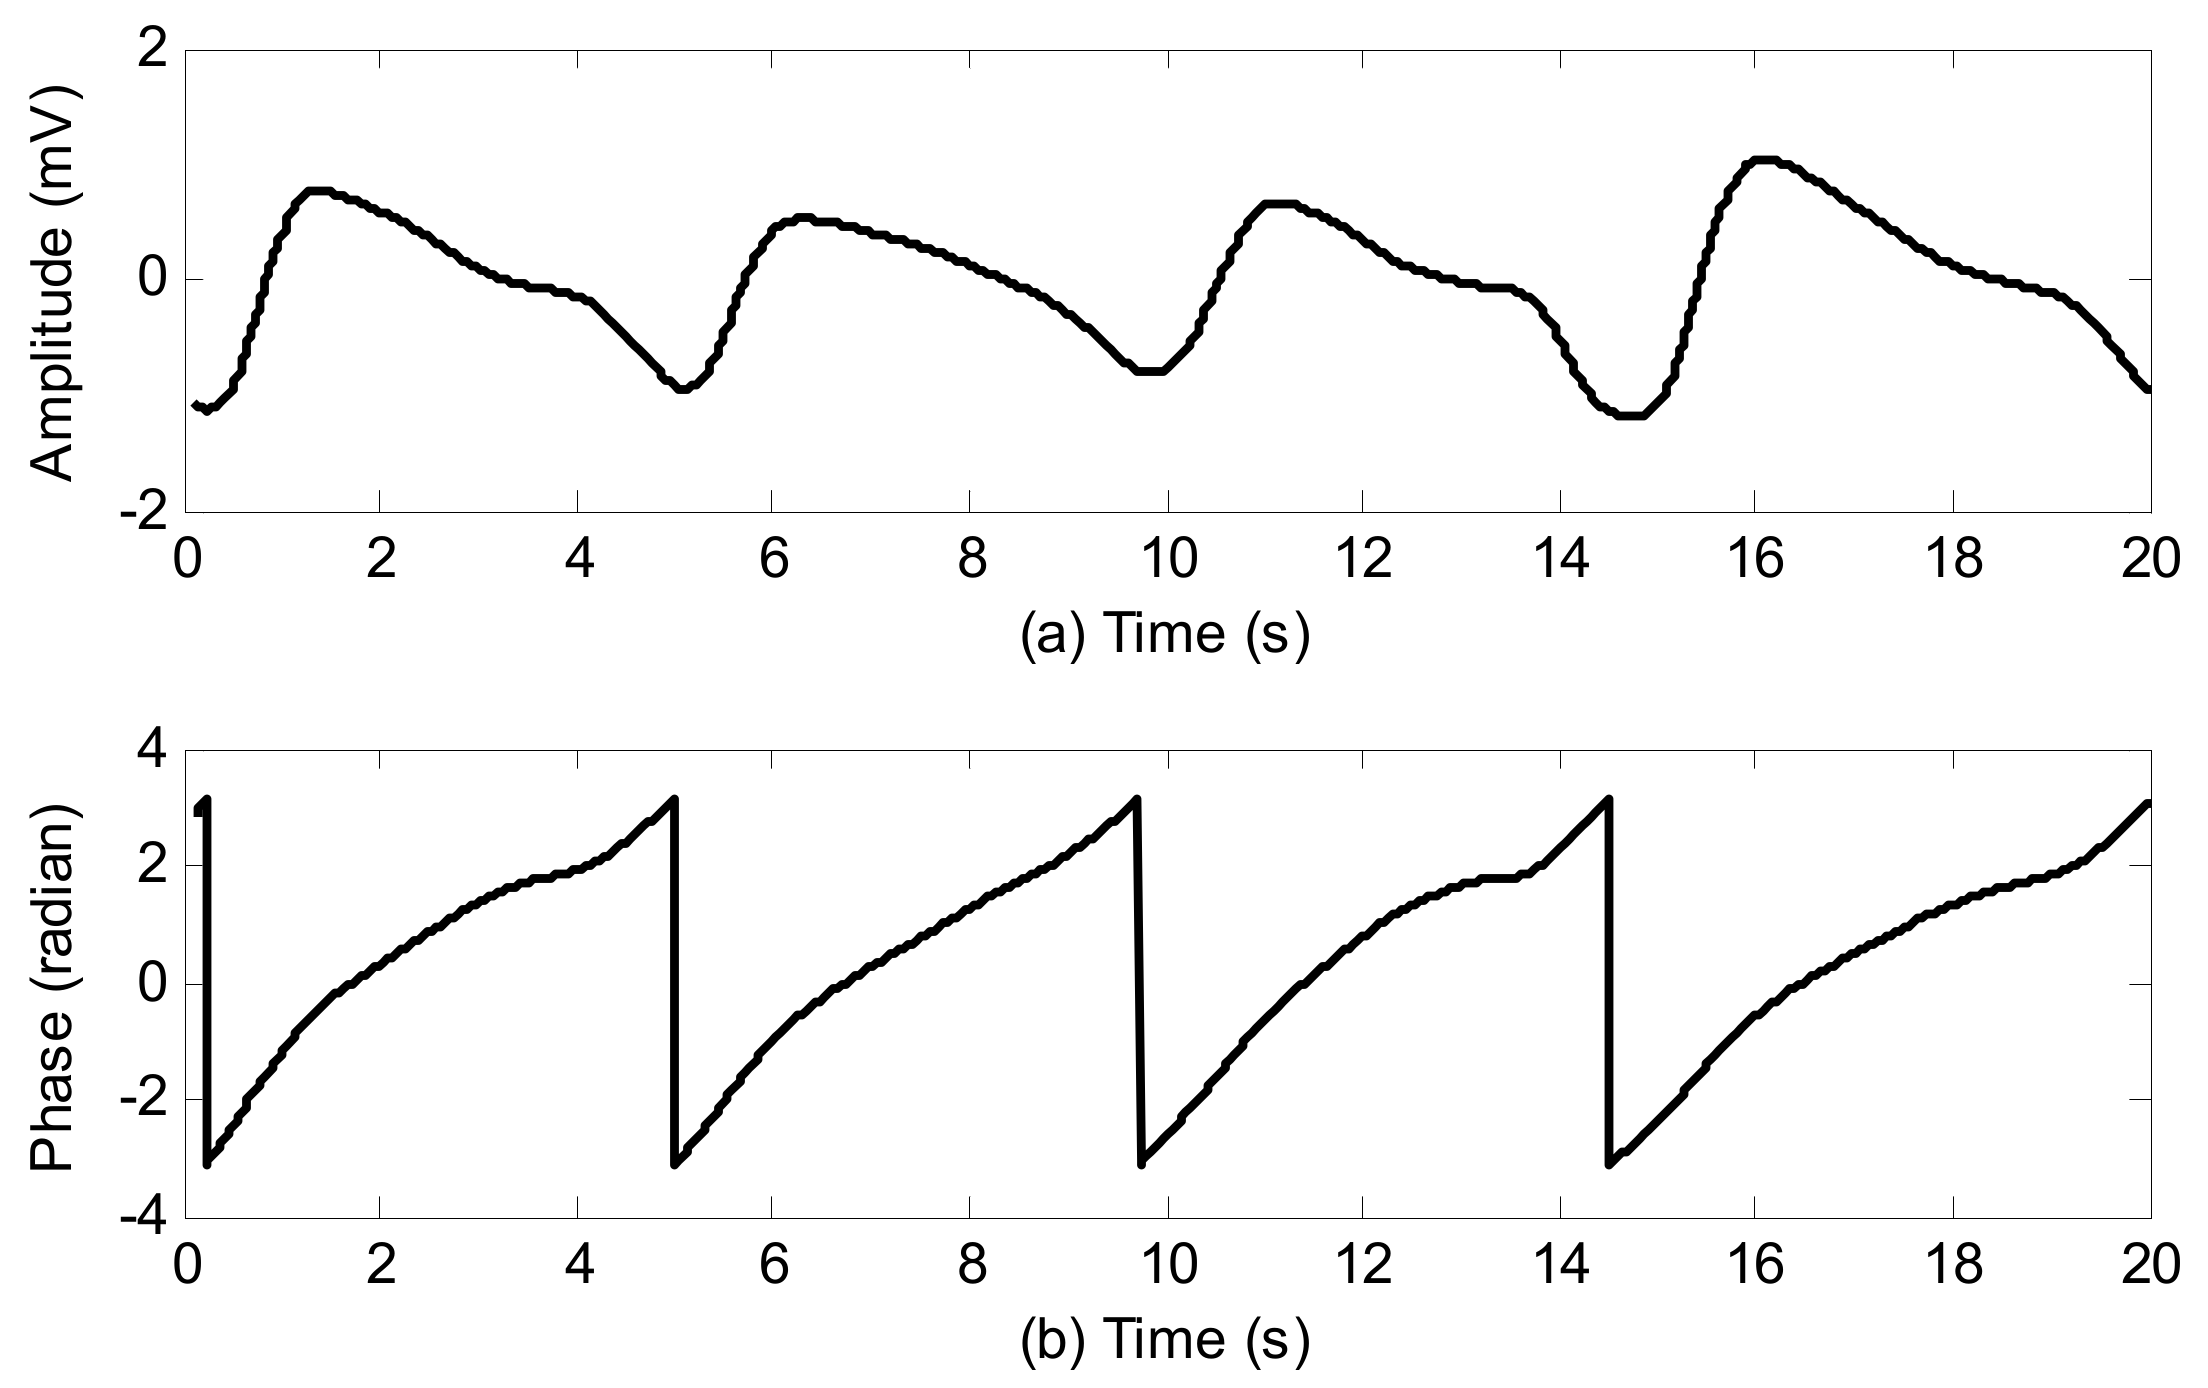
The respiratory phase signal is extracted from the respiratory signal, i.e., the respiratory signal is mapped to respiratory phase from to . Expiration begins at and ends at zero, meanwhile inspiration begins at zero and ends at . To achieve this, the respiratory signal and its Hilbert transform form (the real part and imaginary part of an analytic signal) were used. The respiratory phase is then obtained by the phase of the analytic signal. It is assumed that is a respiratory signal and is its Hilbert transform. The respiratory phase signal is presented as
where arctan2() is the operator of the four quadrant arctangent. An example of calculating respiratory phase is illustrated in Figure 5.
2.5. Investigation on S2 Waveform Changing Modulated by Respiration
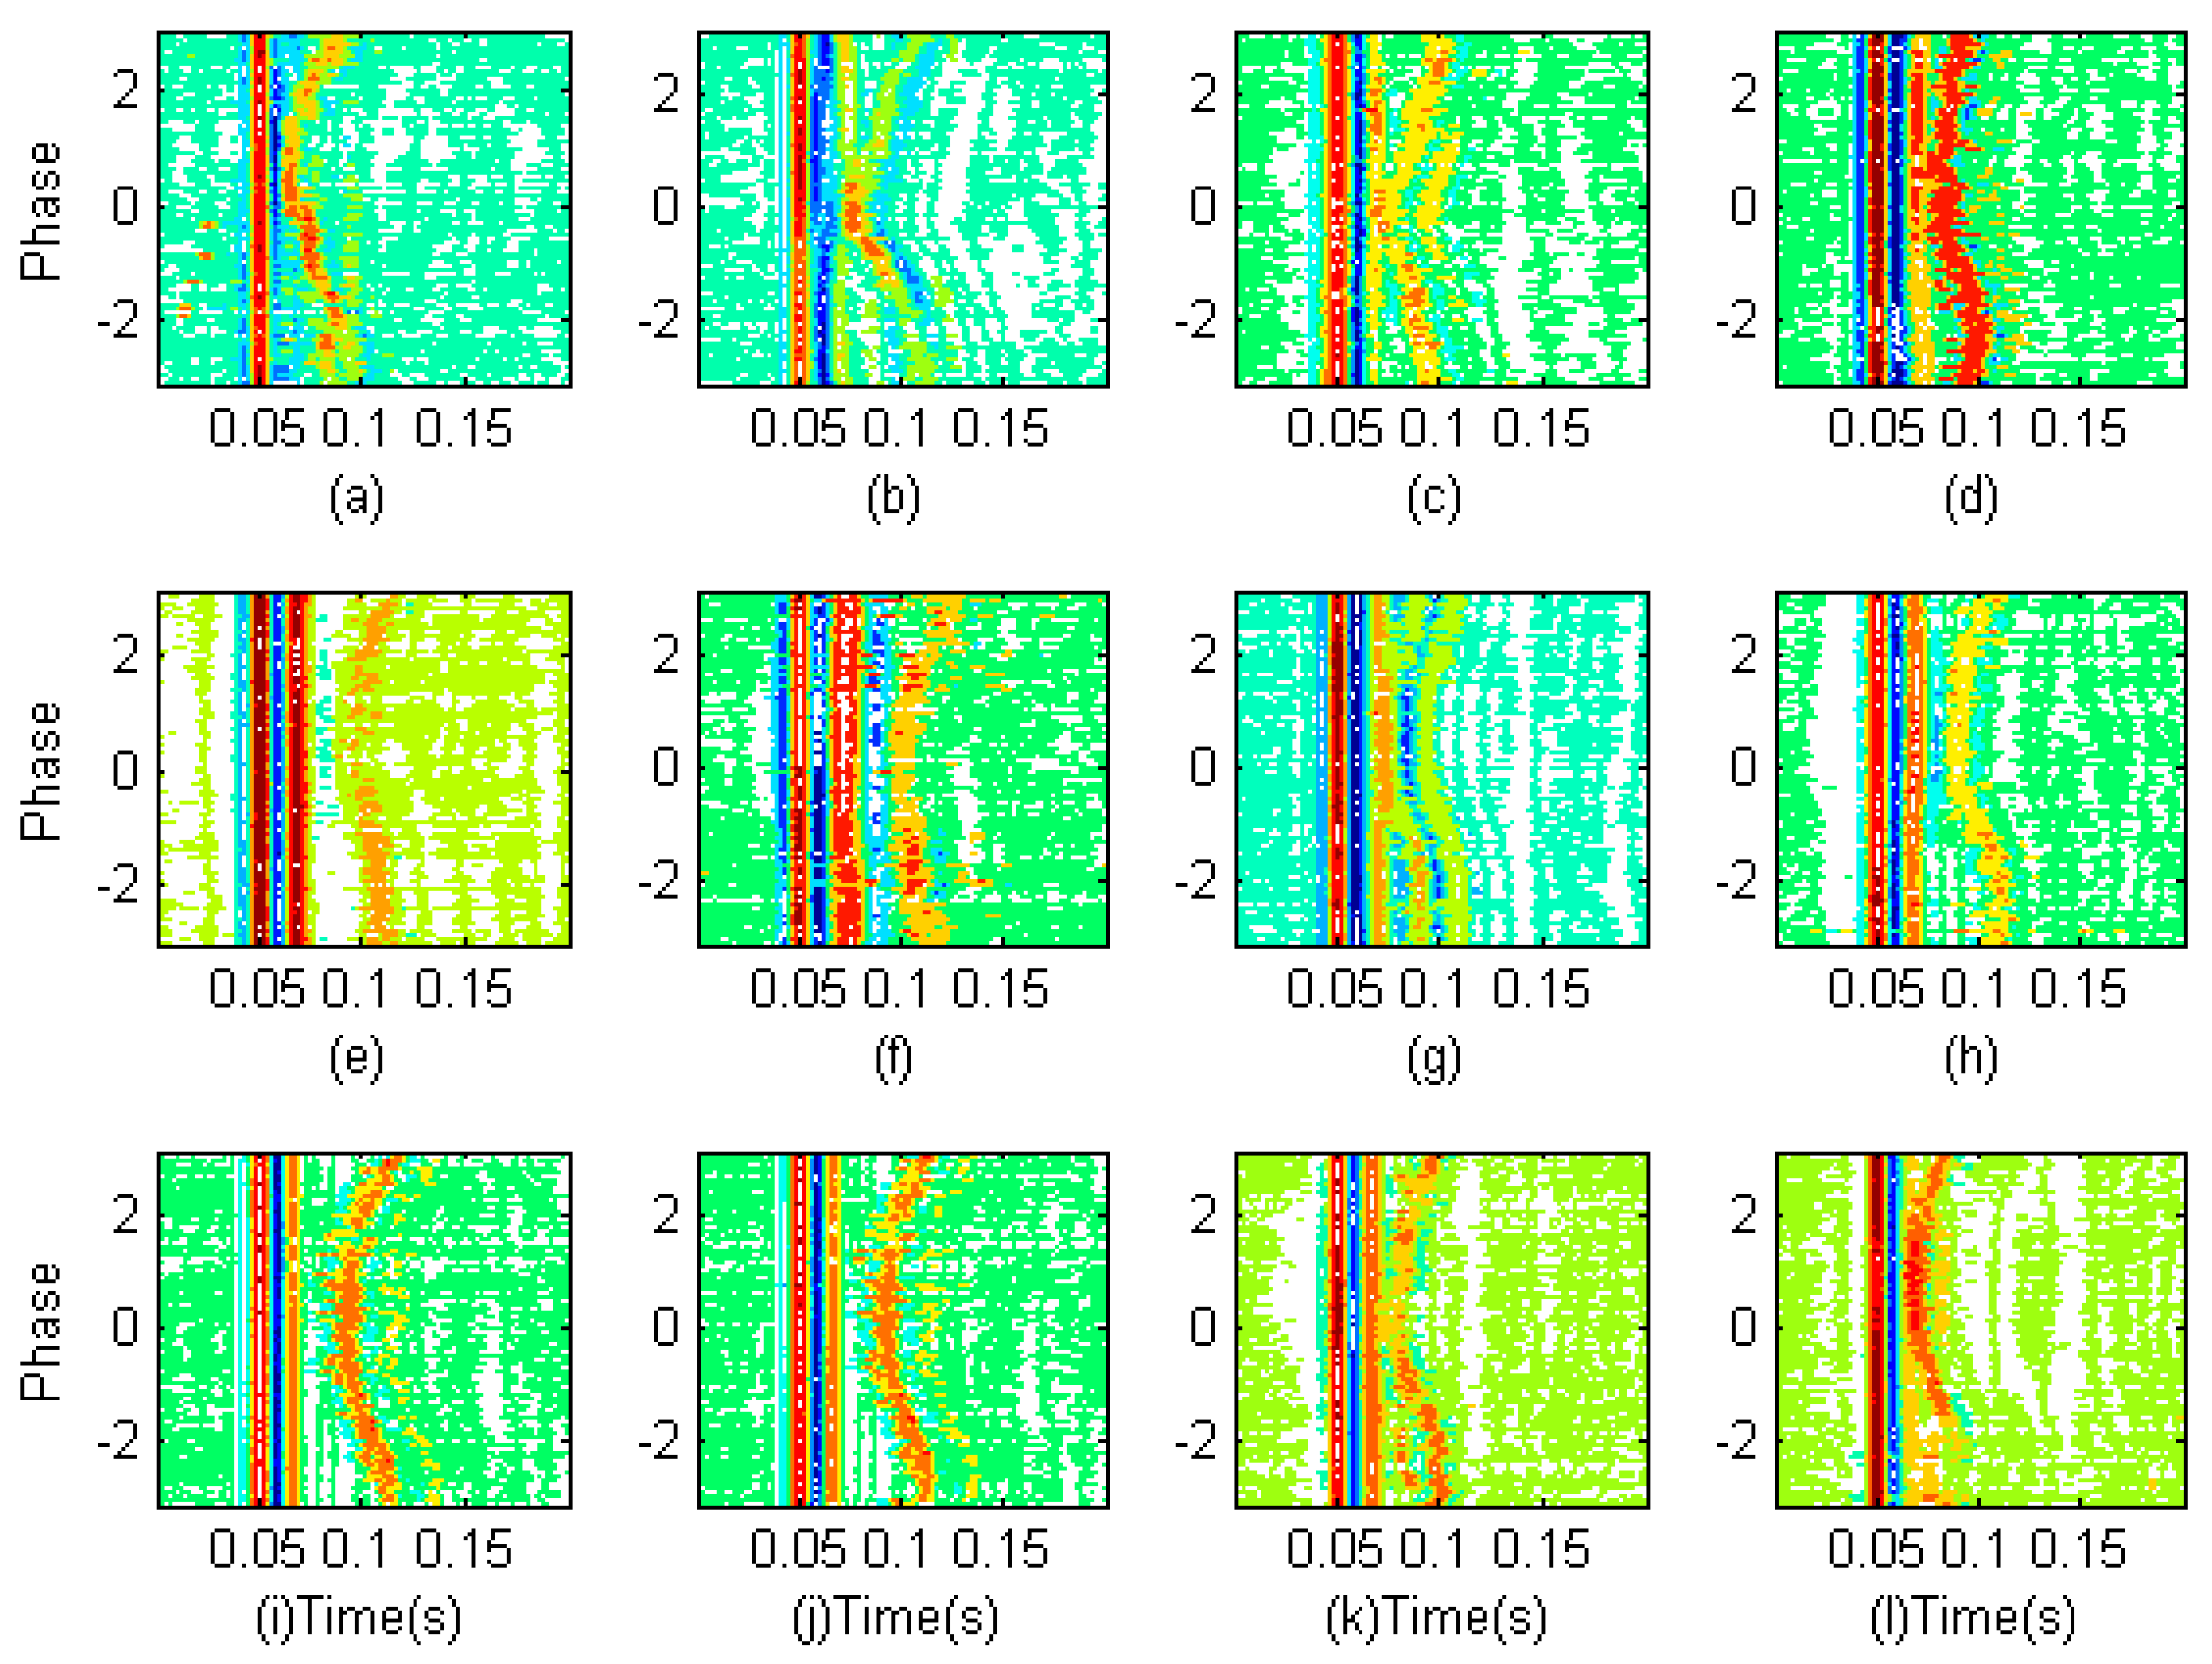
To observe the changing visually, S2s are firstly segmented from the heart sound signal using the envelope method proposed by Liang et al. [16]. The respiratory phases associated to the S2s are looked up from the respiratory phase signal with the reference of the S2s’ timing. The S2s are re-ordered according to respiratory phase in ascending order. Then, the S2s are aligned in time domain and formed into a two dimensional matrix. The horizontal direction is in the time domain and the vertical direction is in the respiratory phase domain. These matrixes enable the changing to be observed clearly. This preprocessing is repeated for the twelve subjects and the contour plots of these matrixes are shown in Figure 6. A common phenomenon can be seen in that the S2s of each subject have two parts. The first parts are aligned in time domain, whose waveforms have almost no change; however the timing of the second parts varied with respect to respiratory phase. That is to say, the splits between the two parts are modulated by the respiratory phase. The split decreases in expiration where the phase is from to zero and the split increases in inspiration where the phase is from zero to . The authors believe that the first parts are the aortic components and the second parts are the pulmonary components.
2.6. Discrimination of Aortic and Pulmonary Component
Model Assumption: It is assumed that the S2 is the sum of aortic and pulmonary components with the following model
where is the aortic component, and is the pulmonary component at the respiratory phase . is the time delay modulated by respiration. is random noise at the respiratory phase to contaminate the second heart sound. The purpose of this article is to measure the respiratory split, . In detail, we have further assumptions based on the mentioned observation above.
- (1)
- is assumed to have a fixed waveform over the respiratory phase, as can been seen in Figure 6.
- (2)
- is the time shifted version of . It is a delayed pulmonary component caused by respiration.
- (3)
- is assumed to be zero mean both over time and over respiratory phase, i.e., and . It may be colored, non-Gaussian and non-stationary.
An average operation over respiratory phase is implemented on Equation (1)
where is the number of S2s involved in operation. Based on the assumption that is zero mean, the average below produces a zero vector.
Therefore, Equation (2) becomes
The average operation to the time shifted pulmonary components smooths the peaks and valleys. So, the average yields a small signal. To show the average operation clearly, an example is given in Figure 7. The S2 signals (blue lines) are over plotted. The solid bold red line is the averaged signal. It can be seen that the average of the time shifted pulmonary components produces so small a signal that it can be neglected considering the objective of this paper. Therefore, the second part in the right side of Equation (4) becomes
The estimated aortic component could be obtained by
It means that the aortic component is discriminated by the ensemble average of S2s over respiratory phase. Furthermore, considering Equation (1), the pulmonary component could be discriminated by subtracting the aortic component from the S2s,
For example, the separated components for the S2s of subject No. 4 are shown in Figure 8. It is clearly observed that the aortic components have no change, see Figure 8b. However, the estimated pulmonary components in Figure 8c have varying delay over respiratory phase. The varying delay will be estimated in the next subsection.
2.7. Estimation of Time Indices
The timings of the estimated aortic and pulmonary component are extracted from the envelope peak position. It is operated in the following. Firstly, get the upper envelope of the absolute aortic component using the local maxima with the help of cubic spline interpolation. The way to calculate the upper envelope is like extracting the upper envelope in empirical mode decomposition (EMD) [17].
Then, the local peaks’ amplitude and associated peaks’ location of the powered envelope are searched
where is empirically set as 8. The function of this power operation is to make the dominant peaks protruding. is a vector consisting of peak amplitude, is a vector consisting of peak position, and is the number of peaks. So, the timing of the aortic component, , is defined as weighted peak position
where the weight coefficient is determined by
Similarly, get the upper envelope of the absolute pulmonary component using the local maxima with the help of cubic spline interpolation
The peaks of the estimated pulmonary component can be determined by
where is empirically set as 8. is a vector consisting of peak amplitude, is a vector consisting of peak position, and is the number of peaks. So, the timing of the pulmonary component, is defined as weighted peak positon
where the weight coefficient is calculated by
The split between the aortic and pulmonary component is then estimated by the timing difference
Here is an example in Figure 9. An S2 signal is shown in Figure 9a. In Figure 9b, the blue line is the estimated aortic component and the red line is the estimated pulmonary component. The powered envelopes of the two components are given in Figure 9c. The peaks are indicated by blue stars and red squares. The associated weighted timings are shown by a black bold star and a black bold square. Hence, the split is measured by the timing difference. This processing is repeated for each S2 signal. Then, the varying split modulated by respiratory phase is obtained.
2.8. Steps to Implement the Method
- (1)
- Heart sound signal, respiratory signal and lead-II ECG signal are synchronously collected from a subject.
- (2)
- Extracted respiratory phase from the respiratory signal as given in Section 2.4.
- (3)
- Segmented all S2s from the heart sound signal and looked up the associated respiratory phase for each S2.
- (4)
- The S2s are re-ordered with respiratory phase in ascending order in joint time and respiratory phase domain.
- (5)
- The S2s are re-aligned in time domain.
- (6)
- Estimated the aortic component by average operation as shown in Section 2.6.
- (7)
- Estimated the pulmonary components by subtracting.
- (8)
- Estimated the split by weighted peak positions as given in Section 2.7.
3. Experiments and Discussions
3.1. Computer Simulation
To validate the proposed method, we use simulated second heart sound signals with well-defined split. According to the model proposed by Xu et al. [3], the aortic component and pulmonary component are modeled as narrow-band chirp signals, i.e.,
where and are the amplitudes of A2 and P2, and are the phases. An S2 signal is simulated as
where is the split. To simulate varying split, it assumes that there are six hundred S2s and the splits of the S2s change in adjacent cardiac cycles from 25 ms to 80 ms like a sine wave. Then, the proposed method, the HVD method [7] and the STFT method [4] are used to detect the split variations. The simulated S2s are shown in Figure 10a. The extracted aortic and pulmonary components are shown in Figure 10b,c. The measured varying splits are illustrated in Figure 10d. A visual check shows that all the measured splits by the three methods are close to the true splits. However, in quantity, the root mean square errors of the proposed, HVD, STFT are 0.98 ms, 0.84 ms, and 1.1 ms, respectively. This computer simulation proves that the proposed method works as the authors expected.
3.2. Measure Respiratory Variations for Human Subjects by the Proposed Method
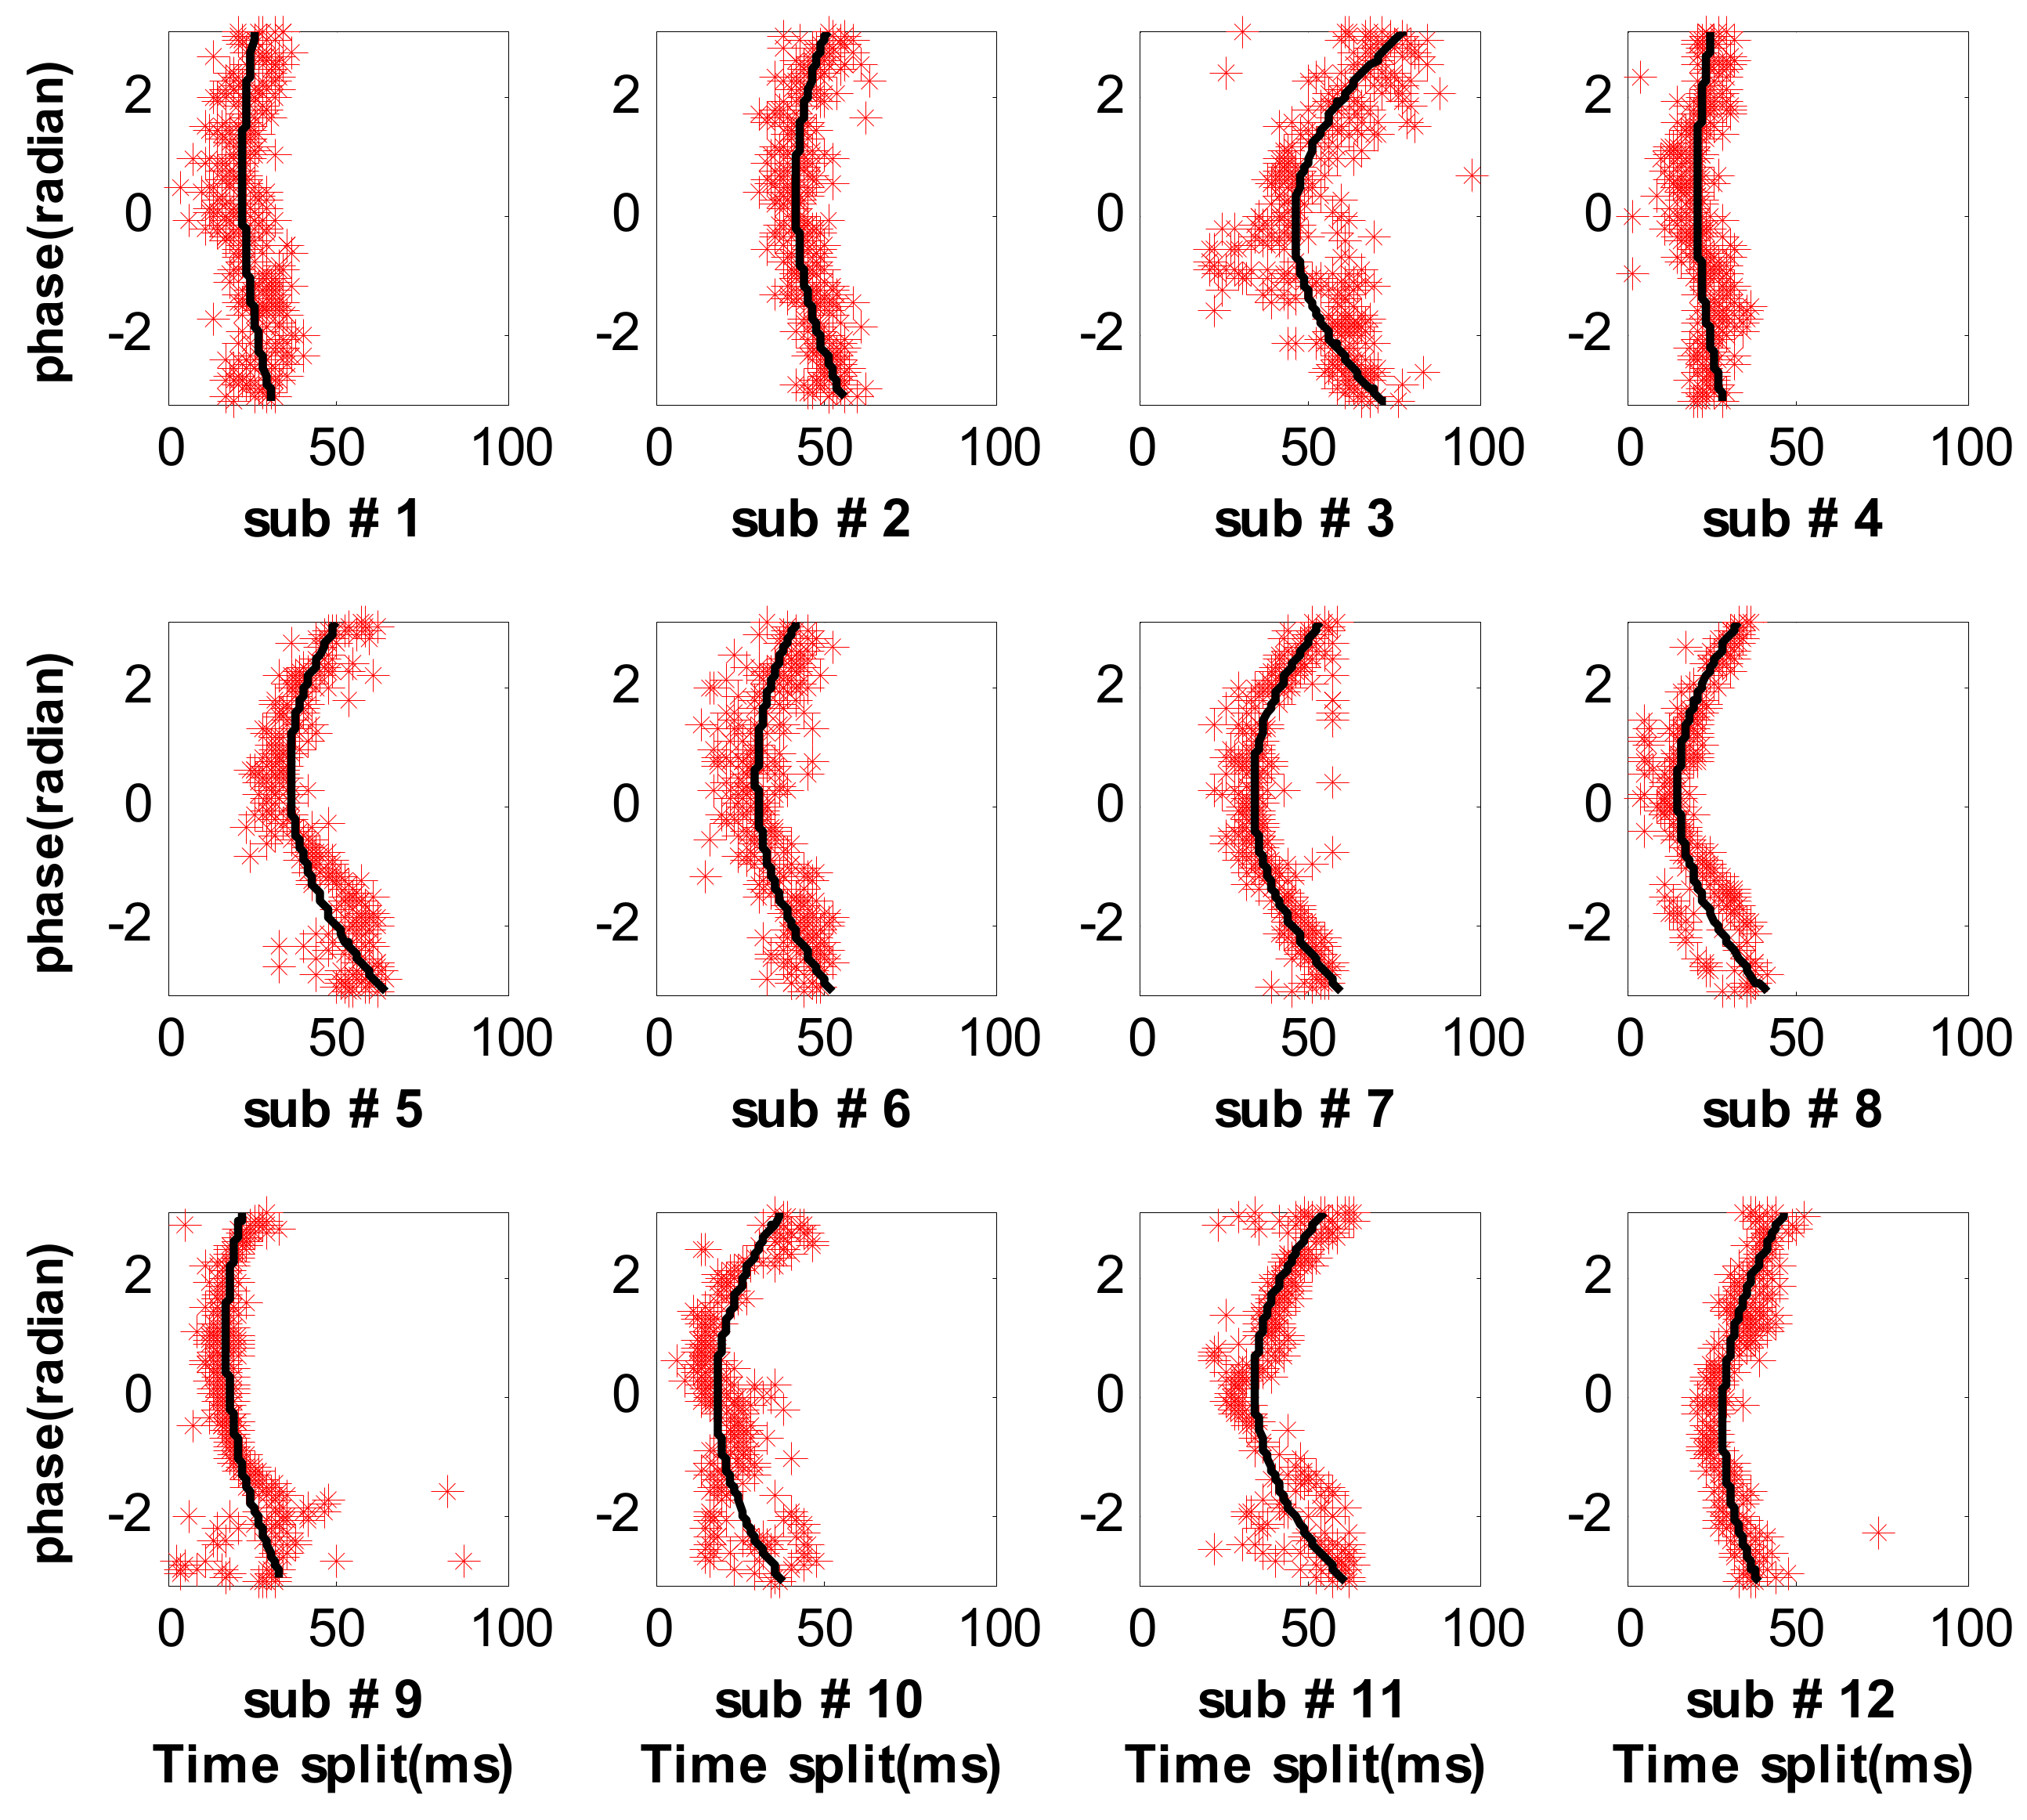
The authors have collected data from 12 subjects and their respiratory splits are shown in Figure 11. Each recording has 3 min to 5 min consisting of several hundred cardiac cycles. A pair of respiratory phase and split can be obtained from each cardiac cycle based on the proposed method, which can be represented by a red star in the joined domain. Hence, the respiratory variations in splitting of the second heart sound can be clearly illustrated by the stars, where the measured splits are re-sorted in respiratory phase in ascending order, seen in Figure 11. We can see that the split gradually increases with the phase increasing from 0 to π (inspiration) or decreases with the phase from −π to 0 (expiration). The minimum split generally occurs at phase zero and the split value is about 20 ms. Meanwhile, the maximum split is about 50 ms at phase π or −π. These values are comparable to the physiological results [11]. The experimental results imply that the proposed method is reasonable to monitor the respiratory variations in the split of the second heart sound. The authors wish to declare that each step of the proposed method can run automatically without any human intervention.
3.3. Measure Respiratory Variations for Human Subjects by the Previous Methods
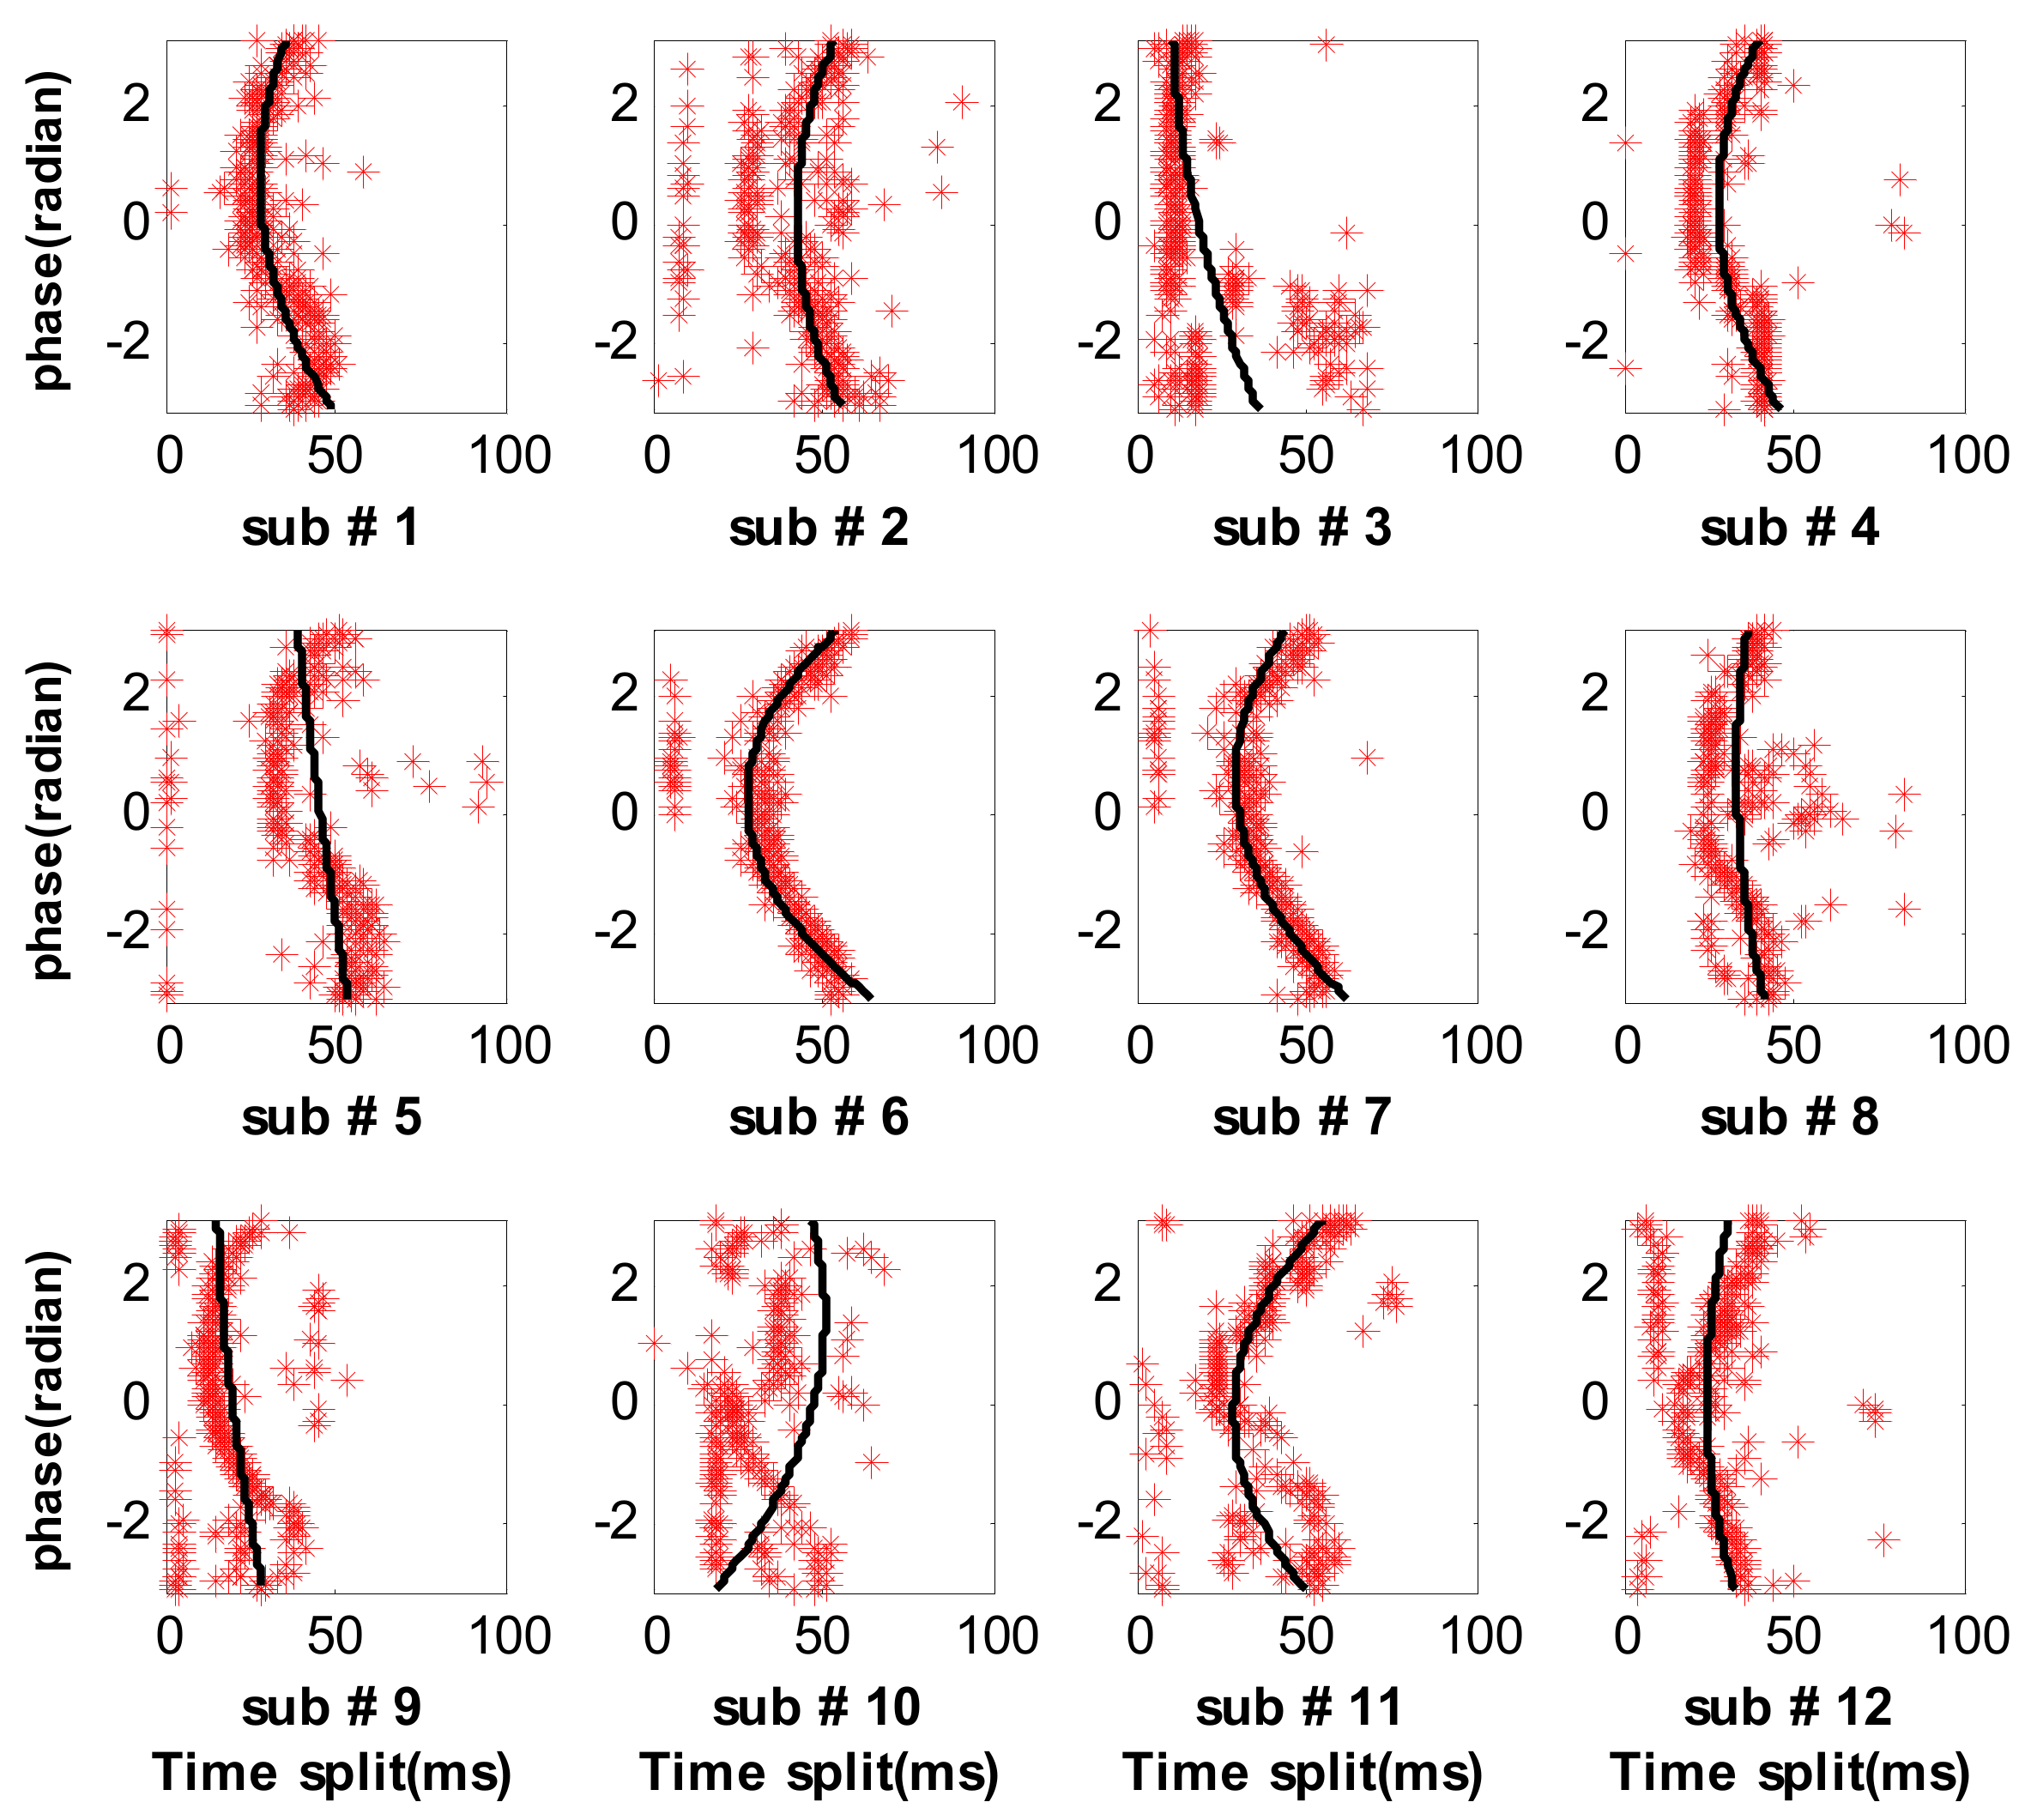
The respiratory splits estimated by the HVD method and the STFT method are shown in Figure 12 and Figure 13, respectively. It can be found that the respiratory splits of all subjects estimated by the HVD method can reflect respiratory modulation. However, the respiratory splits of subject 2, 5 and 10 by the STFT method are somewhat widely disperse, as seen in Figure 13. It concludes that the STFT method is less robust than the HVD method. To evaluate the performance of the proposed method and the two previous methods quantitatively, the scatters are fitted by a second-order polynomial, as seen the black solid lines in Figure 11, Figure 12 and Figure 13.
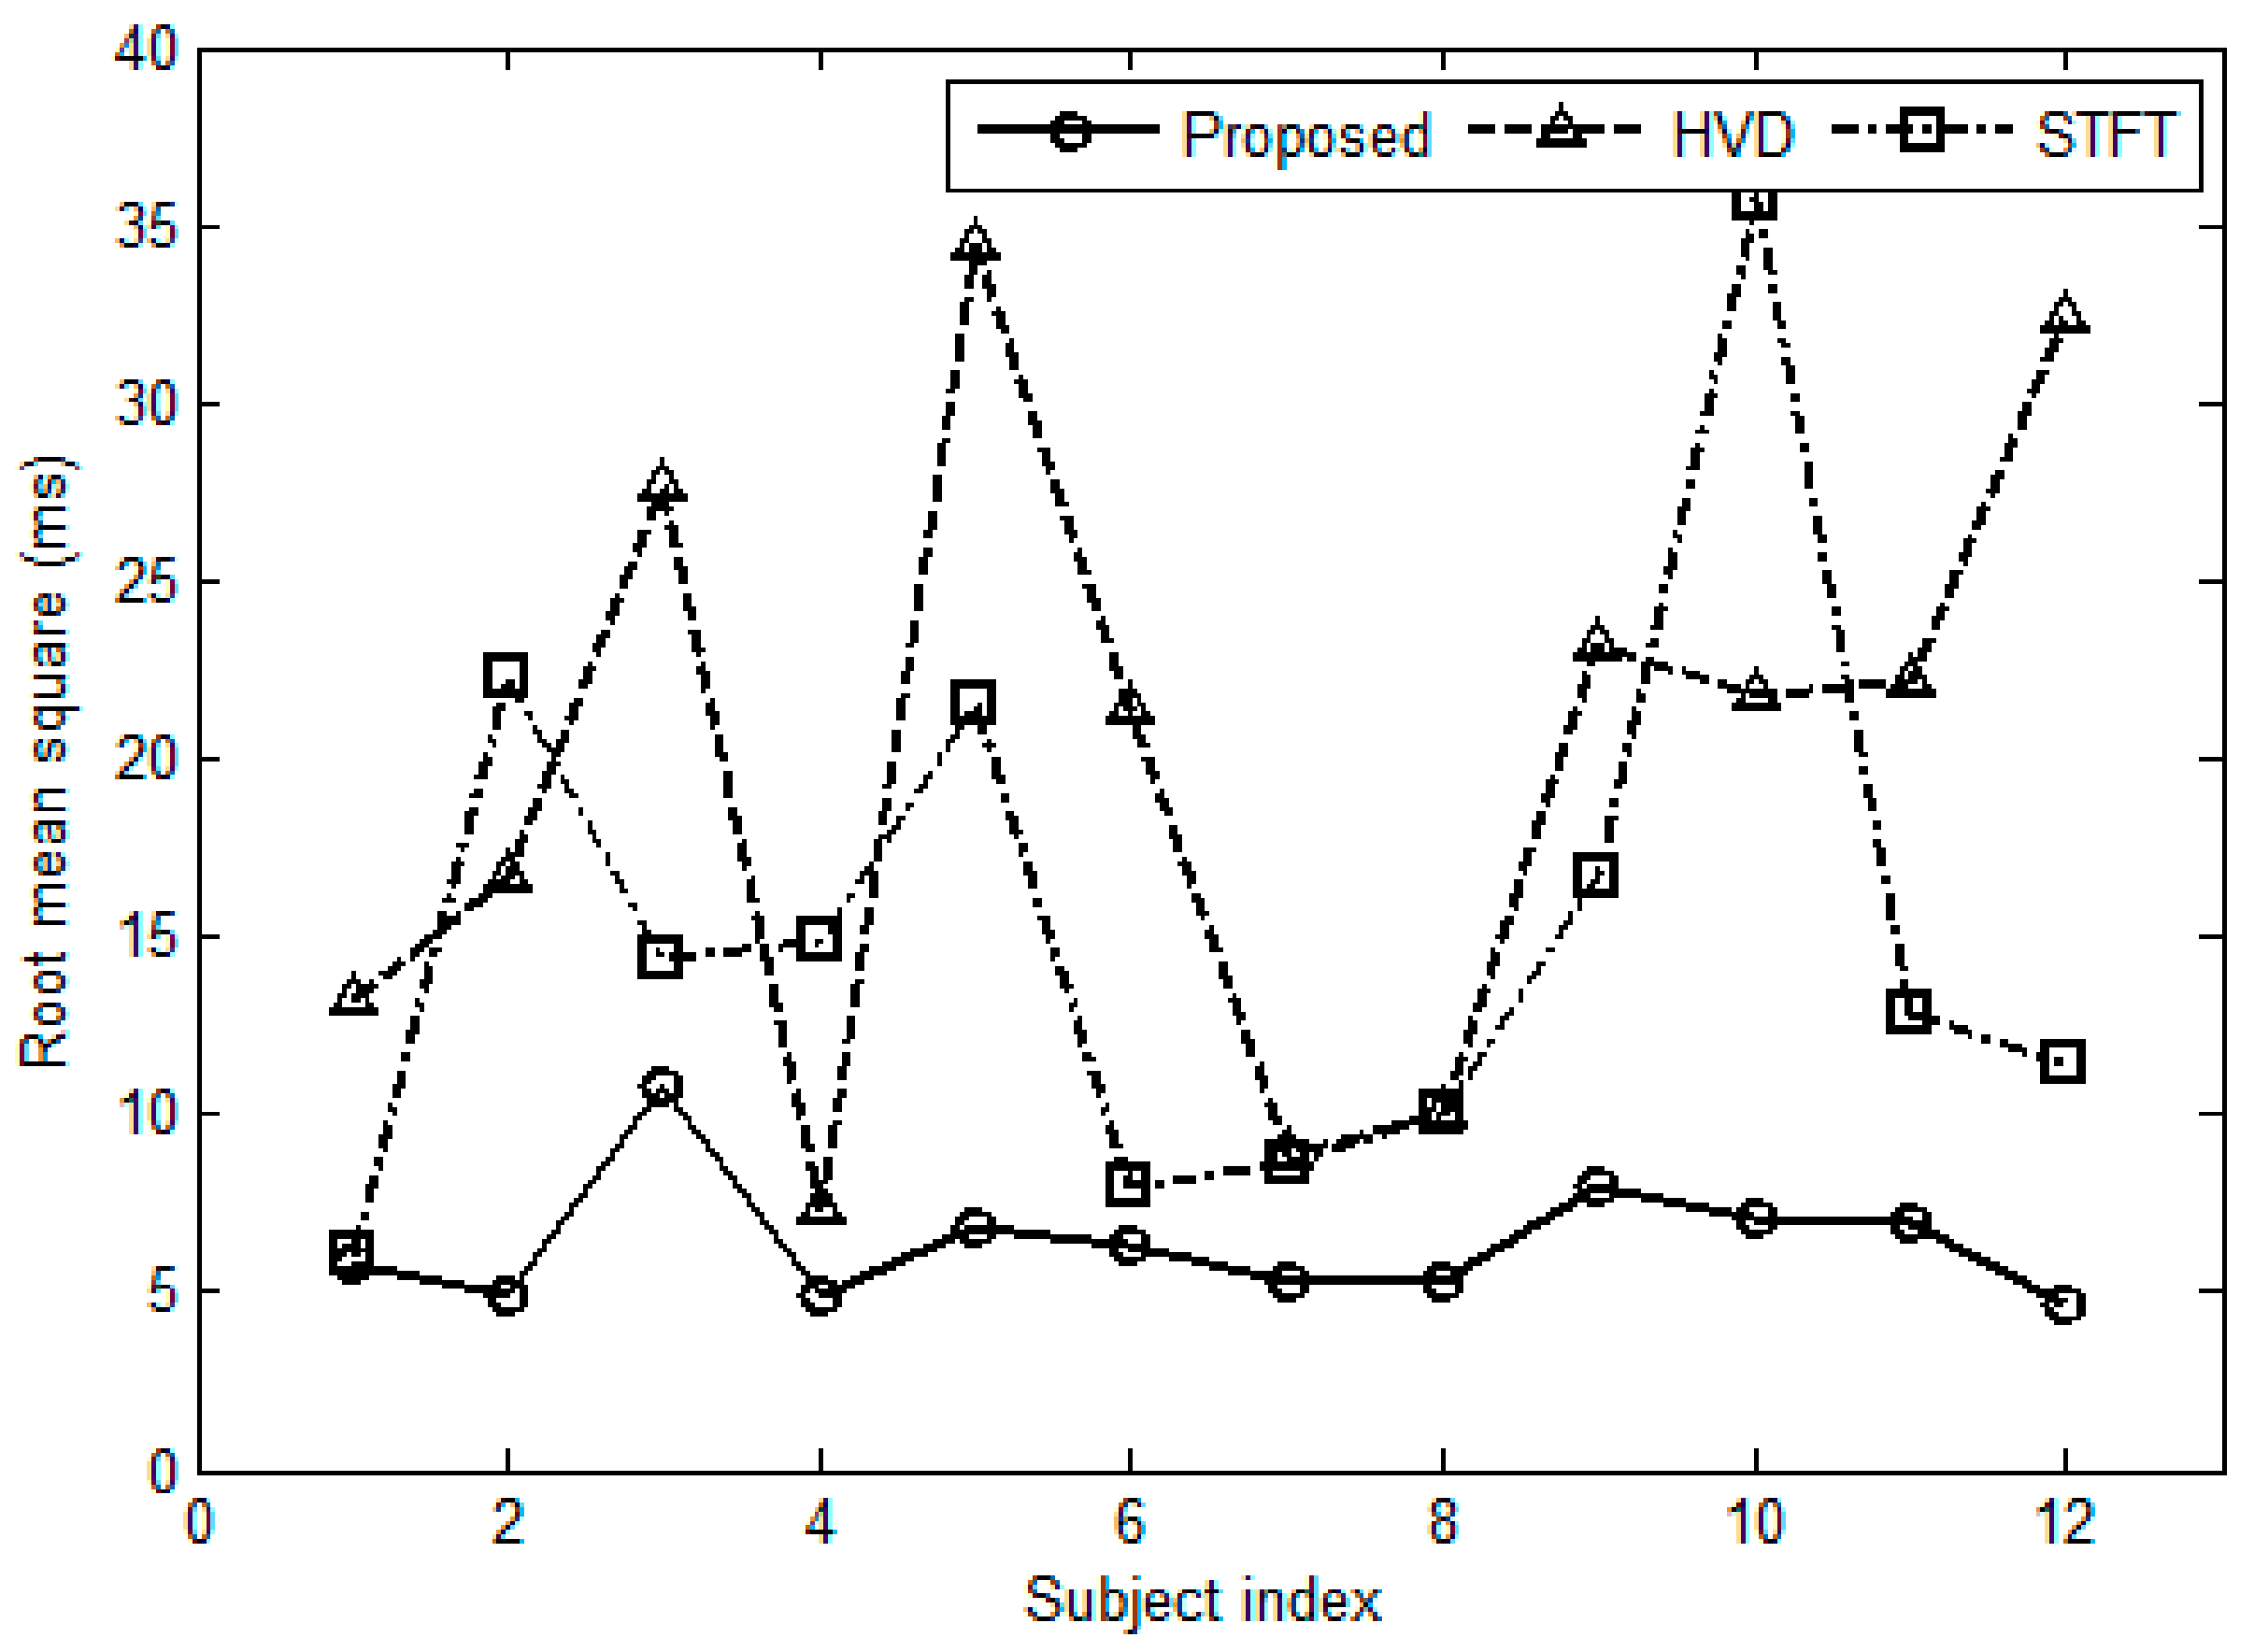
Hence, the difference between the scatters and the fitted values can be used to evaluate the performance. In this paper, the performance is evaluated in two ways. In the first way, the root mean square (RMS) of the difference is considered for this purpose, see Figure 14. It can be found that the proposed method has the lowest RMS for each subject. Meanwhile, the HVD has a greater RMS for subject No. 3, No. 5 and No. 10; the STFT method has a greater RMS for subject No. 2, No. 5, No. 10 and No. 12. In the second way, the authors investigate the difference distribution for all subjects. Hypothesis testing shows that the difference is like a Gaussian distribution. The confidence interval for the mean and standard deviation of the difference can be estimated by statistical theory where the confidence level is set as 0.95. Table 2 gives the confidence intervals of the two indicators. It can be seen that the intervals of both mean and standard deviation of the proposed method are narrowest in the three methods. That is to say, the proposed method has much higher consistency and much higher accuracy than the two previous methods.
3.4. Effect of the Number of S2s
In the proposed method, the aortic component can be extracted by the average, because the average operation can smooth the pulmonary component and noise. However, the performance of average operation depends on the number of S2s involved in. It is reasonable that the greater the number of S2s involved in the average operation are, the greater possibility the assumption becomes true (i.e., the Equations (3) and (5) become true). So, the proposed method runs in block by block. A large collection of S2s is needed before it can run. The embedded ensemble information of respiration modulation are taken advantage to yield the excellent performance. The proposed method will absolutely degrade if the number of S2s is too small. The experiment experience suggests that a very good performance can be obtained if the number of S2s in a recording is greater than 200. That is, the recording time should be greater than 3 min for a normal subject. However, the HVD method and the STFT method do not run in a manner of block. They can work with a single S2 input. There is no limit on the number of cardiac cycles for the HVD method and the STFT method.
3.5. Comparisons in Computation Complexity
The main steps of the HVD method include decomposing each S2 into components by Hilbert vibration decomposition and SPWVD operation for each component to extract timing information for aortic and pulmonary components. The main step of the STFT method is performing a Short Time Fourier Transform to each S2 and extracting timing information from the time-frequency representation. Meanwhile, the main steps of the proposed method are averaging and subtracting. So, the HVD method has the greatest complexity, the STFT method is medium and the proposed method has the least complexity. The CPU time to calculate the respiratory split and the RMS error of the difference between the scatters and the fitted values for the 12 subjects are listed in Table 3 for complexity comparison and accuracy comparison. A personal computer is used to run the three methods where the CPU (Intel Core 2 Quad CPU Q8300, Intel, Kuala Lumpur, Malaysia) has two cores and the frequency is 2.5 GHz. It is found from Table 3 that the proposed method has much less complexity than those of the HVD method and the STFT method. The CPU time of the HVD method is hundreds of times longer than that of the proposed method, and that of the STFT method is over ten times longer than that the proposed method. So, the proposed method has a great attractive advantage in computation complexity. The RMS error of the proposed method is the lowest for each subject compared with the other two methods.
3.6. Limitations of the Proposed Method
The proposed method has an advantage in computation complexity and accuracy. However, it has limitations too. (1) The proposed method runs in block by block. So, it is impossible to run the method in real time. The delay from inputting heart sound signal to outputting the split for a normal subject is three minutes or more. (2) A preprocessing is needed for the collection of S2s in which the S2s are aligned in time domain to facilitate average operation. If the alignment is missed or not well done, the estimated aortic and pulmonary components will be inaccurate, and consequently the performance of split estimation will degrade.
4. Conclusions
The second heart sound consists of aortic and pulmonary components. Previous physiological studies disclosed that the time delay between the two components is modulated by respiration. A novel method is proposed to quantitatively measure the delay using the respiratory modulation. A model is set up to assume that the second heart sound is the sum of aortic component and delayed pulmonary component. The aortic component could be estimated by the average of the second heart sounds over respiratory phase. Subsequently, the pulmonary component could be estimated by subtracting. The timing of the two components is further determined by the weighted powered envelope peak position. The proposed method is evaluated by both simulated data and practical data collected from healthy subjects. The experimental results clearly show that the detected splits of the second heart sound vary with respiratory phase. The values of the split and the trend of the splits coincide with previous results very well. The method is compared to the two well-known previous methods. It has advantages in computation complexity and accuracy. The results suggest the proposed method could be useful in non-invasively monitoring the hemodynamic response to respiration.
Acknowledgments
This work was supported in part by the National Natural Science Foundation of China under Grant No. 61471081, No. 61601081, and Fundamental Research Funds for the Central Universities under Grant No. DUT15QY60, DUT16QY13, DC201501056, and DCPY2016008.
Author Contributions
H.T. conceived, designed the experiments and wrote the manuscript; H.C. performed the experiments; H.C. and T.L. analyzed the data.
Conflicts of Interest
The authors declare that there is no conflict of interest.
References
- Luisada, A.A.; Liu, C.K.; Aravanis, C.; Testelli, M.; Morris, J.; Chicago, B.A. On the mechanism of production of the heart sounds. Am. Heart J. 1958, 55, 383–399. [Google Scholar] [CrossRef]
- Piemme, T.E.; Barnett, G.O.; Dexter, L. Relationship of heart sounds to acceleration of blood flow. Circ. Res. 1966, 18, 303–315. [Google Scholar] [CrossRef] [PubMed]
- Xu, J.; Durand, L.-G.; Pibarot, P. Extraction of the aortic and pulmonary components of the second heart sound using a nonlinear transient chirp signal model. IEEE Trans. Biomed. Eng. 2001, 48, 277–283. [Google Scholar] [PubMed]
- Leung, T.S.; White, P.R.; Cook, J.; Collis, W.B.; Brown, E.; Salmon, A.P. Analysis of the second heart sound for diagnosis of pediatric heart disease. IEE Proc.-Sci. Meas. Technol. 1998, 145, 285–290. [Google Scholar] [CrossRef]
- Djebbari, A.; Reguig, F. Smoothed pseudo wigner-ville distribution of normal and aortic stenosis heart sounds. J. Mech. Med. Biol. 2005, 5, 415–428. [Google Scholar] [CrossRef]
- Djebbari, A.; Bereksi-Reguig, F. Detection of the valvar split within the second heart sound using the reassigned smoothed pseudo Wigner-Ville distribution. Biomed. Eng. Online 2013, 12, 37–57. [Google Scholar] [CrossRef] [PubMed]
- Barma, S.; Chen, B.; Man, K.L.; Wang, J. Quantitative measurement of split of the second heart sound. IEEE Trans. Comput. Biol. Bioinform. 2015, 12, 851–860. [Google Scholar] [CrossRef] [PubMed]
- Feldman, M. Hilbert Transform Application in Mechanical Vibration; John Wiley Sons, Ltd.: West Sussex, UK, 2011; pp. 23–28. [Google Scholar]
- Augen, F.; Flandrin, P.; Lin, Y.; Mclaughlin, S.; Meignen, S.; Oberlin, T.; Wu, H. Time-frequency reassignment and synchrosqueezing. IEEE Signal Process. Mag. 2013, 30, 32–41. [Google Scholar]
- Auger, F.; Flandrin, P. Improving the readability of time-frequency and time-scale representations by the reassignment method. IEEE Trans. Signal Process. 1995, 43, 1068–1089. [Google Scholar] [CrossRef]
- Castle, P.F.; Jones, K. The mechanism of respiratory variation in splitting of the second heart sound. Circulation 1961, 24, 180–184. [Google Scholar] [CrossRef] [PubMed]
- Ishikawa, K.; Tamura, T. Study of respiratory influence on the intensity of heart sound in normal subjects. Angiology 1979, 30, 750–755. [Google Scholar] [CrossRef] [PubMed]
- Amit, G.; Gavriely, N.; Intrator, N. Cluster analysis and classification of heart sounds. Biomed. Signal Process. Control 2009, 4, 26–36. [Google Scholar] [CrossRef]
- Amit, G.; Shukha, K.; Gavriely, N.; Intrator, N. Respiratory modulation of heart sound morphology. Am. J. Physiol. Heart Circ. Physiol. 2009, 296, H796–H805. [Google Scholar] [CrossRef] [PubMed]
- Tang, H.; Gao, J.; Ruan, C.; Qiu, T.; Park, Y. Modeling of heart sound morphology and analysis of the morphological variations induced by respiration. Comput. Boil. Med. 2013, 43, 1637–1644. [Google Scholar] [CrossRef] [PubMed]
- Liang, H.; Lukkarimen, S.; Hartimo, I. Heart sound segmentation algorithm based on heart sound envelogram. Comput. Cardiol. 1997, 24, 105–108. [Google Scholar]
- Huang, N.E.; Shen, Z.; Long, S.R.; Wu, M.C.; Shih, H.H.; Zheng, Q.; Yen, N.C.; Tung, C.C.; Liu, H.H. The empirical mode decomposition and the Hilbert spectrum for nonlinear and non-stationary time series analysis. Proc. R. Soc. A Math. Phys. Eng. Sci. 1971, 454, 903–995. [Google Scholar] [CrossRef]
Figure 1.
Diagrammatic sketch of the influence of respiration on pulmonary arterial pressure and systemic aortic pressure. (This figure is drawn by the authors. These curves are not based on clinical data of any human being or animal. They are only used to show qualitative relations).
Figure 1.
Diagrammatic sketch of the influence of respiration on pulmonary arterial pressure and systemic aortic pressure. (This figure is drawn by the authors. These curves are not based on clinical data of any human being or animal. They are only used to show qualitative relations).
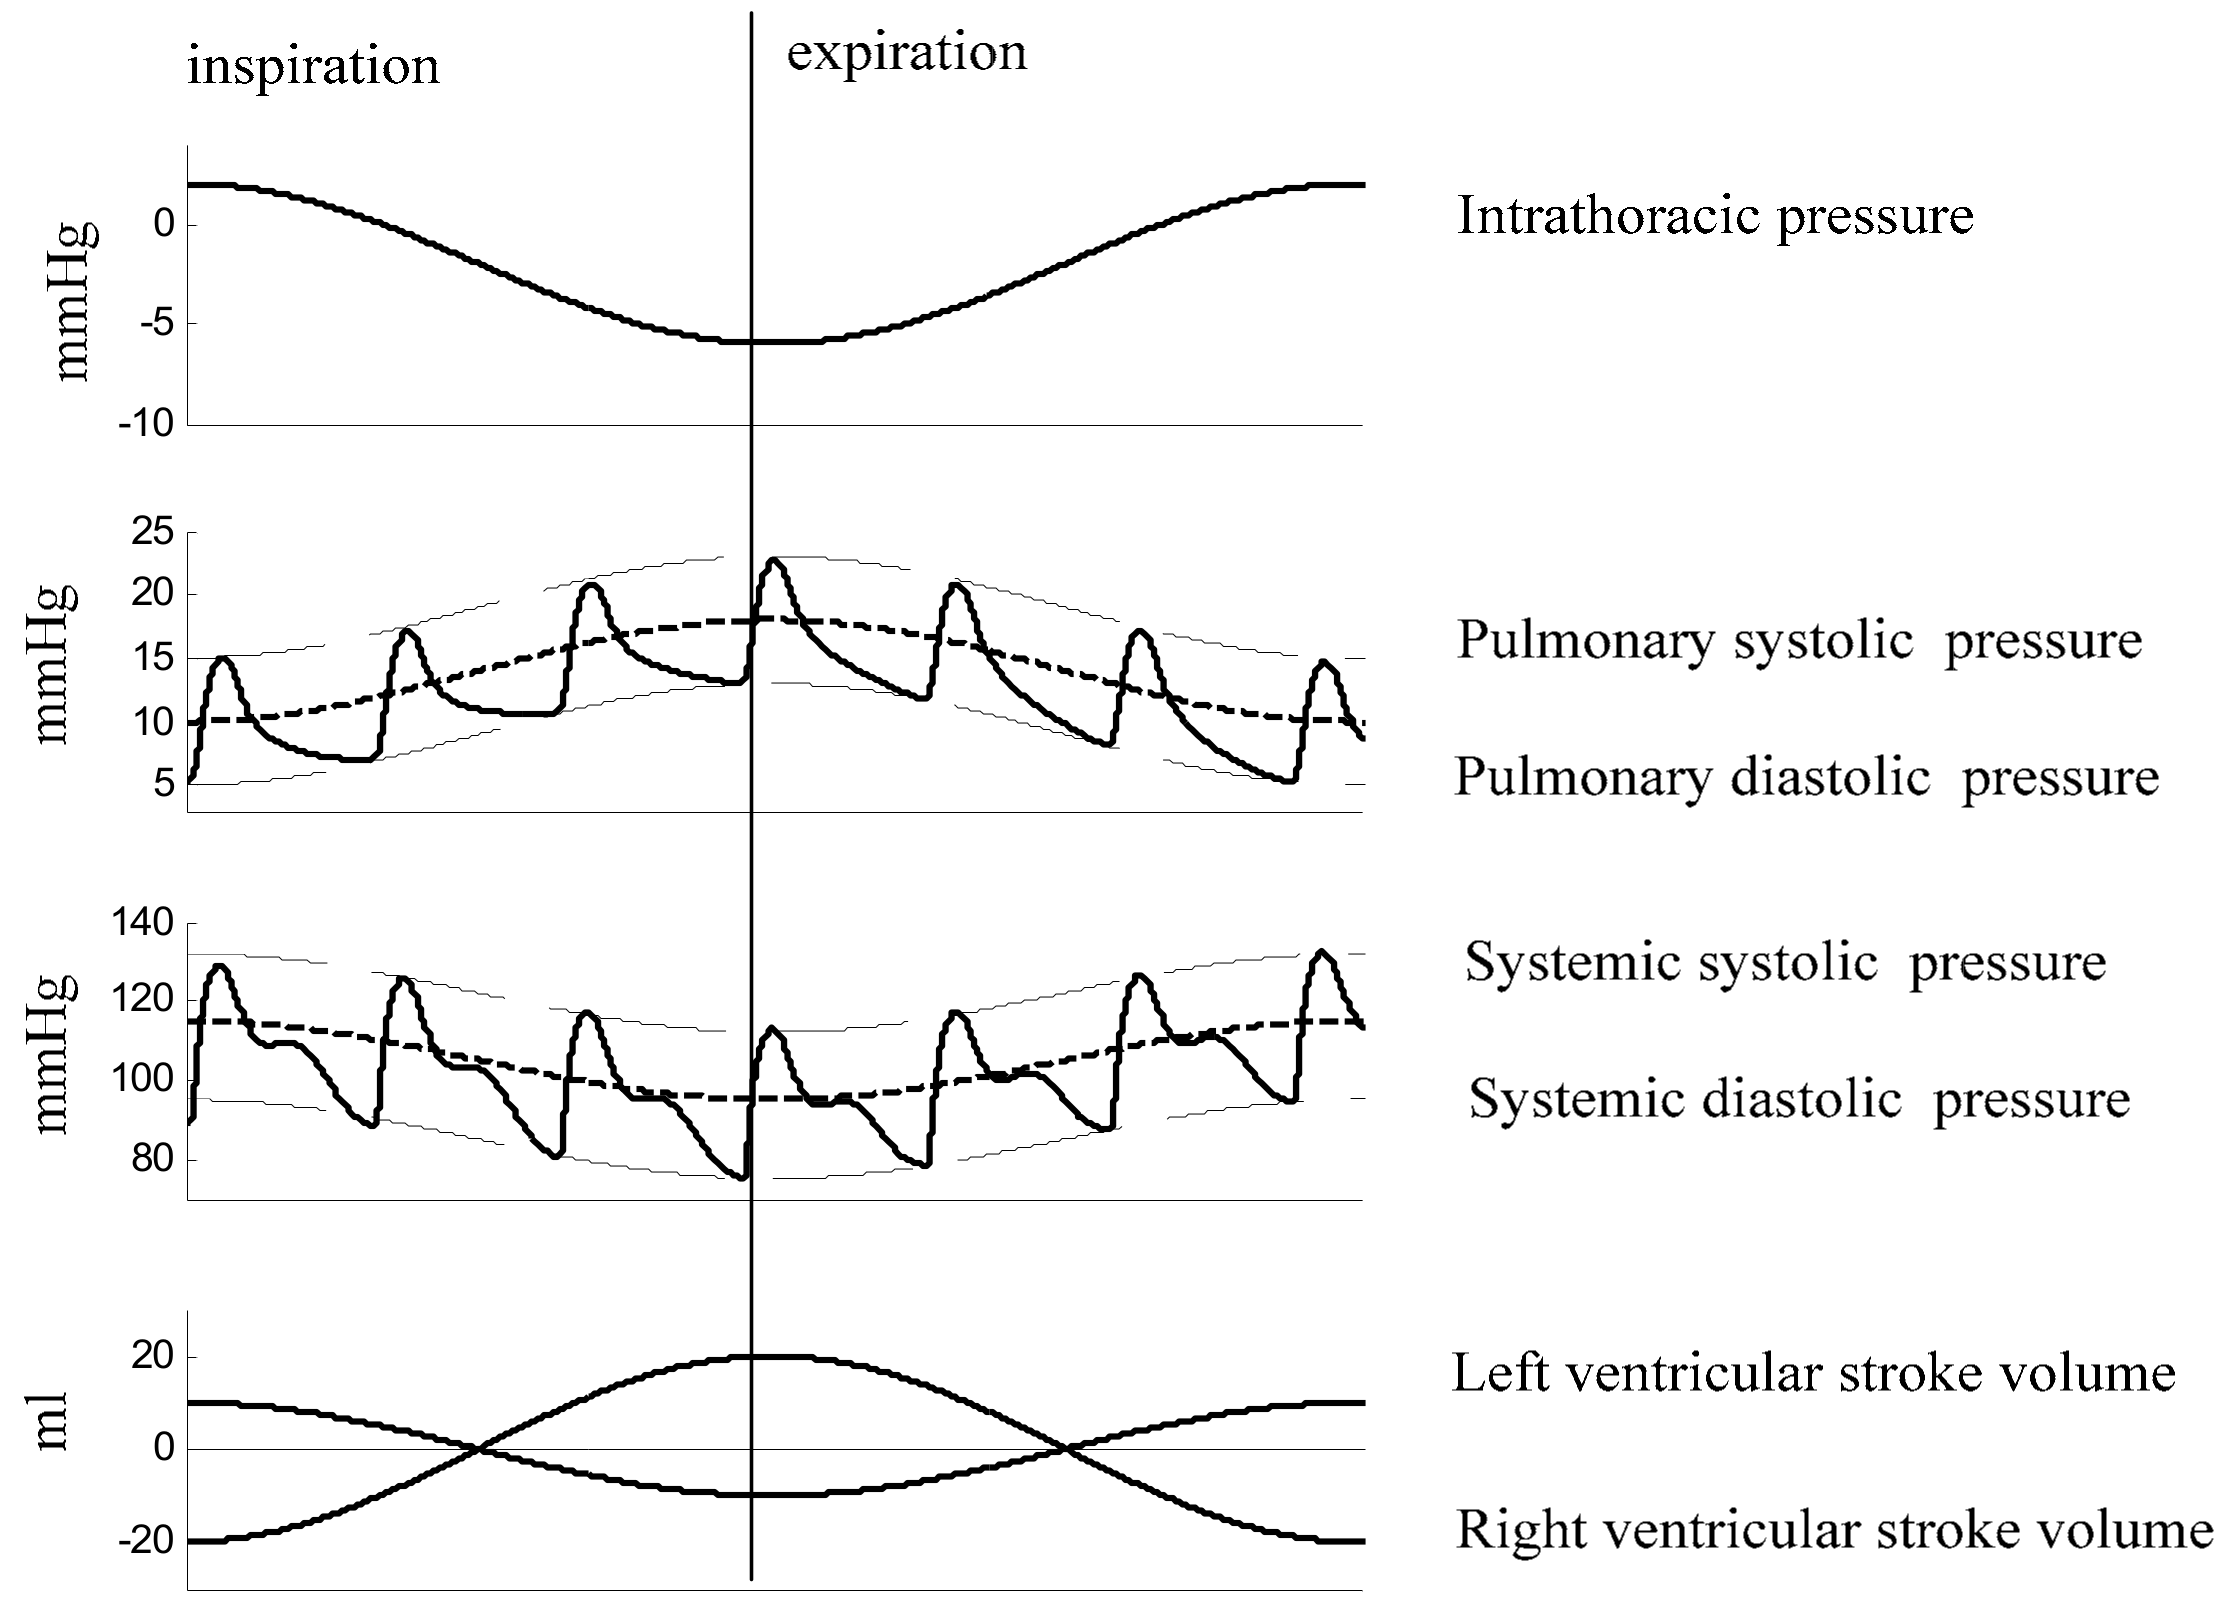
Figure 2.
Illustration of the respiratory variation in spitting of the second heart sound. (a) Diagram of the variations. The dash lines are used as a time reference. (b) A real example to show the respiratory variations based on data collected from a healthy subject.
Figure 2.
Illustration of the respiratory variation in spitting of the second heart sound. (a) Diagram of the variations. The dash lines are used as a time reference. (b) A real example to show the respiratory variations based on data collected from a healthy subject.

Figure 3.
A portion of synchronous signals. They are scaled in amplitude for visual inspection.

Figure 4.
Overview of the workflow.

Figure 5.
Illustration of respiratory phase calculation. (a) Respiratory signal collected from a belt sensor. (b) Respiratory phase. Inspiration corresponds to the phase from zero to π and expiration corresponds to the phase from −π to zero.
Figure 5.
Illustration of respiratory phase calculation. (a) Respiratory signal collected from a belt sensor. (b) Respiratory phase. Inspiration corresponds to the phase from zero to π and expiration corresponds to the phase from −π to zero.

Figure 6.
The second heart sounds from twelve subjects are demonstrated in joint time and respiratory phase domain. (a–l) subjects from No. 1 to No. 12.
Figure 6.
The second heart sounds from twelve subjects are demonstrated in joint time and respiratory phase domain. (a–l) subjects from No. 1 to No. 12.

Figure 7.
Average operation on S2s over respiratory phase. Blue lines are the S2s and the solid red line is the average. It can be seen that the aortic component remains. Meanwhile, the average of pulmonary components produces a very small signal.
Figure 7.
Average operation on S2s over respiratory phase. Blue lines are the S2s and the solid red line is the average. It can be seen that the aortic component remains. Meanwhile, the average of pulmonary components produces a very small signal.
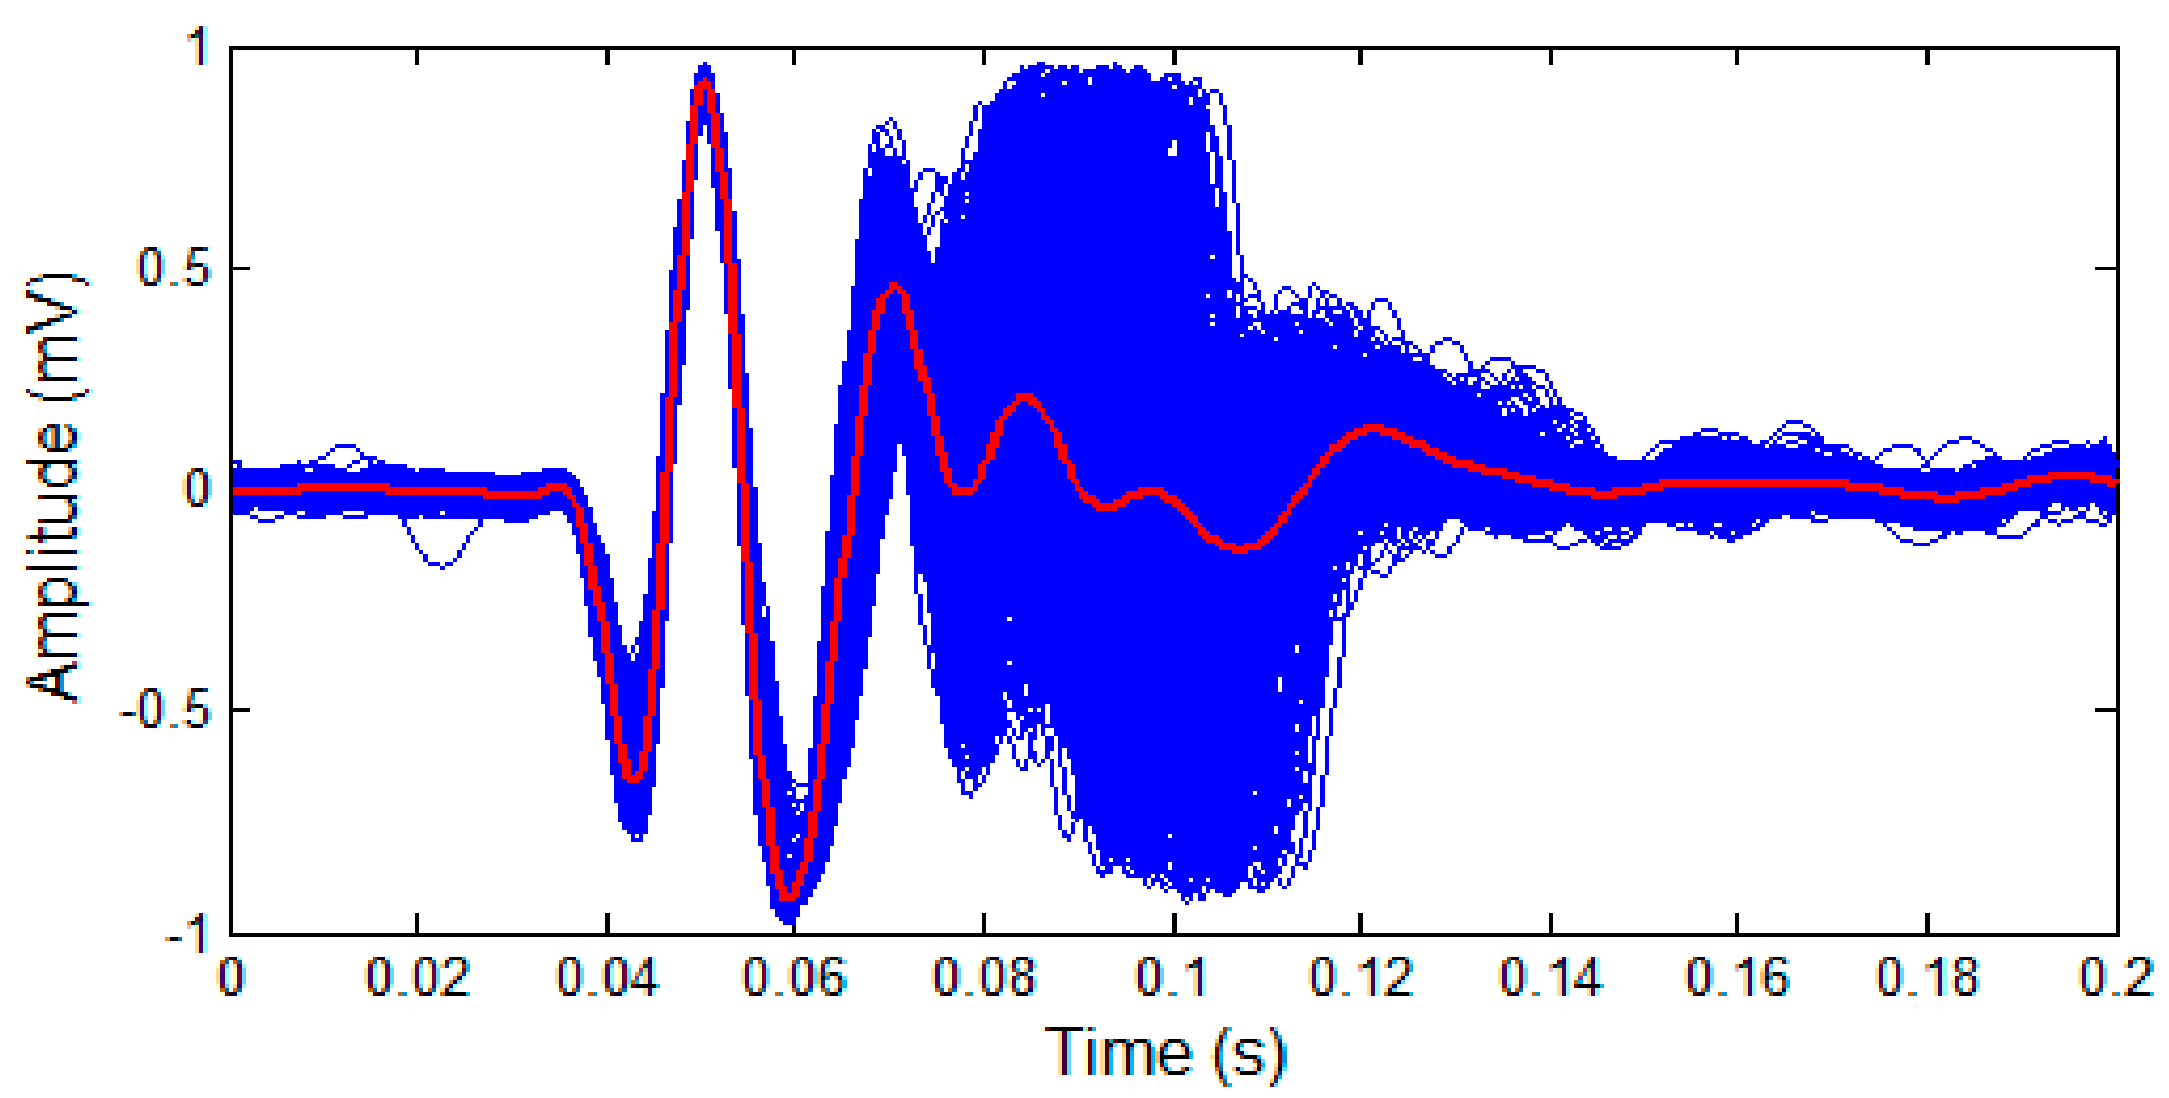
Figure 8.
Example of discrimination aortic and pulmonary components for subject No. 4. (a) the collection of S2s shown in joint domains, (b) separated aortic components, (c) separated pulmonary components.
Figure 8.
Example of discrimination aortic and pulmonary components for subject No. 4. (a) the collection of S2s shown in joint domains, (b) separated aortic components, (c) separated pulmonary components.
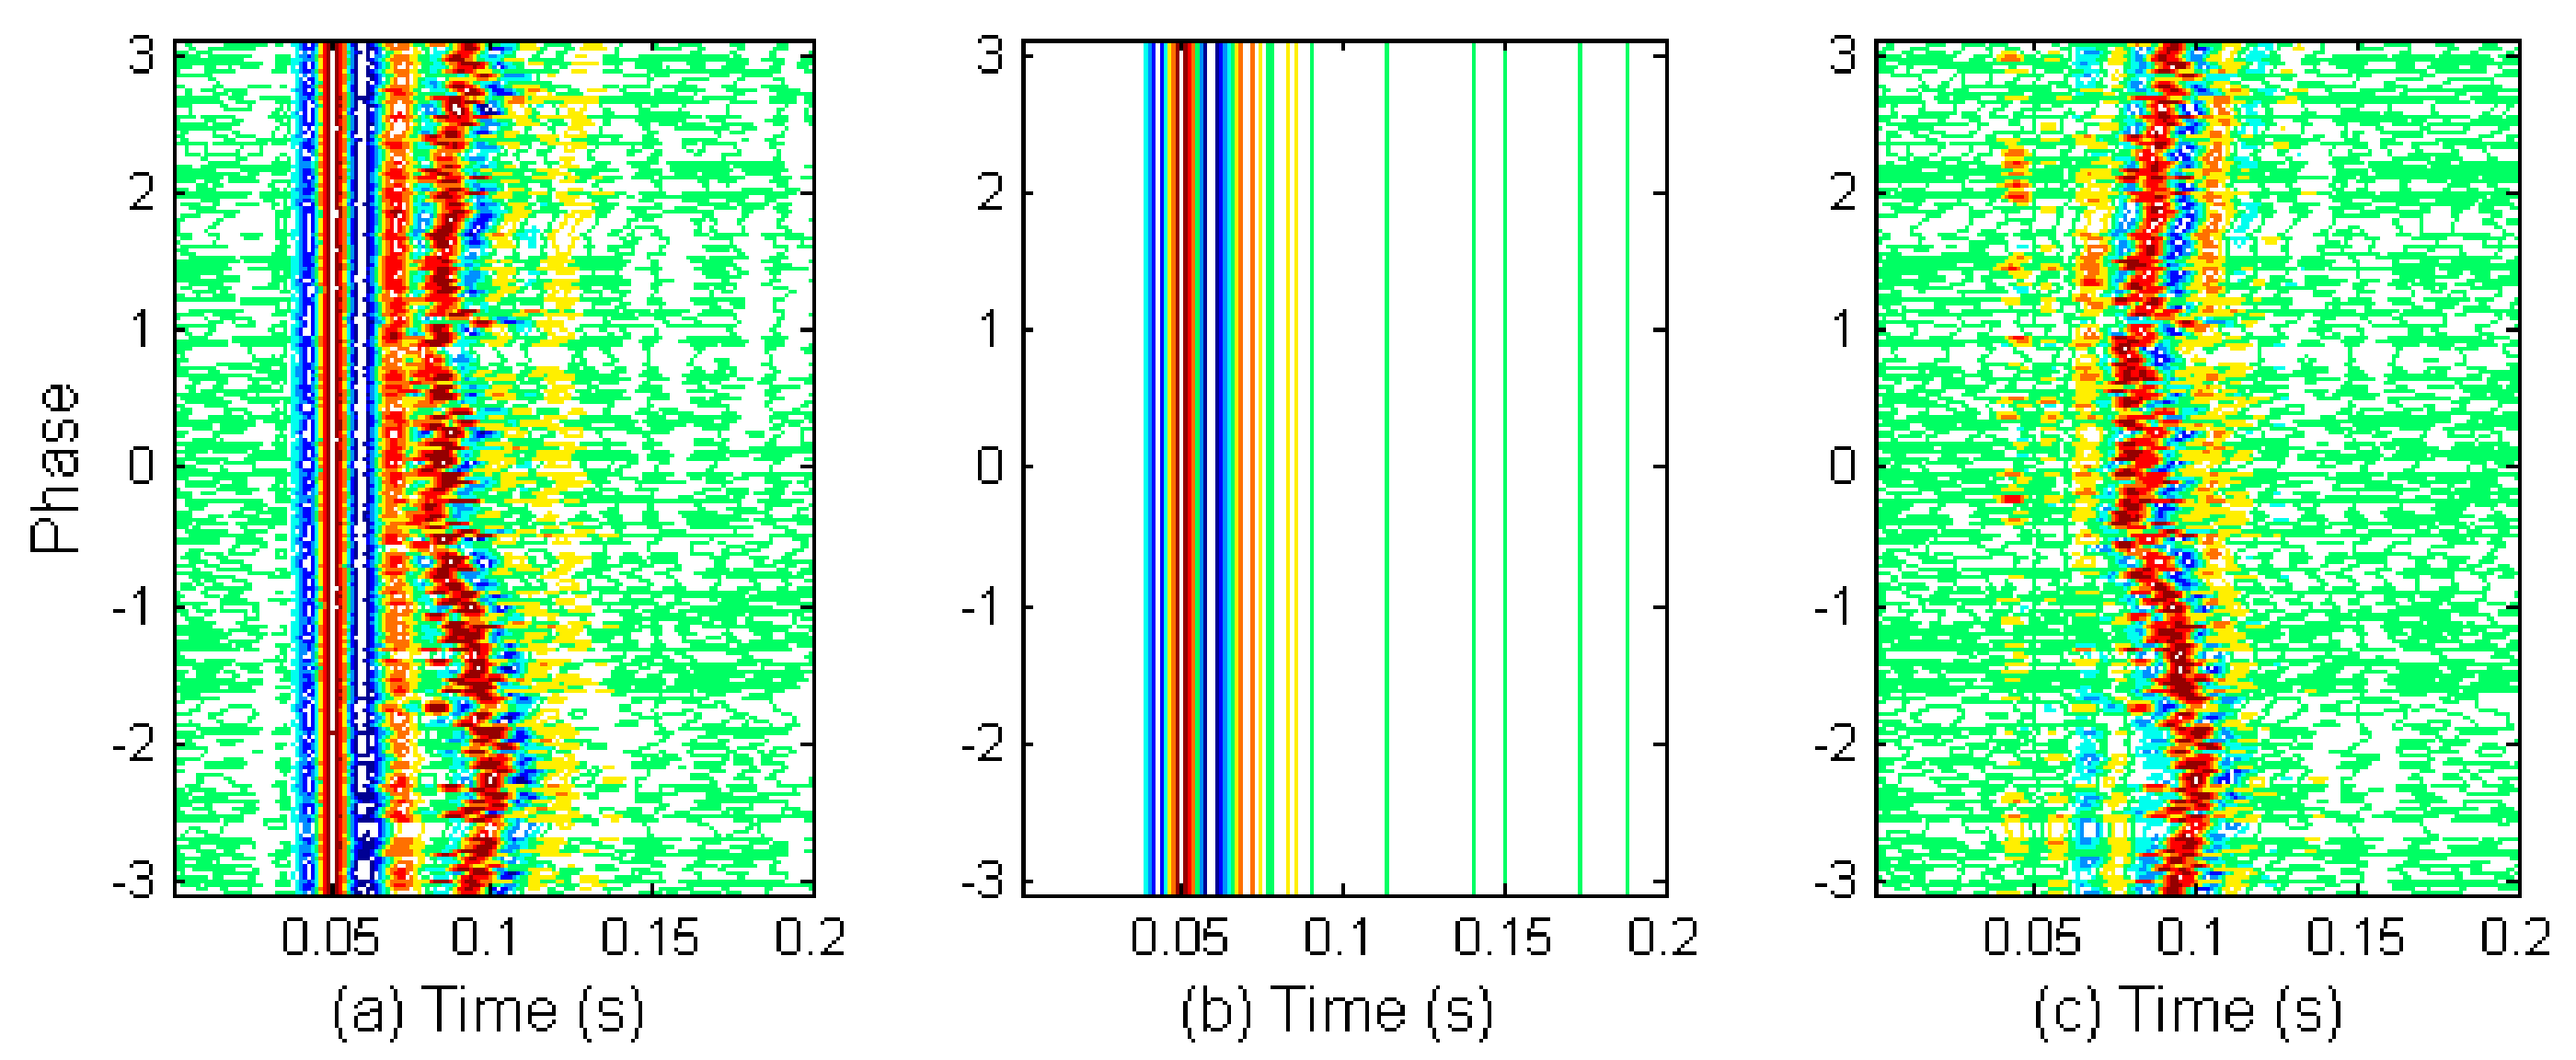
Figure 9.
Estimation of timing indices for aortic and pulmonary components. (a) An S2 signal, (b) Estimated aortic and pulmonary components, (c) Timing indices estimated from weighted peak positions. The split is estimated by the timing difference between the black star and the black square.
Figure 9.
Estimation of timing indices for aortic and pulmonary components. (a) An S2 signal, (b) Estimated aortic and pulmonary components, (c) Timing indices estimated from weighted peak positions. The split is estimated by the timing difference between the black star and the black square.
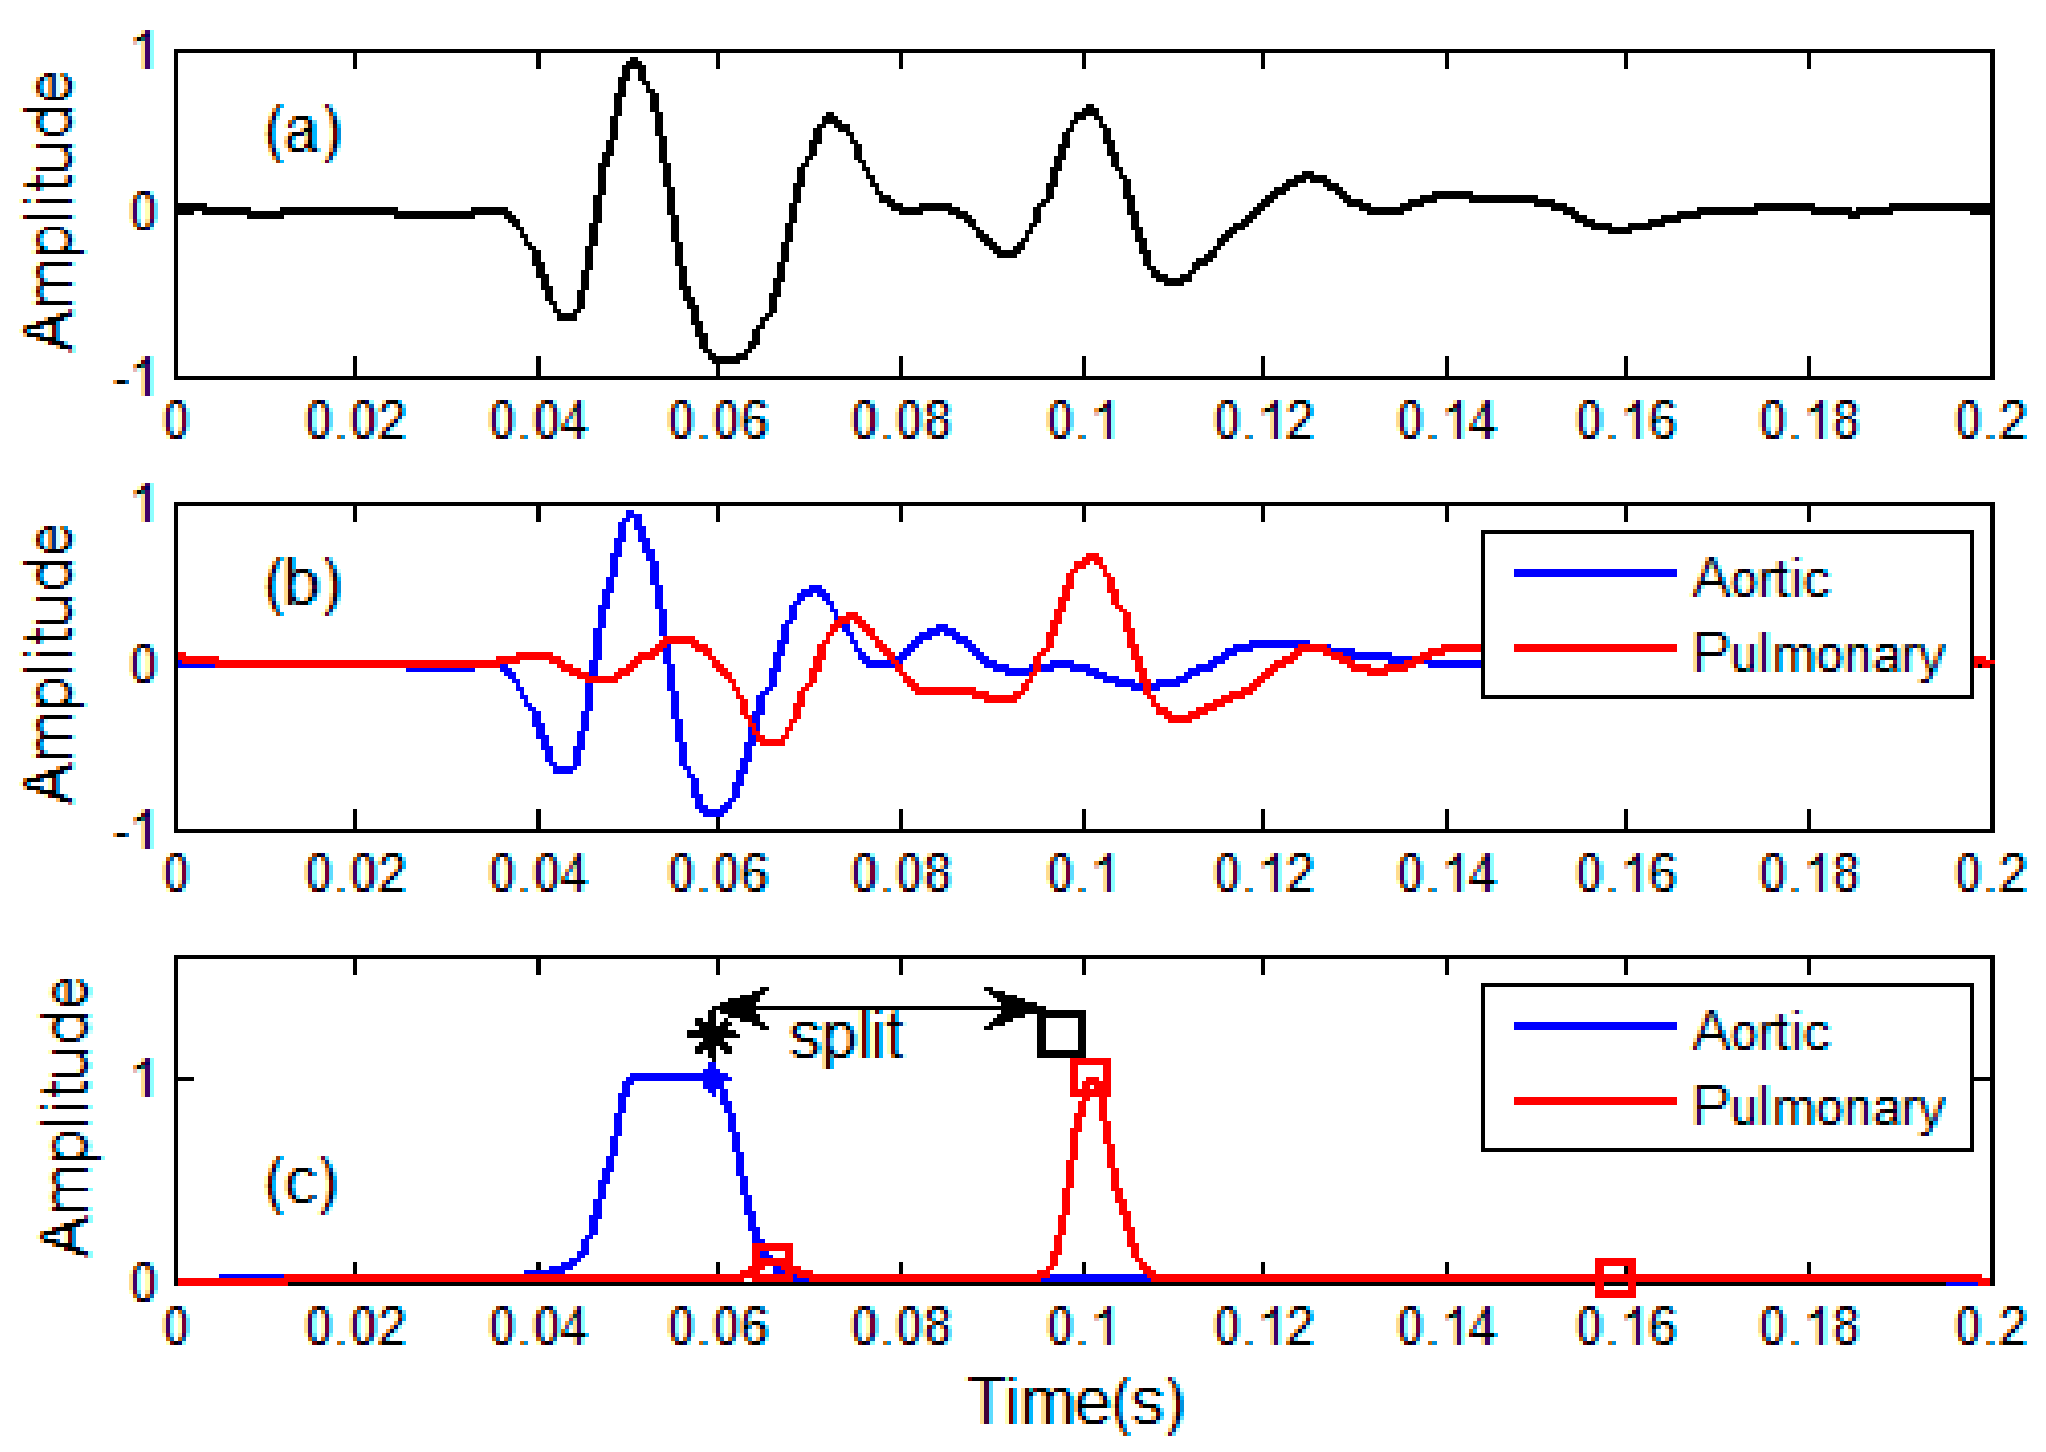
Figure 10.
Validation by computer simulation. (a) Simulated S2 signals with varying split, (b) Extracted aortic components, (c) Extracted pulmonary components, (d) Comparison between the true splits and measured splits.
Figure 10.
Validation by computer simulation. (a) Simulated S2 signals with varying split, (b) Extracted aortic components, (c) Extracted pulmonary components, (d) Comparison between the true splits and measured splits.
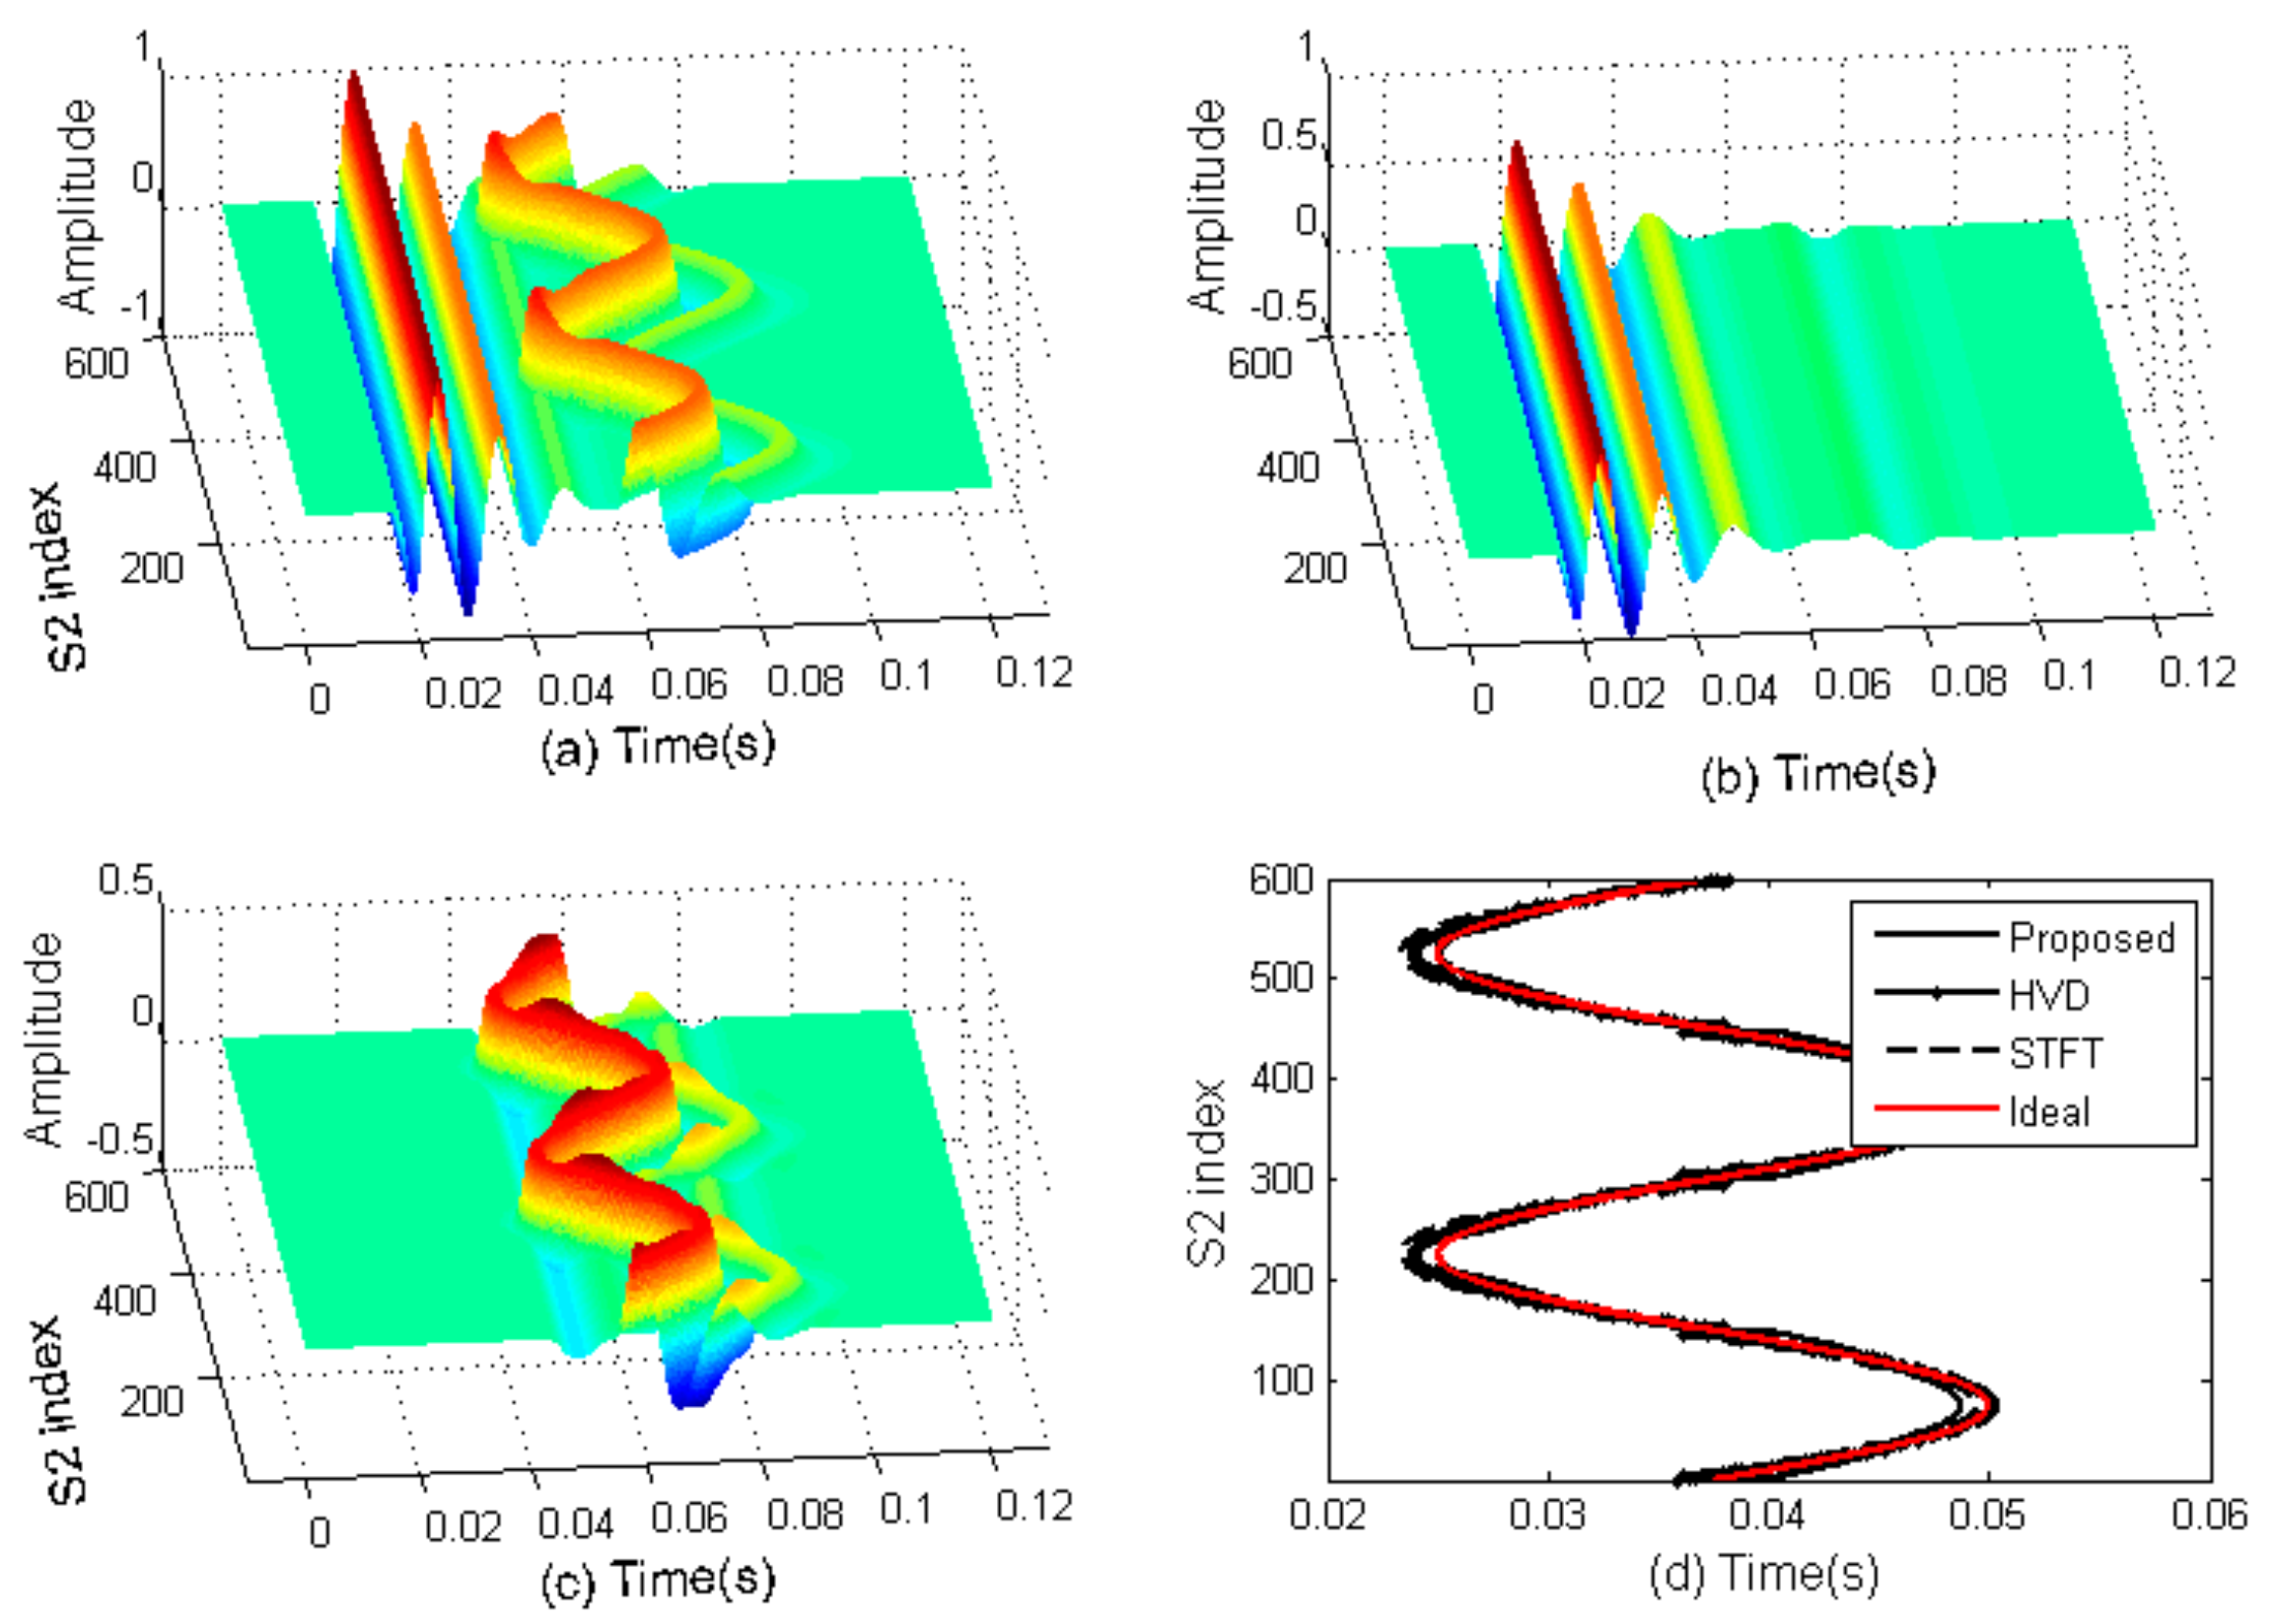
Figure 11.
Measured respiratory splits of the 12 subjects by the proposed method.

Figure 12.
Measured respiratory splits of the 12 subjects by the HVD method.
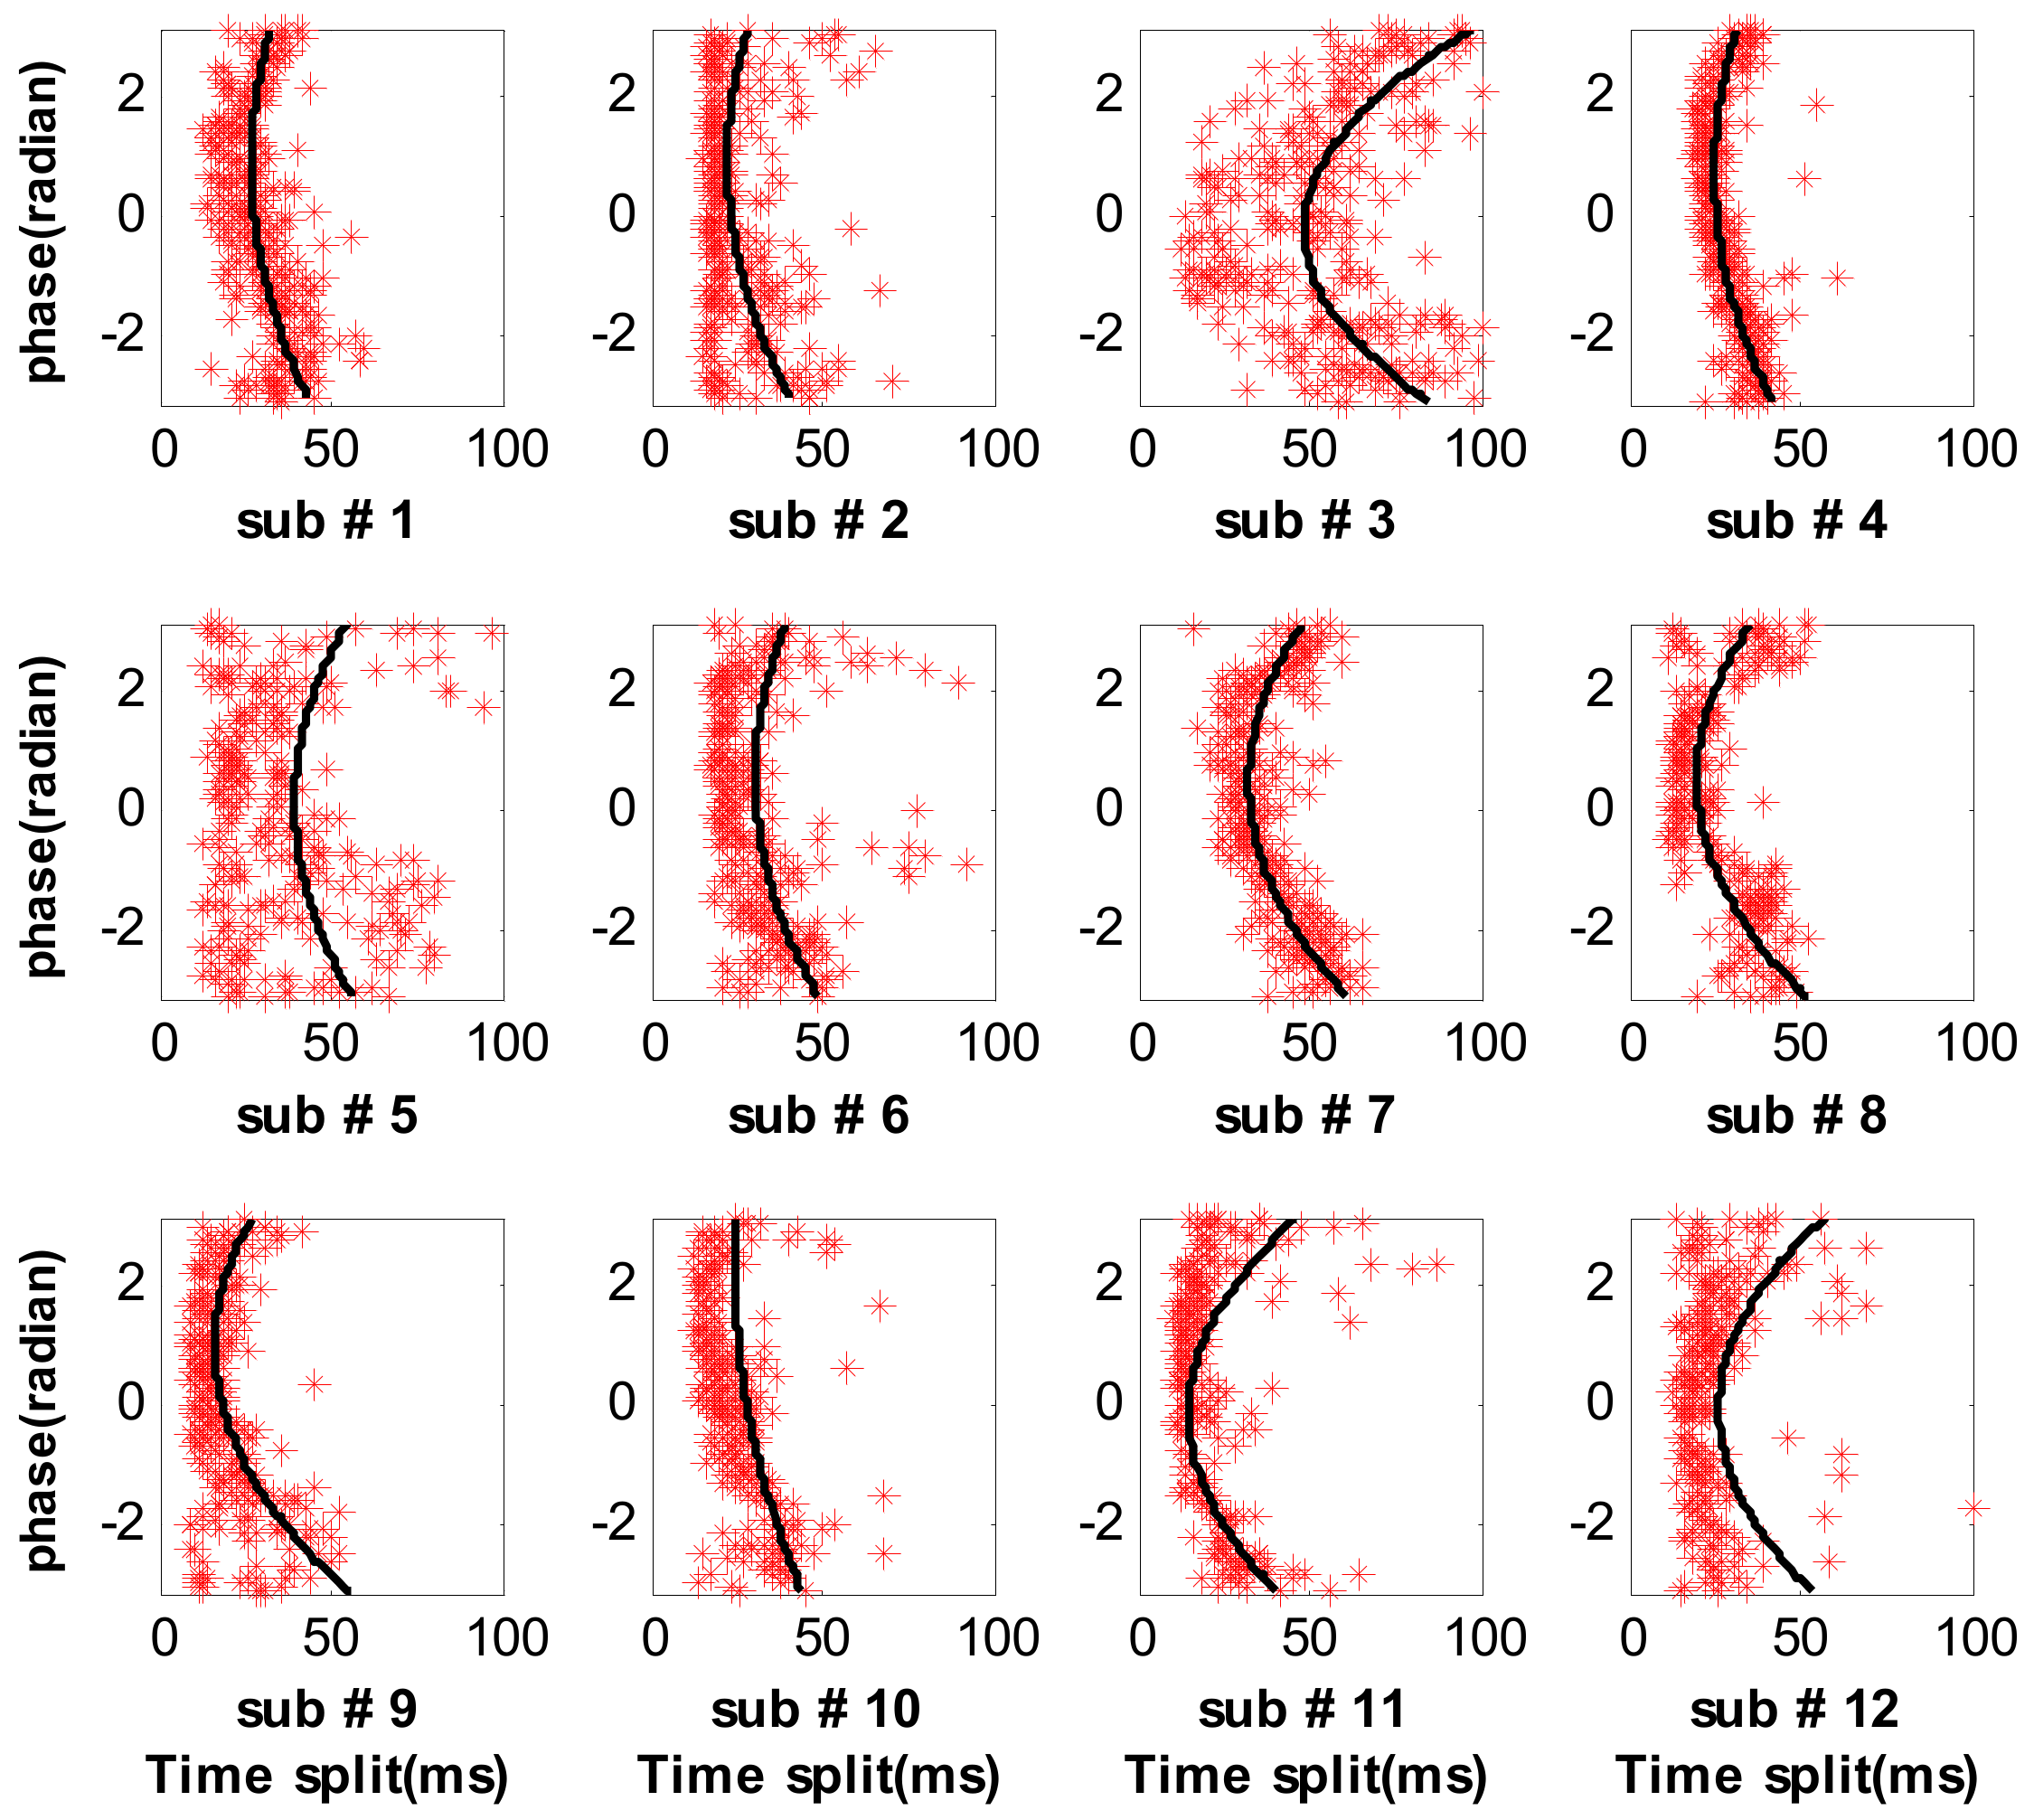
Figure 13.
Measured respiratory splits of the 12 subjects by the STFT method.

Figure 14.
Performance comparison among the three methods in term of RMS.

Table 1.
Summary of cardiac cycles involved in this work for each subject.
| Subject No. | 1 | 2 | 3 | 4 | 5 | 6 |
|---|---|---|---|---|---|---|
| Num. of Cardiac cycles | 344 | 331 | 360 | 367 | 290 | 311 |
| Subject No. | 7 | 8 | 9 | 10 | 11 | 12 |
| Num. of Cardiac cycles | 299 | 281 | 312 | 285 | 286 | 301 |
Table 2.
The confidence intervals of mean and standard deviation in 95% confidence level.
| Subject Index | Indicator | HVD Method [7] (ms) | STFT Method [4] (ms) | Proposed Method (ms) |
|---|---|---|---|---|
| 1 | mean | (−1.40, 1.40) | (−0.64, 0.64) | (−0.61, 0.61) |
| std | (12.30, 14.29) | (5.60, 6.50) | (5.36, 6.23) | |
| 2 | mean | (−1.80, 1.80) | (−2.40, 2.40) | (−0.52, 0.52) |
| std | (15.48, 18.04) | (20.66, 24.08) | (4.50, 5.25) | |
| 3 | mean | (−2.85, 2.85) | (−1.48, 1.48) | (−1.11, 1.11) |
| std | (25.70, 29.76) | (13.38, 15.49) | (10.05, 11.64) | |
| 4 | mean | (−0.75, 0.75) | (−1.52, 1.52) | (−0.50, 0.50) |
| std | (6.78, 7.83) | (13.80, 15.95) | (4.52, 5.23) | |
| 5 | mean | (−3.97, 3.97) | (−2.48, 2.48) | (−0.78, 0.78) |
| std | (31.78, 37.42) | (19.84, 23.37) | (6.25, 7.35) | |
| 6 | mean | (−2.37, 2.37) | (−0.88, 0.88) | (−0.70, 0.70) |
| std | (19.76, 23.13) | (7.33, 8.58) | (5.85, 6.85) | |
| 7 | mean | (−1.01, 1.01) | (−0.97, 0.97) | (−0.60, 0.60) |
| std | (8.20, 9.66) | (7.93, 9.31) | (4.93, 5.80) | |
| 8 | mean | (−1.18, 1.18) | (−1.17, 1.17) | (−0.62, 0.62) |
| std | (9.25, 10.93) | (9.18, 10.85) | (4.88, 5.76) | |
| 9 | mean | (−2.58, 2.58) | (−1.86, 1.86) | (−0.88, 0.88) |
| std | (21.47, 25.13) | (15.45, 18.09) | (7.34, 8.59) | |
| 10 | mean | (−2.52, 2.52) | (−4.14, 4.14) | (−0.83, 0.83) |
| std | (20.01, 23.60) | (32.84, 38.73) | (6.57, 7.75) | |
| 11 | mean | (−2.57, 2.57) | (−1.49, 1.49) | (−0.81, 0.81) |
| std | (20.41, 23.60) | (11.86, 13.98) | (6.46, 7.61) | |
| 12 | mean | (−3.67, 3.67) | (−1.28, 1.29) | (−0.53, 0.53) |
| std | (29.94, 35.15) | (10.55, 12.39) | (4.33, 5.09) |
Table 3.
Comparison of CPU time and RMS error among the three methods.
| Subject Index | Number of S2s | HVD Method [7] | STFT Method [4] | Proposed Method | |||
|---|---|---|---|---|---|---|---|
| CPUtime (s) | RMSerror (ms) | CPUtime (s) | RMSerror (ms) | CPUtime (s) | RMSerror (ms) | ||
| 1 | 344 | 942.1 | 13.2 | 11.5 | 6.0 | 1.3 | 5.8 |
| 2 | 331 | 948.1 | 16.7 | 11.4 | 22.3 | 1.2 | 4.9 |
| 3 | 360 | 971.4 | 27.7 | 11.6 | 14.3 | 1.2 | 10.8 |
| 4 | 367 | 981.1 | 7.3 | 13.1 | 14.8 | 1.1 | 4.9 |
| 5 | 290 | 830.1 | 34.5 | 10.1 | 21.5 | 0.9 | 6.8 |
| 6 | 311 | 843.3 | 21.4 | 10.6 | 7.9 | 1.0 | 6.3 |
| 7 | 299 | 799.3 | 8.9 | 10.2 | 8.6 | 0.9 | 5.4 |
| 8 | 281 | 773.5 | 10.1 | 9.5 | 10.0 | 0.9 | 5.3 |
| 9 | 312 | 847.3 | 23.2 | 10.4 | 16.7 | 0.9 | 7.9 |
| 10 | 285 | 776.7 | 21.7 | 9.7 | 35.7 | 0.9 | 7.1 |
| 11 | 286 | 765.3 | 22.2 | 10.4 | 12.9 | 0.9 | 7.0 |
| 12 | 301 | 804.2 | 32.4 | 10.2 | 11.4 | 1.0 | 4.7 |
© 2017 by the authors. Licensee MDPI, Basel, Switzerland. This article is an open access article distributed under the terms and conditions of the Creative Commons Attribution (CC BY) license (http://creativecommons.org/licenses/by/4.0/).
Share and Cite
MDPI and ACS Style
Tang, H.; Chen, H.; Li, T. Discrimination of Aortic and Pulmonary Components from the Second Heart Sound Using Respiratory Modulation and Measurement of Respiratory Split. Appl. Sci. 2017, 7, 690. https://doi.org/10.3390/app7070690
AMA Style
Tang H, Chen H, Li T. Discrimination of Aortic and Pulmonary Components from the Second Heart Sound Using Respiratory Modulation and Measurement of Respiratory Split. Applied Sciences. 2017; 7(7):690. https://doi.org/10.3390/app7070690
Chicago/Turabian StyleTang, Hong, Huaming Chen, and Ting Li. 2017. "Discrimination of Aortic and Pulmonary Components from the Second Heart Sound Using Respiratory Modulation and Measurement of Respiratory Split" Applied Sciences 7, no. 7: 690. https://doi.org/10.3390/app7070690
Note that from the first issue of 2016, this journal uses article numbers instead of page numbers. See further details here.