Monitoring of Land-Surface Deformation in the Karamay Oilfield, Xinjiang, China, Using SAR Interferometry


1
Department of Urban Environment Systems, Chiba University, Chiba 263-8522, Japan
2
Institute of Geographic Sciences and Tourism, Xinjiang Normal University, Urumqi 830054, Xinjiang, China
*
Author to whom correspondence should be addressed.
Appl. Sci. 2017, 7(8), 772; https://doi.org/10.3390/app7080772
Submission received: 23 June 2017
/
Revised: 26 July 2017
/
Accepted: 27 July 2017
/
Published: 30 July 2017
Abstract
:Synthetic Aperture Radar (SAR) interferometry is a technique that provides high-resolution measurements of the ground displacement associated with various geophysical processes. To investigate the land-surface deformation in Karamay, a typical oil-producing city in the Xinjiang Uyghur Autonomous Region, China, Advanced Land Observing Satellite (ALOS) Phased Array L-band Synthetic Aperture Radar (PALSAR) data were acquired for the period from 2007 to 2009, and a two-pass differential SAR interferometry (D-InSAR) process was applied. The experimental results showed that two sites in the north-eastern part of the city exhibit a clear indication of land deformation. For a further evaluation of the D-InSAR result, the Persistent Scatterer (PS) and Small Baseline Subset (SBAS)-InSAR techniques were applied for 21 time series Environmental Satellite (ENVISAT) C-band Advanced Synthetic Aperture Radar (ASAR) data from 2003 to 2010. The comparison between the D-InSAR and SBAS-InSAR measurements had better agreement than that from the PS-InSAR measurement. The maximum deformation rate attributed to subsurface water injection for the period from 2003 to 2010 was up to approximately 33 mm/year in the line of sight (LOS) direction. The interferometric phase change from November 2007 to June 2010 showed a clear deformation pattern, and the rebound center has been expanding in scale and increasing in quantity.
1. Introduction
Interferometric Synthetic Aperture Radar (InSAR) is a proven remote sensing technique that uses the phase information of SAR images to measure ground surface movements. However, the conventional InSAR method is limited by the so-called temporal and geometrical decorrelation as well as by atmospheric artifacts [1]. Over the years, new advanced InSAR techniques have been proposed to improve the precision of deformation measurement by the joint analysis of a set of SAR images [2,3], for example, Permanent Scatterer InSAR (PS-InSAR™)—use of time series SAR images to detect coherent radar signals over a sequence of interferograms [4,5]; Small Baseline Subset (SBAS)—use of all available SAR images with small baselines to achieve a high degree of spatial coverage of distributed scatters [6]; Persistent Scatterer Pairs (PSP)—works with pairs of points to identify and analyze persistent scatterer [7]; Quasi Persistent Scatterers (QPS)—utilizes partially coherent targets to increase the spatial density of the observations [8]; Stable Points Network (SPN), which has three key features (i.e., pixel selection, use of multi-master images and modeling capability) and less sensitive to geometric decorrelation [9]; SqueeSAR™—a second generation of PS-InSAR™ which combines both the persistent and distributed scatterers [10]; Stanford Method for Persistent Scatterers (StaMPS)—similar to PS-InSAR, but the PS points are defined as the scatters with stable phase characters [11]; Temporarily Coherent Point InSAR (TCPInSAR)—detecting the ground deformation rate and solving the phase ambiguities without phase unwrapping [12]; and Intermittent SBAS (ISBAS)—an extension of SBAS-InSAR that use the pixels which are intermittently coherent in addition to those consistently stable over time [13], etc. These methods have been widely used to measure human- and naturally induced ground deformation, such as earthquake deformation [14,15], mining subsidence [16,17], volcano deformation [18,19], landslides [20,21] and glacier movement [22,23]. Additionally, several studies pertaining to gas/oil extraction-induced and CO2/water injection-induced surface deformation have been carried out [24,25,26,27,28].
In particular, the extraction of ground water, oil and gas from underground reservoirs, and the injection of waste-water would induce deformation in reservoirs by changing the reservoir pressure and consequently generate measurable surface deformations in the form of subsidence or uplift [29]. The excessive surface deformation can cause damage to engineering structures and other infrastructure, such as railroads, roads, buildings, and oil and gas pipelines [30,31]. Thus, identifying the signs of impending land deformation is important in correcting the potential problems before associated accidents/incidents occur [32].
As one of the largest oilfields in China, the Karamay oilfield has large amount of heavy and ultra-heavy oil deposits [33]. After several years of oil field development, a subsurface water injection project was initiated in 1985 to increase the oil production [34]. Despite the Karamay oilfield being in production since 1897 [35], due to the lack of ground measurement data, few studies have been conducted related to the land deformation in this area. Ji et al. [36] first applied the InSAR technique with Advanced Land Observing Satellite (ALOS) Phased Array L-band Synthetic Aperture Radar (PALSAR) images acquired between October 2006 and December 2010 for investigating land-surface displacement in the Karamay oil field, and they detected a significant land uplift area located around the Hei103 well region and concluded that the land uplift may have been caused by subsurface water injection. However, the agreement of the results obtained by different microwave bands of SAR has not yet been achieved. To further understand land-surface deformation in the Karamay oilfield, this paper will make use of three InSAR methods. First, the two-path differential SAR interferometry (D-InSAR) method was applied to three L-band SAR images acquired by ALOS-PALSAR over the study area in the period from 20 January 2007 to 25 January 2009; Second, we further applied the Persistent Scatterer (PS) and Small baseline subset (SBAS)-InSAR technique to 21 C-band images acquired by the Environmental Satellite (ENVISAT) C-band Advanced Synthetic Aperture Radar (ASAR) for the period 30 September 2003 to 15 June 2010. Moreover, comparisons of different InSAR methods and the comparison of satellite-derived deformation rates with the results of a previous continuous Global Positioning System (GPS) station was conducted. This research is intended to assist with identifying areas experiencing ground deformations, in turn helping local authorities concentrate on the detailed monitoring, investigation and risk mitigation over large areas at relatively low costs.
2. Study Area and Data Sets
2.1. Study Area
Karamay is a prefecture-level city in the northern part of the Xinjiang Uyghur Autonomous Region, the People’s Republic of China. Karamay covers an area of 9500 km2 and consists of four administrative districts, Urho, Baijiantan, Karamay and Dushanzi (Figure 1). Oil and natural gas are the main natural resources in Karamay with characteristics of large storage and higher quality. The region is in the mid-latitudes and has a typical temperate continental desert climate. The geomorphological type is predominantly Gobi Desert [37] with an altitude of 250 m to 500 m. Of interest, the relatively minor change in elevation assists with achieving a more accurate result in the SAR interferometry by minimizing the Digital Elevation Model (DEM) error.
2.2. Data Sets
The L-band ALOS satellite data sets covering the region of interest were provided by the Japan Aerospace Exploration Agency (JAXA). The SAR interferograms were computed from PALSAR fine-beam single-polarization (FBS) data taken on three different dates (20 January 2007, 10 December 2008, and 25 January 2009), and predominantly over the winter season to minimize the adverse impact that vegetation has on the accuracy of SAR interferometry. Observation parameters for all the images were as follows: reference system for planning (RSP) number 94; path number 501; and acquired in the ascending orbit with an off-nadir angle of 34.3°. We also used twenty-one C-band ENVISAT-ASAR images provided by the European Space Agency (ESA) and acquired in the period from 30 September 2003 to 15 June 2010. These data sets were acquired in the descending orbit with an incidence angle of 22.9°. A Shuttle Radar Topography Mission-3 (SRTM-3) version-4 (90 m resolution) was used to eliminate the topographic phase, which was downloaded from (http://www.cgiar-csi.org/). Figure 1 shows the cover ranges of the ALOS and ENVISAT data.
3. Methodology
3.1. D-InSAR
D-InSAR is a technique capable of detecting land-surface deformation by analyzing a single interferogram that is derived from a pair of SAR images with the addition of a DEM [38]. In this study, the two-pass interferometry method was implemented by using two ALOS-PALSAR Single Look Complex (SLC) images for interferogram generation, and then, the topographic phase was removed using the SRTM DEM data. To remove noise and to smooth the interferogram, the Goldstein–Werner filtering process was applied [39], and the coefficient in the filtering process was set to 0.2. Finally, the InSAR products were geocoded from the Range-Doppler coordinates to the map geometry with a pixel resolution of 25 m. The SARscape® Modules (5.1) for ENVI (5.3) software suit was employed to process the level-1.1 data and perform interferometric analyses.
3.2. PS and SBAS-InSAR
PS-InSAR is one of the promising approaches that improves the precision of conventional InSAR displacement measurements. The PS-InSAR algorithm utilizes a time series of radar images to detect coherent radar signals from PS points to derive information of the terrain motion [4,5,40]. Another algorithm called SBAS-InSAR was also employed, which utilizes all available SAR images with small baselines to get high degree of spatial coverage of distributed scatters [6]. Both algorithms can compensate the disadvantages of the conventional D-InSAR, namely, phase errors due to geometrical and temporal decorrelation as well as atmospheric disturbance [31].
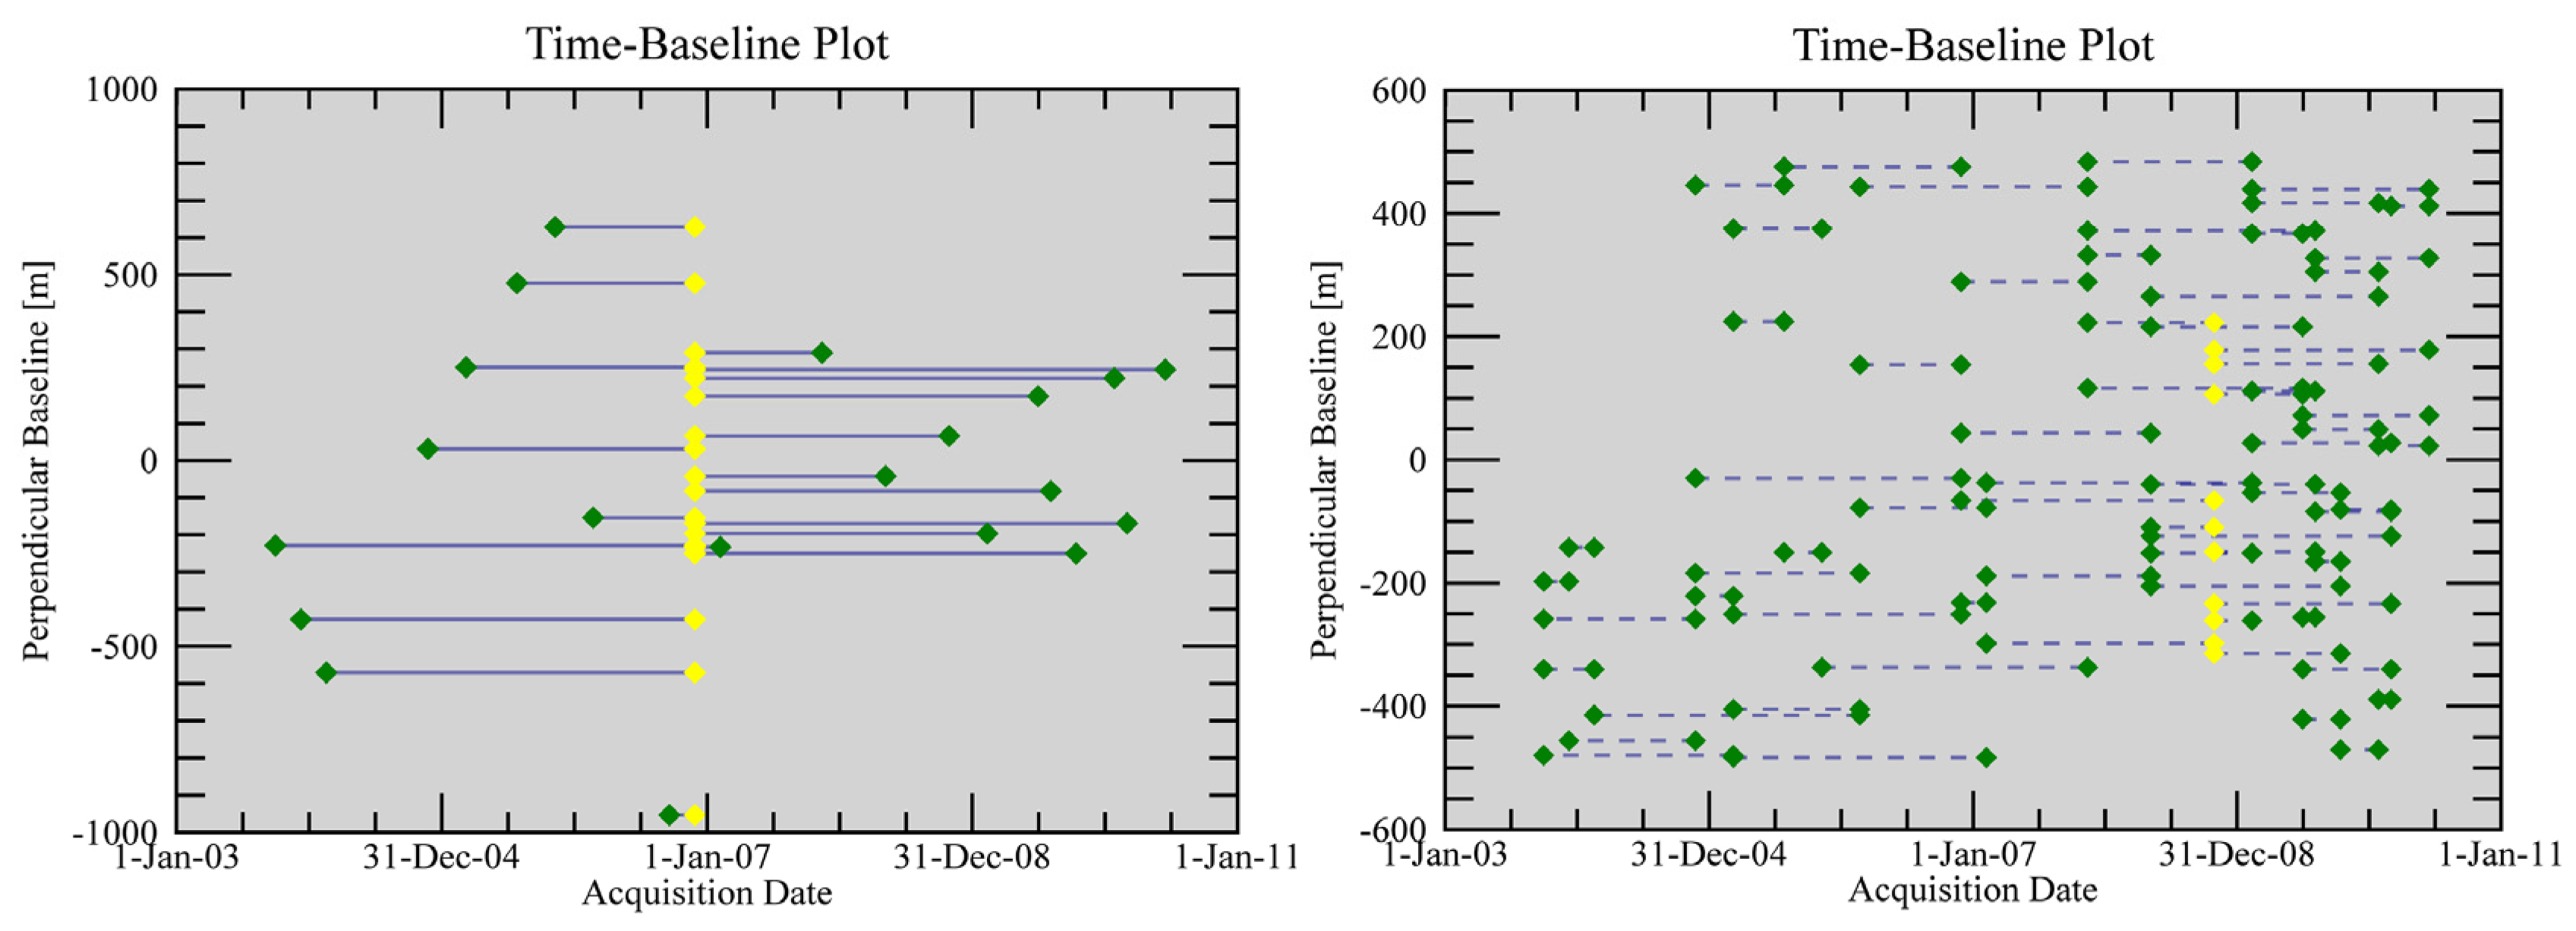
The ENVISAT-ASAR data were processed using both the PS and SBAS-InSAR methods. For PS-InSAR, we selected the slant-range image (28 November 2006) as a master image and generated 20 interferograms. The perpendicular baseline ranged from 43 m to 951 m, the temporal baseline ranged from 68 days to 1277 days, and selected the potential PS candidates with a coherence threshold of 0.67. For SBAS-InSAR, we selected the slant-range image (28 October 2008) as a super master image. To reduce the geometrical and temporal decorrelation, the threshold criteria with a maximum temporal baseline of 735 days and a maximum perpendicular baseline of 483 m were used, and then, 68 interferograms were generated. Figure 2 shows the time-baseline plot for the ENVISAT-ASAR images used for PS and SBAS-InSAR processing. A combination of the minimum cost flow (MCF) network [41] and Delauney 3D method [42] was employed for phase unwrapping with an unwrapping coherence threshold of 0.35. After that, a screening process of flattened, filtered interferograms and unwrapped phases for checking some unwanted behaviors and data problems, which were caused by strong orbit inaccuracy, non-coherent pairs, atmospheric artefacts, residual topography etc., and 12 interferometric pairs were discarded from further processing. For refinement and reflattening, the reference points where the unwrapped phase value close to zero and flat areas identified from a topographic map projected in the line of sight (LOS) direction were chosen [43]. A custom atmospheric filtering was performed with a low-pass spatial filter with a 1.2 km × 1.2 km window on each single acquisition, and a high-pass filter at 365 days on these preliminary results to recover the final and cleaned displacement time series. Finally, geocoding was done in the original satellite LOS direction with a pixel resolution of 25 m. The same software package used for D-InSAR was also used in the PS and SBAS-InSAR processing chain.
3.3. Pearson Correlation Coefficient and Root Mean Square Error
The deformation rate derived from different methods with respect to each pixel in major deformation areas were compared using the Pearson correlation coefficient (r) and the root mean square error (RMSE). During the estimation, we only considered the common valid pixels taken from the deformation map of three InSAR methods. The Pearson’s r is often measured as a correlation coefficient with 0 indicating no linear relationship between the variables, +1 indicating a perfect increasing linear relationship and vice versa [44].
where n is the total number of common valid pixels of the selected reference points, x and y ( and mean values) are the values of the pixels taken from the selected reference points.
The RMSE values can be used to compare the individual model performance to that of other predictive models; it is often used in the field of geosciences, where researchers use the RMSE for model errors and comparison [45,46,47].
where n is the total number of common valid pixels of the selected reference points, Xm,i and Xs,i are the deformation rate values of the reference points taken from the deformation map of two InSAR methods, respectively.
4. Results and Analysis
4.1. Results of D-InSAR Interferometry
The coherence is an indicator of InSAR data quality and significantly influences the accuracy of the phase in interferograms [48]. As shown in Figure 3, the mean coherence is lower (0.39) for the data pairs with long time intervals and relatively large perpendicular baselines (20 January 2007 and 10 December 2008, Bp = 643 m). Meanwhile, the mean coherence is higher (0.65) for the data pairs with short time intervals and relatively small perpendicular baselines (10 December 2008 and 25 January 2009, Bp = 472 m). Good quality interferograms were generated from these two data pairs (Figure 4); the interferogram with a relatively small perpendicular baseline shows good coherence (Figure 3b), but no significant land deformation was found (Figure 4b). It is due to the short interval of time, which was 46 days. Therefore, we used the differential interferogram generated from the large perpendicular baseline pair, which showed clear deformation at two sites in the study area. These areas are indicated by blue dashed circles in Figure 4a. Although the small time baseline image pair was not used for final displacement map generation, it served as a good example of showing the difference of different perpendicular baseline image pairs, and, provided useful clues for further data selection and analyzes.
In general, the sequence of color fringes in the interferogram can be used to determine whether uplift or subsidence has taken place. We chose two close-up views of typical fringe maps (Figure 4c,d) from these two deformation sites for further analysis. The ALOS-PALSAR data were in the ascending orbit in which observations were made from the west. The sequence of color fringes in these two figure shows a decrease in range (yellow–purple–blue), which denotes that the ground objective moves closer to the satellite. In this study, we did not consider the horizontal movement, and thus, it corresponded to an uplift. During the process of extracting the ground displacement, we unwrapped the interferogram in order to solve the 2π ambiguity, and corrected the satellite orbit inaccuracy and phase offset using the collected external ground control points (GCPs). The final geocoded ground displacement map in the LOS direction is shown in Figure 5. The figure shows that two sites in the north-eastern part of the city exhibit clear indications of land uplift, and the maximum LOS displacement was approximately 13 cm in the study period.
4.2. Results of PS and SBAS-InSAR Interferometry
4.2.1. Interferometric Phase Change over Time
The interferometric phase is useful for analyzing the ground deformation trends over time in the LOS direction [49]. The time series interferograms generated from each data pair from (a) to (k) are shown in Figure 6. Generally, we could roughly identify the deformation areas in the large scale by analyzing the fringe density in differential interferograms. In addition, the sequence of color fringes in the interferogram can be a good indicator of whether uplift or subsidence has taken place. Figure 6a shows a typical interferometric phase image, in which the fringes clearly show the areas with a high deformation rate. The ENVISAT-ASAR data were in the descending orbit and observations were made from the east. As shown in Figure 6b, the sequence of color fringes shows a decrease in range (yellow–purple–blue), which denotes that the ground objective moves closer to the satellite. In this study, we did not consider the horizontal movement, and thus, it corresponded to an uplift. To identify and highlight the time series of ground deformation in the period of 30 September 2003 to 15 June 2010, we selected a main deformation area, where the location is highlighted in red dashed lines in Figure 6a. As shown in the figure, a slight deformation can be observed from the earliest image in September 2003 to September 2006 (Figure 6c–f), the rate of deformation increases significantly from November 2007 (Figure 6g–k), and a pattern of rebound, expanding in area and increasing in quantity, can be observed during this period.
4.2.2. Mean Deformation Velocities and Temporal Evolutions
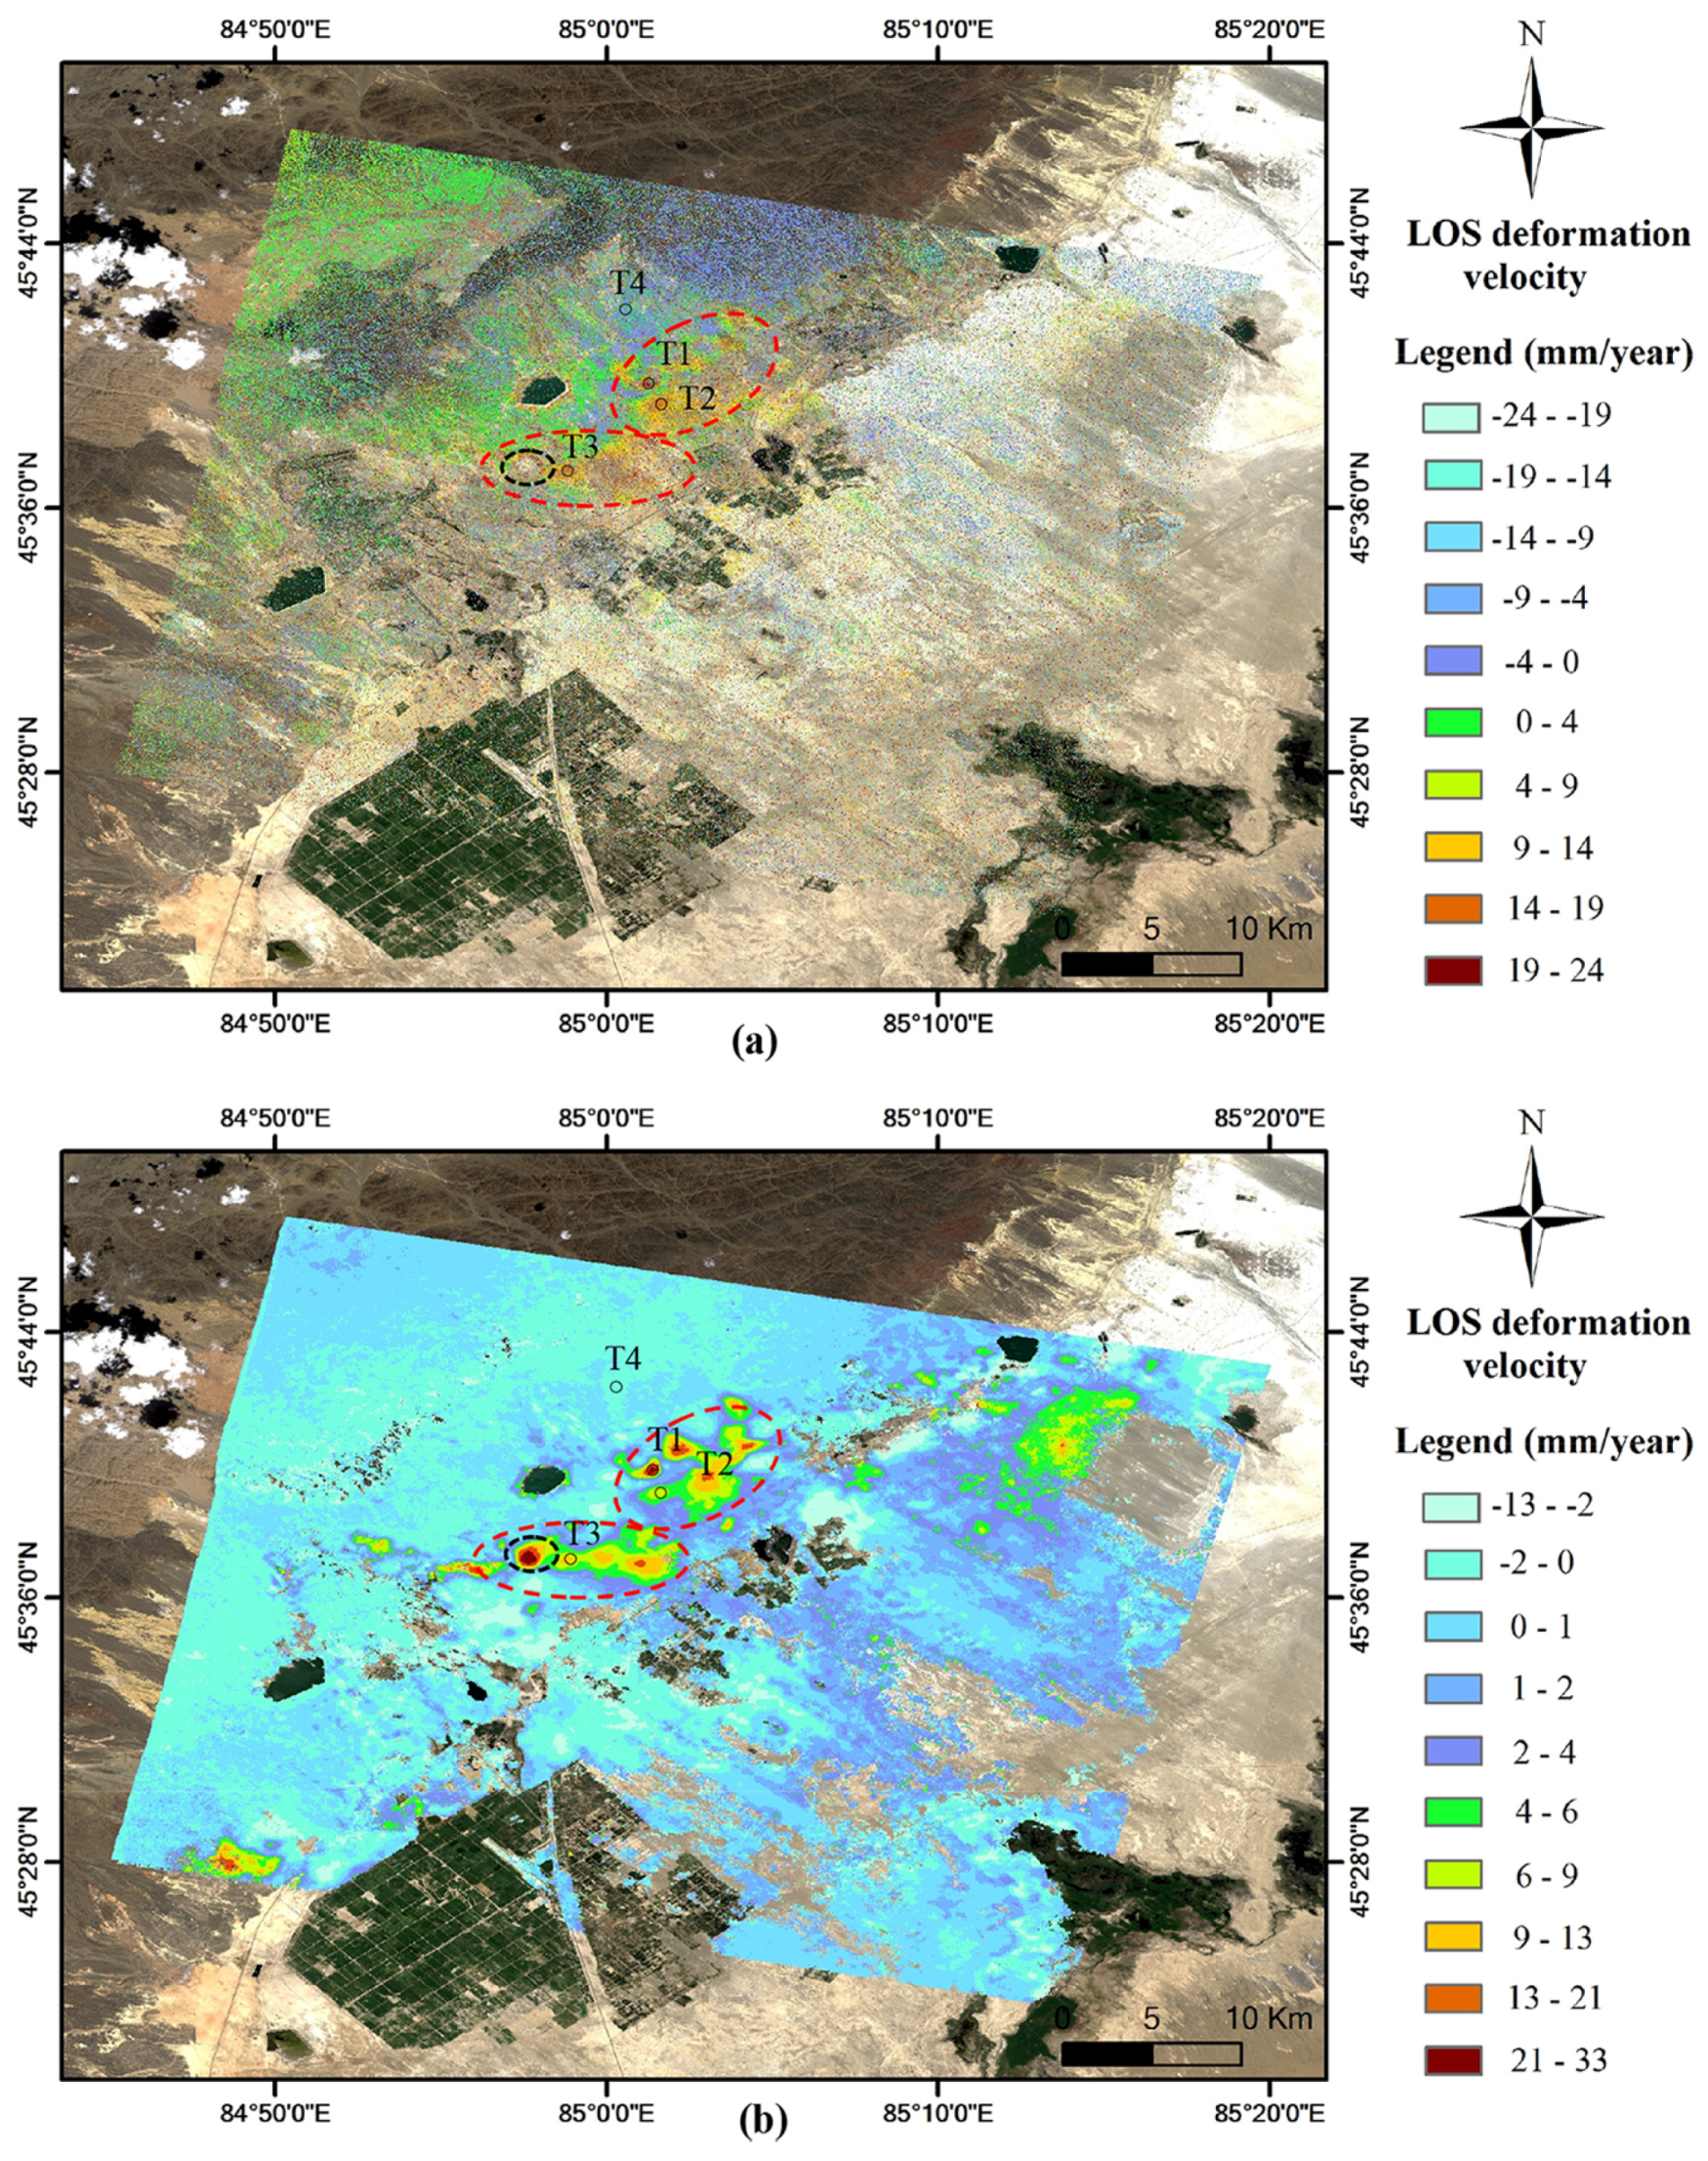
Analyses of the PS and SBAS-InSAR results from the ENVISAT-ASAR dataset show that significant surface uplift occurred over or near the oilfields over the study period (Figure 7). The spatial distributions and mean displacement velocity for the period from 30 September 2003 to 15 June 2010 are shown in Figure 7a (for PS-InSAR), Figure 7b (for SBAS-InSAR). Temporal decorrelation of bare land and agricultural areas were excluded by the coherence threshold. Major uplifted areas were highlighted by both PS and SBAS-InSAR methods and indicated in red dashed circles in Figure 7a,b. Dense PS points were detected around the reservoir area, whereas the distributions of PS points were sparse in other areas. The maximum deformation velocity was approximately 24 mm/year. The locations and the mean deformation velocity detected by the SBAS-InSAR technique were much clearer than the PS-InSAR results (Figure 7b). SBAS-InSAR also revealed a major uplift area that was not detected using the PS-InSAR, as indicated by the black dashed circles in Figure 7a,b. The estimated maximum deformation velocity was approximately 33 mm/year in the LOS direction.
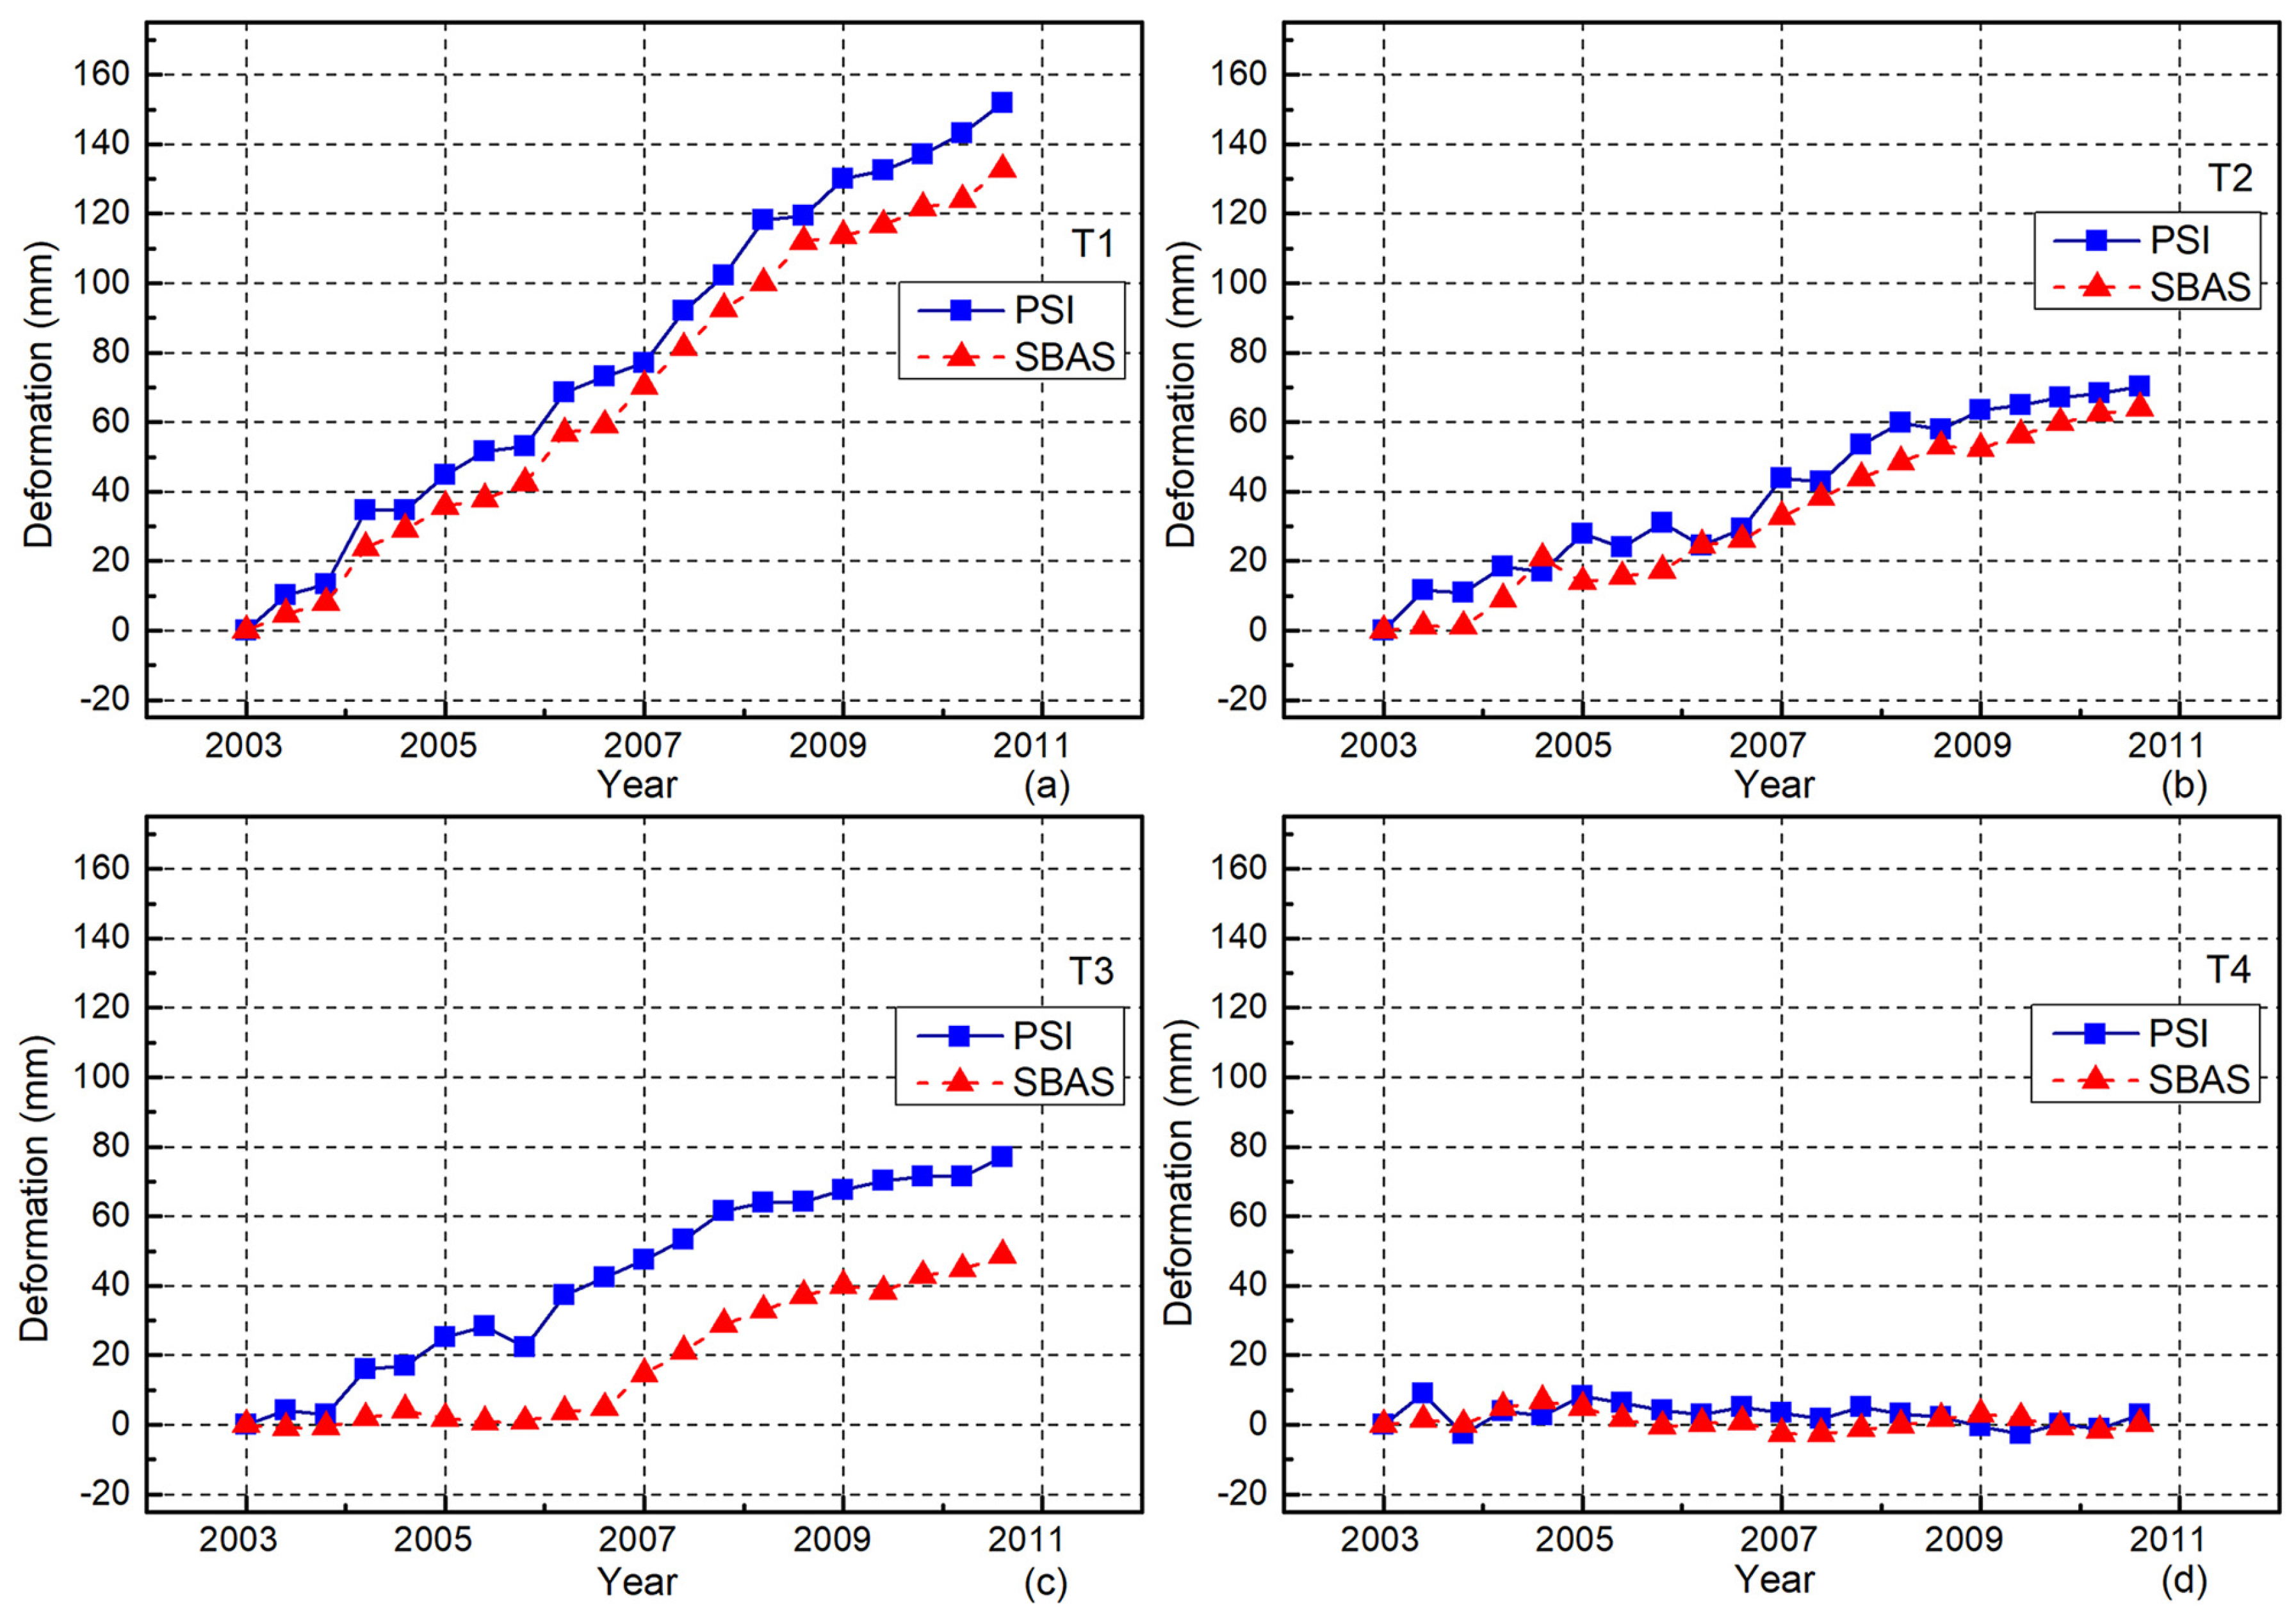
Figure 8 shows the PS and SBAS-InSAR measured displacements over time, from 30 September 2003 to 15 June 2010, for four specific points located within the major deformation area (Figure 7). Three typical reference points were selected with the induced deformation as T1–T3 and one stable reference point as T4, which are shown in Figure 7a,b. Figure 8 illustrates that both PS-InSAR and SBAS-InSAR methods have good agreement in the deformation trend, with the time evolutions of each selected pixel sharing similar characteristics, such as increasing uplift. Despite a notable difference in values for T3, both PS-InSAR and SBAS-InSAR show a trend of consistently increasing deformation. The point T1 shows the largest deformation with the maximum uplift of 151.8 mm in 2010 in the LOS direction. The activity of the wastewater injection of the area may be responsible for the continuing land uplift.
5. Comparison and Discussion
Quantitative accuracy assessment is essential for evaluating the usability and reliability of InSAR-derived deformation [49]. However, except for the one GPS station, no other ground measurements are available, and thus, an alternative approach was used to perform cross-validation among the results from the three InSAR methods.
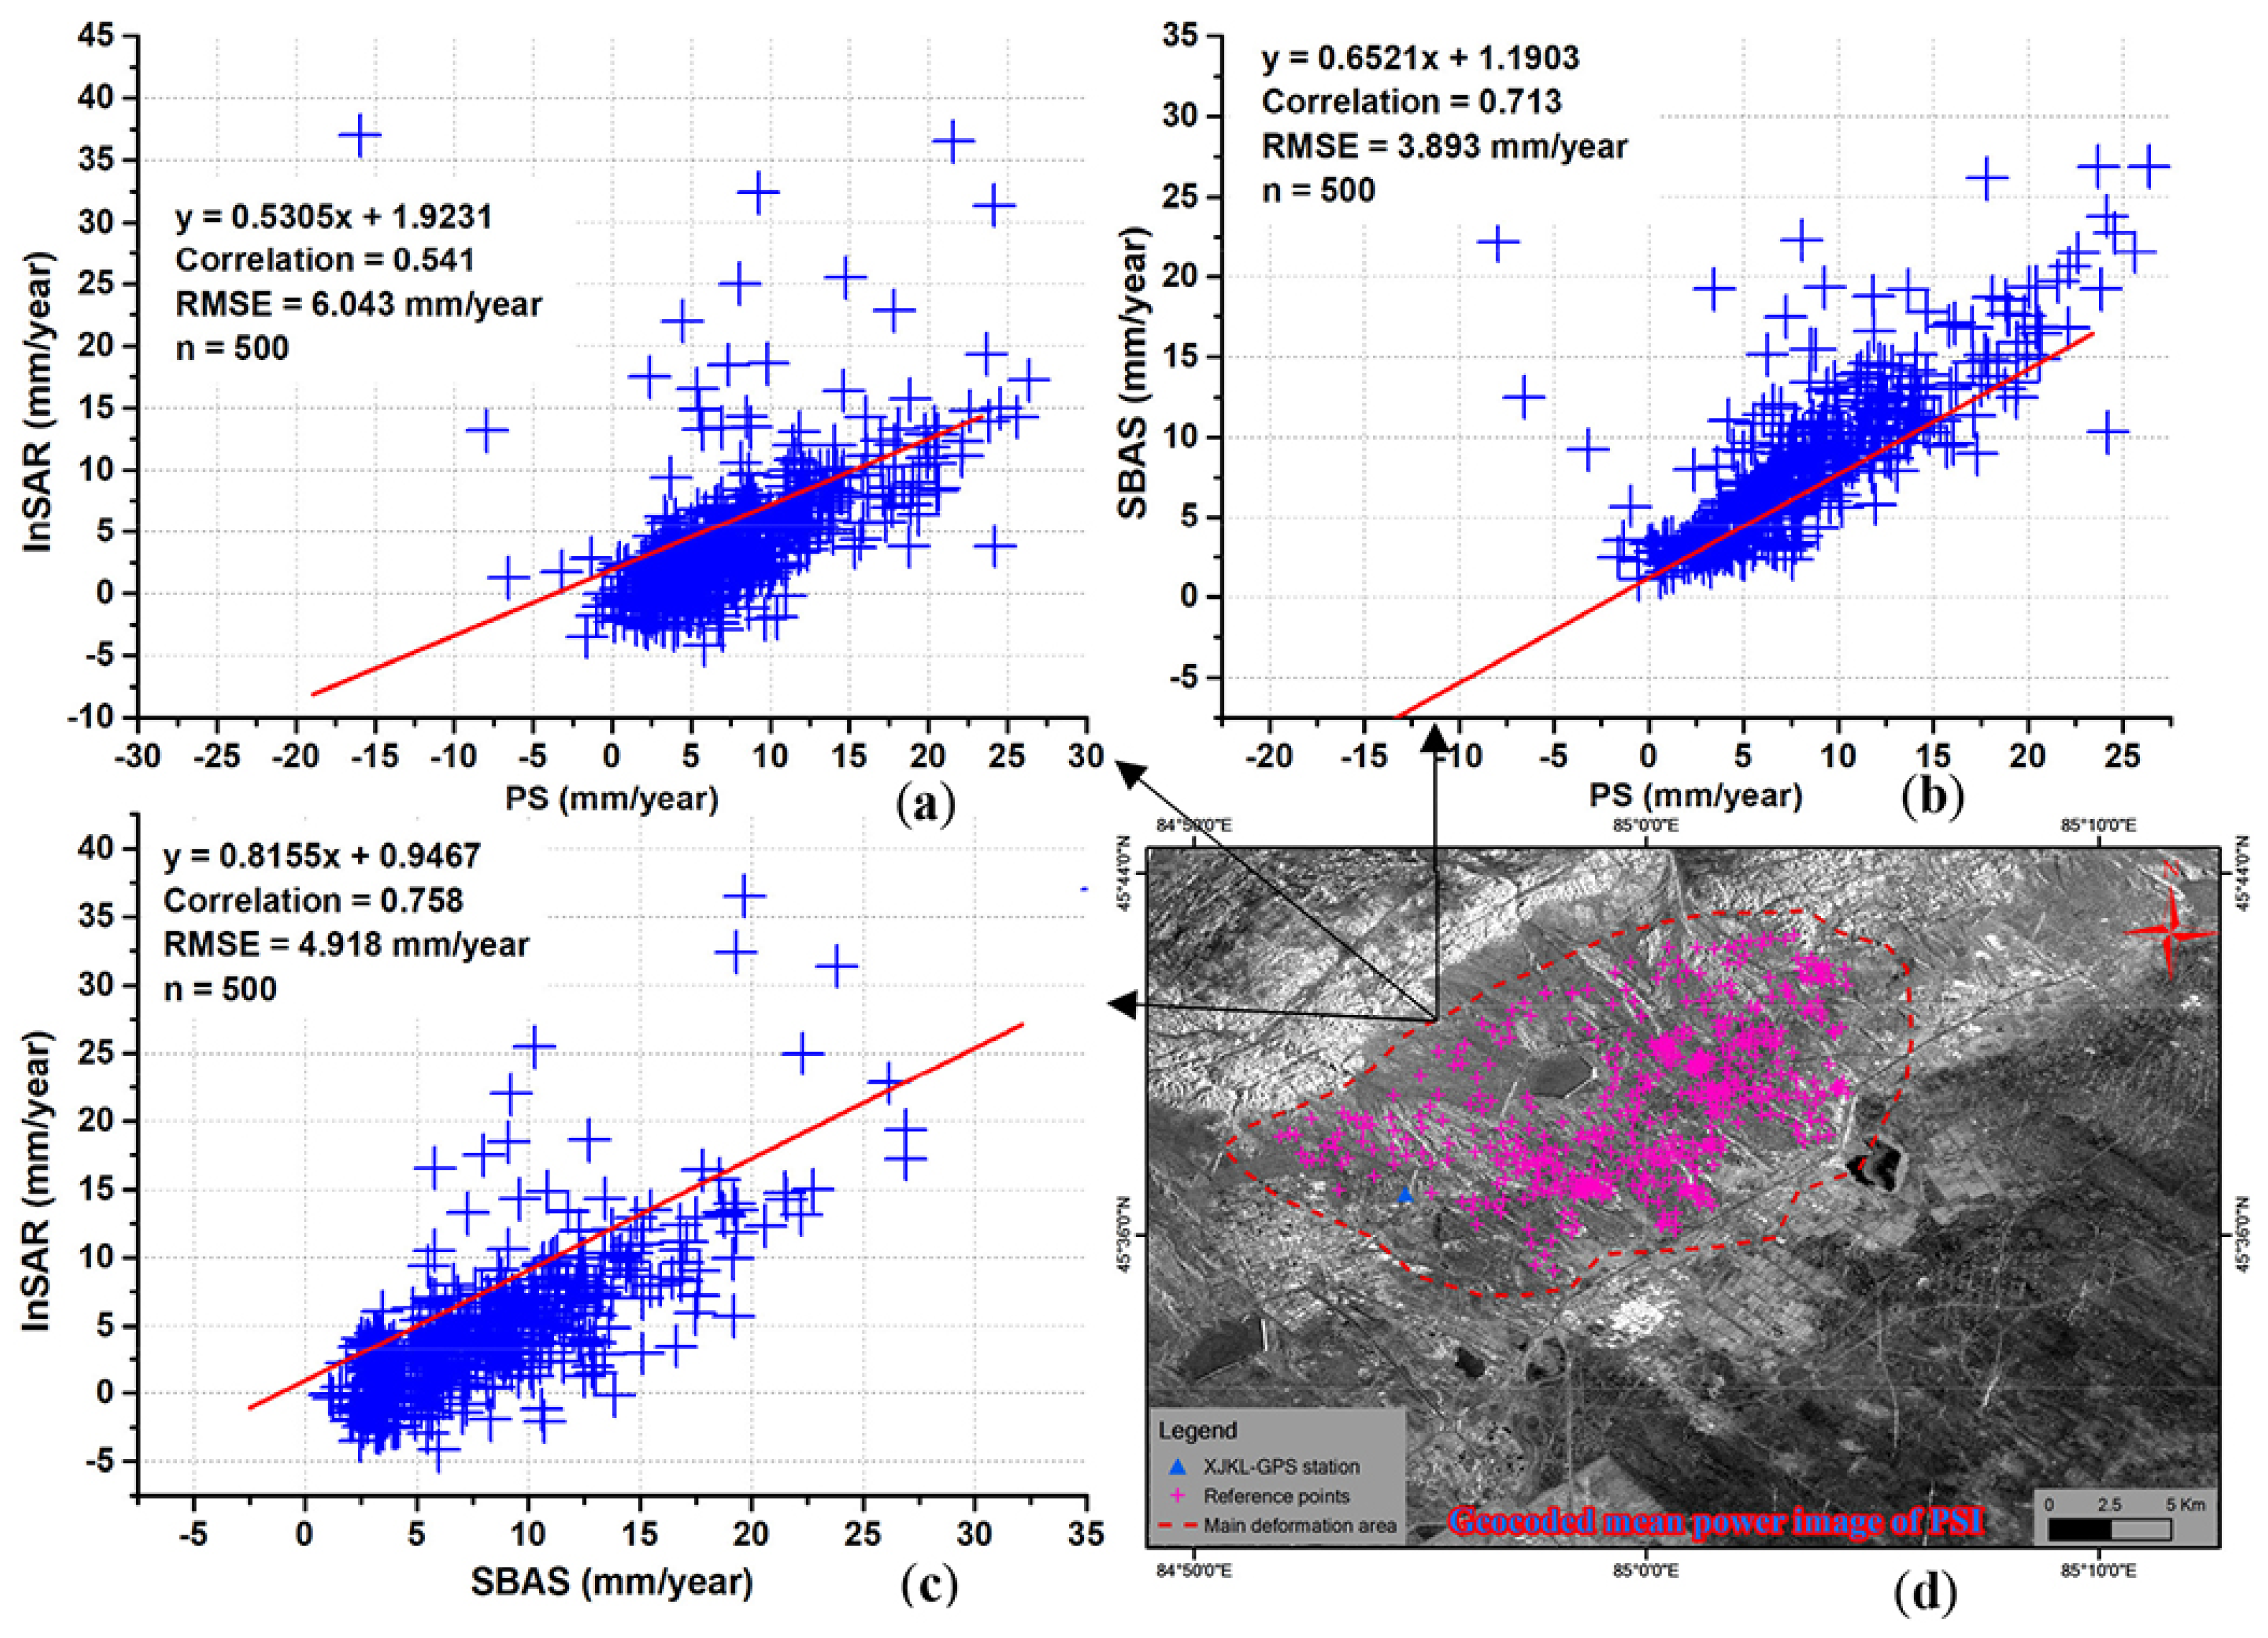
To compare the deformation results obtained from the D-InSAR, PS and SBAS-InSAR methods, the mean deformation velocity of D-InSAR processing results was calculated by averaging the displacement values. As explained in previous Section 4.2.1, the rate of deformation in 2003–2006 is different from that in 2006–2010, and the D-InSAR derived deformation is obtained from the data in 2007–2009. That is, the D-InSAR results are only comparable to the deformation rate in 2006–2010. Therefore, the deformation rate of PS and SBAS-InSAR in 2006–2010 are considered for further comparison. We selected 500 reference points from the PS-InSAR results in the study area, including both the stable and deformed areas (Figure 9d). The LOS displacement velocity for these points was plotted compared with the SBAS and D-InSAR results, and the correlation coefficients were calculated. The results show good agreement between the SBAS and D-InSAR methods with a correlation of 0.75, and the RMSE was approximately 4.918 mm/year. However, the results from the D-InSAR and PS-InSAR were not as comparable, with a low correlation of 0.54 and an RMSE of 6.043 mm/year. However, all the three methods could identify the main deformation areas, except for one of the main deformation areas in PS-InSAR indicated in black circles in Figure 7a. This may be caused by low backscatter in the wide non-urban land use, where the sufficient number of PS points could not be detected in the PS-InSAR processing.
Although the XJKL is the only GPS station located within the study area and is insufficient to measure and represent the entire deformation area, it provides a means of assessing the accuracy of the InSAR data and methods used in this study. The deformation rate at the XJKL continuous GPS station was 9.6 mm/year, while the D-InSAR and SBAS-InSAR derived deformation rates were 1.2 and 7.4 mm/year, respectively. No displacement was found in the PS-InSAR measurement results. In addition, the identified deformation area and the temporal evolution pattern in this study agree well with the results obtained by Ji et al. [36]. In our study, the maximum deformations from 2003 to 2010 for SBAS and PS-InSAR were approximately 22.7 cm and 17.8 cm, respectively, and the results of D-InSAR was 13 cm for the period 2007 to 2009, which are comparable to the previous research results in which the maximum uplift magnitude was reported as 20 cm over the years 2006 to 2010 [36]. The comparison result shows slight differences between the two results, which might be caused by the differences in the deformation trend in the different periods, rather than any deficiencies in one method over the other. As shown in Figure 6, the deformation was evident and more accelerated from 2006 to 2010 than during the previous time of 2003 to 2006.
6. Conclusions
To assess the degree of deformation in the oilfields of Karamay, Xinjiang, China, the D-InSAR technique was applied to ALOS-PALSAR data and the PS-InSAR and SBAS-InSAR to the ENVISAT-ASAR dataset. The results showed that all the three methods could provide useful information for identifying the boundaries of deformation and revealed two areas of land uplift near the oilfield. The maximum deformation velocity was estimated to be 33 mm/year. As previous research suggests, the subsurface water injection used to enhance oil recovery is the likely cause of this land uplift. The comparison of results from each of the three methods indicates that the correlation of the SBAS-InSAR and D-InSAR results is higher than that of the PS-InSAR and D-InSAR results. For this study area, the SBAS-InSAR method was found to be more robust than the PS-InSAR method. Future investigation can improve the findings of this study by utilizing GPS base stations in the high deformation areas and monitoring long-time land deformation in combination with more accurate and improved satellite data.
Acknowledgments
We would like to thank the JAXA for providing the ALOS-PALSAR data and the ESA for providing the ENVISAT-ASAR data. This research was supported by the National Natural Science Foundation of China (Grant No.41361043 and 41661037). We would also like to thank the editor and the two anonymous reviewers for their critical and insightful comments that greatly helped to improve the quality of this manuscript.
Author Contributions
Yusupujiang Aimaiti conceived the work, processed the SAR data and wrote the paper, Alimujiang Kasimu provided auxiliary data sources and revised the manuscript, Fumio Yamazaki and Wen Liu guided during the data analyzes and revised the manuscript, and Fumio Yamazaki supervised the research.
Conflicts of Interest
The authors declare no conflict of interest.
References
- Prati, C.; Ferretti, A.; Perissin, D. Recent advances on surface ground deformation measurement by means of repeated space-borne SAR observations. J. Geodyn. 2010, 49, 161–170. [Google Scholar] [CrossRef]
- Osmanoğlu, B.; Sunar, F.; Wdowinski, S.; Cabral-Cano, E. Time series analysis of InSAR data: Methods and trends. ISPRS J. Photogramm. Remote Sens. 2016, 115, 90–102. [Google Scholar] [CrossRef]
- Zhang, L.; Ding, X.; Lu, Z. Ground deformation mapping by fusion of multi-temporal interferometric synthetic aperture radar images: A review. Int. J. Image Data Fusion 2015, 6, 289–313. [Google Scholar] [CrossRef]
- Ferretti, A.; Prati, C.; Rocca, F. Nonlinear subsidence rate estimation using permanent scatterers in differential SAR interferometry. IEEE Trans. Geosci. Remote Sens. 2000, 38, 2202–2212. [Google Scholar] [CrossRef]
- Ferretti, A.; Prati, C.; Rocca, F. Permanent scatterers in SAR interferometry. IEEE Trans. Geosci. Remote Sens. 2001, 39, 8–20. [Google Scholar] [CrossRef]
- Berardino, P.; Fornaro, G.; Lanari, R.; Sansosti, E. A new algorithm for surface deformation monitoring based on small baseline differential SAR interferograms. IEEE Trans. Geosci. Remote Sens. 2002, 40, 2375–2383. [Google Scholar] [CrossRef]
- Costantini, M.; Falco, S.; Malvarosa, F.; Minati, F. A new method for identification and analysis of persistent scatterers in series of SAR images. In Proceedings of the IEEE International Geoscience and Remote Sensing Symposium, Boston, MA, USA, 7–11 July 2008; Volume 2, p. II-449. [Google Scholar]
- Perissin, D.; Wang, T. Repeat-pass SAR interferometry with partially coherent targets. IEEE Trans. Geosci. Remote Sens. 2012, 50, 271–280. [Google Scholar] [CrossRef]
- Crosetto, M.; Biescas, E.; Duro, J.; Closa, J.; Arnaud, A. Generation of advanced ERS and Envisat interferometric SAR products using the stable point network technique. Photogramm. Eng. Remote Sens. 2008, 74, 443–450. [Google Scholar] [CrossRef]
- Ferretti, A.; Fumagalli, A.; Novali, F.; Prati, C.; Rocca, F.; Rucci, A. A new algorithm for processing interferometric data-stacks: SqueeSAR. IEEE Trans. Geosci. Remote Sens. 2011, 49, 3460–3470. [Google Scholar] [CrossRef]
- Hooper, A. A multitemporal InSAR method incorporating both persistent scatterer and small baseline approaches. Geophys. Res. Lett. 2008, 35, L16302. [Google Scholar] [CrossRef]
- Zhang, L.; Ding, X.L.; Lu, Z. Modeling PSInSAR time series without phase unwrapping. IEEE Trans. Geosci. Remote Sens. 2011, 49, 547–556. [Google Scholar] [CrossRef]
- Sowter, A.; Bateson, L.; Strange, P.; Ambrose, K.; Syafiudin, M. DInSAR estimation of land motion using intermittent coherence with application to the South Derbyshire and Leicestershire coalfield. Remote Sens. Lett. 2013, 4, 979–987. [Google Scholar] [CrossRef]
- Liu, W.; Yamazaki, F.; Matsuoka, M.; Nonaka, T.; Sasagawa, T. Estimation of three-dimensional crustal movements in the 2011 Tohoku-Oki, Japan, earthquake from TerraSAR-X intensity images. Nat. Hazards Earth Syst. Sci. 2015, 15, 637–645. [Google Scholar] [CrossRef]
- Ganas, A.; Elias, P.; Bozionelos, G.; Papathanassiou, G.; Avallone, A.; Papastergios, A.; Valkaniotis, S.; Parcharidis, I.; Briole, P. Coseismic deformation, field observations and seismic fault of the 17 November 2015 M = 6.5, Lefkada Island, Greece earthquake. Tectonophysics 2016, 687, 210–222. [Google Scholar] [CrossRef]
- Samsonov, S.; d’Oreye, N.; Smets, B. Ground deformation associated with post-mining activity at the French–German border revealed by novel InSAR time series method. Int. J. Appl. Earth Obs. Geoinf. 2013, 23, 142–154. [Google Scholar] [CrossRef]
- Li, M.; Zhang, L.; Liao, M.; Shi, X. Detection of coal-mining-induced subsidence and mapping of the resulting deformation using time series of ALOS-PALSAR data. Remote Sens. Lett. 2016, 7, 855–864. [Google Scholar] [CrossRef]
- Chaussard, E.; Amelung, F.; Aoki, Y. Characterization of open and closed volcanic systems in Indonesia and Mexico using InSAR time series. J. Geophys. Res. 2013, 118, 3957–3969. [Google Scholar] [CrossRef]
- Jo, M.J.; Jung, H.S.; Won, J.S. Measurement of precise three-dimensional volcanic deformations via TerraSAR-X synthetic aperture radar interferometry. Remote Sens. Environ. 2017, 192, 228–237. [Google Scholar] [CrossRef]
- Calò, F.; Ardizzone, F.; Castaldo, R.; Lollino, P.; Tizzani, P.; Guzzetti, F.; Lanari, R.; Angeli, M.G.; Pontoni, F.; Manunta, M. Enhanced landslide investigations through advanced DInSAR techniques: The Ivancich case study, Assisi, Italy. Remote Sens. Environ. 2014, 142, 69–82. [Google Scholar] [CrossRef]
- Schulz, W.H.; Coe, J.A.; Ricci, P.P.; Smoczyk, G.M.; Shurtleff, B.L.; Panosky, J. Landslide kinematics and their potential controls from hourly to decadal timescales: Insights from integrating ground-based InSAR measurements with structural maps and long-term monitoring data. Geomorphology 2017, 285, 121–136. [Google Scholar] [CrossRef]
- Satyabala, S.P. Spatiotemporal variations in surface velocity of the Gangotri glacier, Garhwal Himalaya, India: Study using synthetic aperture radar data. Remote Sens. Environ. 2016, 181, 151–161. [Google Scholar] [CrossRef]
- Sánchez-Gámez, P.; Navarro, F.J. Glacier surface velocity retrieval using D-InSAR and offset tracking techniques applied to ascending and descending passes of Sentinel-1 data for southern Ellesmere ice caps, Canadian Arctic. Remote Sens. 2017, 9, 442–458. [Google Scholar] [CrossRef]
- Heimlich, C.; Gourmelen, N.; Masson, F.; Schmittbuhl, J.; Kim, S.W.; Azzola, J. Uplift around the geothermal power plant of Landau (Germany) as observed by InSAR monitoring. Geotherm. Energy 2015, 3, 1–12. [Google Scholar] [CrossRef]
- Yang, Q.; Zhao, W.; Dixon, T.H.; Amelung, F.; Han, W.S.; Li, P. InSAR monitoring of ground deformation due to CO2 injection at an enhanced oil recovery site, West Texas. Int. J. Greenh. Gas Control 2015, 41, 20–28. [Google Scholar] [CrossRef]
- Tamburini, A.; Bianchi, M.; Giannico, C.; Novali, F. Retrieving surface deformation by PSInSAR™ technology: A powerful tool in reservoir monitoring. Int. J. Greenh. Gas Control 2010, 4, 928–937. [Google Scholar] [CrossRef]
- Sun, H.; Zhang, Q.; Zhao, C.; Yang, C.; Sun, Q.; Chen, W. Monitoring land subsidence in the southern part of the lower Liaohe plain, China with a multi-track PS-InSAR technique. Remote Sens. Environ. 2017, 188, 73–84. [Google Scholar] [CrossRef]
- Shirzaei, M.; Ellsworth, W.L.; Tiampo, K.F.; González, P.J.; Manga, M. Surface uplift and time-dependent seismic hazard due to fluid injection in eastern Texas. Science 2016, 353, 1416–1419. [Google Scholar] [CrossRef] [PubMed]
- Khakim, M.Y.; Tsuji, T.; Matsuoka, T. Geomechanical modeling for InSAR-derived surface deformation at steam-injection oil sand fields. J. Pet. Sci. Eng. 2012, 96, 152–161. [Google Scholar] [CrossRef]
- Guéguen, Y.; Deffontaines, B.; Fruneau, B.; Al Heib, M.; De Michele, M.; Raucoules, D.; Guise, Y.; Planchenault, J. Monitoring residual mining subsidence of Nord/Pas-de-Calais coal basin from differential and Persistent Scatterer Interferometry (Northern France). J. Appl. Geophys. 2009, 69, 24–34. [Google Scholar] [CrossRef]
- Grzovic, M.; Ghulam, A. Evaluation of land subsidence from underground coal mining using TimeSAR (SBAS and PSI) in Springfield, Illinois, USA. Nat. Hazards 2015, 79, 1739–1751. [Google Scholar] [CrossRef]
- Guglielmi, Y.; Cappa, F.; Avouac, J.P.; Henry, P.; Elsworth, D. Seismicity triggered by fluid injection–induced aseismic slip. Science 2015, 348, 1224–1226. [Google Scholar] [CrossRef] [PubMed] [Green Version]
- Yuan, X.; Dou, S.; Zhang, J.; Chen, S.; Xu, B. Consideration of geomechanics for In-situ bitumen recovery in Xinjiang, China. SPE-165414-MS. In Proceedings of the SPE Heavy Oil Conference-Canada, Calgary, AB, Canada, 11–13 June 2013; Available online: http://dx.doi.org/10.2118/165414-MS (accessed on 29 July 2017).
- Li, X.; Li, W.; Gao, B.; Yang, D. Study on subsurface water injection in Qizhong area of Karamay oilfield. Xinjiang Oil Gas 2012, 8, 57–59. (In Chinese) [Google Scholar]
- Pang, P. The first large oil field in China-Karamay oil field. J. Univ. Pet. China 2001, 17, 29–32. [Google Scholar]
- Ji, L.; Zhang, Y.; Wang, Q.; Xin, Y.; Li, J. Detecting land uplift associated with enhanced oil recovery using InSAR in the Karamay oil field, Xinjiang, China. Int. J. Remote Sens. 2016, 37, 1527–1540. [Google Scholar] [CrossRef]
- Pan, F.; Tian, C.; Shao, F.; Zhou, W.; Chen, F. Evaluation of ecological sensitivity in Karamay, Xinjiang, China. J. Geogr. Sci. 2012, 22, 329–345. [Google Scholar] [CrossRef]
- Rosen, P.A.; Hensley, S.; Joughin, I.R.; Li, F.K.; Madsen, S.N.; Rodriguez, E.; Goldstein, R.M. Synthetic aperture radar interferometry. Proc. IEEE 2000, 88, 333–382. [Google Scholar] [CrossRef]
- Goldstein, R.M.; Werner, C.L. Radar interferogram filtering for geophysical applications. Geophys. Res. Lett. 1998, 25, 4035–4038. [Google Scholar] [CrossRef]
- Hooper, A.; Zebker, H.; Segall, P.; Kampes, B. A new method for measuring deformation on volcanoes and other natural terrains using InSAR persistent scatterers. Geophys. Res. Lett. 2004, 31, L23611. [Google Scholar] [CrossRef]
- Costantini, M. A novel phase unwrapping method based on network programming. IEEE Trans. Geosci. Remote Sens. 1998, 36, 813–821. [Google Scholar] [CrossRef]
- Hooper, A.; Zebker, H.A. Phase unwrapping in three dimensions with application to InSAR time series. JOSA A 2007, 24, 2737–2747. [Google Scholar] [CrossRef] [PubMed]
- Abir, I.A.; Khan, S.D.; Ghulam, A.; Tariq, S.; Shah, M.T. Active tectonics of western Potwar Plateau–Salt Range, northern Pakistan from InSAR observations and seismic imaging. Remote Sens. Environ. 2015, 168, 265–275. [Google Scholar] [CrossRef]
- Lawrence, I.; Lin, K. A concordance correlation coefficient to evaluate reproducibility. Biometrics 1989, 45, 255–268. [Google Scholar]
- McKeen, S.; Wilczak, J.; Grell, G.; Djalalova, I.; Peckham, S.; Hsie, E.Y.; Gong, W.; Bouchet, V.; Menard, S.; Moffet, R.; et al. Assessment of an ensemble of seven real-time ozone forecasts over eastern North America during the summer of 2004. J. Geophys. Res. 2005, 110, D21. [Google Scholar] [CrossRef]
- Chatterjee, A.; Engelen, R.J.; Kawa, S.R.; Sweeney, C.; Michalak, A.M. Background error covariance estimation for atmospheric CO2 data assimilation. J. Geophys. Res. 2013, 118, 10140–10154. [Google Scholar]
- Du, Z.; Ge, L.; Li, X.; Ng, A.H. Subsidence monitoring over the Southern Coalfield, Australia using both L-Band and C-Band SAR time series analysis. Remote Sens. 2016, 8, 543–558. [Google Scholar] [CrossRef]
- Zou, W.; Li, Y.; Li, Z.; Ding, X. Improvement of the Accuracy of InSAR Image Co-Registration Based On Tie Points–A Review. Sensors 2009, 9, 1259–1281. [Google Scholar] [CrossRef] [PubMed] [Green Version]
- Tantianuparp, P.; Shi, X.; Zhang, L.; Balz, T.; Liao, M. Characterization of landslide deformations in three gorges area using multiple InSAR data stacks. Remote Sens. 2013, 5, 2704–2719. [Google Scholar] [CrossRef]
Figure 1.
(a) Geographic location of the study area; (b) Administrative districts of the study area superimposed on the topographic map; (c) ALOS-Advanced Visible and Near Infrared Radiometer type 2 (AVNIR-2) false color composite image of the study area on 15 July 2008. The red and blue dashed lines represent the coverage of ENVISAT-ASAR and ALOS-PALSAR data sets. ALOS: Advanced Land Observing Satellite; ENVISAT: Environmental Satellite; ASAR: Advanced Synthetic Aperture Radar; PALSAR: Phased Array L-band Synthetic Aperture Radar.
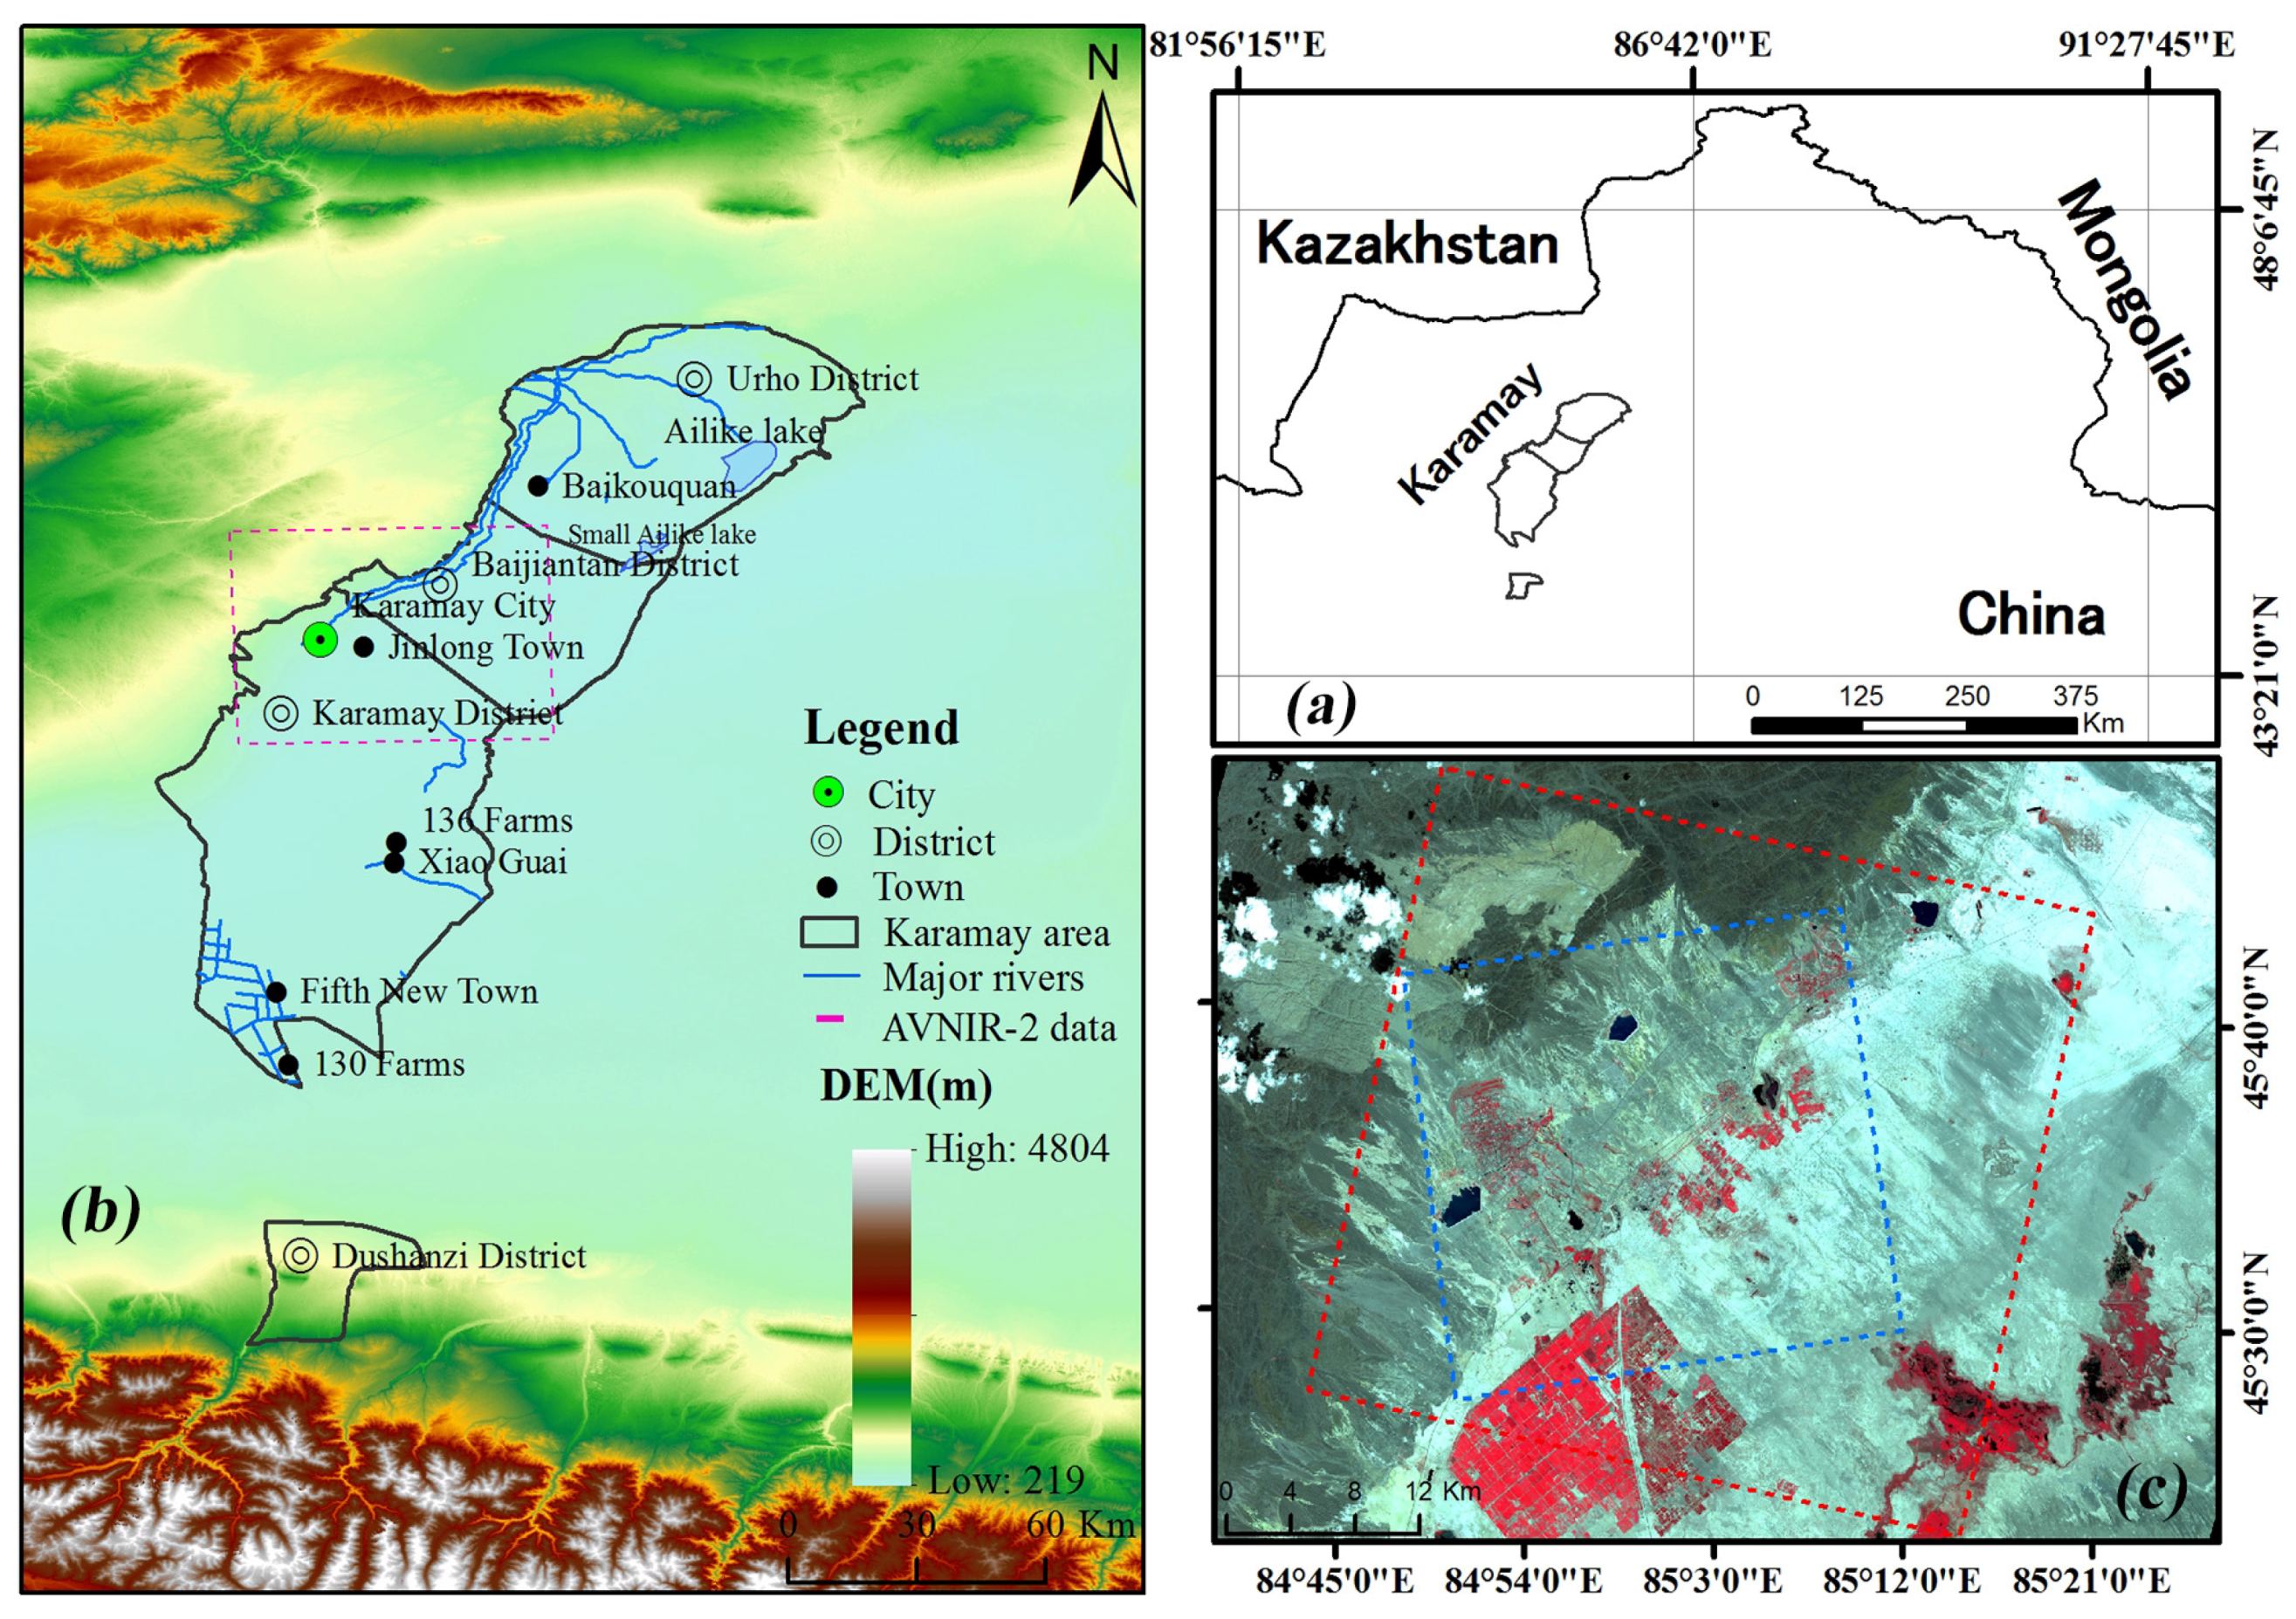
Figure 2.
Perpendicular baseline variations for both PS and SBAS-InSAR interferograms. Green diamonds represent selected interferogram pairs, and the yellow diamonds represent the selected master image of PS (left side: 28 November 2006) and SBAS (right side: 28 October 2008). PS: Persistent Scatterer; SBAS-InSAR: Small Baseline Subset-Interferometric Synthetic Aperture Radar.

Figure 3.
Coherence images of the interferograms generated from the data pair (a) (20 January 2007 and 10 December 2008, Bp = 643 m) and (b) (10 December 2008 and 25 January 2009, Bp = 472 m).
Figure 3.
Coherence images of the interferograms generated from the data pair (a) (20 January 2007 and 10 December 2008, Bp = 643 m) and (b) (10 December 2008 and 25 January 2009, Bp = 472 m).
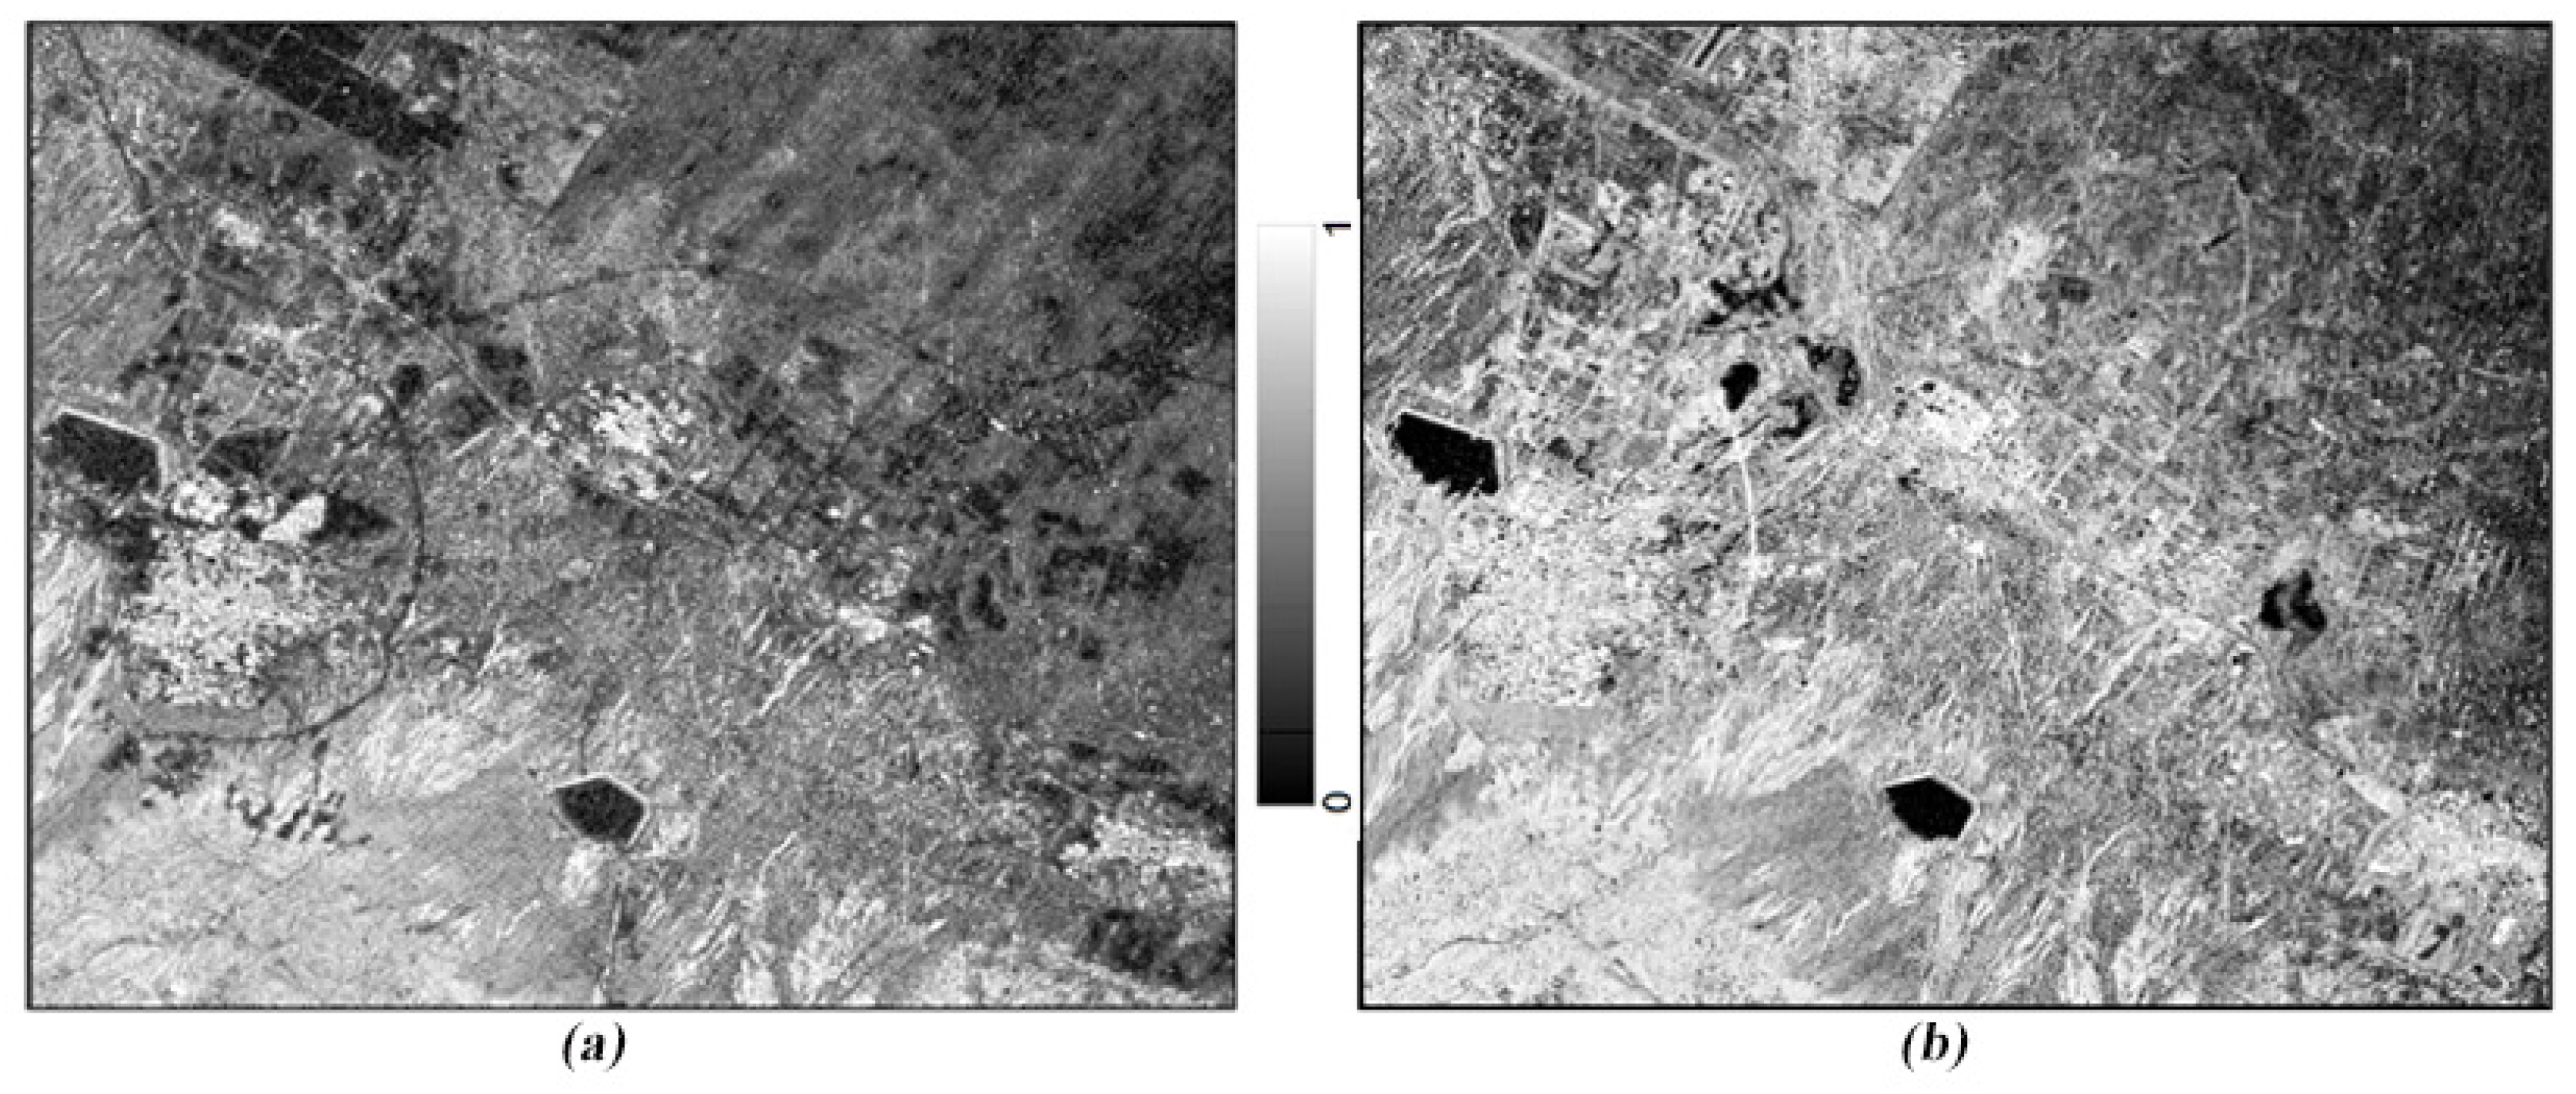
Figure 4.
Differential interferograms generated from the data pair (a) (20 January 2007 and 10 December 2008, Bp = 643 m) and (b) (10 December 2008 and 25 January 2009, Bp = 472 m) after the removal of topographic phase and noise filtering; (c,d) are the close-up view of a typical fringe maps, where the locations are indicated by the black dashed lines in (a).
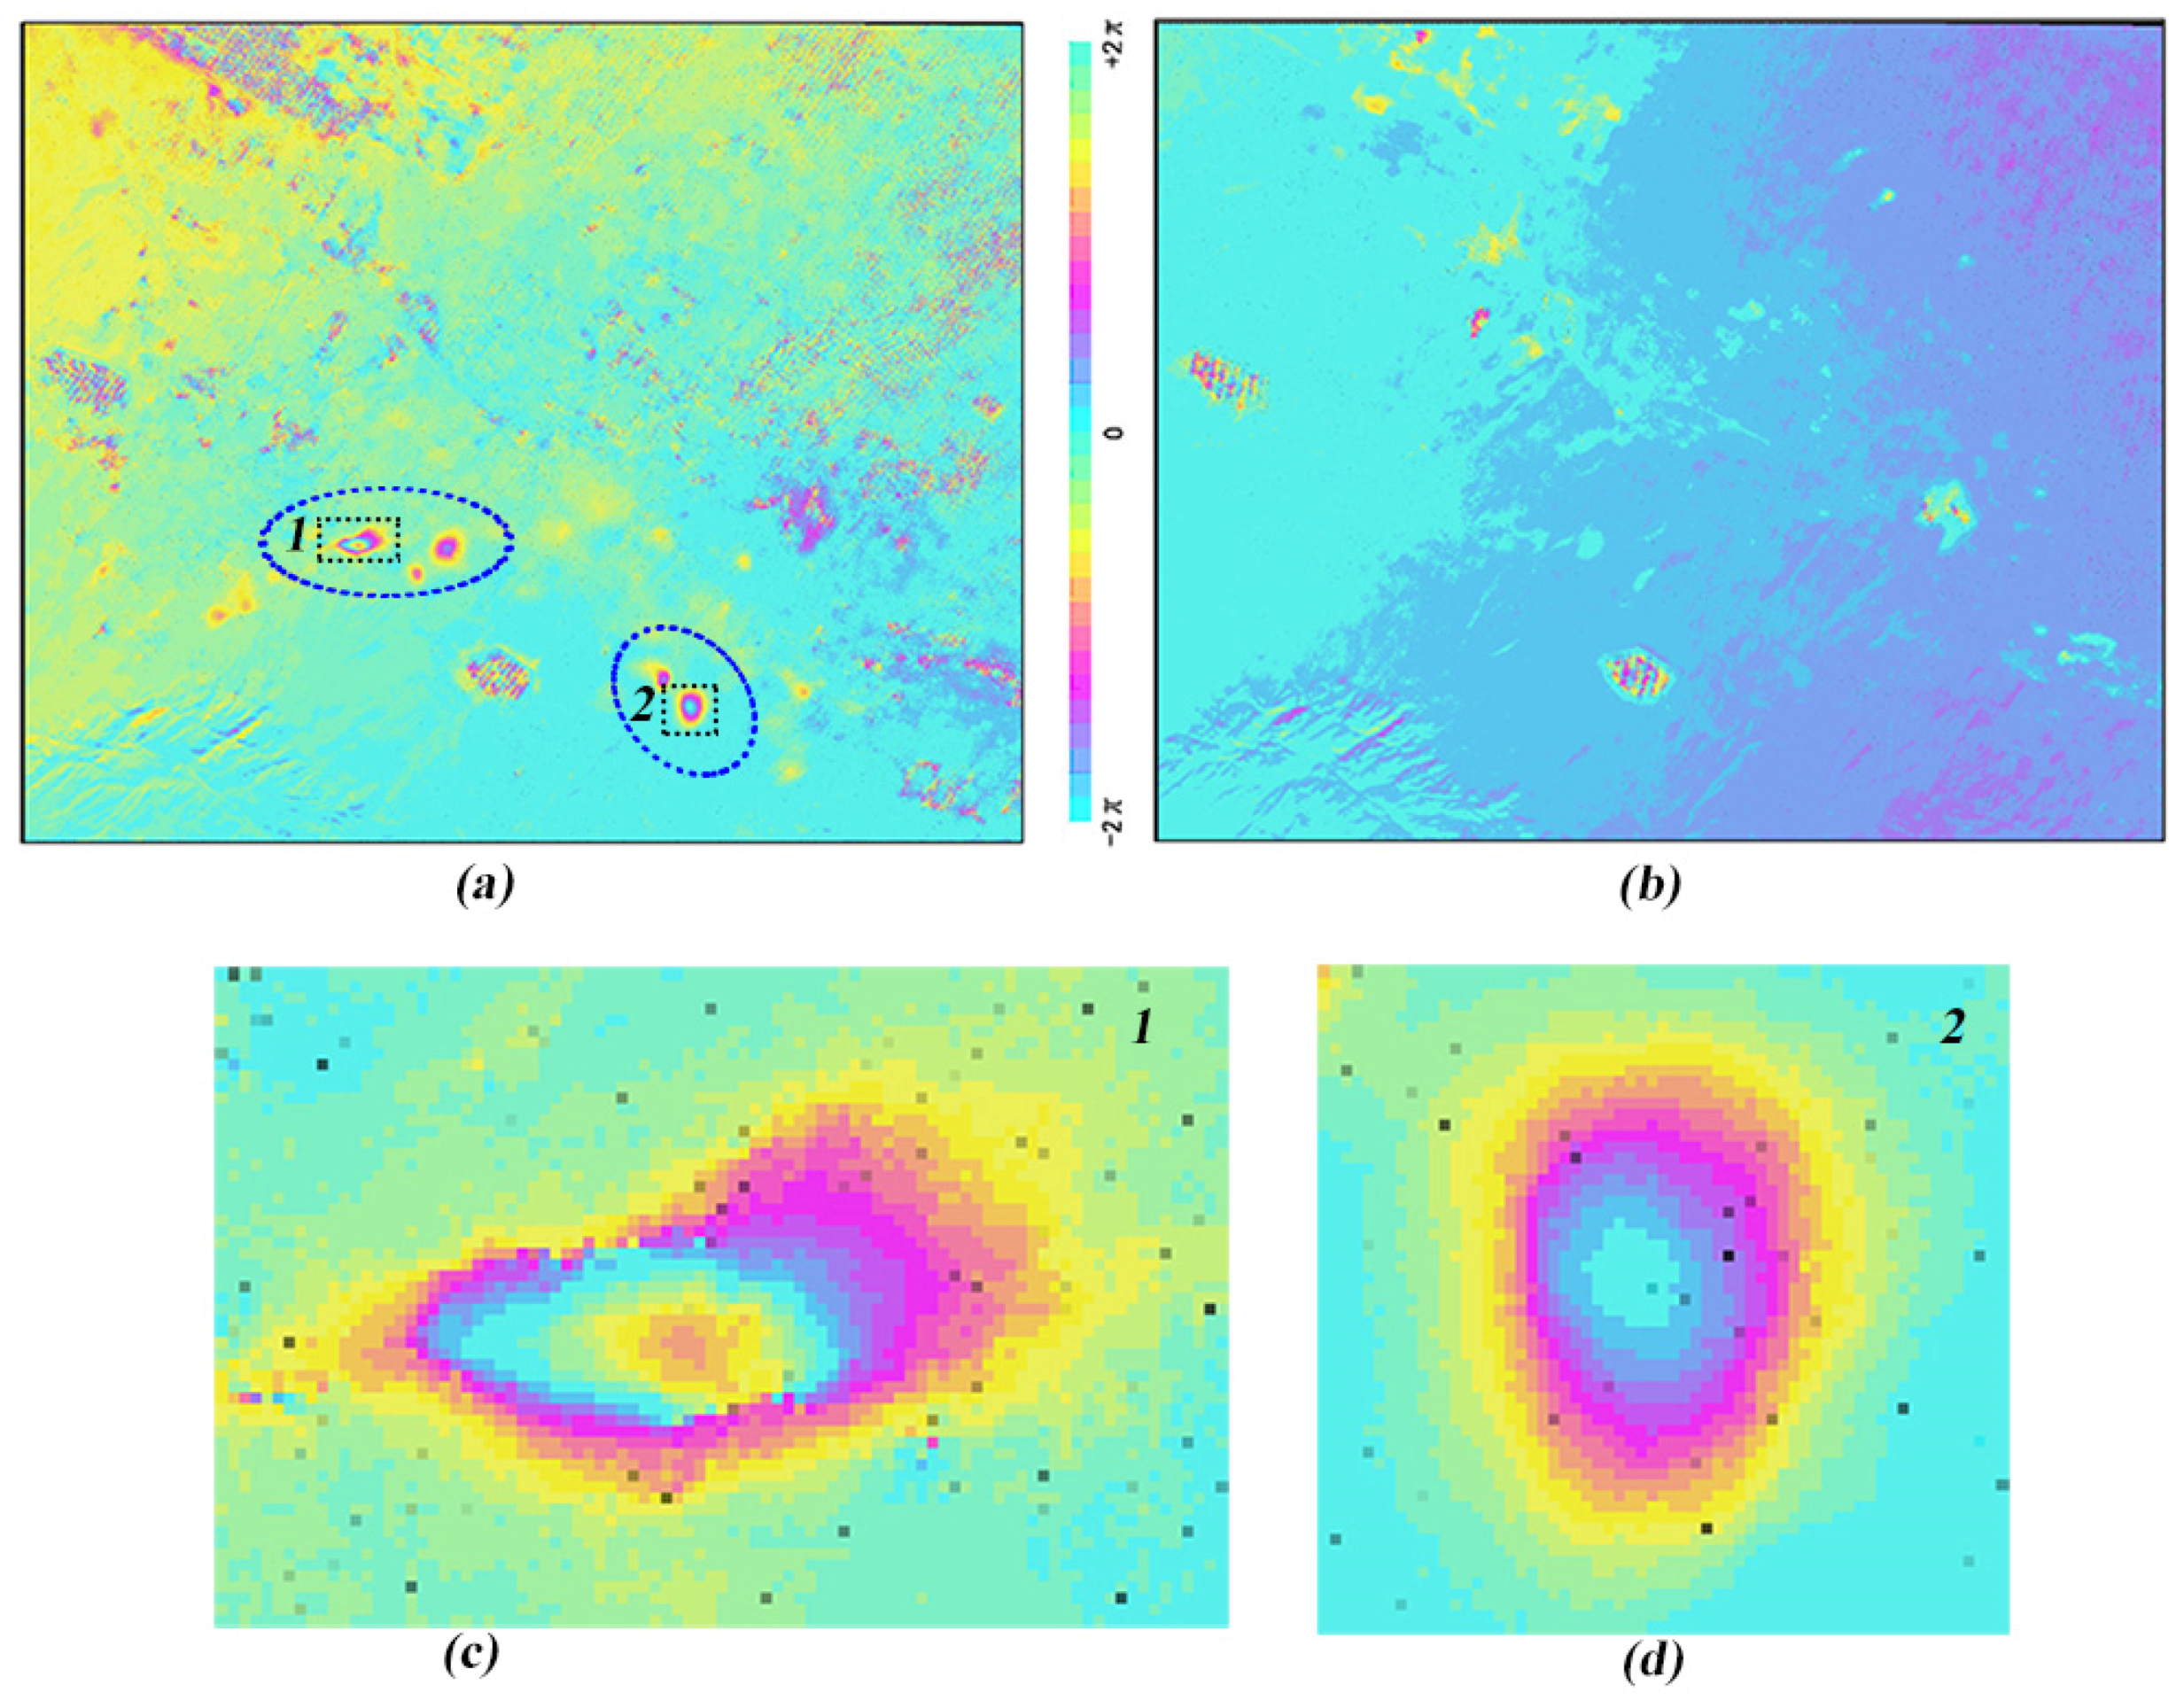
Figure 5.
Geocoded displacement map in the line of sight (LOS) direction obtained by the differential SAR interferometry (D-InSAR) analysis from the ALOS-PALSAR data pair. Positive (negative) values indicates the ground close to (away from) the satellite.
Figure 5.
Geocoded displacement map in the line of sight (LOS) direction obtained by the differential SAR interferometry (D-InSAR) analysis from the ALOS-PALSAR data pair. Positive (negative) values indicates the ground close to (away from) the satellite.
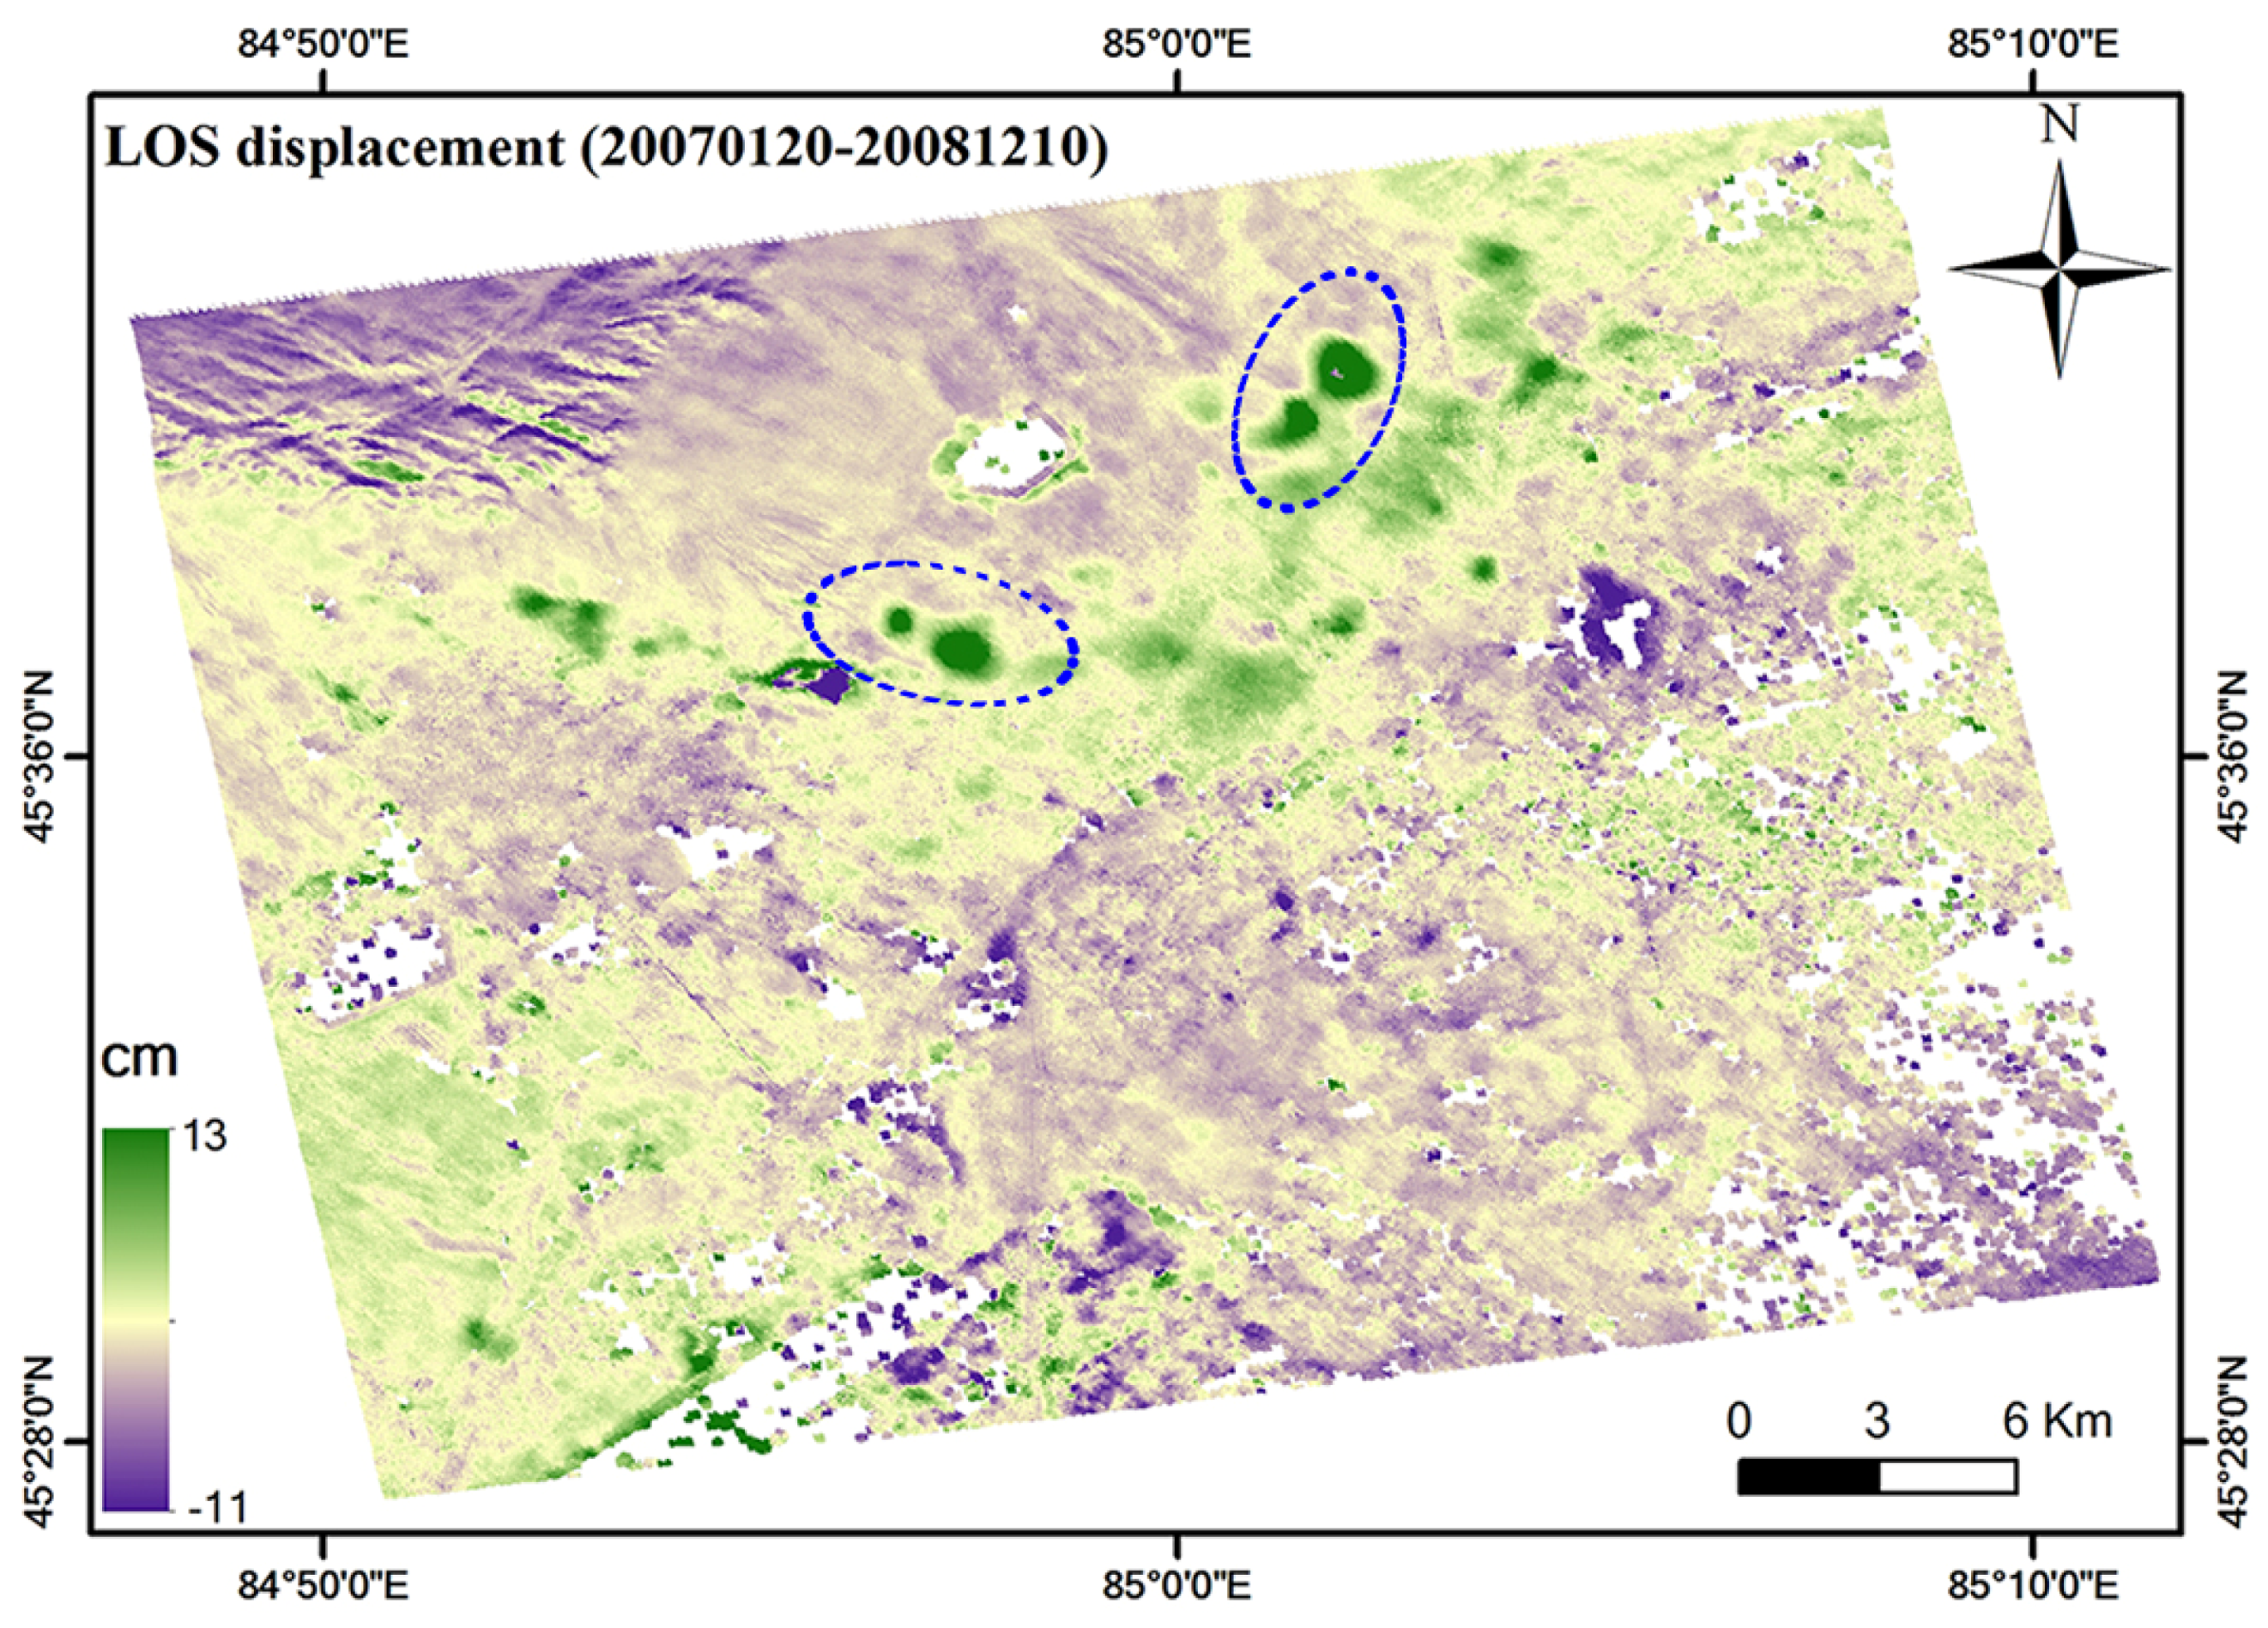
Figure 6.
(a) The representative interferogram generated from the data pair (29 November 2006 and 6 May 2008); (b) Close-up view of a typical fringe map, where the location is indicated by the black dashed lines in Figure 6a. Figure from (c) to (k) correspond to the main deformation area, which is highlighted in a red dashed line in (a), and they show the interferometric phase change in different time periods. The image in 29 November 2006 is the common master image.
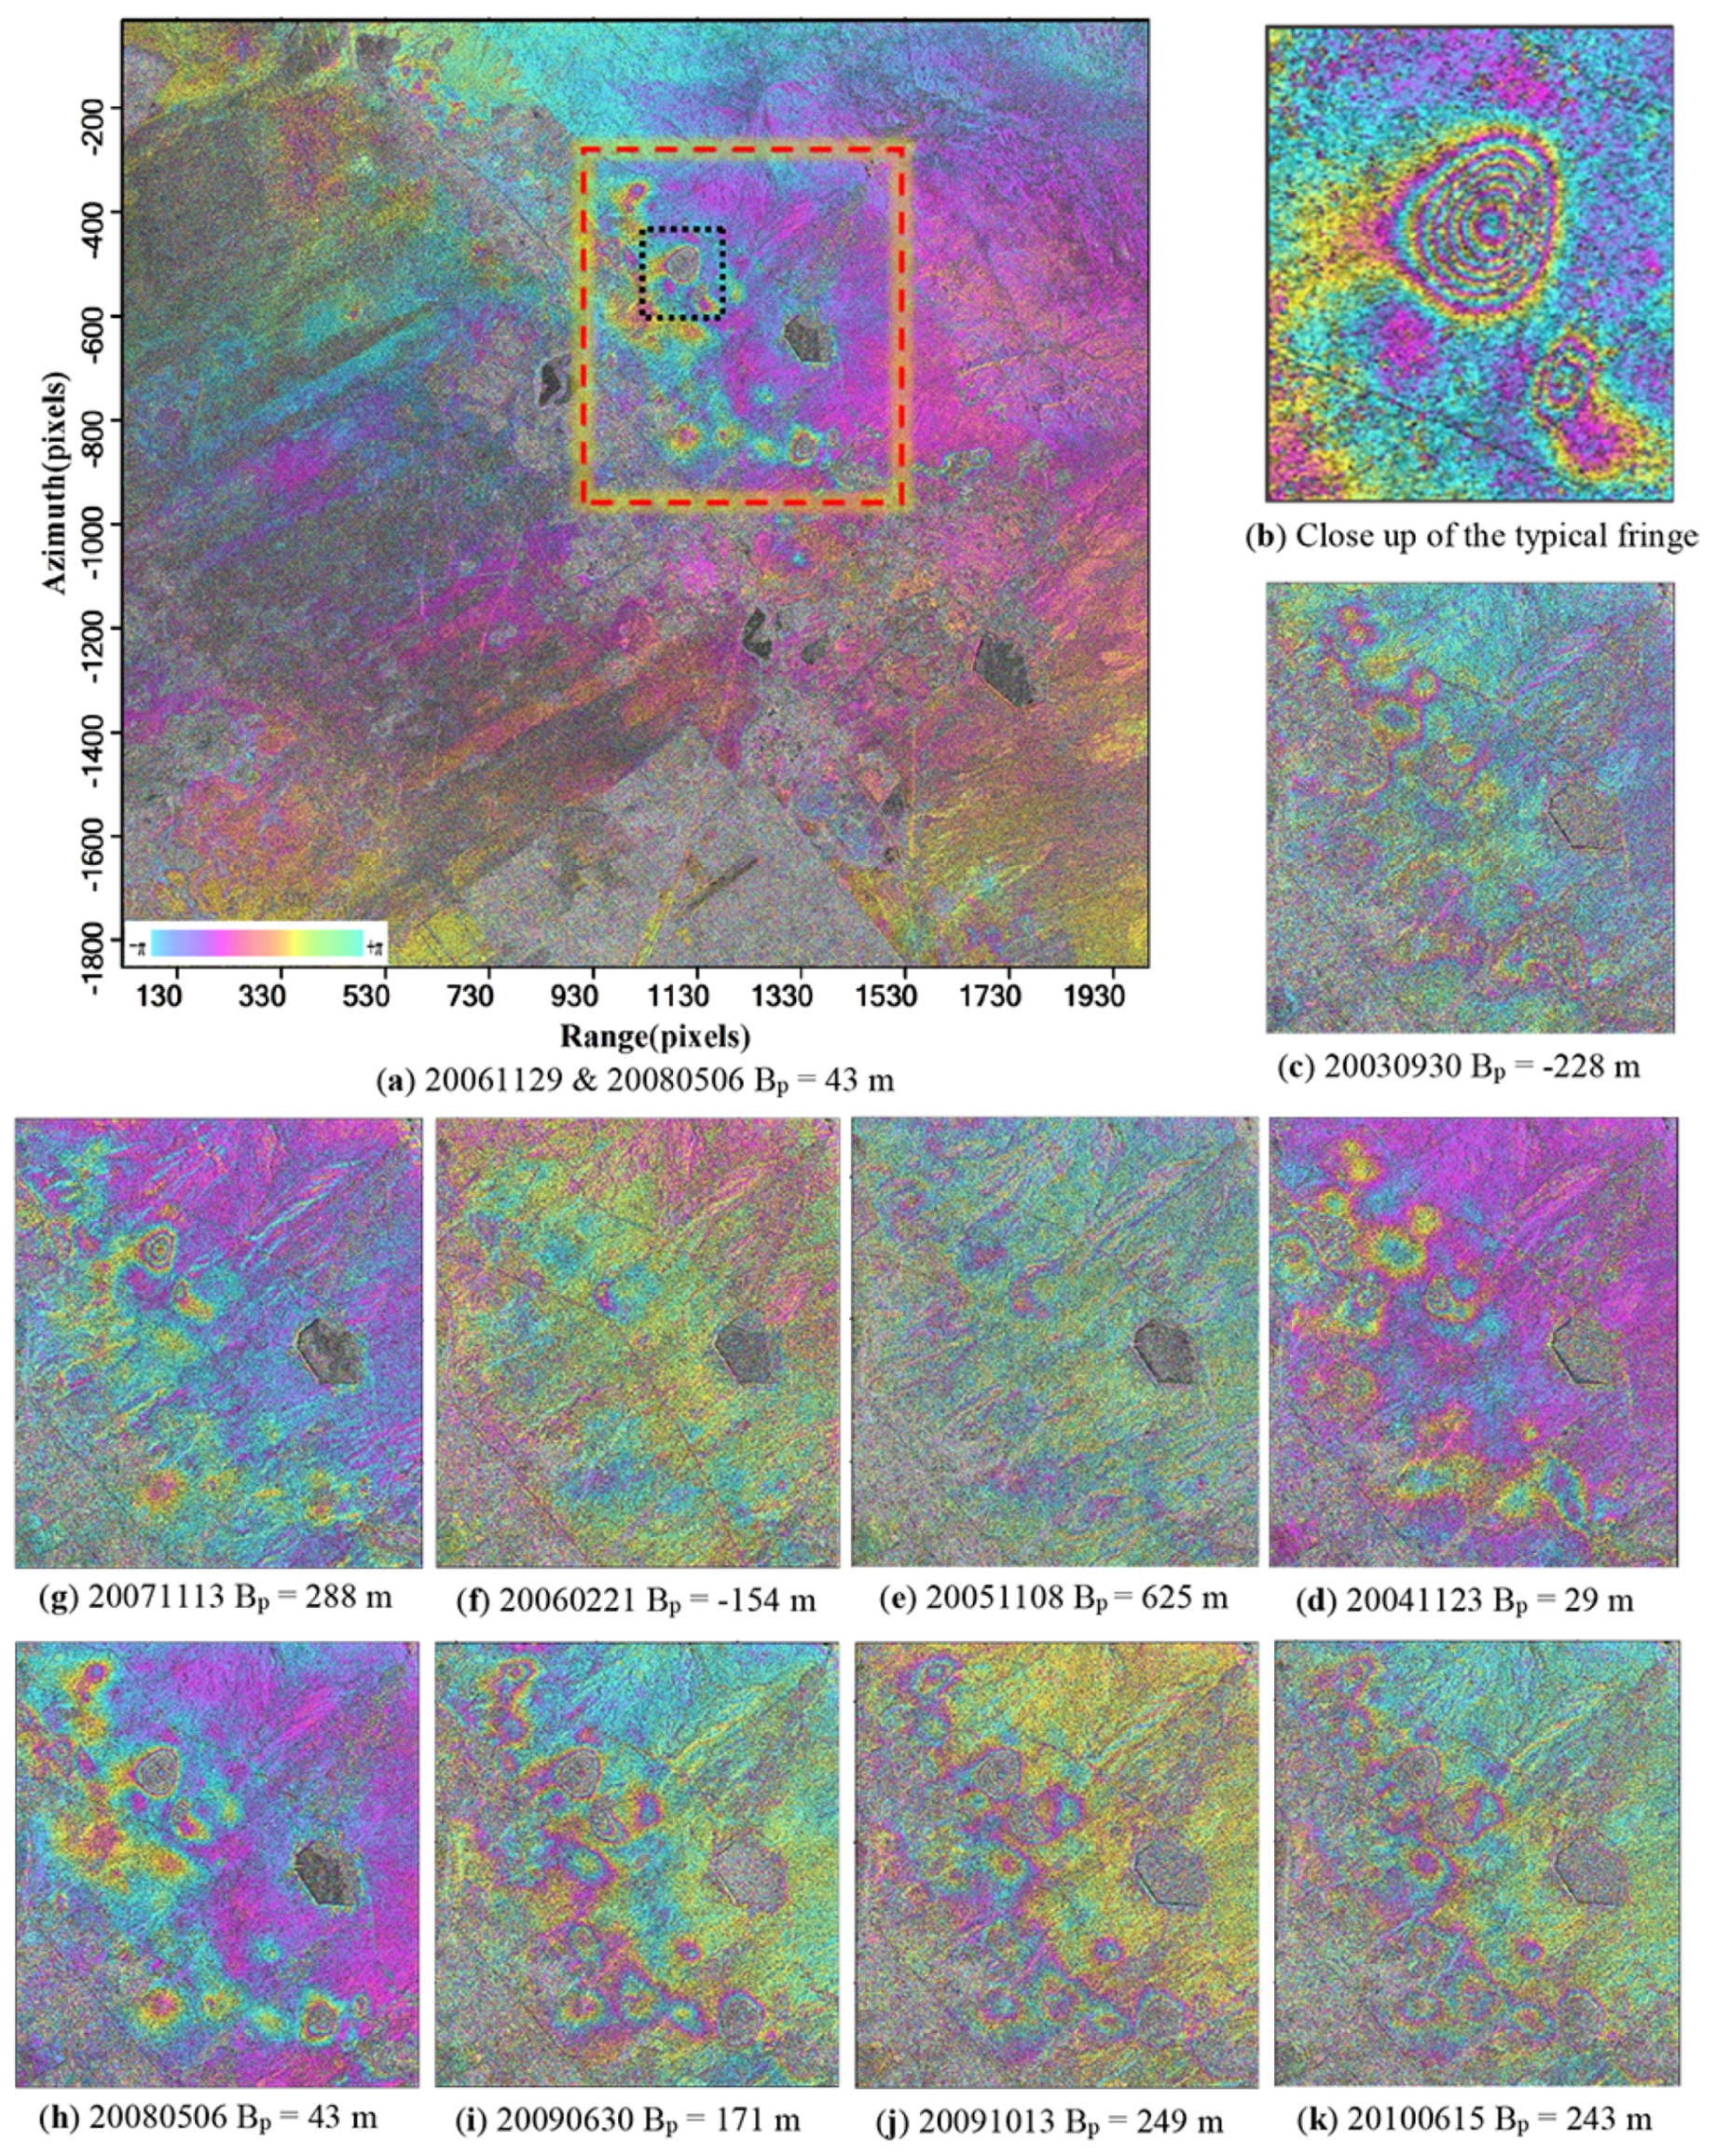
Figure 7.
Mean displacement map of ENVISAT-ASAR data from 2003 to 2010. (a) The mean displacement velocity map of the PS-InSAR method; (b) The mean displacement velocity map of the SBAS-InSAR method. Positive (negative) values indicates the ground close to (away from) the satellite. The points T1, T2, T3 and T4 are chosen for showing the accumulative time series land deformation pattern.

Figure 8.
(a–d) Comparison of time series deformation obtained by the PS-InSAR and SBAS-InSAR methods at the selected locations T1 to T4 (Figure 7).
Figure 8.
(a–d) Comparison of time series deformation obtained by the PS-InSAR and SBAS-InSAR methods at the selected locations T1 to T4 (Figure 7).

Figure 9.
Comparison of mean deformation velocity among D-InSAR, PS-InSAR and SBAS-InSAR methods (a–c) for the selected locations, shown as pink cross lines, in (d), showing the distribution of the selected 500 reference points. The blue triangle denotes the location of previous GPS station [36].
Figure 9.
Comparison of mean deformation velocity among D-InSAR, PS-InSAR and SBAS-InSAR methods (a–c) for the selected locations, shown as pink cross lines, in (d), showing the distribution of the selected 500 reference points. The blue triangle denotes the location of previous GPS station [36].
© 2017 by the author. Licensee MDPI, Basel, Switzerland. This article is an open access article distributed under the terms and conditions of the Creative Commons Attribution (CC BY) license (http://creativecommons.org/licenses/by/4.0/).
Share and Cite
MDPI and ACS Style
Aimaiti, Y.; Yamazaki, F.; Liu, W.; Kasimu, A. Monitoring of Land-Surface Deformation in the Karamay Oilfield, Xinjiang, China, Using SAR Interferometry. Appl. Sci. 2017, 7, 772. https://doi.org/10.3390/app7080772
AMA Style
Aimaiti Y, Yamazaki F, Liu W, Kasimu A. Monitoring of Land-Surface Deformation in the Karamay Oilfield, Xinjiang, China, Using SAR Interferometry. Applied Sciences. 2017; 7(8):772. https://doi.org/10.3390/app7080772
Chicago/Turabian StyleAimaiti, Yusupujiang, Fumio Yamazaki, Wen Liu, and Alimujiang Kasimu. 2017. "Monitoring of Land-Surface Deformation in the Karamay Oilfield, Xinjiang, China, Using SAR Interferometry" Applied Sciences 7, no. 8: 772. https://doi.org/10.3390/app7080772
Note that from the first issue of 2016, this journal uses article numbers instead of page numbers. See further details here.