1. Introduction
Nowadays, there are more mobile phones on this planet than humans. A mobile phone is a necessity in most of our society, and we usually carry it with us not only during the day, but also, in many cases, even at night. In this context, the exponential growth of human behavioural data is related with the use of mobile phones. Thus, an analysis about how someone uses the mobile phone can give us useful information about his/her behaviour. This information can have a great significance if it is applied in many real applications, such as service recommendations or urban planning. However, because of the very large amounts of data that are created by mobile phone users, the treatment of these data is usually complex. In addition, and considering the final goal to achieve, sometimes only part of this extracted data is relevant to analyse. Especially, in the competitive telecommunications market, the stored call data are essential to maintain and manage their customers. The approach proposed in this paper analyses only the stored call logs to extract information about different human behaviours. The main reason for this is that, as far as we know, not much emphasis has been given to extract dynamic human behaviours in real-time from the analysis of call detail records (CDR) as data streams.
In relation with the study of human behaviours, the first research was proposed in the 19th century [
1]. From then, many different techniques have been applied to study several aspects of human behaviour. Many recent papers have studied how cellular network data can be used for urban planning. In [
2], the authors propose the use of CDR data to analyse people flow in and out of a suburban city. That CDR data analysis can help urban planners better understand city dynamics. In a different study [
3], it is demonstrated that the intensity of urban activities and their evolutions through space and time can be represented using call volume and cellular towers. In relation with the service recommendation area, a complete statistical analysis on the mobile users’ data is proposed in [
4]. In that research, the key attributes that are significant for a phone changing event are recognized, and four classifiers to predict whether people change their phones are proposed. Finally, in relation to public health studies, recent studies have demonstrated the potential application of smartphone apps in patient self-monitoring [
5]. In addition, a recent study [
6] aims to identify and analyse cancer-related applications available on the Apple iTunes platform. This paper is focussed on the analysis of human behaviours or patterns in relation to the use of their mobile phone by using only data from CDR. Thus, the proposed approach automatically extracts and analyses different calling behaviours.
In addition, the information from the mobile phones is usually obtained in real-time so it is necessary to analyse that information by using techniques that can work in real-time. However, in the addressed environment, the behaviour patterns change due to the dynamic nature of human activities and these changes need to be considered. In this sense, scalable algorithms to identify frequent human behavioural patterns using a variety of phone sensors (location, WiFi, and so on) are proposed in [
7]. In that research, its scalability is a salient advantage. However, we propose a method which can analyse CDR data in real-time with no need to store the information about the calls analysed. This aspect is important not only because the algorithm implementation is more efficient, but also because it supports the privacy of customers. Thus, the main novelty of this approach is that all the CDR are read as data streams but they do not need to be stored—the results are obtained in real-time in a recursive manner. The real-time behaviour of the algorithms which work in this recursive manner have been tested already [
8]. For this reason, this approach can be used in real-time with a very large number of call records. It is important to remark that the data collection can have some delay, but the algorithms proposed in this paper can work in real-time.
This paper is organized as follows:
Section 2 discusses the related work about human activity recognition in the environment of mobile phones and current research works based on the analysis of CDR.
Section 3 details the case study that is proposed in this research.
Section 4 explains our proposal for clustering calling behaviours and detecting outlier calls and callers. Finally,
Section 5 concludes the paper.
2. Related Works
2.1. Smartphone-Based Approaches
Over the last decade there has been growing interest in activity recognition using wearable sensors [
9]. Currently, the most popular wearable sensor platform is the mobile phone. By analysing the data obtained from mobiles phones, many different applications can be applied, such as health monitoring [
10], road traffic monitoring [
11], activity recognition [
12], identification of patterns and outliers [
13,
14], mobile e-learning [
15], and so on. This area of research has emerged a decade ago, with the increasing availability of large-scale anonymised datasets. In [
16], the authors review some advances made recently in the study of mobile phone datasets. In this sense, it is very relevant to discover and analyse frequent user patterns from these datasets and there are many research works related with this field. In [
17], a novel middleware to efficiently mine user behaviour patterns entirely on the phone is developed. In [
18], an analytical model is used to model or predict how a user interacts with their mobile phone. A study about the relationship between the number of people in restricted areas and activity recorded by mobile phone providers and the online service Twitter is presented in [
19]. Since the temporal communication patterns of human individuals are inhomogeneous, some methods to remove the circadian and weekly patterns from the time series of mobile phone communication events of individuals are proposed in [
20]. In a similar research work [
21], the authors use an 18-month dataset that combines mobile phone calls and questionnaire data to examine individual differences in the daily rhythms of mobile phone activity. In addition, a survey about activity recognition on mobile phones is presented in [
22].
However, most of the approach related with the recognition and analysis of human activity involves off-line processing of the data collected from the mobile phone. Recently, a survey focuses entirely on research that resulted in a practical, on-line, and self-contained implementation on a smart phone is proposed in [
23]. In this paper, the proposed approach extracts different calling patterns/behaviours and it can cope with very large amounts of data streams in on-line mode and in real-time.
2.2. Call Detail Records Approaches
Although nowadays many different data can be extracted from the mobile phones, the analysis and data mining of CDR is still a hot topic. CDR are a very meaningful source of information that the telecom industry can use in order to obtain useful information about their customers. During recent years, there have been several research works related with the analysis of CDR. In [
24], the author underlines the value of analysing CDR and presents the use of big data technology in this area. A novel algorithm (pattern cube algorithm) for the multidimensional analysis of call records is proposed in [
25]. An analysis of calls in a mobile phone network from a CDR trace is presented in [
26]. In [
2], the authors propose the analysis of CDR data to help urban planners better understand city dynamics. An overview of empirical results on the multi-scale dynamics of social dynamics and networks inferred from CDRs is presented in [
27]. In [
28], a study of the community structure of a mobile phone call network is presented and its evolution over time is discussed, revealing the temporal patterns in local communications. A user-centric grid-based approach that utilizes location information retrieved from subscriber CDRs as a basis for cell parameter optimization is presented in [
29]. In a different area, a CDR database which contains the CDR related to old cases and convicted criminals is used in a crime investigation in [
30]. In [
31], suspect tracking based on call log analysis and visualization is proposed. In this paper, considering the importance of the analysis of CDR and the need of on-line analysis data, a real-time framework to extract different calling patterns/behaviours solely from CDR is proposed.
2.3. Evolving Algorithms and Their Use
The idea behind the approach proposed in this research is related with the evolving fuzzy systems [
32], where ‘evolving’ is used in the sense of self-development of a system based on the stream of data coming to the systems on-line and in real-time from the environment and the system itself. Thus, evolving fuzzy systems (EFS) can be defined as self-developing, self-learning fuzzy rule-based or neuro-fuzzy systems that have both their parameters, but also (more importantly) their structure self-adapting on-line. Due to these characteristics, these systems have been applied to many different environments. In [
33], an evolving clustering is used to detect and track objects in real-time for mobile robots. In [
34], an evolving approach to fault detection in industrial processes is presented. That approach uses TEDA algorithm [
35] which has autonomous learning. In [
36], an evolving algorithm is used to classify the behaviour of agents in different environments. In this paper, an evolving method is proposed to dynamically cluster calling behaviours in an evolving manner.
3. Case Study
Before presenting our approach, a brief introduction of the case study that was used to evaluate the approach is given. In this research, the data from the VAST (Visual Analytics Science and Technology) dataset 2008 [
37] was used. This is a synthetic dataset that was generated for the VAST challenge contest. This dataset contains a set of mobile phone call records from over a ten-day period that was narrowed down to about 400 unique mobile phones during this period. The dataset contains 9834 different calls and the values stored per call are presented in
Section 3.1.
It is important to remark that the proposed dataset was created in 2008 but, nowadays, it is still used in many different research works because it is very suitable for evaluating different tasks. Very recent examples (2016–2017) of the use of this dataset include voice calls interaction [
38], communication network anomaly detection [
39], tracking based on call log analysis [
30,
31], interactive visual analytics [
40], and so on. In this research, the VAST data set has been chosen because it has been used widely in this field and, in our case, the extraction of calling patterns is proposed solely from CDR data.
In addition, one of the specifications in this research is that the extracted callers and calling patterns are related with a pre-defined time interval. The reason for this is that the obtained patterns (in relation with these time intervals) need to be clearly understood. For this reason, two different methods for pre-processing this dataset were applied. One of them is related with the calls done per hour and the other is related with a typical time division: morning, afternoon, evening and night. Both processed datasets are presented in
Section 3.2.
3.1. Original Dataset
Each CDR of this original dataset contains the following fields:
From: Identifier of the calling phone,
To: Identifier of the receiving phone,
Day: Day of the call,
Time: Time of the call,
Duration: Duration of the call, in seconds, and
Cell Tower: Location of the call-originating mobile tower.
Since all the mobile phone records were registered with false names in this dataset, numerical identifiers for callers and receivers are provided. The 9834 different calls records have no missing values.
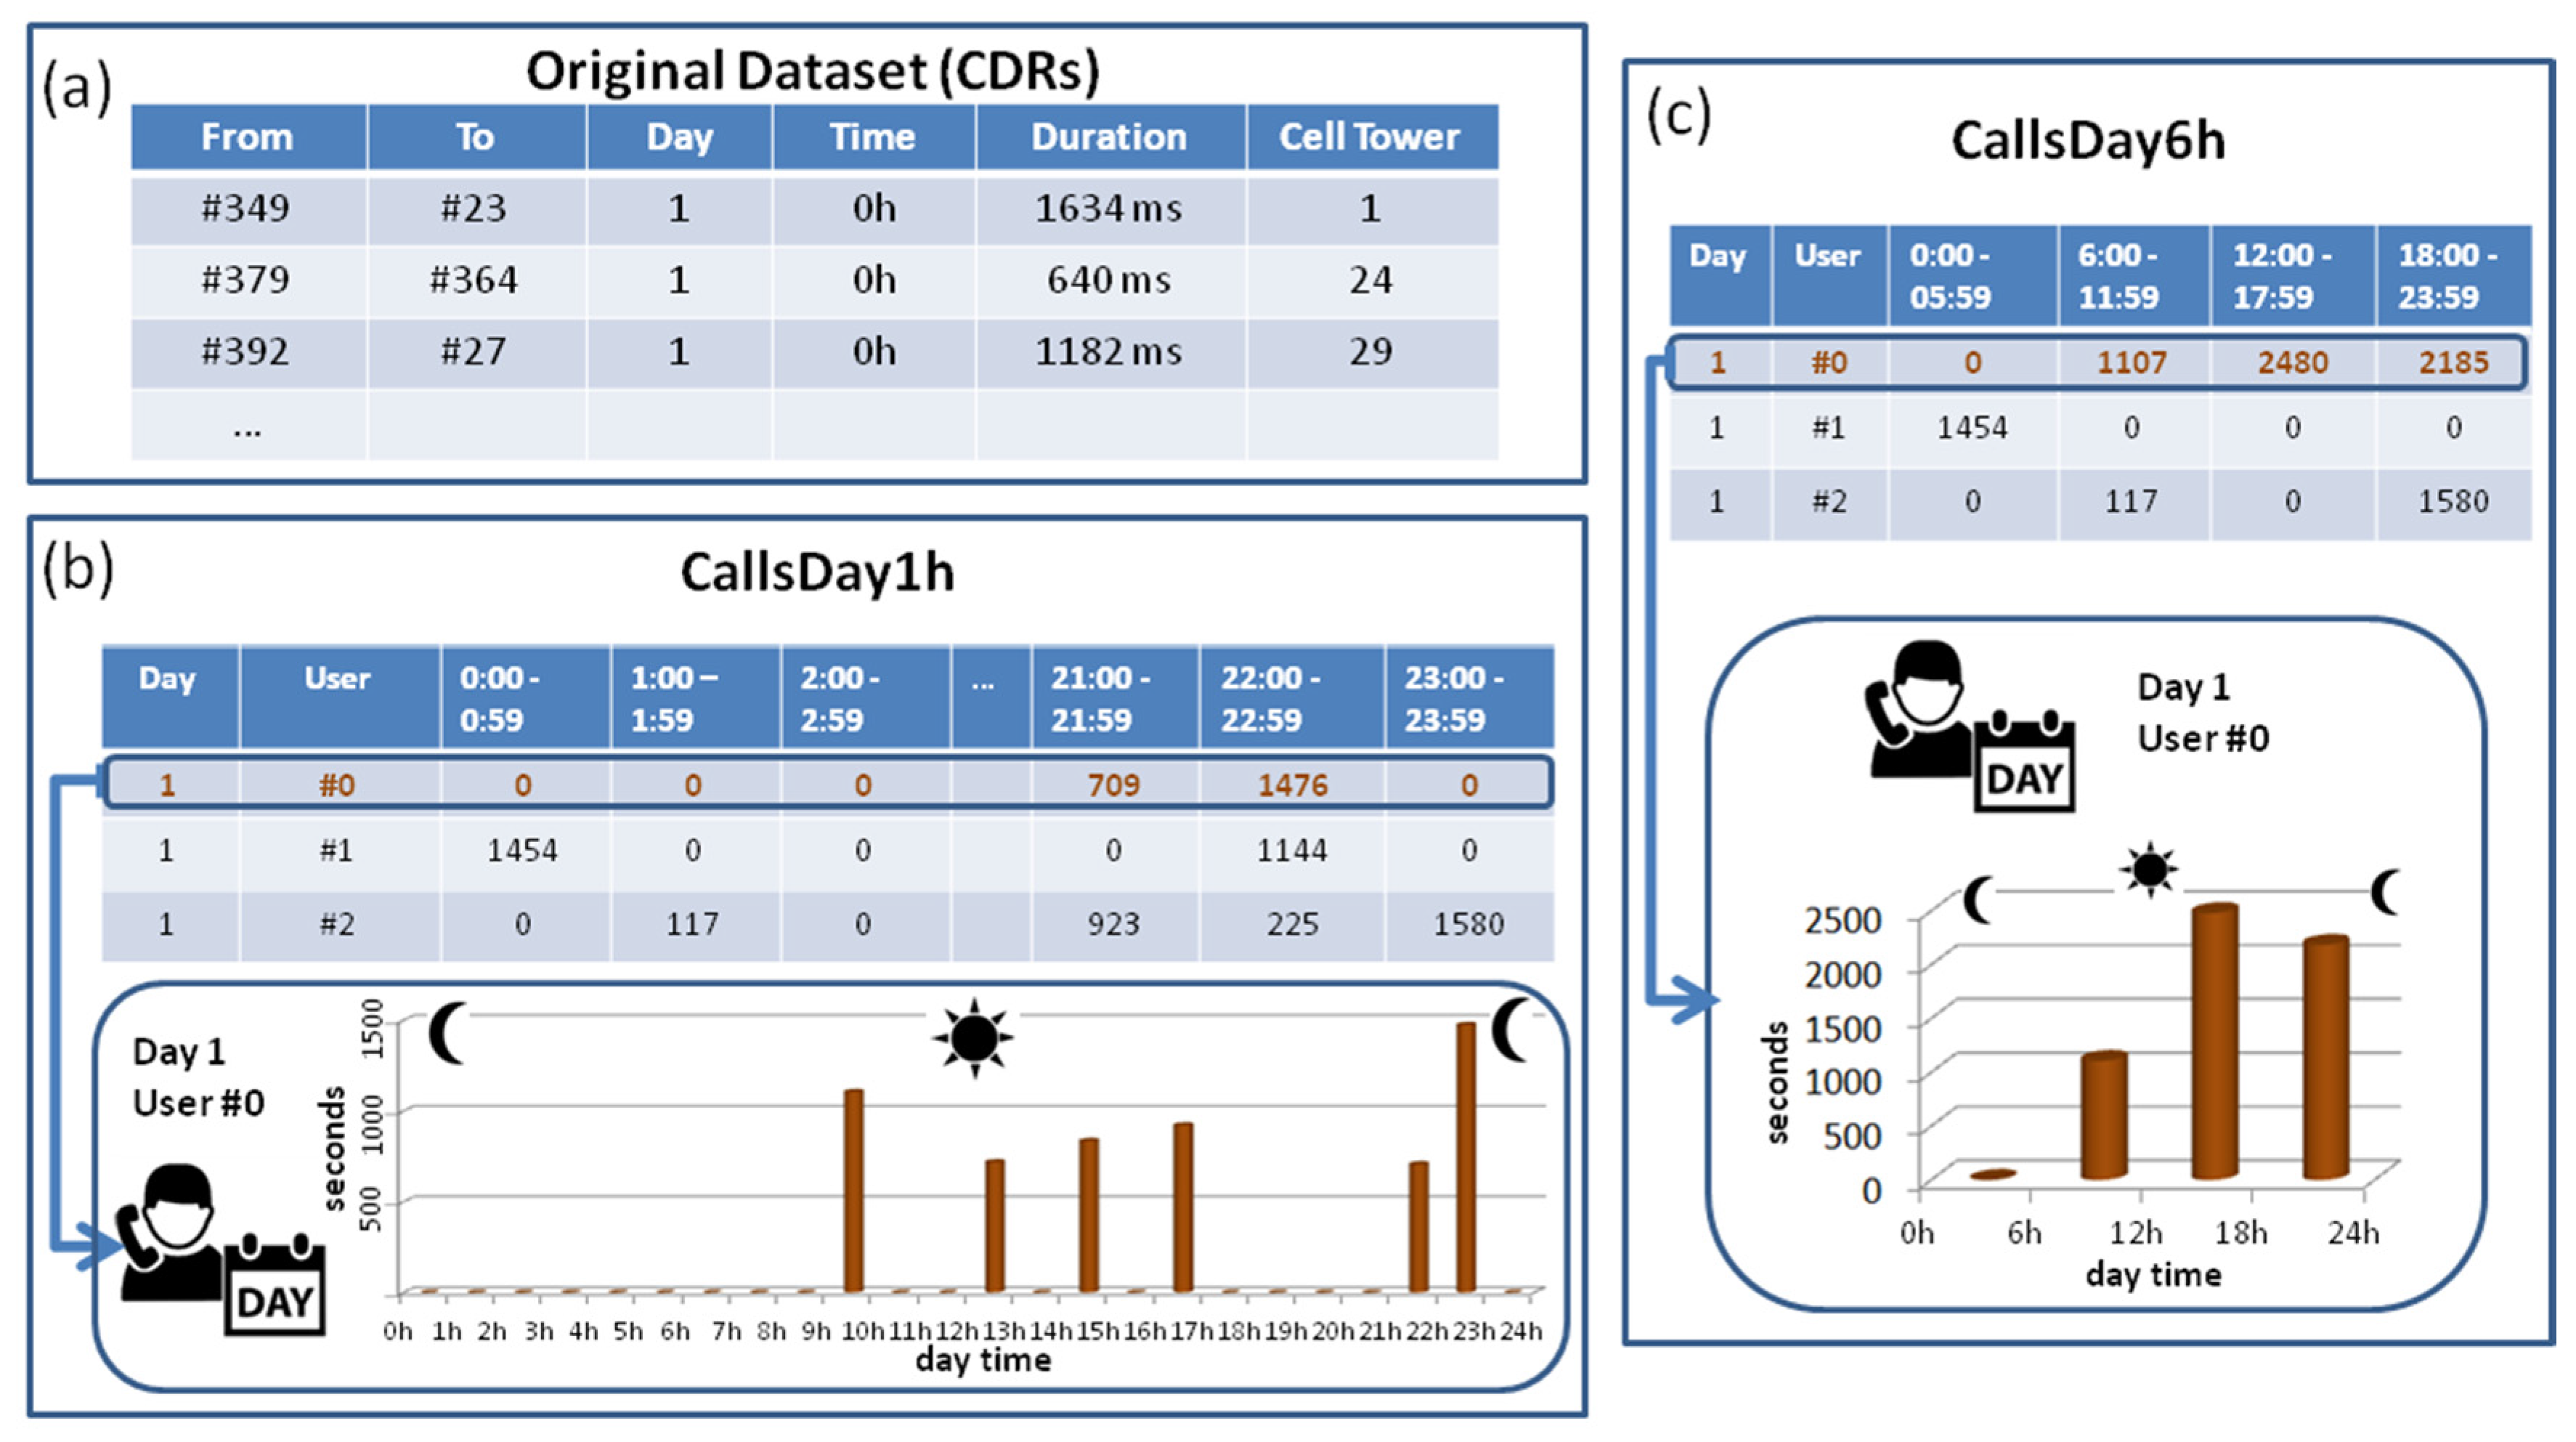
Figure 1a shows the first three records of this dataset. This first example describes a call made the day 1 by the caller #349 to the receiver #23 at a time between 00:00 and 00:59 with a duration of 1634 milliseconds.
3.2. Processed Datasets (CallsDay1h and CallsDay6h)
To check the calling behaviour of the different users, two different datasets that characterize the behaviour of a user in terms of calling consumption per day are created from the previous CDR. These datasets are obtained only by pre-processing the previously-described CDRs, and no extra data about the calls and callers is used. As it was explained, since the patterns obtained need to be clear and easy to understand, the time divisions used are very typical: one-hour interval (
CallsDay1h) and six-hour interval: morning, afternoon, evening, and night (
CallsDay6h). In
Section 5 the proposed approach is described and it will be evaluated using the original CDRs and the two generated datasets.
In the first processed dataset (named
CallsDay1h), the total duration of the calls (in seconds) made by a specific caller is calculated per hour (from 12:00 to 13:00, from 13:00 to 14:00, etc.). Thus, a set of 24 values (seconds) is obtained per day and user.
Figure 1b shows how this set of values created per day and user can be represented as a distribution of 24 values. This is the pre-processing of information about the calling behaviour of the user #0 during the day 1. For example, this user (#0) made the first call from 09:00 to 10:00. Since a new record per user and day is created, the dataset
CallsDay1h contains 4000 samples (10 days × 400 users).
The structure of the second dataset (named
CallsDay6h) is the same as
CallsDay1h. However, in this case, the total duration of calls made by a caller is calculated during six consecutive hours is made: (1) from 00:00 to 06:00, (2) from 06:00 to 12:00, (3) from 12:00 to 18:00, and (4) from 18:00 to 00:00. Thus, the values can be stored as a vector of four values (seconds).
Figure 1c shows how these four values are obtained and represented as a distribution of four values. As in the previous dataset, the number of samples of this dataset is 4000.
4. Density for Clustering Calling Patterns and Detecting Outliers
In this section, a detailed explanation of the method used in this proposal for the comparison of different calls and callers to is given. This measure is used in this research not only to cluster callers, but also to detect calls and callers that can be considered as outliers.
4.1. Density
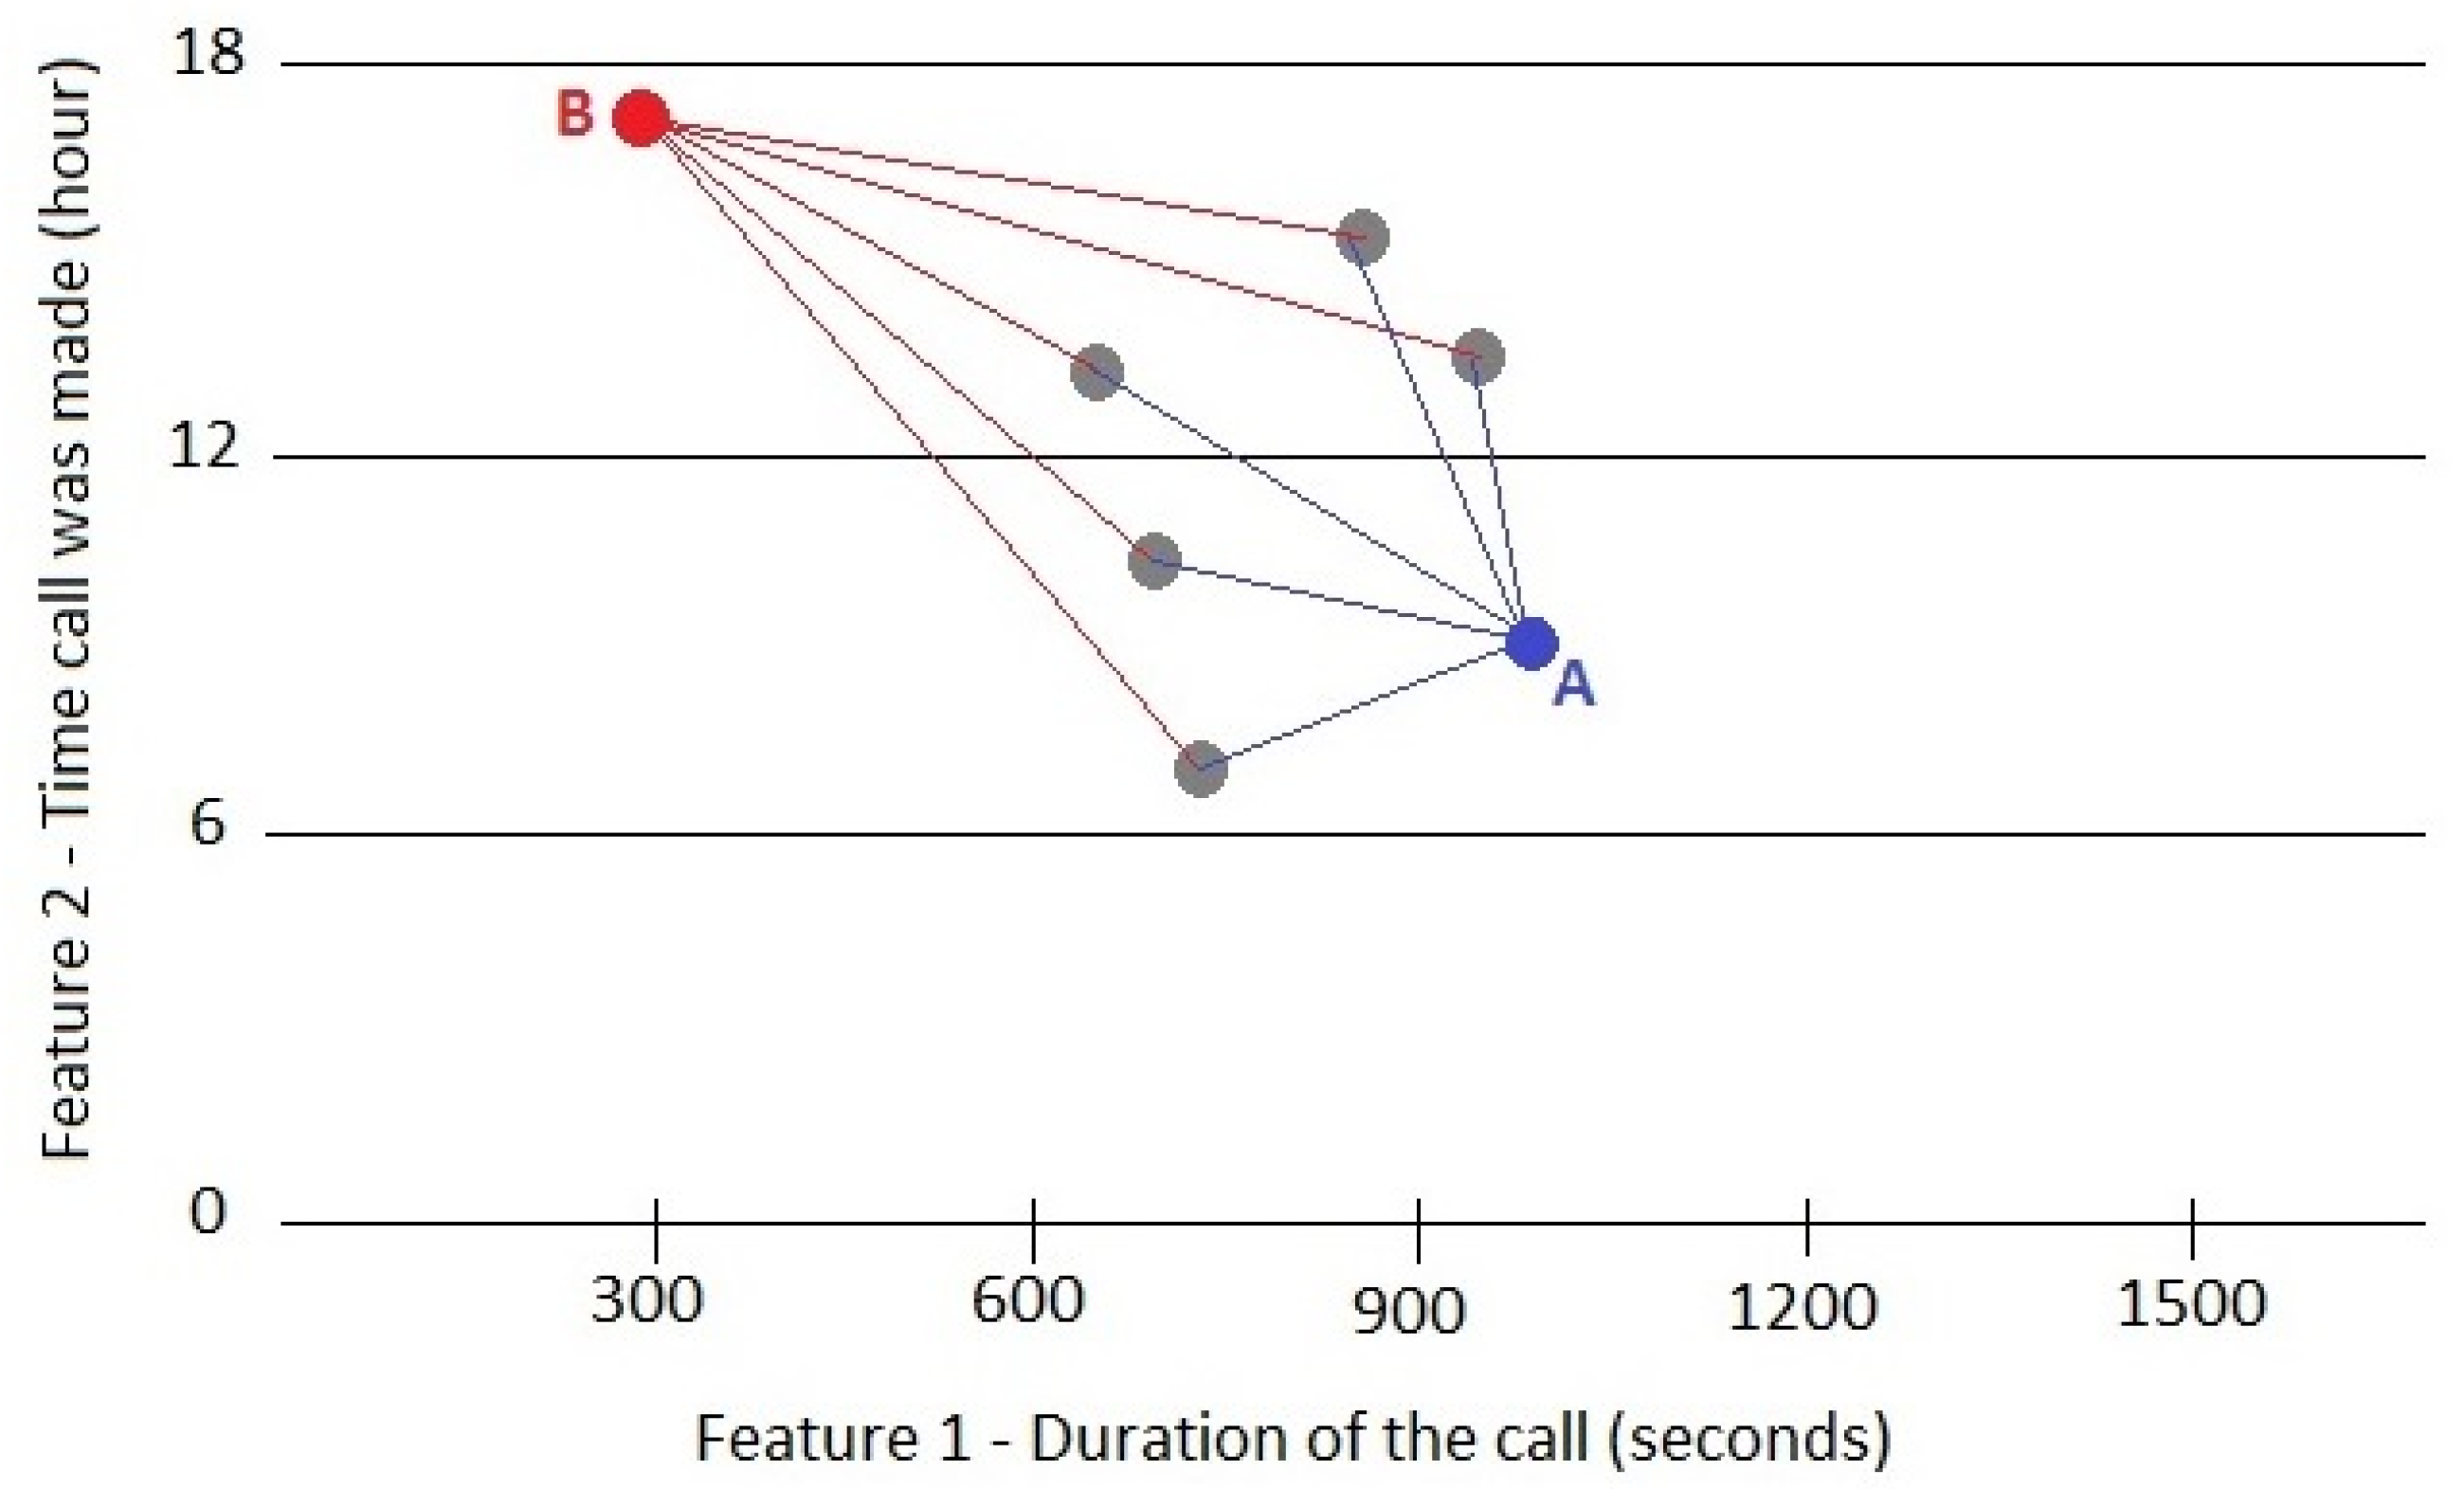
The method that is proposed in this research work is based on the density (D) value that can measure the similarity between a specific data observation and other previous observations. For example, if only two features are considered, each data record can be represented in a two-dimensional space as a point (
Figure 2). In this figure, the density at point B is low, while at point A it is high. Thus, B could be a potential outlier and/or be part of a new cluster.
In this research, the feature vector can be constructed using the calls data (time, duration, and location) as follows:
where
is the
kth observation/call and
are the information about the
kth call.
In addition, using the pre-process dataset
CallsDay1h, the feature vector should be constructed as follows:
where
is the
kth observation/caller and
represents the total duration of calls (seconds) made by the caller from
h − 1 to h hours by the caller during a specific day.
Using the pre-process dataset
CallsDay6h, the feature vector should be constructed as follows:
where
is the
kth observation/caller and
represents the total duration of calls (seconds) made by the caller in the range of six hours (
h) during a specific day.
Using this vector of features, the similarity measure can be expressed as an inverse of the sum of distances between the current data observation and the previous (
k−1) ones, as follows:
where
is the vector data of the current (
kth) observation (call or caller) whose similarity, to previous observations, is measured;
k denotes the number of observations read, and
n is the number of attributes that are being used to represent a specific mobile call or caller.
4.2. Recursive Density Estimation (RDE)
According to Equation (4), all the calls data need to be stored to calculate the measure density. However, our proposal is related with the callers clustering and detection of outliers from continuous and real-time call data. For this reason, the use of a novel technique developed and published [
41,
42] to calculate this value (density) recursively (RDE—Recursive Density Estimation) in a very computational efficient manner is proposed. This way, it is not necessary to store all the calls data—what is essential in this research—since a recursive algorithm that gives exact (not approximate) expression for the density is used. This technique has been used for anomaly detection in different environments, such as video streams [
43], recognition of human activities in an intelligent home environment [
44], and many others.
As it is detailed in [
8], the density value can be calculated recursively using Equations (5)–(7):
where both the mean
and the scalar product
can be updated recursively as follows:
As it has been applied in other environments, the idea behind using RDE for outliers’ detection is that a low density of an observation defines an outlier and a high density is related with the creation of a new prototype in the clustering task. Usually low density means lower than 2σ or 3σ where σ is the standard deviation, which measures the dispersion of the previous set of data from its mean. This threshold (2σ or 3σ) is needed since it is necessary to determine if an observation is sufficiently different than the previous ones [
45].
5. Our Approach
Clustering is a well-known technique for unsupervised learning, and according to [
46] an outlier is an observation that deviates so much from other observations. In this case, it is important to detect not only the calls, but also the callers who can be defined as outliers. This detection can help us to protect ourselves from any fraud or spam calls, calls that are not made by humans, telemarketers or misdialed calls, and so on.
In this section, an evolving approach for clustering callers and detecting callers’ outliers (and calls outliers) is presented. This approach is based on RDE.
5.1. Our Evolving Method
The evolving clustering approach
eClustering was proposed in 2004 [
47] and it is based on the calculation of the density of the different samples using RDE (which was explained in
Section 4.2).
eClustering does not require either the number of clusters to be pre-specified or any other user- or problem-specific parameters. It is on-line, one-pass, non-iterative, recursive, prototype-based, and the procedure of
eClustering can start from scratch. In addition, in this approach, the same algorithm is extended to detect callers’ outliers. This approach proposes to consider an observation as an outlier if its density is lower than 3 σ.
To understand how this approach works, the structure of
eClustering extended to detect outliers is summarized as follows:
| Algorithm 1 eClusteringAndOutliersDetection |
| Read the current observation (xk) |
| IF k = 1 THEN |
| Initialize (the first observation is read) |
| ELSE |
| Calculate recursively the data density of xk (Dk) |
| |
| //eClustering: |
| Update recursively the density of the prototypes |
| IF (Dk > Dmax) THEN |
| a new prototype is created |
| IF ((xk − x*) < σ/2) THEN |
| the corresponding prototype is removed |
| xk is assign to the nearest cluster |
| |
| //eDetectingOutliers: |
| IF (Dk < 3σ) THEN |
| xk is an outlier |
| END IF |
5.2. Application of Our Evolving Method to the Processed Dataset CallsDay1h
In this section, the proposed evolving approach is discussed. Although the results of this approach (clusters and outliers) are explained in different sections, it is important to note that both results are obtained at the same time in real-time after a new observation is read.
5.2.1. eClustering: CallsDay1h
By using eClustering, a set of callers’ behaviours is clustered in such a way that behaviours in the same cluster are more similar to each other than to those in other clusters. In addition, the different prototypes obtained by applying eClustering can be considered as the most representative patterns of callers´ behaviour. In this case, a prototype represents the behaviour of a specific call user during a specific day.
In this case, the 4000 observations (10 days × 400 call users) from
CallsDay1h are clustered using the proposed approach. Note that the number of clusters is not predefined and it depends on the heterogeneity of the observations.
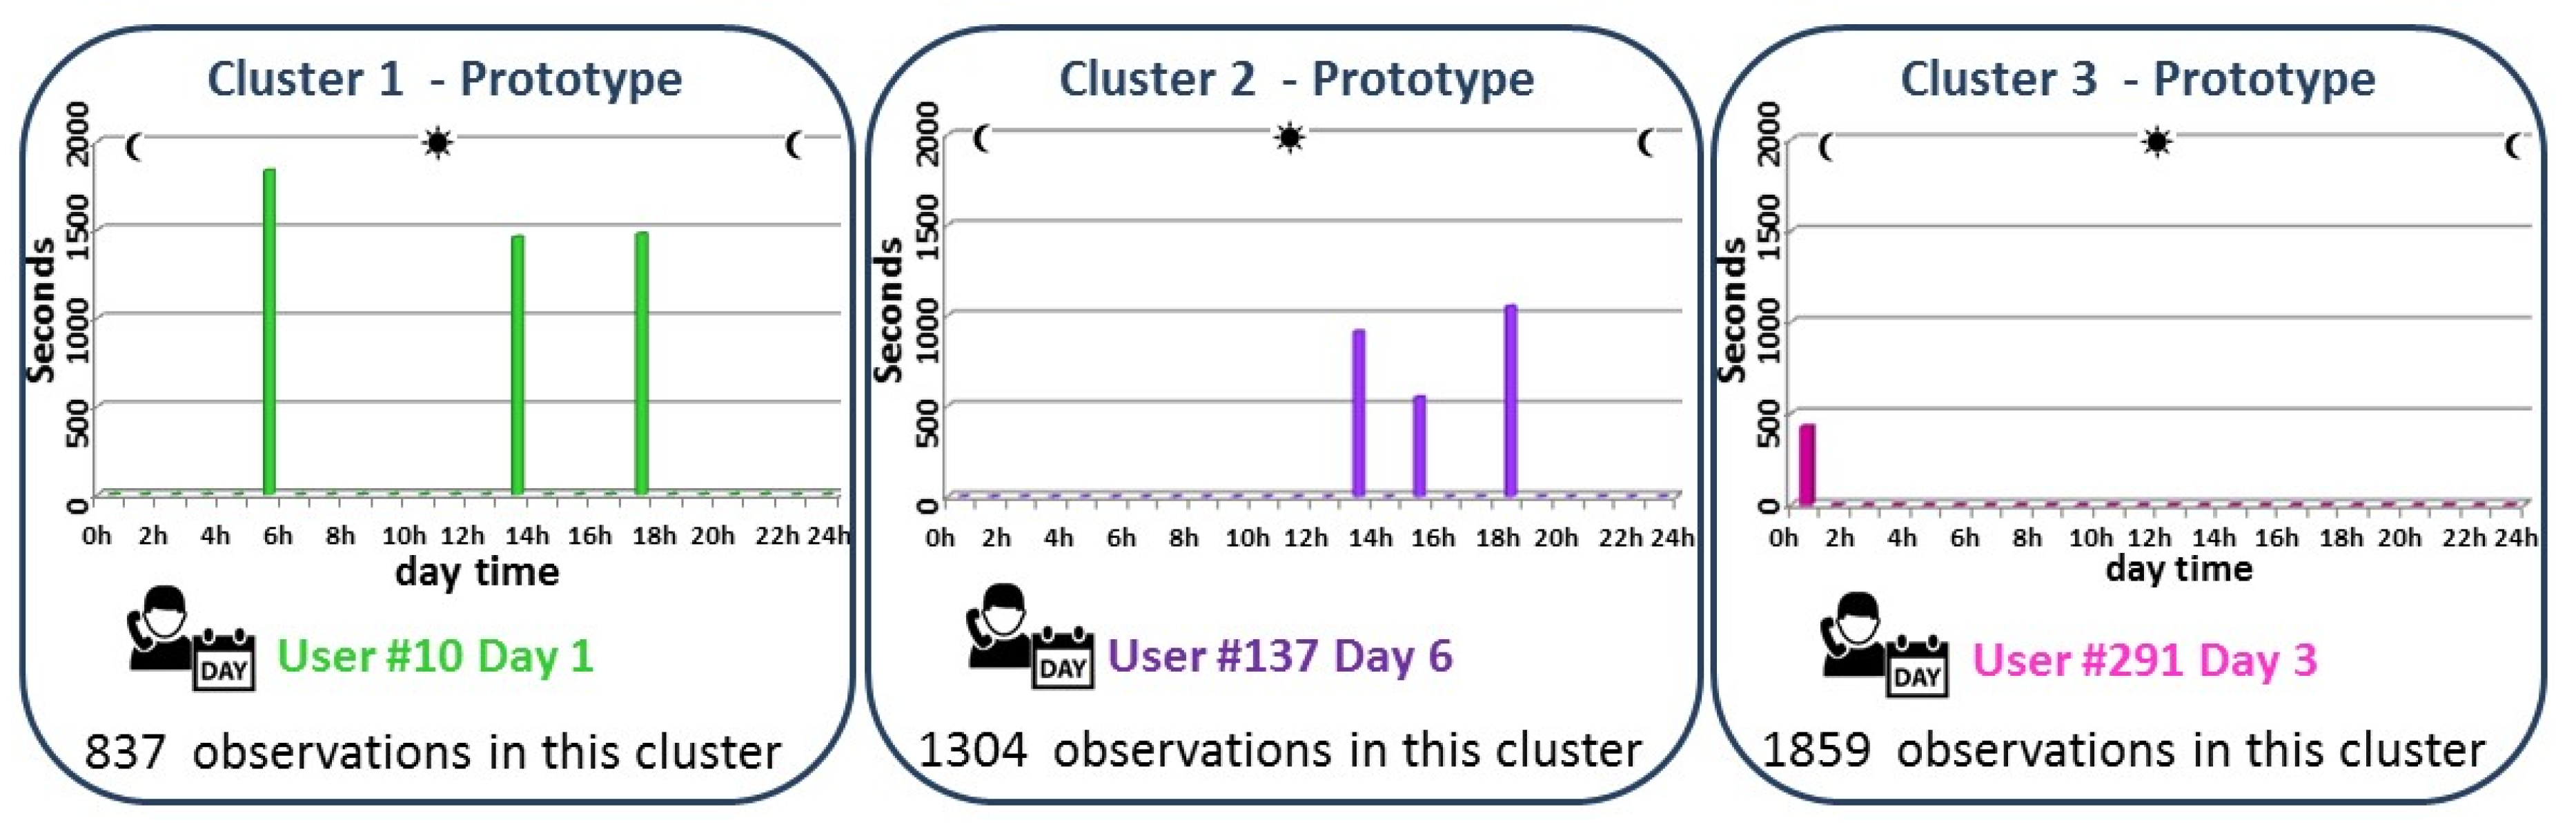
Figure 3 shows the results obtained, and it can be seen that only three clusters are obtained to represent the 4000 observations. Below, the analysis of these three clusters is given:
Cluster 1 represents those callers who make long calls early in the morning and in the afternoon. This cluster is represented by the calling behaviour of the caller #10 during the day 1, and 837 observations (out of 4000) can be represented by this prototype.
Cluster 2 groups those callers who make several calls in the afternoon. The calling behaviour that represents this cluster is the caller #137 during the day 6. In this cluster, 1304 observations are grouped.
Cluster 3 represents the pattern behaviour of those callers who only make short duration calls at night. The caller that represents better this cluster is #294 during day 3, and 1859 observations can be represented by this prototype.
5.2.2. eDetectingOutliers: CallsDay1h
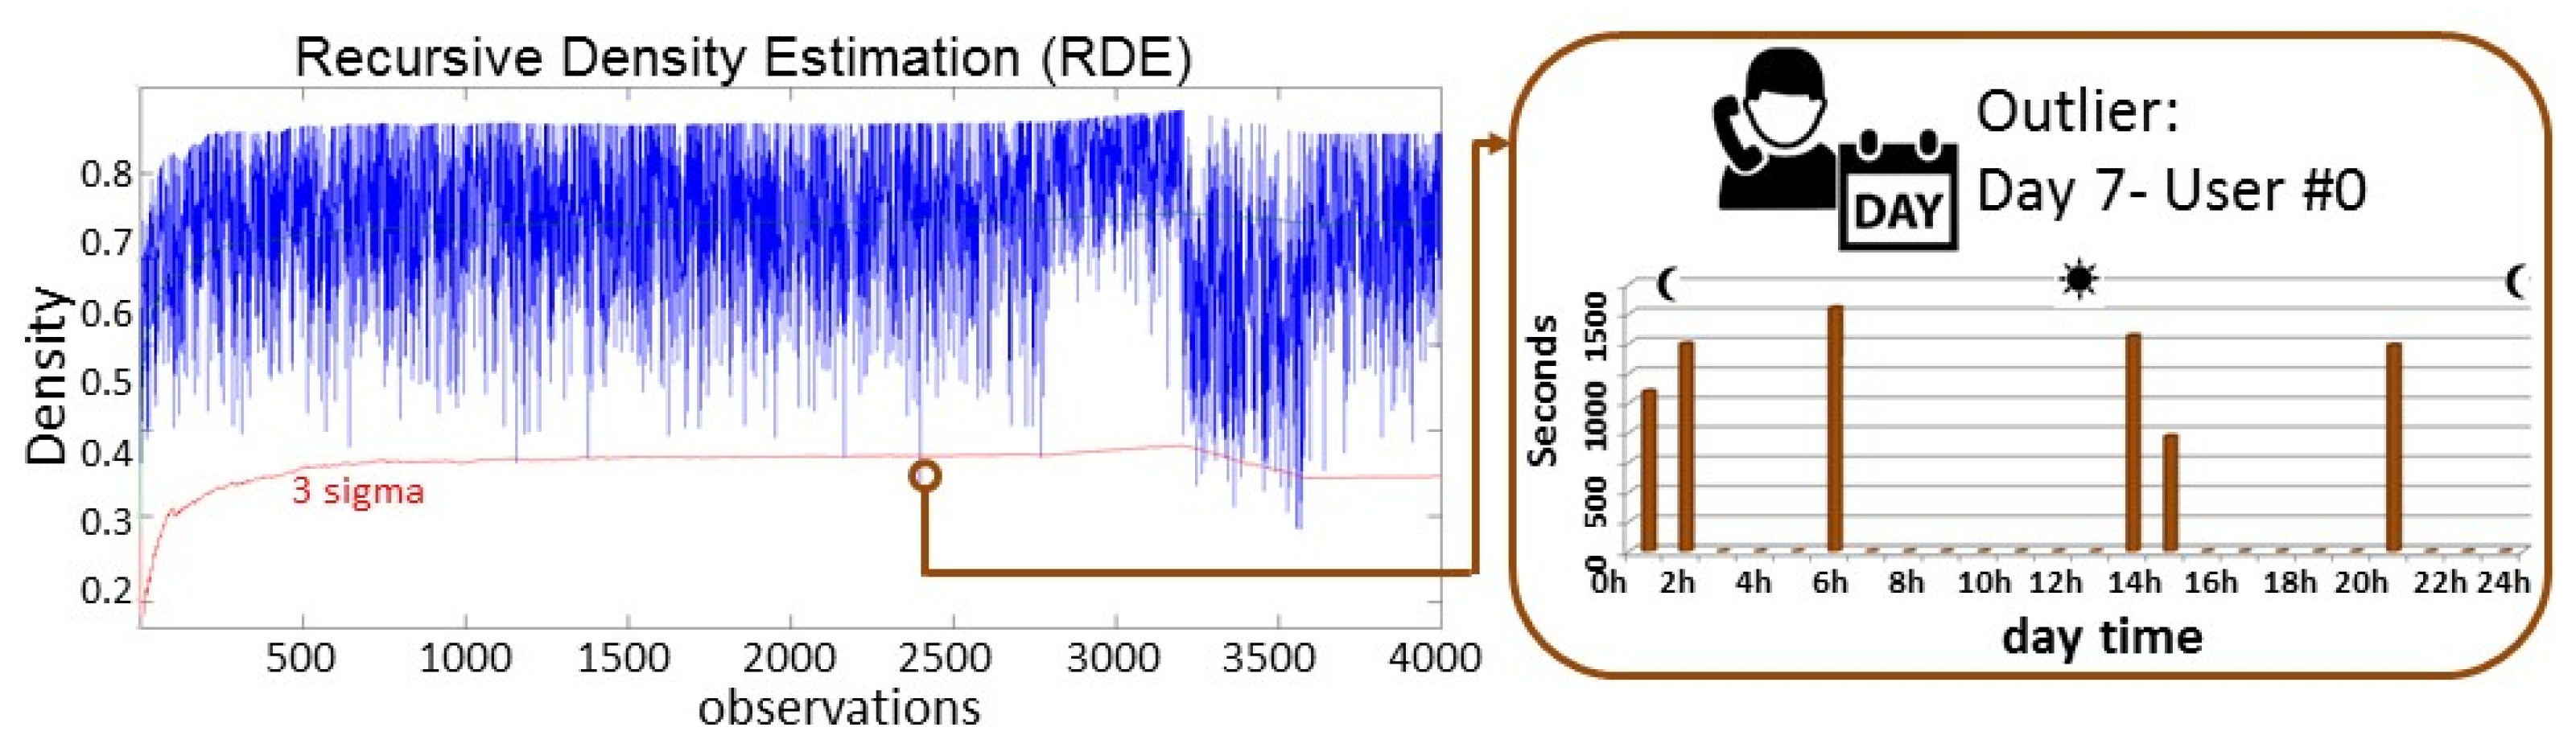
In this subsection, the application of RDE to detect those users with a calling behaviour different to the previous analysed callers (Dk < 3σ) is given in more detail.
Figure 4 shows the RDE of the 4000 observations. Each observation represents the calling behaviour during a specific day of a specific user (10 days × 400 users). In this case, those observations with a density lower than 3σ are considered as outliers. These outliers can easily and quickly be detected and identified. In
Figure 4, one of the calling behaviours (user with id #0 during the day 7), which is considered as outlier, is presented. Other outliers in this case are User #358—day 3; User #178—day 4; Users #0 and #369—day 7, and 16 Users (#48, #66, ...)—day 9.
In addition, it should also be considered that there could be some days with a calling behaviour, that is, in general, different to the corresponding behaviour of the users in previous days. In this case, this aspect can be seen from observation 3200.
5.3. Application of Our Evolving Method to the Processed Dataset CallsDay6h
In this subsection, the same previous analysis was repeated with the dataset CallsDay6h, which stores the total duration of the calls made by each user during six consecutive hours.
5.3.1. eClustering: CallsDay6h
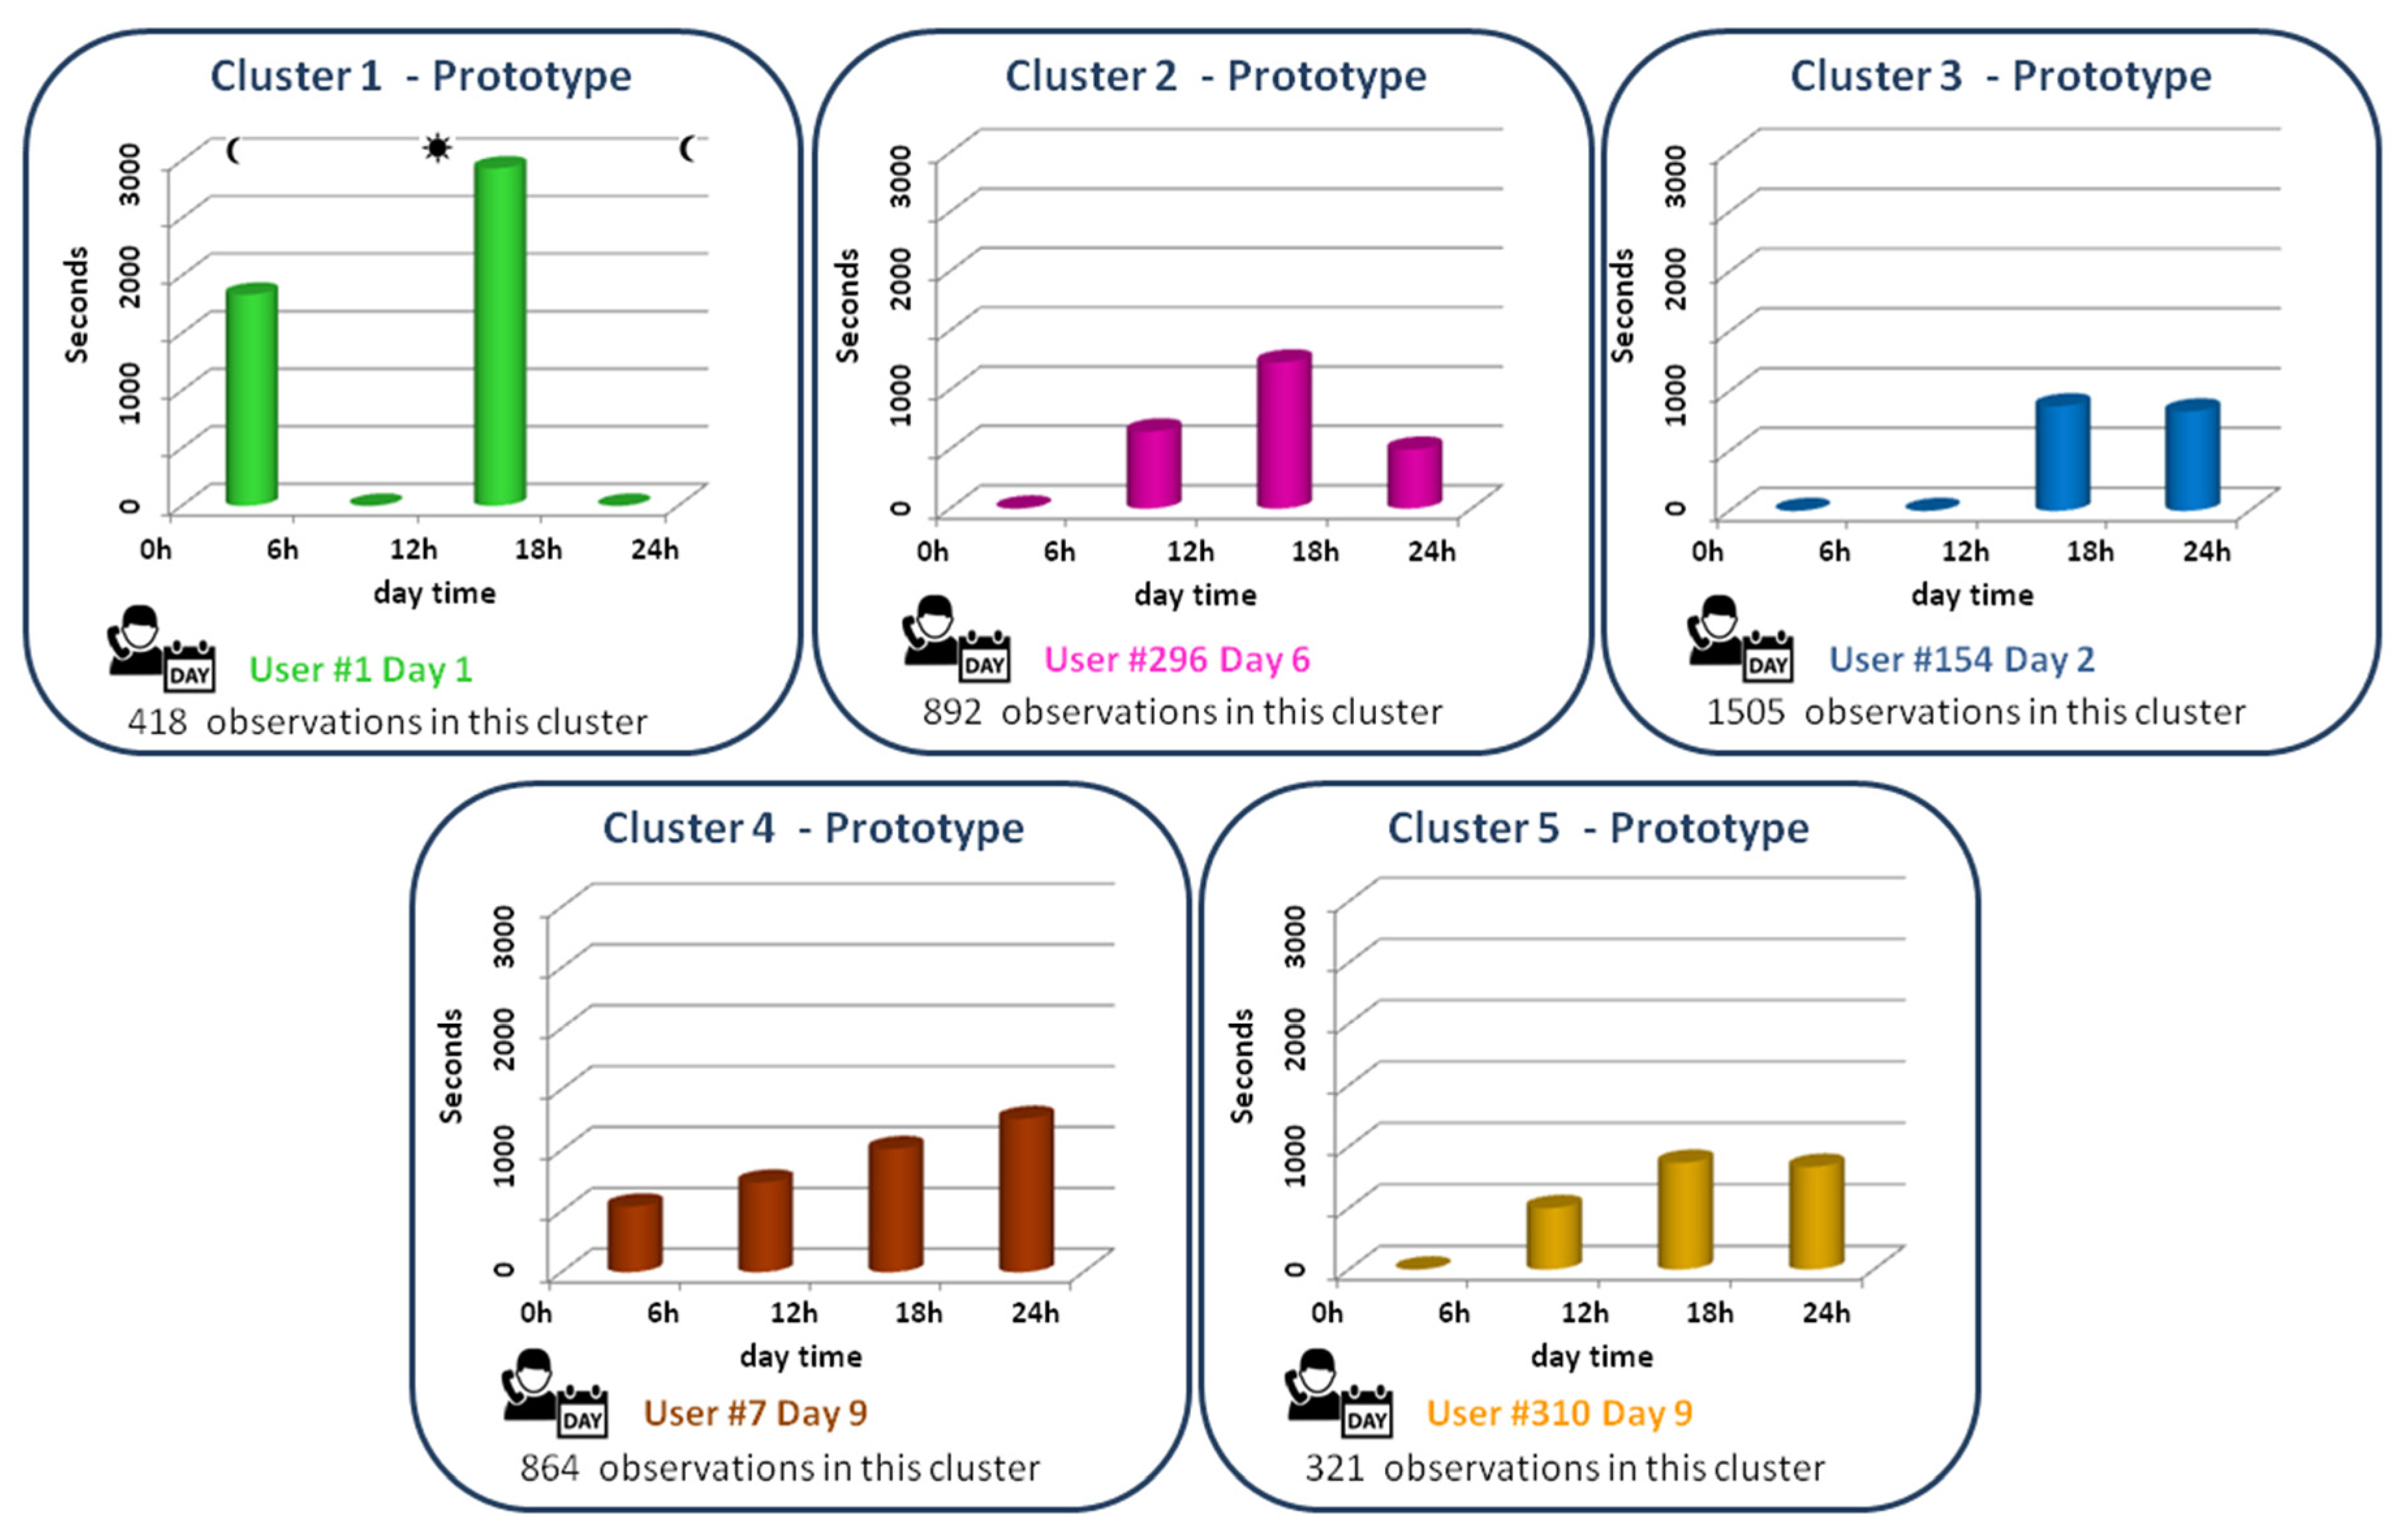
Figure 5 shows the 5 different clusters obtained from this dataset by applying eClustering to the dataset
CallsDay6h. Since the number of clusters is not predefined, in this case, two clusters more than in the previous analysis are obtained. Each cluster is represented by a prototype with the calling behaviour of a user considering the duration of the calls made during the morning, afternoon, evening, and night time.
By analysing
Figure 5, it can be seen that, for example, the users represented by the Cluster 1 make very long-duration calls in the afternoon and at night. This cluster groups 418 different observations (out of 4000). Moreover, analysing the prototype of the Cluster 2, it can be found that although the users make calls during morning, afternoon and evening, the duration of the calls made in the afternoon is longer than the duration of the other calls.
The analysis of these prototypes gives us useful information about the calling behaviour of the users analysed. This information can be also very useful for analysing a specific user during a specific set of days. Finally, the obtained results in this case can also help us in the task of detecting outliers: it can be checked out if there is a cluster that groups a reduced set of users represented by a calling behaviour very different to the other clusters.
One of the advantages of the proposed evolving method is that human-intelligible rules can be automatically extracted in real-time. Since the data of the calls are related with the users, rules based on that info can be formulated. In addition, as it is explained in [
48], model complexity is something which can be measured objectively in terms of the number of rules, fuzzy sets in the antecedent parts, number of inputs, parameters, etc.
As example, considering two clusters (Cluster1 and Cluster3) from the dataset
CallsDay6h by applying
eClustering (
Figure 5). In this context, and considering that any kind of information about the callers could be stored, the form of the rules could be as follows:
| RULE 1 (Pattern 1): |
| IF (SOME calls at night) AND (MOST calls during the afternoon) |
| THEN |
| Caller is related with the INFO about the callers who belong to Pattern 1 |
| |
| RULE 3 (Pattern 3): |
| IF (SOME calls during the afternoon) AND (SOME calls during the evening) |
| THEN |
| Caller is related with the INFO about the callers who belong to Pattern 3 |
5.3.2. eDetectingOutliers: CallsDay6h
Considering the dataset
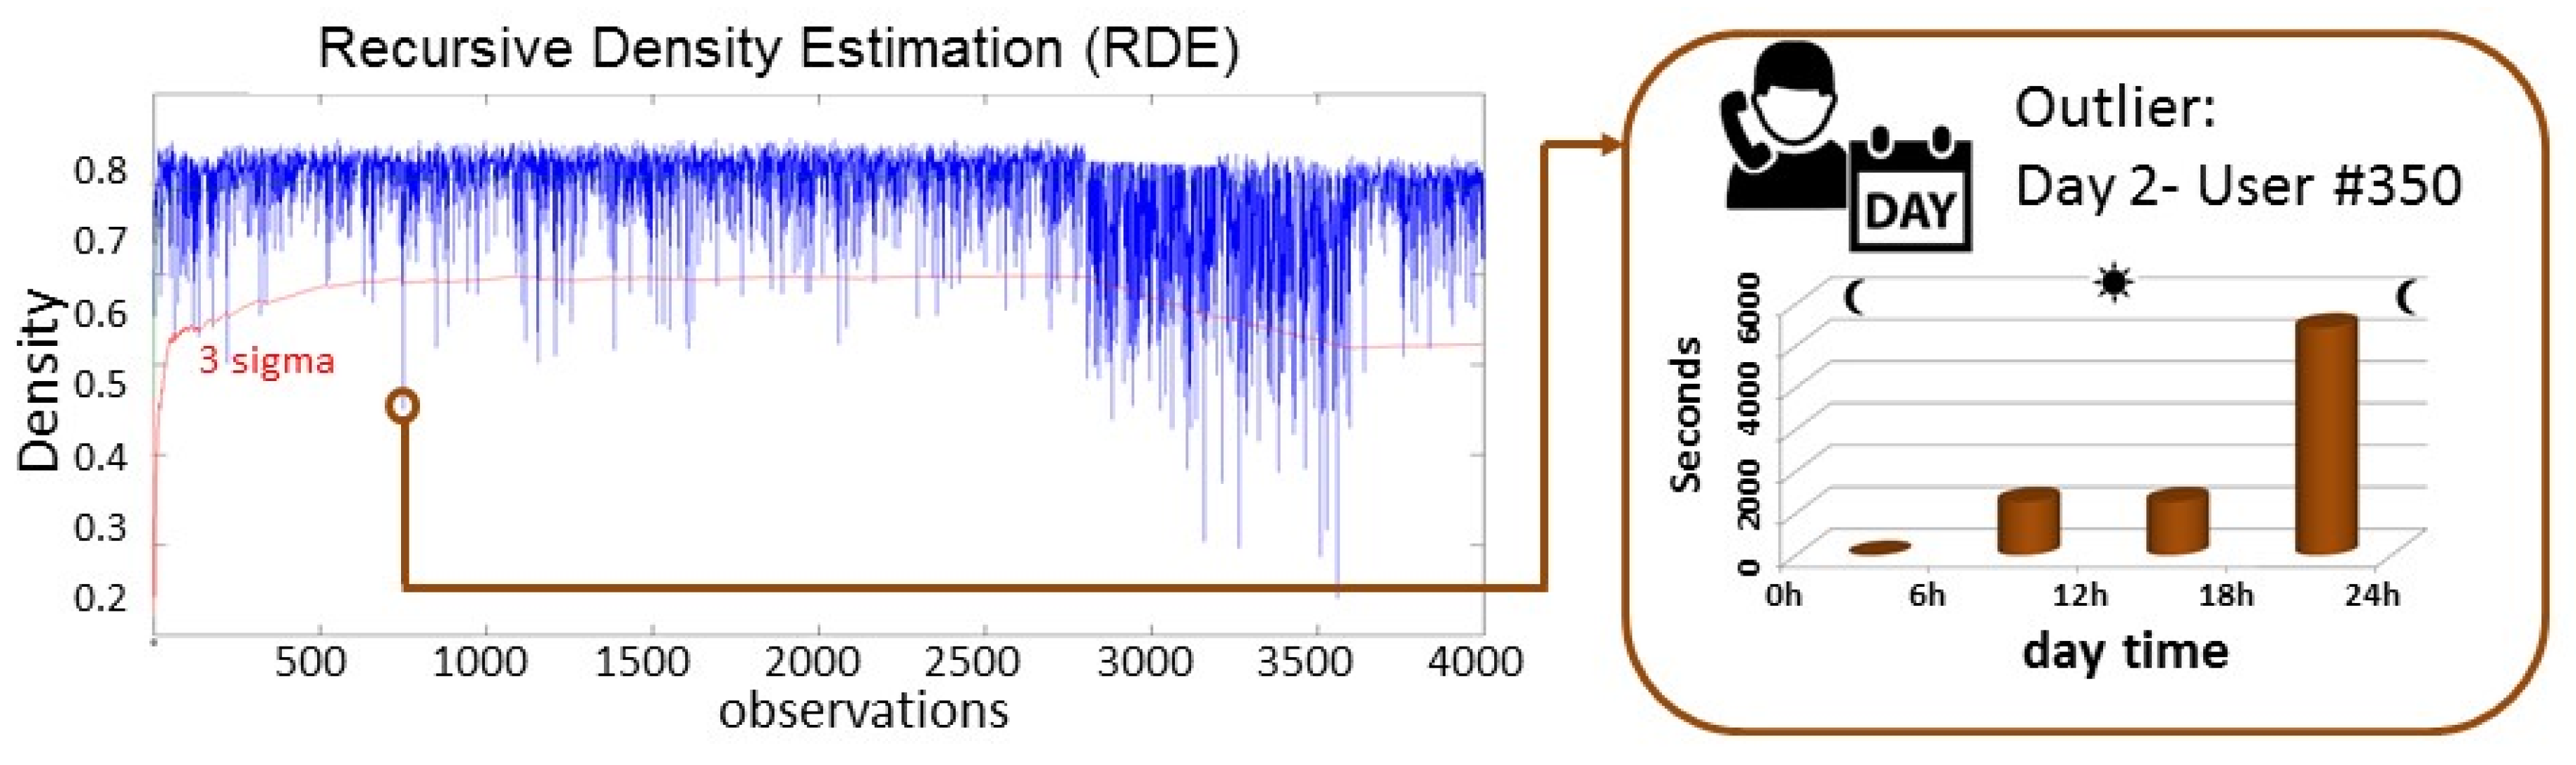
CallsDay6h, the density of the observations is also calculated recursively, and the outliers are selected if this density is lower than 3σ, as in the previous datasets.
Figure 6 shows the RDE of the 4000 observations and the information of one of the outliers. In this case, the outlier is the calling behaviour of the user #350 during the day 2. As it can be seen in the distribution of the four values, the total duration of the calls made in the evening is very high.
5.4. Application of RDE to Detect Outliers’ Calls
In this section, instead of analysing the behaviour of the callers (as it was done in previous sections), all the calls are analysed to detect outliers´ calls in real-time. In this sense, as it was previously explained, the initial dataset was represented by 9834 calls and the features that can be collected (without pre-processing) from the calls data set are the following:
Considering these three data, a data space in which are measured all the call data is created. Thus, for each new call, these three data are normalized and then its density is calculated recursively; if it is lower than a threshold, it means that the current call is significantly different (in terms of the three analysed features) than the previous calls. In this case, the normalization process is also very important since the three data are relevant to calculate the RDE.
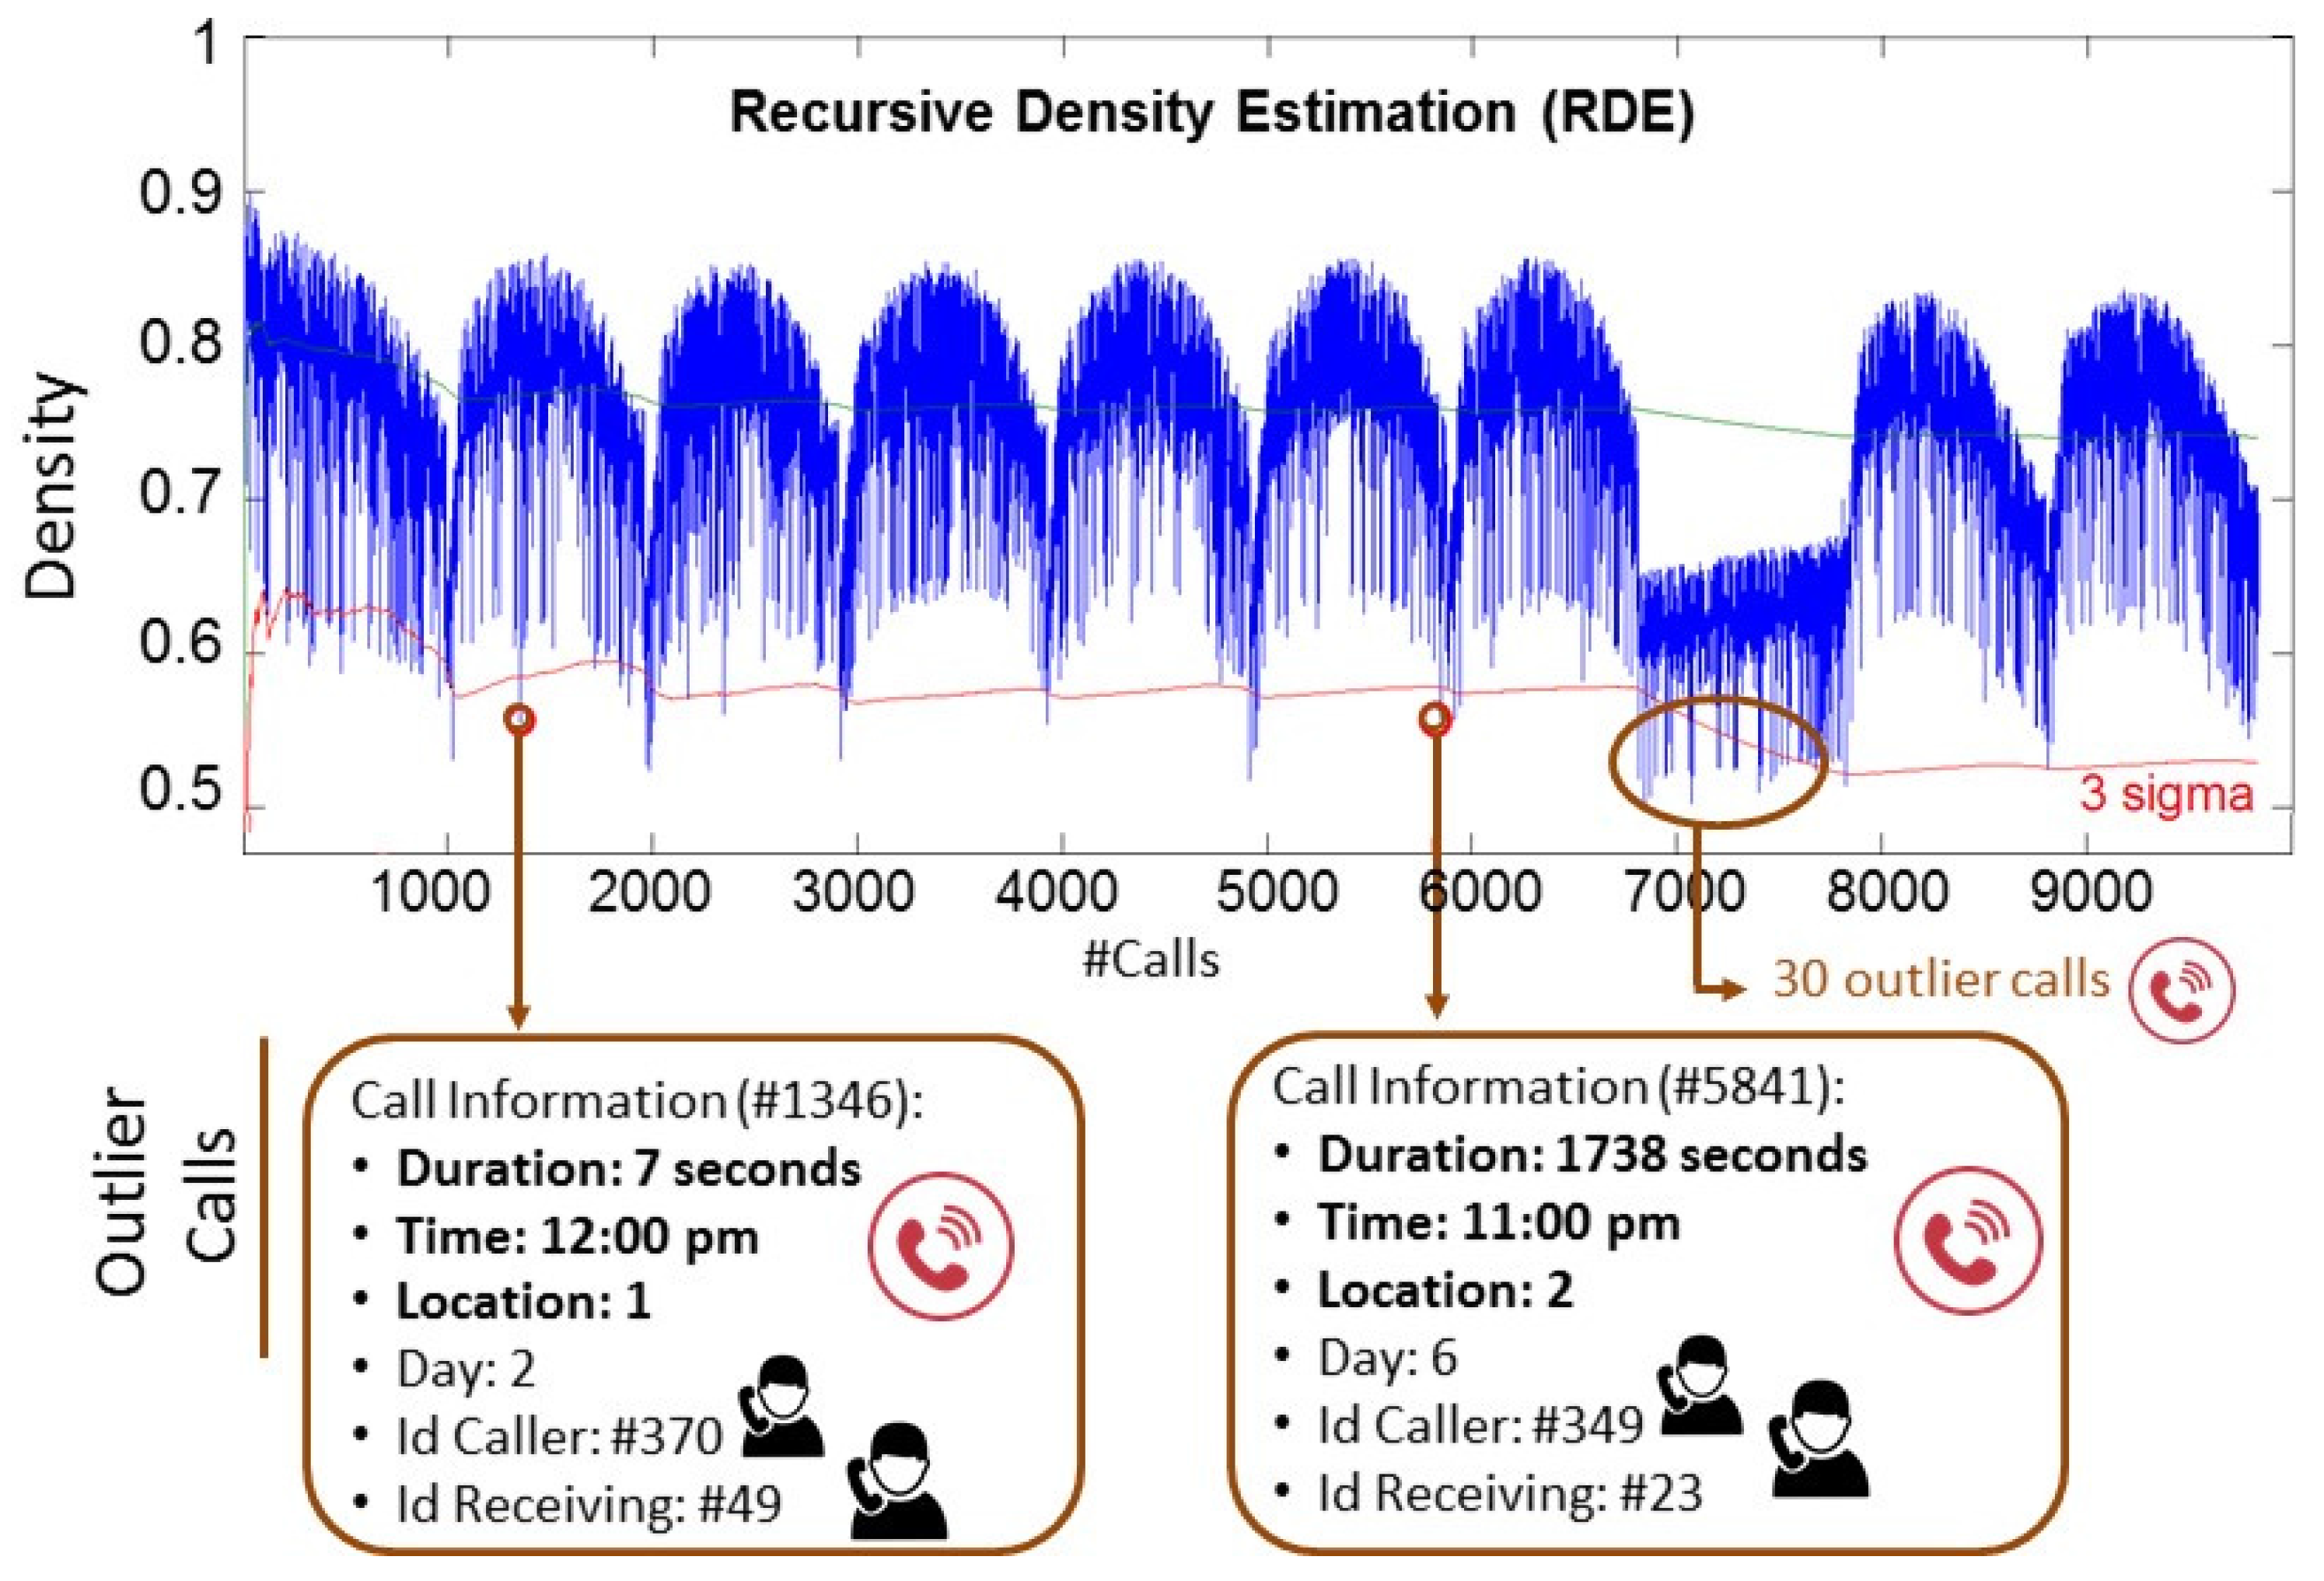
Figure 7 shows the density of the 9834 calls. Some of those calls are very different than the previous ones, as their density is much lower. In this case, a call is considered as outlier if its density is lower than 3σ. In that case, the corresponding information about the call and the caller can be analysed in detail. Below, two of these outlier calls are described:
Outlier call #1346: This call was made by the user #370 and the id of the receiving user is #49. The date of the call is day 2 at a time from 12:00 to 13:00, and it lasted only seven seconds. The location of the call origination cell tower is 1.
Outlier call #5841: The user #349 made this call to the user #23. The call started at a time from 11:00 to 12:00, and it was made in the day 6. Its duration was of 1738 seconds and the location of the call-originating cell tower is 2.
In addition, it can be observed from
Figure 7 that during the day 8, there are 30 outlier calls. In this sense, it is important to remark that the dataset used in this research is a synthetic dataset (CDRs), and the designers of these data possibly wanted to differentiate a day in which the calls were very different than usual. In real life, it can also happen since, for example, the calls on weekends or holidays are much more different than the calls during working days. However, these kinds of “special days” could be detected in advance and the RDE could be calculated considering only those days.
Finally, it is very important to remark that all the previous calls are considered to detect outliers. However, since there is no need to store all those calls, the proposed method is computationally very efficient and the outliers can be detected in real-time. In addition, since the calls’ data are not stored, it supports the privacy of customers.
6. Conclusions
An approach to automatically cluster callers’ behaviour and detect callers’ outliers using only information from CDR is proposed. The main novelty of the framework proposed is that it works in real-time, and the clusters obtained can be updated considering all the previous data recursively. Thus, the results change in time with any new call or caller considered and this evolution of the data stream is being analysed automatically as it takes place.
To evaluate our proposal, a CDR of 9834 calls (400 phone users) is used. This dataset has already been used in many different research works because it is very suitable for evaluating different tasks. It is important to remark that the pre-processing of the initial CDR is essential. In this research work, one of the specifications is that the extracted callers and calling patterns are related with a pre-defined time interval. The reason for this is that the obtained patterns need to be clearly understood. Thus, two different methods were applied: one of them is related with the calls done per hour and the other is related with a typical time division: morning, afternoon, evening, and night.
Finally, it is very important to remark that in this research, the calling behaviour of a user during a day has been clustered. However, in future work, it can also be analysed how a user behaves during several days to check, for example, if their calling behaviour changes in time or not. In addition, in future work, the proposed method will be validated on real mobile phone data.


