1. Introduction
Image processing, that is image manipulation and information extracting from sets of images, is widely used today in the field of medicine [
1]. One fast-growing type of application is the use of image processing to improve medical diagnostic effectiveness [
2]. Diagnostics that rely on imaging technologies such as Magnetic Resonance Imaging (MRI), Computed Tomography (CT) and X-ray benefit considerably from the practice of image processing. Images taken using these clinical procedures can be improved by post-processing algorithms that enhance image quality using contrast enhancement and noise reduction [
1], or automatically extract necessary information, as done in image segmentation [
1,
2]. While most of these tools are implemented as automated detection tools [
2], the final decision is always done by an experienced diagnostic physician.
The amount of images generated by imaging technologies today is growing exponentially. This fact can heavily burden the decision-making process done by the diagnostic physician. Therefore, a separate group of tools may be required, namely tools that reduce the amount of unnecessary images, and support a short and simple diagnostic process. In this study, we demonstrate how such applications, which consist of image-processing algorithms, can facilitate a pronounced improvement of the diagnostic process. Specifically, we chose the case of magnetic resonance (MR)-based diagnosis of multiple sclerosis (MS).
MS is an inflammatory demyelinating autoimmune disease that affects the central nervous system and afflicts over 2.5 million people worldwide. It is considered one of the leading causes of neurological-based disability in young adults [
3,
4] and the most common disease of the central nervous system that is characterized by the presence of white matter (WM) lesions [
5,
6].
The clinical diagnosis of MS is based on a patient’s description and on findings in neurological tests. A central non-invasive diagnostic test of MS is done using MRI [
7]. Conventional MRI techniques are highly sensitive in detecting brain abnormalities (e.g., MS lesions) and can provide quantitative assessment of inflammatory activity and lesion load [
7]. MRI-derived metrics have become established as the most important para-clinical tool for a variety of applications, such as brain lesions diagnosing and monitoring [
8], longitudinal studies of cognitive aging [
9], or even the analysis of fetal brain development [
10]. According to the McDonald criteria, diagnosis of the disease requires finding MS lesions in at least two separate areas of the brain [
6,
11,
12], and several images are sufficient for diagnosis.
MRI images offer a high contrast between the main types of brain tissues, namely gray matter, white matter, and cerebrospinal fluid. Many different types of MRI tests exist [
6,
13,
14].
Also, different MR pulse sequences produce images with different appearances, highlighting different tissues because of sensitivity to naturally occurring (endogenous) contrast or exogenous contrast (i.e., intravenous gadolinium contrast agents), and elaborate on FLAIR etc. Turbo inversion recovery magnitude (TIRM) is a type of inversion recovery MRI pulse sequence.
However, not all of them are relevant for MS diagnosis. While previous studies mostly used the FLAIR images together with either T1 or T2 weighted images [
15,
16], in this paper we use a wider range of MRI image types [
17,
18,
19,
20], including T2 FLAIR, T2 FSE, T2 TS, T2 TIRM and T1 FL2D.
The use of computer-assisted detection/diagnosis (CAD) in other fields such as mammography [
21,
22] is well known. Current MR consists of 500–700 images of various types for each tested subject; as many as thirty for a single type (accounting for the different coordinates of the virtual brain slices). Additionally, within images that belong to a suitable type, a significant portion is concerned with brain areas that are irrelevant for the diagnosis (i.e., images of areas without WM lesions). Altogether, the vast majority of images are not useful for diagnostic purposes.
Currently, decoding of these images is performed manually by a specialized diagnostic physician who reviews each image separately, and looks for images which are relevant for the identification of MS lesions, if any exist. The problem we address is that manually reviewing a large collection of images makes the process lengthy and complicated.
In this study, we present an automated solution to the problem, a solution that consists of several algorithms including file type selection, image enhancement and lesion detection. The combination of these algorithms is used to reduce the amount of relevant images presented to the diagnosing physicians by more than 98% while enhancing the information in each presented image, therefore greatly improving the efficiency of MS diagnostic process.
2. Methods
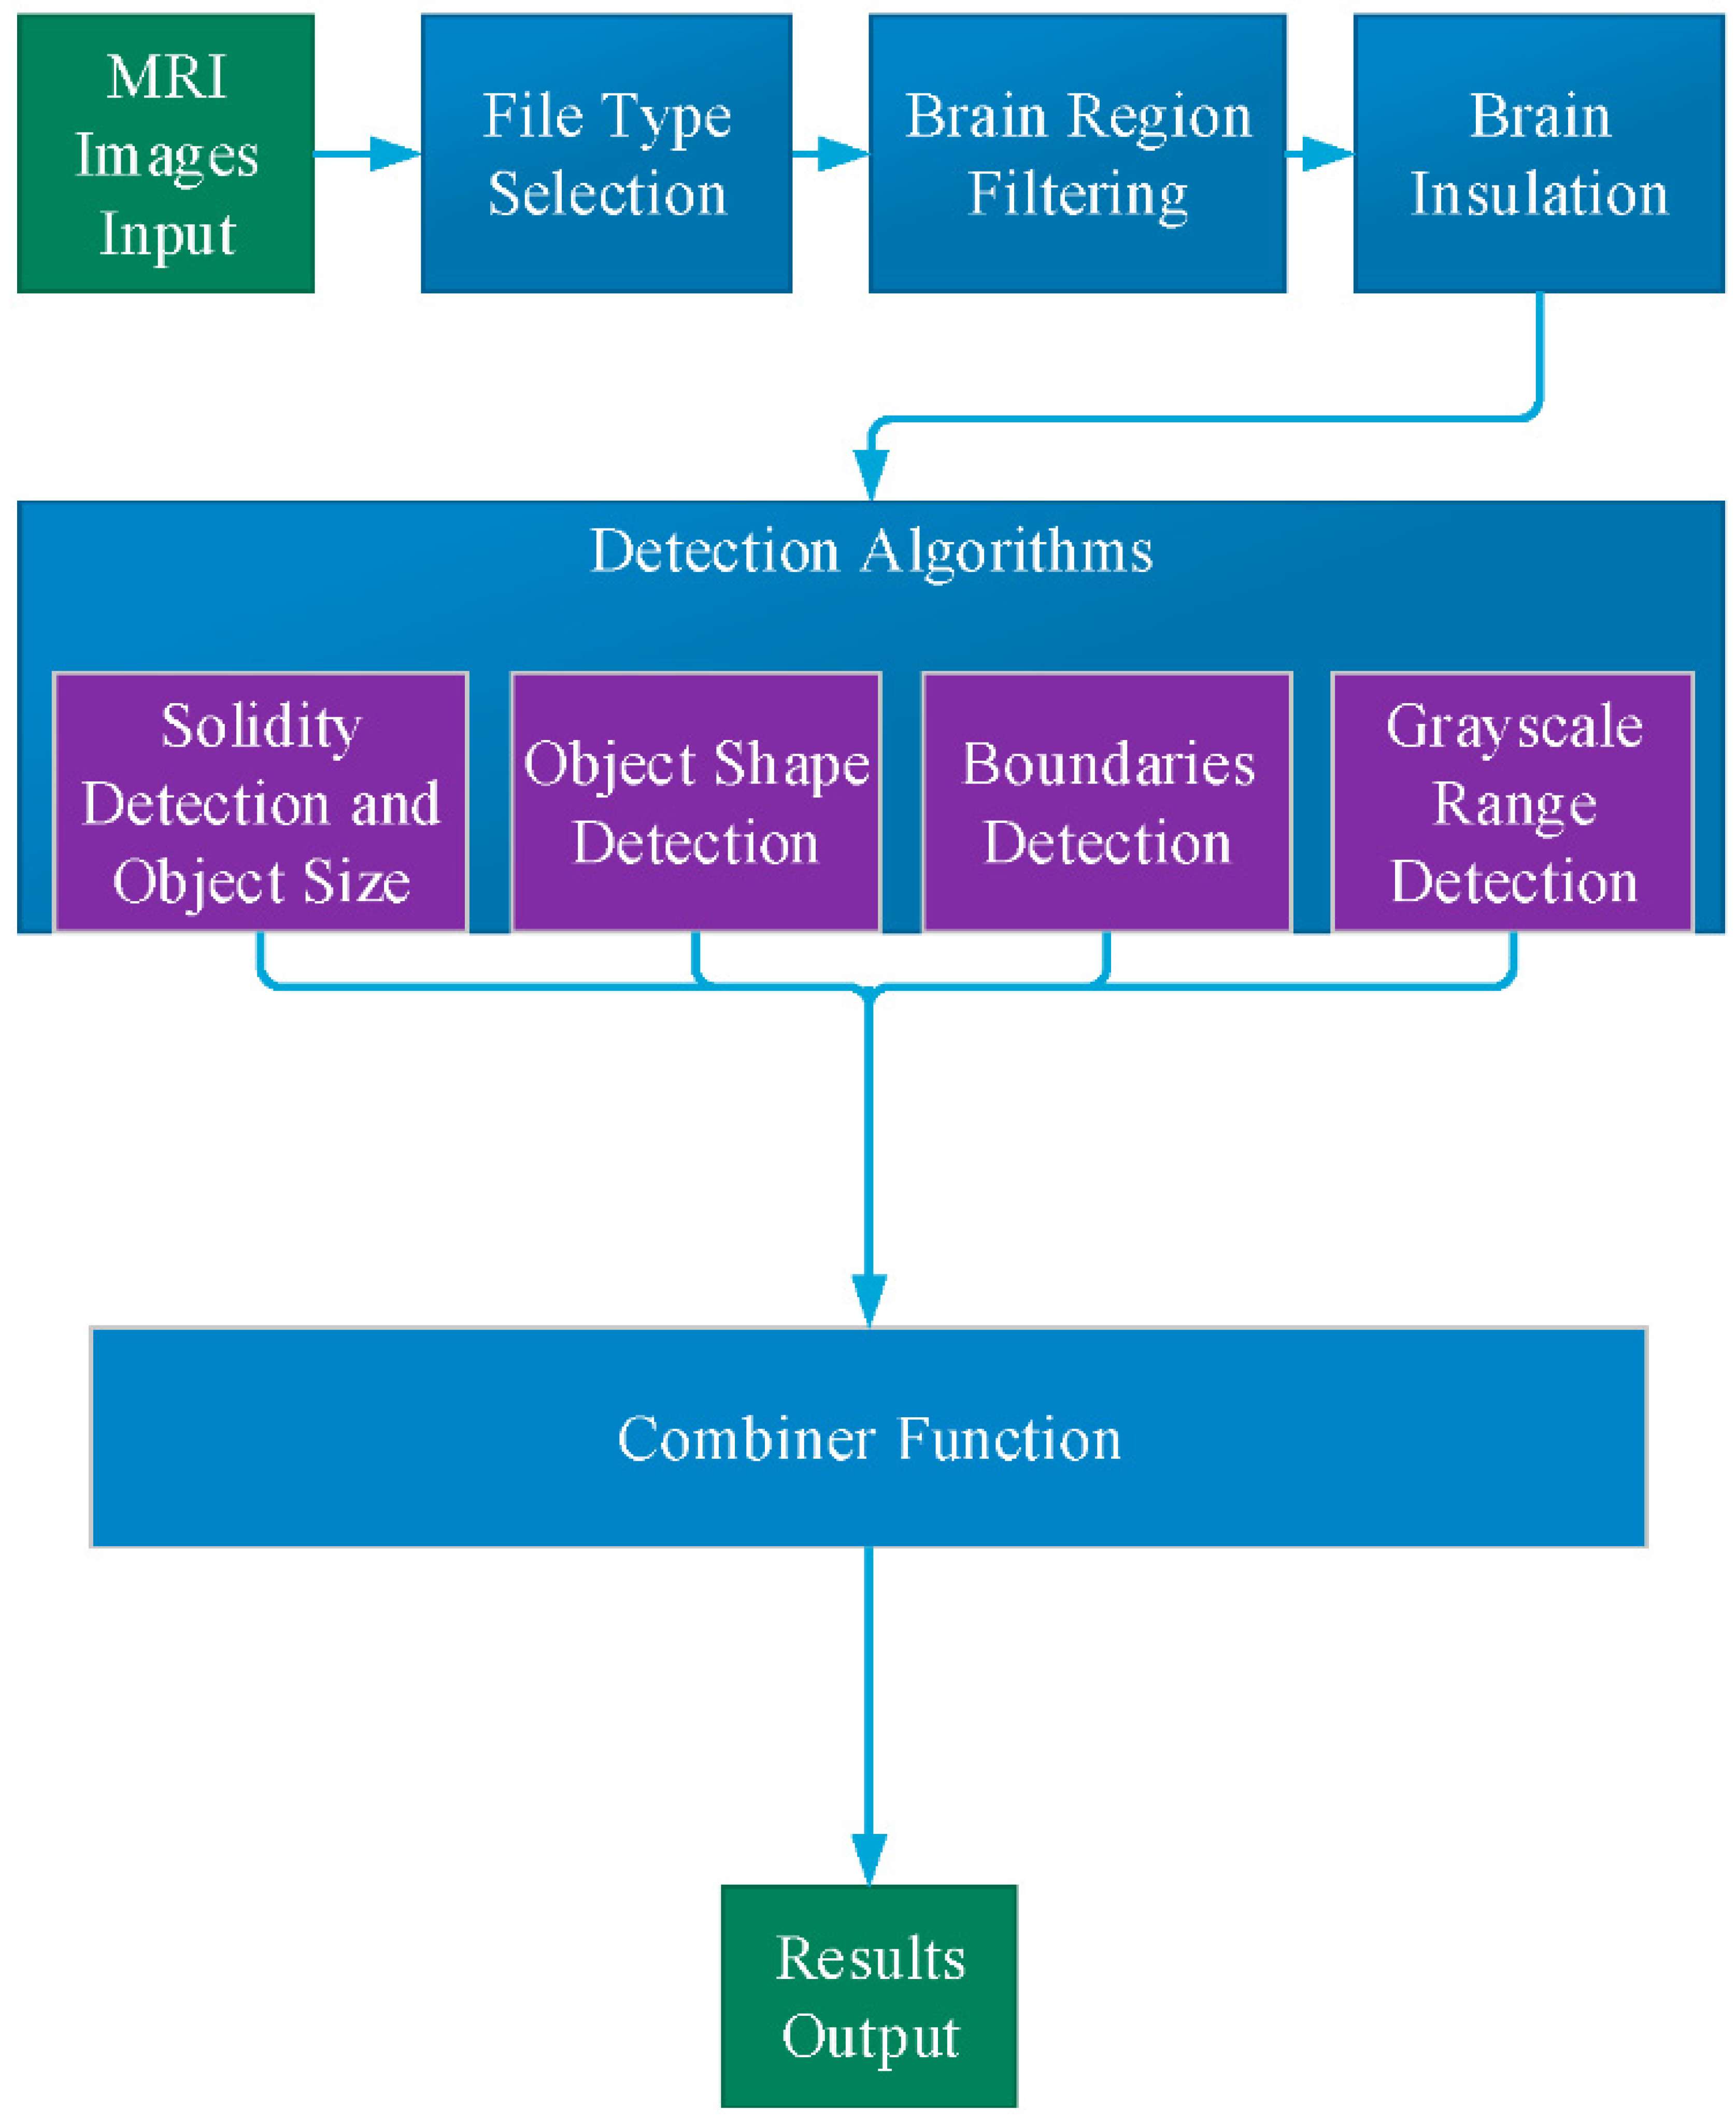
General description of the application is described in
Figure 1. The user defines the input study, which contains the full set of MRI images of a single test. As an output, the application displays only the images that are relevant to the diagnostic process. The MR images within a selected study initially pass through two filters:
The remaining files (5–8%) continue to a preprocessing stage, which performs skull stripping.
The next step, detection of MS lesions, employs four separate processing procedures: Solidity Detection and Object Size, Boundaries Detection, Object Shape Detection and Grayscale Range Detection.
2.1. File Type Selection
The first step is file selection by image type. From all the images produced by a single MR test, only the following types are relevant for the diagnostic process: Ax T2 FLAIR, Ax FSE T2, AX T2 TSE, Ax T1 FL2D and Ax T2 TIRM. The algorithm generates a list of all DICOM files from an MRI directory, and by using the appropriate DICOM files it selects only the relevant types and creates a privet list. This process filters 80–85% of the existing images.
2.2. Brain Region Filtering
After type selection, several dozen of images remain, however many of them may be irrelevant for MS diagnosis, since they do not contain brain area with WM. By detection of WM, the images that do not contain any of it, and are irrelevant for the diagnostics, can be removed.
The detection process of the WM is based on comparison between two vectors (“test vector” and “reference vector”), where the “reference vector” is created by an average on a set of reference images with WM, and the “test vector” is the image we wish to test for existence of WM. We also define a threshold value for each type of MRI since different devices may have different calibration and produce different image features.
In order to perform the comparison process, all the images need to be in the same structure. We used three steps of pre-processing: (1) image registration to perform an alignment of the brain to a perfectly vertical angle; (2) image trimming of the empty frame, according to extreme points of the brain area (min, max); (3) reducing image size to 32 × 32 pixels.
After image pre-processing, the final filtering process is performed by a comparison process between the test images and the reference image. The condition of comparison is given by the difference between every single image and the reference image:
where
Vr is reference vector ,
Vt is test vector and
N is the number of pixels (in our case
N = 1024 pixels). If the total error is lower than the threshold value, this image stays in the list because it may have a WM, and if the value is above the threshold value, the image is removed from the list. The threshold value is set empirically.
2.3. Brain Isolation
It is necessary to isolate the brain from the skull in order to detect lesions in the brain area. The skull area is removed from the image by the following steps: (1) transforming the gray level image to a binary image using a simple threshold; (2) detecting the largest area, which is the brain area (the brain is the largest element in the image); (3) creating a mask which excludes everything outside the brain area; (4) using the mask on the original image and deleting everything outside the region of interest.
2.4. Detection Algorithms
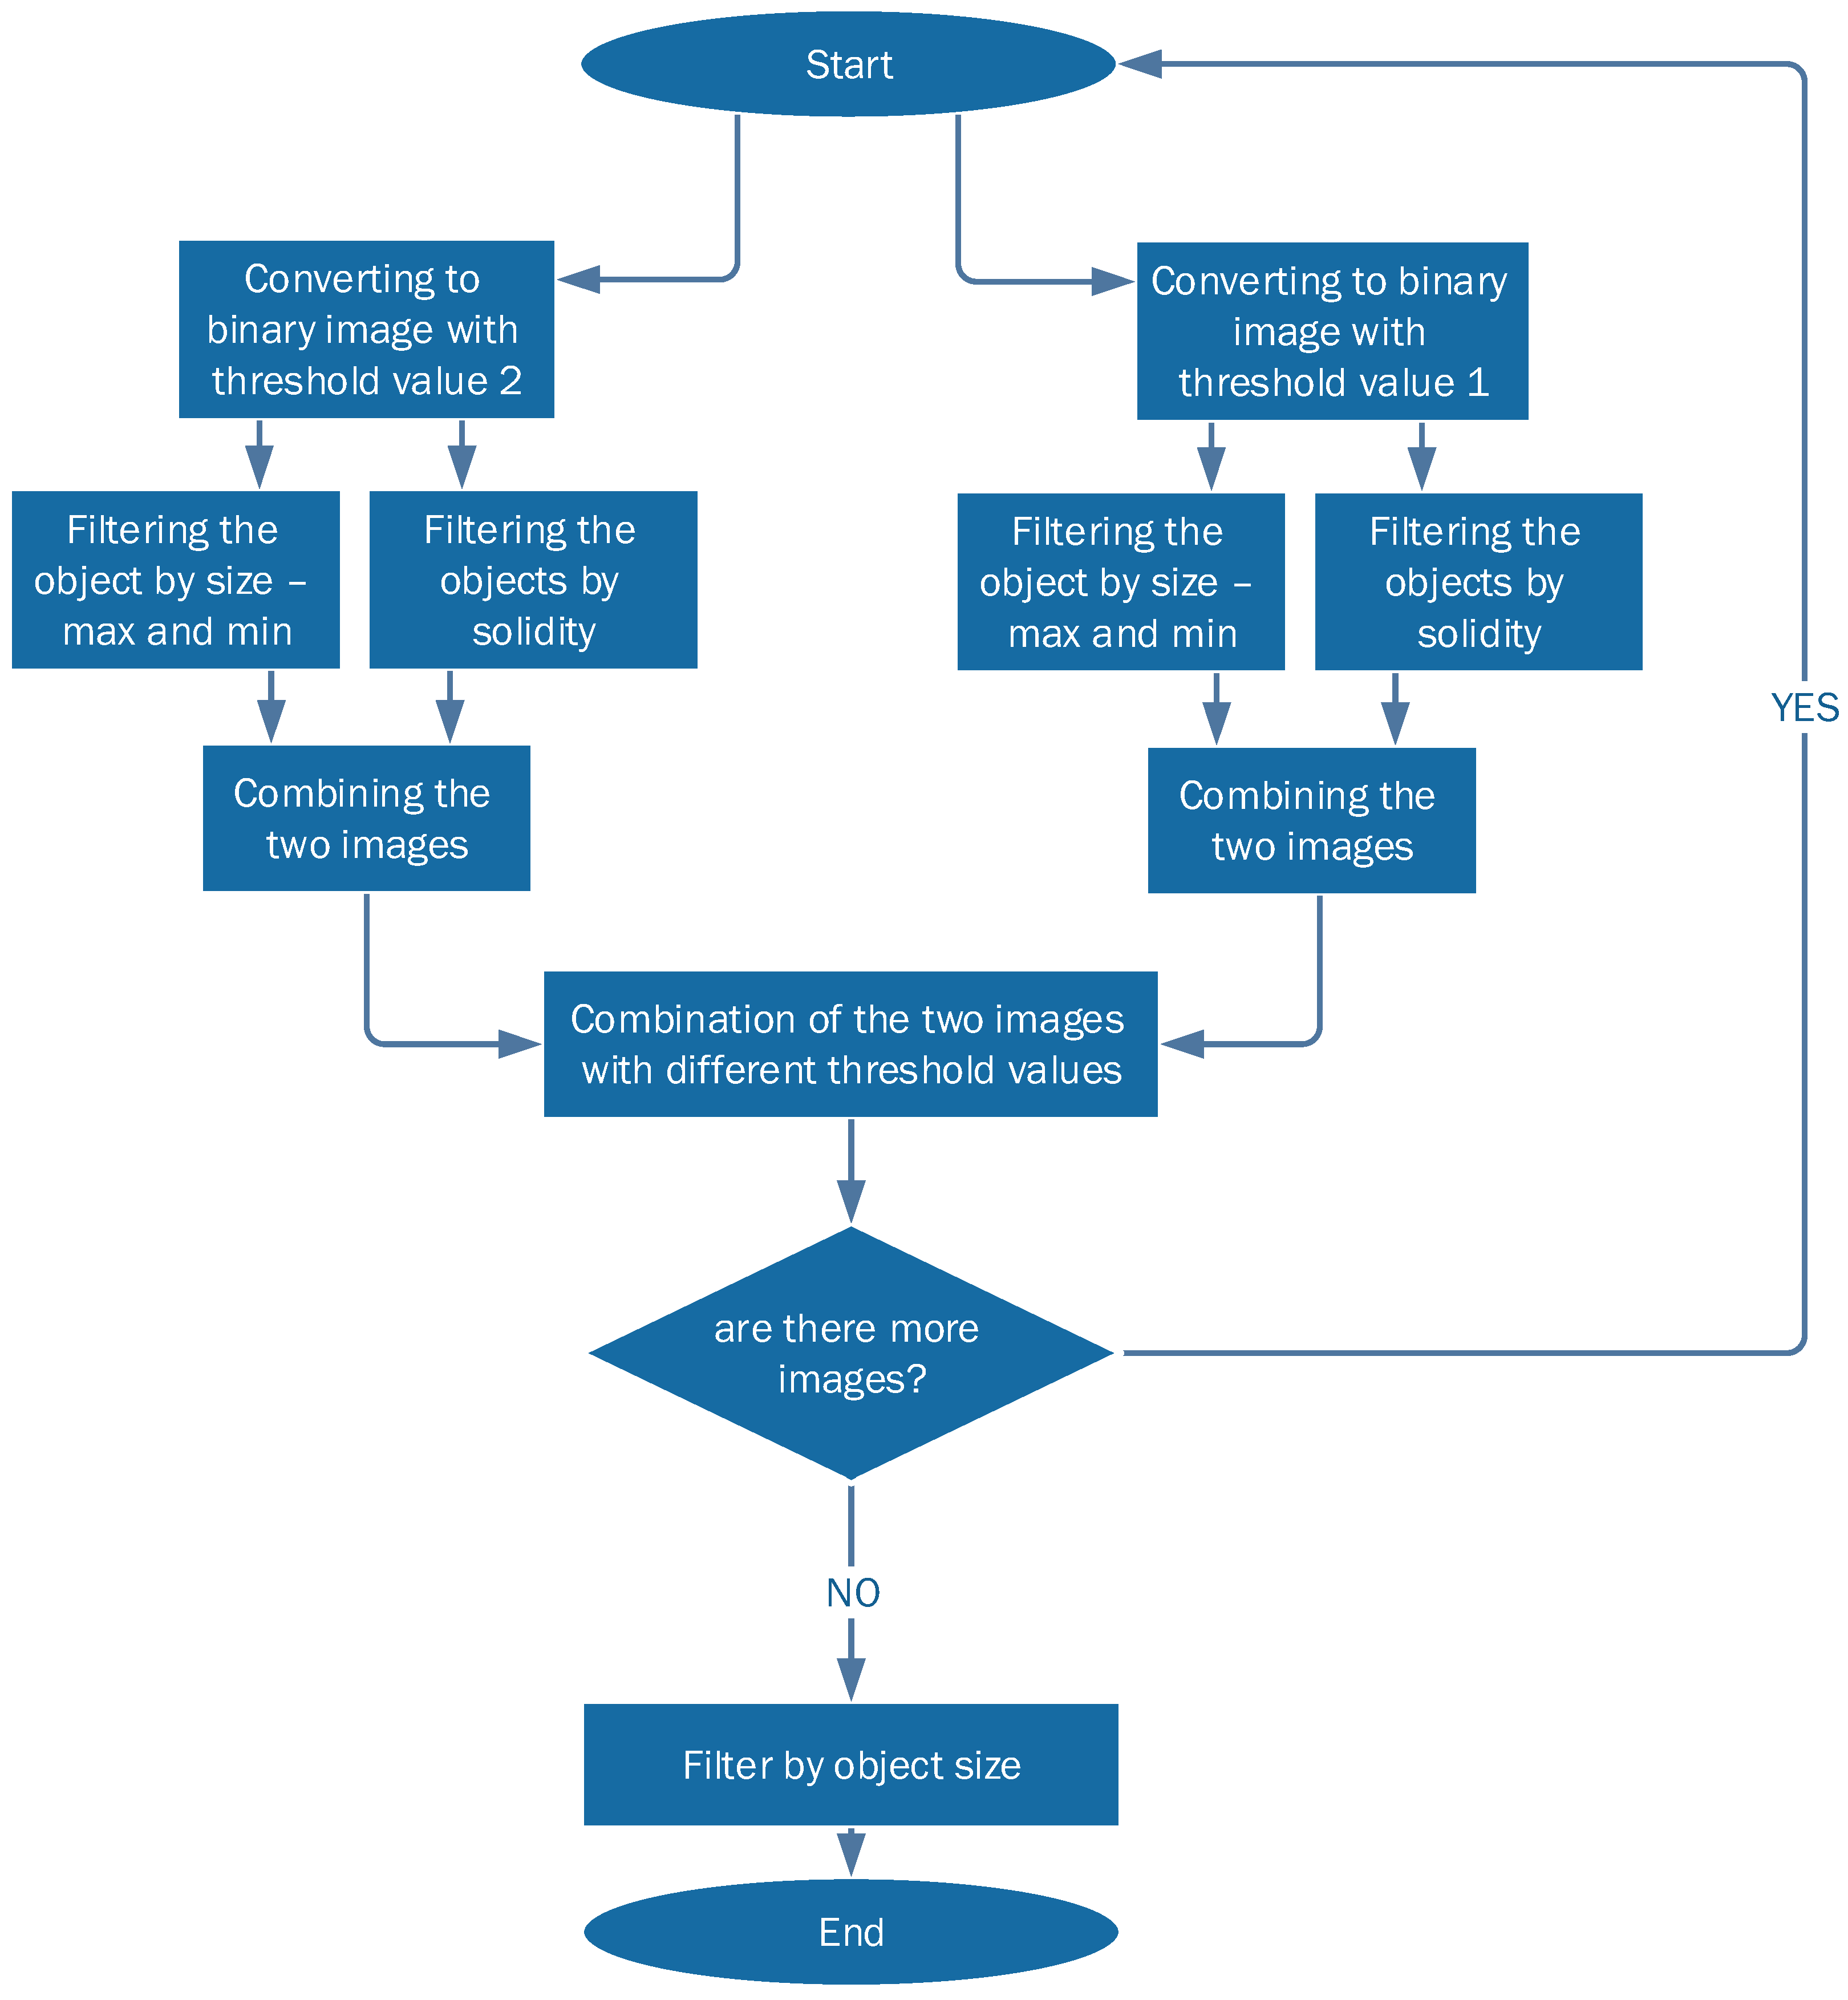
2.4.1. Solidity Detection and Object Size Filtering
This detection algorithm is depicted in
Figure 2. As the shape of the MS lesions is often an ellipsoid or a circle, the algorithm is based on the curvature level (solidity) of each object in the image. The algorithm operates as following:
The images are converted into two binary images with different thresholds. This is done in order to collect all the relevant objects by simplifying the identification process.
Each threshold image goes through two additional levels of filtration:
- (a)
Filtering objects by size: objects that are either too small or too large are discarded.
- (b)
Filtering out all objects with curvature that does not match MS lesions statistics.
The two resulting filtered images are combined into one: candidate MS lesions are positive in both images.
The two combined images (each with different initial threshold) are combined into one, resulting in a full picture, with enhancement of lesion-suspected objects and reduction of the irrelevant objects.
2.4.2. Boundaries Detection
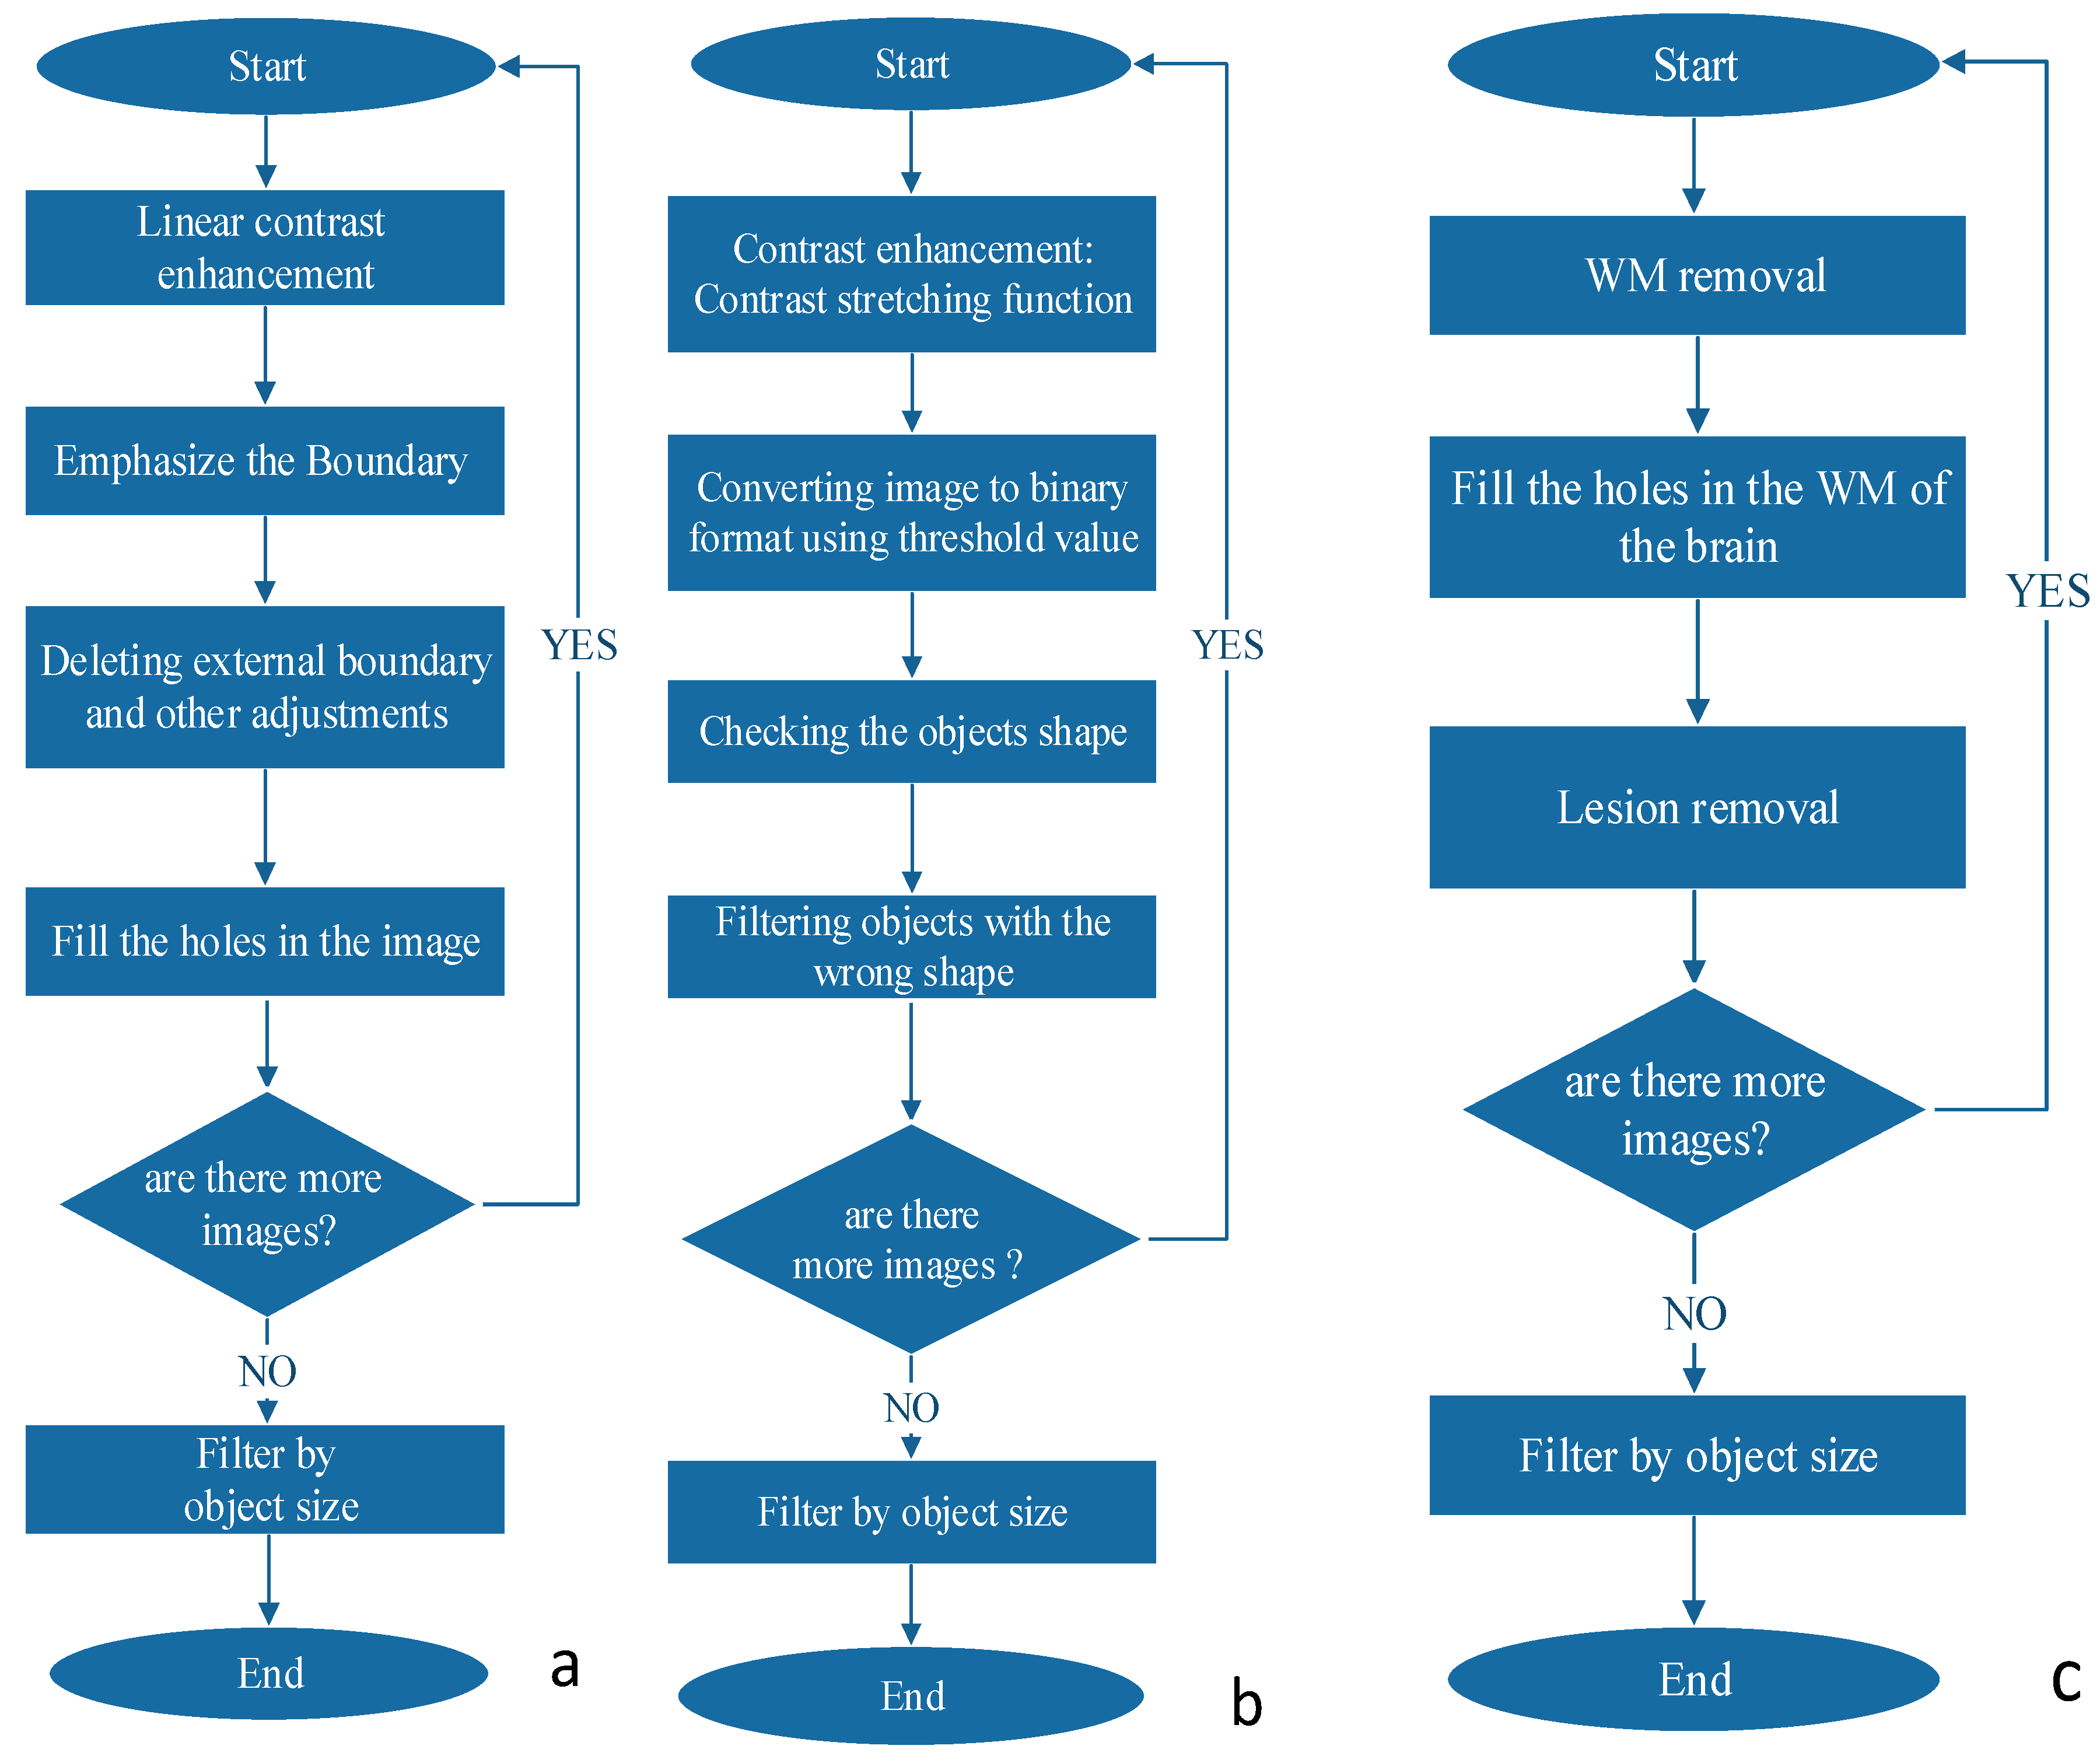
The boundaries detection algorithm is described in
Figure 3a. The MS lesions that are in the WM of the brain differ by their gray levels. This fact was used to define the closed borders of the lesions. First, we increased the contrast differences between WM and lesion grayscale values using the MATLAB (MathWorks, Natick, MA, USA, 2013) function “imadjust”, which performs a linear contrast enhancement. With the improved contrast we searched for the boundaries of the objects within the image using canny edge detection algorithm. The boundary between the background and the brain area needs to be removed since it does not contain any important information. Next, we filled the holes and deleted fine lines that do not form closed boundaries. Finally, all objects are filtered according to their size.
2.4.3. Object Shape Detection
The object shape detection algorithm is described in
Figure 3b. Looking at the MRI image of MS, one can easily see that most of the lesions are in a shape of a circle or ellipsoid. This observation can be exploited as a criterion for the detection of the disease. The first step is to improve the contrast of the image. In this stage we received the best results of detection method by using contrast-stretching function. The next required step is to convert the MRI image to a binary one, using a simple threshold method. Next, we perform registration, i.e., numbering all the objects found in the image. We have extracted shape parameters of the object using MATLAB function “regionprops”. We used the ratio between the area of the object and the area of the rectangle that is blocking this object to assess the shape of the object. The resulting objects were filtered according to their size.
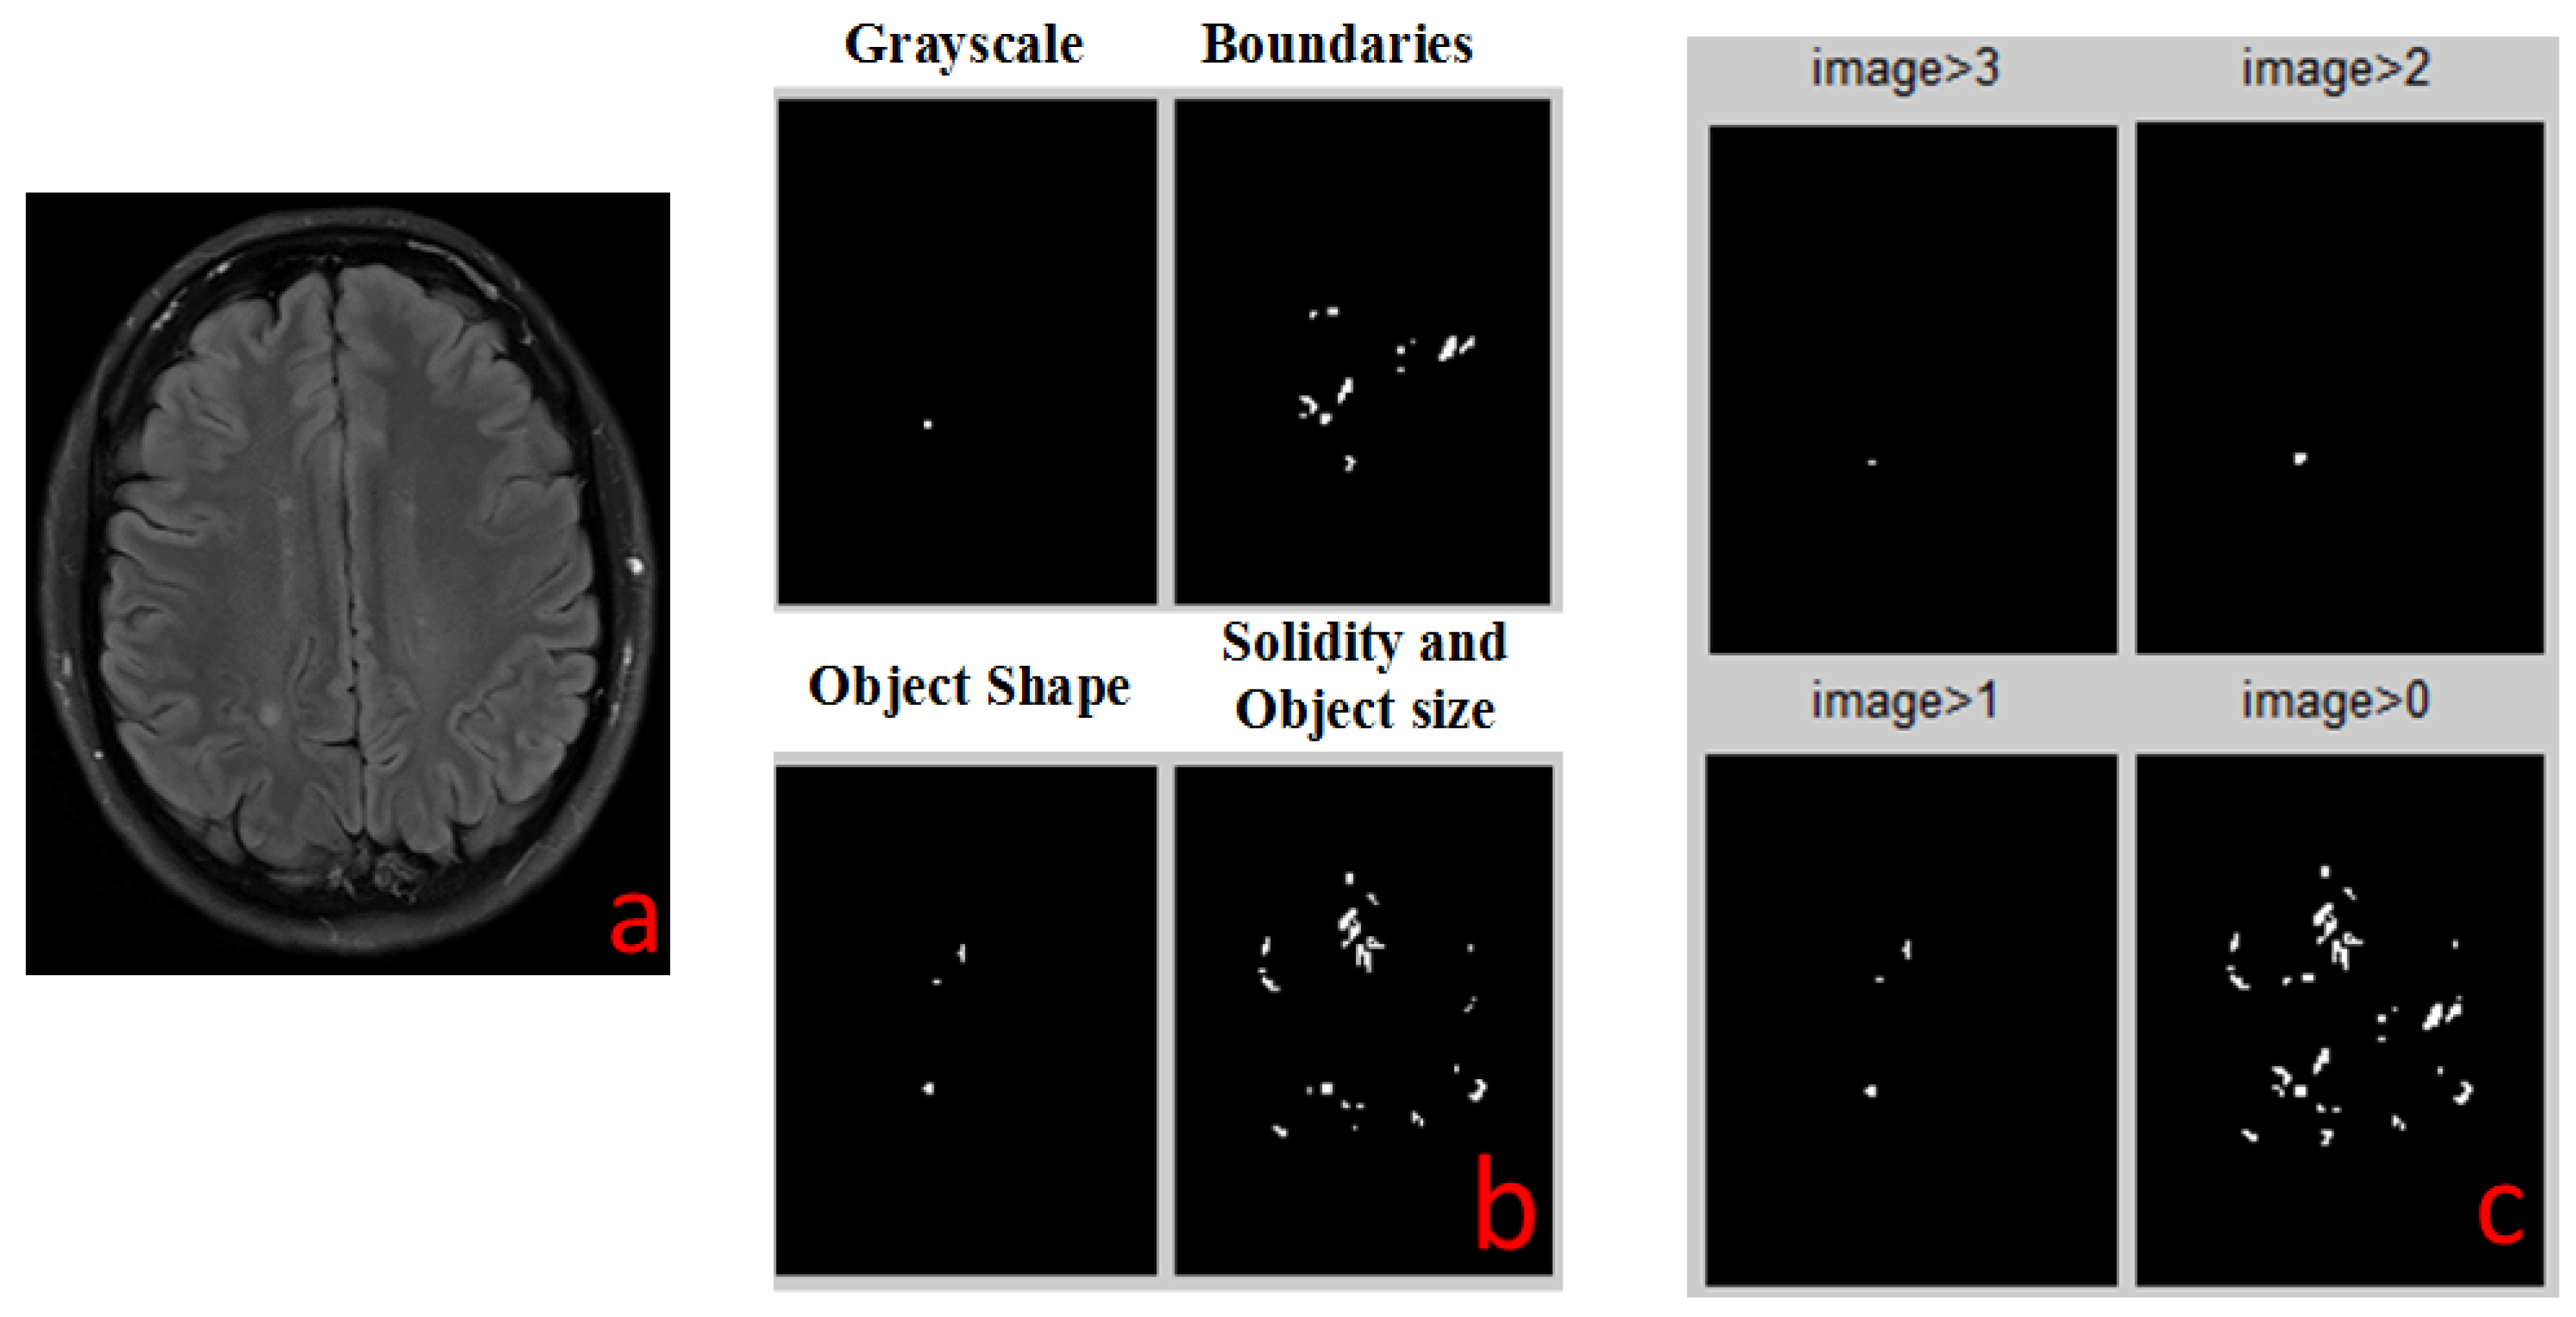
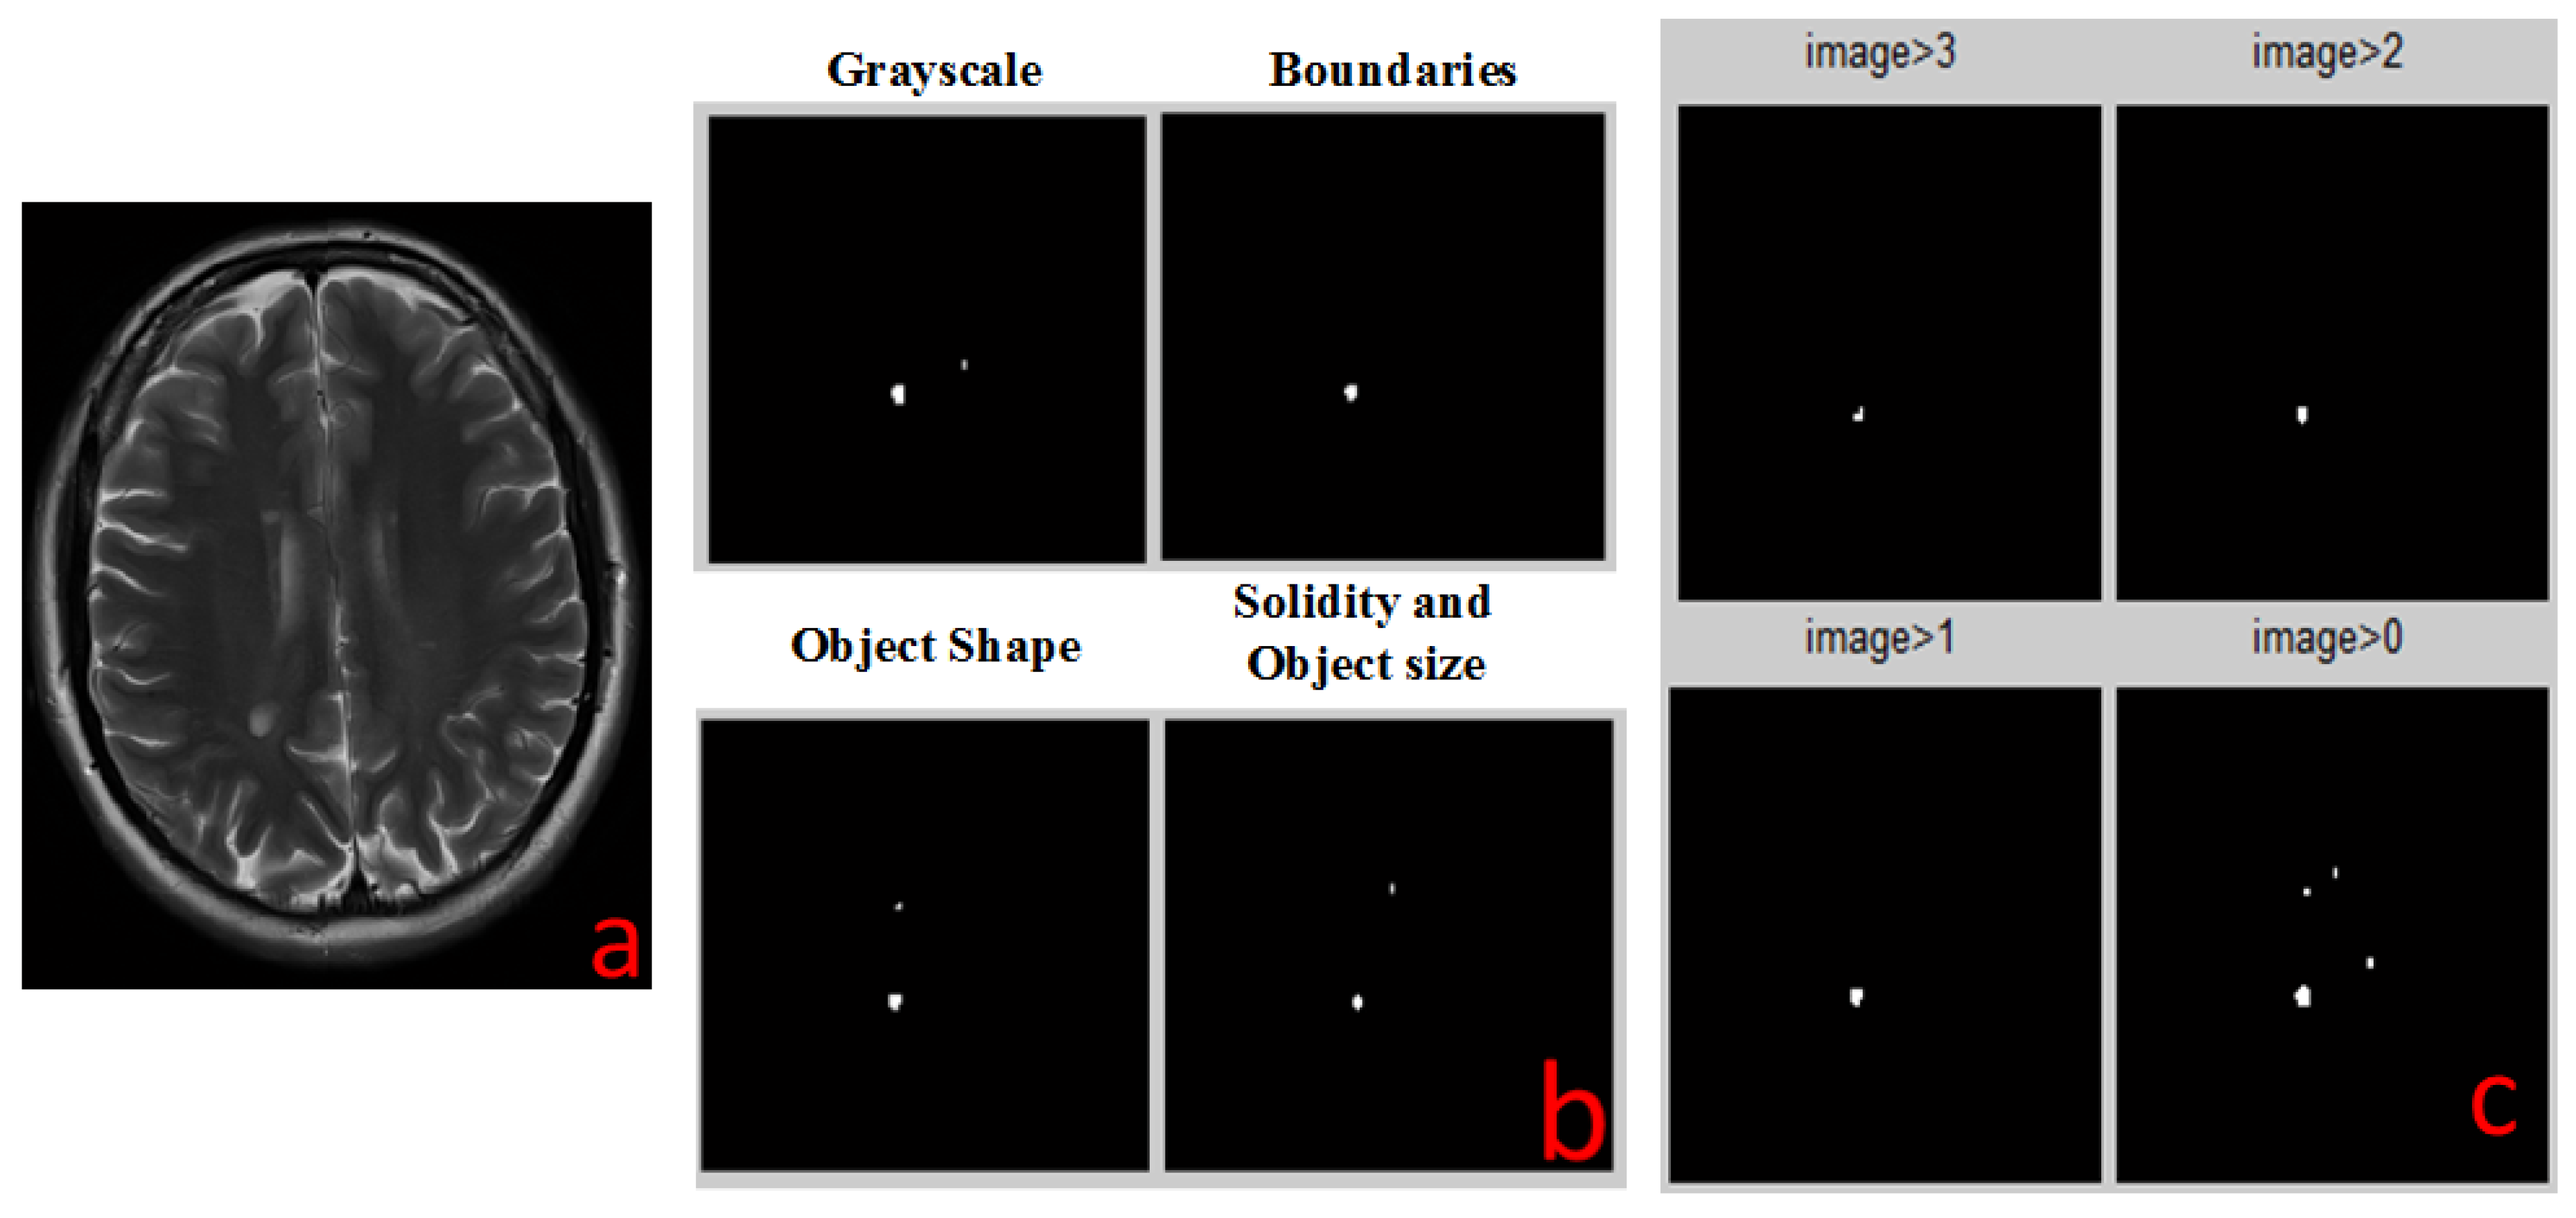
2.4.4. Grayscale Range Detection
The grayscale range detection algorithm is described in
Figure 3c. MS lesions usually appear at a very narrow range of grayscale. An algorithm for MS lesion detection based on this characteristic of “detection by grayscale” is very simple to implement, but there is an issue we must address before we can use this method. A relatively large amount of unwanted areas (noise) with the same grayscales appear in the image, but the main difference between the noise and the lesion of the disease is that most of the noise is outside the WM of the brain while the lesion is in this region. We added to the algorithm several steps to screen out the noise. We first check and define grayscale ranges of WM and of lesions in each type of MR images. Then, we define a mask to separate between the pixels that are included in brain WM and those excluded from it. By this action we cut out most of the noise but at the same time we cut out the lesions as well. Because MS lesions can only be found in WM areas, we use the MATLAB function “imfill” to fill the holes in the WM areas, which are in fact the lesions themselves. Multiplying the original image by the aforementioned results produces an image that contains WM and any internal part of the brain. Next, the algorithm defines the pixels that are outside the lesion area and term them as “0” and those that are inside are termed as “1”. The last step, as in all detection algorithms, includes filtering according to the size of the object.
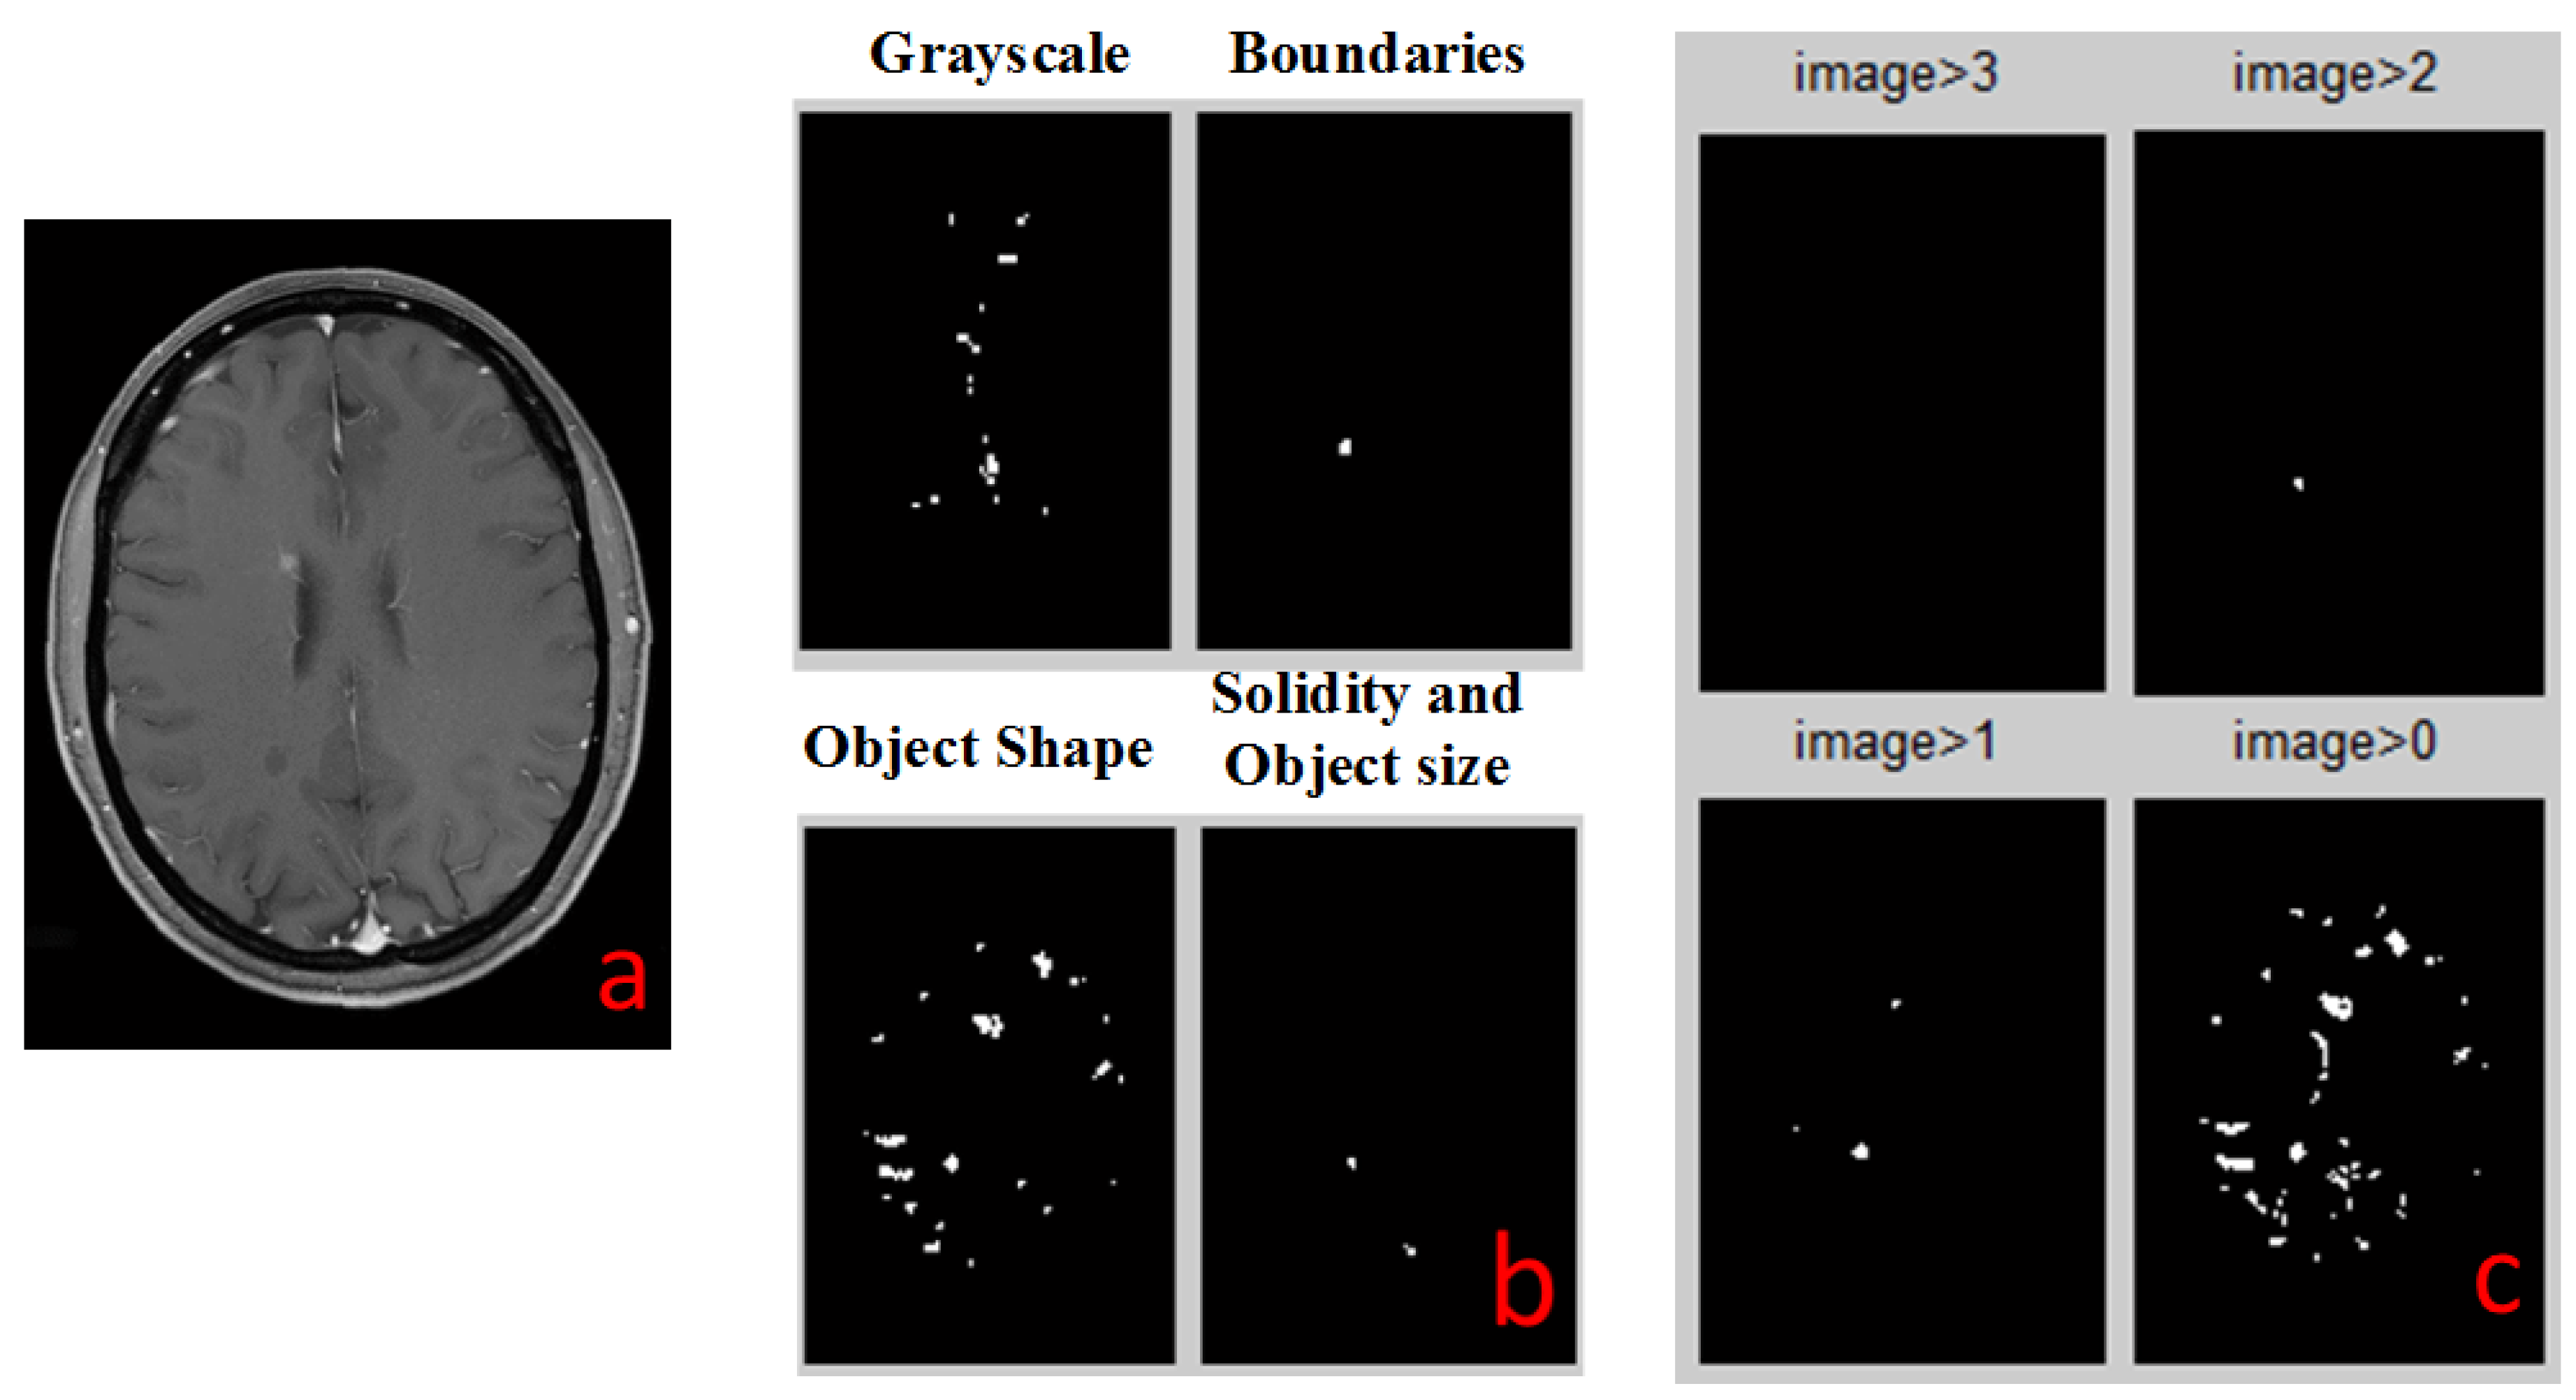
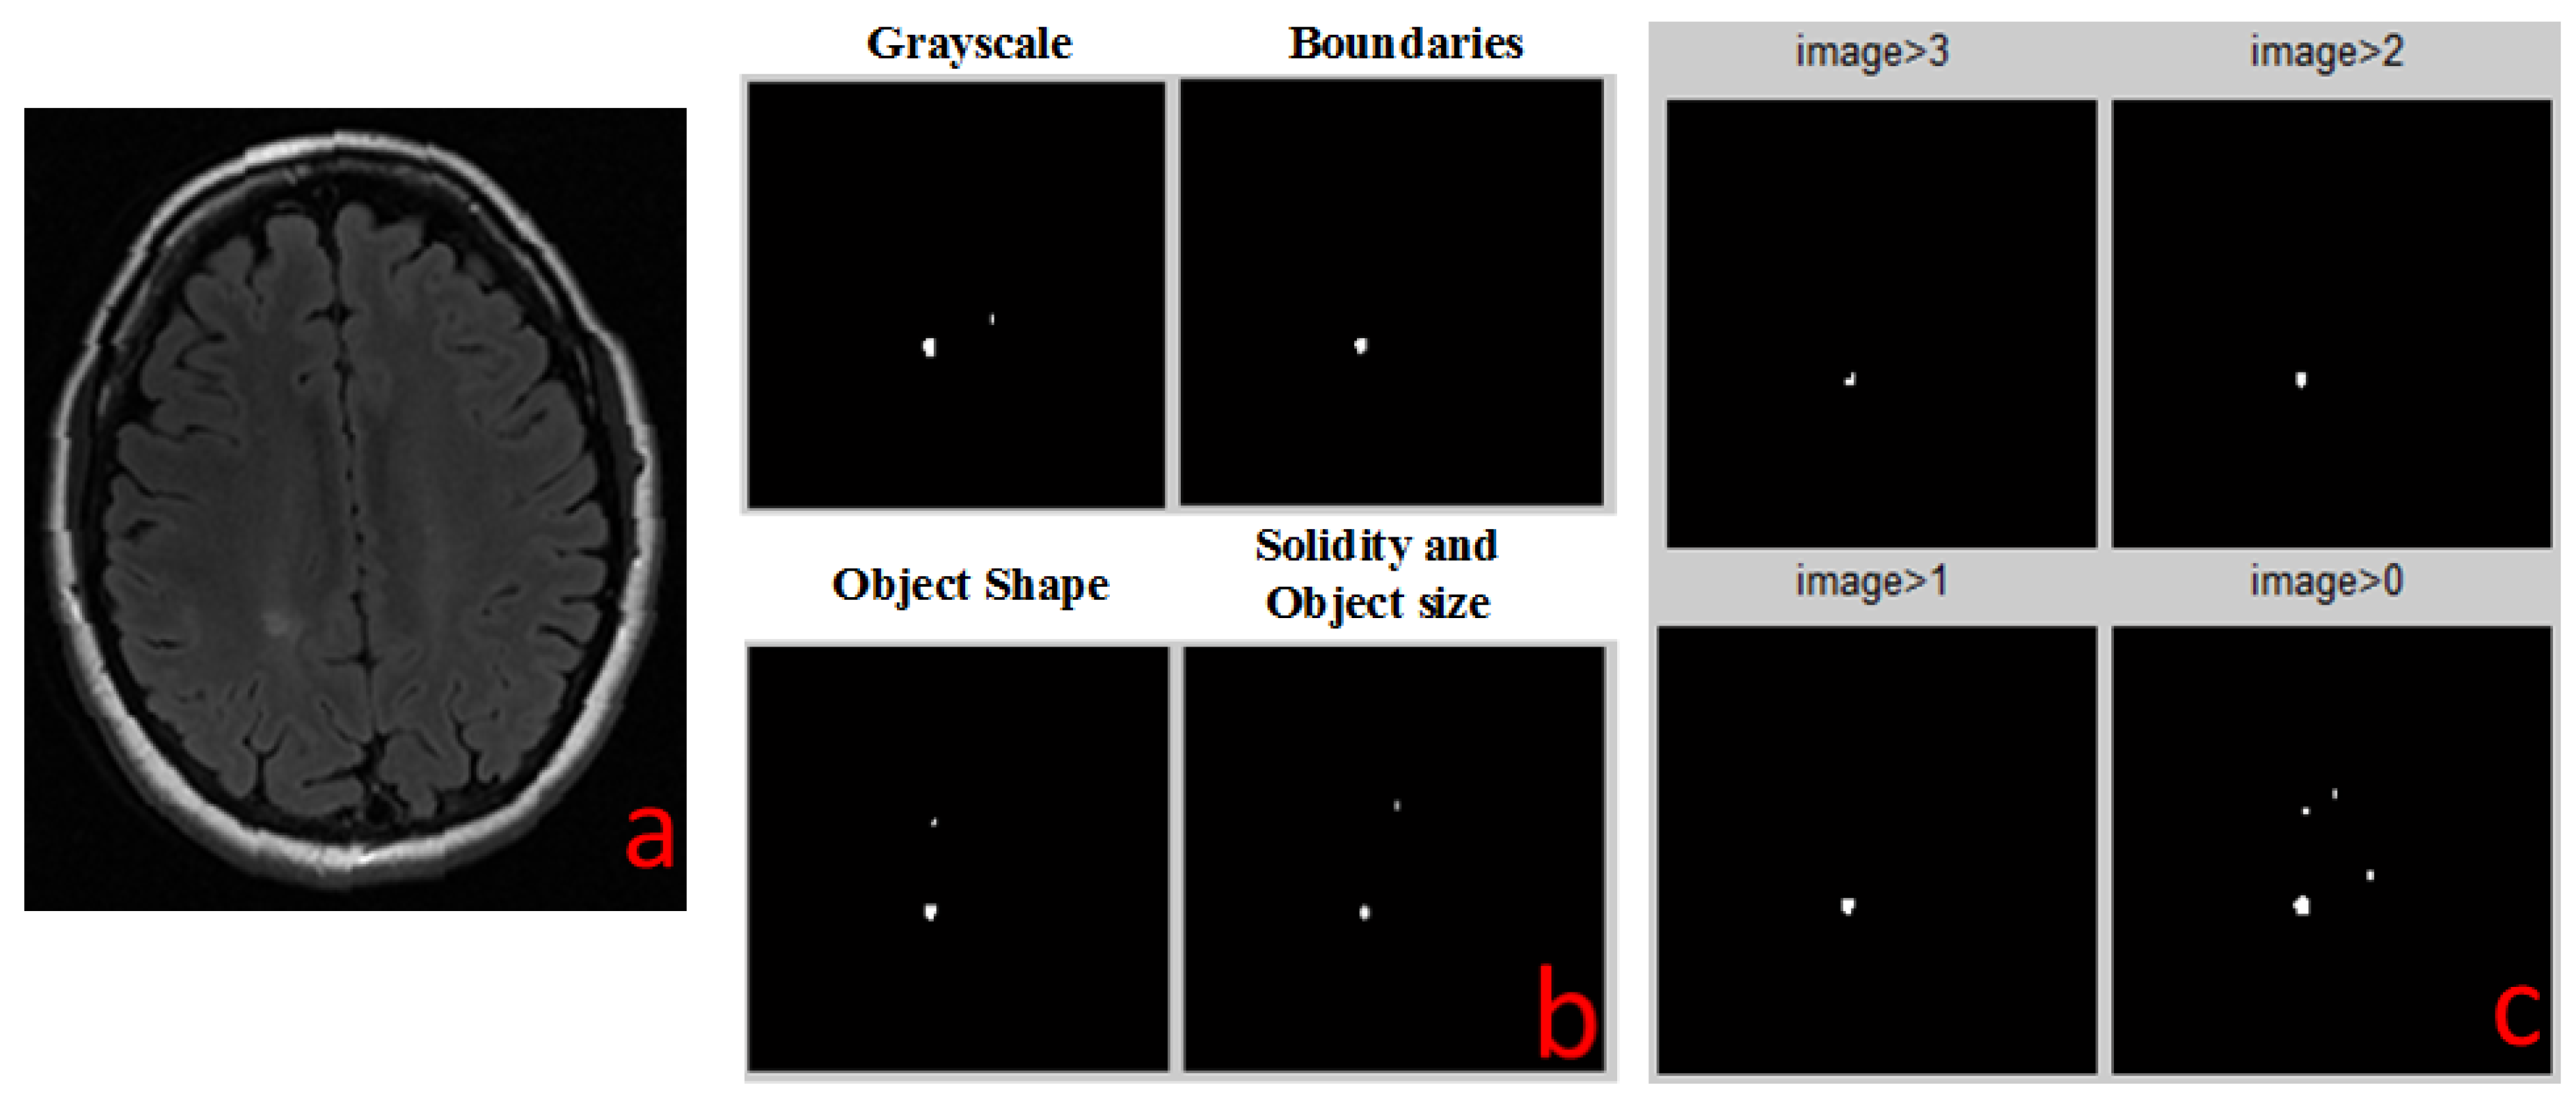
2.5. Combiner Function
Every single detection algorithm has its error in detections. In order to improve the success rate of the detection method, we use all four algorithms and then eliminate most of the errors. It follows that the combining between all the methods is necessary and more effective in getting more accurate results.
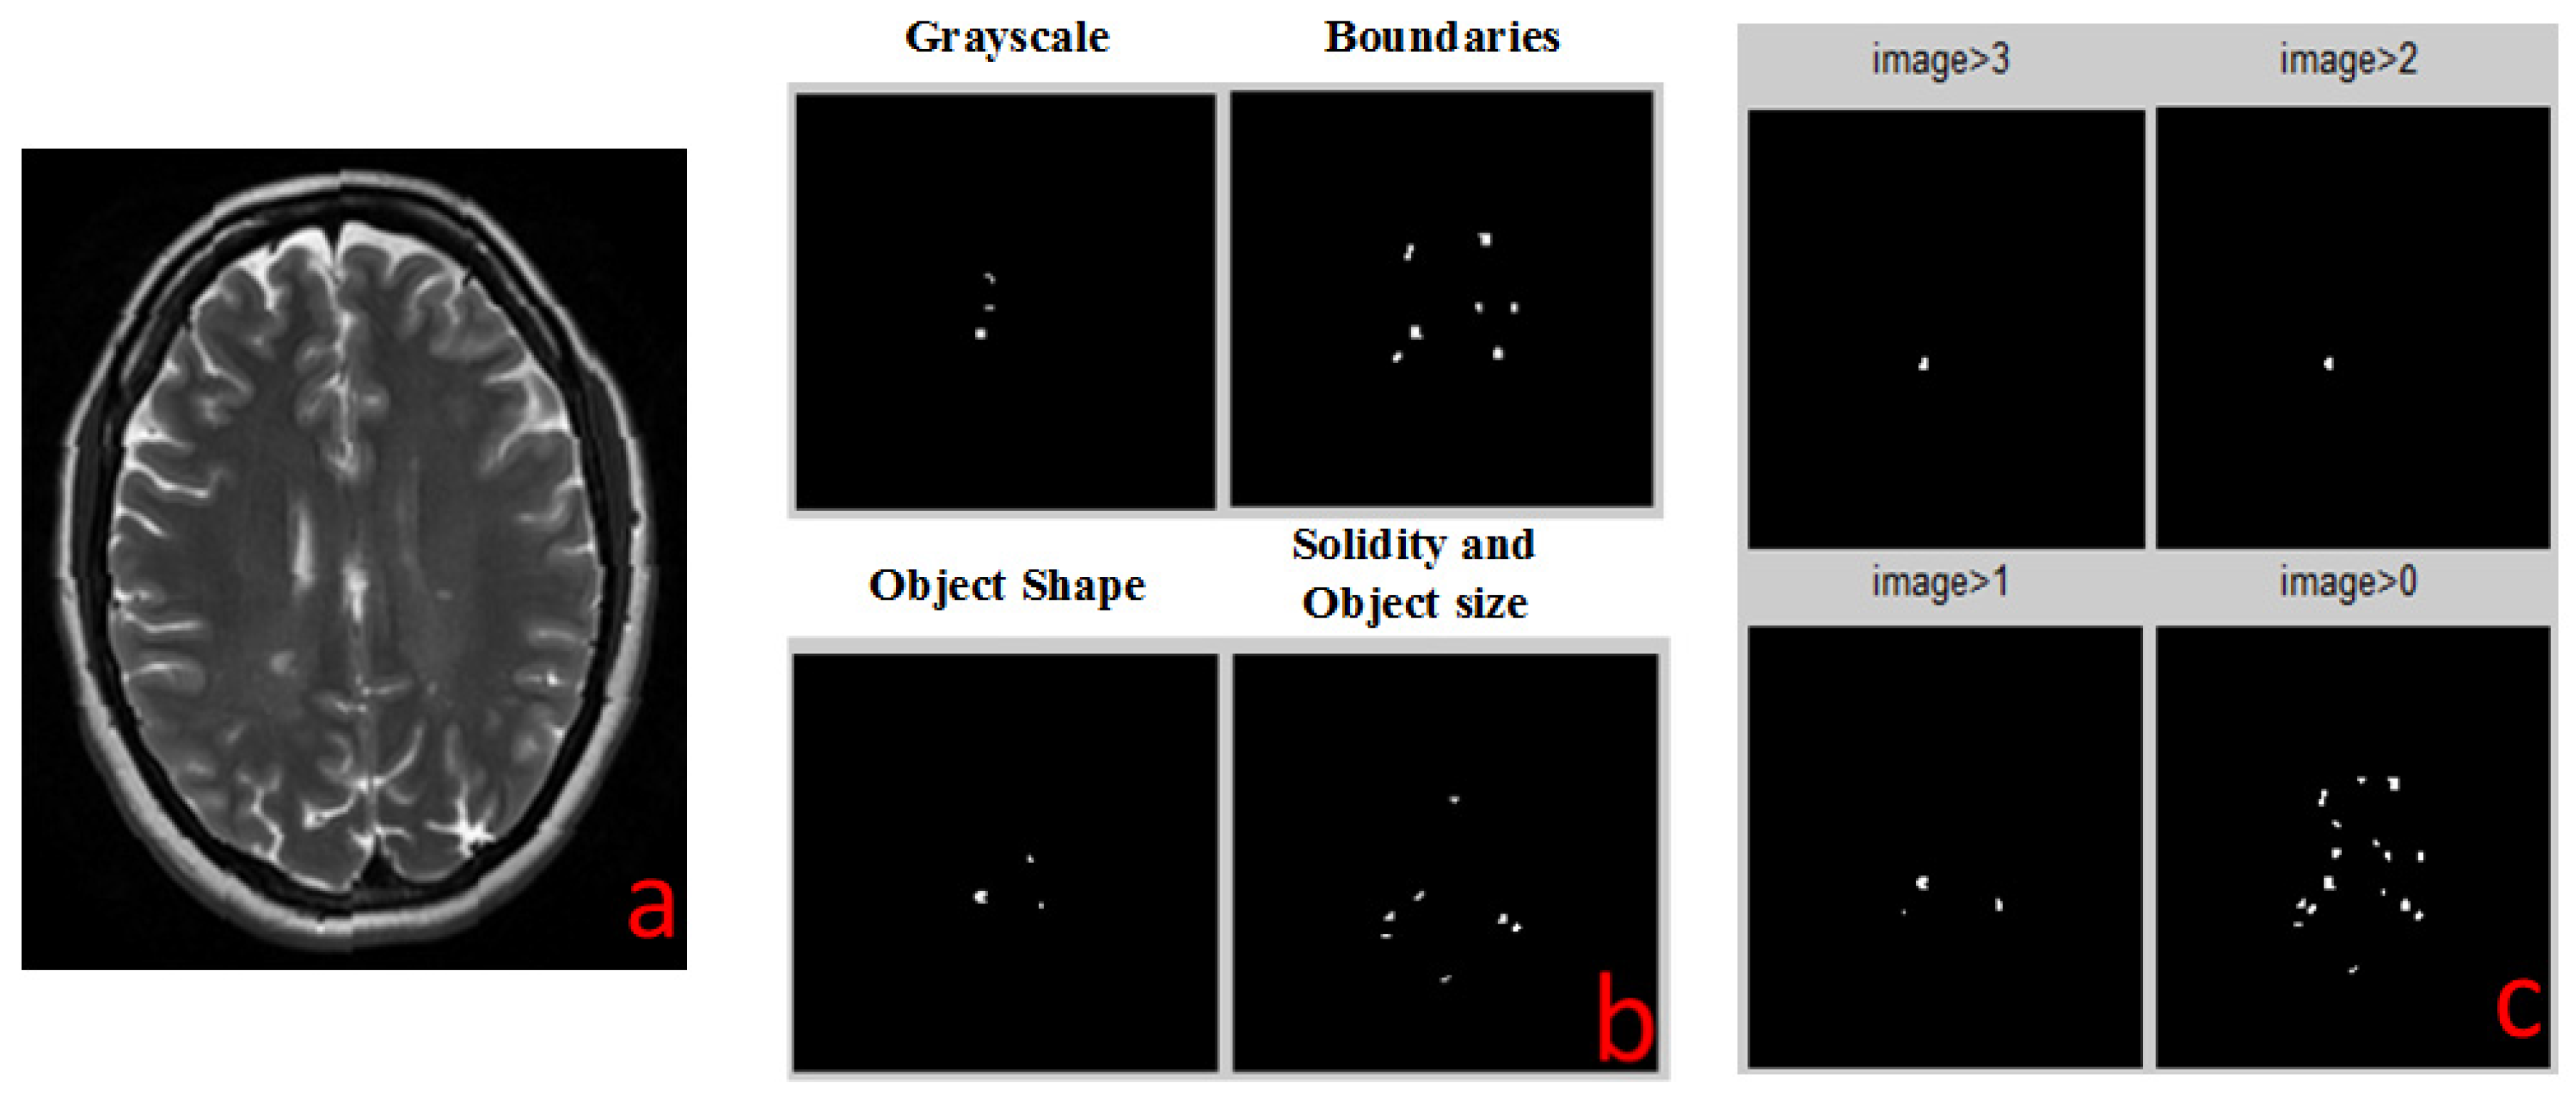
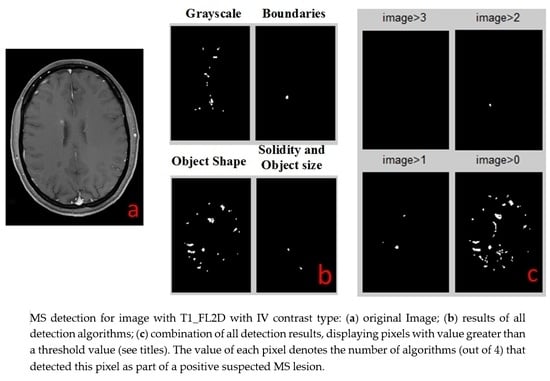
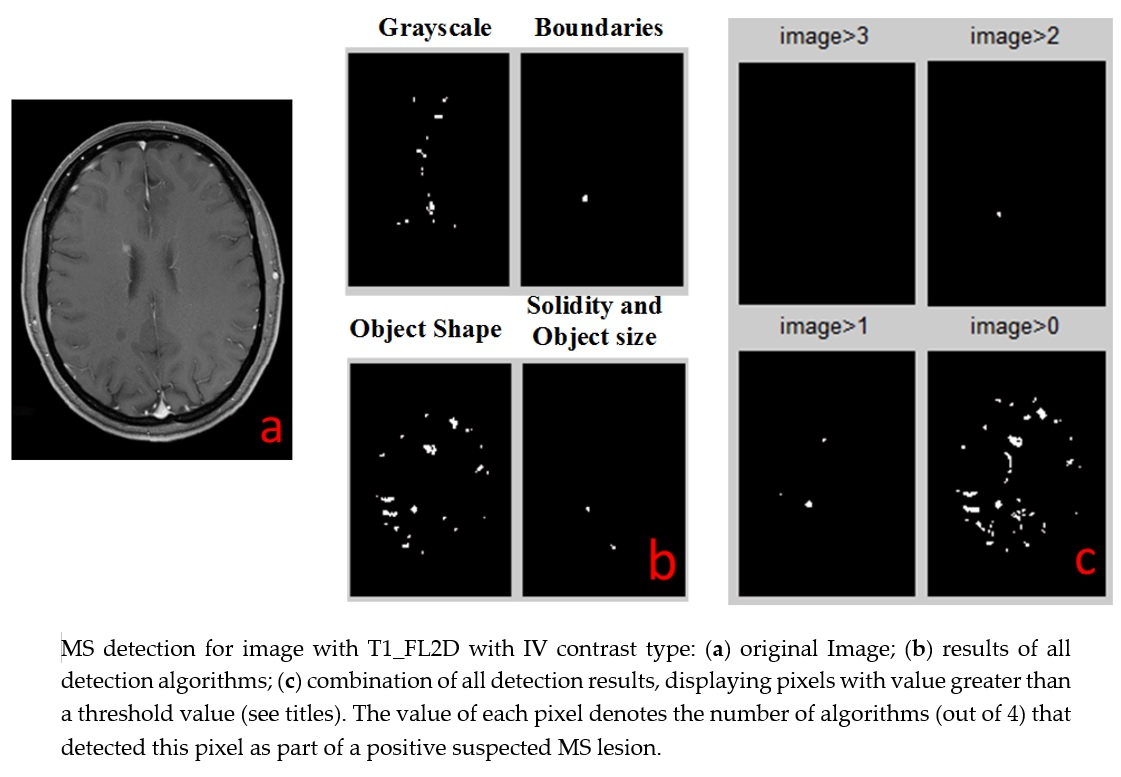
The output of each detection algorithm is a binary image, in which all areas that were detected by the algorithm as suspected MS lesions that are marked as “1”, and all other areas are marked as “0”. All four outputs are numerically added together to a single outcome. Any pixel that has a value of 3 or 4 (was identified by 3 or 4 algorithms) is identified as MS lesion (marked by a white spot). All other pixels are negative MS lesion (black background). This white spots image is the final result of all the combined detection algorithms and it is the same type for all types of MR images.
4. Conclusions
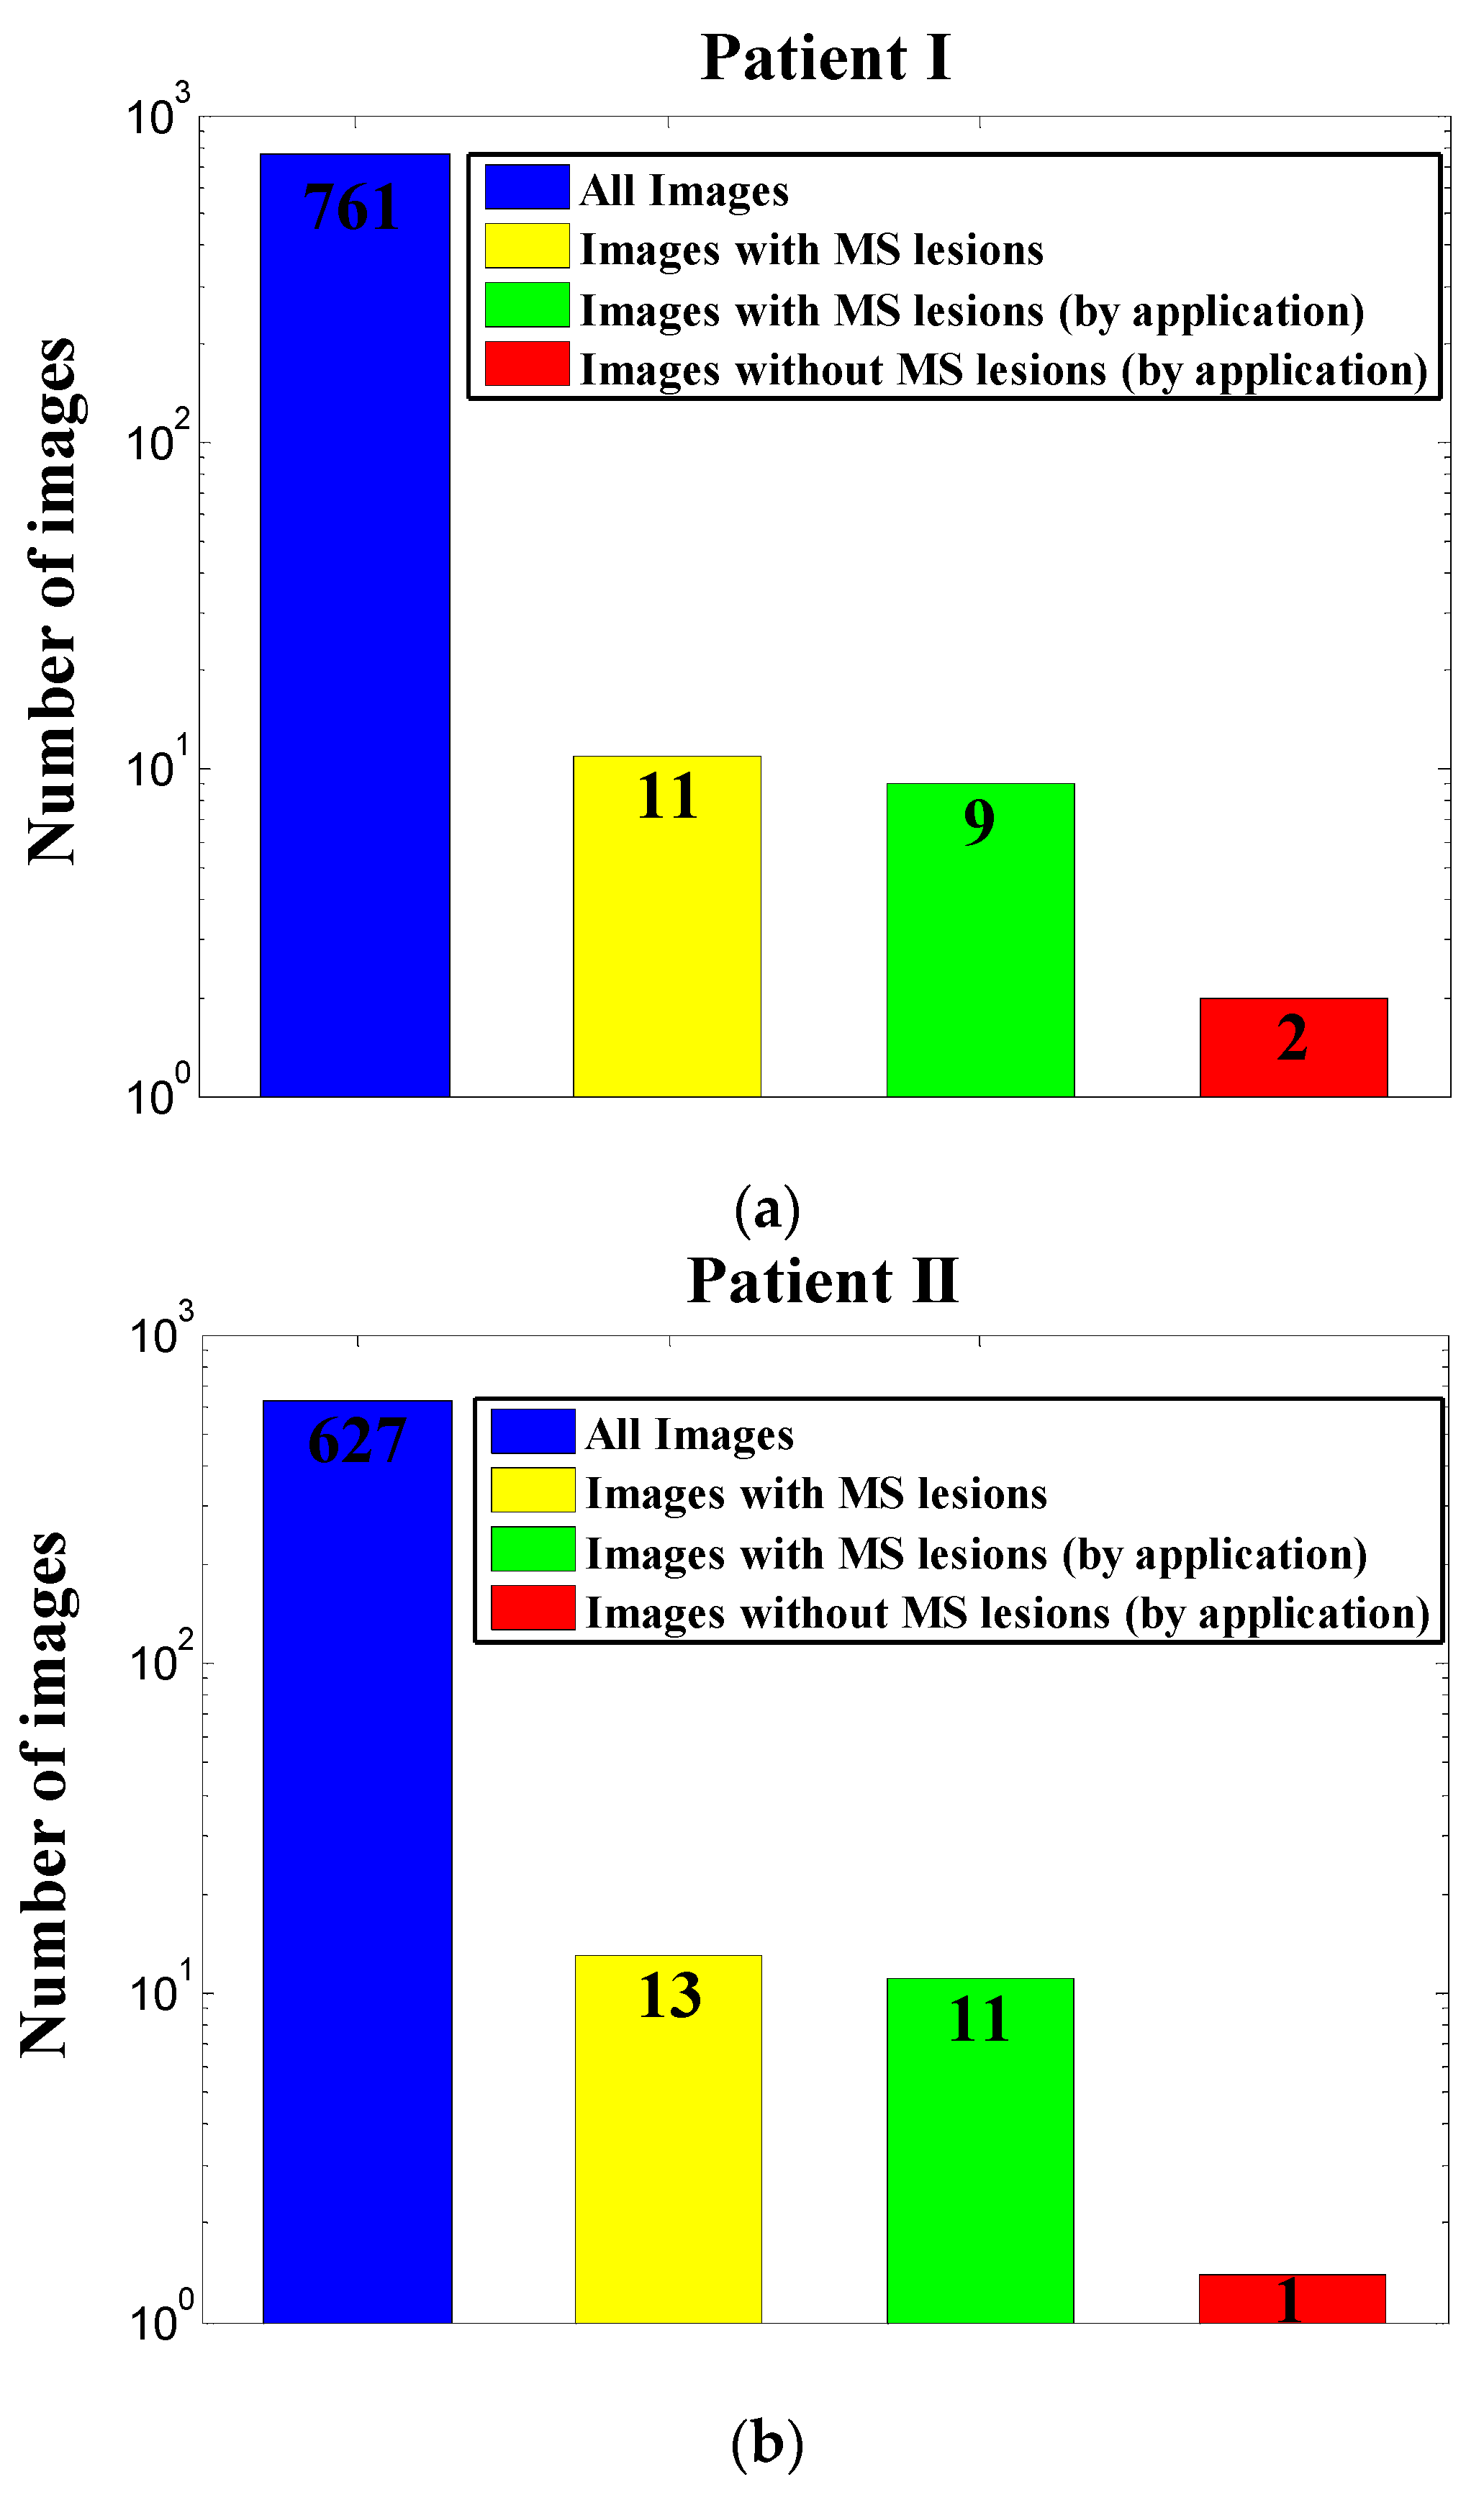
We have demonstrated here a new conceptual diagnostic strategy for MS lesion detection. Our newly developed application, which is based on a combination of four detection algorithms, will improve the diagnosing of MS by greatly reducing the number of images relevant for manual scanning by the diagnosing doctors, saving precious time and energy.
We tested our tool on 4202 images from three MS patients. Only 38 images of the 4202 were considered relevant for diagnosis using expert guidelines for manual screening. Our application was extremely successful, with 99.86% correct rejection of unnecessary images, 0.14% false alarm, 84.2% hits out of all relevant images with lesions, and 15.8% miss. Thus, overall workload was automatically reduced by 99.2% (98.9 ± 0.4% per patient), theoretically saving most of the time and efforts invested by the diagnosing physician. These results suggest that our application can serve as a reliable preprocessing tool for relieving workload in MS diagnosis and monitoring.
It is important to emphasize that the statistical results depend on the quality of the MRI machine, type of the MS and the numbers of patients.
In addition, the application is easy to use by the graphical user interface, which can be helpful for the radiologist to make his/her MS diagnosis report.
Similar applications may be developed in future for improving MR-based diagnostics of other diseases.

 ,
, 