Temporally Programmable Hybrid MOPA Laser with Arbitrary Pulse Shape and Frequency Doubling


State Key Laboratory of Precision Measurement Technology and Instruments, Department of Precision Instrument, Tsinghua University, Beijing 100084, China
*
Author to whom correspondence should be addressed.
Appl. Sci. 2017, 7(9), 892; https://doi.org/10.3390/app7090892
Submission received: 6 August 2017
/
Revised: 24 August 2017
/
Accepted: 28 August 2017
/
Published: 1 September 2017
(This article belongs to the Special Issue Solid State Lasers Materials, Technologies and Applications)
Abstract
:Featured Application
The proposed device can be very useful to precision manufacturing, Lidar and
freespace communication.
Abstract
An arbitrary pulse shape by compensating gain saturation in a solid-state Master oscillator power amplifier (MOPA) system made up of three Neodymium doped yttrium vanadate (Nd:YVO4) amplifiers is demonstrated. By investigating the amplifier dynamics in detail, car-shaped pulse shapes were obtained with compensated pulse distortion. Desired pulse shapes, such as multiple-step, square, parabolic, and Gaussian pulses, were achieved, with a high peak power level of 41.6 kW and a narrow linewidth less than 0.06 nm. In addition, through second harmonic generation (SHG), a green laser with different pulse shapes was obtained, with a maximum conversion efficiency of 42.6%.
1. Introduction
In the fields of optical sensing and Lidar applications, a long pulse duration, a good pulse shape, as well as a narrow spectral linewidth are required to achieve high precision measurements [1,2,3,4,5]. Master oscillator power amplifier (MOPA) systems seeded by a modulated semiconductor diode is a cost-effective approach to obtaining the above parameters. However, the gain saturation effect of amplifiers would cause pulse shape distortion and would shorten the pulse duration in the case of deep saturation. To obtain the required laser parameters for the above-mentioned applications, the negative influence of pulse distortion from MOPA systems should be eliminated. Therefore, the inverse problem on how to obtain the desirable output waveform by actively controlling the input pulse shape and compensating the gain saturation effect should be solved.
The general compensating method was firstly proposed by Siegman in 1986 in his book Lasers [6]. The key of the method is to get the function G(t) describing the change of the input waveform, which is directly related to the gain characteristics of the amplifier. Many researchers have reported works on the pre-compensation of pulse distortion in master oscillator fiber power amplifier (MOFPA) systems [7,8,9,10,11]. Although it is easy to obtain G(t) and control the pulse shape in fiber amplifiers, the peak power is limited by the nonlinear effect in the fiber [5,12], especially for the case of narrow spectral linewidth.
To overcome the shortage of fiber amplifiers, solid-state amplifiers are introduced in this paper. From the literature investigation, for solid-sate amplifiers, few have proposed a way of obtaining G(t) and arbitrary output waveforms accurately in theory. Few works have demonstrated compensation of pulse distortion in solid-state amplifiers by experiment. With the help of a complicated computational system Laser Performance Operations Model (LPOM), a square pulse for a huge laser system was achieved by the group of National Ignition Facility (NIF) [13]. However, the detailed information of the software is not provided by the group. Other software packages for the simulation of the output from an amplification chain include Miró [14] and GLAD [15]. However, they are not easy to access for a high price.
In 2015, Lu Xu et al. [16] demonstrated an experimental method of shaping the input pulse of a solid-state MOPA system by introducing a device made up of two polarizers, one Pockels cell and one half-wave plate. However, the shaping ability is restricted to providing arbitrary input pulse, and the device could not compensate the pulse distortion in the case of an arbitrary saturation degree. Although a square pulse shape is demonstrated in the experiment, the difference between the desired pulse shape and the measured one is large due to the non-linear edge of the input pulse. Gain characteristics and pulse shape transfer function are not deduced theoretically for their MOPA system in that paper either. Table 1 shows the detailed information of progress in temporal compensation for saturated amplifiers.
Our previous work [17] emphasizes the demonstration of an arbitrary burst envelope for an MOPA laser operating in burst mode, which could be used in chirped amplification. In this study, we obtained arbitrary nanosecond pulse shapes in a solid-state MOPA system made up of three Neodymium doped yttrium vanadate (Nd:YVO4) amplifiers. The theoretical method is similar to that in [17]. The pulse distortion was experimentally compensated without a feedback loop. Several particular desired pulse shapes were demonstrated, with a high peak power level and a narrow spectral linewidth. The MOPA laser, compared with the fiber laser, achieved a higher pulse energy and peak power by introducing more solid-state amplifiers, without the limit of a nonlinear effect. Moreover, second harmonic generation (SHG) was demonstrated after the MOPA source, resulting in arbitrary waveforms of the green laser. Based on the experimental results, how to generate desired pulse shapes through the SHG process is discussed.
2. MOPA Setup
A schematic diagram of the experiment setup is depicted in Figure 1. Figure 1a shows the setup of the fiber stage, including a distributed feedback (DFB) laser with fiber-coupled output and two fiber amplifiers. The setup of the fiber stage was similar to that in [17]. The difference was that electro-optic modulator (EOM2) was replaced by an acousto-optic modulator (AOM, Gooch & Housego T-M200-0.1C2G-3-F2P, llminster, UK). The maximum rise/fall time of the AOM is 10 ns, and the maximum modulation frequency is 200 MHz. Its function was enhancing the extinction ratio and pulse contrast of the output pulses.
The photo of the setup of the solid-state amplifiers was shown in Figure 1b, which was almost the same with [18]. To eliminate the influence of the amplified spontaneous emission (ASE) and accurately obtain the gain characteristics, the pump beam diameters of the 2nd and 3rd amplifiers were enlarged to about 940 μm. Moreover, in order to prevent possible parasitic laser oscillation between the 2nd and 3rd amplifiers with high gain, a 3° wedge on one of the facets of the Nd:YVO4 crystal was cut for the 3rd amplifier.
The SHG was realized by a lithium borate (LBO) crystal (Φ = 90°, θ = 0°), with a dimension of 3 mm × 3 mm × 25 mm. To focus the output beam radius into a small point with a beam radius of 90 μm, a focusing lens with a focal length of 150 mm was employed. The LBO crystal was placed in an oven whose temperature was controlled at 160.1 °C with a precision of 0.1 °C.
3. MOPA Laser with Arbitrary Pulse Shape
3.1. Fiber Amplifier Stage
Due to the narrow spectral linewidth of the semiconductor laser, stimulated Brillouin scattering (SBS) could happen when the pulse energy increases. We carefully increased the pump power of the 2nd fiber amplifier and observed at the output end. When the average output power reached 22 mW at a pulse repetition rate of 100 kHz with a pulse duration of 168 ns, a strong backward SBS was generated. As shown in Figure 2b, a depression appeared in the middle of the shape, and the pulse shape was also unstable (see the uploaded video from Supplementary Materials). By introducing the optical spectrum analyzer (Agilent 86142B, Palo Alto, CA, USA), the frequency shift caused by SBS was evidently observed as shown in Figure 2a. The spectrum was also unstable (see the uploaded video from Supplementary Materials).
Compared with the experimental results in [18], the SBS effect was not observed even when the output power was larger than 150 mW. The main reason is that the spectrum of directly modulated DFB laser is chirped broadened, causing a higher SBS threshold. Therefore, it is important to carefully increase the pump power during amplification in order to protect the optical components from the SBS giant pulse.
3.2. Arbitrary Pulse Shape Output for the First Nd:YVO4 Amplifier
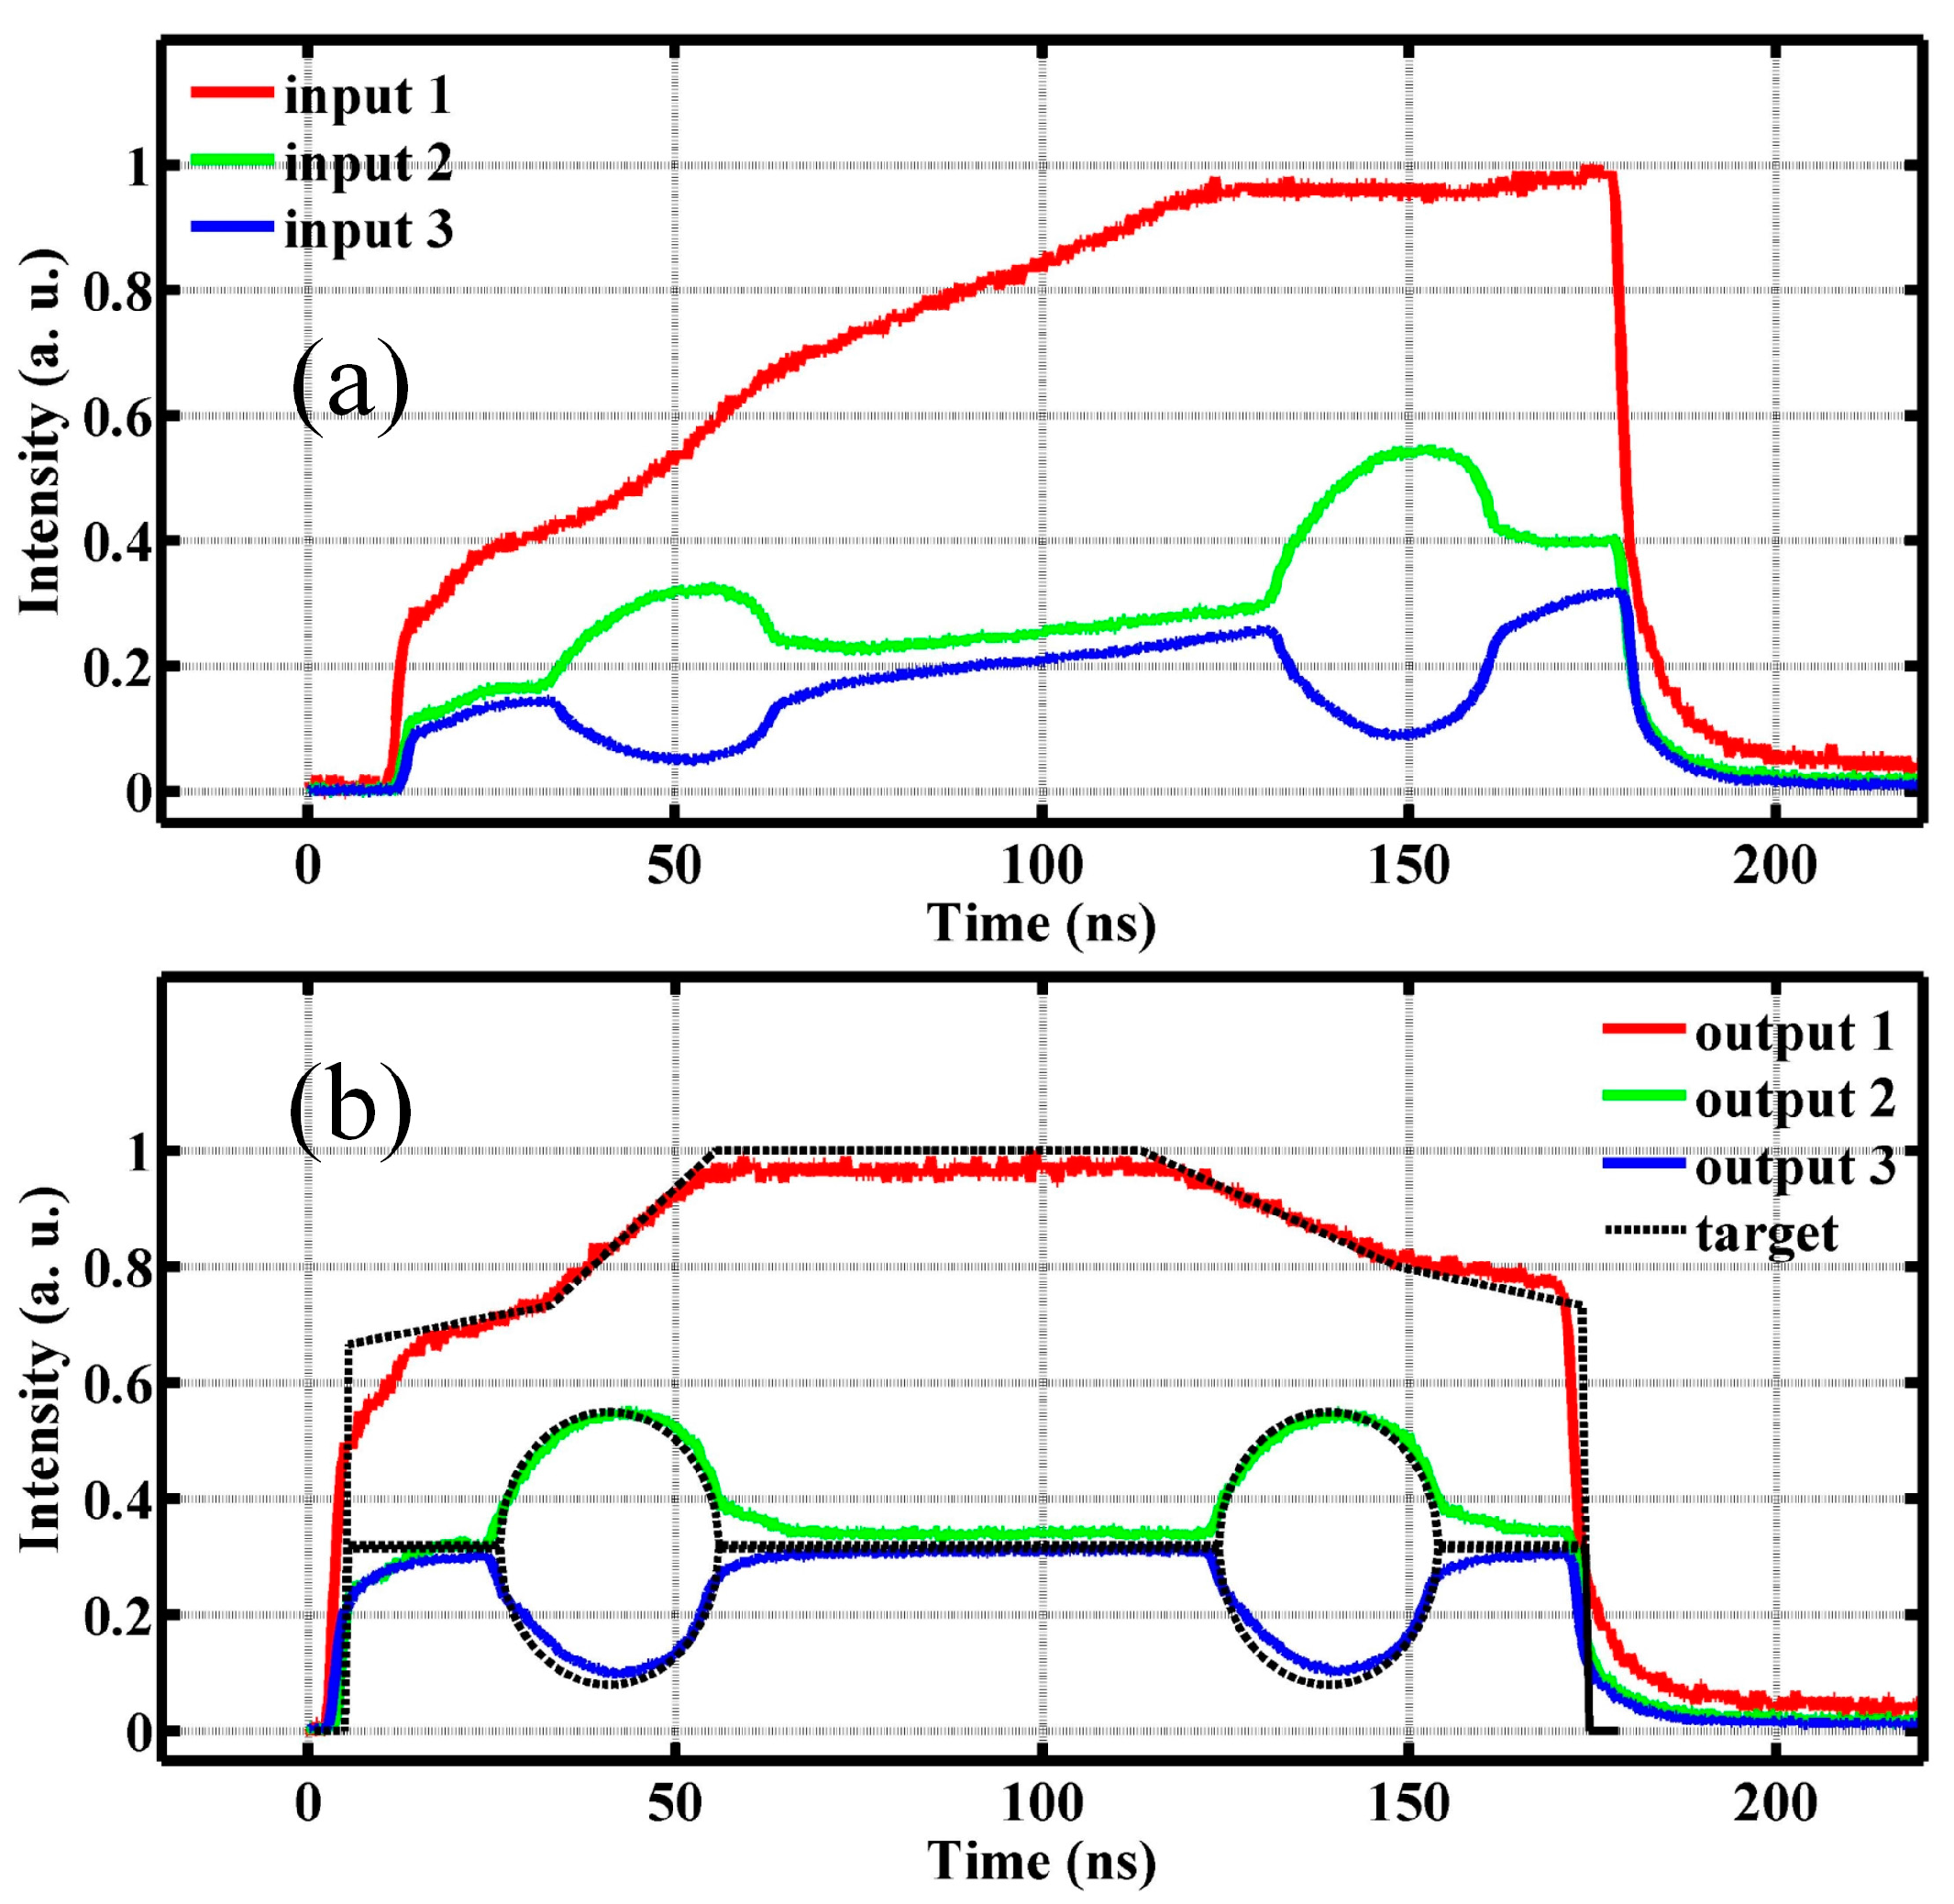
In this section, we verified the feasibility of the theoretical method. By introducing three pulses and compensating the pulse distortion, the shape of a car, interestingly, was obtained. The input average power was 19.5 mW at a pulse repetition rate of 100 kHz, with a square pulse and pulse width of 168 ns.
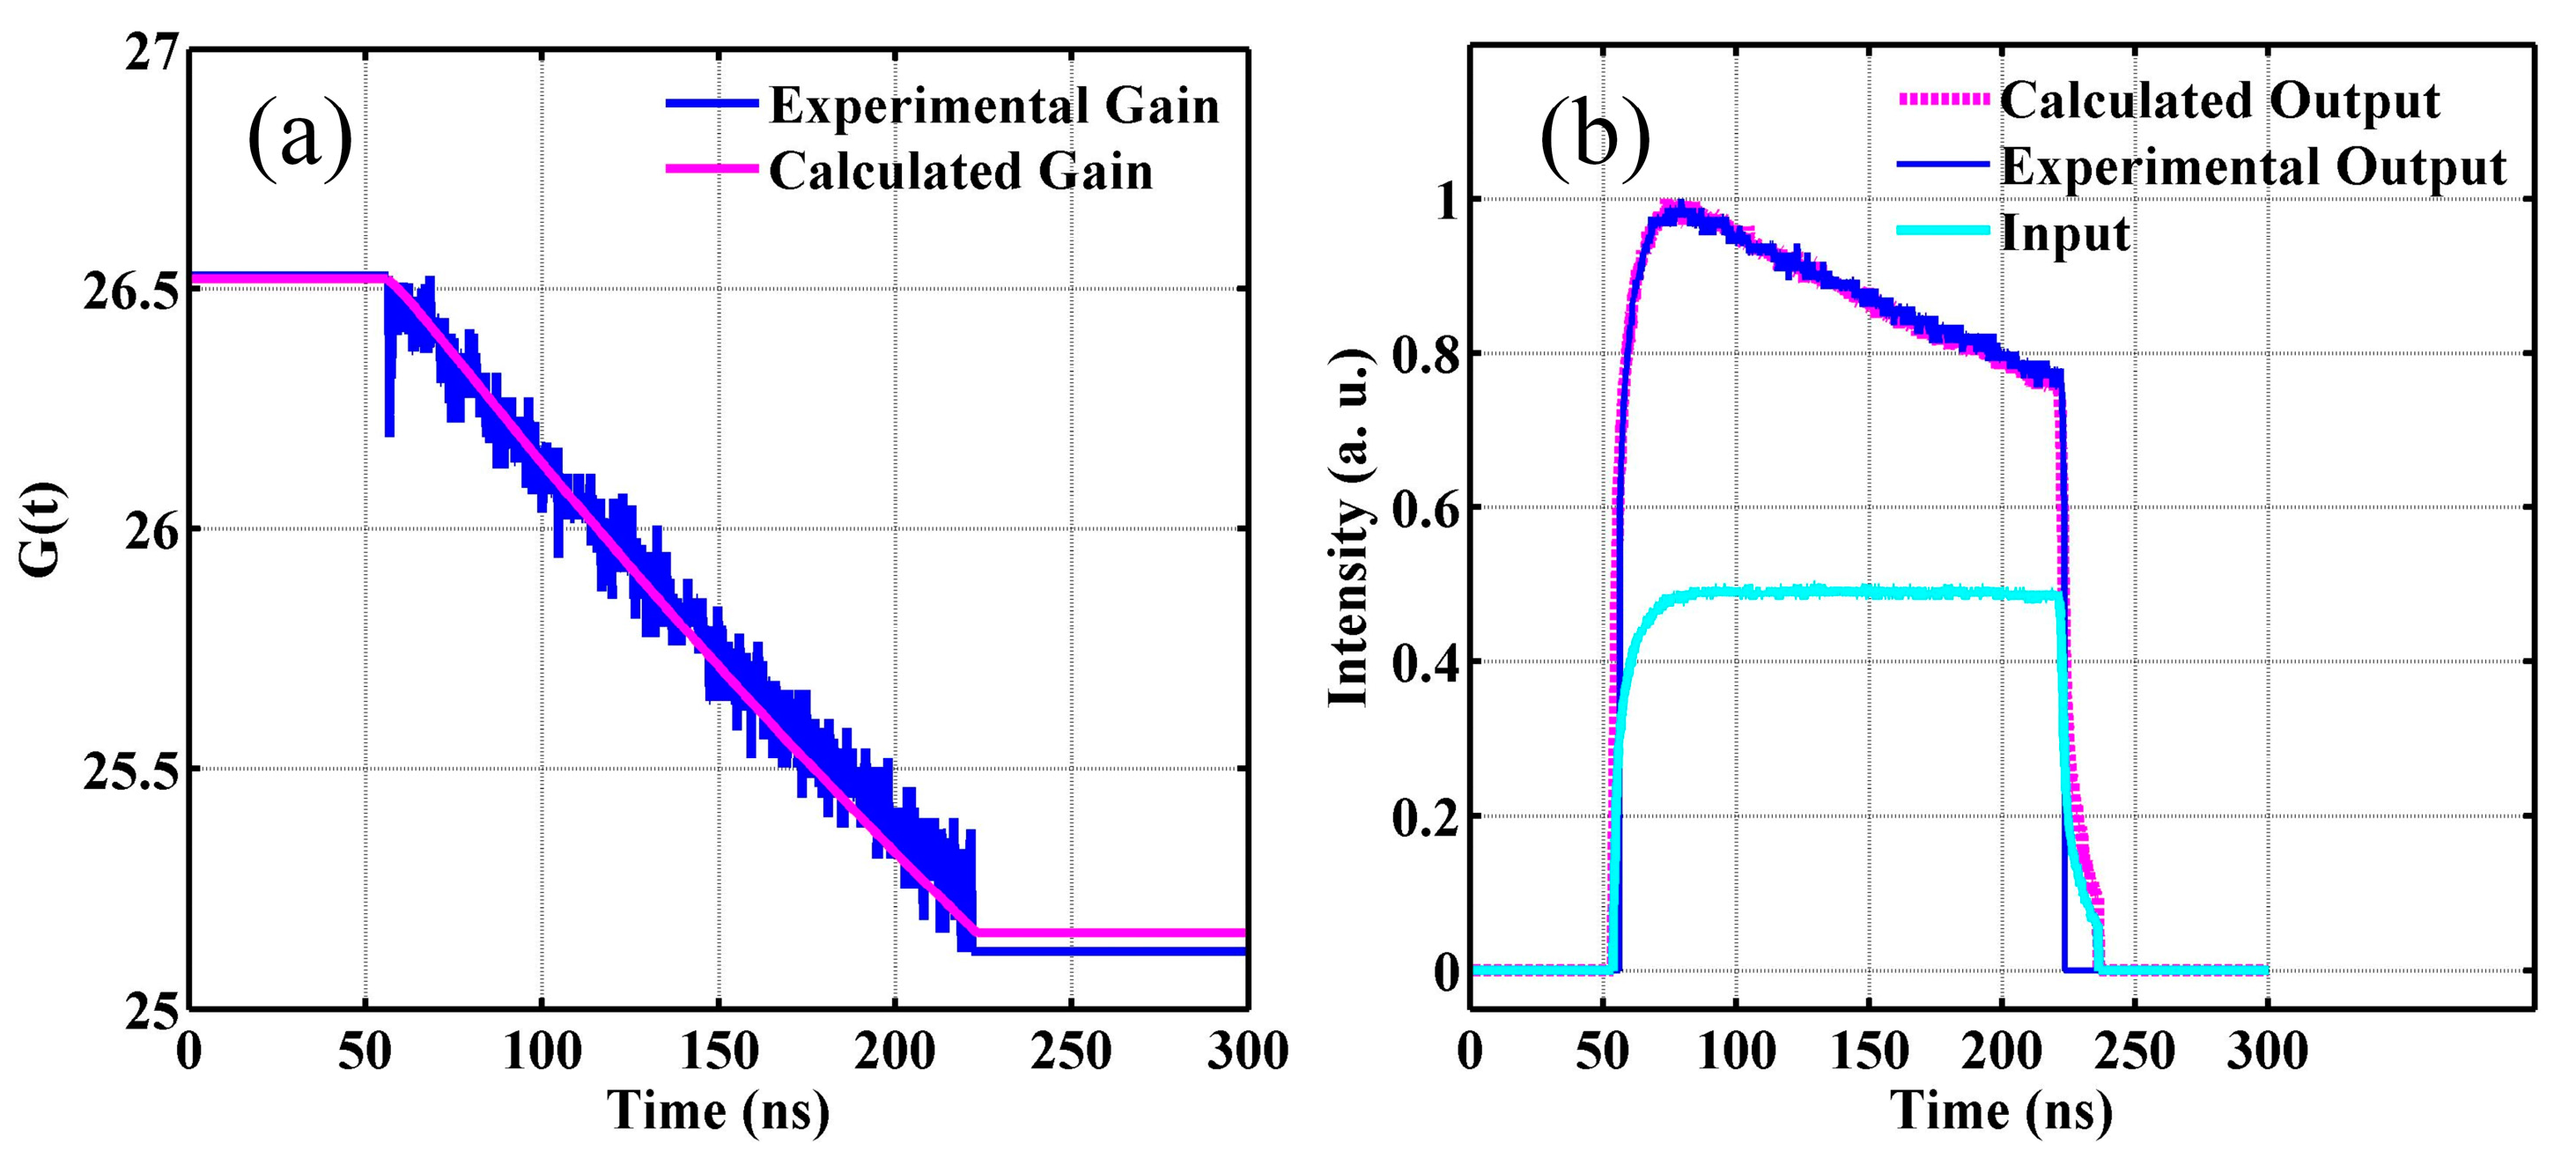
First, the small-signal gain was calculated through our model [19]. Since the stimulated emission section σes directly affects the gain integral, it is a key parameter for the small-signal gain. For Nd:YVO4 crystal, σes is strongly dependent on the boundary temperature [20,21]. We measured the temperature of the crystal at the pumping input end when the pump power was 56 W. The result was 120 °C, and σes was estimated to be 12.5 × 10⁻¹⁹ cm2 [21,22,23,24]. Therefore, we obtained the small-signal gain of the first solid-state stage as 40 dB by slice model [19]. By applying the iteration method [17], the initial pulse gain of 26.5 dB obtained only after 25 times, as depicted by Figure 3. The pulse shape transfer functions from experiment and simulation were plotted in Figure 4a, while the output pulse shapes from experiment and simulation with the same input pulse shape were plotted in Figure 4b. The simulated output power was 7.38 W, being consistent with the experimental one of 7.32 W. Comparing the experimental and simulated results, it was concluded that the theoretical method was very effective in calculating the gain characteristics and in obtaining the pulse shape transfer function.
To test the capability of compensating pulse distortion and obtain car-shaped pulse shapes, the input pulses were theoretically obtained by the desired output pulse shapes and G(t). With the same amplifier setup, the pulse shape transfer function was the same as that in Figure 4. As shown in Figure 5a, for the input pulses, the leading edges’ amplitude values were smaller than those of the trailing edges. As the gain of the leading edges were larger than that of the trailing edges, the output shapes were car-shaped, as plotted in Figure 5b. Comparing the target pulse shapes (in black dot lines) and the experimental one, they are in good accordance with each other. As for the output power of the three pulse shapes, they were all equal to 7.3 W with identical input powers of 19.5 mW.
3.3. Arbitrary Pulse Shape Output for the MOPA System
To further boost the output power and obtain the desired output pulse shapes, another two Nd:YVO4 amplifiers were cascaded after the first Nd:YVO4 amplifier. The output power of 7.3 W was scaled up to 21 W and 41.4 W by the two amplifiers, respectively. With the help of a beam propagation analyzer (Spiricon M2-200-FW-SCOR, Ophir, Israel), the beam quality was measured to be very good. The M2 factor were 1.150 and 1.113, respectively, at horizontal and vertical directions. Due to the setup of the amplifiers, the ASE and parasitic oscillation was not significantly observed at the output of the whole system, both from the pulse shape and the spectrum. The optical signal-to-noise ratio (OSNR) was as high as 42 dB. The spectral line-width (3 dB) was so narrow that it exceeded the resolution of the optical spectrum analyzer (Agilent 86142B, Palo Alto, CA, USA). Many times, the resolution was measured to be less than 0.060 nm. Therefore, we concluded that the spectral linewidth was narrower than 0.06 nm.
The pulse shapes were recorded for each amplifier as shown in Figure 6. The pulse shape distorted after each amplifier resulting from different gains for the leading and trailing edge. The leading edge first consumes the inversion population resulting in a smaller gain for the falling edge and then pulse distortion.
Several desired pulse shapes were obtained after the third amplifier through the same method. The initial pulse gain for the MOPA system was calculated as 34.7 dB. As shown in Figure 7, four common pulse shapes, including multiple-step, parabolic, Gaussian, and flat-top pulses, were introduced. The corresponding input pulses are shown in the insets.
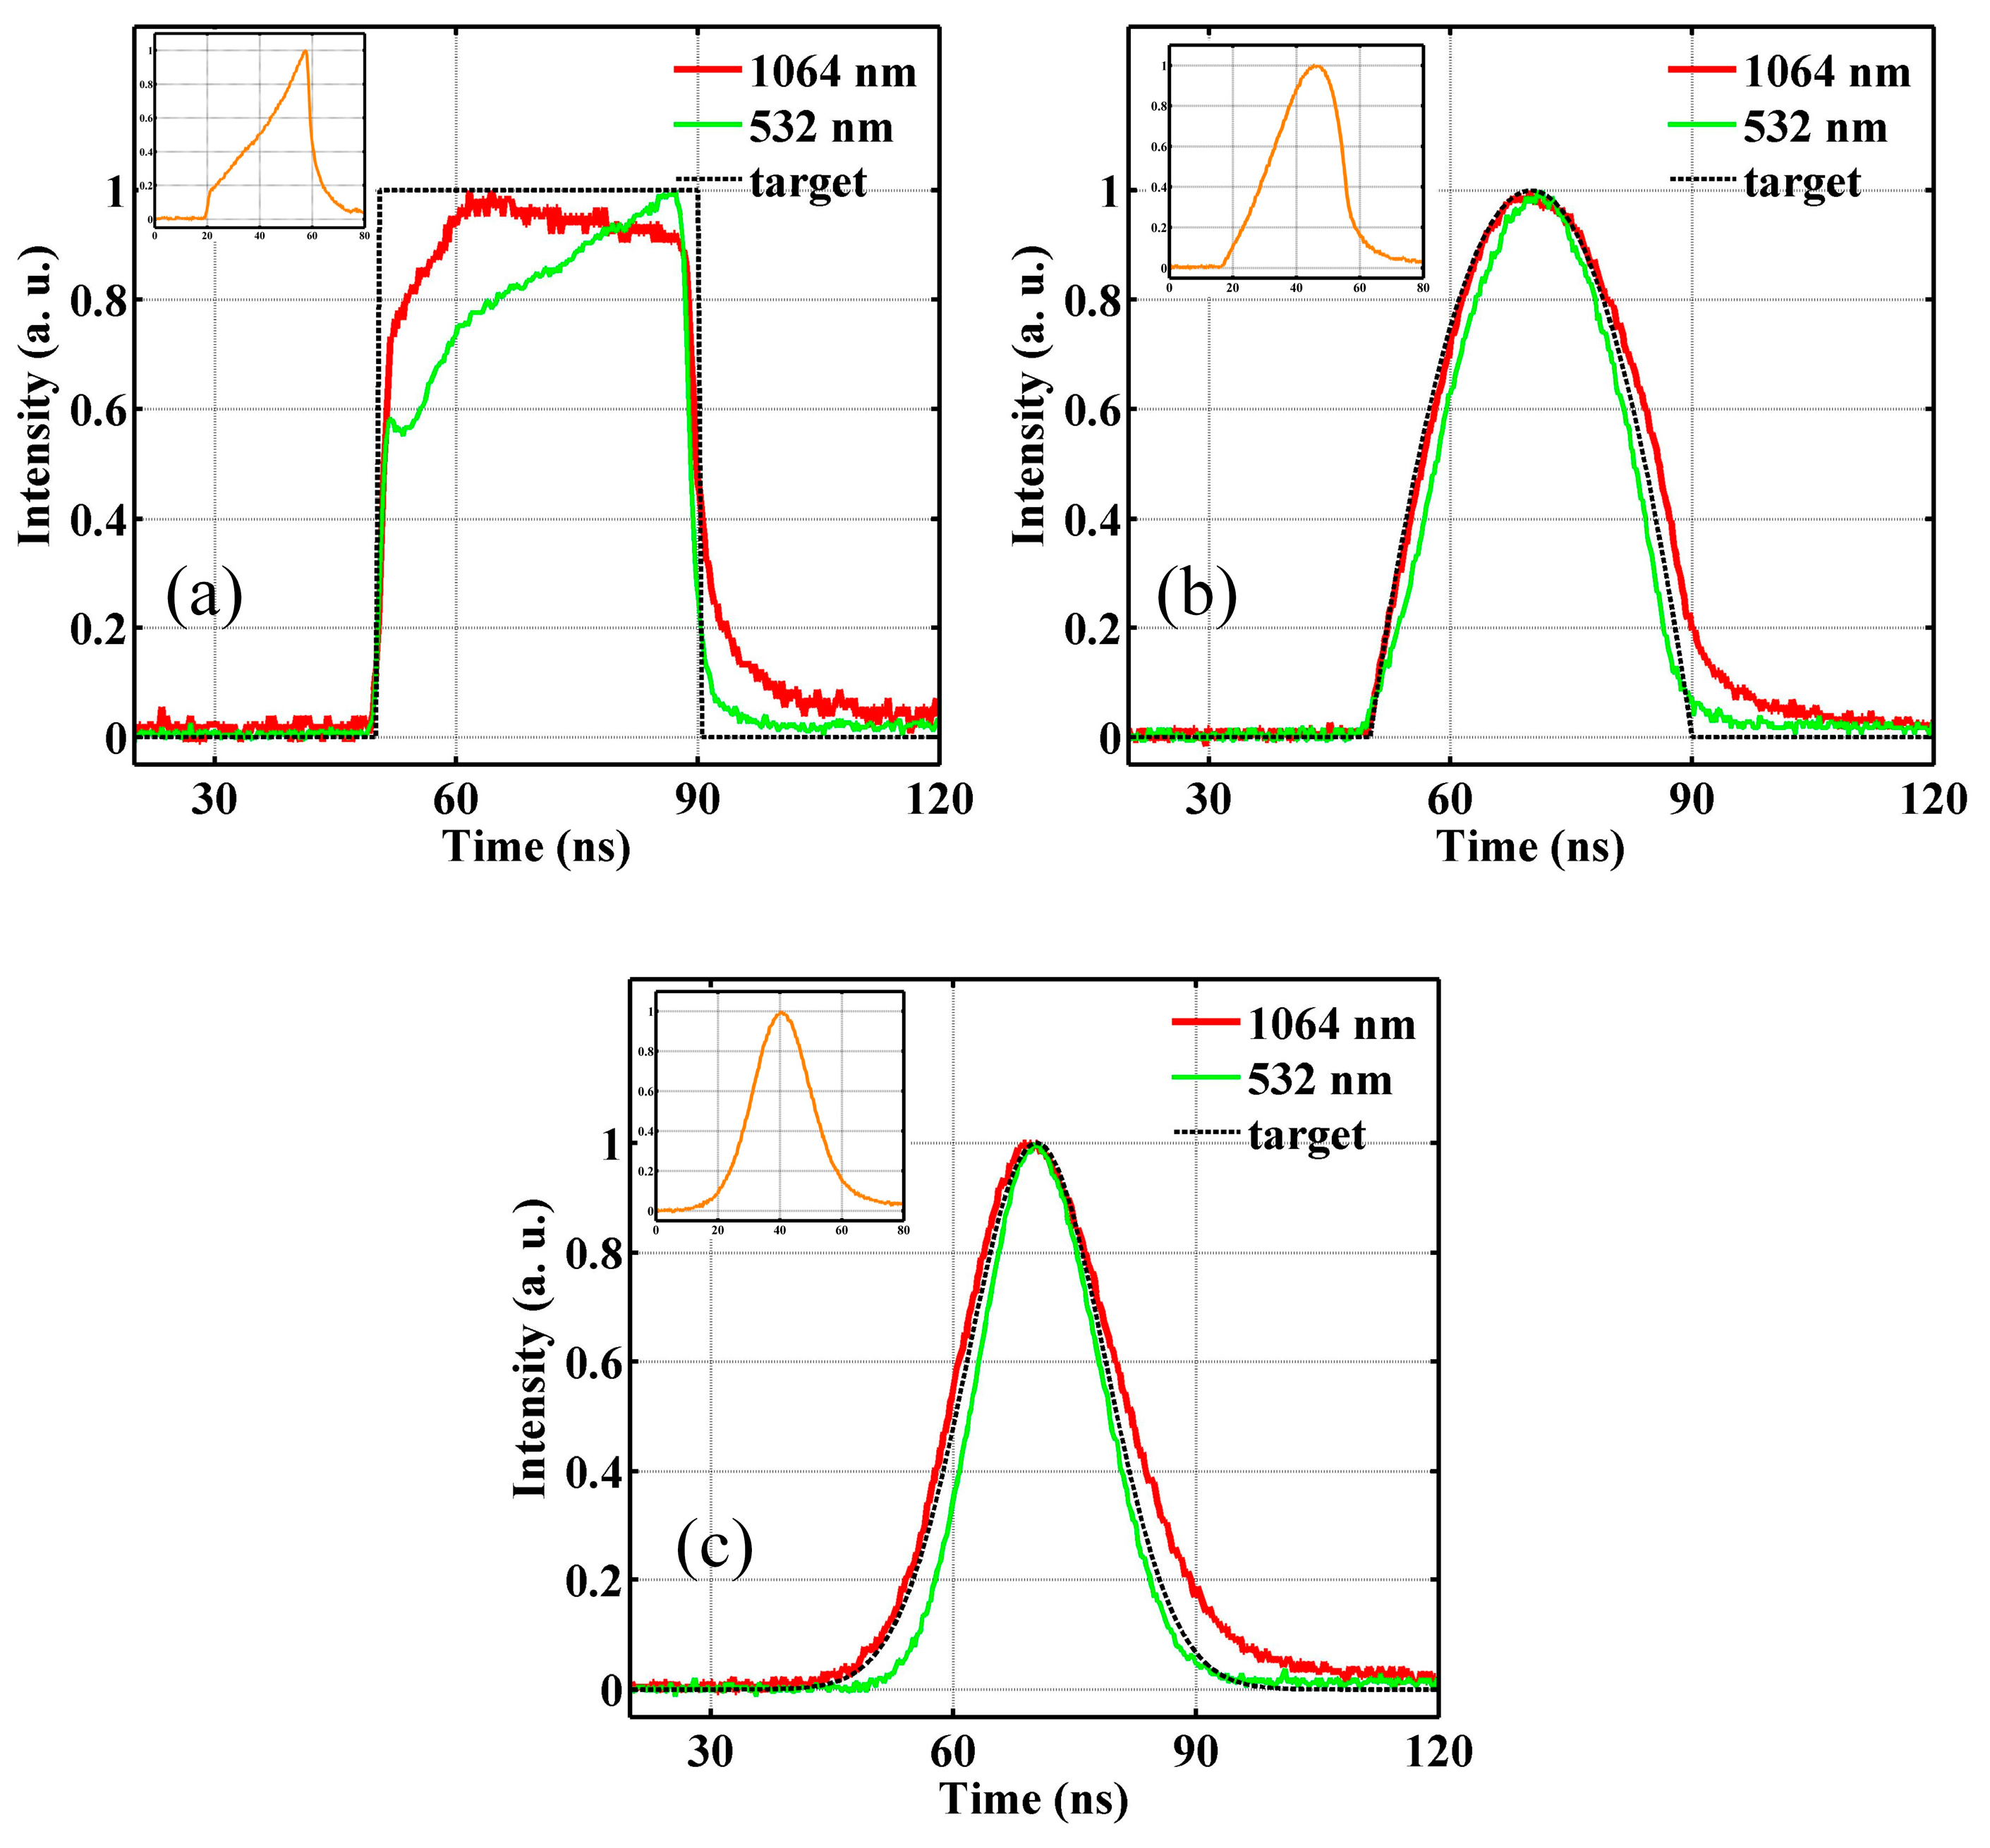
To enhance the peak power, the repetition rate was set to be 40 kHz, and the pulse duration was 40 ns. The output power was 38.3 W, corresponding to the pulse energy of 0.96 mJ, with the input power of 13.5 mW. Using the same method, square, parabolic, and Gaussian pulses were obtained for the MOPA system, as shown in Figure 8. The highest peak power of 41.6 kW, much larger than that in [9], was achieved by the Gaussian pulse.
Limited by the rising time and falling time of the arbitrary waveform generator (AWG), the leading edge and falling edge of the pulses could not be controlled very precisely, especially for the square pulses with fast leading edges and falling edges. In addition, the control of the null point of the EOM and the inadequate sampling rate of the AWG led to the small mismatch of the targeted pulse shape.
4. Second Harmonic Generation
To obtain green lasers with arbitrary pulse shapes, second harmonic generation was accomplished using the output of the above-mentioned MOPA system. The temporal parameters of the fundamental laser (1064 nm) and the output power of the green laser are listed in Table 2. The pulse shapes of the green laser are demonstrated in Figure 7 and Figure 8 with green lines. The maximum conversion efficiency of 42.6% was achieved when peak power intensity was 163 MW/cm2 at a PRF of 40 kHz.
Comparing the output power of the green laser with the same pulse energy but with different pulse shapes in Table 2, it was deduced that a smaller pulse duration, namely a higher peak power intensity, contributes to a higher conversion efficiency from a fundamental laser to the second harmonic wave. Moreover, the conversion efficiency is not linear to the peak power intensity, leading to pulse shape distortion from the fundamental laser. The portion with a higher peak power in the fundamental pulse converts to a green laser to a much greater extent than that with a lower peak power, resulting in a pulse duration narrowing effect.
The comparison between the 1064 nm and 532 nm lasers in Figure 7a evidently shows that the conversion efficiency differs for different peak power levels of fundamental lasers. The lower peak power in the pulse is 0.25 for the fundamental laser, while it is smaller than 0.25 for the green laser. As shown in Figure 7b and Figure 8c, the leading edge and the falling edge of the green laser become smaller than the fundamental laser after the SHG process, which results in a narrower pulse duration. The comparison between the 1064 nm and 532 nm lasers in Figure 7d and Figure 8a indicates that pulse shapes with a uniform distribution of peak power could alleviate the narrowing effect and obtain a green laser pulse similar to the fundamental one. For the Gaussian shape, a higher peak power is helpful to keep the original fundamental pulse shape, as the pulse shape narrowing percentage in Figure 7b and Figure 8b are 22% and 15%, respectively.
To obtain a desired pulse shape from the SHG process, the non-linear conversion efficiency must be taken into account. For example, to obtain a multiple-step green pulse just like in Figure 7a (the lower peak power is 1/4 of the higher peak power for green laser), the lower peak power of the fundamental laser must be larger than one-fourth of the higher peak power.
5. Conclusions
In summary, desired pulse shapes were demonstrated in a hybrid MOPA system mainly made up of three Nd:YVO4 amplifiers. By investigating the amplifier dynamics, the pulse shape transfer function of an end-pumped Nd:YVO4 amplifier was obtained. The numerical simulation for the first amplifier indicates excellent agreement with the experimental results. Interesting pulse shapes, such as that of a car, were obtained through the theoretical method, showing the effectiveness of the theoretical method in achieving arbitrary pulse shapes. Furthermore, several pulse shapes were obtained through the same method for the MOPA system made up of three amplifiers. A high peak power level of 41.6 kW and a narrow linewidth less than 0.06 nm were achieved, with good beam quality. A green laser was generated by this source, with a maximum conversion efficiency of 42.6%. Compared with the input pulse of SHG, the pulse shape of the green laser was distorted due to the nonlinear effect, especially for the ones with a slow leading edge and a falling edge. The solid-state MOPA system with arbitrary waveforms, high peak power levels, and narrow spectral linewidths shows great potential in precision manufacturing, optical sensing, and Lidar applications.
Supplementary Materials
Supplementary materials are available online at Zenodo DOI: 10.5281/zenodo.854840 (https://zenodo.org/record/854840#.WaefZ4SGMcY). Video S1: SBS pulse distortion_40kHz_40ns. Video S2: SBS pulse distortion_100kHz_168ns. Video S3: SBS_freqency shift_100 kHz_168ns.
Acknowledgments
National Key Research and Development Program of China (Grant No. 2017YFB1104500); National Natural Science Foundation of China (61475083).
Author Contributions
Mingming Nie conceived and designed the experiments; Qiang Liu provided guidance and funding; Mingming Nie performed the experiments; Encai Ji and Xing Fu analyzed the data; Xuezhe Cao conducted the simulation; Mingming Nie wrote the manuscript and created the figures. All authors have reviewed the manuscript.
Conflicts of Interest
The authors declare no conflict of interest.
References
- Biswas, A.; Hemmati, H.; Lesh, J.R. High data rate laser transmission for free space laser communications. SPIE Rev. 1999, 3615, 269–277. [Google Scholar]
- Abshire, J.B.; Collatz, G.J.; Sun, X.; Riris, H.; Andrews, A.E.; Krainak, M. Laser sounder technique for remotely measuring atmospheric CO2 concentrations. In Proceedings of the American Geophysical Union, Fall Meeting, San Francisco, CA, USA, 10–14 December 2001. [Google Scholar]
- Kelly, D.; Young, C.Y.; Andrews, L.C. Temporal broadening of ultrashort space-time Gaussian pulses with applications in laser satellite communication. SPIE Rev. 1998, 3266, 231–240. [Google Scholar]
- Hemmati, H.; Wright, M.; Esproles, C. High efficiency pulsed laser transmitters for deep space communications. SPIE Rev. 2000, 3932, 188–195. [Google Scholar]
- Wan, P.; Liu, J.; Yang, L.; Amzajerdian, F. Pulse shaping fiber laser at 1.5 μm. Appl. Opt. 2012, 51, 214–219. [Google Scholar] [CrossRef] [PubMed]
- Siegman, A.E. Lasers; University Science Books: Sausalito, CA, USA, 1986. [Google Scholar]
- Vu, K.T.; Malinowski, A.; Richardson, D.J.; Ghiringhelli, F.; Hickey, L.M.B.; Zervas, M.N. Adaptive pulse shape control in a diode-seeded nanosecond fiber MOPA system. Opt. Express 2006, 14, 10996–11001. [Google Scholar] [CrossRef] [PubMed]
- Schimpf, D.N.; Ruchert, C.; Nodop, D.; Limpert, J.; Tuennermann, A.; Salin, F. Compensation of pulse-distortion in saturated laser amplifiers. Opt. Express 2008, 16, 17637–17646. [Google Scholar] [CrossRef] [PubMed]
- Malinowski, A.; Vu, K.T.; Chen, K.K.; Nilsson, J.; Jeong, Y.; Alam, S.; Lin, D.; Richardson, D.J. High power pulsed fiber MOPA system incorporating electro-optic modulator based adaptive pulse shaping. Opt. Express 2009, 17, 20927–20937. [Google Scholar] [CrossRef] [PubMed]
- Sobon, G.; Kaczmarekm, P.; Antonczak, A.A.; Sotor, J.; Waz, A.; Abramski, K.M. Pulsed dual-stage fiber MOPA source operating at 1550 nm with arbitrarily shaped output pulses. Appl. Phys. B 2011, 105, 721–727. [Google Scholar] [CrossRef]
- Heidt, A.M.; Li, Z.; Richardson, D.J. High Power Diode-Seeded Fiber Amplifiers at 2 μm—From Architectures to Applications. IEEE J. Sel. Top. Quantum Electron. 2014, 20, 525–536. [Google Scholar] [CrossRef]
- Smith, R.G. Optical power handling capacity of low loss optical fibers as determined by stimulated Raman and Brillouin scattering. Appl. Opt. 1972, 11, 2489–2494. [Google Scholar] [CrossRef] [PubMed]
- Shaw, M.; Williams, W.; House, R.; Haynam, C. Laser Performance Operations Model (LPOM). In Inertial Confinement Fusion Semiannual Report; Lawrence Livermore National Laboratory: Livermore, CA, USA, 2004. [Google Scholar]
- Morice, O. Miró: Complete modeling and software for pulse amplification and propagation in high-power laser systems. Opt. Eng. 2003, 42, 1530–1541. [Google Scholar] [CrossRef]
- Siegman, A.E. Design considerations for laser pulse amplifiers. J. Appl. Phys. 1964, 35, 460. [Google Scholar] [CrossRef]
- Xu, L.; Yu, L.; Chu, Y.; Gan, Z.; Liang, X. Temporal compensation method of pulse distortion in saturated laser amplifiers. Appl. Opt. 2015, 54, 357–362. [Google Scholar] [CrossRef]
- Nie, M.; Cao, X.; Liu, Q.; Ji, E.; Fu, X. 100 μJ pulse energy in burst-mode-operated hybrid fiber-bulk amplifier system with envelope shaping. Opt. Express 2017, 25, 13557–13566. [Google Scholar] [CrossRef] [PubMed]
- Nie, M.; Liu, Q.; Ji, E.; Gong, M. High peak power hybrid MOPA laser with tunable pulse repetition frequency and pulse duration. Appl. Opt. 2017, 56, 3457–3461. [Google Scholar] [CrossRef] [PubMed]
- Nie, M.; Liu, Q.; Ji, E.; Cao, X.; Fu, X.; Gong, M. Design of High-Gain Single-Stage and Single-Pass Nd:YVO4 Amplifier Pumped by Fiber-Coupled Laser Diodes: Simulation and Experiment. IEEE J. Quantum Electron. 2016, 52, 1–10. [Google Scholar] [CrossRef]
- Delen, X.; Balembois, F.; Georges, P. Temperature dependence of the emission cross section of Nd:YVO4 around 1064 nm and consequences on laser operation. J. Opt. Soc. Am. B 2011, 28, 972–976. [Google Scholar] [CrossRef]
- Sato, Y.; Taira, T. Temperature dependencies of stimulated emission cross section for Nd-doped solid-state laser materials. Opt. Mater. Express 2012, 2, 1076–1087. [Google Scholar] [CrossRef]
- Nie, M.; Liu, Q.; Ji, E.; Gong, M. Gain change by adjusting the pumping wavelength in an end-pumped Nd:YVO4 amplifier. Appl. Opt. 2015, 54, 8383–8387. [Google Scholar] [CrossRef] [PubMed]
- Krishnan, G.; Bidin, N. Determination of a stimulated emission cross section gradient on the basis of the performance of a diode-end-pumped NdYVO4 lase. Laser Phys. Lett. 2013, 10, 1–5. [Google Scholar] [CrossRef]
- Peterson, R.; Jenssen, H.; Cassanho, A. Investigation of the Spectroscopic Properties of Nd:YVO4. In Proceedings of the Advanced Solid-State Lasers (Optical Society of America, 2002), Québec City, QC, Canada, 3 February 2002; pp. 294–298. [Google Scholar]
Figure 1.
(a) Schematic of the fiber stage. OI: optical isolator; WDM: wavelength division multiplex; YDF: Ytterbium doped fiber; BPF: band pass filter (5 nm). (b) Photo of setup of solid-state laser amplifiers.
Figure 1.
(a) Schematic of the fiber stage. OI: optical isolator; WDM: wavelength division multiplex; YDF: Ytterbium doped fiber; BPF: band pass filter (5 nm). (b) Photo of setup of solid-state laser amplifiers.
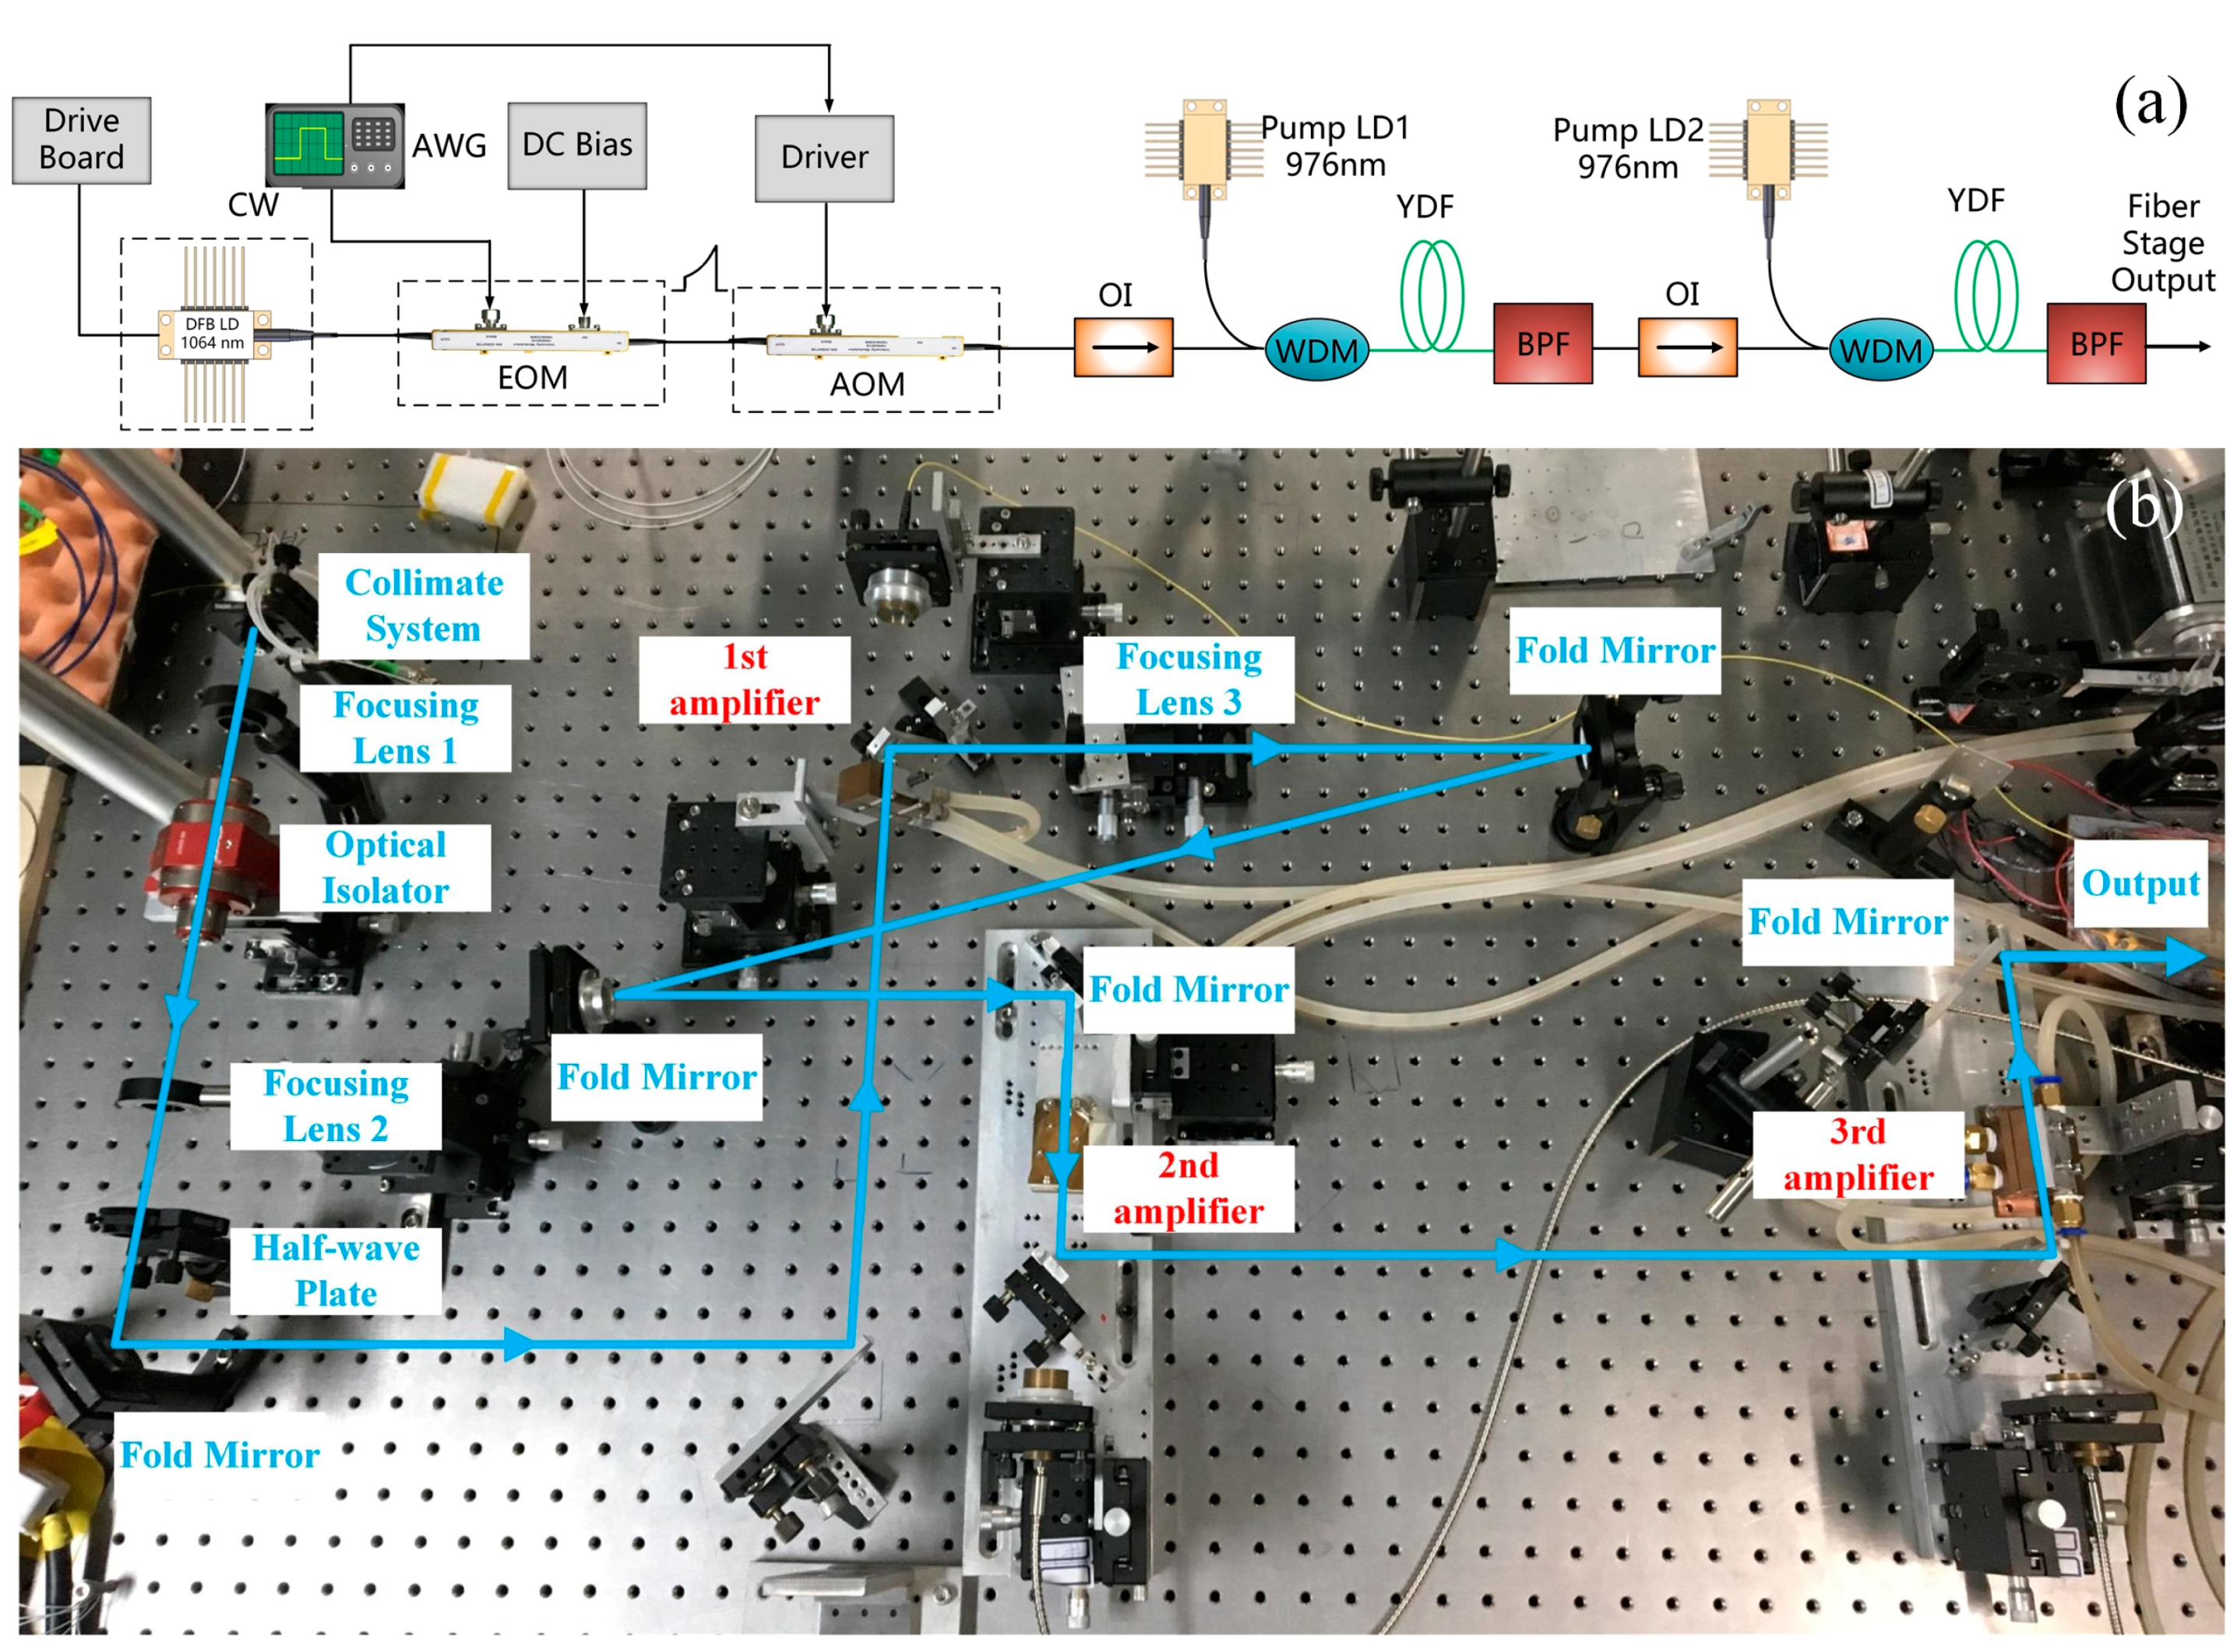
Figure 2.
The results are measured at a pulse repetition rate of 100 kHz with a pulse duration of 168 ns. (a) Raman frequency shift from the stimulated Brillouin scattering (SBS) effect; (b) pulse distortion due to backward SBS generation.
Figure 2.
The results are measured at a pulse repetition rate of 100 kHz with a pulse duration of 168 ns. (a) Raman frequency shift from the stimulated Brillouin scattering (SBS) effect; (b) pulse distortion due to backward SBS generation.
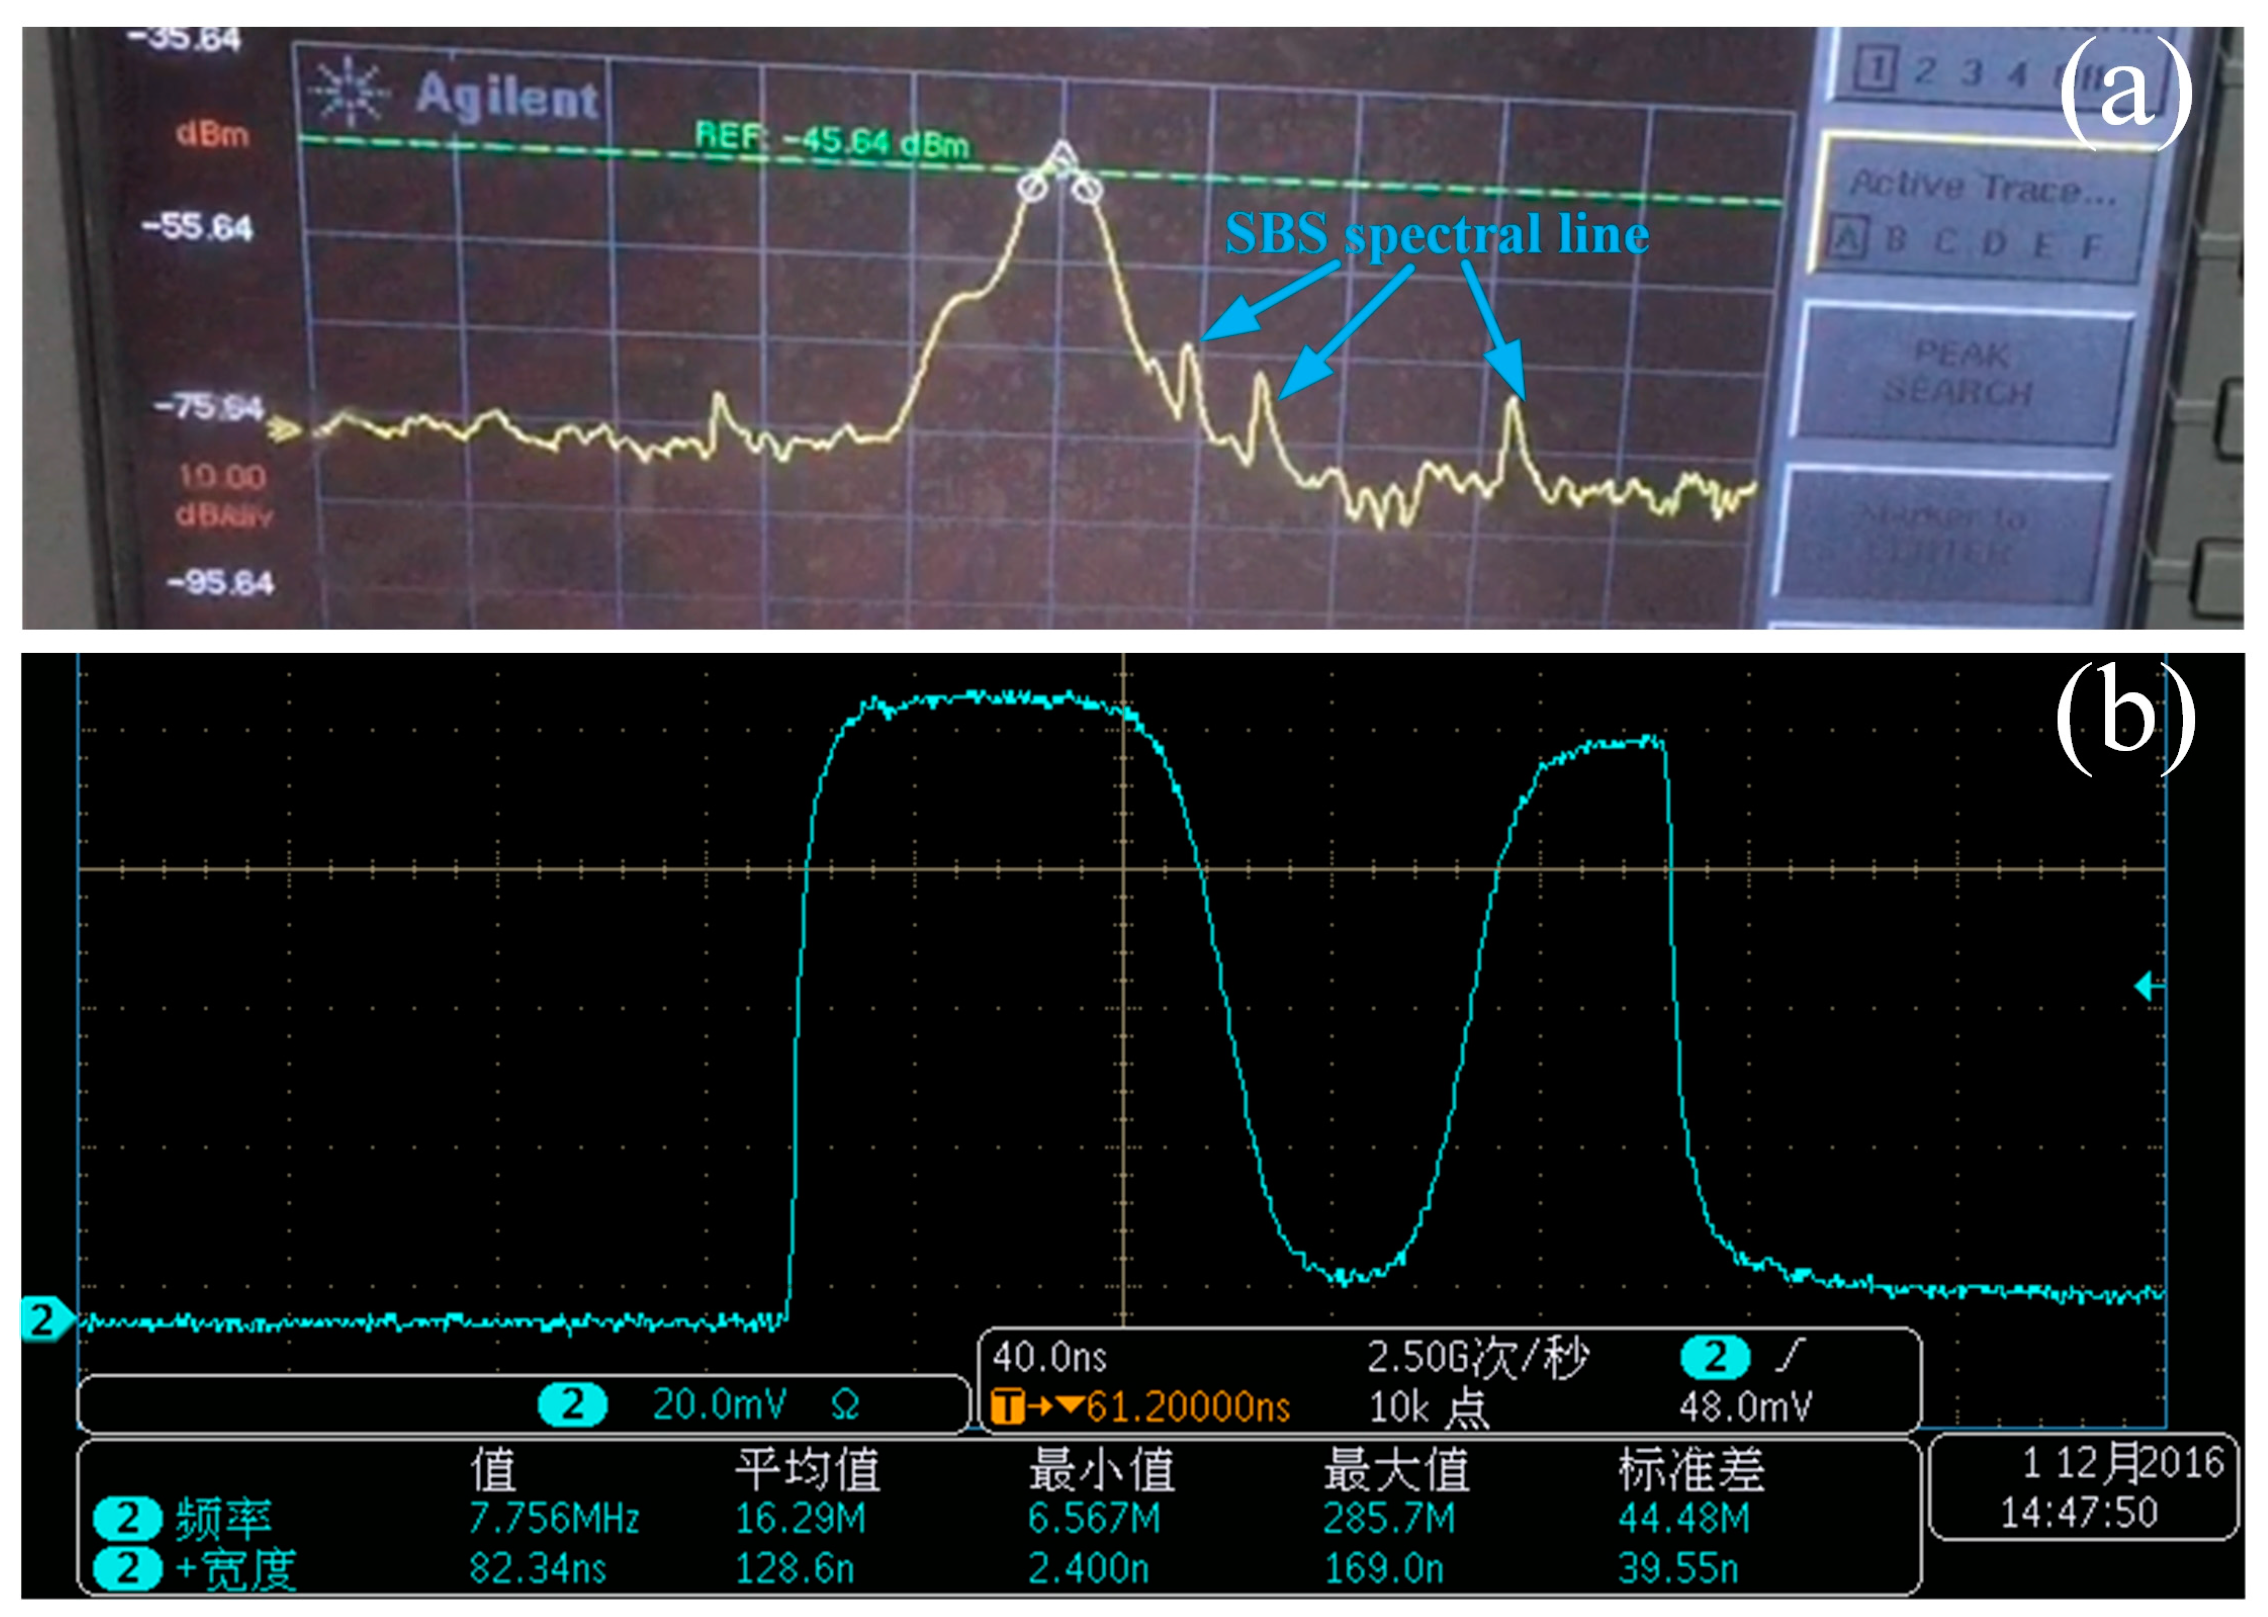
Figure 3.
Pulse shape evolution during the iteration.
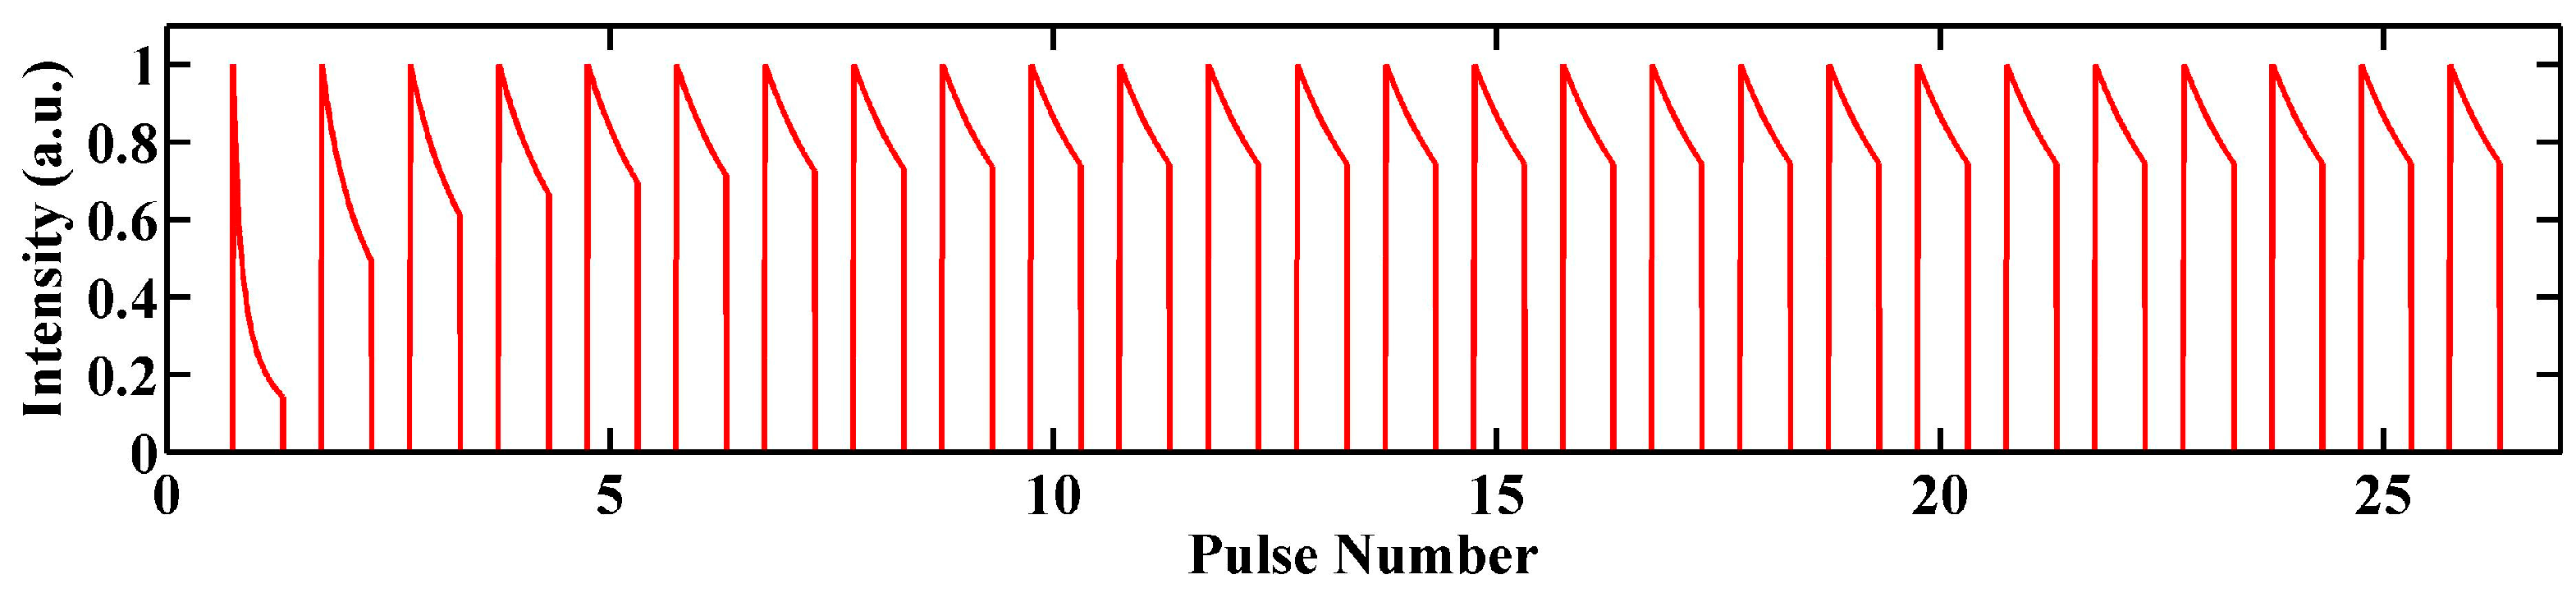
Figure 4.
(a) Pulse shape transfer function from experiment and simulation. (b) Output pulse shape from experiment and simulation with the same input pulse shape.
Figure 4.
(a) Pulse shape transfer function from experiment and simulation. (b) Output pulse shape from experiment and simulation with the same input pulse shape.

Figure 5.
Compensation of the pulse distortion. (a) Input pulse shape (three pulses); (b) output pulse shape with amplified power.
Figure 5.
Compensation of the pulse distortion. (a) Input pulse shape (three pulses); (b) output pulse shape with amplified power.

Figure 6.
Pulse evolution for each amplifier.
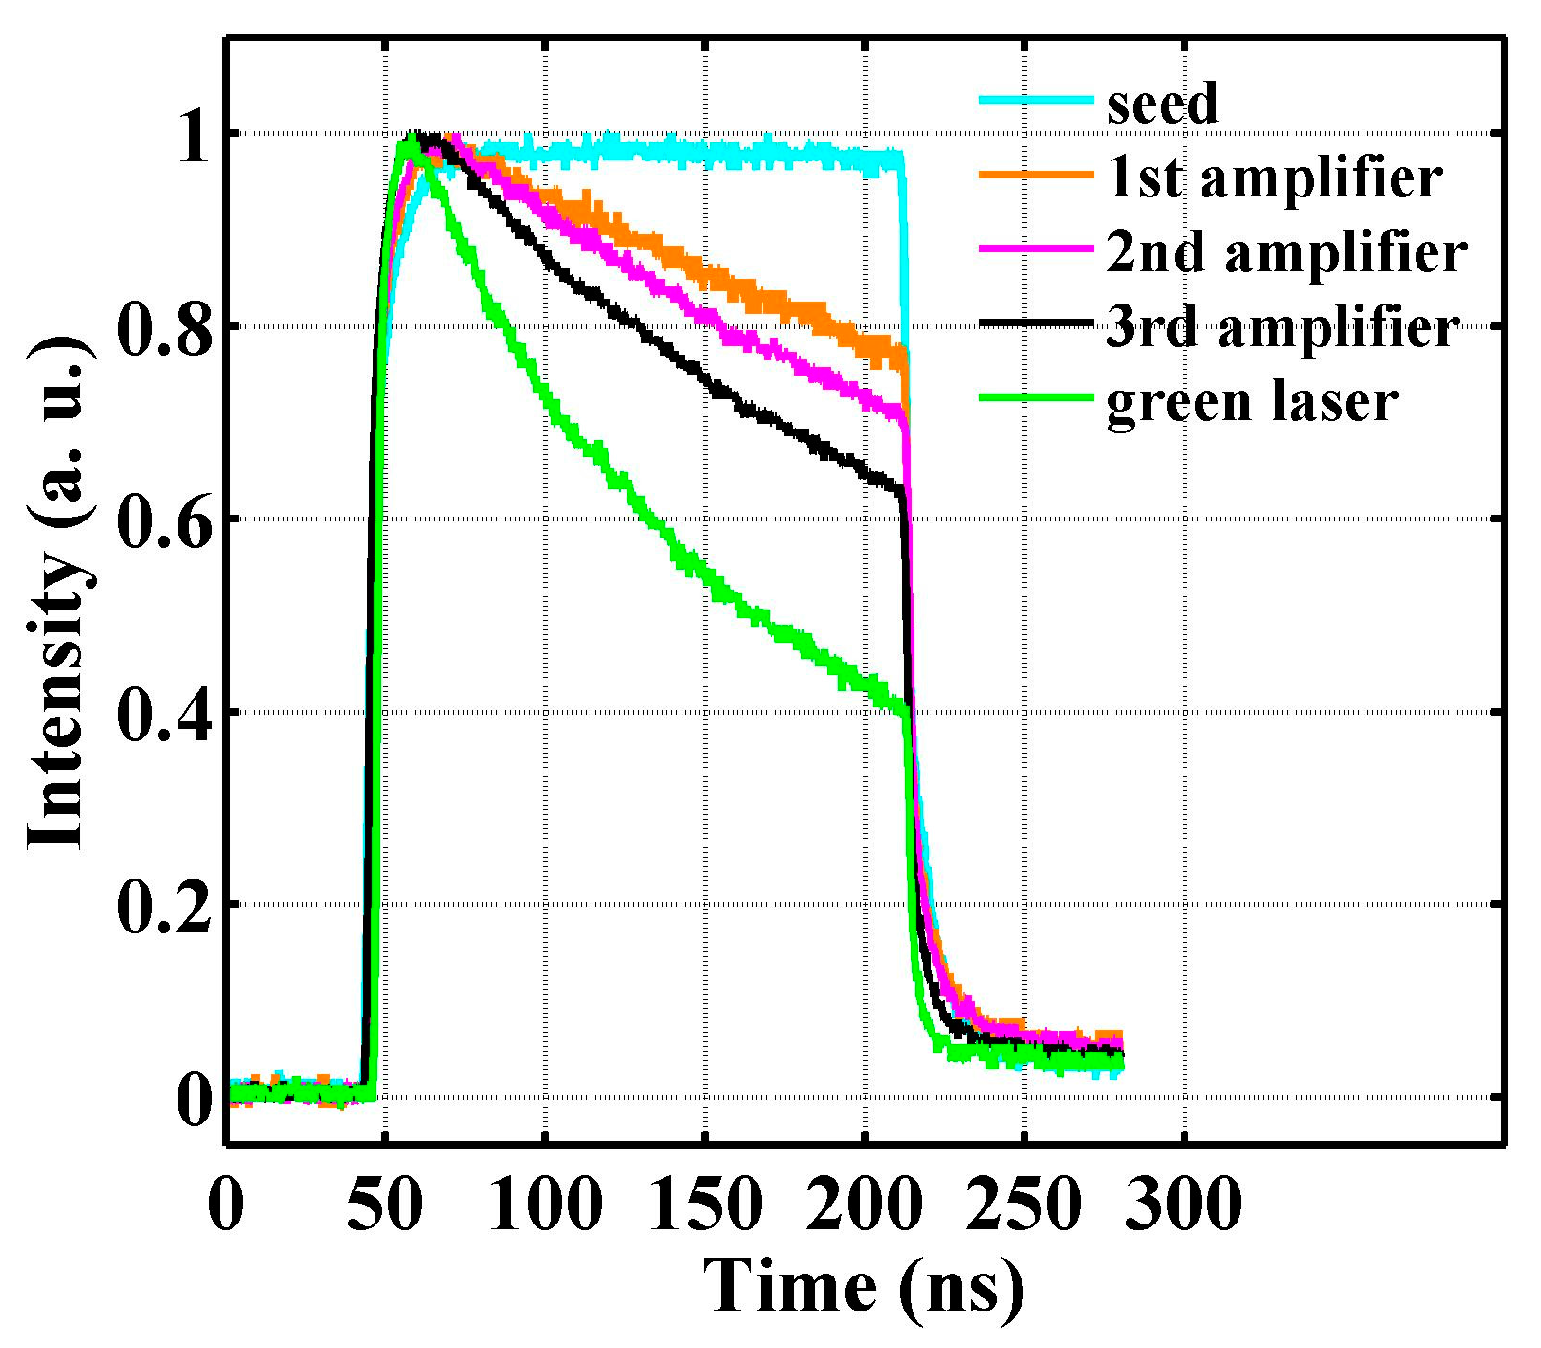
Figure 7.
Desired pulse shapes for the 1064 nm and 532 nm at a PRF of 100 kHz. Target is for 1064 nm. (a) Multiple-step; (b) Parabolic; (c) Gaussian; (d) Square. (Input pulse shape is given in the inset).
Figure 7.
Desired pulse shapes for the 1064 nm and 532 nm at a PRF of 100 kHz. Target is for 1064 nm. (a) Multiple-step; (b) Parabolic; (c) Gaussian; (d) Square. (Input pulse shape is given in the inset).
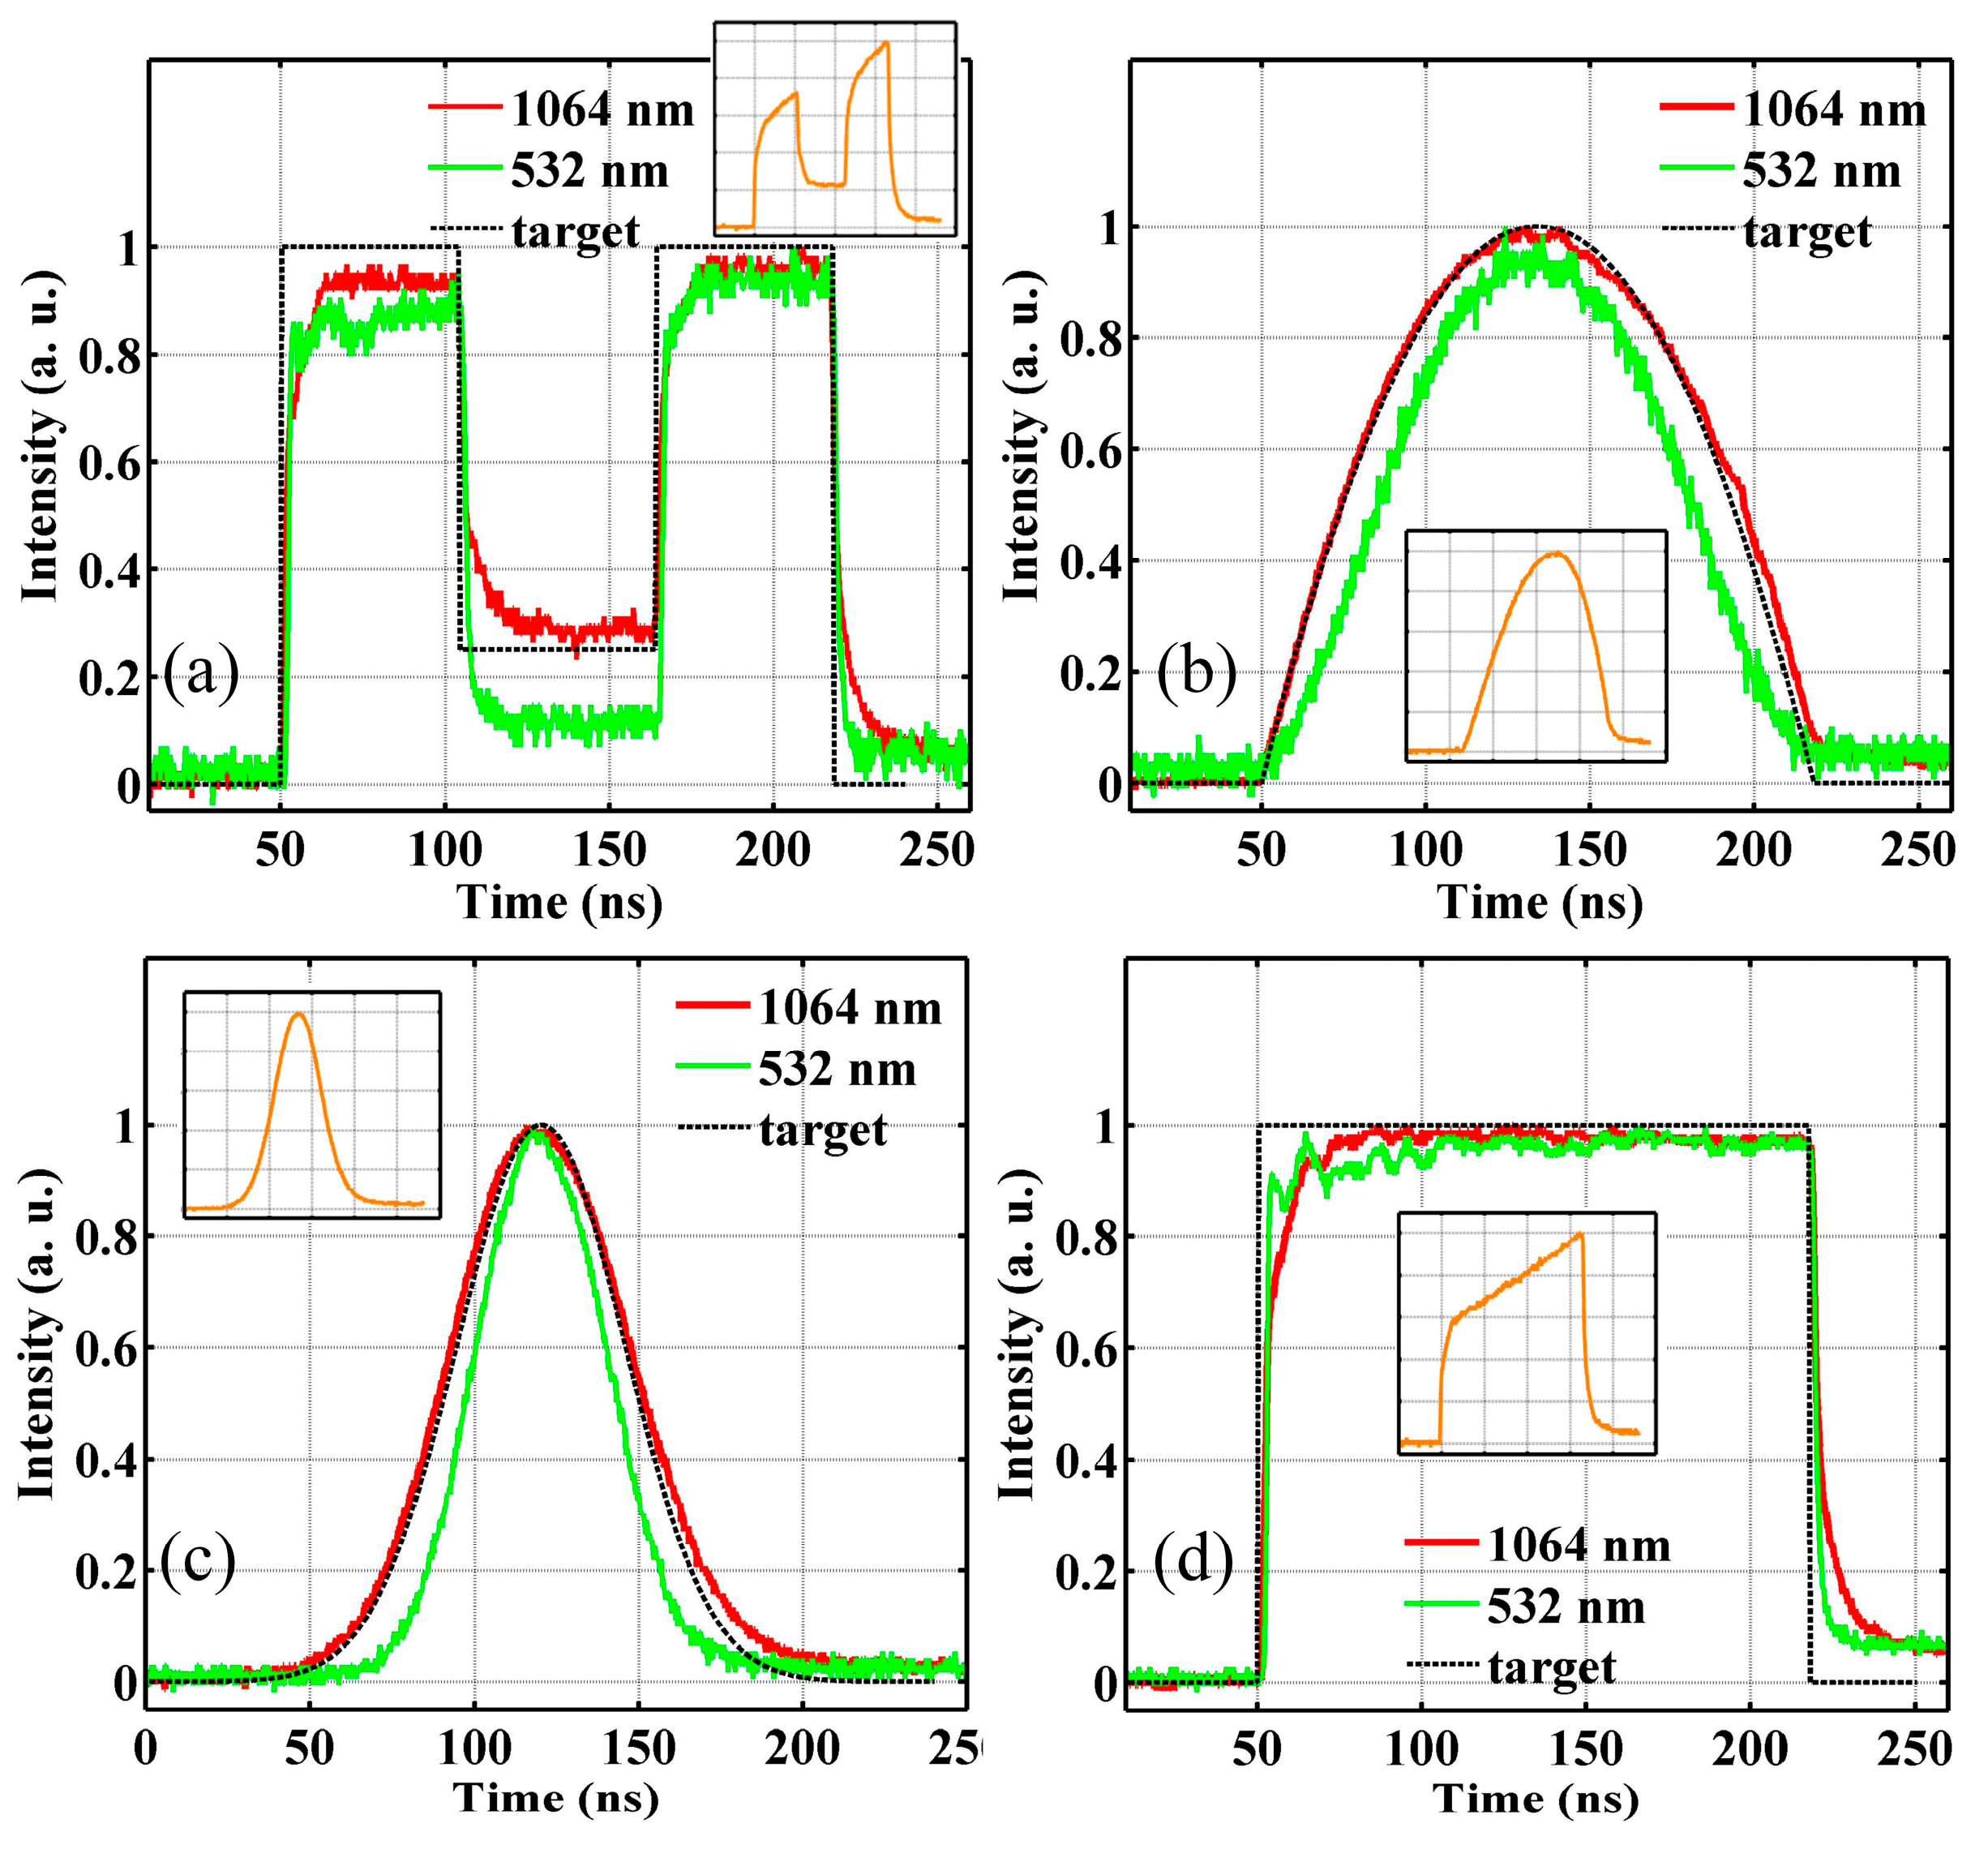
Figure 8.
Desired pulse shapes for the 1064 nm and 532 nm at a PRF of 40 kHz. Target is for 1064 nm. (a) Square; (b) Parabolic; (c) Gaussian. (Input pulse shape is given in the inset).
Figure 8.
Desired pulse shapes for the 1064 nm and 532 nm at a PRF of 40 kHz. Target is for 1064 nm. (a) Square; (b) Parabolic; (c) Gaussian. (Input pulse shape is given in the inset).


Table 1.
Progress in temporal compensation for saturated amplifiers.
| Amplifier | Peak Power (kW) | Linewidth (nm) | Exp or Theo 1 | Arbitrary Waveform | Reference |
|---|---|---|---|---|---|
| fiber | 2.6 | 3 | theo | yes | [7] |
| 1.5 | - | theo | yes | [8] | |
| 18 | 0.3 | exp | yes | [9] | |
| solid-state | - | - | exp | yes | [13] |
| 1.34×10⁸ | narrow | exp | no | [16] |
1 The method of obtaining the arbitrary waveforms: experimental or theoretical.
Table 2.
Temporal parameters of 1064 nm and an output power of 532 nm.
| Pulse Shape | 100 kHz, 41.4 W | 40 kHz, 38.3 W | ||||||
|---|---|---|---|---|---|---|---|---|
| Leading Edge (ns) | Falling Edge (ns) | Pulse Duration (ns) | Power of Green Laser (W) | Leading Edge (ns) | Falling Edge (ns) | Pulse Duration (ns) | Power of Green Laser (W) | |
| square | 9 (1.53) 1 | 15 (5.7) | 168 (166.8) | 3.63 | 6.6 (2.4) | 8.6 (3.6) | 39 (38) | 14.5 |
| Gaussian | 45 (32.6) | 51 (37.9) | 63 (47.2) | 5.3 | 16 (11.7) | 20 (13.7) | 23 (17.5) | 16.3 |
| parabolic | 49 (57.2) | 54 (64.4) | 123.4 (96) | 4.19 | 14 (14.4) | 18 (13.2) | 29 (24.7) | 16.0 |
| multiple-step | 8 (2.0) | 12 (7.5) | 111 (-) | 4.23 | - | - | - | - |
1 The data in the bracket is for green laser.
© 2017 by the authors. Licensee MDPI, Basel, Switzerland. This article is an open access article distributed under the terms and conditions of the Creative Commons Attribution (CC BY) license (http://creativecommons.org/licenses/by/4.0/).
Share and Cite
MDPI and ACS Style
Nie, M.; Liu, Q.; Ji, E.; Cao, X.; Fu, X. Temporally Programmable Hybrid MOPA Laser with Arbitrary Pulse Shape and Frequency Doubling. Appl. Sci. 2017, 7, 892. https://doi.org/10.3390/app7090892
AMA Style
Nie M, Liu Q, Ji E, Cao X, Fu X. Temporally Programmable Hybrid MOPA Laser with Arbitrary Pulse Shape and Frequency Doubling. Applied Sciences. 2017; 7(9):892. https://doi.org/10.3390/app7090892
Chicago/Turabian StyleNie, Mingming, Qiang Liu, Encai Ji, Xuezhe Cao, and Xing Fu. 2017. "Temporally Programmable Hybrid MOPA Laser with Arbitrary Pulse Shape and Frequency Doubling" Applied Sciences 7, no. 9: 892. https://doi.org/10.3390/app7090892
Note that from the first issue of 2016, this journal uses article numbers instead of page numbers. See further details here.