Article

Gas Sensor Design Based on a Line Locked Tunable Fiber Laser and the Dual Path Correlation Spectroscopy Method

by
Everardo Vargas-Rodriguez
1,*,
Ana Dinora Guzman-Chavez
1,
Raja Kamarulzaman Raja-Ibrahim
2 and
Luis Eusebio Cardoso-Lozano
1
1
Departamento de Estudios Multidisciplinarios, División de Ingenierías, Universidad de Guanajuato, Av. Universidad s/n, Col. Yacatitas, 38940 Yuriria, Gto., Mexico
2
Physics Department, Faculty of Science, Universiti Teknologi Malaysia, Johor Bahru 81310, Malaysia
*
Author to whom correspondence should be addressed.
Appl. Sci. 2017, 7(9), 958; https://doi.org/10.3390/app7090958
Submission received: 9 August 2017 / Revised: 9 September 2017 / Accepted: 18 September 2017 / Published: 19 September 2017
(This article belongs to the Section Optics and Lasers)

Abstract

:
In this work a hybrid gas sensor based on a tunable fiber laser and a correlation spectroscopy technique is presented. The laser is tuned by varying the temperature of a bulk silicon wafer of 85 μ m thickness and, once the desired wavelength is reached the line, is locked by keeping fixed its temperature. According to experimental results the wafer temperature variation was in the order of 0.02 K, which induced an estimated wavelength deviation of 0.12 pm, which satisfies the high wavelength position accuracy required for gas sensing applications. Additionally, it is shown that errors due to laser intensity fluctuations can be minimized by implementing a simple dual path correlation spectroscopy stage. As a proof of the suitability of our tunable fiber laser for gas sensing applications, a C2H2 sensor was implemented. By using a 10 cm gas cell at atmospheric pressure, it was possible to detect concentrations from 0 to 20% with a sensitivity of 521 ppm and sub-minute time response. Moreover, the experimental measurements and simulated results have a high level of agreement. Finally, it is important to point out that, by using doped fiber with different characteristics, other wavelength emissions can be generated.

1. Introduction

Gases are used in a broad range of applications and therefore it is important to have sensors capable of measuring concentration with high precision. In particular, acetylene is a highly flammable gas that is used in several industrial applications. Its lower explosive limit (LEL) of 2.5% by volume and its upper explosive limit (UEL) of 100% by volume make this gas extremely hazardous. Therefore, sensors capable to detect its concentration with high sensitivity and low cross sensitivity to other gases are necessary. In general there are different sensor configurations, for instance, non-dispersive sensors (NDS) and those based on the tunable laser absorption spectroscopy (TLAS) technique. In NDS, basically all wavelengths from a broadband source arrive together to an optical detector. Different configurations of this type of sensors can be implemented by using basic components such as a broadband source, a band pass filter and a detector. In order to either increase the sensitivity, to minimize the cross sensitivity of the sensor to other molecules, or to minimize some type of errors, authors have proposed designs that use either two detectors, two sources, two cells (one for reference and one for measurement), or a combination of these components [1,2,3]. In sensors based on the TLAS technique, ideally only one wavelength arrives at the optical detector at a time. Hence, to implement this sensing setup it is necessary to have a laser emission that can be tuned within the range where ro-vibrational absorption lines of the target molecule occurs [4]. Commonly, TLAS can be performed in two different modes: Analytical Tunable Laser Absorption Spectroscopy (ATLAS) or Line Locked Tunable Laser Absorption Spectroscopy (LL-TLAS) [5]. In ATLAS mode, the laser line emission is scanned to resolve with high resolution one or more absorption lines of the target molecule [6,7,8,9,10]. In LL-TLAS mode, the emission is ideally matched with the central wavelength of the absorption line, thereby the overall laser intensity observed by the detector will be affected as the gas concentration is varied [5]. Diode lasers have been used as TLAS sources since a long time ago [7,8,9,10]. Hence, diode lasers, as single-mode distributed feedback laser diodes (DFB), are quite popular for this application. Another light source option for LL-TLAS sensing in the near infrared (NIR) region are fiber lasers, since these can provide narrow line width emissions and are relatively low cost because these can be implemented with standard communication components [4]. These lasers can be used to detect gases such as acetylene (C2H2), hydrogen iodide (HI), ammonia (NH3), carbon monoxide (CO) and carbon dioxide (CO2) [11,12,13]. Lasers that will be used in TLAS applications must be able to be continuously tuned over the spectral range where the ro-vibrational absorption lines occur. Hence not all optical fiber lasers can be finely tuned due to the mode hopping effect [10,12,13,14,15], however some optical fibers with continuous tuning have previously been achieved [13,14,15]. Moreover, some authors have proposed fiber lasers for gas sensing [12,16]. A practical limitation of LL-TLAS is the difficulty to maintain fixed the wavelength of the laser at the absorption line center over time due to different factors, such as laser temperature fluctuation and oscillation current drift [17].
Acetylene sensors operating in the NIR region and based on optical fibers can be found in literature. Some of these sensors have achieved sensitivities in the order of 700 ppm by using path lengths of around 25 cm [18]. Higher sensitivities have been reported by using cells with lengths in the order of meters [19,20,21]. For instance, it has been reported a sensor with sensitivity of 100 ppm in which 1 m cell was used [19]. Another example is the sensor that achieved a sensitivity of 50 ppm by using a cell length of 27 m [21]. Moreover, these sensors typically have time responses in the order of a few seconds, up to some minutes [18,19,20,21,22]. In general, in sensor design there is an inherent compromise between the level of sensitivity, the time response and the gas path length. In this work a C2H2 sensor based on the Line Locked Tunable Laser Absorption Spectroscopy (LL-TLAS) and a dual path correlation spectroscopy method is presented. In order to implement the LL-TLAS technique, an erbium doped tunable fiber laser was designed and implemented. This laser used a silicon wafer as a selective filter that allowed us to finely tune the laser emission until it is matched to one ro-vibrational line of the target gas. Afterwards, the laser remains in line-locked mode by keeping the wafer temperature constant. This is achieved by driving a thermo-electric cooler with a proportional-integral-derivative (PID) control program. This allowed the laser to have a very high wavelength accuracy in the order of 0.12 pm, which is a mandatory requirement for this kind of sensing application. Moreover, the sensing arrangement is complemented with a simple dual path correlation spectroscopy stage that helps to strongly minimize errors due to laser intensity fluctuations. The achieved sensor sensitivity was of 521 ppm for the concentration range from 0 to 20% by using a 10 cm cell with a time response within the sub-minute order. Experimental measurements supported by numerical simulations are provided demonstrating the suitability of the tunable fiber laser for the implementation of this type of sensing application.

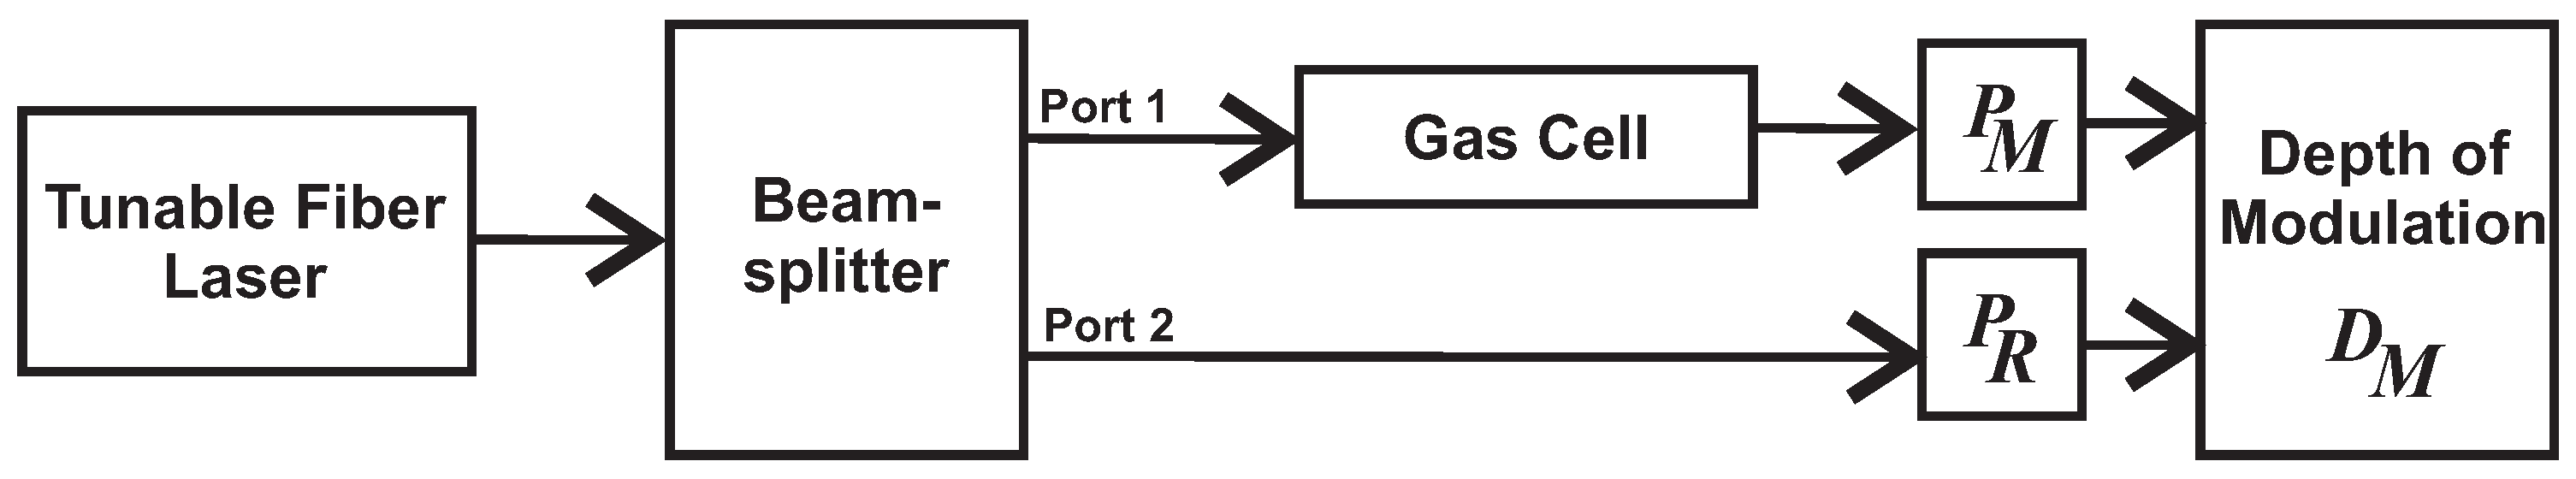
2. Gas Sensor Mathematical Model

The block diagram of the proposed hybrid gas sensor design is shown in Figure 1. Here, the source is a tunable fiber laser operating in line locked mode L λ ; ideally the beam is divided into two arms. In the first arm, which is called the measurement channel, the light passes through the gas cell before it arrives at the detector P M . In the second arm, which is called the reference channel, the beam arrives directly at the detector P R . In general terms, the measurement detector output can be described as:
P M C , l = λ 1 λ 2 L λ A λ , C , l R λ d λ ,
while the output of the reference channel is given by:
P R = λ 1 λ 2 L λ R λ d λ ,
where λ is the wavelength, A λ , C , l is the transmission through the gas cell, C is the gas concentration, l is the gas cell path length, and R λ is the detector responsivity. The depth of modulation D M is given as the ratio between the difference of the two channels and their average, and it can be written as [1,23]:
D M C , l = 2 P R k P M C , l P R + k P M C , l ,
In this way, D M is unitless and in our case k is a proportionality constant to take into account losses in the measurement channel. In a practical way, k can be calculated as the ratio between the signals provided by the reference and the measurement detectors when the C2H2 concentration is 0. In this form the depth of modulation will be 0 when the C2H2 concentration is 0% and it will be increasing with the concentration. Now, let us represent the laser wavelength tuning position error as r and the laser intensity fluctuations by q. Following, these parameters can be included in the depth of modulation equation and therefore this can be rewritten as:
D M C , l = 2 λ 1 λ 2 q L λ ± r , T R λ d λ k λ 1 λ 2 q L λ ± r , T A λ , C R λ d λ λ 1 λ 2 q L λ ± r , T R λ d λ + k λ 1 λ 2 q L λ ± r , T A λ , C R λ d λ
Here, as the wavelength band λ 2 λ 1 , where the laser emitting is very narrow, it is possible to consider R λ as a constant and therefore all terms of Equation (4) can be canceled. Moreover, since the laser intensity fluctuation parameter q also can be treated as constant and it appears in all integrals of Equation (4), it can therefore be canceled. This issue demonstrates the advantage of using the two channels correlation spectroscopy method. However, if there is a tuning error in the laser wavelength, this will not be canceled by the correlation spectroscopy stage. Therefore, it is obligatory in this application that the laser has a high level of wavelength accuracy r 0 .

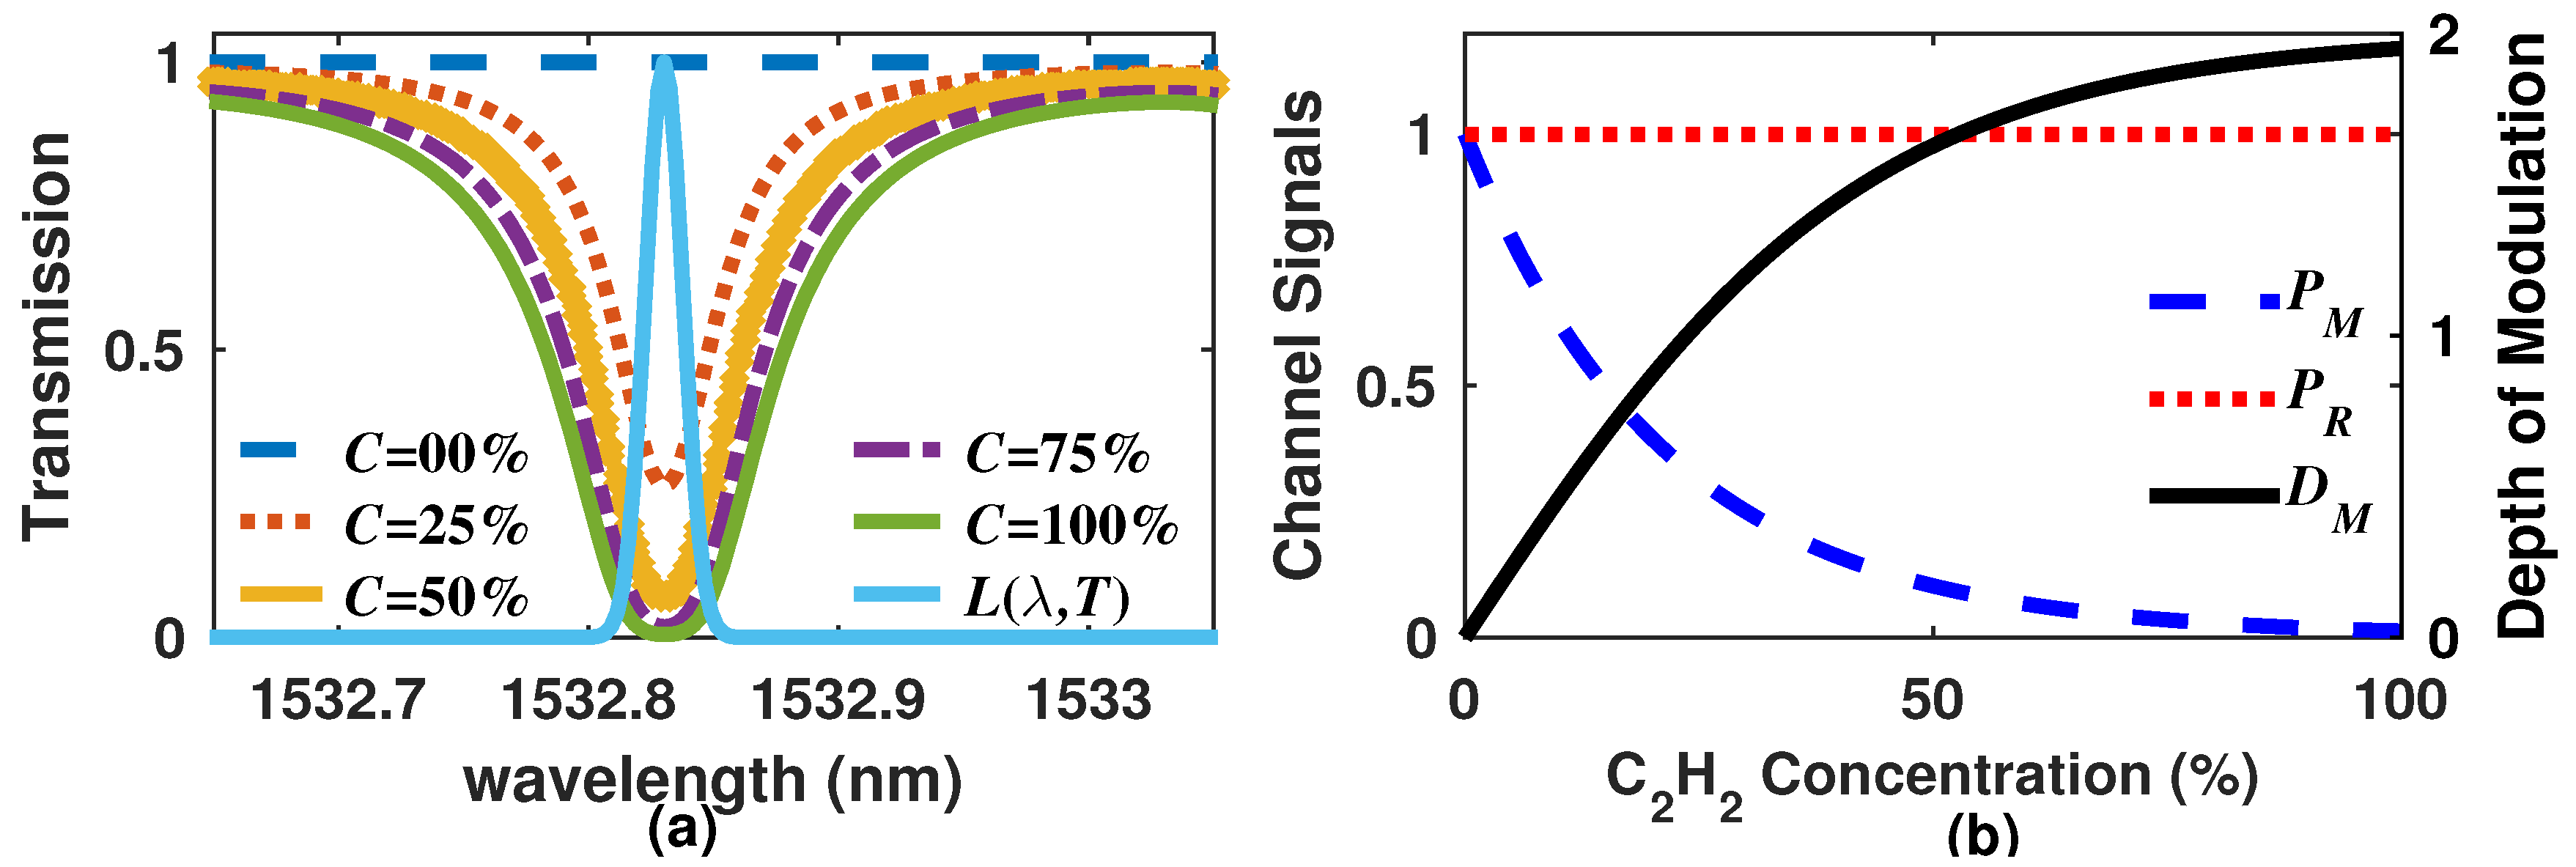
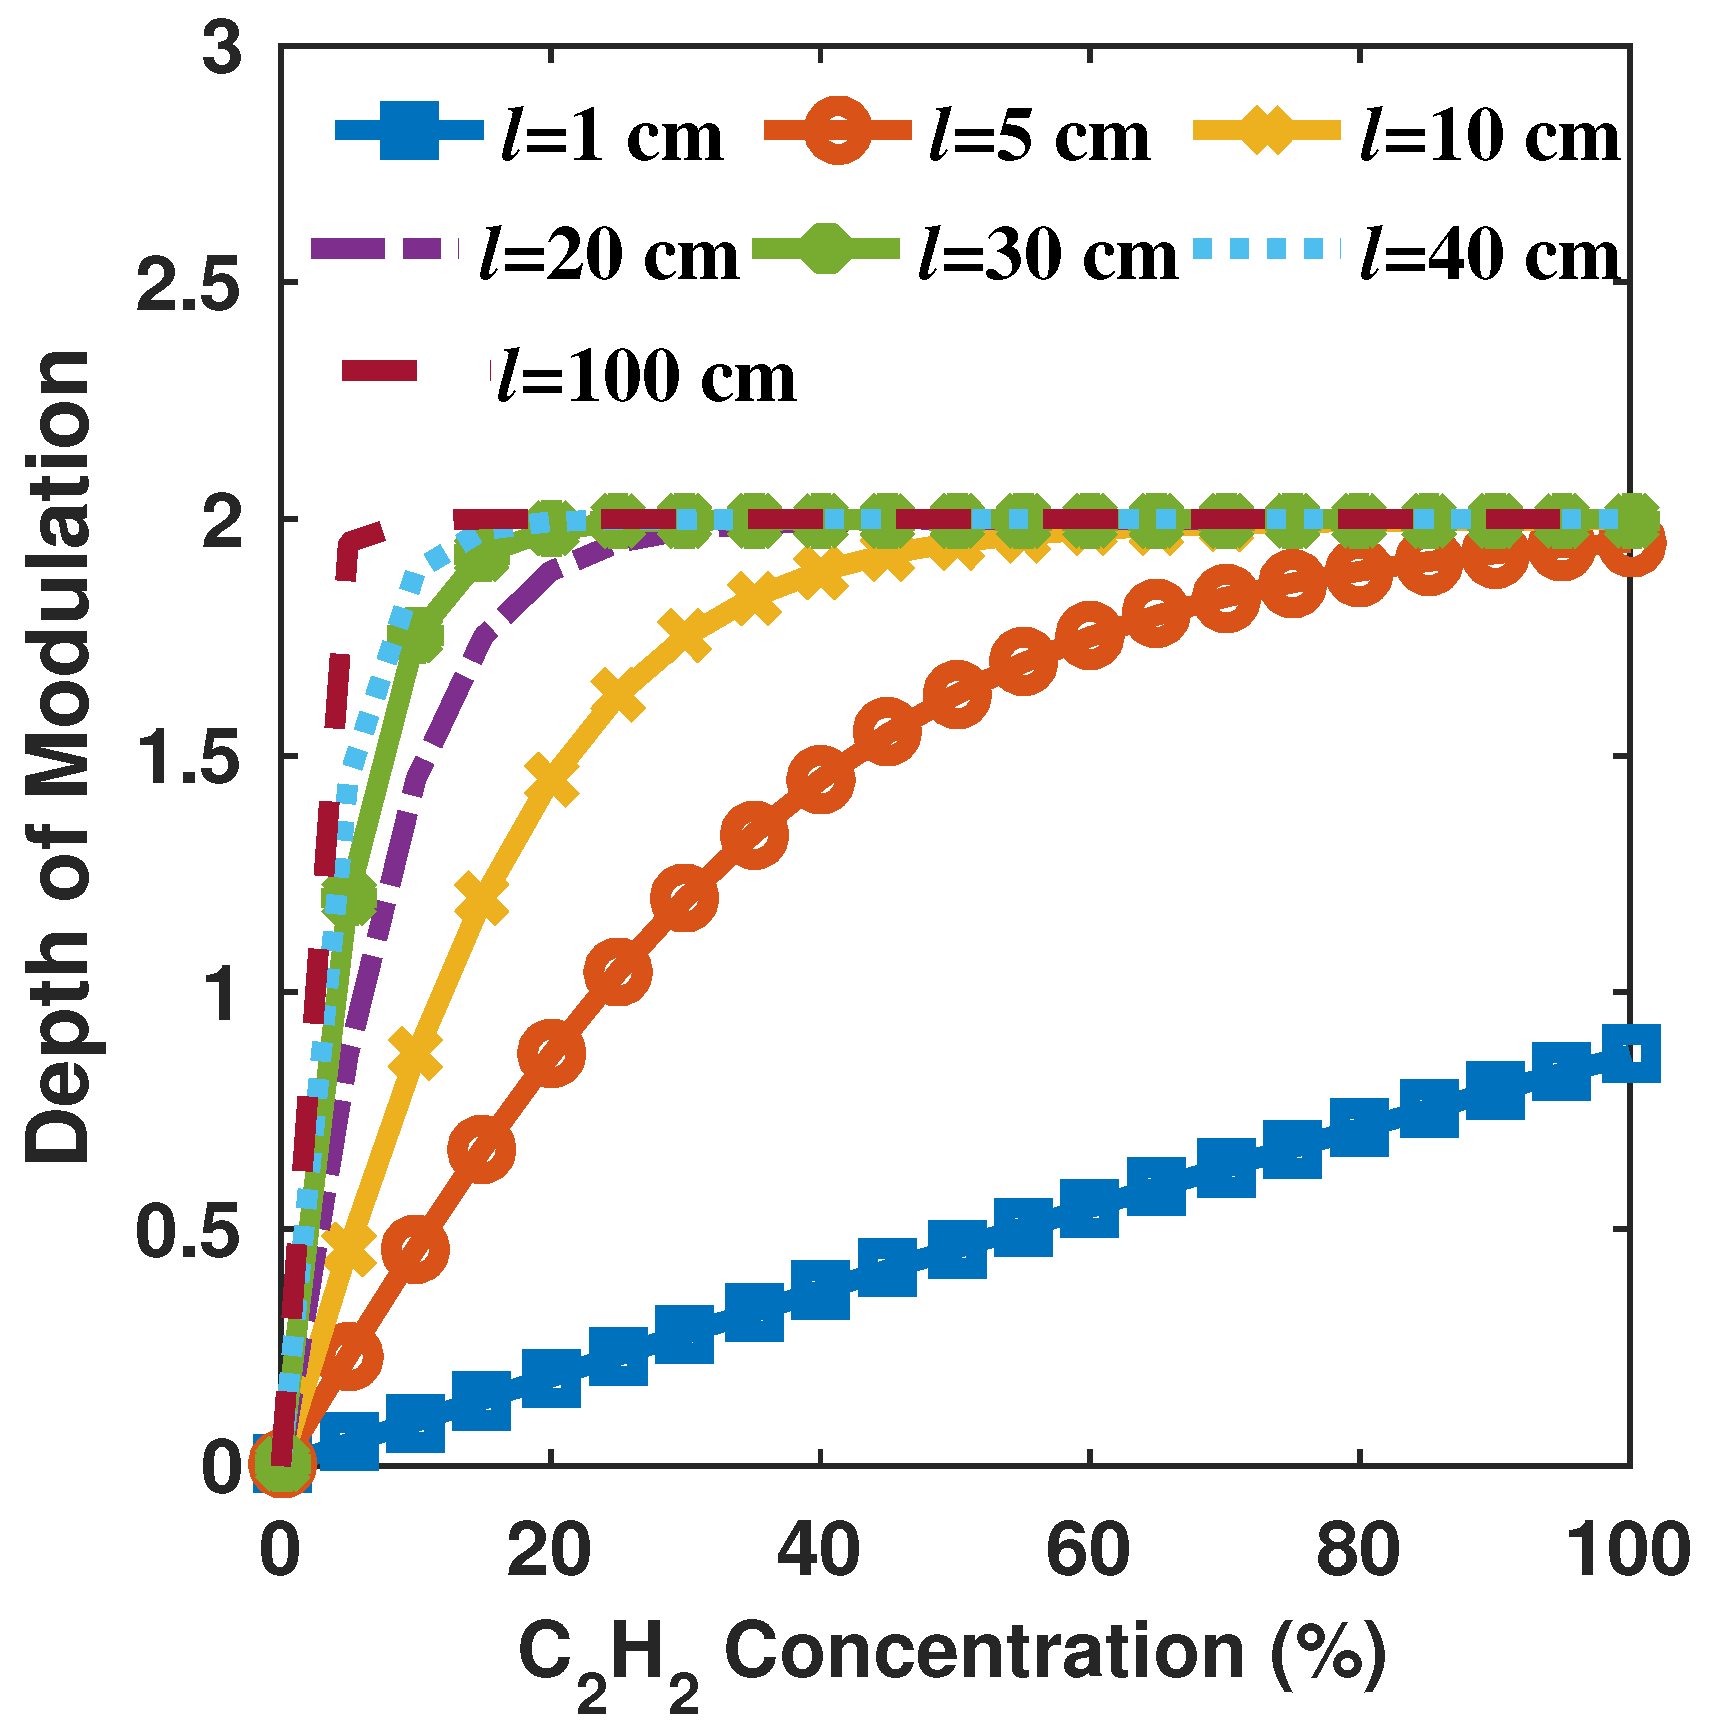
3. Simulation Results

In order to carry out some numerical simulations, let us consider the ro-vibrational line of C2H2 occurring at 1532.8302 nm [24] and use a laser line emission that has a Gaussian profile with 15 pm of full width at half maximum (FWHM) (Figure 2a). Moreover, to perform these simulations, we also considered a gas path length of 5 cm and different C2H2 concentrations within the range from 0 to 100%, at atmospheric concentration. Furthermore, the channels were considered ideal channels without optical losses and therefore k = 1 . For this case, the overall detector outputs and the depth of modulation are shown in Figure 2b. Here, it can be observed that the signal provided by the measurement detector P M decreases as the concentration increases, while the depth of modulation D M increases.
From these simulations it can be appreciated that a path length of 5 cm can be used to implement a sensor capable of detecting relatively high concentrations. However, the proper length can be determined depending on the target concentration range. For instance, in Figure 3, numerical results showing the effect of varying the gas path length are presented. Here, it can be observed that, to measure low concentration levels, it is necessary to select a longer path lengths. This will also increase in a considerable way the sensitivity since the depth modulation rapidly increases with the concentration, for instance, the case when l is in the order of 100 cm. Hence, the length of the cell can be selected depending of the application requirement.

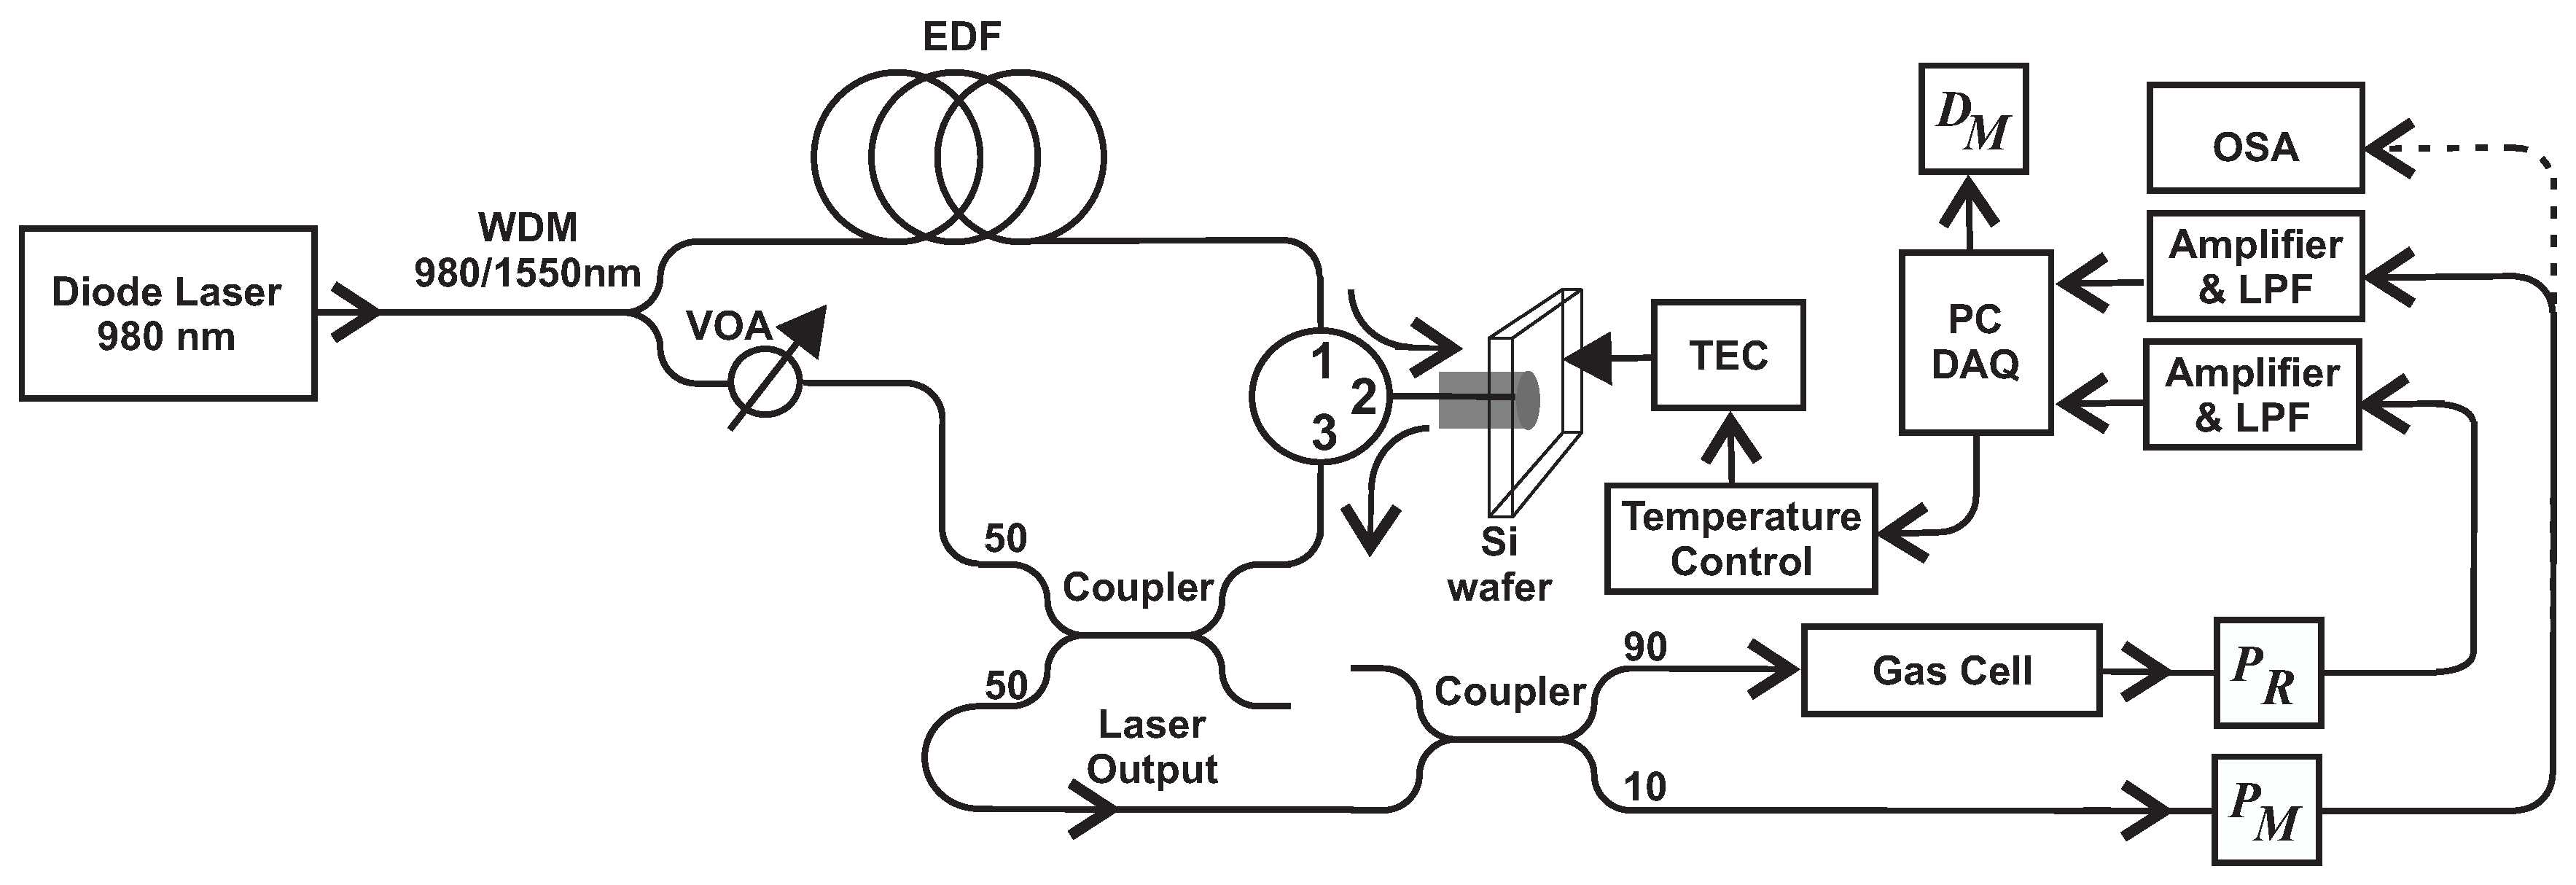
4. Experimental Sensing Setup

For this work the setup shown in Figure 4 was implemented. It was formed by a ring cavity fiber tunable laser, a beam coupler to split the laser output into two paths, two optical detectors, and an electronic stage to control the laser and to recover, amplify, and low pass filter (LPF) the sensor signals. In the setup a Yokogawa AQ6370C optical spectrum analyzer (OSA) was only used to characterize the laser spectrum profile.

4.1. Tunable Fiber Laser

Here, a tunable laser based on an erbium doped fiber ring cavity is utilized. Basically, this tunable laser is formed by a ring cavity in which a bulk silicon wafer of 85 μ m thickness is used as a spectral selective filter [25]. Hence, the wafer acts as a Fabry-Perot interferometer (FPI) and therefore its reflection pattern can be shifted by varying the refractive index of silicon. This can be achieved by taking advantage of the thermo-optical properties of silicon [25]. Consequently, this allowed us to tune the laser emission wavelength to match one ro-vibrational absorption line of the target molecule. In our case, we matched the laser emission with the ro-vibrational line of C2H2 occurring at 1532.8302 nm at atmospheric pressure [24]. Furthermore, in the laser cavity a variable optical attenuator (VOA) was used to suppress emissions in the region of 1550 nm. Here, the laser fine tuning mechanism depends directly on the silicon wafer that is acting as wavelength selective filter and it can be tuned by changing its temperature. Additionally, the VOA induces a coarse shifting and can help to select different wavelength regions. For the experiments carried out in this work, the VOA remained fixed. For dual path correlation spectroscopy measurements, it is necessary that the laser wavelength must remain stable over the time, otherwise considerable errors will be obtained. For instance, in Figure 5a it can be observed, from simulation results, that the depth of modulation error rapidly increases as the wavelength deviate a few picometers from the reference wavelength. Hence, the gas line absorption is acting as an extremely narrow suppression band filter and, therefore, if the laser wavelength slightly shifts, the signal monitored by the detectors will change in a considerable way. Therefore, this issue allowed us to indirectly assume that the laser line is wavelength locked by monitoring that the detectors output remains fixed over the time. In this way, we characterized that by keeping the silicon wafer constant such that the laser wavelength was locked. In our sensing arrangement, the wafer temperature was varied by means of a thermo-electric cooler (TEC) to reach the desired wavelength. Moreover, once the wavelength is matched, the Si wafer temperature must be kept stable over the time. In order to achieve this temperature stability, it was necessary to drive the TEC with a proportional-integral derivative (PID) control program that was implemented in LabVIEW software. By driving the TEC with this PID controller, it was possible to maintain the temperature of the Si wafer as highly stable, with a standard deviation of just 0.02 K. This represents that the laser wavelength was fixed to 1532.8302 pm with an estimated standard deviation of approximately 0.12 pm. These measurements were taken over a period of 3 h (Figure 5b) and show that the laser is suitable for this sensing application. The measured spectral profile of the laser emission L M is shown in Figure 6a, where it can be appreciated that it has a FWHM of approximately 16 pm, which is thinner than the ro-vibrational line of C2H2 occurring at 1532.8302 nm at atmospheric pressure [24]. In general the expected D M errors at the sensor output due to laser wavelength shifting (Figure 5a) can be explained by the fact that the laser width is narrower than the absorption line width. Hence, if the laser spectrally shifts, the power will rapidly increase following the shape of the gas absorption line. Therefore, the system tolerance to the laser wavelength shifting will also be affected by the pressure at the gas cell since it modifies the molecule absorption line widths. In our case we are characterizing the sensor response at atmospheric pressure. Additionally, in Figure 6a it is presented how the laser profile can be fitted to a Gaussian function L F with high agreement.

4.2. Dual Path Correlation Spectroscopy

Once the target laser wavelength has been reached, gas detection can be carried out directly by passing the laser emission through the cell and monitoring it with an optical detector. However, laser intensity fluctuations can affect the measurement readings. Therefore, in our sensing setup the laser output was divided into two channels by utilizing a 90/10 fiber coupler (Figure 4). The beam with 90% illuminates the measurement channel, while the 10% beam illuminates the reference channel. At the end of the optical channels, two identical indium gallium arsenide (InGaAs) detectors are placed to measure the overall light intensity of each channel. Both signals generated by detectors were conditioned and low pass filtered by using simple analog circuits. Furthermore, these signals are recovered with a data acquisition board and processed to calculate the depth of modulation. Here, it is important to point out that within the same PID control program the required functions were added to record the channel signals and to perform the depth of modulation calculations. At this point, we would like to point out that basically all the electronic and processing stages have the potential to be implemented within a simple microcontroller based acquisition board. This can help to compact the sensor and the size of the fiber laser can be reduced by using components, such as a short segment of a highly erbium doped fiber as a gain medium.
The system signals generated by both detectors, after conditioning, are shown in Figure 6b. It is important to mention that for this case, the experimental k value was calculated as 1.56. In this figure it can be observed that changes in the C2H2 concentration only affects the measurement signal P M , while the output of the reference channel P R is always constant. Moreover, when the C2H2 concentration is 0%, the reference and the measurement signals are equal and have maximum value, afterwards, if the concentration increases, the measurement signal level will decrease, which is in agreement with the numerical results (Figure 2b). The calculated depth of modulation as a function of time is shown in Figure 6c. Here it can be appreciated that the depth of modulation increases with concentration and conveniently is 0 when the C2H2 concentration is 0%. For this experiment, we alternated a 0% C2H2 concentration and a given mixture of C2H2/N2. Moreover, in this figure, it can be noted that D M levels are constant while the mixture of C2H2/N2 remains fixed, which shows the stability of the sensor over the time.
Finally, in order to determine the experimental depth of modulation D M E we calculated its average value over a period of time for each tested concentration (Figure 6c). Moreover, to compare our experimental measurements with the numerical results, we considered as a light source a Gaussian function L F with a FWHM of 16 pm (Figure 6a). The simulated D M S and the experimental D M E depth of modulation are shown in Figure 6d. These results show that D M E has a nonlinear behavior within the concentration range from 0 to 100%. However, some intervals of D M E can be fit with the linear function D M F = m C + n . For instance, in the inset of Figure 6d are shown the measured D M E values for the range from 0 to 20% and its corresponding linear fit. In this way, the function can be segmented into four concentration ranges that can be fit with a linear function. The m and n constants of the linear functions that fit each one of these intervals are provided in Table 1, as well as its corresponding R 2 adjustment coefficient. From this figure it can be appreciated that in general our experimental results are quite close to the simulated results, and we think that the difference at higher concentrations between D M S and D M E is due to the fact that we used an approximated function to describe the laser emission that can introduce small variations in the numerical results.

5. Minimization of Errors Due to Laser Intensity Fluctuations

Laser intensity fluctuations can be due to laser power supply fluctuations, drift or aging [2,19]. In the dual path correlation spectroscopy arrangement both detector outputs will change in the same proportion as the laser intensity varies. Therefore, by calculating the depth of modulation, these fluctuations will be canceled. In order to probe this point, in our experiment we intentionally varied the laser line intensity while the gas concentration was left fixed. As an example, the gas cell was filled with a mixture of 9% C2H2 and 91% N2 and after a certain time we reduced the laser intensity five times. This consequently affected the signal levels of both channels (Figure 7a). By using these signals the depth of modulation was calculated and the result is presented in Figure 7b, where it can be appreciated that the depth of modulation is practically unaffected by laser intensity fluctuations. As a further example, we performed an additional measurement, which started with a 0% C2H2 concentration, after we filled the cell with the mixture of 40% C2H2 balanced with N2. At this point the measurement channel signal started to drop (Figure 7c) while the D M started to increase until it reached its constant state (Figure 7d). Afterwards, we reduced the light intensity in two different times, affecting both channel signals (Figure 7c) while the D M remained constant (Figure 7d). Finally, the light intensity was increased to its initial value and both channels signals recovered their levels (Figure 7c), while the D M continued quite stable over the time (Figure 7d). These measurement results are very important since they clearly demonstrate that the dual path correlation spectroscopy is able to minimize large laser intensity fluctuations (Figure 7a,c) by calculating the depth of modulation (Figure 7b,d).

6. Sensor Sensitivity

The sensor sensitivity is the minimum concentration that can be detected by the system. This implies that the sensitivity is the concentration for which the signal to noise ratio (SNR) is equal to unity ( S = N ) [26]. Afterwards, considering that the sensor output has a linear behavior, therefore, it is possible to rewrite the relationship S = N as ( Δ D M E / Δ C ) C = σ , where σ is the standard deviation over the time of the depth modulation signal. Here, as our sensor has a nonlinear output, therefore, we grouped the measurements into four intervals that can be fit by a linear function D M F = m C + n ; the details of each range and their corresponding function constants are listed in Table 1. Moreover, the depth of modulation as a function of time was recorded and its corresponding average value and standard deviation were calculated. This procedure was performed for one concentration level within each range. For instance, the depth of modulation as a function of time for a C σ = 9% concentration is shown in Figure 8a, which has an average value of 0.522 and a standard deviation of 2.9 × 10 3 . By using these values, it is possible to estimate that the system sensitivity is 521 ppm for a concentration range from 0 to 20%. The sensor sensitivity for different concentration ranges are given in Table 1. Furthermore, it is important to comment that the sensor response can be faster by reducing the order of the low pass filter process, however, it will reduce the sensor sensitivity. For instance, in Figure 8b, the transition region is shown in detail and an appreciation can be gained in how the D M changes when the concentration is varied and considering two different low pass filters (LPF1 and LPF2). For this work, LPF1 was a high order low pass filter that was used to remove the sensitivity of 521 ppm. LPF2 was a first order low pass filter, which makes it possible to reduce the response time (Figure 8b), however, it has a penalty in the sensitivity since it increases up to 2578 ppm. Therefore, depending on the combination of required parameters such as the response time and the sensitivity, the gas cell and the low pass filter parameters can be adjusted. Finally, it is important to point out that our tunable optical fiber laser is capable to be finely tuned over different spectral windows where absorption lines due to different molecules can occurs. By means of the VOA, spectral windows between 1530 and 1565 nm can be selected and these can be scanned by changing the temperature of the silicon wafer. Moreover, other wavelength windows of the telecommunications region can be achieved by changing the laser gain medium. This is useful for spectroscopy applications since there are different molecules that can be detected in this spectral region. Also, the overall cost of the system is relatively competitive since it can be implemented with standard optical telecommunication components.

7. Conclusions

In this work, a comprehensive modeling of a hybrid gas sensor is presented. For this application, a fiber tunable laser with very high wavelength stability was designed and implemented. The laser was tuned by changing the temperature of a 85 μ m thickness silicon wafer with a PID control program. According to experimental measurements, the standard deviation of the wafer temperature was 0.02 K, which induced a wavelength standard deviation of 0.12 pm within a period of 3 h. This level of wavelength accuracy avoided errors due to wavelength instability. Furthermore, it is demonstrated that, by adding a dual path correlation, spectroscopy stage errors due to laser intensity fluctuations can be strongly minimized. Therefore, to demonstrate the viability of a sensor based on the tunable laser and the dual path correlation spectroscopy, an acetylene sensor was implemented. Here, it is shown that by using a 10 cm gas cell, the sensor achieved a sensitivity of 521 ppm for the concentration range from 0 to 20% with a sub-minute time response. Moreover, it was stated that the concentration range, the sensitivity and the time response can be modified by changing different parameters such as the gas path length and the low pass filter constants. Since simulated and experimental results have a high level of agreement, it is possible to consider that this sensing method can be applied to detect different gases. Finally, it is important to point out that one advantage of the fiber tunable laser is that it can emit in other wavelengths by using different doped fibers or wafer thickness.

Acknowledgments

This work was partially supported by the Universidad de Guanajuato and partially by Research University Grant Tier 1 Vot 02768.

Author Contributions

E.V.-R., A.D.G.-C. and R.K.R.-I. designed the tunable fiber laser. E.V.-R. and A.D.G.-C. designed the sensor and contributed to its simulation and the implementation of the sensor arrangement. L.E.C.-L. designed and fabricated parts and equipment used for the sensor arrangement implementation. All authors collaborated actively in the paper writing process

Conflicts of Interest

The authors declare no conflict of interest.

References

  1. Goody, R. Cross-Correlating Spectrometer. J. Opt. Soc. Am. 1968, 58, 900–908. [Google Scholar] [CrossRef]
  2. Johnston, S.F. Gas monitors employing infrared LEDs. Meas. Sci. Technol. 1992, 3, 191–195. [Google Scholar] [CrossRef]
  3. Dakin, J.P.; Edwards, H.O.; Weigl, B.H. Latest developments in gas sensing using correlation spectroscopy. Proc. SPIE 1995, 2508, 2–17. [Google Scholar]
  4. Shemshad, J.; Aminossadati, S.M.; Kizil, M.S. A review of developments in near infrared methane detection based on tunable diode laser. Sens. Actuators B 2012, 171–172, 77–92. [Google Scholar] [CrossRef]
  5. Fetzer, G.J.; Pittner, A.S.; Ryder, W.L.; Brown, D.A. Tunable diode laser absorption spectroscopy in coiled hollow optical waveguides. Appl. Opt. 2002, 41, 3613–3621. [Google Scholar] [CrossRef] [PubMed]
  6. Mihalcea, R.M.; Baer, D.S.; Hanson, R.K. Diode laser sensor for measurements of CO, CO2, and CH4 in combustion flows. Appl. Opt. 1997, 36, 8745–8752. [Google Scholar] [CrossRef] [PubMed]
  7. Eng, R.S.; Mantz, A.W. Tunable Diode Laser Spectroscopy of CO2 in the 10 to 15 μm Spectral Region-Lineshape and Q-Branch Head Absorption Profile. J. Mol. Spectrosc. 1979, 74, 331–344. [Google Scholar] [CrossRef]
  8. Reid, J.; Garside, B.K.; Shewchun, J.; El-Sherbiny, M.; Ballik, E.A. High sensitivity point monitoring of atmospheric gases employing tunable diode lasers. Appl. Opt. 1978, 17, 1806–1810. [Google Scholar] [CrossRef] [PubMed]
  9. Rosenmann, L.; Langlois, S.; Taine, J. Diode Laser Measurements of CO2 Hot Band Line Intensities at High Temperature near 4.3 mm. J. Mol. Spectrosc. 1993, 158, 263–269. [Google Scholar] [CrossRef]
  10. Weldon, V.; O’Gorman, J.; Phelan, P.; Hegarty, J.; Tanbun-Ek, T. H2S and CO2 gas sensing using DFB laser diodes emitting at 1.57 mm. Sens. Actuators B 1995, 29, 101–107. [Google Scholar] [CrossRef]
  11. Bremer, K.; Pal, A.; Yao, S.; Lewis, E.; Sen, R.; Sun, T.; Grattan, K.T.V. Sensitive detection of CO2 implementing tunable thulium-doped all-fiber laser. Appl. Opt. 2013, 52, 3957–3963. [Google Scholar] [CrossRef] [PubMed]
  12. Whitenett, G.; Stewart, G.; Yu, H.; Culshaw, B. Investigation of a tuneable mode-locked fiber laser for application to multipoint gas spectroscopy. J. Lightwave Technol. 2004, 22, 813–819. [Google Scholar] [CrossRef]
  13. Ball, G.A.; Morey, W.W. Continuously tunable single-mode erbium fiber laser. Opt. Lett. 1992, 17, 420–422. [Google Scholar] [CrossRef] [PubMed]
  14. Paschotta, R.; Nilsson, J.; Reekie, L.; Trooper, A.C.; Hanna, D.C. Single-frequency ytterbium-doped fiber laser stabilized by spatial hole burning. Opt. Lett. 1997, 22, 40–42. [Google Scholar] [CrossRef] [PubMed]
  15. Shen, L.; Ye, Q.; Cai, H.; Qu, R. Mode-hop-free electro-optically tuned external-cavity diode laser using volume Bragg grating and PLZT ceramic. Opt. Express 2011, 19, 17244–17249. [Google Scholar] [CrossRef] [PubMed]
  16. Marshall, J.; Stewart, G.; Whitenett, S. Design of a tunable L-band multi-wavelength laser system for application to gas spectroscopy. Meas. Sci. Technol. 2006, 17, 1023. [Google Scholar] [CrossRef]
  17. Wei, W.; Chang, J.; Huang, Q.; Wang, Q.; Liu, Y.; Qin, Z. Water vapor concentration measurements using TDALS with wavelength modulation spectroscopy at varying pressures. Sens. Rev. 2017, 37, 172–179. [Google Scholar] [CrossRef]
  18. Homobono-Soares, V.; Renan Leal de Morais, C.; Ataide de Lima, R.; Fontana, E.; Ferreira Martins-Filho, J. Contributions to the optimization of an optical sensor for acetylene and carbon monoxide. In Proceedings of the 2011 SBMO/IEEE MTT-S International Microwave and Optoelectronics Conference (IMOC 2011), Natal, Brazil, 29 October–1 November 2011; pp. 632–636. [Google Scholar]
  19. Austin, E.; van Brakel, A.; Petrovich, M.N.; Richardson, D.J. Fibre optical sensor for C2H2 gas using gas-filled photonic bandgap fibre reference cell. Sens. Actuators B 2009, 139, 30–34. [Google Scholar] [CrossRef]
  20. Ritari, T.; Tuominen, J.; Ludvigsen, H.; Petersen, J.C.; Sørensen, T.; Hansen, T.P.; Simonsen, H.R. Gas sensing using air-guiding photonic bandgap fibers. Opt. Express 2004, 12, 4080–4087. [Google Scholar] [CrossRef] [PubMed]
  21. Wynne, R.M.; Barabadi, B.; Creedon, K.J.; Ortega, A. Sub-Minute Response Time of a Hollow-Core Photonic Bandgap Fiber Gas Sensor. J. Lightwave Technol. 2009, 27, 1590–1596. [Google Scholar] [CrossRef]
  22. Yan, G.; Zhang, A.P.; Ma, G.; Wang, B.; Kim, B.; Im, J.; He, S.; Chung, Y. Fiber-Optic Acetylene Gas Sensor Based on Microstructured Optical Fiber Bragg Gratings. IEEE Photonics Technol. Lett. 2011, 23, 1588–1590. [Google Scholar] [CrossRef]
  23. Dakin, J.P.; Gunning, M.J.; Chambers, P.; Xin, Z.J. Detection of gases by correlation spectroscopy. Sens. Actuators B 2003, 90, 124–131. [Google Scholar] [CrossRef]
  24. Rothman, L.S.; Jacquemart, D.; Barbe, A.; Chris Benner, D.; Birk, M.; Brown, L.R.; Carleer, M.R.; Chackerian, J.C.; Chance, K.; Coudert, L.H.; et al. The HITRAN 2004 molecular spectroscopic database. J. Quant. Spectrosc. Radiat. Transf. 2005, 96, 139–204. [Google Scholar] [CrossRef]
  25. Gallegos-Arellano, E.; Vargas-Rodriguez, E.; Guzman-Chavez, A.D.; Cano-Contreras, M.; Cruz, J.L.; Raja-Ibrahim, R.K. Finely tunable laser based on a bulk silicon wafer for gas sensing applications. Laser Phys. Lett. 2016, 13, 065102. [Google Scholar] [CrossRef]
  26. Hoo, Y.L.; Liu, S.; Ho, H.L.; Jin, W. Fast Response Microstructured Optical Fiber Methane Sensor with Multiple Side-Openings. IEEE Photonics Technol. Lett. 2010, 22, 296–298. [Google Scholar] [CrossRef]
Figure 1. Block diagram of a hybrid C2H2 sensor design based on the Line Locked Tunable Laser Absorption Spectroscopy (LL-TLAS) and Non-Dispersive Sensors (NDS) correlation spectroscopy techniques.
Applsci 07 00958 g001
Figure 2. (a) Simulated laser emission profile and C2H2 transmission spectra considering a path length of 5 cm and different concentrations. The simulated laser spectrum was normalized to 1 for clarity purpose. (b) Simulated measurement and reference signals and their corresponding depth of modulation as a function of the C2H2 concentration.
Applsci 07 00958 g002
Figure 3. Depth ofmodulation as a function of concentration considering different cell path length values.
Applsci 07 00958 g003
Figure 4. Hybrid C2H2 sensor setup based on the LL-TLAS and NDS correlation spectroscopy techniques.
Applsci 07 00958 g004
Figure 5. (a) Simulated D M error due to wavelength instability and considering different C2H2 concentration; (b) Measured temperature variation of the Si wafer over the time and its induced laser wavelength error.
Applsci 07 00958 g005
Figure 6. (a) Measured and fitted spectral profiles of the laser line emission, normalized for clarity purposes. (b) Channel signals, as a function of time, showing the effect of changing the C2H2 concentration. (c) Calculated depth of modulation as a function of time showing the effect of changing the C2H2 concentration. (d) Measured and simulated depth of Modulation as a function of the C2H2 concentration.
Applsci 07 00958 g006
Figure 7. (a,c) Measured channel signals showing the effect of varying the light intensity. (b,d) calculated depth of modulation showing that it is unaffected by light intensity variations. For (a,b) the C2H2 concentration was 9% and for (c,d) it was 40%.
Applsci 07 00958 g007
Figure 8. (a) Depth of modulation as function of time and its standard deviation. (b) Depth modulation considering a high order low pass filter (LPF1) and a first order low pass filter (LPF2).
Applsci 07 00958 g008
Table 1. Sensor sensitivity for different concentration ranges.
Concentration (%)mn R 2 C σ (%) D M E ( C σ ) σ Sensitivity (ppm)
0–200.051740.025080.997190.5222.9 × 10 3 521
20–320.023870.564050.9999221.0903.2 × 10 3 1340
32–510.014360.872360.9999511.6103.1 × 10 3 2158
51–1000.005001.360720.9945641.6853.4 × 10 3 6800

