Which Method Detects Foot Strike in Rearfoot and Forefoot Runners Accurately when Using an Inertial Measurement Unit?


Department of Human Locomotion, Chemnitz University of Technology, Chemnitz 09126, Germany
*
Author to whom correspondence should be addressed.
Appl. Sci. 2017, 7(9), 959; https://doi.org/10.3390/app7090959
Submission received: 17 August 2017
/
Revised: 11 September 2017
/
Accepted: 15 September 2017
/
Published: 19 September 2017
(This article belongs to the Special Issue Wearable Computing and Machine Learning for Applications in Sports, Health, and Medical Engineering)
Abstract
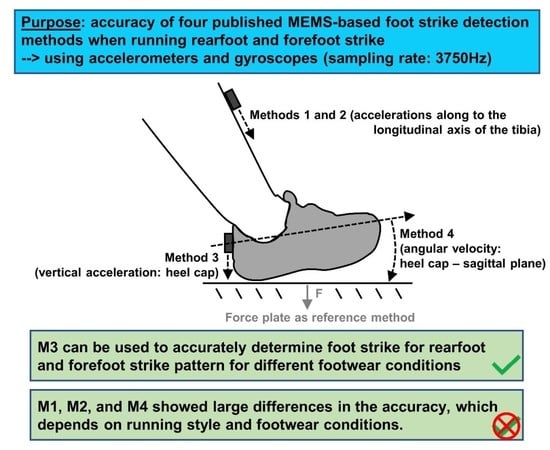
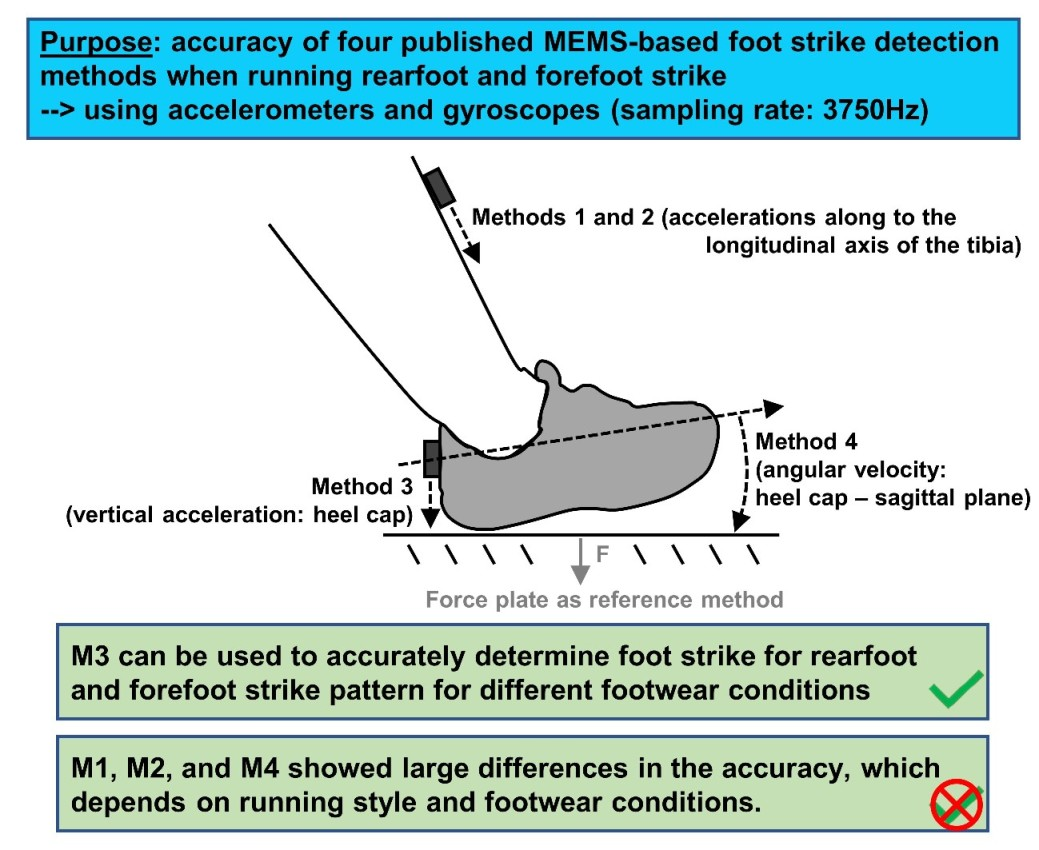
:Accelerometers and gyroscopes are used to detect foot strike (FS), i.e., the moment when the foot first touches the ground. However, it is unclear whether different conditions (footwear hardness or foot strike pattern) influence the accuracy and precision of different FS detection methods when using such micro-electromechanical sensors (MEMS). This study compared the accuracy of four published MEMS-based FS detection methods with each other and the gold standard (force plate) to establish the most accurate method with regard to different foot strike patterns and footwear conditions. Twenty-three recreational runners (12 rearfoot and 11 forefoot strikers) ran on a 15-m indoor track at their individual running speed in three footwear conditions (low to high hardness). MEMS and a force plate were sampled at a rate of 3750 Hz. Individual accuracy and precision of FS detection methods were found which were dependent on running styles and footwear conditions. Most of the methods were characterized by a delay which generally increased from rearfoot to forefoot strike pattern and from high to low midsole hardness. It can be concluded that only one of the four methods can accurately determine FS in a variety of conditions.
1. Introduction
Biomechanical investigations of running require accurate detection methods of foot strike (FS), i.e., the exact moment when the foot touches the ground. This is of great importance to determine the FS angle in continuous kinematic data stream signals of foot orientation in the sagittal plane. This was performed by Heidenfelder et al. [1], Hein and Grau [2], and Hollander et al. [3] when investigating the FS angle under various conditions (footwear conditions or barefoot vs. shod) in the laboratory. Furthermore, the accuracy of electromyographical (EMG) investigations (EMG onset and EMG peak value) of lower limb muscles is based on an accurately determining FS. Relative to FS, Guidetti et al. [4] found EMG peaks of 6.8 ± 2.8 ms for rectus femoris, 11.1 ± 5.3 ms for gastrocnemius, and 9.5 ± 4.7 ms for tibialis anterior muscles when running at 4.2 m/s. The short latency between FS and EMG peak emphasizes the importance of accurate and precise FS detection. Moreover, exact FS detection enhances data accuracy and consequently minimizes defective variability in running parameters, e.g., stride length and stride frequency, which have been investigated by various authors [3,5,6,7,8].
To detect FS, force plates are frequently used as the method of choice. However, force plates are often restricted to indoor use in specific gait laboratories and limited to a small number of consecutive gait cycles for each trial. In addition, force plate targeting of subjects results in slightly adjusting the natural running pattern in order to hit the force plate, which may distort accuracy of running data [9].
On the other hand, micro-electromechanical sensors (MEMS) can be an alternative for detecting the moment of FS when force plates are not available. These wearable motion sensors (e.g., gyroscopes and accelerometers) are easy to use, low-cost, and suitable for field measurements [10,11,12,13]. Furthermore, these sensors offer the advantages of collecting multiple consecutive gait cycles and eliminate the issue of targeting. Numerous authors have already used MEMS to detect FS in a variety of conditions [8,14,15,16,17,18,19,20]. Nevertheless, just one study was found which investigated the accuracy of MEMS for detecting FS during running by comparing those data to a synchronized force plate signal [21]. Those authors used a shank-mounted accelerometer, measuring accelerations along the longitudinal axis of the tibia in sixteen rearfoot runners (4.0 m/s). They found an average error of 1.68 ms (95% CI: −2.94 to 6.25 ms) and an absolute error of 5.46 ms (95% CI: 1.89 to 9.03 ms), respectively. Furthermore, Sabatini et al. [17] used a gyroscope signal (sagittal plane) to determine FS during walking (0.83 to 1.7 m/s). The accuracy of FS was compared to footswitches (small force sensors—Tekscan A201), which were placed under the calcaneus (heel) and the hallux (big toe), respectively. Authors found an average difference of −2 ms (95% CI: −16 to 12 ms). Further studies compared stride and stance duration during running by using inertial sensors, however they did not mention the accuracy for determining FS [19,22].
To the best of the authors’ knowledge, there are currently no studies which address whether published FS detection methods are able to accurately detect the initial ground contact for forefoot strike (FFS) pattern. In contrast to rearfoot strike (RFS) pattern, the FFS pattern is characterized by altered kinematics of the lower limbs, resulting in initial ground contact with the ball of the foot [23]. This running style is becoming more popular among runners due to presumed protection against impact-related injuries [23,24]. Consequently, this increases the necessity for more research on the accurate and precise detection of the moment when the foot touches the ground, related to, e.g., kinematics, muscle activity, and spatio-temporal parameters.
Therefore, the purpose of the present study was to examine whether four published FS detection methods can accurately define the time of initial ground contact for RFS and FFS running styles. A synchronized force plate was used as the reference. Moreover, this study aims to analyze the influence of various footwear material properties on the accuracy of the different FS detection methods. These results are required to determine whether differences in investigated parameters (e.g., foot strike angle, EMG onset, stride length) between footwear conditions are caused by errors in FS detection methods or by the investigated conditions themselves. It was hypothesized that all investigated and published FS detection methods are sufficient to accurately detect the RFS pattern (H1), and the FFS pattern (H2), independently from the footwear conditions.
2. Materials and Methods
2.1. Participants
Twelve recreational RFS runners (age: 24.8 ± 4.5 years; height: 176.0 ± 5.4 cm; weight: 72.3 ± 7.8 kg; running experience: 8.3 ± 5.9 years; training hours: 2.6 ± 2.1 h per week) and eleven recreational FFS runners (age: 26.3 ± 3.2 years; height: 177.0 ± 3.6 cm; weight: 74.5 ± 7.5 kg; running experience: 7.8 ± 5.0 years; training hours: 2.1 ± 1.1 h per week) participated in this study. All procedures were approved by the local ethics committee (V-103-17-HS-CM-Bodenkontakt-25082015). The participants were required to give written informed consent before participating in the study.
2.2. Testing Procedure
Participants wore three different running shoes during the tests, which were investigated in a randomized order. All shoes were provided by the laboratory in men’s UK size 8: PUMA Speed 100 (PU100); PUMA Speed 500 (PU500); PUMA Speed 1000 (PU1000). According to Mitschke et al. [13], after an individual warm-up and familiarization with the measurement setup, five repeated running trials were recorded on a 15-m indoor running track. The running speed was individual and self-selected, close to their personal standard training velocity: 3.26 ± 0.4 m/s (range: 2.8 to 3.9 m/s) for the RFS runners and 3.38 ± 0.4 m/s (range: 2.7 to 4.0 m/s) for the FFS runners. Velocities were monitored using two light barriers placed four meters apart. Trials were rated as successful when athletes ran within their individual velocity range and when FS was in the middle of the force plate.
2.3. Experimental Setup
A lightweight inertial measurement unit (ICM-20601, InvenSense, San Jose, CA, USA, mass 4 g), combining a tri-axial accelerometer (measurement range ±353 m/s/s) and a tri-axial gyroscope (measurement range ±4000 deg/s), was attached to the shaved skin at the medial aspect and mid-distance between the malleolus and the plateau of the runner’s right tibia [25]. An elastic strap was used to stabilize the sensor to prevent excessive movements due to its own weight. Additionally, the same sensor type was affixed to the heel cap of the right shoe. All sensors operated synchronously and data were sampled at 3750 Hz by a data logger, secured in a waist belt. The data logger and PC were connected via a 10-m cable. To confirm FS pattern of the runners, running was controlled visually using high-speed video (Exilim EX-F1, Casio, Tokyo, Japan, 300 Hz). Ground reaction force measurements were simultaneously recorded using a force plate (9287 BA, 0.6 × 0.9 m, 3750 Hz, Kistler, Winterthur, Switzerland), which was synchronised with the inertial sensors. Data post-processing was done using MATLAB R2016b (MathWorksTM, Natick, MA, USA).
2.4. Foot Strike Detection Methods
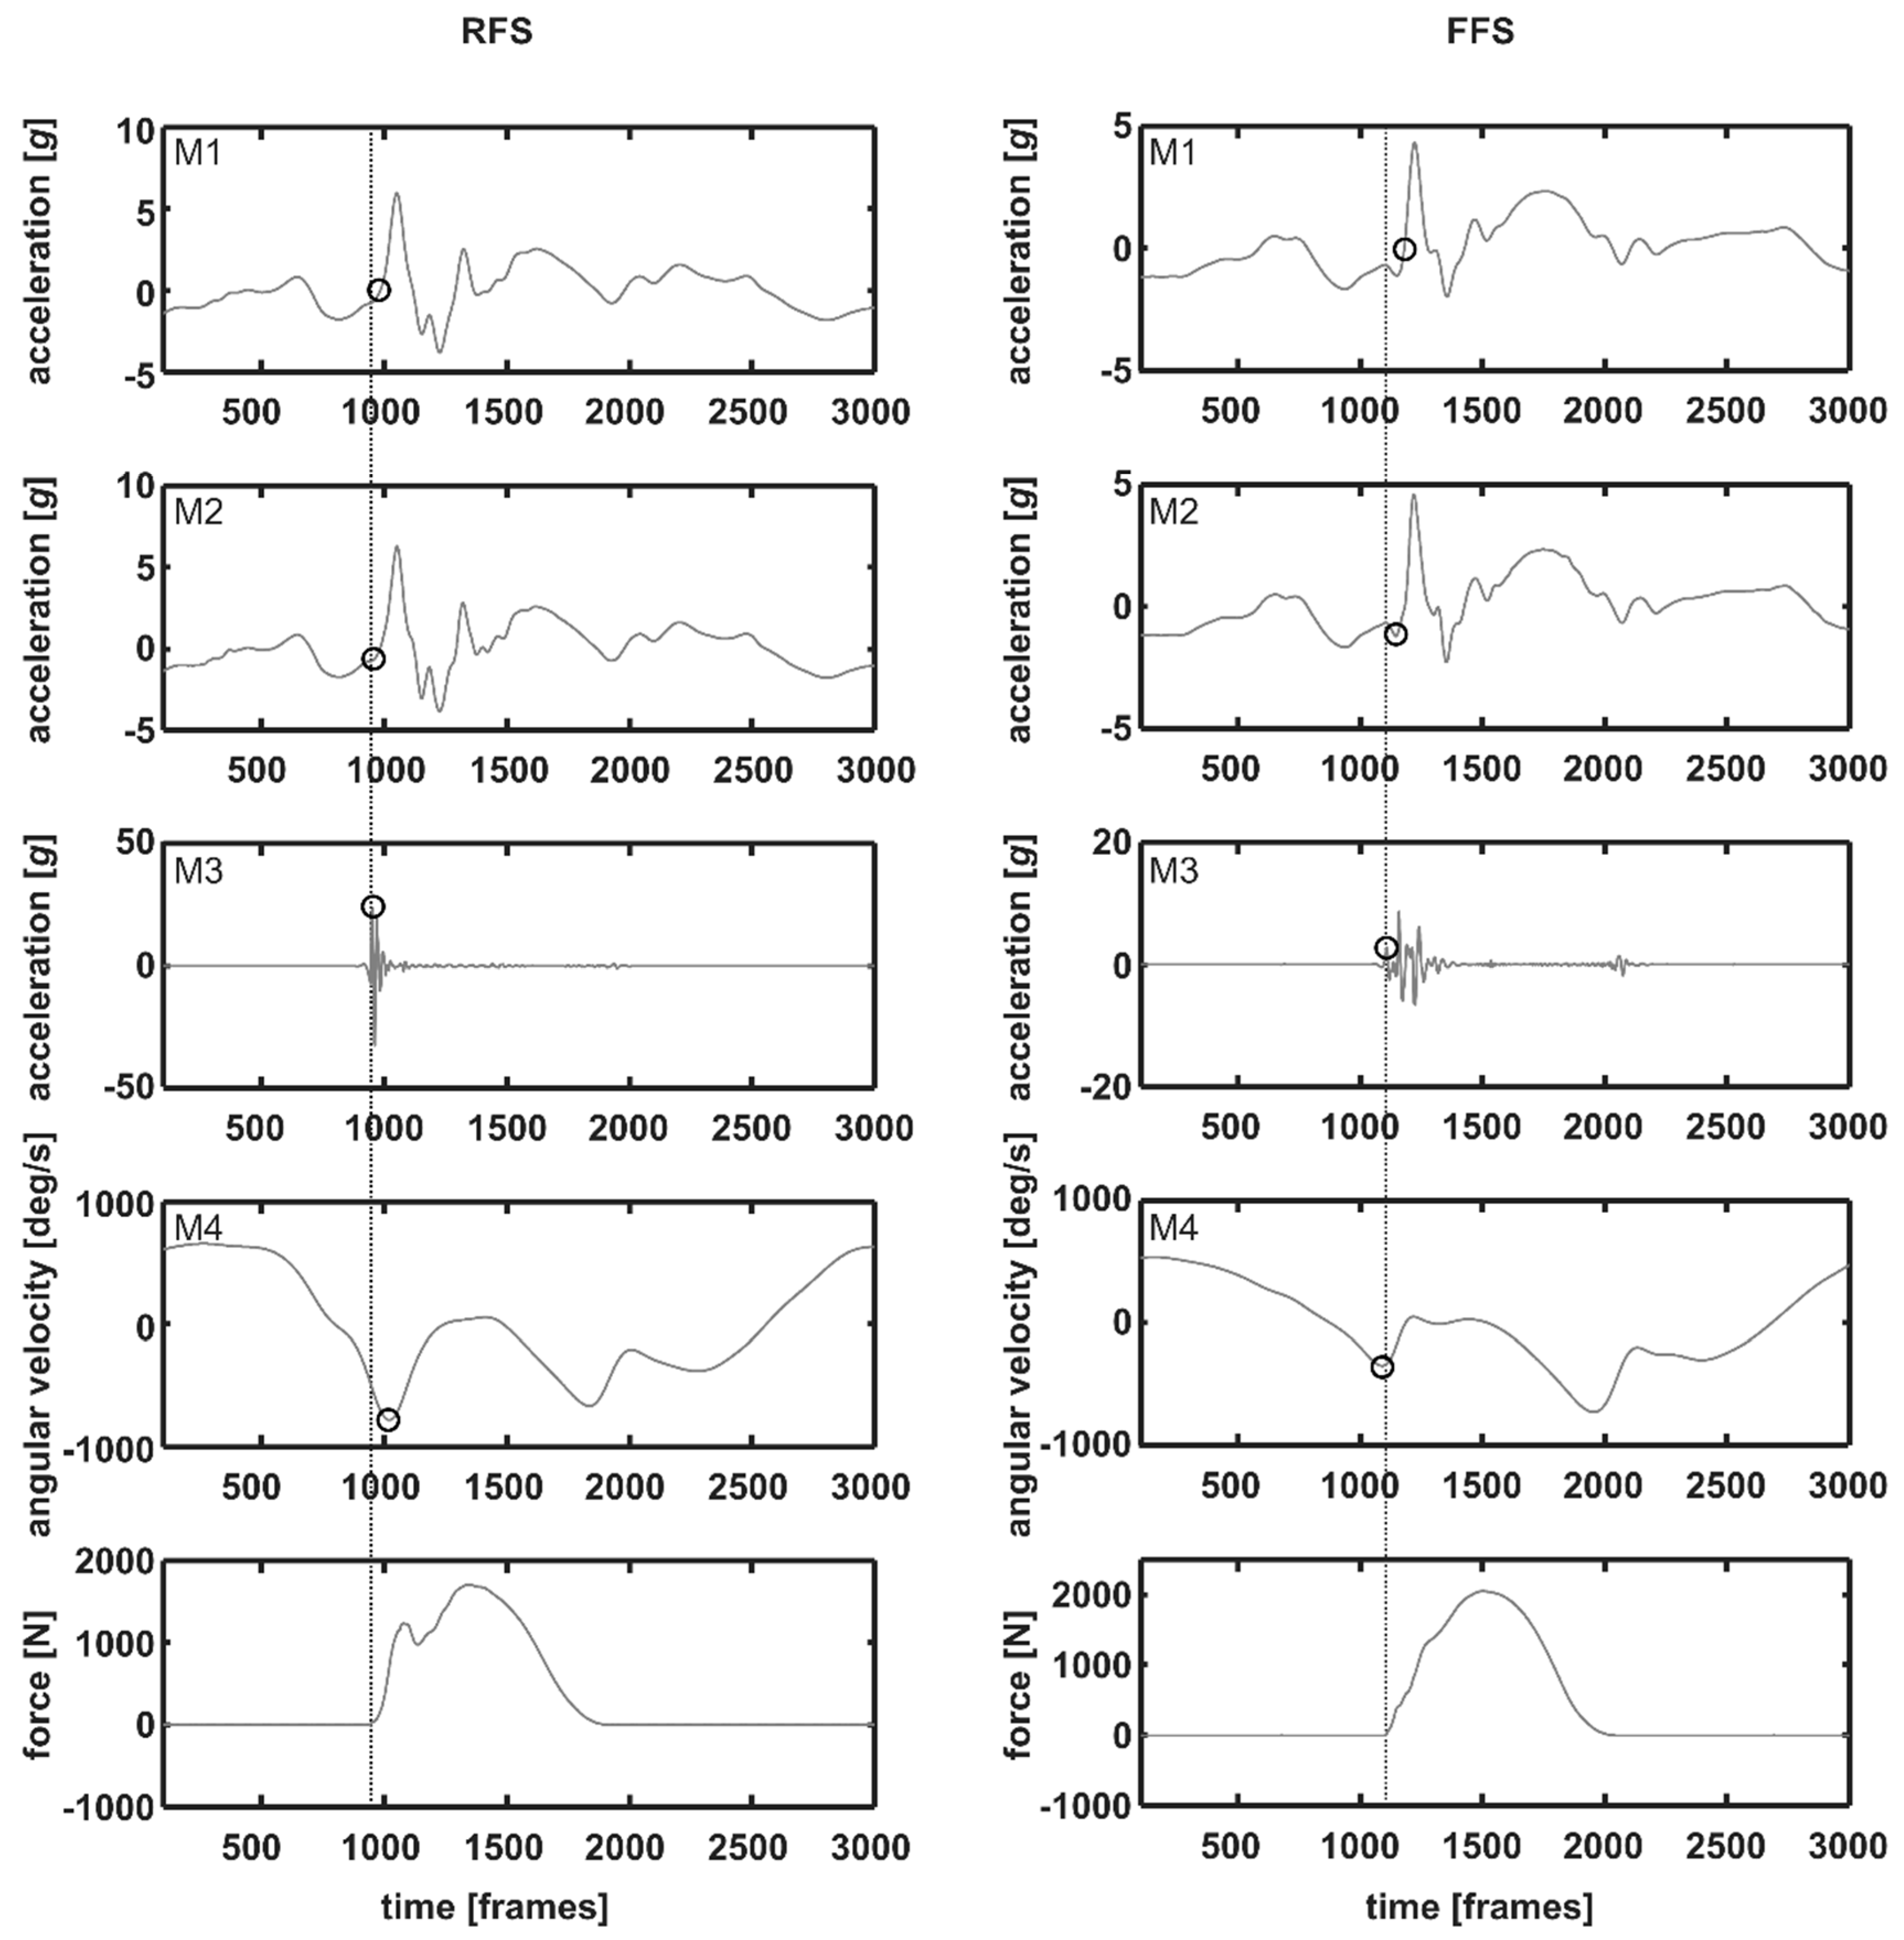
To determine FS, a total of four different methods were compared. Method 1 (M1) was conducted according to Sinclair et al. [21]. The tibial acceleration signal, acceleration along the longitudinal axis of the tibia, was smoothed using a 60 Hz low pass zero-lag filter (4th order). FS was identified when crossing a threshold of zero g, before peak tibial acceleration occurred (by a maximum 20 ms before peak tibial acceleration, to prevent false detection, Figure 1). Method 2 (M2) was conducted according to Mercer et al. [14]. The tibial acceleration signal along the longitudinal axis of the tibia was also used to detect FS. The minimum acceleration before the peak tibial acceleration was declared as FS (Figure 1). Method 3 (M3) was conducted according to Maiwald et al. [15]. The accelerometer signal of the heel sensor, the vertical axis, was 80 Hz zero-lag high pass filtered (third order) and the first peak in the filtered signal was defined as FS (Figure 1). Method 4 (M4) was based on Sabatini et al. [17]. The gyroscope signal of the heel sensor was 15 Hz zero-lag low pass filtered (second order). FS was determined as the time when the angular velocity reached the minimum value for the first time in the gait cycle (Figure 1).
2.5. Footwear Conditions
Differences between midsole materials for the rearfoot and forefoot areas for all three shoes were quantified using a servo-hydraulic testing device (HC10; Zwick GmbH and Co. KG; Ulm, Germany) as described in Schwanitz and Odenwald [27] and Schwanitz et al. [28]. Each shoe was tested mechanically ten times. The stiffness between 1000 and 1500 N for the rearfoot and forefoot areas were analysed. Within the three footwear conditions, the footwear with high mechanical stiffness was defined as relatively hard, and footwear with lower mechanical stiffness as relatively soft.
2.6. Statistical Analyses
The means and standard deviations (mean ± SD) were calculated to compare footwear stiffness. Given that parameters were normally distributed, a one-way analysis of variance (ANOVA) followed by Bonferroni post-hoc tests were used to determine whether there are differences between mechanical footwear characteristics.
For the comparison of MEMS-based FS detection methods (M1 to M4) and force plate FS detection, accuracy (mean) and precision (standard deviation: SD), 95% confidence intervals (95% CI), and the repeatability coefficient (RC) were calculated. According to Oriwol et al. [29], RC was calculated between the five trials for each subject to assess the variability of the detection method between the five running trials. Consequently, RCs were averaged over all footwear conditions and running patterns, respectively.
For the comparison of FS detection methods and the reference, a positive mean indicates that the MEMS-based FS detection method detected FS before detection by the force plate. Similarly, a negative mean indicates that the MEMS-based FS detection method defined FS after detection by the force plate. Since parameters were not normally distributed; the Friedman-Test, followed by paired Wilcoxon tests with Bonferroni adjustment, was used to determine differences between the accuracy of MEMS-based detection methods. Effect size (Cohen’s d) was calculated to quantify the magnitude of differences between shoe characteristics and to quantify the magnitude of differences between FS detection methods. The coefficients were interpreted as trivial effect (d < 0.2), small effect (d < 0.5), medium effect (d < 0.8), and large effect (d ≥ 0.8) [30]. The level of significance was set to an alpha of 0.05 for all statistical analyses.
3. Results
3.1. Footwear Characteristics
ANOVA revealed that footwear type influenced rearfoot and forefoot stiffness. All pair-wise comparisons reached statistical significance (p < 0.001), and showed large effects. The lowest rearfoot stiffness was found for PU1000 (143.3 ± 0.1 N/mm) and the highest was found for PU100 (302.9 ± 0.1 N/mm) (Table 1). Furthermore, the lowest forefoot stiffness was also measured for PU1000 (279.9 ± 0.0 N/mm) and the greatest forefoot stiffness was found for PU100 (403.0 ± 0.0 N/mm).
3.2. Foot Strike Detection Methods
Differences between FS detection methods (M1 to M4) and the reference method, force plate FS detection, are shown in Table 2, Table 3, Table 4 and Table 5. M1 was characterized by a great offset reaching from −11.47 ± 4.21 ms (PU500-RFS) to −15.28 ± 3.94 ms (PU100-FFS). Using M1, FS was detected later than with the force plate (vertical ground reaction force >10 N) for all footwear conditions, and for both foot strike patterns. M2 showed a high accuracy for PU100 (−1.42 ± 13.53 ms) and PU500 (1.08 ± 10.65 ms) when running with RFS pattern. However, the FS detection method was characterized by a great variability (95% CI: −4.53 to 2.35 ms and −1.67 to 3.84 ms) and a low repeatability (RC: 37.68 and 27.30) for both of these footwear conditions. Additionally, for PU1000 (RFS) and all footwear conditions when running FFS pattern, low accuracy, high variability, and high RCs were found for M2. The greatest accuracy (lowest mean differences), compared to the reference, was found for M3 for RFS and FFS when running in all footwear conditions. Interestingly, M3 detected the FS on average before the force plate for the RFS pattern (between 0.48 ± 0.26 ms and 0.70 ± 0.26 ms) and later than the force plate for the FFS pattern (between −0.95 ± 2.05 ms and −2.37 ± 1.93 ms). In comparison, a contrary trend was found for M4. Negative differences were observed for the RFS pattern and positive differences were observed for the FFS pattern.
Differences between M3 and the reference method were significantly lower (large effects of d ≥ 0.8) than for the three other FS detection methods regarding all footwear conditions and both running styles, except M2 for PU100—RFS (trivial effect: d = 0.19) and PU500—RFS (non-significant). Missing effects between M2 and M3 could be the result of the high variability (95% CI) and low precision (SD) of M2 for the respective conditions. Furthermore, M3 revealed the lowest RC for the RFS and FFS pattern for all footwear conditions.
4. Discussion
The aim of the present study was to examine whether four published foot strike detection methods—using wearable sensors—can accurately define the time when the foot touches the ground initially for distinctive running styles and different footwear conditions. A synchronized force plate was used as the reference. To determine FS as accurately as possible, a fast sampling rate of 3750 Hz was used for all methods. Inaccurate determination of FS can produce subsequent errors in investigated running and gait parameters (e.g., kinematics, muscle activity, and spatio-temporal parameters). We found that the analyzed FS detection methods showed large differences in accuracy and precision, which depends on running style and footwear condition.
Test method M1 was conducted according to previously published procedures by using an accelerometer mounted to the tibia [21]. Authors also compared the accuracy of their FS detection algorithm with the vertical component of the ground reaction forces. They found differences in mean of 1.68 ms (95% CI: −2.94 to 6.25 ms) when investigating rearfoot runners. This difference is distinctly lower than what we found for the RFS pattern. The threshold they used to detect FS with the force plate was 20 N, whereby in the present study the threshold was set to 10 N. This threshold and the high sampling rate in our procedure could potentially explain the greater differences we found between M1 and the force plate in contrast to the results of Sinclair et al. [21]. However, the different force plate thresholds do not explain all differences, due to the high force rising rates at the beginning of ground contact. It seems that there is a continuous offset in the RFS pattern, which is slightly higher in the FFS pattern (Table 2, Table 3 and Table 4). As a result of various influencing factors (sensor wobbling, shoe midsole deformation, heel fat pad cushioning, and foot pronation), accelerations were attenuated and captured with a delay. Interestingly, we found that different footwear hardness does not seem to influence the accuracy of FS detection (range between shoes—RFS: 1.8 ms; FFS: 0.4 ms), whereas the running style influences accuracy of FS detection slightly (within differences between RFS and FFS—PU100: 2.0 ms; PU500: 3.4 ms; PU1000: 2.4 ms). Due to the altered kinematics of the lower limbs for the FFS pattern, accelerations (crossing a threshold of zero g before peak tibial acceleration occurred) were measured with a greater delay, which also increased the difference to the reference method. Finally, it can be stated for M1 that when only one sensor (placed at the tibia) is available to detect FS, it can be detected with a low error of ±4 ms under various conditions when subtracting 14 ms (mean of our found differences) from the detected FS.
For M2, tibial acceleration along the longitudinal axis of the tibia was also used to detect FS [14]. Thereby, minimum acceleration before the peak tibial acceleration defined FS. We found that FS detection with this method is characterized by a low precision, shown by the great SD and low repeatability (RC). Despite this, great accuracy of mean <−1.42 ms was found for RFS when wearing the harder shoes PU100 and PU500. However, for PU1000 (RFS) and all footwear conditions when running with the FFS pattern, substantial differences up to −15.84 ms were observed between M2 and the reference method. As discussed for M1, accelerations measured at the tibia revealed delayed acceleration patterns, which resulted in the negative values for the differences between M2 and the reference method. Interestingly, the shoe with the lowest stiffness in the rearfoot area (PU1000) showed the lowest accuracy (−10.49 ± 10.09 ms) for the RFS pattern. For the FFS pattern, the delay due to altered lower limb kinematics was more prominent (>14.65 ms) than the influence of the footwear conditions (range between shoes: 1.2 ms). Additionally, in a few trials, the tibial acceleration data of forefoot runners showed a double peak. This was especially true in runners who touched the ground with the ball of the foot first, but then touched the ground with the heel during mid-stance phase. The second measured peak could influence the automatic detection of FS, leading to FS detection errors when the minimum acceleration before the false peak tibial acceleration was used.
M3 was conducted according to Maiwald et al. [15], by using the vertical accelerometer axis of a heel mounted inertial measurement unit. This method revealed a great accuracy and the lowest difference compared to the reference method for RFS and FFS when running in all footwear conditions. Due to the wobbling-free attachment to the heel cap of the shoe, impact accelerations can be measured without delay. For the RFS pattern, no influence of the shoe hardness in the rearfoot area on accuracy of FS detection could be found. However, a trend was found for the FFS pattern: the footwear with the hardest midsole in the forefoot area (PU100) showed the highest accuracy between the FS detection method and reference method (−0.95 ± 2.05 ms), whereas the footwear with the softest midsole in this area (PU1000) showed the greatest delay (−2.37 ± 1.93 ms). It seems that the impact attenuation is related to midsole hardness and—therefore—influences the accuracy of this FS detection method slightly during forefoot running. In contrast to this, precision and repeatability were not influenced by forefoot hardness of the shoes for the FFS pattern.
M4 was based on previously published findings by Sabatini et al. [17]. In contrast to M1, M2, and M3, gyroscope data (measured angular velocity in the sagittal plane) were used instead of the accelerometer signal to detect FS. Our results revealed a negative detection error between −16.68 ± 2.73 ms (PU500) and −20.59 ± 3.28 ms (PU1000) for the RFS pattern and a positive detection error between 5.13 ± 3.01 ms (PU100) and 8.43 ± 4.28 ms (PU1000) for the FFS pattern. It shows that the accuracy of this method is distinctly higher for the FFS pattern than for the RFS pattern. However, accuracy of M4 was significantly lower than accuracy of M3 for all footwear conditions and both foot strike patterns. Sabatini et al. [17] compared their FS detection algorithm to footswitches and found a distinctly lower difference on average of −2 ms (95% CI: −16 to 12 ms). They investigated walking in a range between 0.83 and 1.7 m/s. Due to the altered lower limb kinematics when changing locomotion speed from walking to running, the angular velocity was modified slightly and a phase shift was observed. It seems that the signal characteristics which were used to define FS (angular velocity reaching the minimum value for the first time in the gait cycle; Figure 1) changed considerably. Additional phase shift was found when comparing the RFS and FFS pattern, which led to the opposed differences to the reference method between both running styles. Furthermore, accuracy of M4 was influenced by the midsole hardness in the forefoot area, when running with the FFS pattern. As already found for M3, the footwear with the hardest midsole in the forefoot area (PU100) revealed the highest accuracy between the FS detection method and reference method (5.13 ± 3.01 ms), and the footwear with the softest midsole (PU1000) showed the greatest delay (8.43 ± 4.28 ms). Presumably, due to different midsole hardness, foot strike angle varied during forefoot running and therefore, angular velocity phases and magnitudes were also influenced. However, foot strike angle was not monitored and cannot be further investigated. However, it can be stated that besides acceleration signals measured at the heel cap, gyroscope signals were also influenced by footwear hardness FFS running patterns.
Four published FS detection methods were tested to determine whether they can accurately detect FS for distinctive running styles and different footwear conditions when running at a self-selected velocity. Due to the low accuracy and precision of some FS detection methods, hypotheses H1 (RFS pattern) and H2 (FFS pattern) have to be rejected.
When applying the current study’s results to the elecromyographical investigations in the literature, EMG peaks relative to FS of 6.8 ± 2.8 ms for the rectus femoris, and 9.5 ± 4.7 ms for the tibialis anterior muscles were found [4]. Based on the current study’s results, it can be stated that M3 is the only method which can be used to define these EMG peaks accurately relative to FS. When using the other methods (M1, M2, or M4) to detect FS, the relative moment of EMG peaks will not be detected accurately, which can result in errors when comparing different conditions (e.g., footwear conditions). Furthermore, considering muscle activity within a defined time range relative to FS, incorrect FS detection can result in misinterpreted muscle activity relative to the gait cycle: too early—no activity during swing phase; or too late—muscle activity during mid-stance.
A limitation of the current study is that only subjects’ individual running velocity was investigated. Further studies should also examine whether slower and faster velocities influence accuracy and precision of the FS detection algorithms.
In conclusion, these results are important when investigating running parameters which are dependent on an exact detection of FS. Individual accuracy and precision of FS detection methods were found, which are dependent on running styles and footwear conditions. Therefore, it can be concluded that M3 can be used to determine FS in a variety of conditions, accurately (e.g., to compare the influence of footwear conditions on muscle activity, foot strike angle and stride duration in prolonged field runs). When investigating running parameters which are related to FS detection algorithms M1, M2, and M4, the results should be considered carefully.
Acknowledgments
The authors would like to thank Lisa Peterson for proofreading the paper as a native speaker. This research was supported by Puma® Inc., Germany. The publication costs of this article were funded by the German Research Foundation/DFG and the Technische Universität Chemnitz, Chemnitz, Germany, through the funding program Open Access Publishing.
Author Contributions
Christian Mitschke and Thomas L. Milani conceived and designed the experiments; Christian Mitschke performed the experiments; Christian Mitschke, Tobias Heß and Thomas L. Milani analyzed the data; Thomas L. Milani contributed reagents/materials/analysis tools; Christian Mitschke, Tobias Heß and Thomas L. Milani wrote the paper.
Conflicts of Interest
The authors declare no conflicts of interest.
References
- Heidenfelder, J.; Sterzing, T.; Bullmann, M.; Milani, T.L. Heel strike angle and foot angular velocity in the sagittal plane during running in different shoe conditions. J. Foot Ankle Res. 2008, 1, O16. [Google Scholar] [CrossRef]
- Hein, T.; Grau, S. Can minimal running shoes imitate barefoot heel-toe running patterns? Acomparison of lower leg kinematics. J. Sport Health Sci. 2014, 3, 67–73. [Google Scholar] [CrossRef]
- Hollander, K.; Argubi-wollesen, A.; Reer, R.; Zech, A. Comparison of Minimalist Footwear Strategies for Simulating Barefoot Running : A Randomized Crossover Study. PLoS ONE 2015, 10, 1–11. [Google Scholar] [CrossRef] [PubMed]
- Guidetti, L.; Rivellini, G.; Figura, F. EMG patterns during running: Intra-and inter-individual variability. J. Electromyogr. Kinesiol. 1996, 6, 37–48. [Google Scholar] [CrossRef]
- Meardon, S.A.; Hamill, J.; Derrick, T.R. Running injury and stride time variability over a prolonged run. Gait Posture 2011, 33, 36–40. [Google Scholar] [CrossRef] [PubMed]
- Riley, P.O.; Dicharry, J.; Franz, J.; Croce, U.D.; Wilder, R.P.; Kerrigan, D.C. A kinematics and kinetic comparison of overground and treadmill running. Med. Sci. Sports Exerc. 2008, 40, 1093–1100. [Google Scholar] [CrossRef] [PubMed]
- Bonacci, J.; Saunders, P.U.; Hicks, A.; Rantalainen, T.; Vicenzino, B.G.T.; Spratford, W. Running in a minimalist and lightweight shoe is not the same as running barefoot: A biomechanical study. Br. J. Sports Med. 2013, 47, 387–392. [Google Scholar] [CrossRef] [PubMed]
- Reenalda, J.; Maartens, E.; Homan, L.; Buurke, J.H. (Jaap) Continuous three dimensional analysis of running mechanics during a marathon by means of inertial magnetic measurement units to objectify changes in running mechanics. J. Biomech. 2016, 49, 3362–3367. [Google Scholar] [CrossRef] [PubMed]
- Challis, J.H. The Variability in Running Gait Caused by Force Plate Targeting. J. Appl. Biomech. 2001, 17, 77–83. [Google Scholar] [CrossRef]
- Shih, Y.; Ho, C.-S.; Shiang, T.-Y. Measuring kinematic changes of the foot using a gyro sensor during intense running. J. Sports Sci. 2014, 32, 550–566. [Google Scholar] [CrossRef] [PubMed]
- Liu, T.; Inoue, Y.; Shibata, K. Development of a wearable sensor system for quantitative gait analysis. Measurement 2009, 42, 978–988. [Google Scholar] [CrossRef]
- Mayagoitia, R.E.; Nene, A.V.; Veltink, P.H. Accelerometer and rate gyroscope measurement of kinematics: An inexpensive alternative to optical motion analysis systems. J. Biomech. 2002, 35, 537–542. [Google Scholar] [CrossRef]
- Mitschke, C.; Öhmichen, M.; Milani, T.L. A Single Gyroscope Can Be Used to Accurately Determine Peak Eversion Velocity during Locomotion at Different Speeds and in Various Shoes. Appl. Sci. 2017, 7, 659. [Google Scholar] [CrossRef]
- Mercer, J.A.; Bates, B.T.; Dufek, J.S.; Hreljac, A. Characteristics of shock attenuation during fatigued running. J. Sport. Sci. 2003, 21, 911–919. [Google Scholar] [CrossRef]
- Maiwald, C.; Dannemann, A.; Gaudel, J.; Oriwol, D. A simple method to detect stride intervals in continuous acceleration and gyroscope data recorded during treadmill running. Footwear Sci. 2015, 7, 143–144. [Google Scholar] [CrossRef]
- Brauner, T.; Oriwol, D.; Sterzing, T.; Milani, T.L. A single gyrometer inside an instrumented running shoe allows mobile determination of gait cycle and pronation velocity during outdoor running. Footwear Sci. 2009, 1, 25–26. [Google Scholar] [CrossRef]
- Sabatini, A.M.; Martelloni, C.; Scapellato, S.; Cavallo, F. Assessment of walking features from foot inertial sensing. IEEE Trans. Biomed. Eng. 2005, 52, 486–494. [Google Scholar] [CrossRef] [Green Version]
- Giandolini, M.; Poupard, T.; Gimenez, P.; Horvais, N.; Millet, G.Y.; Morin, J.B.; Samozino, P. A simple field method to identify foot strike pattern during running. J. Biomech. 2014, 47, 1588–1593. [Google Scholar] [CrossRef]
- Lee, J.B.; Mellifont, R.B.; Burkett, B.J. The use of a single inertial sensor to identify stride, step, and stance durations of running gait. J. Sci. Med. Sport 2010, 13, 270–273. [Google Scholar] [CrossRef]
- Strohrmann, C.; Harms, H.; Kappeler-Setz, C.; Tröster, G. Monitoring Kinematic Changes With Fatigue in Running Using Body-Worn Sensors. IEEE Trans. Inf. Technol. Biomed. 2012, 16, 983–990. [Google Scholar] [CrossRef]
- Sinclair, J.; Hobbs, S.J.; Protheroe, L.; Edmundson, C.J.; Greenhalgh, A. Determination of gait events using an externally mounted shank accelerometer. J. Appl. Biomech. 2013, 29, 118–122. [Google Scholar] [CrossRef] [PubMed]
- Norris, M.; Kenny, I.C.; Anderson, R. Comparison of accelerometry stride time calculation methods. J. Biomech. 2016, 49, 3031–3034. [Google Scholar] [CrossRef] [PubMed]
- Lieberman, D.E.; Venkadesan, M.; Werbel, W.A.; Daoud, A.I.; D’Andrea, S.; Davis, I.S.; Mang’eni, R.O.; Pitsiladis, Y. Foot strike patterns and collision forces in habitually barefoot versus shod runners. Nature 2010, 463, 531–535. [Google Scholar] [CrossRef] [PubMed]
- Williams, D.S.; McClay, I.S.; Manal, K.T. Lower extremity mechanics in runners with a converted forefoot strike pattern. J. Appl. Biomech. 2000, 16, 210–218. [Google Scholar] [CrossRef]
- Milani, T.L.; Hennig, E.M.; Lafortune, M.A. Perceptual and biomechanical variables for running in identical shoe constructions with varying midsole hardness. Clin. Biomech. 1997, 12, 294–300. [Google Scholar] [CrossRef]
- Laughton, C.A.; McClay Davis, I.; Hamill, J. Effect of strike pattern and orthotic intervention on tibial shock during running. J. Appl. Biomech. 2003, 19, 153–168. [Google Scholar] [CrossRef]
- Schwanitz, S.; Odenwald, S. Long-term cushioning properties of running shoes. Eng. Sport 7 2008, 2, 95–100. [Google Scholar] [CrossRef]
- Schwanitz, S.; Möser, S.; Odenwald, S. Comparison of test methods to quantify shock attenuating properties of athletic footwear. Procedia Eng. 2010, 2, 2805–2810. [Google Scholar] [CrossRef]
- Oriwol, D.; Sterzing, T.; Milani, T.L. The position of medial dual density midsole elements in running shoes does not influence biomechanical variables. Footwear Sci. 2011, 3, 107–116. [Google Scholar] [CrossRef]
- Cohen, J. Quantitative Methods in Psychology. Psychol. Bull. 1992, 112, 155–159. [Google Scholar] [CrossRef] [PubMed]
Figure 1.
Foot strike detection methods M1 to M4 (O) and reference method (vertical component of ground reaction forces >20 N is represented by dotted line) for rearfoot strike pattern (RFS) and forefoot strike pattern (FFS), for one representative trial (sampling rate 3750 Hz).
Figure 1.
Foot strike detection methods M1 to M4 (O) and reference method (vertical component of ground reaction forces >20 N is represented by dotted line) for rearfoot strike pattern (RFS) and forefoot strike pattern (FFS), for one representative trial (sampling rate 3750 Hz).


Table 1.
Group mean ± standard deviation (SD) for mechanical testing of the three footwear conditions (PUMA Speed 100 (PU100); PUMA Speed 500 (PU500); PUMA Speed 1000 (PU1000)) for rearfoot and forefoot stiffness; statistical significance (p < 0.05), and large effects (d ≥ 0.8) were found between all footwear conditions for both foot areas.
| Footwear Condition | Rearfoot Stiffness (N/mm) | Forefoot Stiffness (N/mm) | ||
|---|---|---|---|---|
| Mean | SD | Mean | SD | |
| PU100 | 302.9 | 0.1 | 403.0 | 0.0 |
| PU500 | 264.3 | 0.1 | 324.0 | 0.0 |
| PU1000 | 143.3 | 0.1 | 279.9 | 0.0 |
Table 2.
Accuracy (mean) ± precision (standard deviation: SD), 95% confidence intervals (95% CI), and repeatability coefficient (RC) of foot strike detection methods (M1 to M4) for PUMA Speed 100 (PU100) and rearfoot (RFS) and forefoot strike (FFS) pattern.
Table 2.
Accuracy (mean) ± precision (standard deviation: SD), 95% confidence intervals (95% CI), and repeatability coefficient (RC) of foot strike detection methods (M1 to M4) for PUMA Speed 100 (PU100) and rearfoot (RFS) and forefoot strike (FFS) pattern.
| PU100 (ms) | RFS | FFS | ||||||
|---|---|---|---|---|---|---|---|---|
| M1 | M2 | M3 | M4 | M1 | M2 | M3 | M4 | |
| mean | −13.28 | −1.42 | 0.70 | −19.27 | −15.28 | −15.84 | −0.95 | 5.13 |
| SD | 3.97 | 13.53 | 0.26 | 3.91 | 3.94 | 10.29 | 2.05 | 3.01 |
| 95% CI | −12.25 | 2.35 | 0.77 | −18.26 | −14.21 | −13.06 | −0.39 | 5.94 |
| −14.31 | −4.53 | 0.63 | −20.28 | −16.34 | −18.63 | −1.50 | 4.32 | |
| RC | 10.90 | 37.68 | 1.01 | 9.34 | 7.54 | 23.10 | 5.60 | 9.87 |
Table 3.
Accuracy (mean) ± precision (standard deviation: SD), 95% confidence intervals (95% CI), and repeatability coefficient (RC) of foot strike detection methods (M1 to M4) for PUMA Speed 500 (PU500) and rearfoot (RFS) and forefoot strike (FFS) pattern.
Table 3.
Accuracy (mean) ± precision (standard deviation: SD), 95% confidence intervals (95% CI), and repeatability coefficient (RC) of foot strike detection methods (M1 to M4) for PUMA Speed 500 (PU500) and rearfoot (RFS) and forefoot strike (FFS) pattern.
| PU500 (ms) | RFS | FFS | ||||||
|---|---|---|---|---|---|---|---|---|
| M1 | M2 | M3 | M4 | M1 | M2 | M3 | M4 | |
| mean | −11.47 | 1.08 | 0.54 | −16.68 | −14.90 | −14.65 | −1.46 | 7.42 |
| SD | 4.21 | 10.65 | 0.28 | 2.73 | 4.18 | 9.43 | 2.23 | 3.74 |
| 95% CI | −10.38 | 3.84 | 0.61 | −15.98 | −13.77 | −12.10 | −0.86 | 8.43 |
| −12.56 | −1.67 | 0.46 | −17.39 | −16.04 | −17.20 | −2.07 | 6.41 | |
| RC | 10.34 | 27.30 | 1.16 | 7.37 | 8.76 | 30.69 | 8.60 | 14.13 |
Table 4.
Accuracy (mean) ± precision (standard deviation: SD), 95% confidence intervals (95% CI), and repeatability coefficient (RC) of foot strike detection methods (M1 to M4) for PUMA Speed 1000 (PU1000) and rearfoot (RFS) and forefoot strike (FFS) pattern.
Table 4.
Accuracy (mean) ± precision (standard deviation: SD), 95% confidence intervals (95% CI), and repeatability coefficient (RC) of foot strike detection methods (M1 to M4) for PUMA Speed 1000 (PU1000) and rearfoot (RFS) and forefoot strike (FFS) pattern.
| PU1000 (ms) | RFS | FFS | ||||||
|---|---|---|---|---|---|---|---|---|
| M1 | M2 | M3 | M4 | M1 | M2 | M3 | M4 | |
| mean | −12.49 | −10.49 | 0.48 | −20.59 | −14.84 | −15.81 | −2.37 | 8.43 |
| SD | 5.58 | 10.09 | 0.26 | 3.28 | 4.36 | 14.48 | 1.93 | 4.28 |
| 95% CI | −11.05 | −7.88 | 0.54 | −19.74 | −13.66 | −11.89 | −1.85 | 9.58 |
| −13.94 | −13.09 | 0.41 | −21.44 | −16.02 | −19.72 | −2.89 | 7.27 | |
| RC | 19.73 | 29.16 | 1.23 | 7.79 | 9.00 | 41.36 | 6.52 | 11.50 |
Table 5.
p-values of the pair-wise Wilcoxon test; significant differences (p < 0.05) between foot strike detection methods M1 to M4 were marked with *; large effects (d ≥ 0.8) were found for all significant differences, except comparison M2 vs. M3 for PU100—RFS (trivial effect d = 0.19).
Table 5.
p-values of the pair-wise Wilcoxon test; significant differences (p < 0.05) between foot strike detection methods M1 to M4 were marked with *; large effects (d ≥ 0.8) were found for all significant differences, except comparison M2 vs. M3 for PU100—RFS (trivial effect d = 0.19).
| PU100 | PU500 | PU1000 | ||||
|---|---|---|---|---|---|---|
| RFS | FFS | RFS | FFS | RFS | FFS | |
| M1 vs. M2 | <0.001 * | 0.963 | <0.001 * | 1 | 1 | 1 |
| M1 vs. M3 | <0.001 * | <0.001 * | <0.001 * | <0.001 * | <0.001 * | <0.001 * |
| M1 vs. M4 | 0.003 * | <0.001 * | 0.170 | <0.001 * | <0.001 * | <0.001 * |
| M2 vs. M3 | 0.043 * | <0.001 * | 0.337 | <0.001 * | <0.001 * | <0.001 * |
| M2 vs. M4 | <0.001 * | <0.001 * | <0.001 * | <0.001 * | <0.001 * | <0.001 * |
| M3 vs. M4 | <0.001 * | 0.001 * | <0.001 * | <0.001 * | <0.001 * | <0.001 * |
© 2017 by the authors. Licensee MDPI, Basel, Switzerland. This article is an open access article distributed under the terms and conditions of the Creative Commons Attribution (CC BY) license (http://creativecommons.org/licenses/by/4.0/).
Share and Cite
MDPI and ACS Style
Mitschke, C.; Heß, T.; Milani, T.L. Which Method Detects Foot Strike in Rearfoot and Forefoot Runners Accurately when Using an Inertial Measurement Unit? Appl. Sci. 2017, 7, 959. https://doi.org/10.3390/app7090959
AMA Style
Mitschke C, Heß T, Milani TL. Which Method Detects Foot Strike in Rearfoot and Forefoot Runners Accurately when Using an Inertial Measurement Unit? Applied Sciences. 2017; 7(9):959. https://doi.org/10.3390/app7090959
Chicago/Turabian StyleMitschke, Christian, Tobias Heß, and Thomas L. Milani. 2017. "Which Method Detects Foot Strike in Rearfoot and Forefoot Runners Accurately when Using an Inertial Measurement Unit?" Applied Sciences 7, no. 9: 959. https://doi.org/10.3390/app7090959
Note that from the first issue of 2016, this journal uses article numbers instead of page numbers. See further details here.