Thermal Pre-Treatment of Sewage Sludge in a Lab-Scale Fluidized Bed for Enhancing Its Solid Fuel Properties


1
Department of Environmental Engineering, Kongju National University, 1223-24 Cheonan-Daero, Seobuk, Chungnam 330-717, Korea
2
Department of Mechanical Engineering, Kongju National University, 1223-24 Cheonan-Daero, Seobuk, Chungnam 330-717, Korea
*
Author to whom correspondence should be addressed.
Appl. Sci. 2018, 8(2), 183; https://doi.org/10.3390/app8020183
Submission received: 5 January 2018
/
Revised: 24 January 2018
/
Accepted: 25 January 2018
/
Published: 26 January 2018
(This article belongs to the Special Issue Renewable Energy 2018)
Abstract
:Thermal pre-treatment of non-lignocellulosic biomass, sewage sludge, using a lab-scale fluidized bed reactor was carried out in order to enhance its solid fuel properties. The influence of the torrefaction temperature range from 200–350 °C and 0–50 min residence time on the physical and chemical properties of the torrefied product was investigated. Properties of the torrefied product were analyzed on the basis of the degree of torrefaction, ultimate and proximate analysis, and gas analysis. An attempt was made to obtain the chemical exergy of sewage sludge. An elevated torrefaction temperature presented a beneficial impact on the degree of torrefaction and chemical exergy. Moreover, the effect of the torrefaction temperature and residence time on the elemental variation of sewage sludge exhibited an increase in the weight percentage of carbon while the H/C and O/C molar ratios deteriorated. Additionally, the product gas emitted during torrefaction was analyzed to study the pathway of hydrocarbons and oxygen containing compounds. The compounds with oxygen were emitted at higher temperatures in contrast to hydrocarbon gases. In addition, the study of various correlations for predicting the calorific value of torrefied sewage sludge was made.
1. Introduction
The extensive use of conventional fuel has not only induced economic problems, but also ecological damages. Limited fossil fuel reserves have served as a challenge, globally, to look for alternative sources of energy. Thus, the apprehension for greenhouse gas emissions (GHG), energy security, and sustainability has caught worldwide attention to look for renewable and alternative energy resources. Therefore, to curtail these issues, an appropriate replacement for renewable energy is necessary.
Korea is dependent for its energy demands and imports almost 97% of its energy. It is vital that the country generates ideas for the production of renewable energy. One of the materials that can be used for the production of energy is sewage sludge which is generated from wastewater treatment plants. According to a study by Environment Department, Water and Wastewater Policy office of South Korea, 2012 [1], an annual increase of 5.9% was observed in the case of sewage sludge production, with a daily production of 9799 tons, as per the 2012 statistics. This projects that the amount of sewage sludge produced is sufficient for its usage in energy generation. Sewage sludge disposal and management can be one of the most complex and challenging environmental issues. In today’s time, a great deal of work has been centralized for proper management of sewage sludge, for instance, applications of sewage sludge to agricultural land or thermochemical treatments, like combustion, gasification, and pyrolysis [2,3,4]. Due to the high amount of organic content present in sewage sludge, it can be utilized as a biomass resource for generating energy. A study by Mills et al. [5] reflects the potentiality sewage sludge holds for energy recovery. The author also states that the UK water industry generated approximately 800 GWh/year of electrical energy from sewage sludge. In addition, Parshetti et al. [6] also highlight the conversion of waste sludge to energy-densified solid fuels for energy generation.
Although the concept of utilizing waste for generating energy through thermochemical treatment is not recent, the properties of biomass, such as low heating value, high moisture content, and hygroscopic behavior, have impeded this sector [7]. Torrefaction, a thermal pretreatment process, can, therefore, be utilized to overcome these barriers that biomass possess and can produce low-value biomass feedstocks applicable for use in energy-related applications, like pyrolysis, combustion, or gasification. Some of the principal influences of pretreatment by torrefaction include: (i) low transportation cost; (ii) high grindability; (iii) reduction in size of biomass; (iv) increase in calorific value; (v) hydrophobic product, making storage easier; (vi) slowing of biological and thermal degradation improving shelf life and storage; and (vii) the combustibility of biomass [8,9,10,11,12].
Torrefaction is a pretreatment process where the feedstock (biomass) is heated to a temperature of 200–300 °C in an inert environment [13]. One of the major advantages of this pretreatment process is the energy densification of the torrefied biomass as projected in Figure 1 [14]. During this process, decomposition of biomass takes place by emitting various kinds of volatiles. Tumluru et al. [15] exhibited in his research that the torrefied product or yield retained the energy constituent remarkably. In addition, the torrefied product showed enhanced calorific value and energy density, and higher carbon percentage with a lower hydrogen to carbon ratio. Furthermore, a study by Arias et al. (2008) [16] testifies to the improvement in biomass properties through torrefaction which, in turn, expedited its co-firing with coal. Moreover, Pimchuai et al. [17] conducted torrefaction of five different types of agricultural residues with respect to torrefaction temperature and residence time and concluded that torrefaction escalated the physical and thermochemical properties of agricultural residues compared to raw biomass in terms of energy density and calorific value.
Numerous works focuses on torrefaction of lignocellulosic biomass [16,18,19,20,21], while the torrefaction of non-lignocellulosic biomass has been studied to a lesser degree [22,23,24]. A study by Dhungana et al. [22] demonstrated that, despite no, or a low amount of, hemicellulose present in sewage sludge, the energy density increased with torrefaction. In addition, the study also concluded that the effect of torrefaction temperature was more pronounced than the residence time. Huang et al. [24] compared sewage sludge and leucaena torrefaction using a single-mode microwave oven, which established a higher calorific value, fuel ratio, and low atomic H/C and O/C ratios. However, they suggested the use of co-torrefaction of sewage sludge with other biomass for better torrefaction performance. Jeeban et al. [25], in their research, utilized a blend of sewage sludge and waste wood torrefaction and highlighted the benefits of co-torrefaction including, but not limited to, constructive influence on gasification and pyrolysis.
Study of torrefaction of sewage sludge remains limited and has been torrefied in muffle furnaces [22], fixed bed reactors [23], auger reactors [26], and fluidized bed reactors [4]. According to Martinez et al. [26] muffle furnace and fixed bed is less feasible for industrial scale. Fluidized beds exhibit excellent gas-solid heat and mass transfer and has been used for combustion [27,28], gasification [29], and pyrolysis [30]. Despite the leverage fluidized beds portray, to our knowledge, only a few studies has been carried out for torrefaction using this technology [4,7,31]. In a fluidized bed reactor, biomass is mixed well and a uniform temperature distribution is maintained, which results in a uniform product quality, which is generally difficult in the case of other reactors [22].
This study, therefore, attempts to investigate the torrefaction of sewage sludge using a fluidized bed in order to take maximum benefit of the swift heat and mass transfer. This paper also aims to assess the qualitative analysis of torrefied biomass with respect to their calorific value, O/C and H/C molar ratios, gas analysis, and proximate and ultimate analysis. Chemical exergy was also investigated. In addition, various correlations for predicting the higher heating value (HHV) from different studies were considered and a comparative study of experimental HHV with predicted HHV from different correlations was carried out. An attempt to study the optimum torrefaction temperature of sewage sludge in a fluidized bed was made as it has the long-term benefit of commercialization. Overall, this work focuses on the torrefaction of sewage sludge in a laboratory-scale fluidized bed, the characterization of torrefied sewage sludge properties, and also the identification of the optimized torrefaction temperature range for sewage sludge.
2. Materials and Methods
2.1. Materials
Raw sewage sludge was obtained from a wastewater treatment plant in Pocheon, South Korea. The raw sewage sludge was homogeneously mixed and dried at 105 °C for 24 h. Table 1 illustrates the properties of the sample where ‘others’ indicates inorganic components present in sewage sludge and the calculation methods are illustrated in Section 2.2. Before conducting torrefaction, sewage sludge was ground into powder and was separated into five size fractions, 0–250, 250–355, 355–450, 450–600, and 600–800 µm. All fractions were used in the cold model tests, but only 250–355 µm was selected for this experiment. The cold model test was conducted using a Plexiglas unit with identical dimensions to that of the hot unit. Channeling was observed for sizes of 0–250 µm, whereas slugging was observed for sizes above 450 µm, and proper fluidization was only observed for sizes of 250–355 µm.
2.2. Experimental Apparatus and Method
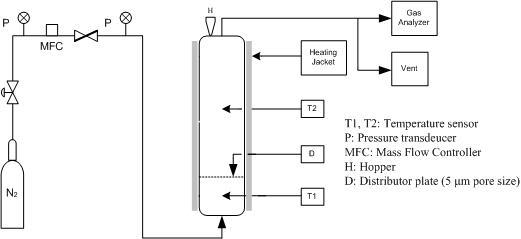
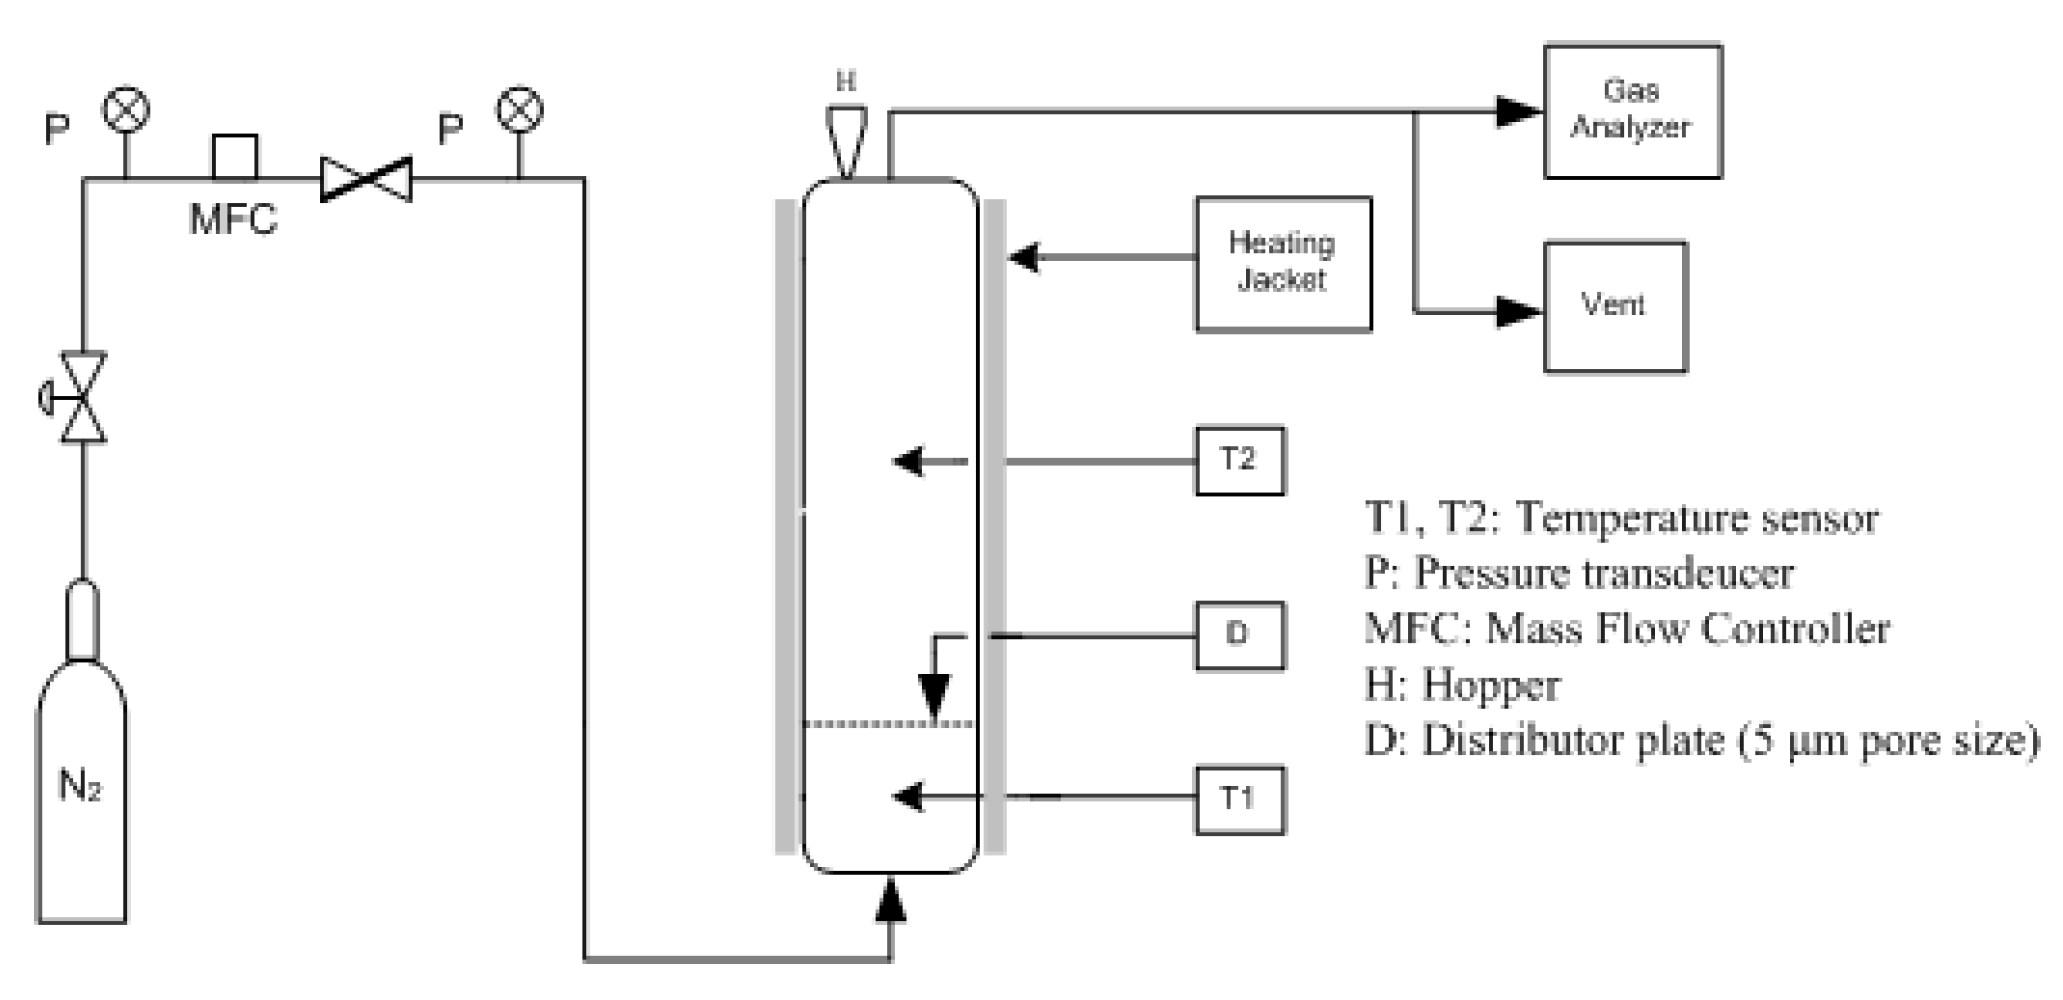
A laboratory-scale fluidized bed made of stainless steel was used for the torrefaction of sewage sludge. The height of the bed was 600 mm with an internal diameter of 30.7 mm. The schematic diagram of the fluidized bed is provided in Figure 2. Thermocouples were used to measure the temperatures of the inlet gas, the fluidized bed, and the reactor wall. The calorific value was measured using a bomb calorimeter (Parr Instrument Co., Model 1672, Moline, IL, USA) whereas a Thermo Fisher Scientific Inc., Thermo FLASH 200 (Hudson, NH, USA) was used for elemental analysis. In addition, the emitted gas during torrefaction was analyzed using a MK9000 (Eurotron Instruments, Chelmsford, UK, gas) gas analyzer. Four temperature levels, 200, 250, 300 and 350 °C, and 0–50 min of residence time were used for this study. Proximate analysis was calculated using the ASTM D3172 method.
A sample load of 15 g at ambient temperature and a volumetric flow of 300 Nm3/min with nitrogen as the fluidized gas were determined from the cold experiment. Nitrogen helps in maintaining the inert atmosphere along with controlling the rapid temperature rise within the fluidized bed. During the hot model test, the fluidized bed was heated to the desired temperature using a heating jacket. After the temperature was reached, the weighed sample was fed from the hopper situated at the top of the reactor. The sewage sludge was then fluidized by nitrogen at a predetermined flow rate at the desired residence time. After the completion of the test, the sample was removed immediately. The use of inert bed materials is preferred in fluidized beds for proper heat transfer to the particles in the reactor [32]. However, a study by Li et al. [31] proposes eliminating the use of inert material due to the contamination caused by fine broken bed materials that will elevate the ash content of the torrefied product. Therefore, use of any bed material or inert material, such as sand, was avoided in this research as well. The result obtained in this experiment aligns well with Alvarez et al. [33] and Huang et al. [24]. In contrast, the values are different to Atienza-Martínez et al. [26]. The thermogravimetric analysis (TGA) of the sewage sludge was conducted using a thermogravimetric analyzer (TA Instruments, Q50, New Castle, DE, USA). The sample was studied at various heating rates ranging from 10 to 30 °C/min and at temperatures ranging from room temperature to 800 °C. The initial mass of each sample was 2 mg. All experiments were carried out in a nitrogen atmosphere under a flow rate of 60 mL/min. The conversion (α) of sewage sludge was calculated using Equation (1):
where Wo and W are the initial and final masses of the sample.
3. Results and Discussions
3.1. Thermogravimetric Analysis
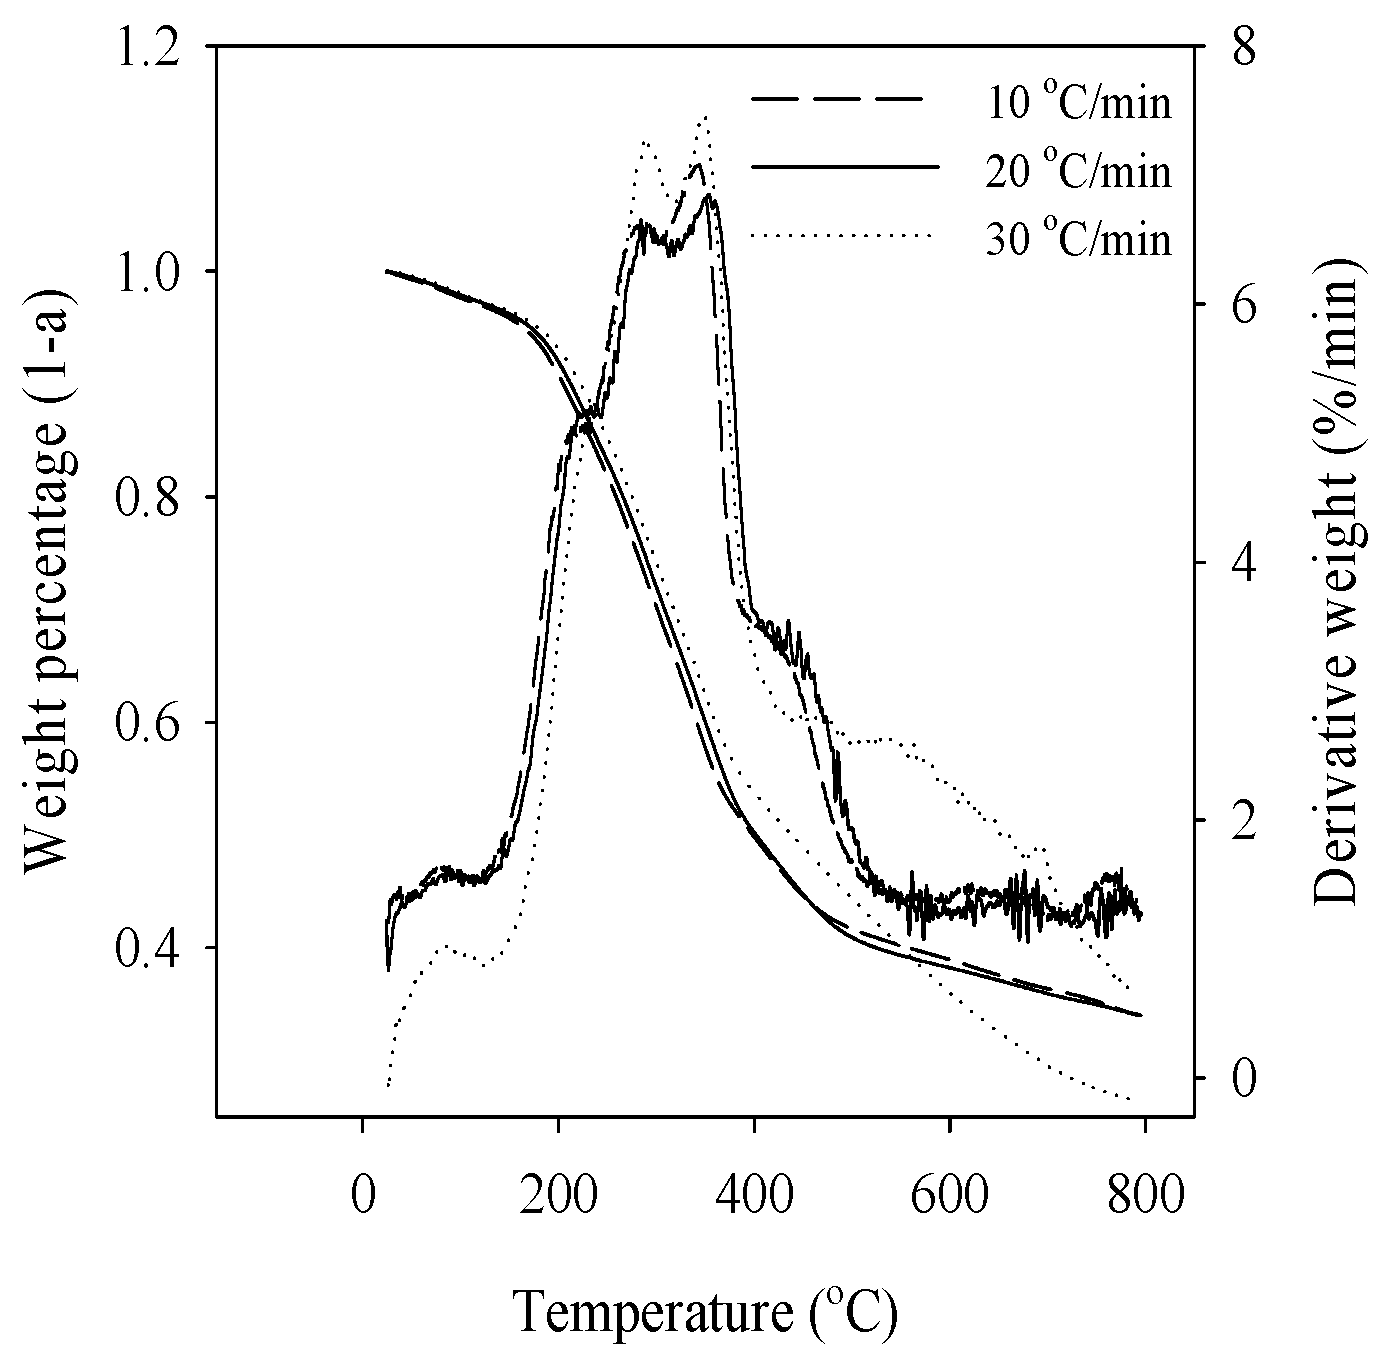
Figure 3 shows the Thermogravimetric Analysis-Differential Thermal Analysis (TG-DTA) curves of sewage sludge under nitrogen atmosphere, recorded at three different heating rates (i.e., 10, 20, 30 °C). The graph demonstrates the mass loss of sewage sludge over the temperature range from ambient temperature up to about 800 °C. The weight loss percentage increases with increase in the torrefaction temperature, which signifies the effect the torrefaction temperature has on the weight percentage change. Initial weight loss can be observed before 200 °C, which may be due to a loss of moisture of the sewage sludge. Furthermore, for the temperature range of approximately 200–500 °C, a higher weight loss can be observed, which may be associated to the thermal decomposition as the sewage sludge enters the pyrolysis zone. Additionally, it can be observed that the actual temperature range from start to finish of the sewage sludge decomposition is narrower at a lower heating rate with respect to a higher heating rate. It also results that higher heating rates are accompanied by higher reaction rates and elevated reaction temperatures, i.e., the Derivative Thermogravimetric Analysis (DTG) peak temperature shifts to a higher value with increasing heating rates. There are two main reasons associated with the effects of the heating rate on the TG and DTG curve shape and the characteristic temperatures. First, at higher heating rates, a temperature difference is generated between the sample and the thermocouple built-in sensor. This might result in lagging of the real sample temperature behind the thermocouple. Second, in the decomposition with volatile products, it takes time for those products to diffuse out of the sample and to be carried away by the flowing gas. A low heating rate is more likely to generate thermal equilibrium and give reproducible results for analysis. Similar results have been obtained by Arias et al. [16].
Thermogravimetric measurements suggest that the thermal decomposition of sewage sludge is a rather complex process that occurs in several stages, as it is clearly reflected by the presence of several DTG peaks (Figure 3). The complicated thermal behavior exhibited by sewage sludge is likely a consequence of its very complex chemical composition, which is characterized by the presence of the organic components, such as cellulosic, dead bacteria and microbes combined with a large fraction of inorganic material in different amounts. In addition, Fourier-transform Infrared Spectroscopy (FTIR) can be integrated with TGA for better qualitative assessment of thermal treatment and for better understanding of the evolved gases from the infrared spectral analysis providing an extra specificity to the measurement.
3.2. Degree of Torrefaction
The relative energy gain of the torrefied biomass is expressed in terms of the degree of torrefaction, which is calculated using Equation (2), obtained from Nitthitron and Suthum [34]. The degree of torrefaction is directly correlated with the calorific value of the torrefied product:
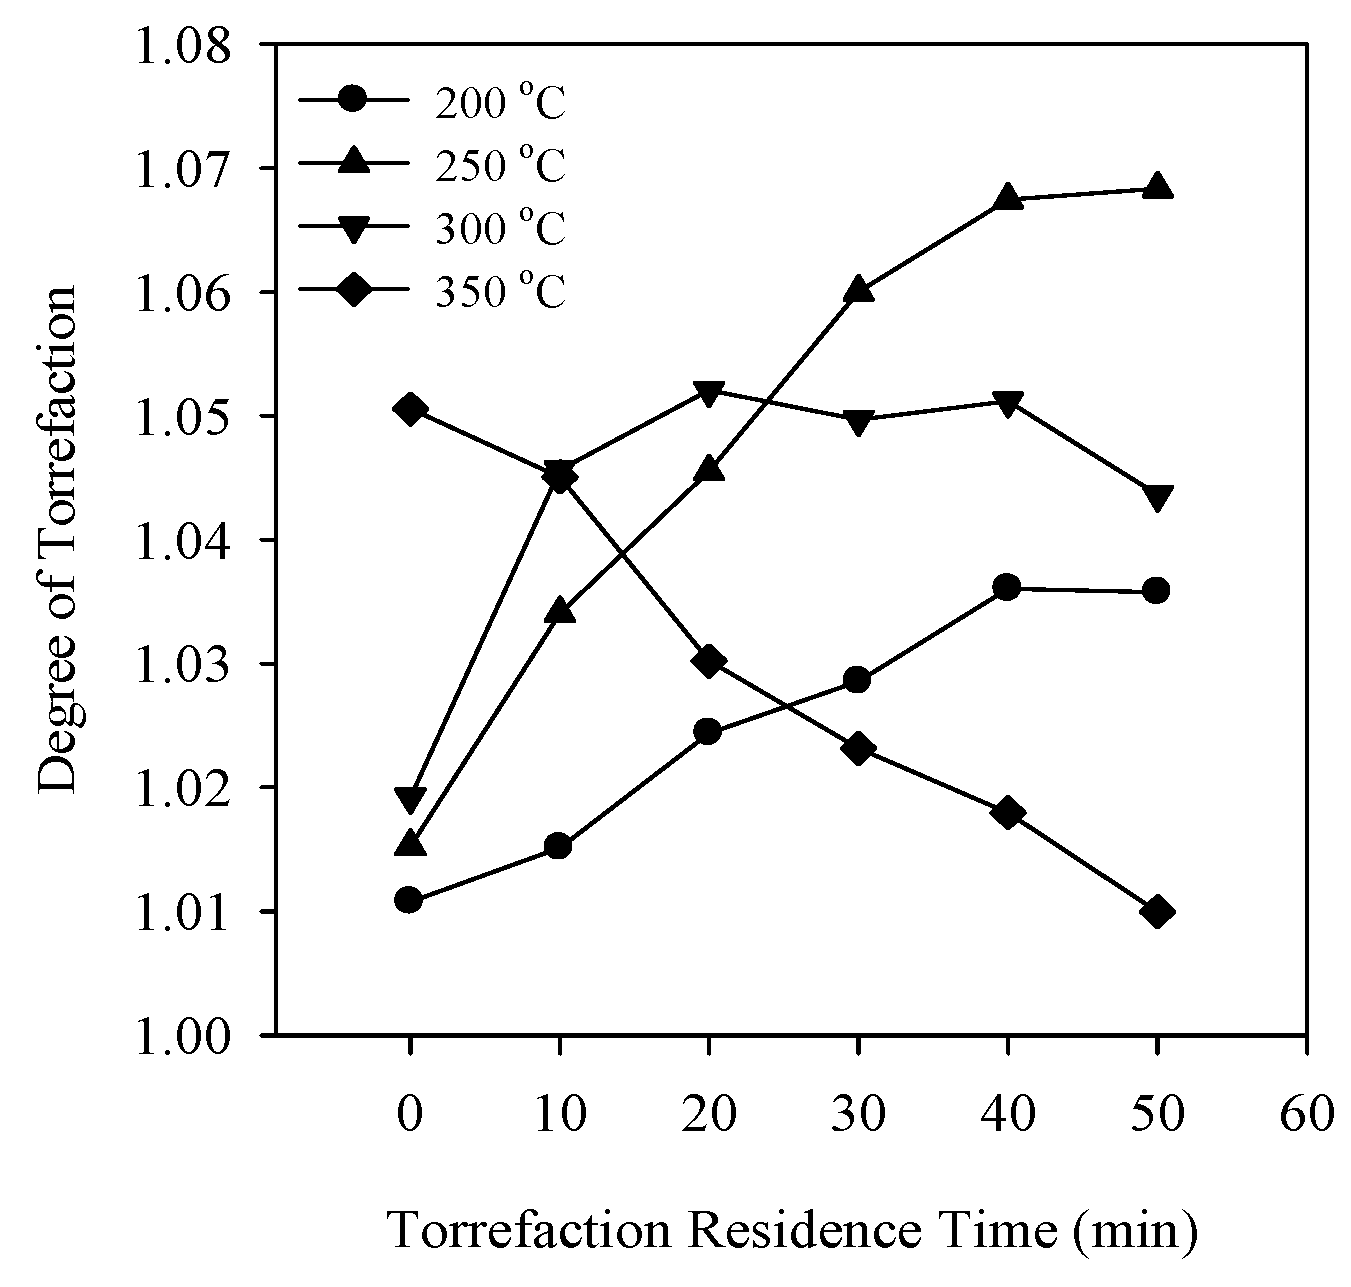
One of the major advantages of torrefaction is the gain in energy density of the torrefied biomass, which is also supported by Figure 1. The graph in Figure 4 shows the degree of torrefaction with respect to the torrefaction residence time. Nitthitron and Suthum [34] indicate that the greater the degree of torrefaction over unity, the greater the relative energy gain per unit mass. Moreover, the authors also suggested that the increase in the degree of torrefaction is due to the increase in the calorific value of torrefied biomass with an increase in the torrefaction temperature. It can be seen from the graph that the degree of torrefaction was more pronounced for 250 °C at 50 min torrefaction residence time. While the increase in the degree of torrefaction is consistent for 200 °C, the overall increase is not great. With the increase in the torrefaction temperature from 200 to 250 C, the rate of increase of the degree of torrefaction increases. However, after 300 °C, the rate starts to decline and a gradual decrease in the rate of the degree of torrefaction is observed at 350 °C from the inception of torrefaction. In addition, at 300 °C, the rate of degree of torrefaction increases until 20 min residence time, after which the rate starts declining on a further increase in the torrefaction residence time. This increase, up to 300 °C, may be attributed to the removal of the oxygen. In addition, sewage sludge is non-lignocellulosic, constituting of the thermally-degradable organic component that degrades easily on higher torrefaction temperature, resulting in a decrease in the degree of torrefaction. Zanzi et al. [35] and Nimlos et al. [36], in their report, also established that an increase in the torrefaction temperature increases the calorific value which, in turn, increases the degree of torrefaction. A study by Iroba et al. [37] conducted a microwave-assisted torrefaction where the increase in calorific value was observed with an increase in the torrefaction residence time. Recari et al. [38], in their study, showed that the calorific value improved only at 290 °C. These results can be correlated with the degree of torrefaction attained in this study as the degree of torrefaction increases with the increase in the calorific value.
3.3. Torrefaction Index
A study by Basu et al. [39] introduced the torrefaction index (TI) based on the ratio between the energy density enhancement factors at a given condition to the reference condition and showed a linear dependence of energy density on the torrefaction temperature. Additionally, the authors also suggested 300 °C and 60 min as the reference torrefaction temperature and residence time, respectively. However, the study conducted comprised only of lignocellulosic biomasses. The torrefaction temperature and residence time for non-lignocellulosic biomass, such as sewage sludge, are comparatively milder owing to its higher organic fraction in contrast to lignocellulosic biomass.
Table 2 shows a comparison between the TI obtained in this study to that of Basu et al. [39]. From the table, it is clear that the value obtained in this study coordinates very well to the predicted value range. From this it can be seen that the TI increases with increase in torrefaction temperature until of 300 °C, after which the value starts declining. From this it can be suggested that torrefaction above 300 °C would be undesirable for sewage sludge.
Sarvaramini et al. [40] suggested that torrefaction of 300 °C was more efficient than 260 °C. In addition, Shang et al. [41] performed torrefaction of wheat straw and concluded that the upper limit of temperature, i.e., 300 °C, is the desired temperature for torrefaction. Contrarily, Jeeban et al. [42], in their study, concluded that the optimum temperature range for torrefaction of sewage sludge was 300–350 °C, although the torrefaction of sewage sludge was performed in a fixed bed. However, the present study suggests an optimum temperature of 250–300 °C. The difference in the temperature range in the literature and this study may refer to the fact that the chemical and structural composition of lignocellulosic and non-lignocellulosic biomass is dissimilar and is also based on the composition and the origin of the biomass. Therefore, the use of a torrefaction index might be beneficial as a pre-assessment tool to generate ideas about the quality of the torrefied product before conducting the experiment itself, as highlighted by Basu et al. [39] in their studies.
3.4. Proximate Analysis
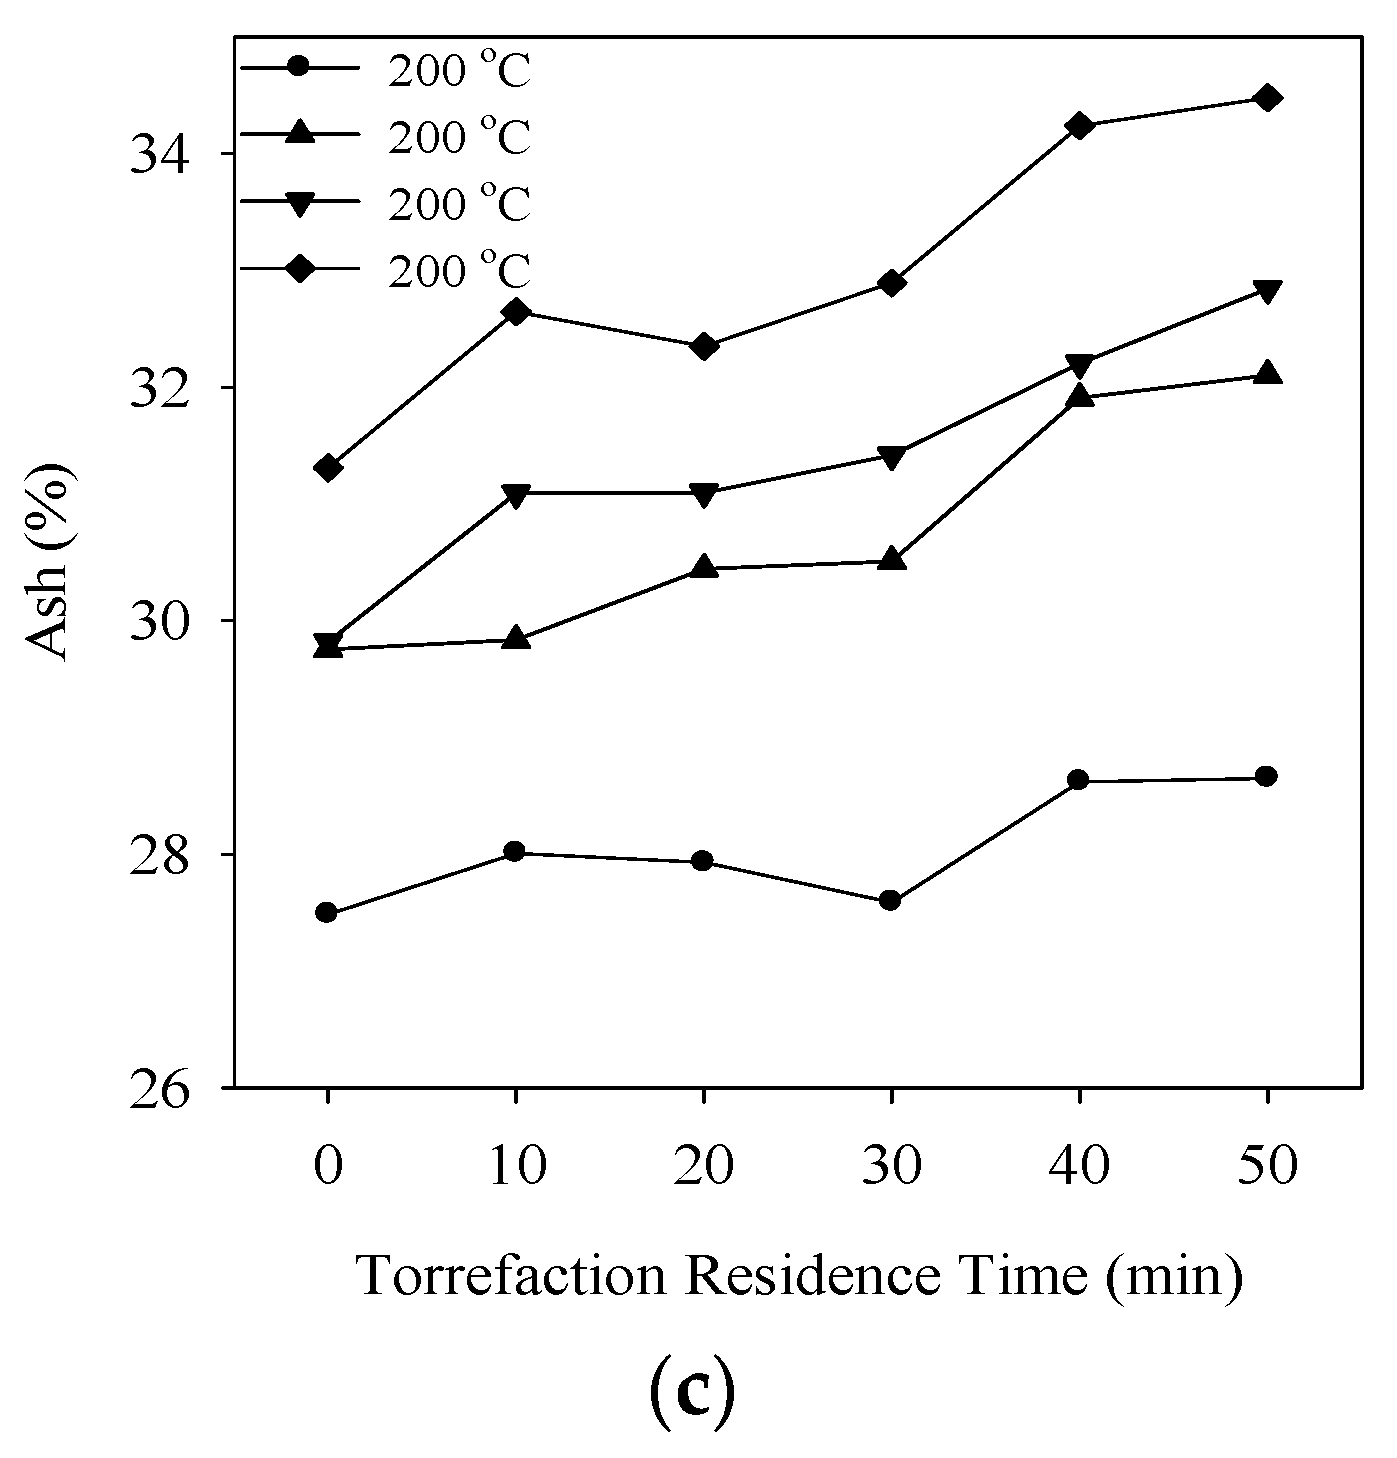
In torrefaction, the decrease in the volatile fraction (VF) and the increase in fixed carbon (FC) are preferred as they enhance the calorific value and remove moisture from the biomass. Therefore, the VF of the biomass should decrease and the FC should increase after torrefaction. The drop in the VF increases with the increase in the torrefaction temperature because a part of the volatile is depolymerized [22]. The results of proximate analysis for torrefied biomass at varying torrefaction temperatures and residence times are illustrated in Figure 5a–c. As from the graph, the VF of the sewage sludge decreased by 3.29% for 200 °C. At higher temperatures, 250 °C and 300 °C, the VF decreases by 7.35 and 7.82 wt %. Further increasing the temperature to 350 °C, the trend is similar with respect to temperature and residence time, but the absolute value is smaller, i.e., only a 5.82 wt % reduction was observed. For torrefaction temperatures between 250–300 °C, the fraction of FC reached a maximum value of 29.37 wt % and the ash fraction was approximately 9.2 wt %. Higher amounts of FC of torrefied biomass can produce a greater heat of combustion, which can be beneficial during combustion applications [20]. However, high ash content can be disadvantageous for usage of sewage sludge as an energy source. Additionally, ash management can be challenging as high amounts of ash can lead to fouling, slagging, and agglomeration of the bed [43]. Yang et al. [44] demonstrated similar results where the volatile content decreased after an increment of torrefaction temperature from 230 to 270 °C. Furthermore, Boatend and Mullen [45] explains this decrease in the volatile matter is associated with the decomposition of biomass polymer as well as the release of light volatiles.
Tulumuru et al. [15], in their studies, demonstrates that at torrefaction temperatures of 160 and 180 °C the changes in the biomass is due to dehydration reactions. It also states that further increasing the torrefaction temperature above 230 °C, devolatilization and carbonization take place, which are the principal reactions causing the alteration in the chemical composition of the torrefied biomass to that of the raw biomass. Bates and Ghoniem [46] used two-step models in their studies and demonstrated that oxygenated species, such as water and acetic acid, are released in the first stage, and lactic acid and methanol were released in the second stage. The authors also demonstrated that an increase in the torrefaction temperature elevated the mass fraction of carbon and decreased the hydrogen and oxygen content. Park et al. [47], in their study, exhibited that the loss of VF is correlated to the thermal breakdown of carbohydrate fractions which amount to the accumulation buildup of ash after torrefaction. The study further illustrates that these alterations increase the FC content of the biomass, which complies well with the findings in this study.
3.5. Ultimate Analysis
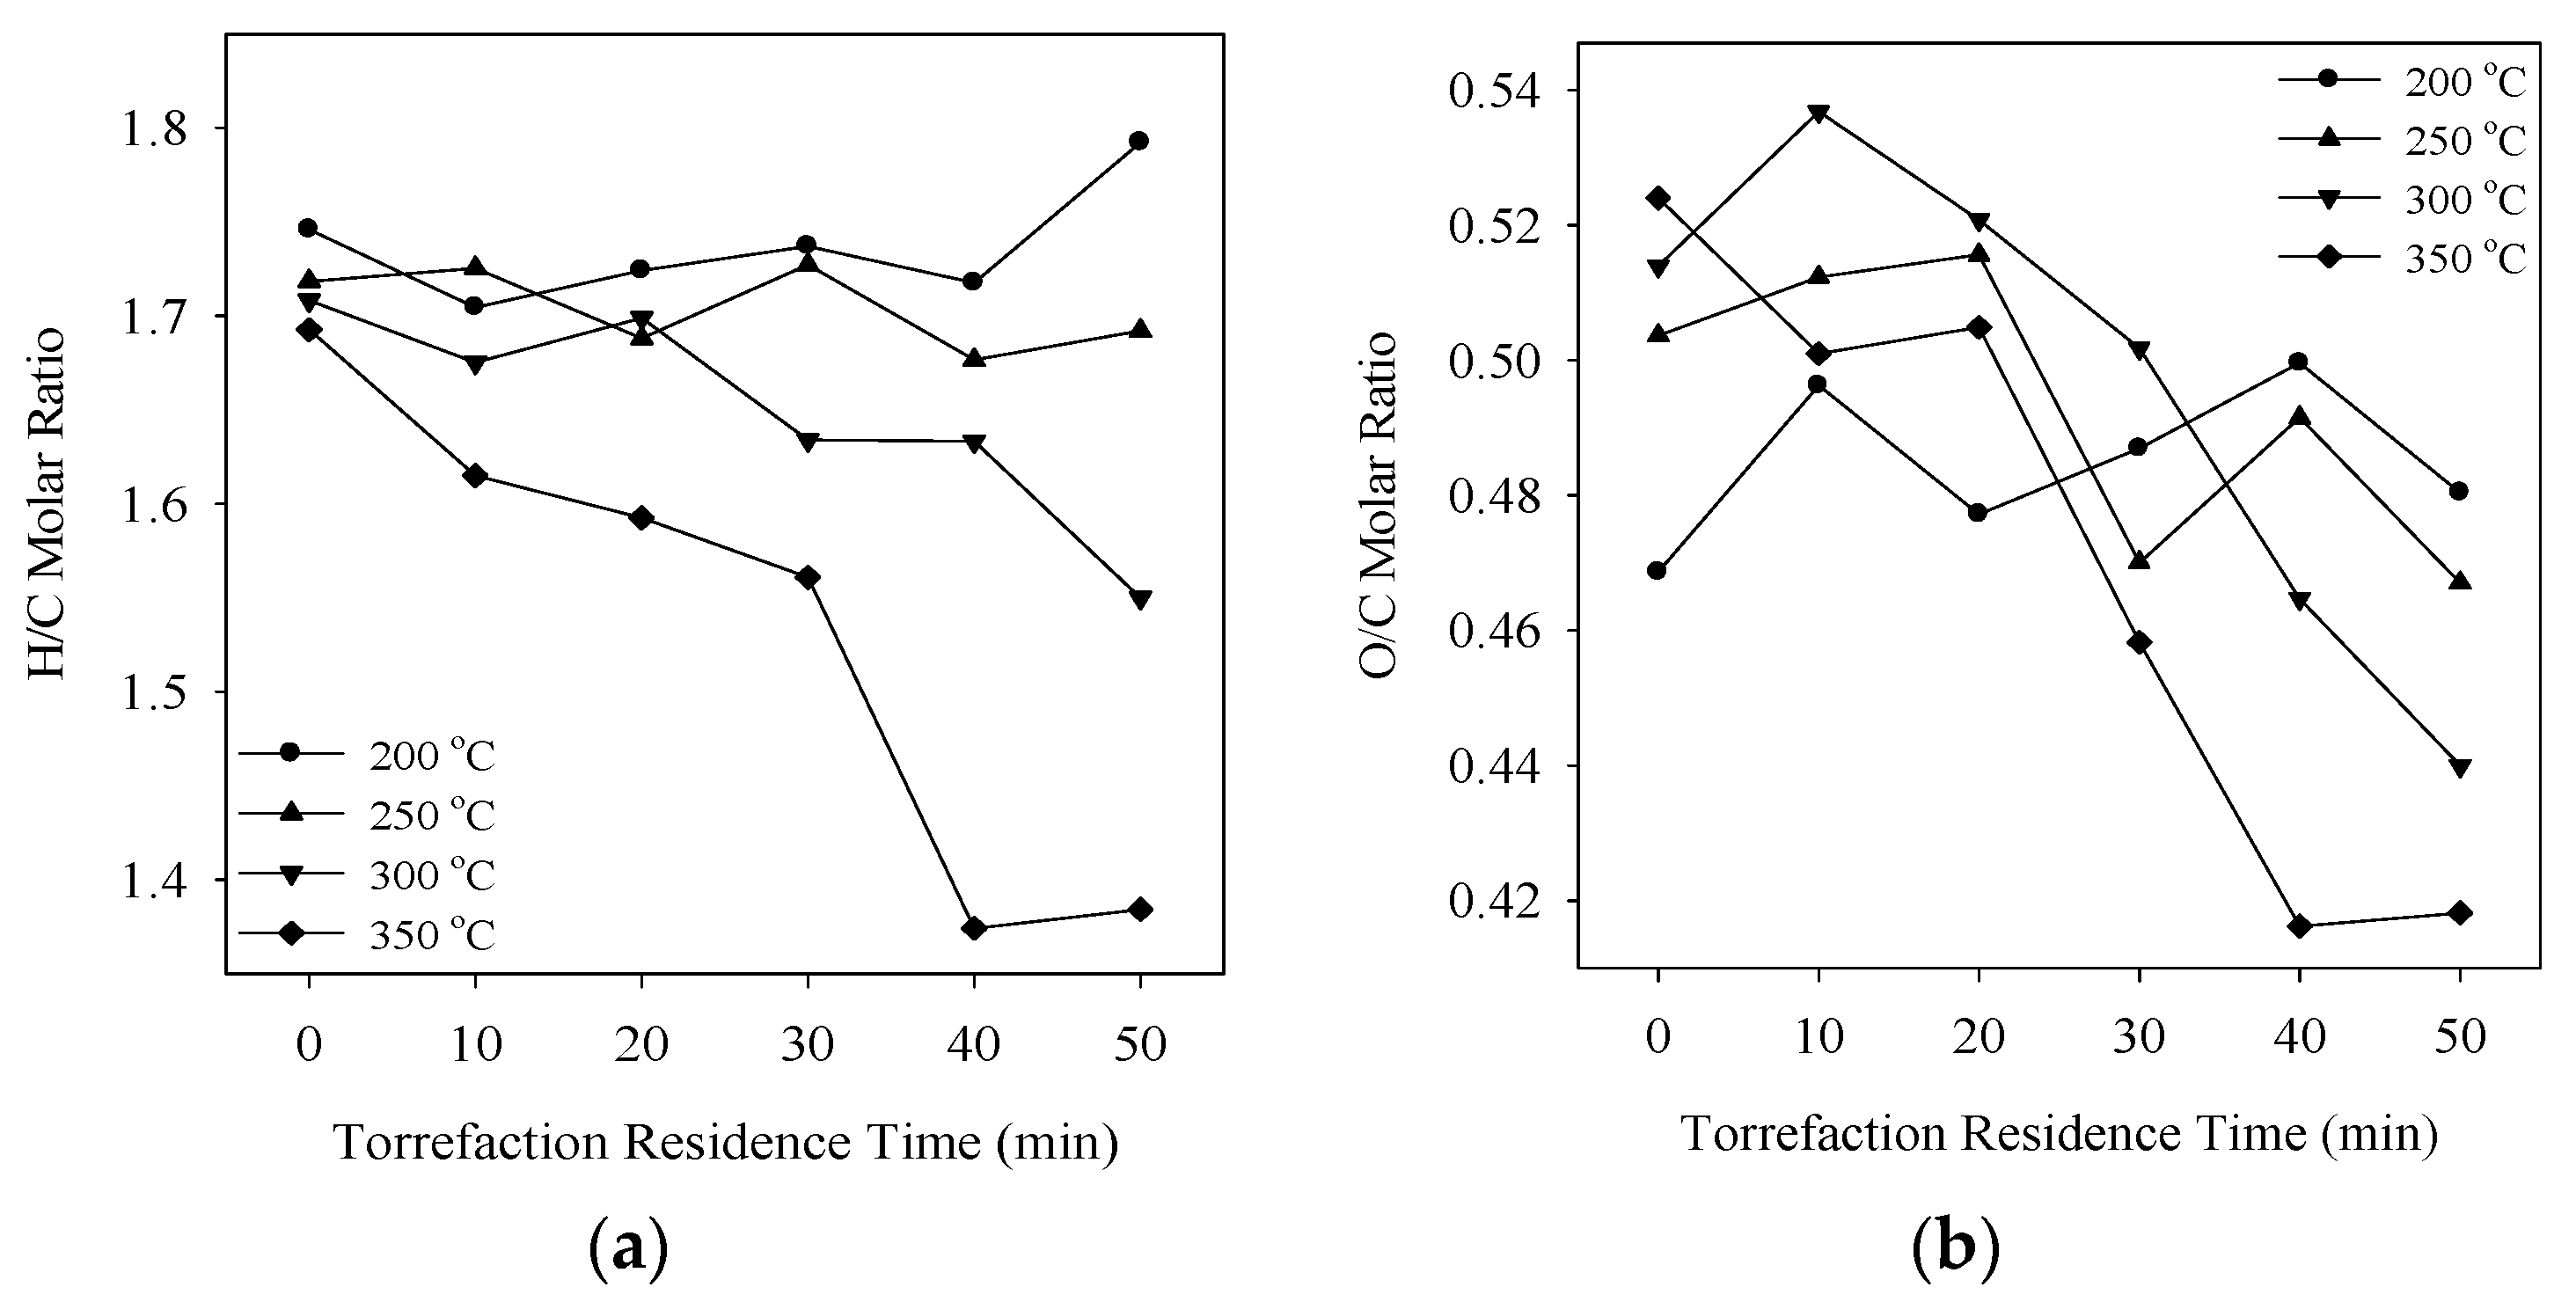
Figure 6 demonstrates the change in H/C and O/C molar ratios with respect to the torrefaction residence time. The relative increase in the carbon and the decrease in hydrogen and oxygen content also suggests the change in chemical composition, which leads to the decrease in H/C and O/C ratios. This increases the hydrophobic nature, which enhances the storage and transportation capability of the biomass. In addition, the decrease in H/C and O/C ratios is advantageous as less smoke and water vapor is formed, reducing the energy loss during combustion and gasification processes. Therefore, this alteration in the chemical composition of biomass can upgrade its quality as an energy source as more oxygen is lost in the form of volatiles than carbon.
The increase in the calorific value coordinates with the increase in the carbon content and the decrease in the oxygen and hydrogen content with the increase in the torrefaction temperature and residence time. The reduction in oxygen and hydrogen content is due to the loss of oxygen0 and hydrogen-rich volatile components during the pyrolysis phase of torrefaction. In contrast, the nitrogen establishes no correlations with the torrefaction temperature. The decrease in H/C and H/C ratios can also lead to increase in the degree of torrefaction [48]. Lower O/C ratios observed at temperature above 200 °C can be due to the release of oxygen-rich compounds, such as CO2 and H2O, while the decrease in H/C can be associated with the formation of CH4 during torrefaction [49]. This can be correlated with the gas analysis from Figure 7 where CH4 is produced after 250 °C, and CO and CO2 after 200 °C.
3.6. Gas Analysis
Figure 7 shows the yield of gases produced during torrefaction. Until 200 °C the yield was almost negligible for all the gases. With an increase in the torrefaction temperature, the yield of gases increased significantly. After approximately 215 °C both CO and CO2 start to increase with the increase in the torrefaction temperature. Traces of methane (CH4) can be observed after 250 °C, whereas Thermal Hydro-Carbon (THC) is released approximately around 200 °C. White and Dietenberger [50] explain the production of CO2 is caused by decarboxylation of acid groups, which refers to the CO production due to the reaction of CO2 and steam with char at elevated temperature. Similar results are obtained by Medic et al. [51]. It can be seen from the graph that although carbon is devolatized in the gaseous phase in the form of CO, CO2, CH4, and THC, there is an increase in the relative carbon content which may be associated with the mass loss being greater than the loss in carbon.
In addition, the present study indicates that there is a significant loss of volatiles at temperatures above 300 °C. Since the loss of higher energy content volatiles may be disadvantageous for improving the energy at temperatures above 300 °C. This study concludes that 250–300 °C can be a suitable range for torrefaction of sewage sludge as the temperature above 300 °C results in significant loss of volatiles, resulting in higher relative ash content, which is not suitable for energy applications. Tulumuru et al. [52] also suggested that temperatures above 300 °C are not necessary for torrefying biomass.
3.7. Chemical Exergy
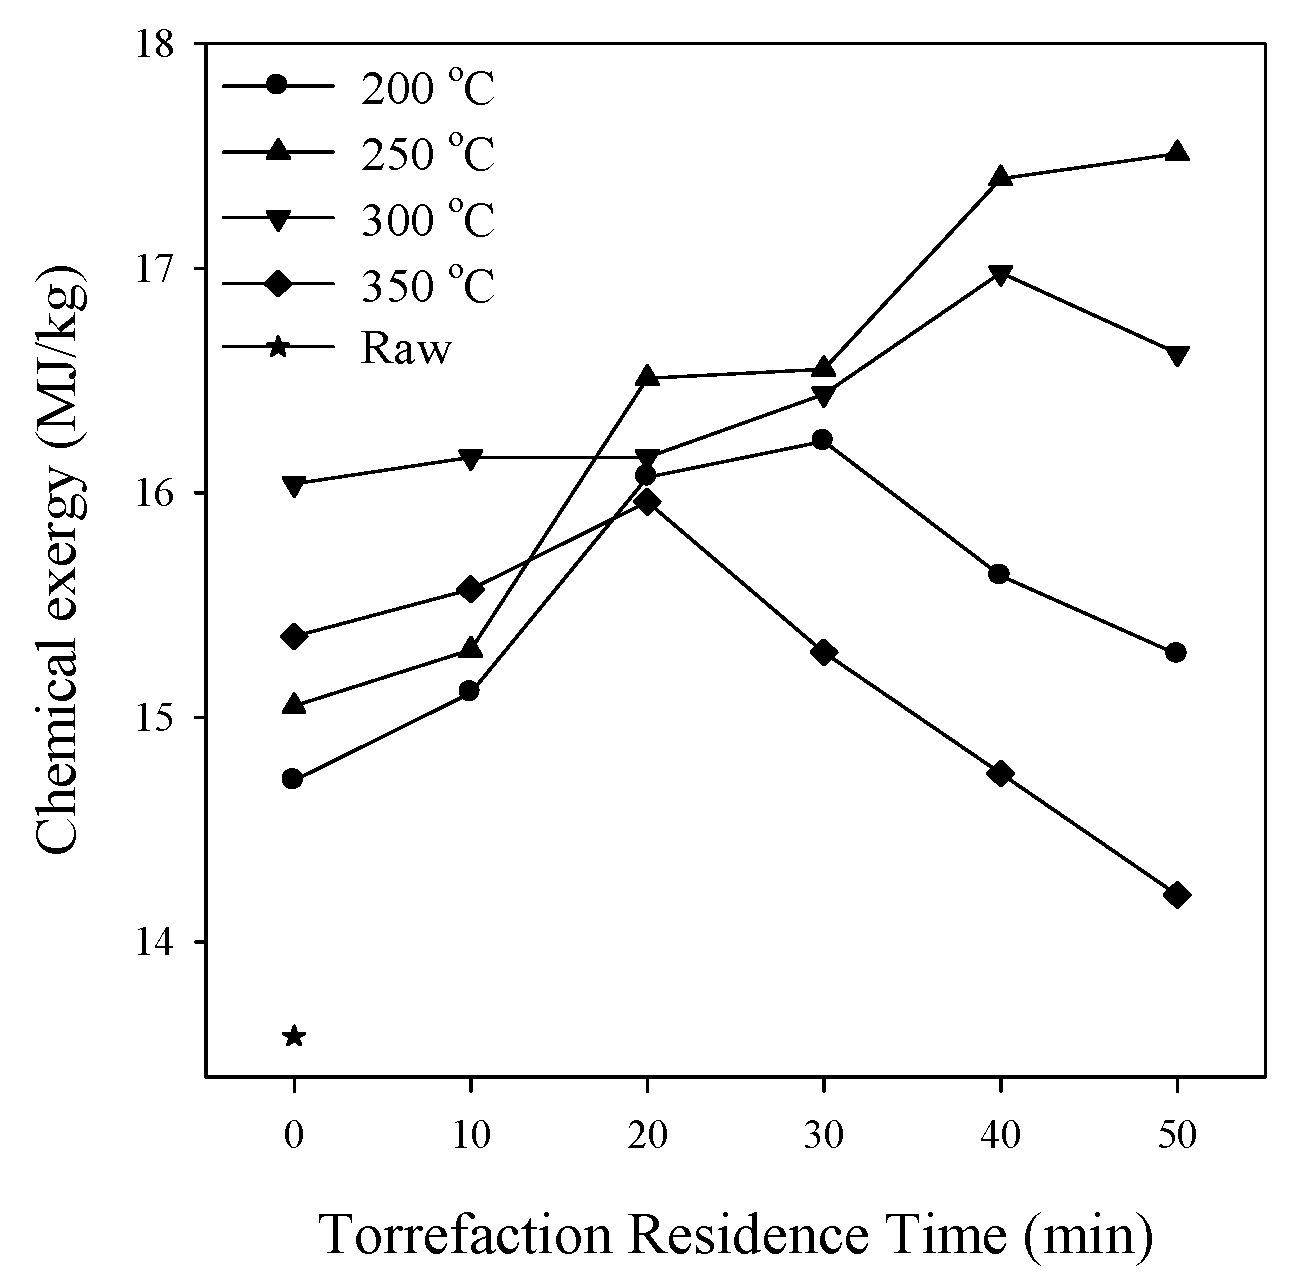
Chemical exergy (ech) of the raw and the torrefied biomass was calculated using correlations that consider ultimate analysis. The chemical exergy was calculated using Equations (3) and (4) provided by Kotas [53]:
where HHV is the experimental calorific value obtained, λbiomass is a dimensionless coefficient relating chemical exergy and the heating value of the biomass, and C, H, N and O are the elemental composition in wt %. Kotas [53] defined chemical exergy as the measure of the maximum potential that can be obtained as useful work. From Figure 8 it can be seen that the overall increase in chemical exergy increases with the increase in the torrefaction time, with few exceptions at 200 and 350 °C. Hence, the increment of exergy results in greater availability of useful work using torrefied biomass for further thermochemical processes. The exergy of torrefied biomass is substantial, especially for 250–300 °C, which also explains why 250 °C can be used as an optimum temperature for sewage sludge torrefaction. In addition, chemical exergy must be studied in detail in order to produce a better torrefied yield that can further be used for thermochemical applications for better energy production.
3.8. Validating HHV Correlation for Torrefied Biomass Using Proximate and Ultimate Analysis
A study by Nhuchhen and Afzal [54] reviewed the published literature for predicting the HHV of raw and torrefied biomass using ultimate and proximate analysis, as demonstrated in Equations (7) and (8), respectively, and concluded that the ultimate analysis-based correlations are more accurate than the proximate-based correlation. This study compared four correlations for predicting HHV using proximate and ultimate analysis, which is illustrated in Table 3. Equations (5) and (6) were used for predicting the HHV using proximate analysis (Cordero et al. [55]) and ultimate analysis (Friedl et al. [56]). The correlations used for comparing the predicted HHV with experimental HHV of this experiment are as follows:
HHV1 = 0.3543FC + 0.1708VM
HHV2 = (3.55C2 − 232C − 2230H + 51.2CH + 131N + 20,600) × 10−3
HHV3 = 0.1846VM + 0.3525FC
HHV4 = 32.7934 + 0.0053C2 − 0.5321C − 2.8769H + 0.0608CH − 0.2401N
It can be concluded from Table 3 that the correlation that best fits with the actual HHV of sewage sludge in this study was the correlation developed by Nhuchhen and Afzal [54] using ultimate analysis. With other correlations, high estimation errors can be seen. Most of the correlations that are developed to date are concentrated only for lignocellulosic biomass. However, using the same correlation for sewage sludge, a non-lignocellulosic biomass showed accuracy in the predicted data. The correlations proposed by Nhuchhen and Afzal [54], based on ultimate analysis, fit well with the HHV obtained in this study. However, a varied range of non-lignocellulosic biomass must be carried out in order to draw an accurate prediction of HHV using ultimate and proximate analysis. Further study is required for detailed validation of the correlations using non-lignocellulosic biomass, such as digested and undigested sludge, and chicken litter, in order to have a good prediction band in different types of non-lignocellulosic biomass.
4. Conclusions
Sewage sludge torrefaction using a lab-scale fluidized bed was investigated for a particle size of 250–355 µm. The degree of torrefaction increased with the increase in the severity of torrefaction. This increase in the severity of torrefaction also elevated the ash content, FC, and chemical exergy whilst a decrement was observed for VF and molar ratios. At 250 °C the highest degree of torrefaction was obtained, while 350 °C had a negative impact on the calorific value. The decrease in VF with the increase in torrefaction temperature was observed which, in turn, increased the FC and ash content. The increase in the torrefaction temperature and residence time showed a steeper decline of H/C and O/C ratios. From the product gas analysis, it was observed that THC was emitted at 200 °C while the oxygen-containing compounds, such as CO and CO2, were emitted at approximately 215 °C. The overall value of chemical exergy increased with the increase in the torrefaction temperature; however, the ideal range was 250–300 °C. Combining all the torrefaction characteristics in this study, a temperature range of 250–300 °C can be concluded to be the optimal torrefaction temperature, although the actual temperature can vary depending on the initial condition of the raw material, the heating rate, and the chemical composition of the raw material. Finally, a comparative study of the same biomass using the fluidized bed and other reactors under the same operating parameters must be carried out to obtain a better understanding of the physical and chemical properties of the torrefied product and the efficiency of the reactors.
Acknowledgments
This work was supported by the Human Resources Development Program (No. 20154030200940) of the Korea Institute of Energy Technology Evaluation and Planning (KETEP) funded by the Ministry of Trade, Industry, and Energy of the Korean Government and the Korea Ministry of Environment (MOE) as “Waste-to-Energy Technology Development Project”.
Author Contributions
Sujeeta Karki and Jeeban Poudel equally contributed in the experiment while Sujeeta Karki was responsible for preparing the first draft of the paper. All three authors were equally responsible for preparing the final draft of this research article. Sea Cheon Oh supervised the research and finalized the paper.
Conflicts of Interest
The authors declare no conflict of interest.
Nomenclature
| ASTM | American Society for Testing and Materials |
| C | Carbon |
| CH4 | Methane |
| CO | Carbon-monoxide |
| CO2 | Carbon-dioxide |
| DTG | Derivative Thermogravimetric Analysis |
| FC | Fixed Carbon |
| FTIR | Fourier-transform Infrared Spectroscopy |
| H | Hydrogen |
| HHV | Higher Heating Value |
| O | Oxygen |
| THC | Thermal Hydro-Carbon |
| TI | Torrefaction Index |
| VF | Volatile Fraction |
| TG-DTA | Thermogravimetric Analysis-Differential Thermal Analysis |
References
- Korean Government, Water and Wastewater Policy office of South Korea. 2012. Available online: http://eng.me.go.kr/eng/web/index.do?menuId=288 (accessed on 12 December 2017).
- Schowanek, D.; Carr, R.; David, H.; Douben, P.; Hall, J.; Kirchmann, H.; Patria, L.; Sequi, P.; Smith, S.; Webb, S. A risk-based methodology for deriving quality standards for organic contaminants in sewage sludge for use in agriculture—Conceptual framework. Regul. Toxicol. Pharmacol. 2004, 40, 227–251. [Google Scholar] [CrossRef] [PubMed]
- Hospido, A.; Moreira, T.; Martín, M.; Rigola, M.; Feijoo, G. Environmental evaluation of different treatment processes for sludge from urban wastewater treatments: Anaerobic digestion versus thermal processes (10 pp). Int. J. Life Cycle Assess. 2005, 10, 336–345. [Google Scholar] [CrossRef]
- Atienza-Martínez, M.; Fonts, I.; Ábrego, J.; Ceamanos, J.; Gea, G. Sewage sludge torrefaction in a fluidized bed reactor. Chem. Eng. J. 2013, 222, 534–545. [Google Scholar] [CrossRef]
- Mills, N.; Pearce, P.; Farrow, J.; Thorpe, R.B.; Kirkby, N.F. Environmental & economic life cycle assessment of current & future sewage sludge to energy technologies. Waste Manag. 2014, 34, 185–195. [Google Scholar] [PubMed]
- Parshetti, G.K.; Liu, Z.; Jain, A.; Srinivasan, M.P.; Balasubramanian, R. Hydrothermal carbonization of sewage sludge for energy production with coal. Fuel 2013, 111, 201–210. [Google Scholar] [CrossRef]
- Brachi, P.; Miccio, F.; Miccio, M.; Ruoppolo, G. Torrefaction of tomato peel residues in a fluidized bed of inert particles and a fixed-bed reactor. Energy Fuels 2016, 30, 4858–4868. [Google Scholar] [CrossRef]
- Chen, W.; Peng, J.; Bi, X.T. A state-of-the-art review of biomass torrefaction, densification and applications. Renew. Sustain. Energy Rev. 2015, 44, 847–866. [Google Scholar] [CrossRef]
- Tumuluru, J.S.; Wright, C.T.; Hess, J.R.; Kenney, K.L. A review of biomass densification systems to develop uniform feedstock commodities for bioenergy application. Biofuels Bioprod. Biorefin. 2011, 5, 683–707. [Google Scholar] [CrossRef]
- Bergman, P.C.; Boersma, A.R.; Kiel, J.H.; Prins, M.J.; Ptasinski, K.J.; Janssen, F.J.J.G. Torrefaction for Entrained-Flow Gasification of Biomass; Report ECN-RX-04-046; ECN: Petten, The Netherlands, 2005. [Google Scholar]
- Chen, D.; Mei, J.; Li, H.; Li, Y.; Lu, M.; Ma, T.; Ma, Z. Combined pretreatment with torrefaction and washing using torrefaction liquid products to yield upgraded biomass and pyrolysis products. Bioresour. Technol. 2017, 228, 62–68. [Google Scholar] [CrossRef] [PubMed]
- Chen, D.; Cen, K.; Jing, X.; Gao, J.; Li, C.; Ma, Z. An approach for upgrading biomass and pyrolysis product quality using a combination of aqueous phase bio-oil washing and torrefaction pretreatment. Bioresour. Technol. 2017, 233, 150–158. [Google Scholar] [CrossRef] [PubMed]
- Rousset, P.; Aguiar, C.; Labbé, N.; Commandré, J. Enhancing the combustible properties of bamboo by torrefaction. Bioresour. Technol. 2011, 102, 8225–8231. [Google Scholar] [CrossRef] [PubMed]
- Bergman, P.C.; Boersma, A.; Zwart, R.; Kiel, J. Torrefaction for Biomass Co-Firing in Existing Coal-Fired Power Stations “Biocoal”; Report No. ECN-C-05-013; ECN: Petten, The Netherlands, 2005. [Google Scholar]
- Shankar Tumuluru, J.; Sokhansanj, S.; Hess, J.R.; Wright, C.T.; Boardman, R.D. A review on biomass torrefaction process and product properties for energy applications. Ind. Biotechnol. 2011, 7, 384–401. [Google Scholar] [CrossRef]
- Arias, B.; Pevida, C.; Fermoso, J.; Plaza, M.G.; Rubiera, F.; Pis, J. Influence of torrefaction on the grindability and reactivity of woody biomass. Fuel Process. Technol. 2008, 89, 169–175. [Google Scholar] [CrossRef] [Green Version]
- Pimchuai, A.; Dutta, A.; Basu, P. Torrefaction of agriculture residue to enhance combustible properties. Energy Fuels 2010, 24, 4638–4645. [Google Scholar] [CrossRef]
- Deng, J.; Wang, G.; Kuang, J.; Zhang, Y.; Luo, Y. Pretreatment of agricultural residues for co-gasification via torrefaction. J. Anal. Appl. Pyrolysis 2009, 86, 331–337. [Google Scholar] [CrossRef]
- Couhert, C.; Salvador, S.; Commandre, J. Impact of torrefaction on syngas production from wood. Fuel 2009, 88, 2286–2290. [Google Scholar] [CrossRef]
- Bridgeman, T.G.; Jones, J.M.; Shield, I.; Williams, P.T. Torrefaction of reed canary grass, wheat straw and willow to enhance solid fuel qualities and combustion properties. Fuel 2008, 87, 844–856. [Google Scholar] [CrossRef]
- Uemura, Y.; Omar, W.N.; Tsutsui, T.; Yusup, S.B. Torrefaction of oil palm wastes. Fuel 2011, 90, 2585–2591. [Google Scholar] [CrossRef]
- Dhungana, A.; Dutta, A.; Basu, P. Torrefaction of non-lignocellulose biomass waste. Can. J. Chem. Eng. 2012, 90, 186–195. [Google Scholar] [CrossRef]
- Ábrego, J.; Sánchez, J.L.; Arauzo, J.; Fonts, I.; Gil-Lalaguna, N.; Atienza-Martínez, M. Technical and energetic assessment of a three-stage thermochemical treatment for sewage sludge. Energy Fuels 2013, 27, 1026–1034. [Google Scholar] [CrossRef]
- Huang, Y.; Sung, H.; Chiueh, P.; Lo, S. Microwave torrefaction of sewage sludge and leucaena. J. Taiwan Inst. Chem. Eng. 2017, 70, 236–243. [Google Scholar] [CrossRef]
- Poudel, J.; Karki, S.; Gu, J.H.; Lim, Y.; Oh, S.C. Effect of Co-Torrefaction on the Properties of Sewage Sludge and Waste Wood to Enhance Solid Fuel Qualities. J. Residuals Sci. Technol. 2017, 14. [Google Scholar] [CrossRef]
- Atienza-Martínez, M.; Mastral, J.F.; Ábrego, J.; Ceamanos, J.; Gea, G. Sewage sludge torrefaction in an auger reactor. Energy Fuels 2014, 29, 160–170. [Google Scholar] [CrossRef]
- Cummins, E.J.; McDonnell, K.P.; Ward, S.M. Dispersion modelling and measurement of emissions from the co-combustion of meat and bone meal with peat in a fluidised bed. Bioresour. Technol. 2006, 97, 903–913. [Google Scholar] [CrossRef] [PubMed]
- Henihan, A.M.; Leahy, M.J.; Leahy, J.; Cummins, E.; Kelleher, B. Emissions modeling of fluidised bed co-combustion of poultry litter and peat. Bioresour. Technol. 2003, 87, 289–294. [Google Scholar] [CrossRef]
- Hannula, I.; Kurkela, E. A semi-empirical model for pressurised air-blown fluidised-bed gasification of biomass. Bioresour. Technol. 2010, 101, 4608–4615. [Google Scholar] [CrossRef] [PubMed]
- Pattiya, A. Bio-oil production via fast pyrolysis of biomass residues from cassava plants in a fluidised-bed reactor. Bioresour. Technol. 2011, 102, 1959–1967. [Google Scholar] [CrossRef] [PubMed]
- Li, H.; Liu, X.; Legros, R.; Bi, X.T.; Lim, C.J.; Sokhansanj, S. Torrefaction of sawdust in a fluidized bed reactor. Bioresour. Technol. 2012, 103, 453–458. [Google Scholar] [CrossRef] [PubMed]
- Folkeson, B. Propensity of Bed Materials Used in Dual Fluidized Beds to Retain Ash-Forming Elements from Biomass Fuels; SLU, Department of Energy and Technology: Uppsala, Sweden, 2014. [Google Scholar]
- Alvarez, J.; Amutio, M.; Lopez, G.; Barbarias, I.; Bilbao, J.; Olazar, M. Sewage sludge valorization by flash pyrolysis in a conical spouted bed reactor. Chem. Eng. J. 2015, 273, 173–183. [Google Scholar] [CrossRef]
- Kongkeaw, N.; Patumsawad, S. Thermal upgrading of biomass as a fuel by torrefaction. In Proceedings of the 2nd International Conference on Environmental Engineering and Applications, Shanghai, China, 19–21 August 2011; Volume 17, pp. 38–42. [Google Scholar]
- Zanzi, R.; Ferro, D.T.; Torres, A.; Soler, P.B.; Bjornbom, E. Biomass torrefaction. In Proceedings of the 6th Asia-Pacific International Symposium on Combustion and Energy Utilization, Kuala Lumpur, Malaysia, 20–22 May 2002. [Google Scholar]
- Nimlos, M.N.; Brooking, E.; Looker, M.; Evans, R. Biomass torrefaction studies with a molecular beam mass spectrometer. Am. Chem. Soc. Div. Fuel Chem. 2003, 48, 590–591. [Google Scholar]
- Iroba, K.L.; Baik, O.; Tabil, L.G. Torrefaction of biomass from municipal solid waste fractions II: Grindability characteristics, higher heating value, pelletability and moisture adsorption. Biomass Bioenergy 2017, 106, 8–20. [Google Scholar] [CrossRef]
- Recari, J.; Berrueco, C.; Puy, N.; Alier, S.; Bartrolí, J.; Farriol, X. Torrefaction of a solid recovered fuel (SRF) to improve the fuel properties for gasification processes. Appl. Energy 2017, 203, 177–188. [Google Scholar] [CrossRef]
- Basu, P.; Kulshreshtha, A.; Acharya, B. An index for quantifying the degree of torrefaction. BioResources 2017, 12, 1749–1766. [Google Scholar] [CrossRef]
- Sarvaramini, A.; Assima, G.P.; Beaudoin, G.; Larachi, F. Biomass torrefaction and CO2 capture using mining wastes—A new approach for reducing greenhouse gas emissions of co-firing plants. Fuel 2014, 115, 749–757. [Google Scholar] [CrossRef]
- Shang, L.; Ahrenfeldt, J.; Holm, J.K.; Sanadi, A.R.; Barsberg, S.; Thomsen, T.; Stelte, W.; Henriksen, U.B. Changes of chemical and mechanical behavior of torrefied wheat straw. Biomass Bioenergy 2012, 40, 63–70. [Google Scholar] [CrossRef] [Green Version]
- Poudel, J.; Ohm, T.; Lee, S.; Oh, S.C. A study on torrefaction of sewage sludge to enhance solid fuel qualities. Waste Manag. 2015, 40, 112–118. [Google Scholar] [CrossRef] [PubMed]
- Sadaka, S.; Negi, S. Improvements of biomass physical and thermochemical characteristics via torrefaction process. Environ. Prog. Sustain. Energy 2009, 28, 427–434. [Google Scholar] [CrossRef]
- Yang, Z.; Sarkar, M.; Kumar, A.; Tumuluru, J.S.; Huhnke, R.L. Effects of torrefaction and densification on switchgrass pyrolysis products. Bioresour. Technol. 2014, 174, 266–273. [Google Scholar] [CrossRef] [PubMed]
- Boateng, A.; Mullen, C. Fast pyrolysis of biomass thermally pretreated by torrefaction. J. Anal. Appl. Pyrolysis 2013, 100, 95–102. [Google Scholar] [CrossRef]
- Bates, R.B.; Ghoniem, A.F. Biomass torrefaction: Modeling of volatile and solid product evolution kinetics. Bioresour. Technol. 2012, 124, 460–469. [Google Scholar] [CrossRef] [PubMed]
- Park, J.; Meng, J.; Lim, K.H.; Rojas, O.J.; Park, S. Transformation of lignocellulosic biomass during torrefaction. J. Anal. Appl. Pyrolysis 2013, 100, 199–206. [Google Scholar] [CrossRef]
- Sarkar, M.; Kumar, A.; Tumuluru, J.S.; Patil, K.N.; Bellmer, D.D. Gasification performance of switchgrass pretreated with torrefaction and densification. Appl. Energy 2014, 127, 194–201. [Google Scholar] [CrossRef]
- Tumuluru, J.S. Effect of Deep Drying and Torrefaction Temperature on Proximate, Ultimate Composition, and Heating Value of 2-mm Lodgepole Pine (Pinus contorta) Grind. Bioengineering 2016, 3, 16. [Google Scholar] [CrossRef] [PubMed]
- White, R.H.; Dietenberger, M. Wood Products: Thermal Degradation and Fire; Elsevier: Amsterdam, The Netherlands, 2001. [Google Scholar]
- Medic, D.; Darr, M.; Shah, A.; Potter, B.; Zimmerman, J. Effects of torrefaction process parameters on biomass feedstock upgrading. Fuel 2012, 91, 147–154. [Google Scholar] [CrossRef]
- Tumuluru, J.S.; Boardman, R.D.; Wright, C.T.; Hess, J.R. Some chemical compositional changes in miscanthus and white oak sawdust samples during torrefaction. Energies 2012, 5, 3928–3947. [Google Scholar] [CrossRef]
- Kotas, T.J. The Exergy Method of Thermal Plant Analysis; Krieger Publishing Company: Boston, MA, USA, 1995. [Google Scholar]
- Nhuchhen, D.R. Studies on Advanced Means of Biomass Torrefaction. Ph.D. Thesis, Dalhousie University, Halifax, NS, Canada, 2016. [Google Scholar]
- Cordero, T.; Marquez, F.; Rodriguez-Mirasol, J.; Rodriguez, J.J. Predicting heating values of lignocellulosics and carbonaceous materials from proximate analysis. Fuel 2001, 80, 1567–1571. [Google Scholar] [CrossRef]
- Friedl, A.; Padouvas, E.; Rotter, H.; Varmuza, K. Prediction of heating values of biomass fuel from elemental composition. Anal. Chim. Acta 2005, 544, 191–198. [Google Scholar] [CrossRef]
Figure 1.
Typical mass and energy balance of the torrefaction process (E: energy unit and M: mass unit).
Figure 1.
Typical mass and energy balance of the torrefaction process (E: energy unit and M: mass unit).
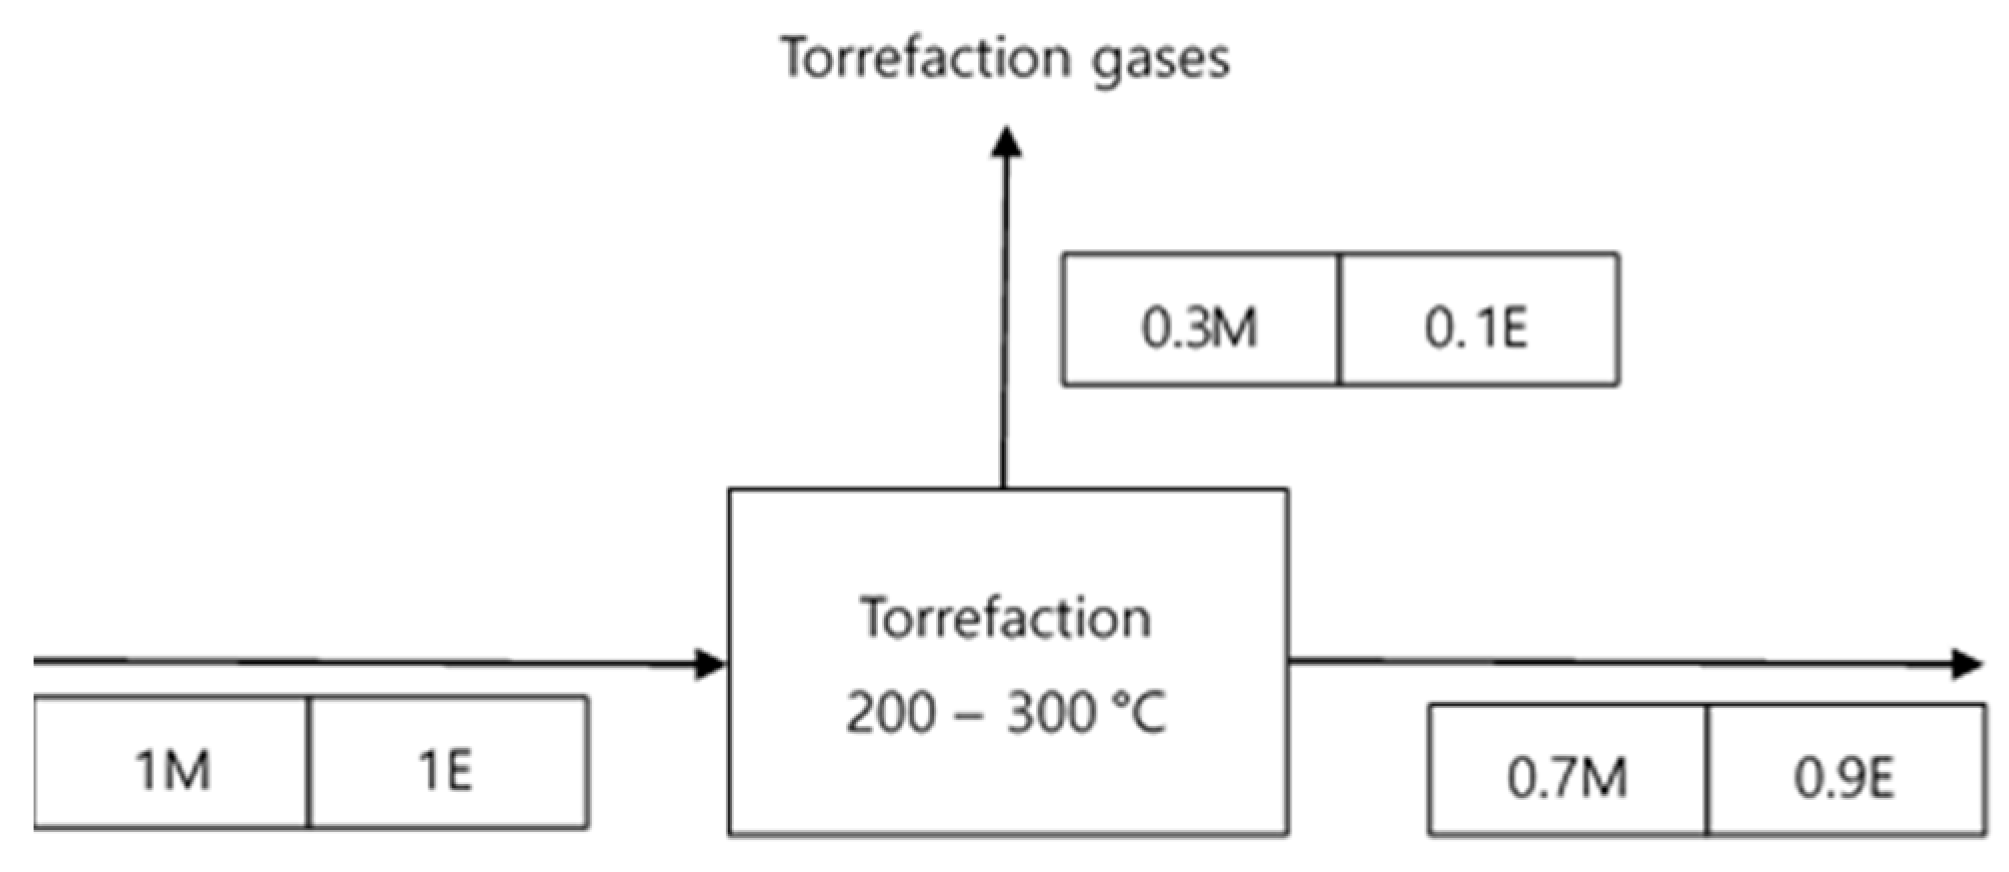
Figure 2.
Schematic diagram of the fluidized bed used in this study.

Figure 3.
Thermogravimetric Analysis-Differential Thermal Analysis (TG-DTA) analysis of sewage sludge in a nitrogen atmosphere as a function of the torrefaction temperature.
Figure 3.
Thermogravimetric Analysis-Differential Thermal Analysis (TG-DTA) analysis of sewage sludge in a nitrogen atmosphere as a function of the torrefaction temperature.

Figure 4.
Degree of torrefaction of torrefied samples as a function of the torrefaction residence time.
Figure 4.
Degree of torrefaction of torrefied samples as a function of the torrefaction residence time.

Figure 5.
(a) Volatile fraction (%); (b) fixed carbon (%); and (c) ash (%) as a function of the torrefaction residence time.
Figure 5.
(a) Volatile fraction (%); (b) fixed carbon (%); and (c) ash (%) as a function of the torrefaction residence time.
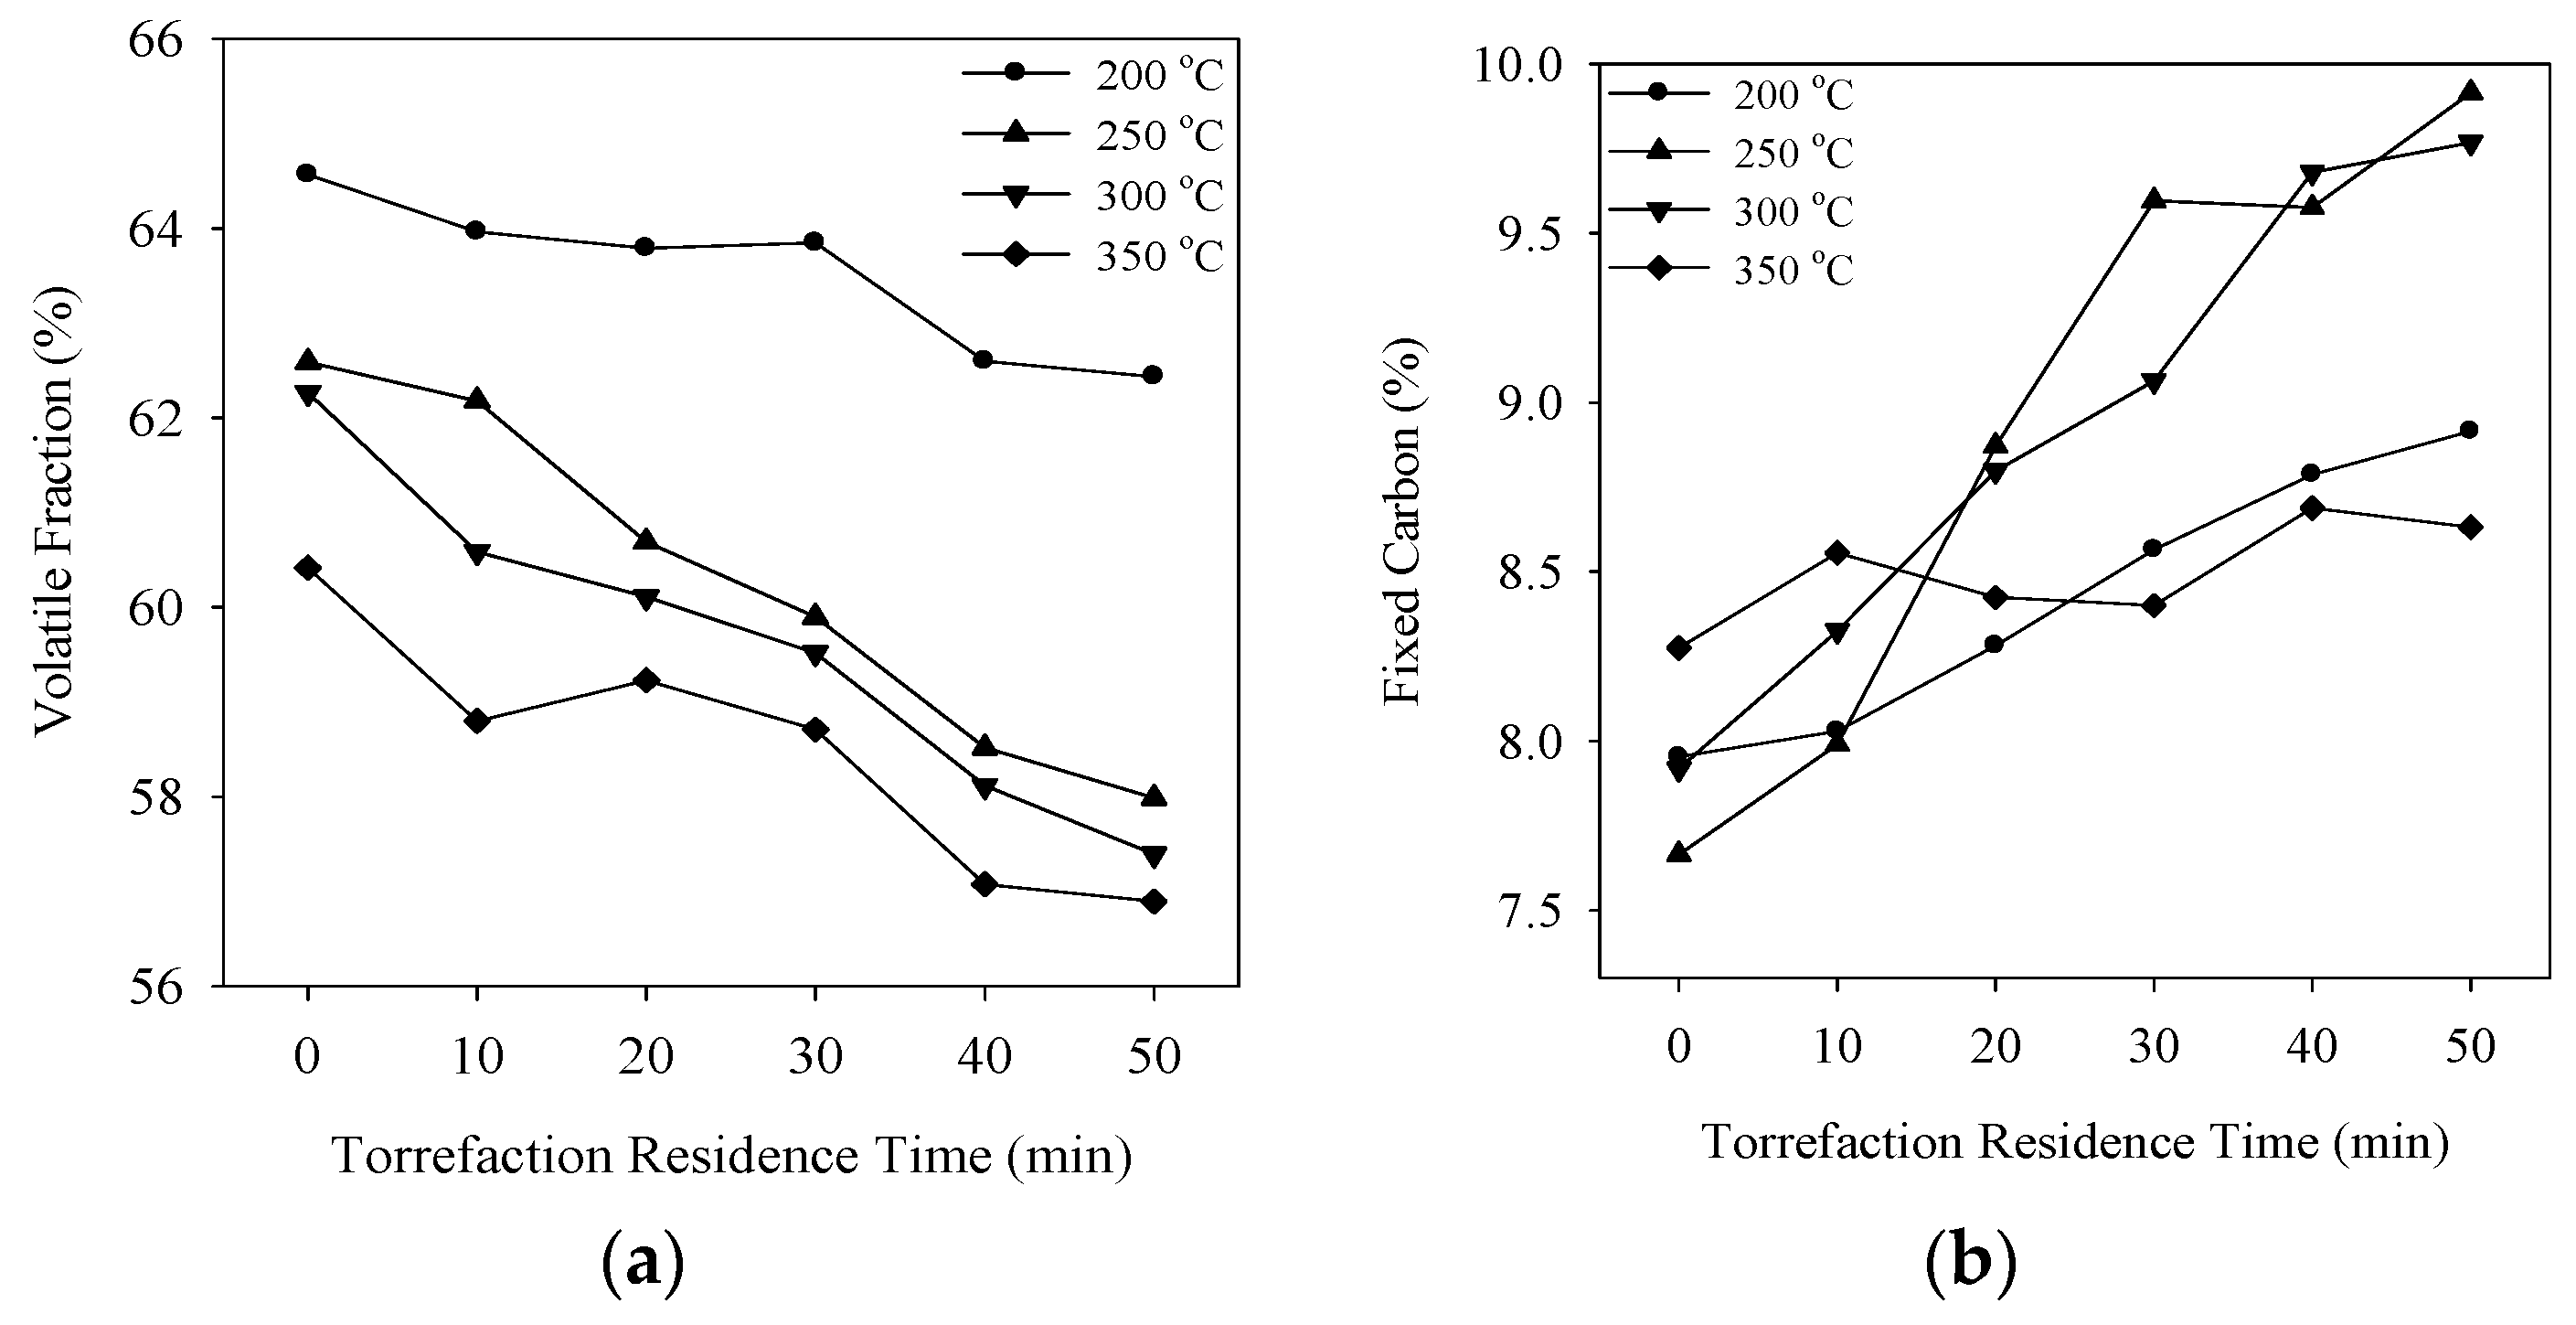

Figure 6.
Changes of (a) H/C and (b) O/C molar ratios as a function of the torrefaction residence time.
Figure 6.
Changes of (a) H/C and (b) O/C molar ratios as a function of the torrefaction residence time.

Figure 7.
Gas analysis from torrefaction of sewage sludge as a function of the temperature.
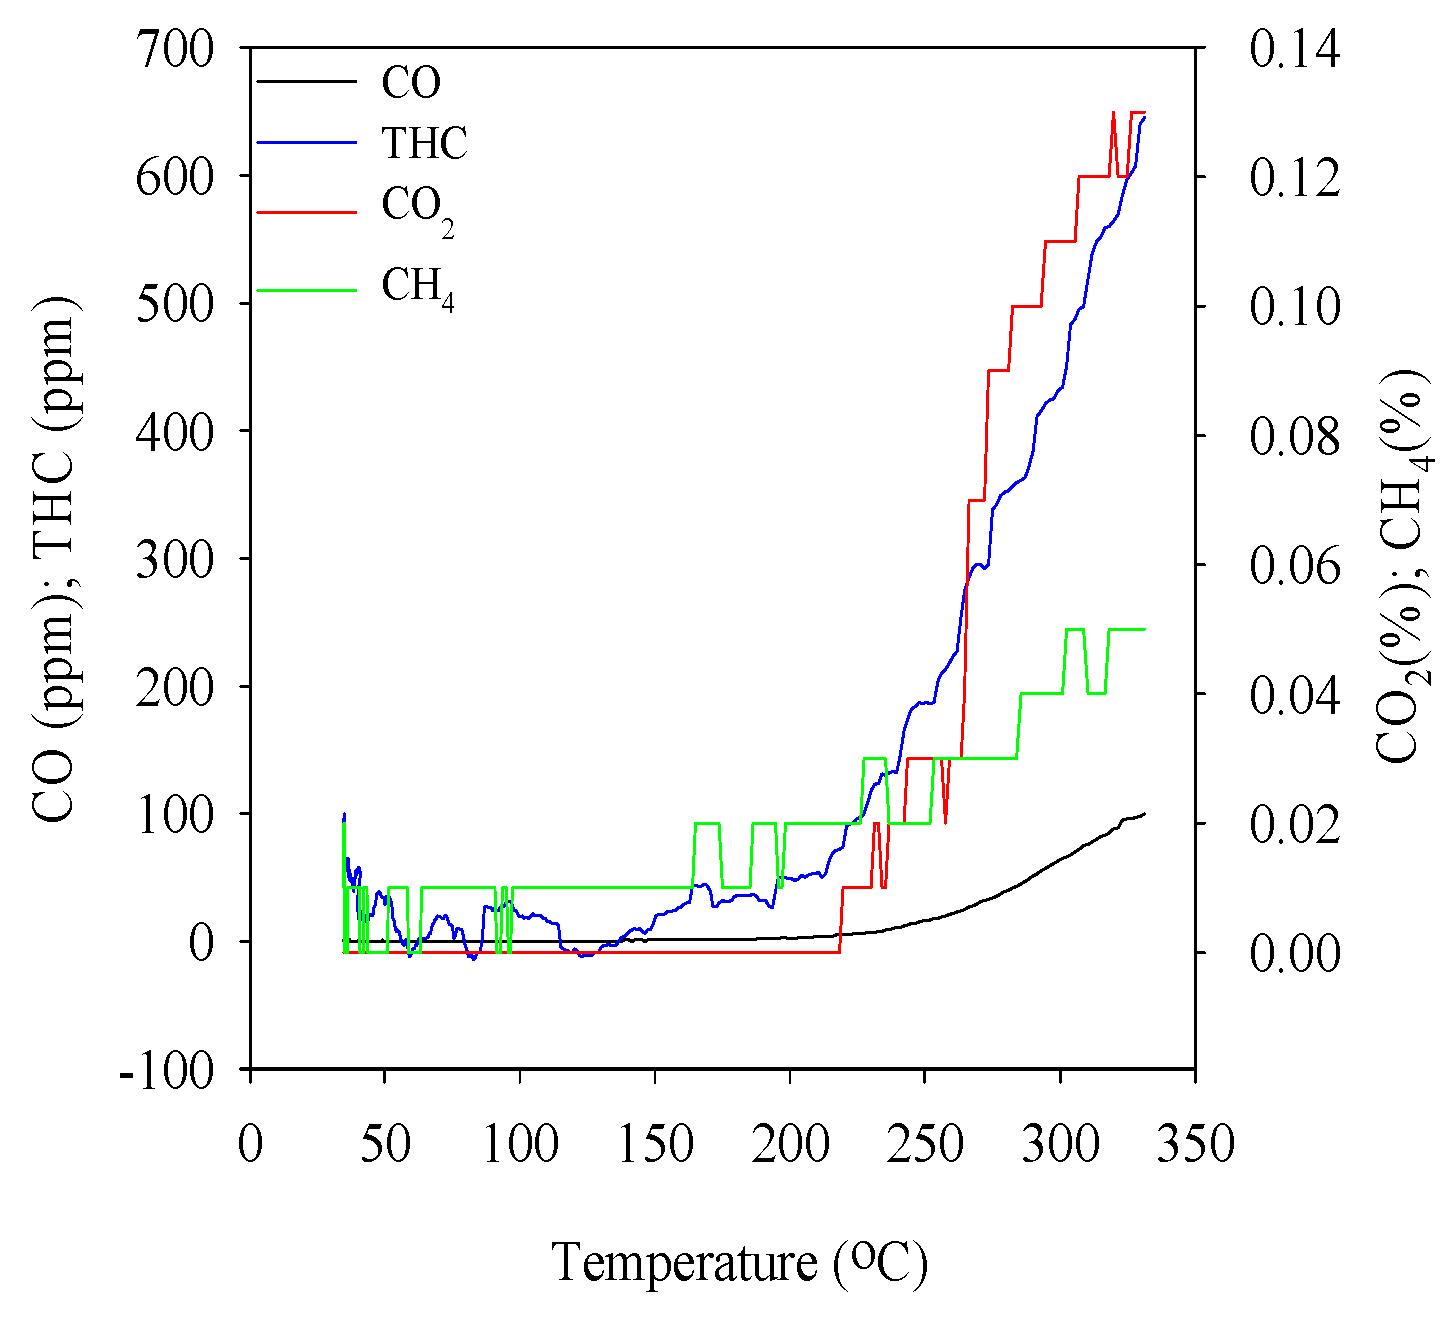
Figure 8.
Chemical exergy of sewage sludge as a function of the torrefaction residence time.


Table 1.
Properties of raw sewage sludge.
| Elemental Analysis (wt %) * | C | 37.82 |
| H | 5.82 | |
| N | 4.14 | |
| O | 25.12 | |
| S | 1.44 | |
| Others | 25.66 | |
| Proximate Analysis (wt %) ** | Moisture (%) | 80.12 |
| Volatile Content (%) | 12.87 | |
| Ash (%) | 5.50 | |
| Fixed Carbon (%) | 1.51 | |
| HHV (MJ/kg) * | 15.81 | |
* Dry Basis; ** Wet Basis, Others: inorganic components.
Table 2.
TI in different regimes.
| Torrefaction Regimes | Temperature (°C) | TI [43] | TI (This Study) |
|---|---|---|---|
| Light | 200–235 | 0.93–0.95 | 0.96–0.99 |
| Medium | 235–275 | 0.95–0.97 | 0.97–1.02 |
| Severe | 275–300 | 0.97–1.0 | 0.97–1.0 |
| 350 | 1–0.96 |
Table 3.
Validating the predicted higher heating value (HHV) with the experimental HHV.
| Torrefaction Residence Time (min) | 200 °C | 250 °C | 300 °C | 350 °C | ||||||||||||||||
|---|---|---|---|---|---|---|---|---|---|---|---|---|---|---|---|---|---|---|---|---|
| HHV1 | HHV2 | HHV3 | HHV4 | HHV * | HHV1 | HHV2 | HHV3 | HHV4 | HHV * | HHV1 | HHV2 | HHV3 | HHV4 | HHV * | HHV1 | HHV2 | HHV3 | HHV4 | HHV * | |
| 0 | 13.85 | 4.53 | 14.72 | 16.02 | 15.98 | 13.40 | 5.24 | 14.25 | 15.94 | 16.06 | 13.44 | 5.32 | 14.29 | 15.95 | 16.12 | 13.25 | 5.38 | 14.07 | 15.89 | 16.61 |
| 10 | 13.77 | 5.35 | 14.64 | 15.97 | 16.05 | 13.45 | 5.19 | 14.29 | 15.91 | 16.35 | 13.30 | 5.89 | 14.12 | 15.97 | 16.54 | 13.07 | 6.07 | 13.87 | 16.21 | 16.53 |
| 20 | 13.83 | 4.92 | 14.70 | 15.99 | 16.20 | 13.51 | 5.68 | 14.33 | 15.99 | 16.53 | 13.38 | 5.48 | 14.20 | 15.91 | 16.64 | 13.10 | 6.27 | 13.90 | 16.18 | 16.29 |
| 30 | 13.94 | 5.03 | 14.81 | 15.90 | 16.27 | 13.63 | 4.99 | 14.44 | 15.94 | 16.76 | 13.38 | 5.71 | 14.18 | 16.17 | 16.60 | 13.00 | 6.18 | 13.80 | 16.29 | 16.18 |
| 40 | 13.80 | 5.11 | 14.65 | 16.01 | 16.38 | 13.39 | 5.58 | 14.18 | 15.99 | 16.88 | 13.36 | 5.55 | 14.14 | 16.18 | 16.62 | 12.83 | 7.16 | 13.60 | 16.56 | 16.10 |
| 50 | 13.82 | 4.27 | 14.67 | 15.91 | 16.38 | 13.42 | 5.06 | 14.20 | 16.07 | 16.90 | 13.26 | 5.92 | 14.04 | 16.35 | 16.50 | 12.78 | 7.26 | 13.55 | 16.58 | 15.97 |
HHV * = Experimental HHV of this study; all units are in MJ/kg.
© 2018 by the authors. Licensee MDPI, Basel, Switzerland. This article is an open access article distributed under the terms and conditions of the Creative Commons Attribution (CC BY) license (http://creativecommons.org/licenses/by/4.0/).
Share and Cite
MDPI and ACS Style
Karki, S.; Poudel, J.; Oh, S.C. Thermal Pre-Treatment of Sewage Sludge in a Lab-Scale Fluidized Bed for Enhancing Its Solid Fuel Properties. Appl. Sci. 2018, 8, 183. https://doi.org/10.3390/app8020183
AMA Style
Karki S, Poudel J, Oh SC. Thermal Pre-Treatment of Sewage Sludge in a Lab-Scale Fluidized Bed for Enhancing Its Solid Fuel Properties. Applied Sciences. 2018; 8(2):183. https://doi.org/10.3390/app8020183
Chicago/Turabian StyleKarki, Sujeeta, Jeeban Poudel, and Sea Cheon Oh. 2018. "Thermal Pre-Treatment of Sewage Sludge in a Lab-Scale Fluidized Bed for Enhancing Its Solid Fuel Properties" Applied Sciences 8, no. 2: 183. https://doi.org/10.3390/app8020183
Note that from the first issue of 2016, this journal uses article numbers instead of page numbers. See further details here.