Article

An Optimal Domestic Electric Vehicle Charging Strategy for Reducing Network Transmission Loss While Taking Seasonal Factors into Consideration

1
Key Laboratory of Smart Grid of Ministry of Education, Tianjin University, Tianjin 300072, China
2
China Electric Power Research Institute, Beijing 100192, China
3
Department of Electrical Engineering, Northeast Electric Power University, Jilin 132012, China
*
Author to whom correspondence should be addressed.
Appl. Sci. 2018, 8(2), 191; https://doi.org/10.3390/app8020191
Submission received: 11 January 2018 / Revised: 24 January 2018 / Accepted: 25 January 2018 / Published: 26 January 2018
(This article belongs to the Special Issue Electric Vehicle Charging)

Abstract

:
With the rapid growth of domestic electric vehicle charging loads, the peak-valley gap and power fluctuation rate of power systems increase sharply, which can lead to the increase of network losses and energy efficiency reduction. This paper tries to regulate network loads and reduce power system transmission loss by optimizing domestic electric vehicle charging loads. In this paper, a domestic electric vehicle charging loads model is first developed by analyzing the key factors that can affect users’ charging behavior. Subsequently, the Monte Carlo method is proposed to simulate the power consumption of a cluster of domestic electric vehicles. After that, an optimal electric vehicle charging strategy based on the 0-1 integer programming is presented to regulate network daily loads. Finally, by taking the IEEE33 distributed power system as an example, this paper tries to verify the efficacy of the proposed optimal charging strategy and the necessity for considering seasonal factors when scheduling electric vehicle charging loads. Simulation results show that the proposed 0-1 integer programming method does have good performance in reducing the network peak-valley gap, voltage fluctuation rate, and transmission loss. Moreover, it has some potential to further reduce power system transmission loss when seasonal factors are considered.

1. Introduction

The increasing concerns about greenhouse gas emissions and the energy crisis have accelerated the pace of transportation electrification. Due to the fact that domestic electric vehicles have many advantages, such as higher efficiency in energy utilization, less direct pollution, and more environmental friendliness, they have successfully attracted more attention from governments and institutions around the world [1]. However, with the access of electric vehicles to the grid, extra-large and undesirable peak demands may emerge in distributed power systems because of the huge amount of electrical energy consumed in charging electric vehicles and domestic users’ inappropriate charging behavior [2].
According to the National Household Travel Survey (NHTS), domestic users’ charging behavior is closely related to the rules of the owners’ trip. As a typical example, the 2009 NHTS is widely used in many studies to model domestic users’ electric vehicle driving and charging patterns through developing users’ travelling probability density functions. According to recent studies, different kinds of assumptions have been made by scholars to simplify domestic users’ driving patterns. For example, it is assumed that electric vehicles have pre-specified arrival time in [3], and in [4], a rigid electric vehicle charging schedule is presented. However, these assumptions can lead to inaccuracy of evaluation by ignoring the stochastic nature of driving patterns. To improve the accuracy of evaluation, Qian K et al. use the probability method to model the arrival time, departure time, and daily mileage in [5,6,7]. In addition, a method to estimate the electric vehicle integration patterns in distributed power systems considering their dispersion in different locations is proposed in [8]. Moreover, it is stated in [9] that the Monte Carlo Simulation is an efficient tool to model electrical characteristics of power systems, which makes it possible to use the Monte Carlo Simulation method to model network total electric vehicle charging loads. Even though the accuracy of evaluation can be improved by the aforementioned literature, many factors still have not been fully considered when modelling users’ load charging behavior. For instance, electric vehicle charging loads are sensitive to seasons, while seasonal factors have not been taken into consideration in recent studies. To build a more accurate model of electric vehicle charging loads, it is necessary to analyze the key factors that can affect users’ charging behavior.
With the rapid growth of electric vehicle charging loads, uncoordinated and random charging activities can increase the burden for distributed systems and may cause network voltage fluctuation, efficiency reduction, and so on [10]. As shown in the 2009 NHTS, numerous electric vehicle owners finish their last trips within a narrow time period, and most of them prefer to charge their vehicles shortly after the last trip; these inappropriate charging activities have negative effects on network operation. Therefore, it is urgent to propose an optimal electric vehicle charging strategy for regulating electric vehicle charging loads, because the proposed strategy can play an important role in load shifting, energy cost saving, and improving energy efficiency for distributed power networks [11,12,13]. As two of the most important objectives, reducing system losses and voltage fluctuation have been studied frequently in literature, with the aim of developing an electric vehicle charging strategy. In [14,15], optimal load charging strategies are proposed for minimizing system losses and improving voltage profiles based on the real-time smart load management (RT-SLM) control strategy. Sensitivity-based and optimization-based methods are proposed for mitigating voltage fluctuation in the presence of plug-in hybrid electric vehicles in [16]. However, with the increase of domestic electric vehicles, the complexity of the aforementioned methods can be significantly increased. In this context, it is necessary to develop a computational friendly strategy. Considering that electric vehicles are charged by constant power most of time, the 0-1 integer programming (0 for not charging and 1 for charging) method can be used to accelerate the computation time for a network with a large number of electric vehicles [17].
Based on the aforementioned literature, this paper first builds the domestic electric vehicle charging loads model while taking seasonal factors into account, and then uses the Monte Carlo method to simulate the charging loads of a cluster of domestic electric vehicles in four seasons. After that, this paper proposes an optimal charging strategy which is based on 0-1 integer programming to minimize the variance of daily charging loads in distributed power systems. The main contributions of this paper can be summarized as follows:
(1)
Key factors (users’ driving habits, users’ preference of charging vehicles, and ambient temperature, etc.) that can affect domestic users’ charging behavior have been fully analyzed when modelling a domestic electric vehicle charging loads model. It is worth noting that for the first time in the context of domestic electric vehicles, seasonal factors are considered to model the electrical charging loads of a single domestic electric vehicle.
(2)
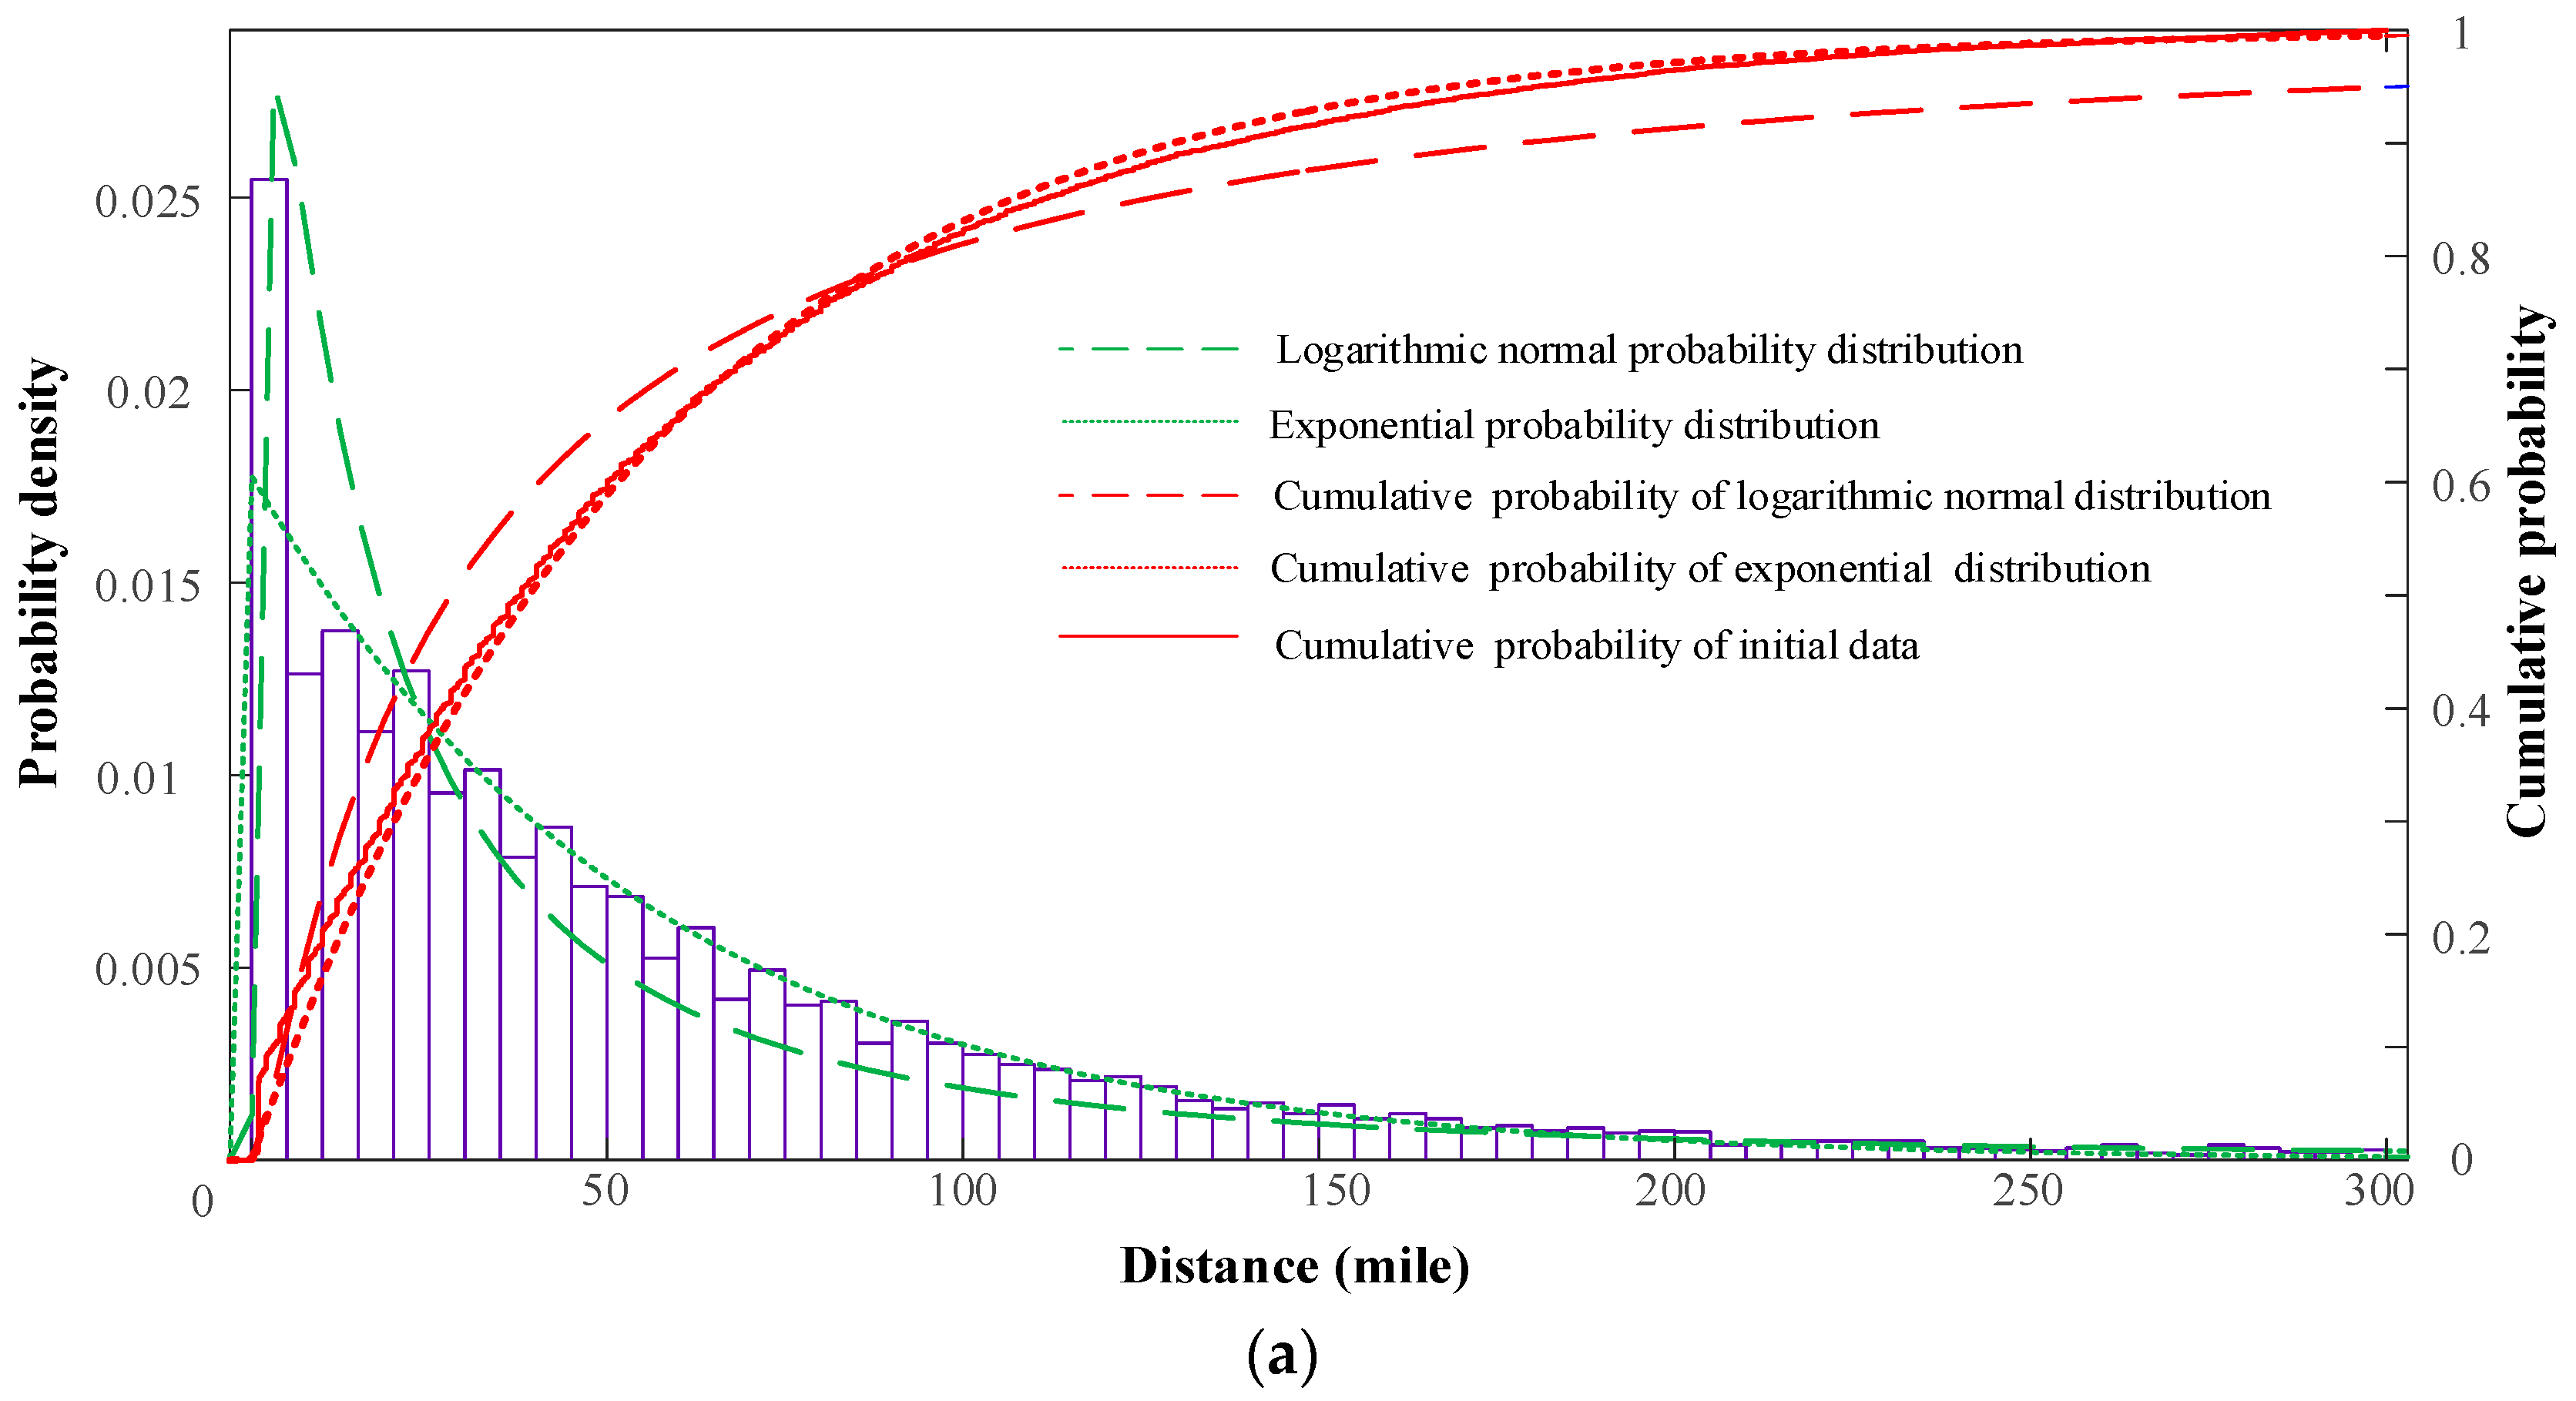
It is the first time that the exponential distribution is used to model the domestic users’ daily travelling distance, and compared with the logarithmic normal distribution, the exponential distribution model is more suitable and accurate to reveal domestic users’ daily travelling distance.
(3)
The 0-1 integer programming method is proposed to regulate electric vehicle charging loads and reduce distributed power system transmission loss. By introducing binary states to domestic electric vehicle charging loads, calculation complexity can be significantly reduced, which makes the proposed strategy more real-world feasible.

2. Domestic Electric Vehicle Charging Loads Modelling

As mentioned in the previous section, optimizing domestic electric vehicle charging strategy plays an important role in load shifting, energy cost saving, and improving energy efficiency for distributed networks. However, the use of domestic electrical vehicles has great uncertainty and flexibility compared to other domestic electric appliances. In addition, there are many factors that can affect the charging behavior of domestic electric vehicles, for example, users’ driving habits, users’ preference of charging vehicles, and ambient temperature, etc. Therefore, in order to develop an optimal electric vehicle charging strategy, it is important to analyze the key factors that can affect the charging behavior of domestic electric vehicles.

2.1. Users’ Driving Habits and Preference of Charging Electric Vehicles

As two critical parameters, users’ daily return time from the last trip and daily travelling distance per vehicle need to be analyzed carefully, because they are directly relevant to users’ driving habits and preference of charging electric vehicles. Figure 1 shows the statistical data of the probability distribution of domestic users’ daily return time from the last trip, which came from the NHTS and was published by the Department of Transportation of U.S. [18].
Figure 1a reveals that the probability distribution of domestic users’ daily return time is similar to the normal distribution. Therefore, the probability density function of domestic users’ daily return time from the last trip can be written as follows:
f e n d ( t r ) = { 1 σ e n d 2 π e [ ( t r + 24 u e n d ) 2 2 σ e n d 2 ] 0 < t r u e n d 12 1 σ e n d 2 π e [ ( t r u e n d ) 2 2 σ e n d 2 ] u e n d 12 < t r 24
In (1), fend(tr) is the probability density function of daily return time from the last trip, σend represents the standard deviation, μend is the mathematical expectation, and tr is daily return time from the last trip. In addition, according to Figure 1b, users’ daily return time from the last trip varies greatly according to the seasons. It is shown that compared to the summer, domestic users finish their last trips much earlier in winter. Therefore, in this paper, it is the first time that seasonal factors are taken into consideration when modelling the probability density function of domestic users’ daily return time from the last trip. By implementing MATLAB (R2016b, MathWorks company, Nettie, MA, USA) Simulation, the standard deviations and mathematical expectations of users’ return time from the last trip in different seasons can be acquired. Table 1 summarizes the simulation results of these two parameters in different seasons.
As another important factor that can affect users’ driving habits and preference of charging electric vehicles, user’s daily travelling distance needs to be analyzed. Figure 2 shows the probability distribution of domestic users’ daily travelling distance per vehicle (in mile).
Figure 2a reveals that both of the probability distribution and the cumulative probability distribution of domestic users’ daily travelling distance are similar to exponential distribution compared with that of logarithmic normal probability distribution. Therefore, in this paper, it is the first time that exponential distribution is used to represent the original data which was published by the Department of Transportation of U.S.
In Figure 2b, simulation intervals of daily travelling distance increases from 5 to 10 miles, and simulation results show that the error is significantly reduced when applying exponential distribution to represent the original data. This is because stochastic volatility can be reduced if simulation intervals are increased. In addition, Figure 2b shows that simulation results are accurate by implementing exponential distribution to represent the probability distribution of travelling distance for different seasons. Therefore, in this paper, the exponential distribution model is used to represent the probability distribution of daily travelling distance. Equation (2) is the mathematical expression of the probability density function of daily travelling distance.
f ( s ) = 1 μ m i l e e s μ m i l e
In (2), f(s) is the probability density function of daily travelling distance, s is daily travelling distance, and μmile is the mathematical expectation which equals 56.22 miles.

2.2. Ambient Temperature

Ambient temperature, which varies significantly according to the seasons, has a strong impact on domestic users’ charging behavior. This is because users prefer to switch on air conditioners in summer and heaters in winter to keep vehicle temperature within a comfortable range [19]. Therefore, average daily load curves of electric vehicles are different in different seasons. Figure 3 shows the average daily load curves of 2000 electric vehicles in different seasons [20].
Figure 3 reveals that the electric vehicle charging loads are lowest in spring and largest in summer. For the convenience of comparative analysis, electric vehicle charging loads in different seasons need to be standardized. Given that the electric vehicle charging loads are lowest in spring, in this paper, the electric vehicle charging loads in spring are taken as the base to standardize the charging loads in other seasons. The standardization results are shown in Table 2.
Table 2 indicates that the electric vehicle charging loads are almost equal in spring and autumn; however, it can increase about 30% and 19% in summer and winter, respectively. Therefore, ambient temperature has a great influence on the electric vehicle charging load, which can directly affect the charging behavior of domestic users.

2.3. Domestic Users’ Electric Vehicle Charging Loads Modelling

Without an optimal electric vehicle charging strategy, electric vehicles are normally charged shortly after finishing their last trips, and stop charging when batteries are fully charged. Therefore, the charging loads of electric vehicles at time t can be written as:
P e v ( t ) = N P c p t
where N is the number of electric vehicle, Pc is the electrical charging power of a single electric vehicle (in kW), and pt is the probability of an electric vehicle under charging condition at time t, which can be expressed as:
p t = 0 T m a x 0 t t e v f t e v f e n d d t d t e v + 0 T m a x 0 t + 24 t e v f t e v f e n d d t d t e v
where fend and ftev are the probability density functions of domestic users’ daily return time from the last trip and domestic users’ electric vehicle charging period, respectively and Tmax is the upper limit of charging period tev. In Equation (4), charging period ftev can be expressed as:
t e v = k s c P c
where k is a seasonal coefficient, s is the daily travelling distance, and c is electric vehicle energy consumption per mile in spring. In this paper, the Nissan Leaf, whose battery capacity is 24 kWh and rated charging power is 3.3 kW [21], is used as an example to model total electrical demand of electric vehicles. As mentioned in Section 1, the total daily charging loads vary greatly according to the number of electric vehicles within a distributed power network, and the Monte Carlo Simulation is an efficient tool to model electrical characteristics of power systems. Therefore, the Monte Carlo method is used to model total electrical demand of electric vehicles in this paper. Figure 4 is an example of the Monte Carlo Simulation results of the average daily charging loads of 2000 electric vehicles in different seasons.
In this section, key factors that can affect domestic users’ charging behavior have been studied, and after analyzing these factors, the Monte Carlo Simulation is used to model daily charging loads curves of electric vehicles in different seasons. In the next section, an electric vehicle optimal charging control strategy is proposed to regulate charging loads and to reduce power system losses.

3. Electric Vehicle Charging Loads Control Strategy and the Transmission Loss Optimization

As is reported in [3], power system efficiency will decrease with the increase of the fluctuation of feeder loads. Therefore, to reduce power system losses, it is necessary to regulate average daily electric vehicle charging loads in different seasons.

3.1. 0-1 Integer Programming for Regulating Electric Vehicle Charging Loads

There are only two states for vehicles: charging or not charging. In this case, the binary states of vehicles can be represented as 1 for charging and 0 for not charging. Under this condition, the complexity of electric vehicle charging loads optimization can be reduced, if the 0-1 Integer Programming Model is developed to regulate charging loads.
As demonstrated at the beginning of this section, to reduce system losses, the fluctuation of feeder loads should be reduced. By discretizing charging loads into m periods, this paper aims to minimize the variance of daily charging loads based on the 0-1 Integer Programming. Therefore, the mathematical expression of the proposed problem can be expressed as:
f 1 = m i n 1 m { j = 1 m ( L ( j ) + i = 1 N S i j P c P a v ) 2 }
where
  P a v = j = 1 m ( L ( j ) + i = 1 N S i j P c ) m
In (6) and (7), f1 is the objective function; L(j) is the total electrical demand of the power system without considering the electric vehicle charging loads at time period j, j = 1, 2, 3…m; Sij is the binary charging states of electric vehicle i at time period j; and Pav is the average electrical demand of a power system. Given that the proposed model only shifts loads, Pav is a constant for a given power system. Therefore, the objective function can be simplified as:
f s = m i n { j = 1 m ( L ( j ) + i = 1 N S i j P c ) 2 }
The aforementioned 0-1 Integer Programming Model is a quadratic integer programming problem. For this kind of problem, with the increase of samples (electric vehicles connected to the power grid), the number of decision variables and the complexity of calculation are increased. To accelerate computation for a large number of electric vehicles, an equivalent linearization method to linearize the objective function is proposed in [22,23], which significantly reduces computation complexity. By taking this same method, the total demand of power system at time period j can be expressed as:
( L ( j ) + i = 1 N S i j P c ) 2 = n = 1 S α n ( j ) δ n ( j )
In Equation (9), S is the segment number; αn (j) is the slope of the load of the nth segment at time period j after linearization; and δn (j) is the value of the load of the nth segment at time period j after linearization. Therefore, the linearized equivalent simplified objective function of the proposed model can be written as:
f = m i n j = 1 m n = 1 S α n ( j ) δ n ( j )
To develop the aforementioned model, there are four assumptions that need to be highlighted:
(1) Electric vehicle charging power
There are two processes of electric vehicle charging, which are the constant power charging state and the charging power linearly decrease state. The constant power charging state is the main process of electric vehicle charging, and this process takes a relatively long time and has a relatively high efficiency compared with the charging power linearly decrease state. In addition, with the development of electric vehicle charging technologies, the charging power linearly decrease state tends to disappear [24]. Therefore, in this paper, it is assumed that electric vehicles are charged with constant power.
(2) Electric vehicle charging time
For most domestic users, it is more preferable to charge electric vehicles shortly after the last trip of the day, although a few of them may charge their vehicles when they are at the office. In this paper, it is assumed that domestic users’ start charging their vehicles shortly after finishing their last trip and must stop charging vehicles before going to work. Based on this assumption, electric vehicle charging time can be expressed as:
t r t t s
In (11), tr is the daily return time from the last trip and ts is the daily start time of the first trip.
(3) Electric vehicle battery state of charge (SOC)
To guarantee safe operation of the electric vehicle battery system and to meet domestic users’ travelling requirements, domestic electric vehicle battery SOC should be limited within a certain range:
S O C b = S O C s k s c C
S O C a = P c S i j Δ t C + S O C b
S O C E x p < S O C a < S O C F u l l
where SOCb and SOCa are the SOCs of the ith electric vehicle battery before and after charging, respectively; SOCs is the SOC of the ith electric vehicle battery before the trip starts; C is the capacity of the electric vehicle battery; SOCExp and SOCFull are the expected and the fully-charged SOCs of an electric vehicle battery, respectively and Δt is the discrete time, which is inversely proportional to the number of discretized charging loads periods m.
(4) Electric vehicle battery lifetime
As the lifetime of a battery can be seriously influenced by charging cycles, to increase the lifetime of a battery, it is preferable to reduce switching frequency when charging a battery [25]. In this paper, it is assumed that batteries for the electric vehicles need to be charged for at least one integer discrete time period (Δt) to avoid frequently changing charging states of batteries.

3.2. The Transmission Loss Optimization
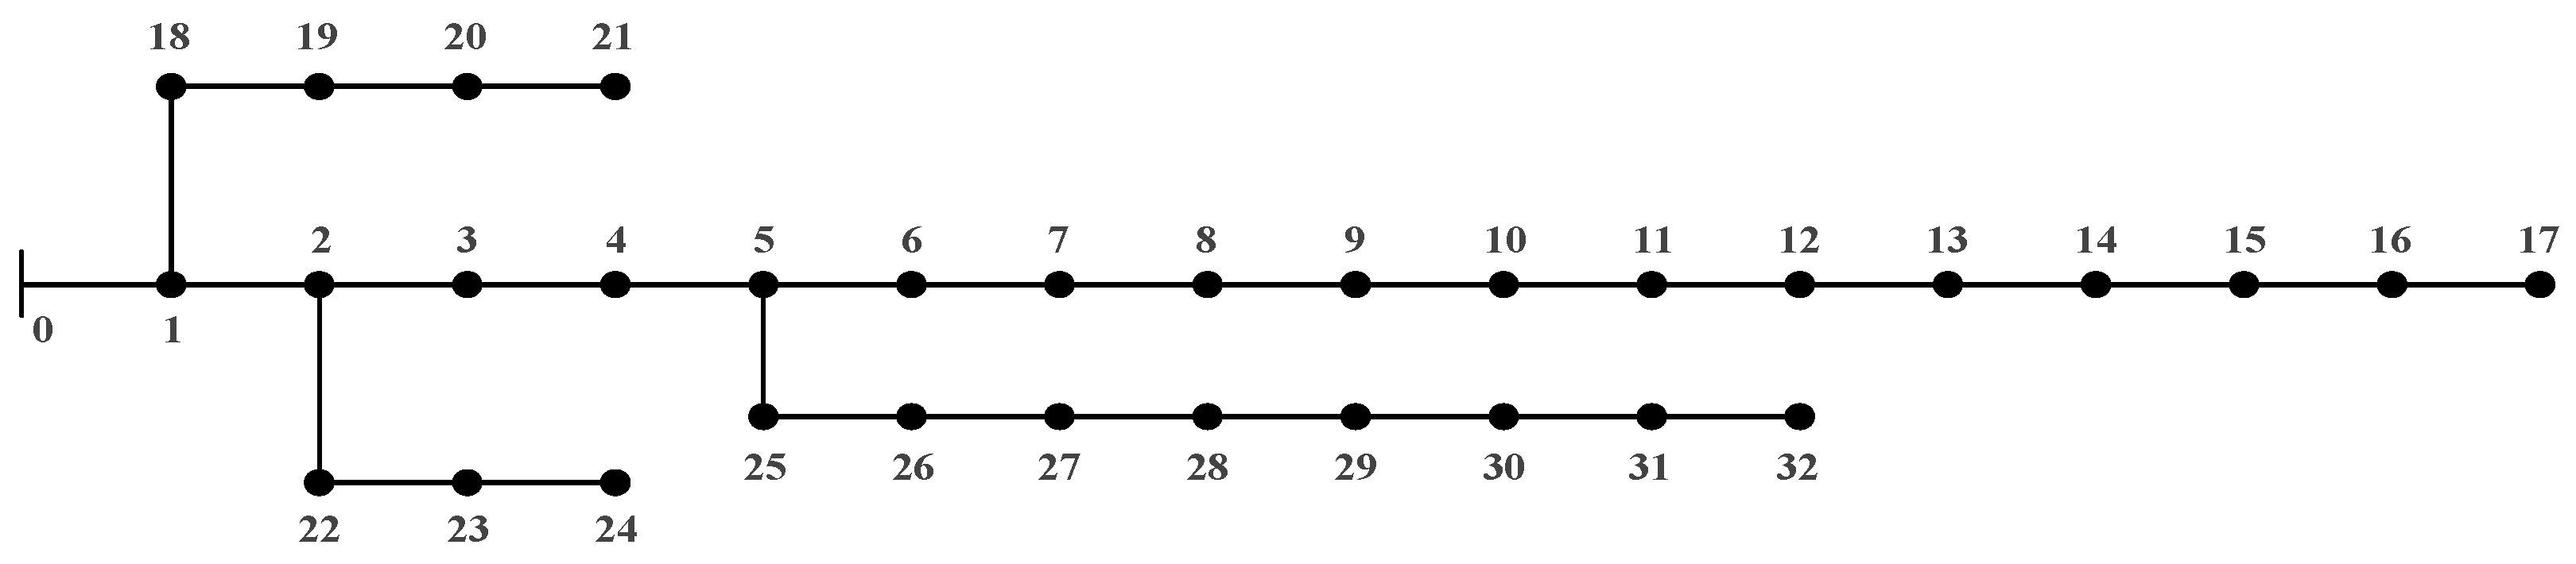
As proposed in [10], domestic users may increase power system losses by consuming power in an irregular way. In this part, a power system transmission loss model is developed to analyze the key factor that can affect transmission loss and to calculate system transmission loss.
The transmission loss is one of the most important parts of power system losses, and it is directly related to the resistance and the current of the transmission line. Equation (15) is the mathematical expression of the power system transmission loss.
E l o s s = t = 0 T r R i 2 ( t ) d t
where Eloss is the power system transmission loss, R is the resistance of the transmission line, Tr is the length of a day, and i(t) is the current of a transmission line at time period t. In addition, in Equation (15), the current of a transmission line at time period t is relevant to the total daily demands, the voltage of the power system, and the difference between the current at time period t and the daily average current, therefore, i(t) can be expressed as:
i ( t ) = E t o t a l U T r + Δ i ( t )
In (16), Etotal is the total daily demands of the power system; U is the voltage of the power system, and Δi(t) is the difference between the current at time period t and the daily average current. By combining Equations (15) and (16), the mathematical expression of the power system transmission loss can be modified as:
E l o s s = t = 0 T r R i 2 ( t ) d t = R E 2 t o t a l U 2 T r + 2 R E t o t a l U T r t = 0 T r [ Δ i ( t ) d t ] + R t = 0 T r Δ i 2 ( t ) d t
Given that the power system voltage U is nearly a constant, the first term in the right hand side of Equation (17) is a constant and the second term in the right hand side of Equation (17) is 0. Therefore, the transmission loss of a power system can be greatly affected by the fluctuation of the current. Figure 5 is the flow diagram showing how to optimize power system transmission loss and voltage fluctuation based on the electric vehicle 0-1 integer programming model while taking the key factors that can affect domestic users’ electric vehicle charging behavior into consideration.

4. Case Study

In this paper, an IEEE 33-node distributed power network is used as an example to calculate distributed power system transmission loss and voltage fluctuation by employing MATLAB simulation. Figure 6 is the structure of the IEEE 33-node distributed power network. The Node 0 is selected as the reference node because it is directly connected to the main grid. For this system, 12.66 kV is selected as the reference voltage and the maximum active load (ignoring the electric vehicle charging load) of this network is 3.72 MW. Figure 7 is the daily load curves of the given distributed power network in different seasons.
In this network, there are about 950 families, and the average demand of each family is 4 kW at peak demand time. Suppose that the penetration rate of electric vehicles is 30% in this system, thus, the total number of electric vehicles is 285 in this network. In addition, it is assumed that all electric vehicles are distributed evenly in all nodes to charge their battery. In the next section, simulation results of the optimal control strategy proposed in Section 3, based on this given case, will be given to show the effectiveness of the proposed optimal strategy.

5. Results and Analysis

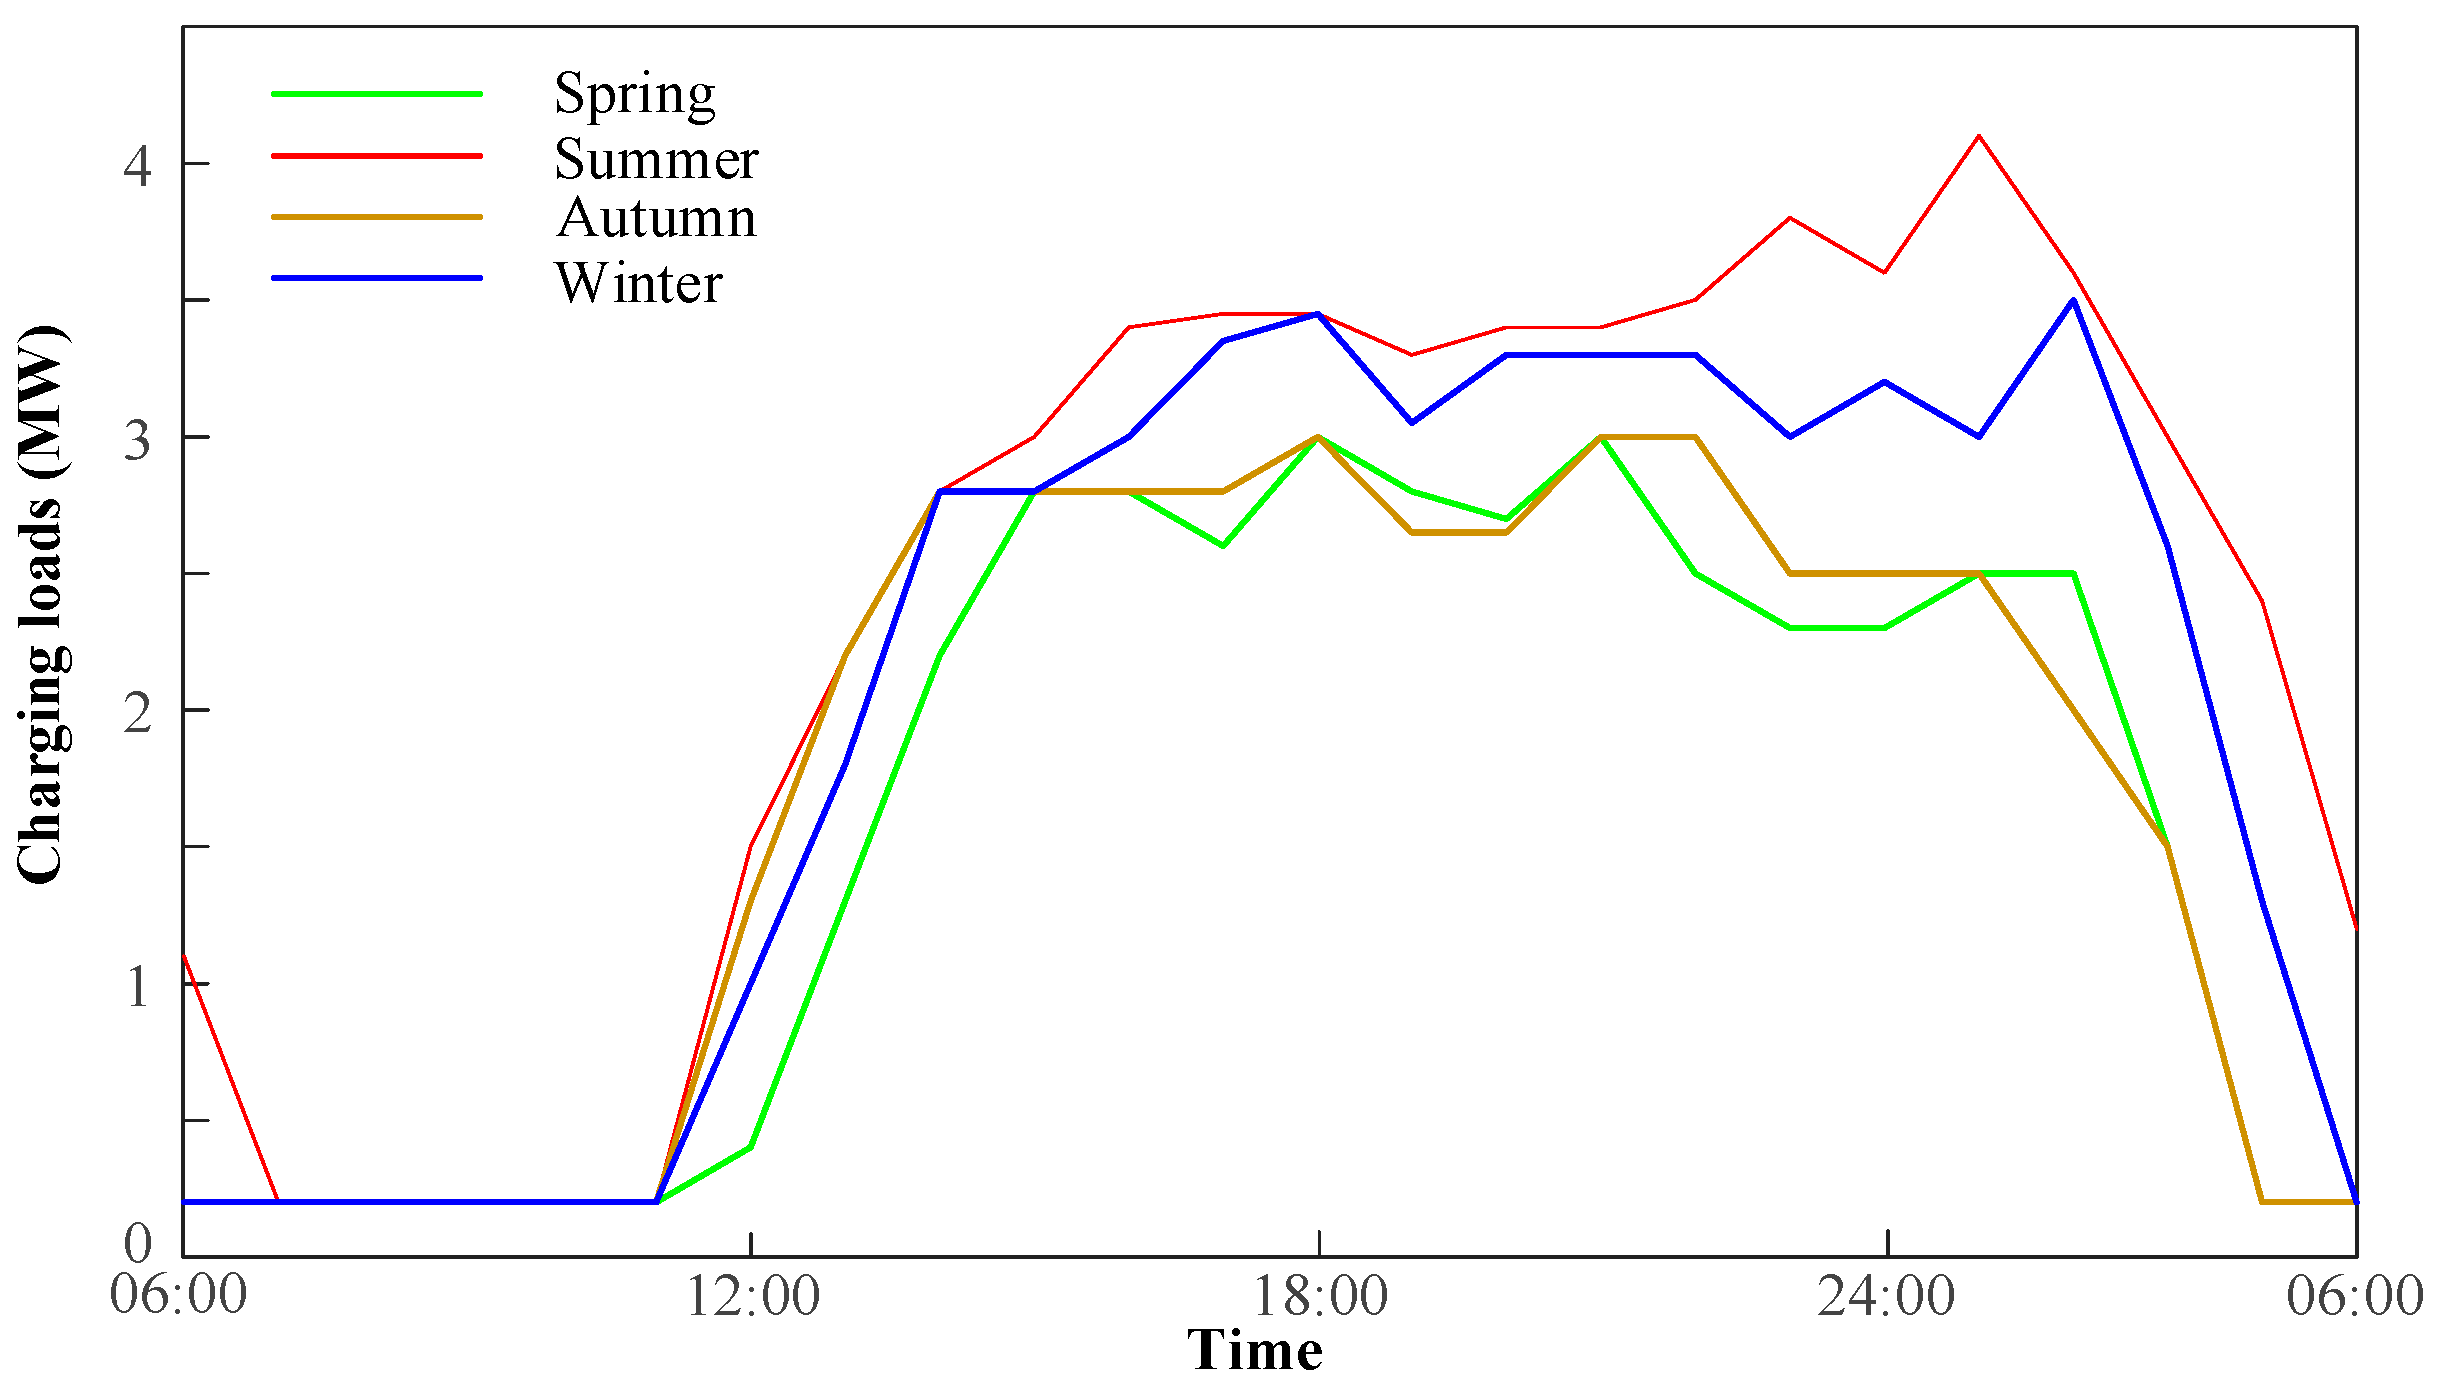
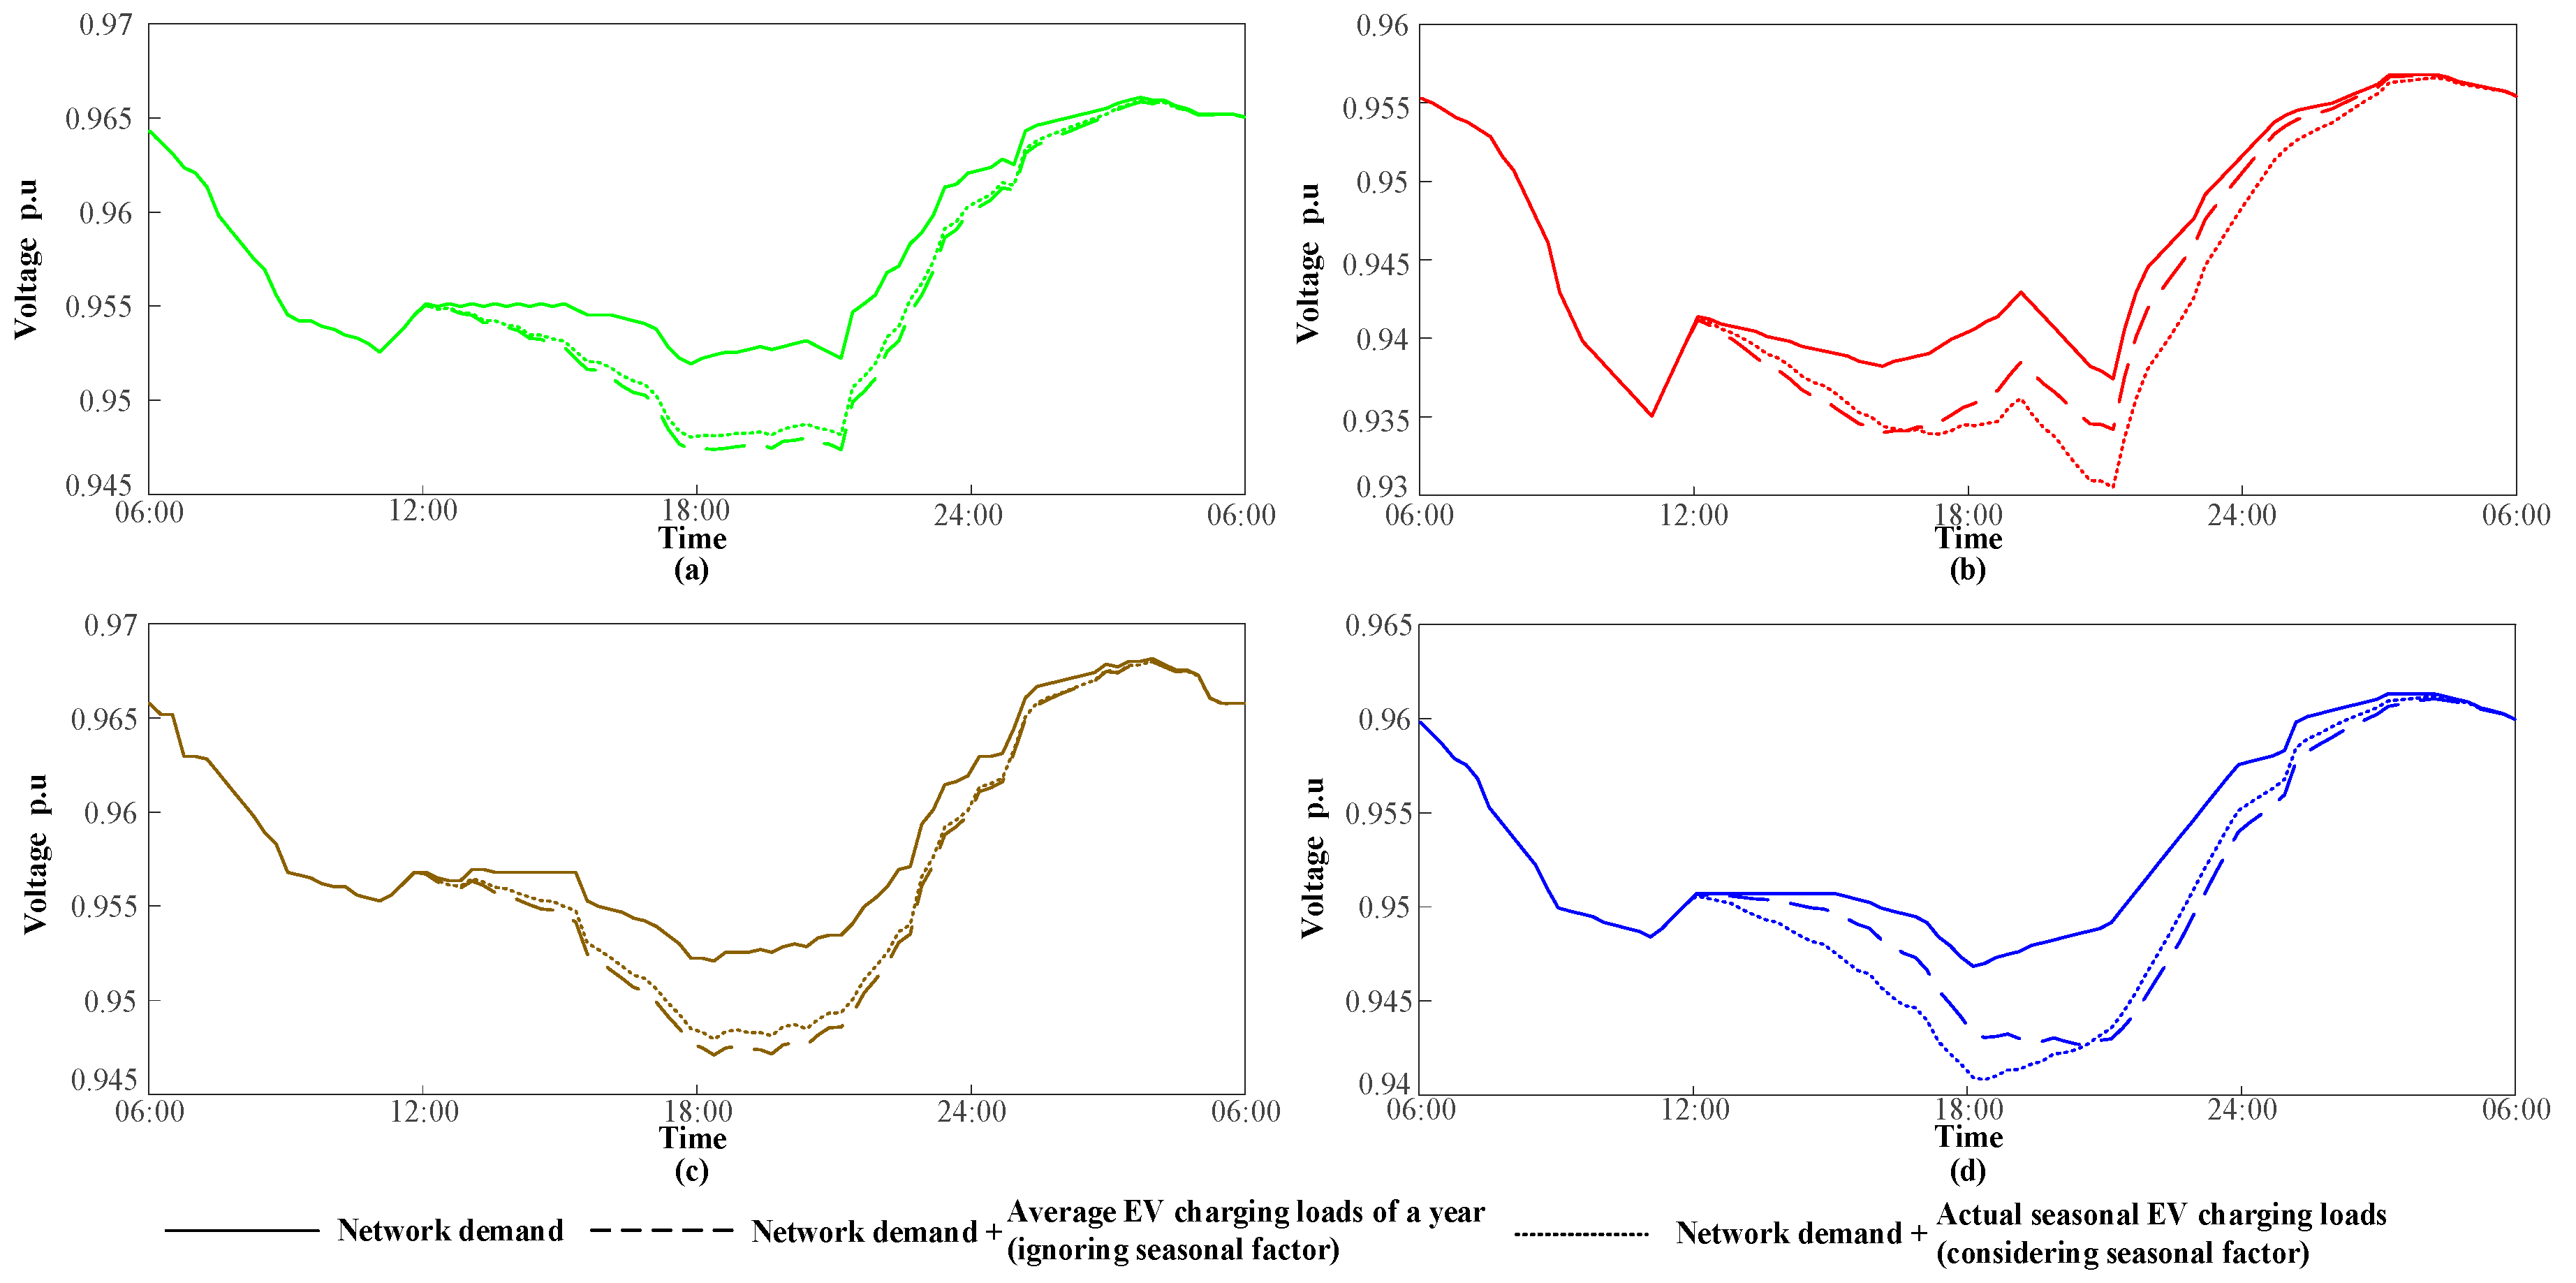
5.1. Charging Electric Vehicle without Any Optimal Strategy

Figure 8 shows the daily load curves of the given network without considering any optimal charging strategy in four different seasons.
Figure 8 reveals that the gap between the maximum demand and the minimum demand of the given network in a day is approximately 1.4 MW in spring and autumn. However, this gap can increase to 2.2 MW in summer and winter. This proves that seasonal factors do have an influence on calculating power system peak-valley difference, which has further impact the calculation of power system transmission loss.
In addition, simulation results indicate that the actual total demands of the given network should be higher in summer and winter, if seasonal factors are considered. On the contrary, the actual total demands of the given network should be lower in spring and autumn. Moreover, in summer, the actual daily load curve (considering seasonal factors) lags behind the average daily load curve (ignoring seasonal factors). However, an opposite tendency is shown in winter. For spring and autumn, the actual daily load curve and the average daily load curve are in the same phase. This is caused by domestic users’ preference of charging electric vehicle. As demonstrated in Section 2.1, users’ finish their last trips early in winter and late in summer. Therefore, the actual daily load curve in summer lags behind the average daily load curve and the actual daily load curve in winter is ahead of the average daily load curve. In summary, seasonal factors can affect the shape of the daily load curve of a network.
Taking node 8 as an example, Figure 9 shows the daily voltage curves of a node in the given network without considering any optimal charging strategy in four different seasons.
Figure 9 reveals that the voltage fluctuation rate of the given node is about 2% in summer and winter, and this rate would reduce to around 1% in spring and autumn. It is worth noting that with the connection of electric vehicles to the grid, this rate could increase about 50% for all seasons. In other words, the voltage fluctuation rate increases to about 1.5% in spring and autumn and about 3% in summer and winter if electric vehicles charging loads are connected to the grid. In addition, similar to the load curve simulation results, the actual voltage curve lags behind to the average voltage curve in summer and is ahead of the average voltage curve in winter.
Simulation results show that seasonal factors not only affect total demand of the given network, but also influence node voltage. Therefore, it is crucial to take these factors into account when scheduling electric vehicle charging loads. Additionally, simulation results also suggest that without an appropriate electric vehicle charging strategy, the maximum peak-valley difference of the given power system is 2.2 MW, which is more than half of the network peak demand. Therefore, the optimal electric vehicle charging strategy needs to be applied to regulate power and voltage fluctuation for this network.

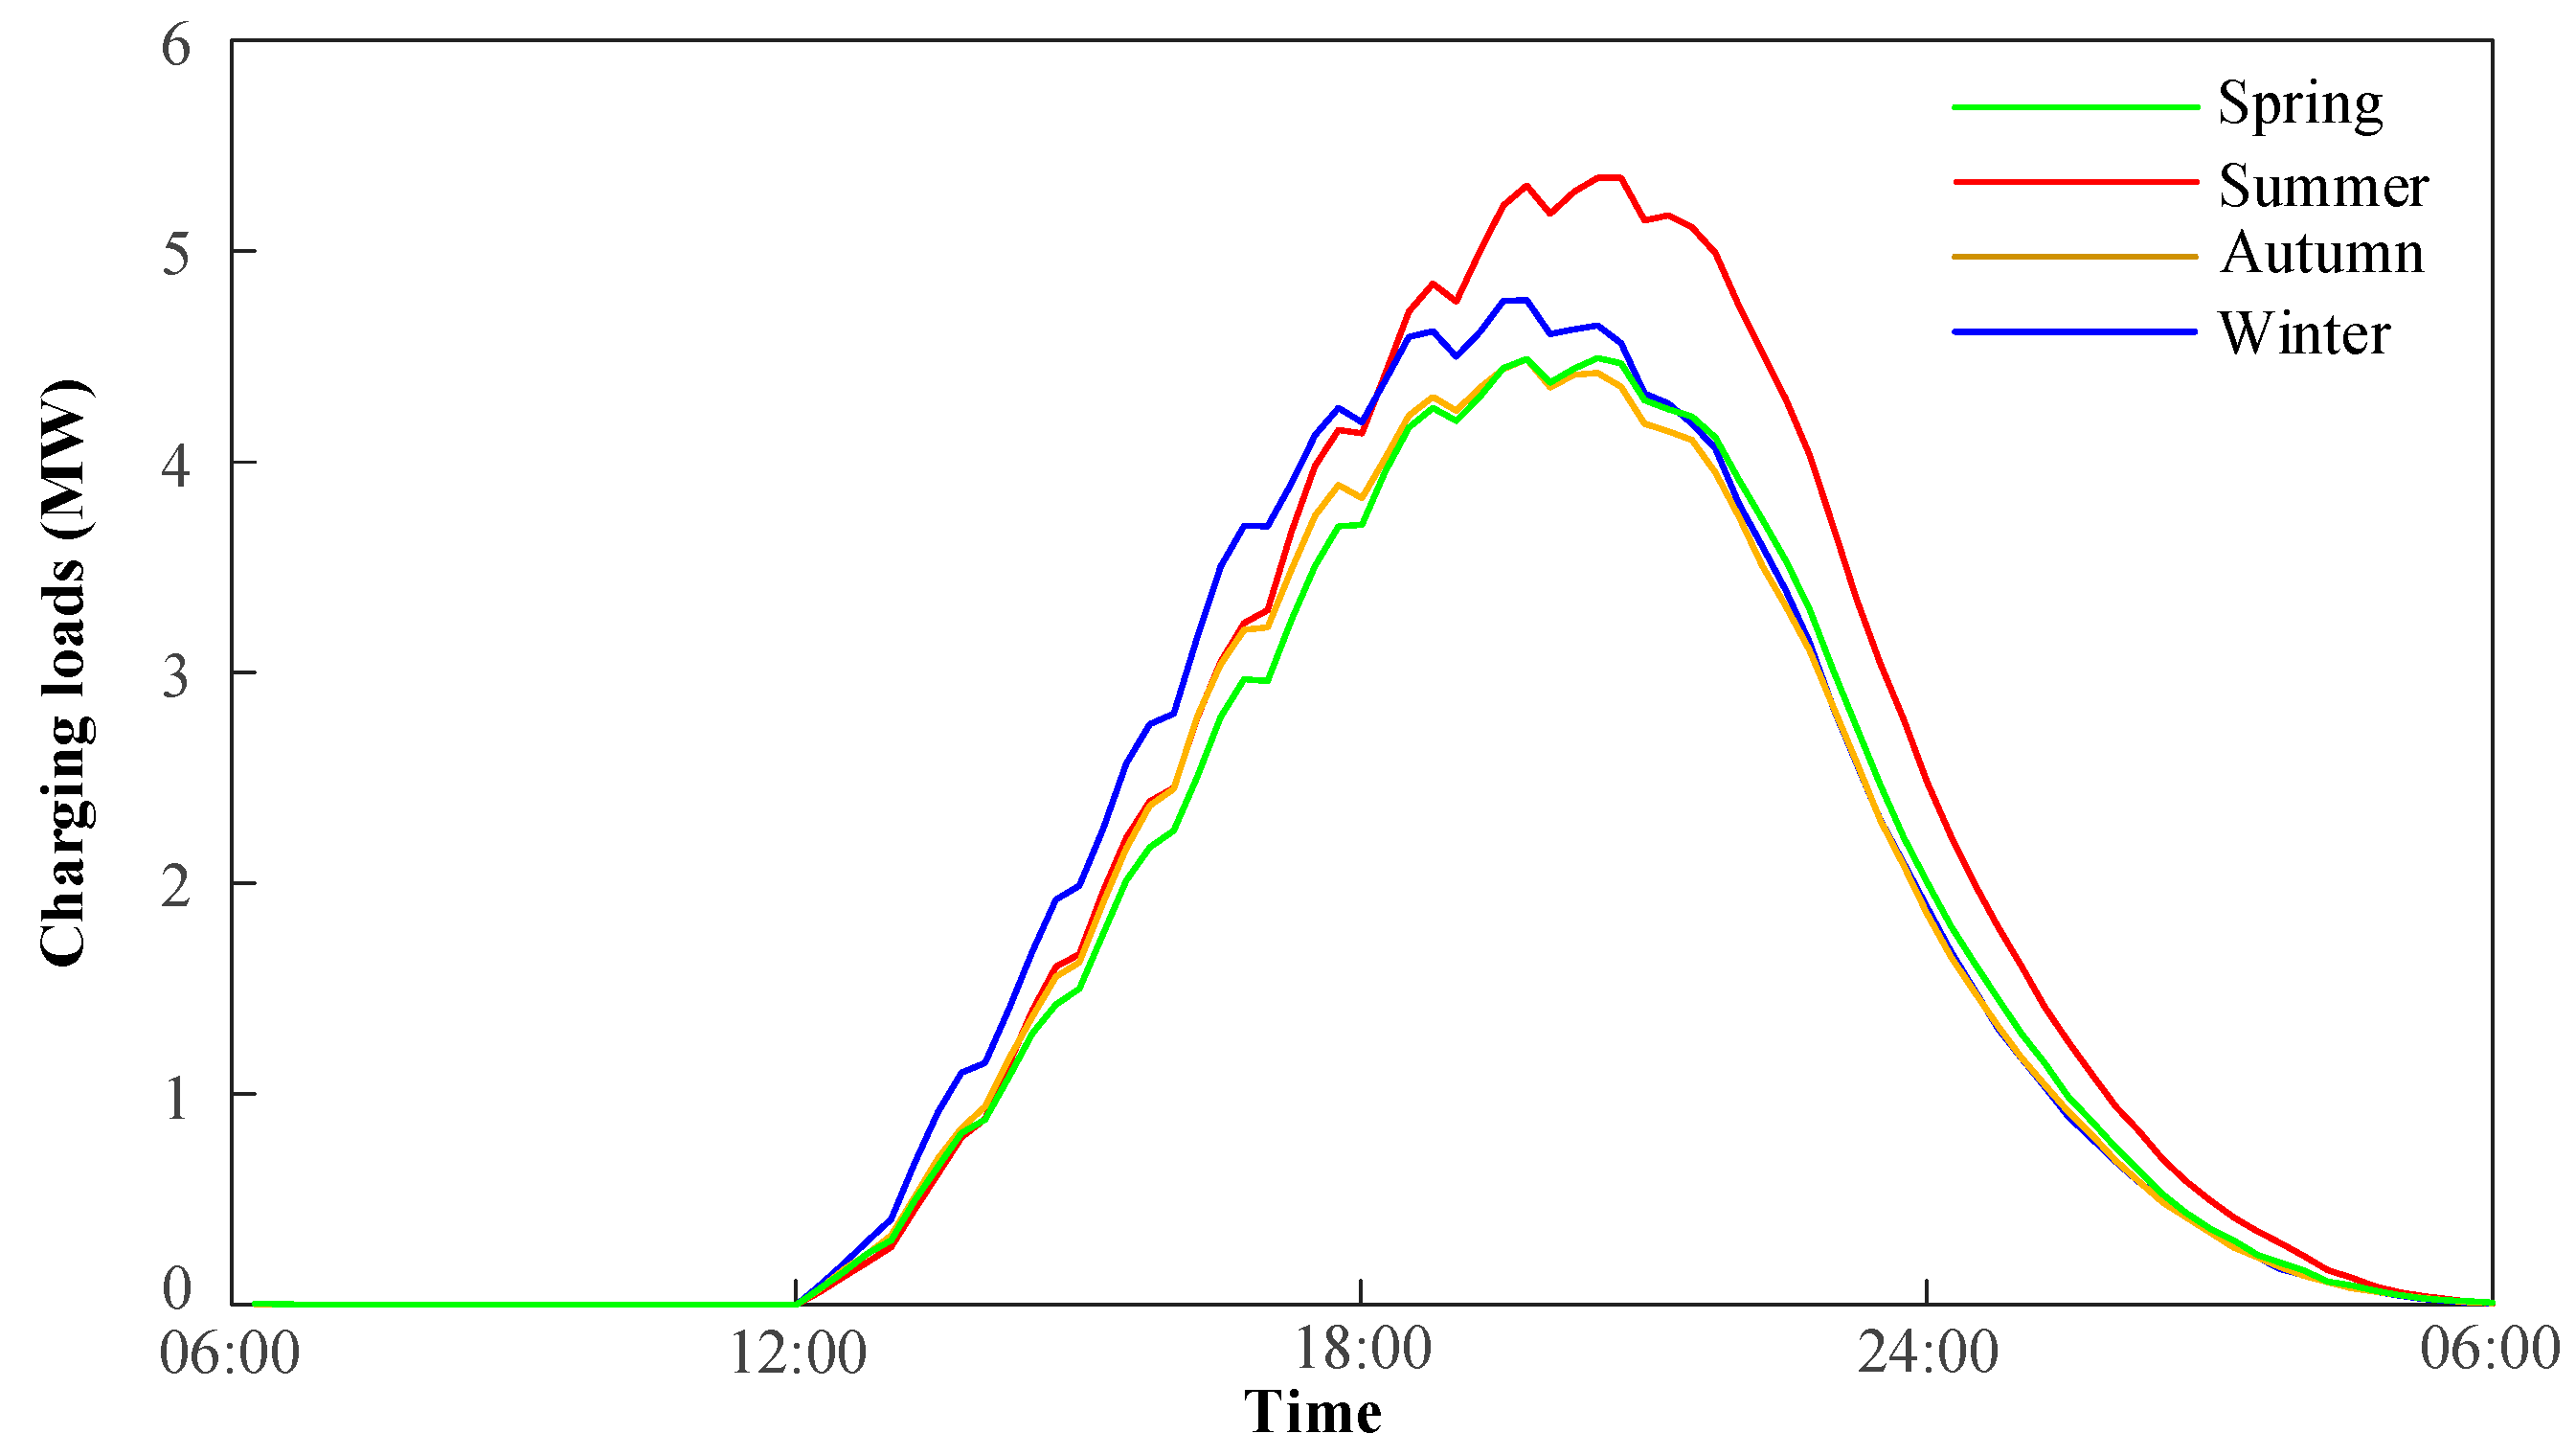
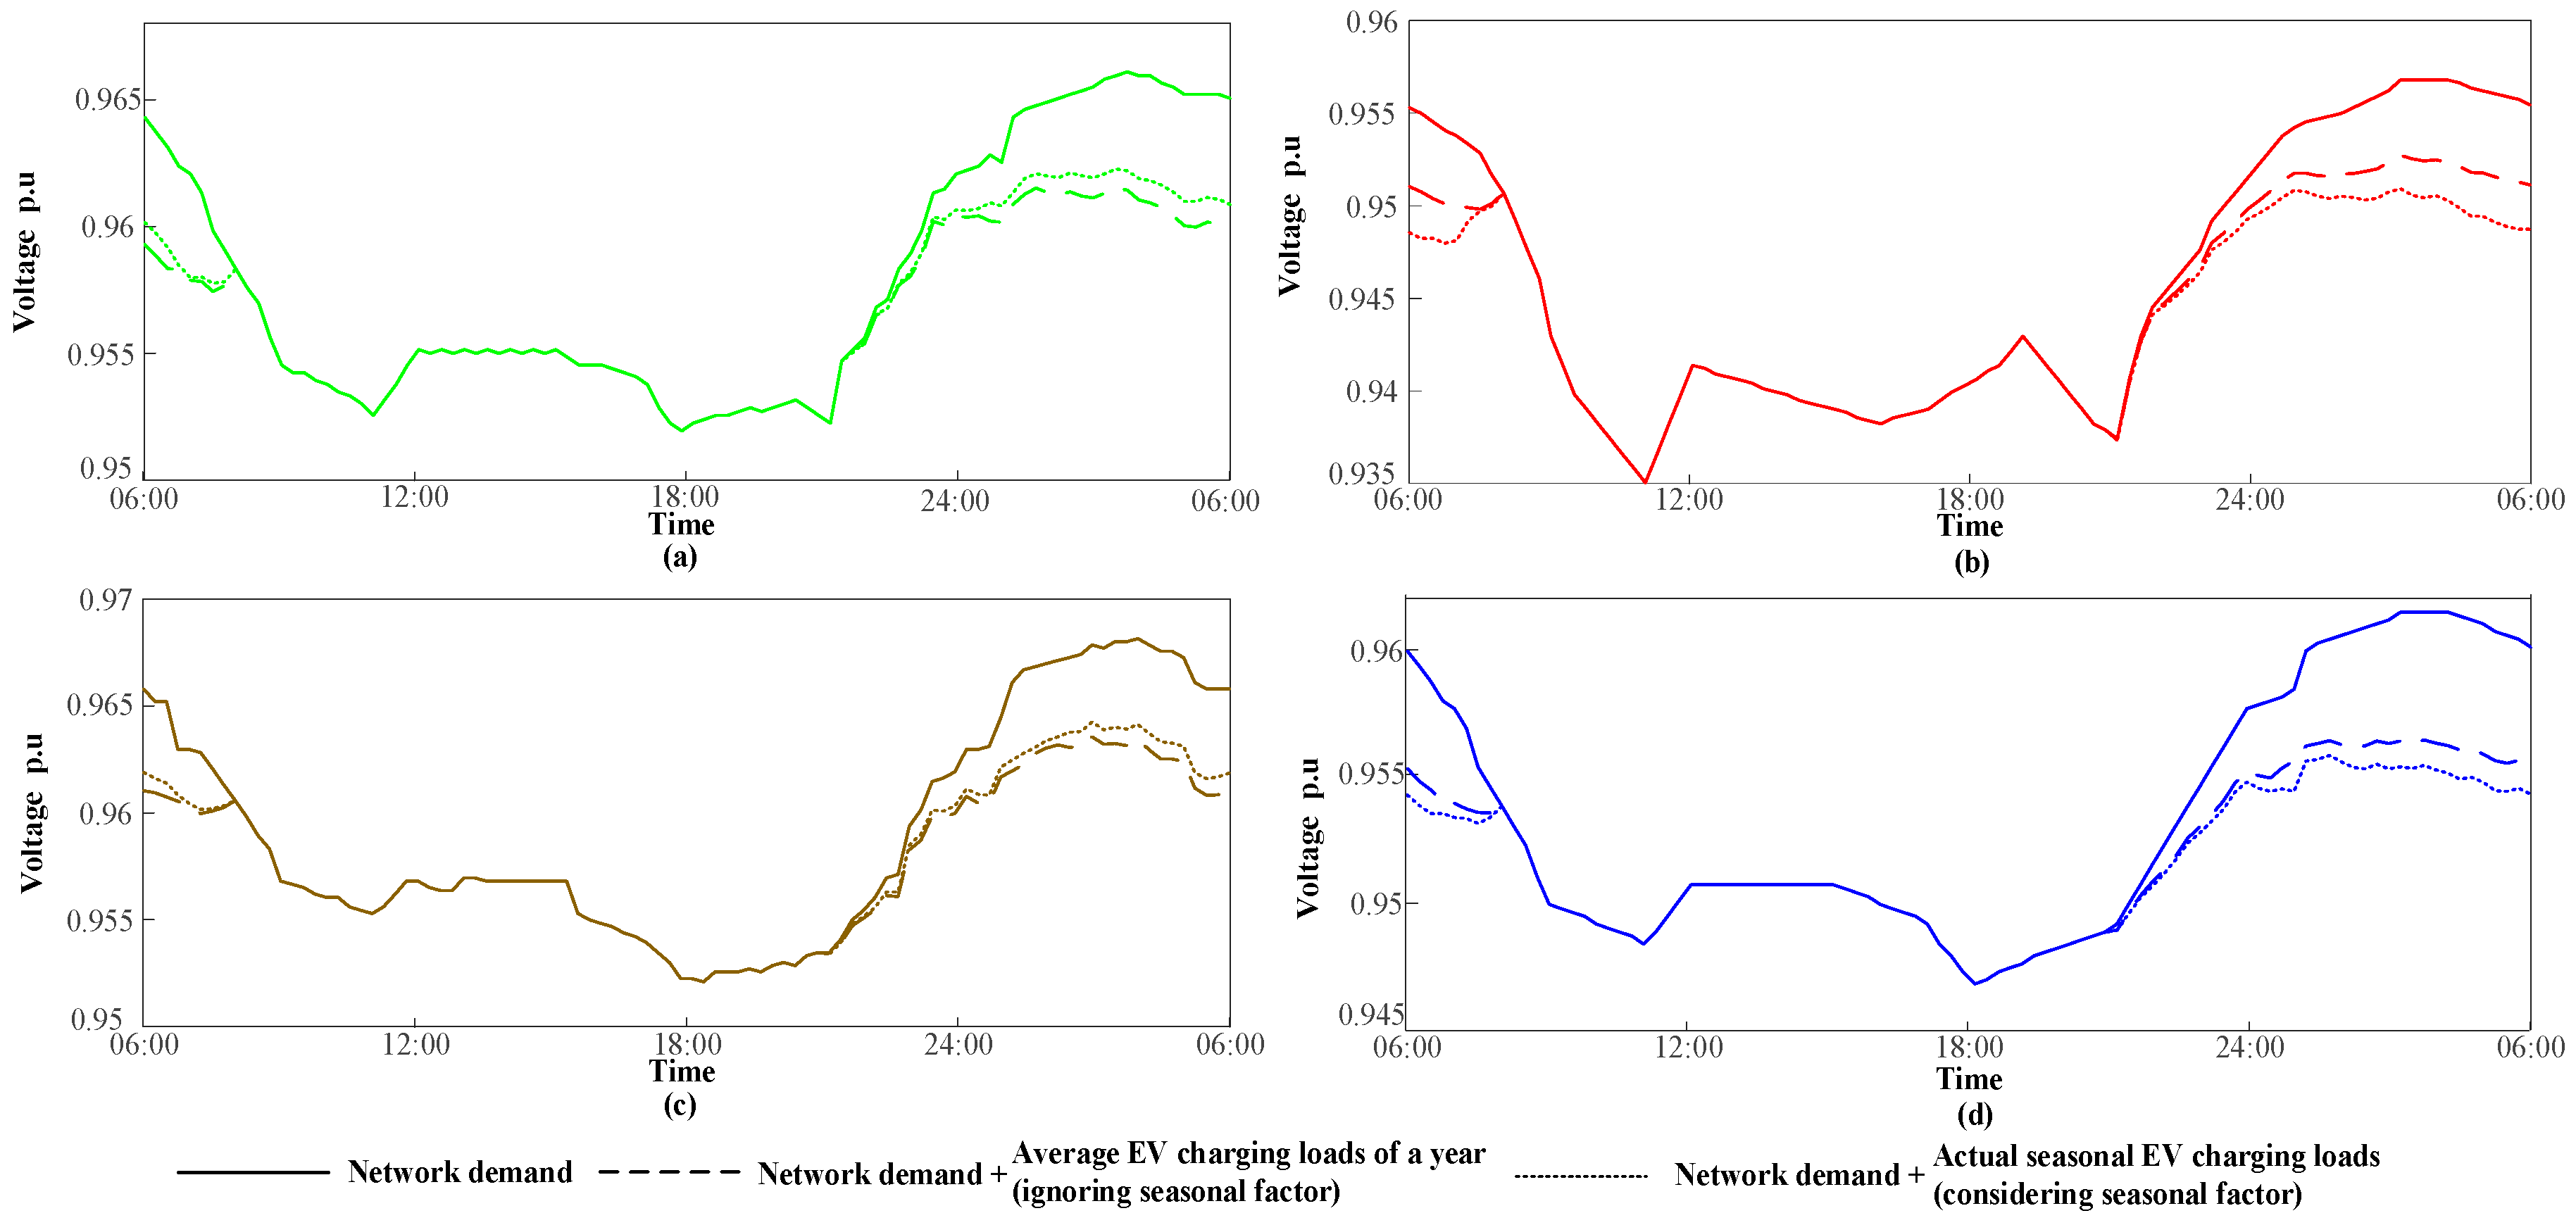
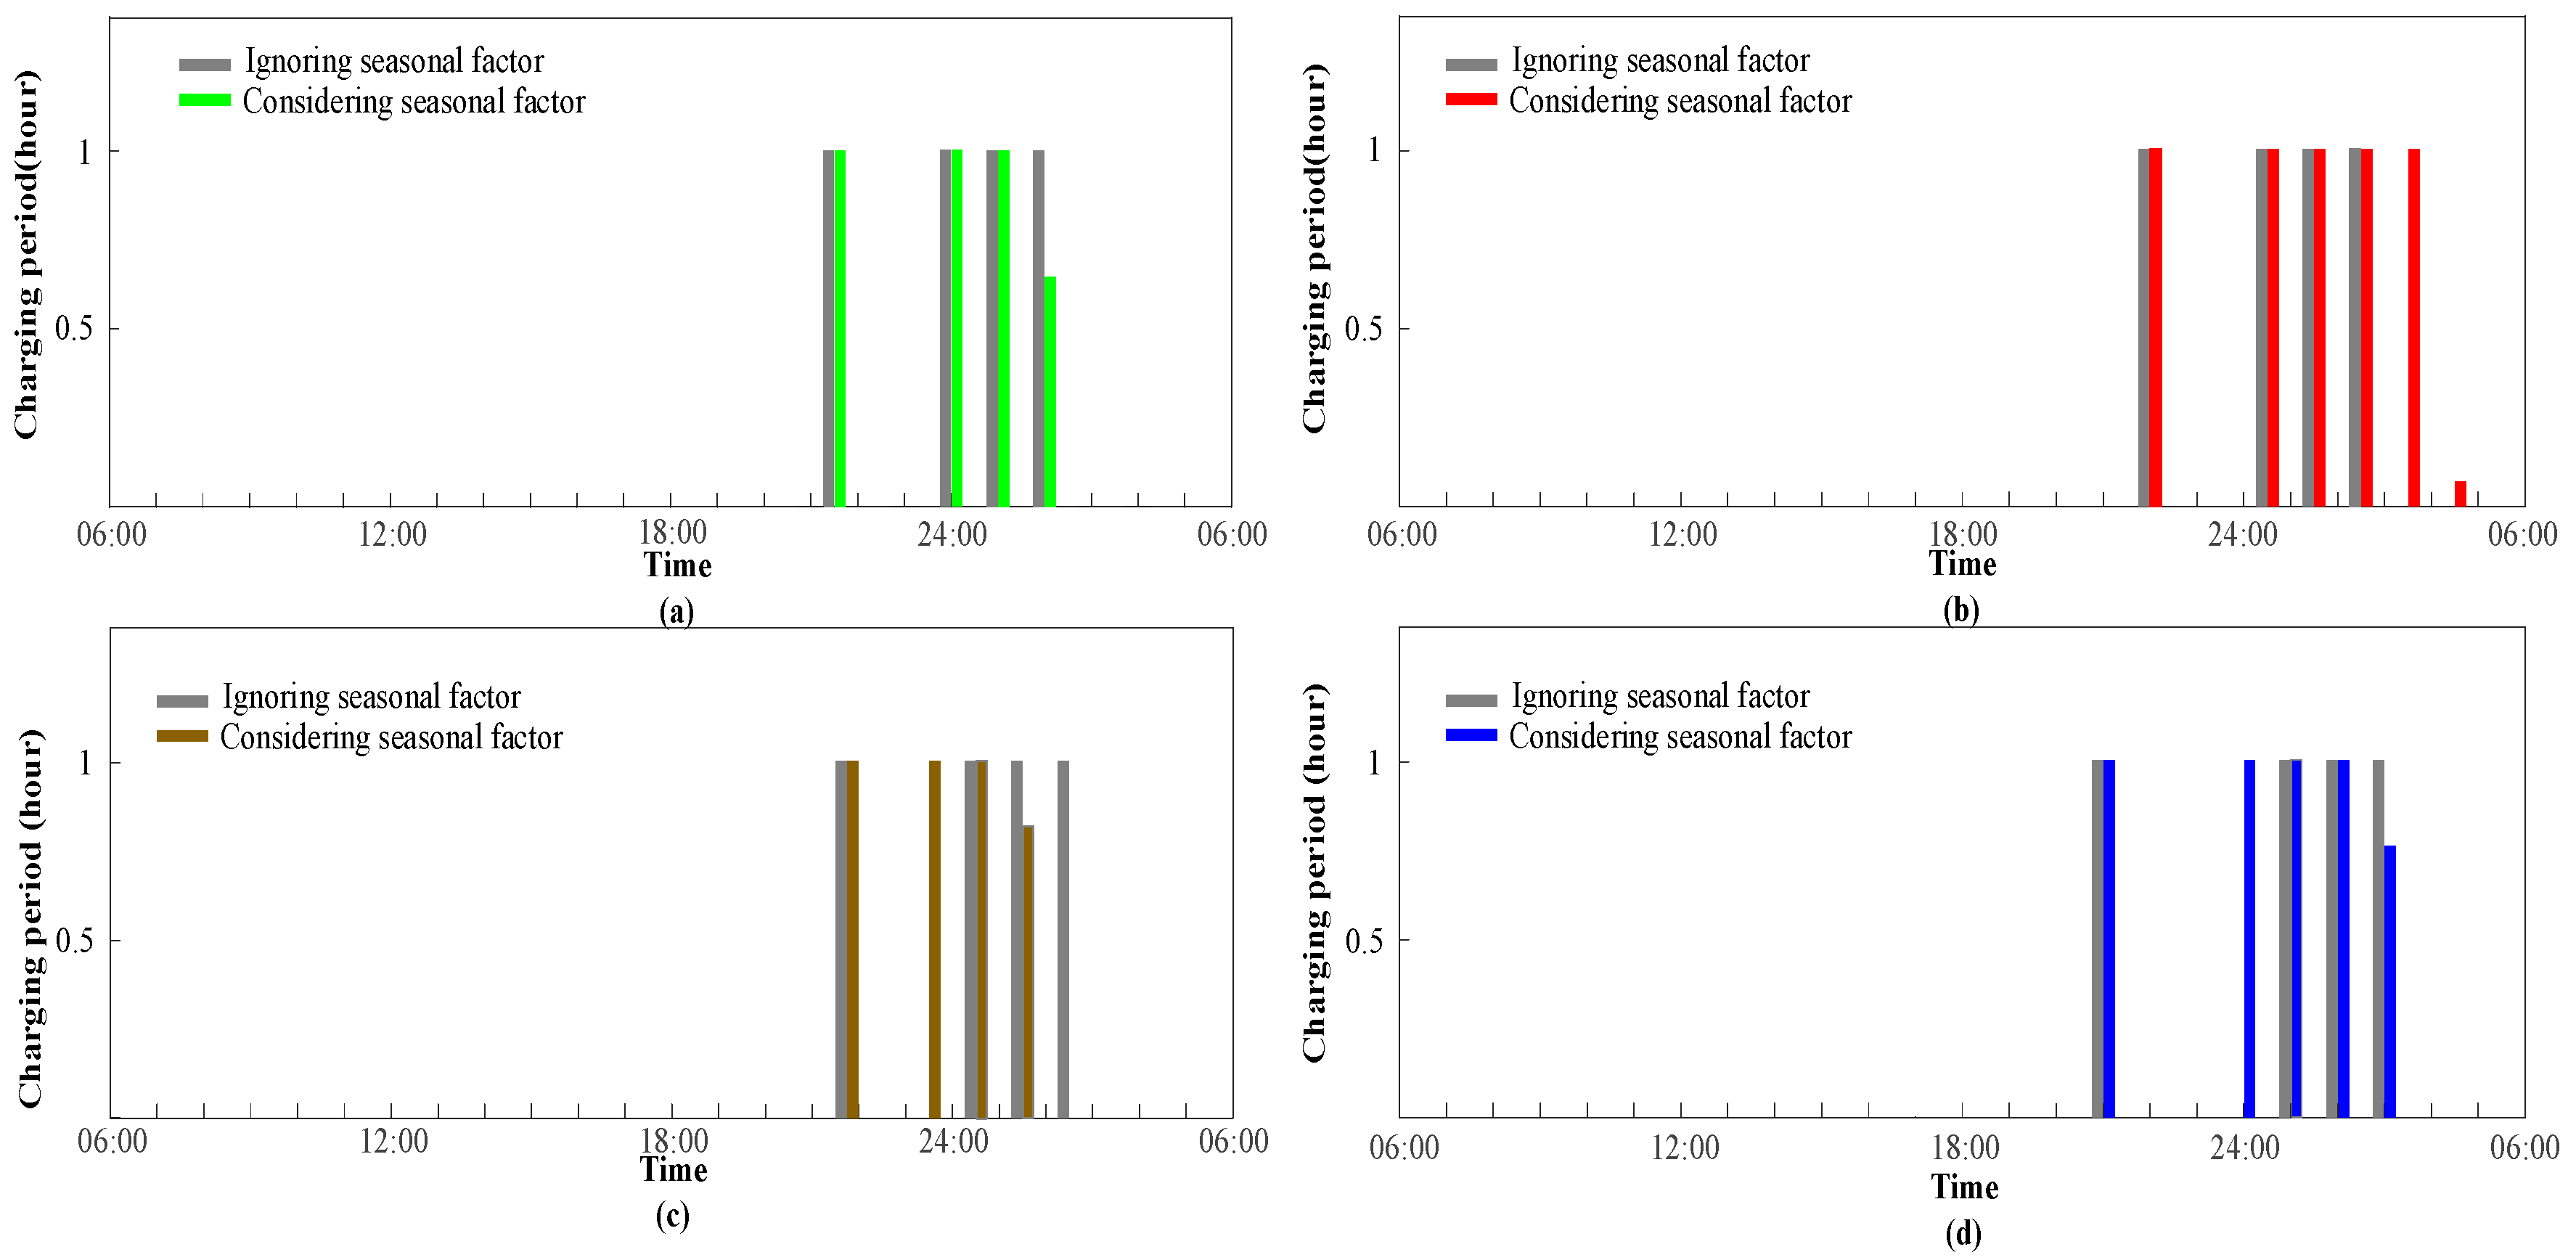
5.2. Charging Electric Vehicle with the Proposed Optimal Strategy

By applying the proposed electric vehicle charging strategy, Figure 10 shows the optimized daily load curves of the given network in four different seasons. As can be seen from Figure 10, with the proposed optimal strategy, the gap between the maximum and the minimum demand of the given network in a day reduces to about 0.8 MW in spring and autumn and to 1.2 MW in summer and winter. In this context, the gap between the maximum demand and minimum demand reduces by 45% in four different seasons. By applying the proposed optimal charging strategy, the electric vehicle charging loads have been successfully shifted to the valley demand time. This proves the effectiveness of the proposed method in load shifting.
Figure 11 shows the daily voltage curves of the node 8 in the given network by considering the optimal charging strategy in four different seasons.
As shown in Figure 11, with the access of electric vehicle charging loads to the grid, the voltage fluctuation rate of node 8 reduces to 1% in spring and autumn, while in summer and winter this rate is about 50% higher than that in spring and autumn, which is 1.5%. Even though the voltage fluctuation rate in summer and winter is 50% higher than that in spring and autumn, compared with not applying any charging strategy to charge electric vehicle loads, the voltage fluctuation rate of node 8 has been significantly reduced in each season by applying the proposed electric vehicle charging strategy. Simulation results show that the average voltage fluctuation rate reduction of node 8 is about 45% in one year.
In summary, as shown in Figure 10 and Figure 11, the proposed optimal electric vehicle load charging strategy not only has good performance on shifting load, but also has a strong ability to reduce voltage fluctuation rate. Simulation results show that both of the peak-valley gap and voltage fluctuation rate of the network reduce by about 45% by applying the proposed electric vehicle load charging strategy. Therefore, according to the aforementioned results, it can be predicted that transmission loss of the given network can be reduced to some extent.

5.3. The Transmission Loss Optimization Results

Based on the 0-1 Integer Programming Model, which is proposed in Section 3.1, Figure 12 shows the optimal charging strategy for a selected domestic electric vehicle. In addition, by analyzing power fluctuation of the given network, transmission loss of the given network can be calculated. Table 3 summarizes the transmission loss of the given network under different conditions.
Figure 12 reveals that for a selected domestic electric vehicle, optimal charging periods are vastly different if seasonal factors are considered, and this is mainly reflected in two aspects. Firstly, the selected electric vehicle needs a longer charging period in summer and winter, but a shorter charging period in spring and autumn, if seasonal factors are considered. This is because more energy is consumed in cooling and heating systems when considering seasonal factors. Another important aspect is that the optimal electric vehicle charging time period may be shifted if seasonal factors are considered. For example, in Figure 12c, the selected electric vehicle is charged between 23:00 to 24:00 when considering seasonal factors, while this period is postponed to 2:00 to 3:00 if the seasonal factors are ignored. The reason for this is that when considering seasonal factors, the load charging curves may lag behind or be ahead of the average electric vehicle load charging curves for one year, which has been demonstrated in Section 5.1.
Table 3 shows that the average network transmission loss rate for one year increases to 3.65%, which is about a 13.06% increase if electric vehicle charging loads are connected to the network. Therefore, with the increasing number of domestic electric vehicles, the average network transmission loss increases significantly. To reduce transmission loss, an optimal electrical vehicle charging strategy should be applied. By applying the proposed electric vehicle charging strategy, the average network loss rate for one year drops to 3.50%, which is about a 4.11% reduction in average if seasonal factors are ignored. On the contrary, when seasonal factors are taken into account, the network transmission loss rate can further be reduced to 3.45% by applying the proposed optimal charging strategy. Therefore, the simulation results verify the efficacy of the proposed 0-1 Integer Programming model and emphasize the necessity of considering seasonal factors when regulating electric vehicle charging loads.

6. Conclusions

This paper aims at regulating network daily load curves and reducing distributed power system transmission loss by optimizing domestic electric vehicle charging loads. To achieve this, this paper first analyzes the key factors that can affect the charging behavior of domestic electric vehicles. In this part, for the first time in the context of domestic electric vehicles, seasonal factors are considered to model the electrical charging loads of a single domestic electric vehicle. Then, a cluster of domestic electric vehicle charging loads of the given network is modelled by the Monte Carlo method. After that, the 0-1 integer programming method is proposed to regulate network daily load curves and to reduce distributed power system transmission loss.
The optimization results show that with the connection of electric vehicles to the grid, the peak-valley gap of the given network can increase by about 33% and the voltage fluctuation rate can increase by about 50% on average. In addition, the average network transmission loss rate for one year increases to 3.65%, which is about a 13.06% increase. To reduce the peak-valley gap, the voltage fluctuation rate, and the average network transmission loss rate of the given network, the 0-1 integer programming method is employed to optimize electric vehicle charging loads. By applying the proposed electric vehicle charging strategy, both the peak-valley gap and voltage fluctuation rate of the network can be reduced by about 45% compared with not connecting electric vehicles to the grid. Additionally, the average network loss rate for one year drops to 3.50%, which is about a 4.11% reduction in average compared with not applying the 0-1 integer programming. Furthermore, with taking seasonal factors into account, network transmission loss rates can be reduced to 3.45%, and the best time to charge electric vehicles is vastly different when compared with ignoring seasonal factors.
In summary, the proposed 0-1 integer programming method does have good performance in reducing the network peak-valley gap, the voltage fluctuation rate, and transmission loss. Moreover, with taking seasonal factors into account, network transmission loss rate can be further reduced and the optimal electric vehicle charging time can be significantly different. Therefore, it is important to consider seasonal factors when optimizing electric vehicle charging loads. To further improve the commercial utility of the work, it is worth considering financial incentives and price signals when scheduling residential charging loads in the future work.

Acknowledgments

This paper is funded by “Research on multistage regulation key technology of demand response based on composite information” of SGCC (YDB17201500163).

Author Contributions

Yuancheng Zhao designed the study; Yanbo Che and Dianmeng Wang collected the data; Kun Shi conducted the simulation; Huanan Liu analyzed the data; Dongmin Yu wrote the paper.

Conflicts of Interest

The authors declare no conflict of interest.

References

  1. Abdul-Manan, A.F.N. Uncertainty and differences in GHG emissions between electric and conventional gasoline vehicles with implications for transport policy making. Energy Policy 2015, 87, 1–7. [Google Scholar] [CrossRef]
  2. Clement-Nyns, K.; Haesen, E.; Driesen, J. The impact of vehicle-to-grid on the distribution grid. Electr. Power Syst. Res. 2011, 81, 185–192. [Google Scholar] [CrossRef]
  3. Clement-Nyns, K.; Haesen, E.; Driesen, J. The Impact of Charging Plug-In Hybrid Electric Vehicles on a Residential Distribution Grid. IEEE Trans. Power Syst. 2010, 25, 371–380. [Google Scholar] [CrossRef] [Green Version]
  4. Hadley, S.W.; Tsvetkova, A.A. Potential Impacts of Plug-in Hybrid Electric Vehicles on Regional Power Generation. Electr. J. 2009, 22, 56–68. [Google Scholar] [CrossRef]
  5. Qian, K.; Zhou, C.; Allan, M.; Yuan, Y. Modeling of Load Demand Due to EV Battery Charging in Distribution Systems. IEEE Trans. Power Syst. 2011, 26, 802–810. [Google Scholar] [CrossRef]
  6. Brady, J.; O’Mahony, M. Modelling charging profiles of electric vehicles based on real-world electric vehicle charging data. Sustain. Cities Soc. 2016, 26, 203–216. [Google Scholar] [CrossRef]
  7. Li, G.; Zhang, X.P. Modeling of Plug-in Hybrid Electric Vehicle Charging Demand in Probabilistic Power Flow Calculations. IEEE Trans. Smart Grid 2012, 3, 492–499. [Google Scholar] [CrossRef]
  8. Cheng, L.; Chang, Y.; Liu, M.; Wu, Q. Estimating EV integration patterns considering spatial dispersion in distribution systems. In Proceedings of the 2015 IEEE Power & Energy Society General Meeting, Denver, CO, USA, 26–30 July 2015; pp. 1–5. [Google Scholar]
  9. Yin, Z.; Che, Y.; Li, D.; Liu, H.; Yu, D. Optimal Scheduling Strategy for Domestic Electric Water Heaters Based on the Temperature State Priority List. Energies 2017, 10, 1425. [Google Scholar] [CrossRef]
  10. Tehrani, N.H.; Wang, P. Probabilistic estimation of plug-in electric vehicles charging load profile. Electr. Power Syst. Res. 2015, 124, 133–143. [Google Scholar] [CrossRef]
  11. Usman, M.; Knapen, L.; Yasar, A.U.H.; Bellemans, T.; Janssens, D.; Wets, G. Optimal recharging framework and simulation for electric vehicle fleet. Future Gener. Comput. Syst. 2017. [Google Scholar] [CrossRef]
  12. Luo, X.; Chan, K.W. Real-time scheduling of electric vehicles charging in low-voltage residential distribution systems to minimise power losses and improve voltage profile. IET Gener. Transm. Distrib. 2014, 8, 516–529. [Google Scholar] [CrossRef]
  13. Esmaili, M.; Rajabi, M. Optimal charging of plug-in electric vehicles observing power grid constraints. IET Gener. Transm. Distrib. 2014, 8, 583–590. [Google Scholar] [CrossRef]
  14. Clement, K.; Haesen, E.; Driesen, J. Coordinated charging of multiple plug-in hybrid electric vehicles in residential distribution grids. In Proceedings of the Power Systems Conference and Exposition (PSCE ’09), Seattle, WA, USA, 15–18 March 2009; pp. 1–7. [Google Scholar]
  15. Deilami, S.; Masoum, A.S.; Moses, P.S.; Masoum, M.A.S. Real-Time Coordination of Plug-In Electric Vehicle Charging in Smart Grids to Minimize Power Losses and Improve Voltage Profile. IEEE Trans. Smart Grid 2011, 2, 456–467. [Google Scholar] [CrossRef]
  16. Ali, A.; Raisz, D.; Mahmoud, K. Sensitivity-based and optimization-based methods for mitigating voltage fluctuation and rise in the presence of PV and PHEVs. Int. Trans. Electr. Energy Syst. 2017, 27, e2456. [Google Scholar] [CrossRef]
  17. Bakır, M.A.; Aksop, C. A 0–1 integer programming approach to a university timetabling problem. Hacettepe Univ. Bull. Nat. Sci. Eng. 2008, 37, 41–55. [Google Scholar]
  18. U.S. Department of Transportation F.H.D. National Household Travel Survey. 2009. Available online: http://nhts.ornl.gov/download.shtml (accessed on 25 October 2017).
  19. Shojaei, S.; McGordon, A.; Robinson, S.; Macro, J. Improving the Performance Attributes of Plug-in Hybrid Electric Vehicles in Hot Climates through Key-off Battery Cooling. Energies 2017, 10, 2058. [Google Scholar] [CrossRef]
  20. Chang, D. Study on Short Term Load Forecasting Model of Electric Vehicle Charging Station in Smart Grid; Qingdao University: Qingdao, China, 2015. [Google Scholar]
  21. Abdalrahman, A.; Zhuang, W. A Survey on PEV Charging Infrastructure: Impact Assessment and Planning. Energies 2017, 10, 1650. [Google Scholar] [CrossRef]
  22. Ding, H.; Hu, Z.; Song, Y. Value of the energy storage system in an electric bus fast charging station. Appl. Energy 2015, 157, 630–639. [Google Scholar] [CrossRef]
  23. Rubino, L.; Capasso, C.; Veneri, O. Review on plug-in electric vehicle charging architectures integrated with distributed energy sources for sustainable mobility. Appl. Energy 2017, 207, 439–464. [Google Scholar] [CrossRef]
  24. Nienhueser, I.A.; Qiu, Y. Economic and environmental impacts of providing renewable energy for electric vehicle charging—A choice experiment study. Appl. Energy 2016, 180, 256–268. [Google Scholar] [CrossRef]
  25. Yu, D.; Liu, H.; Yan, G.; Jiang, J.; Le Blond, S. Optimization of Hybrid Energy Storage Systems at the Building Level with Combined Heat and Power Generation. Energies 2017, 10, 606. [Google Scholar] [CrossRef]
  26. Zhu, X. Short-Term Load Forecasting and Its Application System of Power System; Southeast University: Dhaka, Bangladesh, 2004. [Google Scholar]
Figure 1. Probability distribution of domestic users’ daily return time from the last trip; (a) For one year; (b) For different seasons.
Applsci 08 00191 g001
Figure 2. Probability distribution of domestic users’ daily travelling distance per vehicle (in miles); (a) For one year; (b) For different seasons.
Applsci 08 00191 g002aApplsci 08 00191 g002b
Figure 3. Average daily load curves of 2000 electric vehicles in different seasons [20].
Applsci 08 00191 g003
Figure 4. An example of daily charging load curves of 2000 electric vehicles.
Applsci 08 00191 g004
Figure 5. A flow diagram of distributed power system transmission loss optimization based on the electric vehicle 0-1 integer programming model. EV = electric vehicle.
Applsci 08 00191 g005
Figure 6. The structure of the IEEE 33-node distributed power network.
Applsci 08 00191 g006
Figure 7. The daily load curves of the given network in different seasons [26].
Applsci 08 00191 g007
Figure 8. Daily load curves of the given network without considering any optimal charging strategy; (a) spring, (b) summer, (c) autumn, (d) winter.
Applsci 08 00191 g008
Figure 9. Daily node voltage curves of the given network without considering any optimal charging strategy; (a) spring, (b) summer, (c) autumn, (d) winter.
Applsci 08 00191 g009
Figure 10. Optimized daily load curves of the given network by applying the proposed charging strategy; (a) spring, (b) summer, (c) autumn, (d) winter.
Applsci 08 00191 g010
Figure 11. Optimized daily note voltage curves of the given network by applying the proposed charging strategy; (a) spring, (b) summer, (c) autumn, (d) winter.
Applsci 08 00191 g011
Figure 12. Optimal charging strategy for a selected domestic electric vehicle in different seasons; (a) spring, (b) summer, (c) autumn, (d) winter.
Applsci 08 00191 g012
Table 1. The standard deviations and mathematical expectations of users’ return time in different seasons.
ParametersSpringSummerAutumnWinter
μend17:48 118:00 117:26 117:10 1
σend3.603.593.603.62
1 17:48, 18:00, 17:26 and 17:10 need to be converted to 17.8, 18.0, 17.43 and 17.17, respectively, when calculating the probability of return time from the last trip.
Table 2. Standardized charging loads in different seasons.
Standardized Charging LoadsSpringSummerAutumnWinter
Standardized Maximum Charging Loads11.371.071.23
Standardized Average Charging Loads11.301.031.19
Table 3. A summary of the given network transmission loss under different conditions.
Seasons and CasesDaily Network Demands (MW·h)Network Loss (MW·h)Loss Rate (%)
SpringCase 1 157.611.662.88
Case 2 159.941.963.27
Case 3 159.941.863.10
Case 4 159.941.883.14
SummerCase 1 175.102.853.79
Case 2 178.133.254.16
Case 3 178.133.053.90
Case 4 178.133.123.99
AutumnCase 1 158.081.692.91
Case 2 160.481.993.29
Case 3 160.481.893.13
Case 4 160.481.903.14
WinterCase 1 165.312.183.34
Case 2 168.042.633.87
Case 3 168.042.503.67
Case 4 168.042.543.73
1 Case 1: Not considering electric vehicle charging loads at all; Case 2: Considering electric vehicle charging loads and seasonal factors, but not considering any electric vehicle charging strategy; Case 3: Considering electric vehicle charging loads, seasonal factors, and the proposed electric vehicle charging strategy, and Case 4: Considering electric vehicle charging loads and the proposed electric vehicle charging strategy, but not considering seasonal factors.

