Evaluation of Handheld Scanners for Automotive Applications


Princess Fatima Alnijiris’s Research Chair for Advanced Manufacturing Technology (FARCAMT Chair), Advanced Manufacturing Institute, King Saud University, Riyadh 11421, Saudi Arabia
*
Author to whom correspondence should be addressed.
Appl. Sci. 2018, 8(2), 217; https://doi.org/10.3390/app8020217
Submission received: 1 December 2017
/
Revised: 20 December 2017
/
Accepted: 25 January 2018
/
Published: 31 January 2018
(This article belongs to the Special Issue Laser Scanning)
Abstract
:Featured Application
There has been an increased demand for, and there are potential benefits of, creating three-dimensional digital models of existing objects in the automotive, aerospace, cultural heritage, and medical industries. Non-contact data acquisition systems are in great demand owing to their higher data acquisition speed and movability. The application of unsuitable data acquisition may result in inaccurate data, thus making the reverse engineering ineffective and inefficient. Therefore, it is crucial for the designers to select the appropriate data acquisition technique, depending on the application requirements. Hence, this work provides the methodology and guidelines for the users to evaluate and compare different scanners for applications in the automotive, aerospace, and medical industries, etc.
Abstract
The process of generating a computerized geometric model for an existing part is known as Reverse Engineering (RE). It is a very useful technique in product development and plays a significant role in automotive, aerospace, and medical industries. In fact, it has been getting remarkable attention in manufacturing industries owing to its advanced data acquisition technologies. The process of RE is based on two primary steps: data acquisition (also known as scanning) and data processing. To facilitate point data acquisition, a variety of scanning systems is available with different capabilities and limitations. Although the optical control of 3D scanners is fully developed, still several factors can affect the quality of the scanned data. As a result, the proper selection of scanning parameters, such as resolution, laser power, shutter time, etc., becomes very crucial. This kind of investigation can be very helpful and provide its users with guidelines to identify the appropriate factors. Moreover, it is worth noting that no single system is ideal in all applications. Accordingly, this work has compared two portable (handheld) systems based on laser scanning and white light optical scanning for automotive applications. A car door containing a free-form surface has been used to achieve the above-mentioned goal. The design of experiments has been employed to determine the effects of different scanning parameters and optimize them. The capabilities and limitations have been identified by comparing the two scanners in terms of accuracy, scanning time, triangle numbers, ease of use, and portability. Then, the relationships between the system capabilities and the application requirements have been established. The results revealed that the laser scanner performed better than the white light scanner in terms of accuracy, while the white light scanner performed better in terms of acquisition speed and triangle numbers.
1. Introduction
In the automotive, aerospace, cultural heritage, and medical industries, there are many potential benefits of creating three-dimensional (3D) digital models of existing objects. This technique is known as reverse engineering (RE). It can be defined as the process of generating an identical Computer-Aided Design (CAD) model using an existing physical object. This model can then be utilized in several downstream applications such as protoyping, testing and verification [1], simulation, drafting, design improvement, customization in medicine, etc. It is particularly useful when an existing CAD model is not available, the component becomes outdated, or the design requires modification in addition to reconciling broken geometry, reducing product development time, or minimizing the manufacturing costs, etc. The RE process is based on the following two basic steps: (1) data acquisition and (2) surface reconstruction. Depending on the application requirement or the desired accuracy, different techniques or methods may be used to accomplish these steps. The accuracy of the final CAD model is dependent both on the data acquisition technique, as well as the surface reconstruction procedure. Indeed, the effectiveness of a given step in the RE process always relies on the accuracy achieved in the preceding step. It means that the accuracy of the surface reconstruction is dependent on the precision that can be attained during data acquisition. Hence, the data acquisition process controls the accuracy of the subsequent steps in the RE process. Unsuitable data acquisition results in inaccurate data and complicates future steps, thus making the RE ineffective and inefficient. Therefore, it is crucial for the designers to select the appropriate data acquisition, depending on the application requirements.
The different techniques for data acquisition can be classified into contact and non-contact methods as shown in Figure 1. The main purpose of the 3D data acquisition is to collect and record object information pertaining to shape and dimensions either using touch probes (contact) or optical systems (non-contact). In the contact method, a probe makes contact with the object’s surface, while in the non-contact approach, there is no physical contact with the object’s surface. Non-contact methods are based on different techniques including photogrammetry [2], triangulation and time of flight [3], as well as utilize various light sources such as laser and white light [4].
In the last decade or so, 3D optical scanning technologies have been identified as the most efficient and effective data acquisition methods used for RE [7]. These systems can deliver the desired accuracy for large, complex sheet metal parts and dyes used in the automotive industry. As a result of their inherent benefits, different types of 3D optical scanners with varying specifications and capabilities have been developed. Recently, the handheld scanners based on laser and white light have been amongst the favored digitization technologies.
Handheld 3D scanners are preferred over non-transportable alternatives by researchers and industries owing to their low weight and greater portability. They generate 3D surfaces using a triangulation mechanism in which either the laser or white light is projected onto an object, and the distance between the scanner and the object surface is measured through the triangulation. The acquired points are then used to create a CAD model in the appropriate program. A new type of handheld scanner has become available with self-positioning systems that depend on positioning targets placed on the scanning object [8], in addition to the many different existing types of handheld scanners (based on different techniques) available for data acquisition. Due to the wide variety of available scanners, it is often difficult for the user to select a suitable scanner for their application. Therefore, a comparative evaluation of scanners assessing their benefits and limitations can be very useful in their selection.
In this work, two handheld scanners based on laser and white light have been evaluated. To accomplish this objective, a design of experiment has been employed. Moreover, a car door (consisting of a free-form shape) is utilized as the test component. Notice that the different object materials such as transparent, fluorescent, shiny, glossy, or black color, etc., may influence the performance of the two scanners and provide different scanning results [9]. Therefore, in this investigation same surface conditions, as recommended by the creaform company for these scanners, were employed. The two scanners have been compared in terms of accuracy, scanning time, number of triangles, ease of use, and portability.
Applications
Optical 3D scanning technologies have been successfully applied for achieving 3D measurements in many fields such as the automotive industry [7]. Optical scanning technologies based on laser and white light have increasingly been utilized in designing the most effective and efficient handheld scanners. The primary benefits of handheld scanners are their portability and higher acquisition speeds. For some users, the cost also plays a significant role when it comes to selecting a particular device for the given application. For example, Tong J., et al. employed a low cost 3D data-acquisition technique based on the Microsoft Kinect sensor [10]. This scanning system was used for capturing the complete 3D human body using multiple Kinect sensors. They employed two Kinect sensors to capture the upper part and lower part of the body, while the third Kinect sensor was used to capture the middle part of the body. This low-priced system produced very good results in a relatively short time, and demonstrated the importance of performing a comparative evaluation (keeping in mind the application requirements) of all available systems before making a final decision. Besides low costs, other user requirements may include high-density points and the ability to measure deep features or internal cavities, short times, high accuracy, etc. [11]. The different user requirements and varying capabilities of each system demand a discrete assessment of the individual scanners, as well as a comparative evaluation of the several available scanning systems. There is a plethora of existing research in which the effects of scanning parameters were investigated and the RE process was evaluated. For example, Al-Ahmari and Aalam (2015) employed design of experimental techniques to optimize surface reconstruction parameters in the RE of free-form surfaces [12]. The authors investigated the effects of noise reduction, number of points, triangle count, and sampling on the surface accuracy, computational time, and computer memory. The case study involved two types of point clouds, which were obtained using a fixed Coordinate Measuring Machine (CMM) laser line scanner and a portable CMM laser line scanner. Similarly, Mian et al. (2014) investigated the performance of three different scanning techniques, including a laser line scanning probe, an active scanning probe, and a passive scanning probe attached to a bridge-type CMM [13]. The Taguchi approach was used in the experimental design to determine the appropriate values for the scanning parameters to achieve the shortest scanning time and lowest error. To evaluate the effect of laser scanning parameters, as well as the object position and angle on the scanner accuracy, Gerbino et al. (2016) [14] also employed design of experiment methodology. They used Geomagics software to evaluate the accuracy of scanning objects. Contact and non-contact systems (based on laser digitizing) have also been compared by Martınez S., et al. (2010) to study dimensional accuracy [15]. Tóth and Živčák (2014) studied the Steinbichler Comet L3D optical scanner and the Creaform EXAscan laser scanner for a comparative evaluation [16]. They used Volume Graphics VGStudio MAX 2.2 software to evaluate the deviation between the scanned models and the CAD model. The Analytic Hierarchy Process, which has powerful comparison capabilities, may also be used in addition to the design of experiment approach. For example, Duss A. (2012) employed Analytic Hierarchy Process to investigate the capabilities (accuracy, repeatability, measuring speed, work envelope, and ease of use) of four different RE hardware systems [11]. Moreover, to evaluate the performance of the several contactless data acquisition devices, Iuliano L., et al. (2010) designed a reference part using basic geometries and free-form surfaces [17]. They compared the two systems by considering the dimensional and geometrical tolerances, as well as other quantitative and qualitative criteria. Additionally, three calibrated test parts (a sphere, cylinder, and gauge block) were utilized by Barbero and Ureta (2011) to compare the accuracy of five 3D scanners [18]. On the basis of their study, they concluded that the scanners that used white light (Comet, Atos) provided the highest accuracy. A structured methodology developed by Minetola P., et al. (2015) was used to compare different RE programs applicable to inspection activities [19]. Six RE software programs, including PointMaster v.5.3.3, Gom Inspect v.7.5, Geomagic Qualify v.12, 3D Reshaper v.7.1, Rapidform XOV2, and Polyworks Inspector v.12 were compared to evaluate their performances. In recent times, Pagliarulo et al. (2017) [20] have combined the data from Electronic Speckle Pattern Interferometry (ESPI) with laser scanning data for 3D characterization of racing tyres sections.
A comparative evaluation of different systems is highly valuable when several options are available for a particular application. To conduct a reliable assessment, a robust tool or technique such as design of experiment must be employed. Therefore, in this work, handheld laser and white light scanners have been evaluated (for an automotive application) using a design of experiment approach.
2. Materials and Methods
In this study, the two handheld scanners based on a laser (ViuScan from Creaform Inc., Lévis, QC, Canada) (Figure 2a) and white light (Goscan from Creaform Inc., Lévis, QC, Canada) (Figure 2b) are evaluated.
The two handheld scanners evaluated in this work were manufactured by Creaform (Creaform Inc., Quebec, Canada) [8]. These scanners are portable and self-positioning, meaning that they use positioning targets for reference. With the laser-based handheld scanner, two crossing laser lines are projected onto the object surface, while with the white light scanner, a light pattern is projected onto the object surface. The technical specifications as defined by the manufacturer can be seen in Table 1.
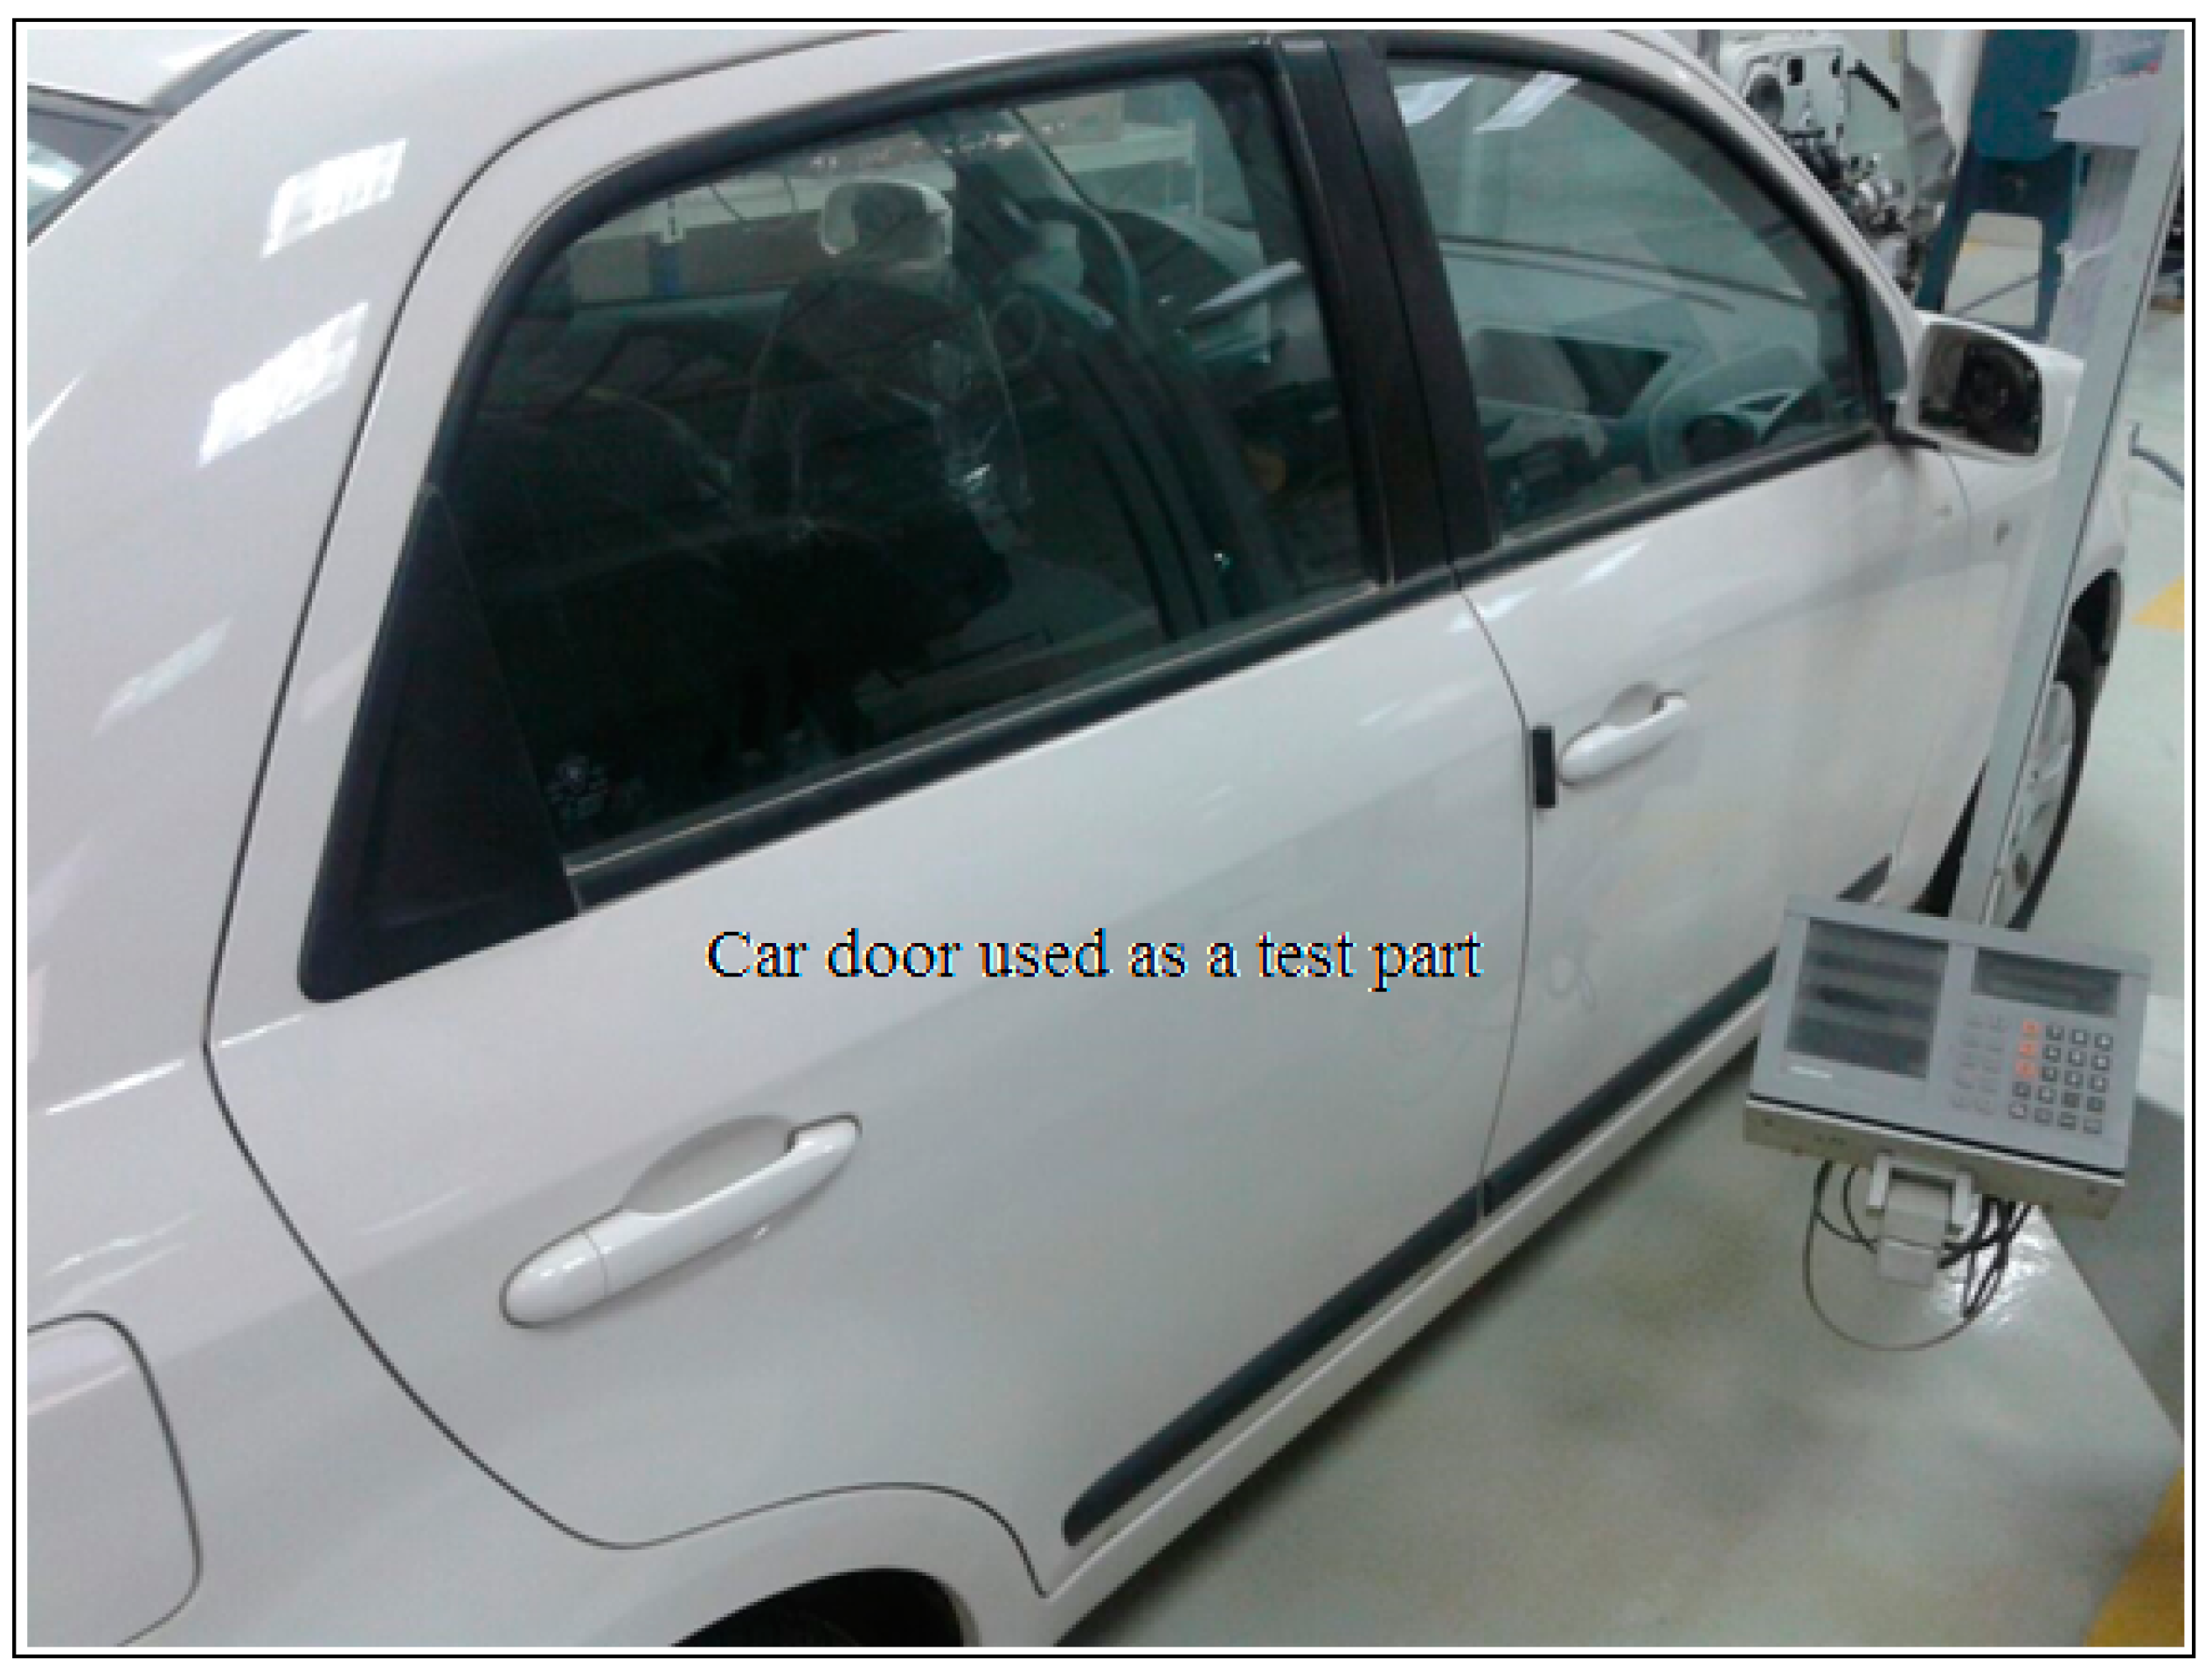
The test part considered in this investigation was the automotive car door shown in Figure 3. This component was selected because it provided a free-form surface and was large enough to evaluate the performance effectively. Besides accuracy and scanning time, the factors such as portability and ease of use are also important factors that govern the selection of scanners for the desired application. The portability in the current scenario has been defined as the ease or proficiency with which the scanner can be transferred or moved from one place to another. The portability can be determined by the weight of the scanner, setup time, etc. Similarly, the ease of use defines the user-friendliness, ease of learning, and applicability of the scanner. The ease of use may depend on the number of the scanning parameters, set up procedure (easy or difficult), and number of operators required, amongst other factors.
Besides analysis of variance (ANOVA) and main effect plots, the optimization plots were utilized to optimize the different factors involved in achieving the desired response values. Since, different responses were involved in this study, composite desirability instead of individual desirability was used to optimize the set of responses. This approach was based on the desirability function for the optimization of multiple response processes [21]. Specifically, the overall desirability can be defined as the geometric mean of the desirability for each response. A desirability value of one represents the ideal case. An optimal solution occurs when composite desirability attains its maximum.
Experimental Procedure
The investigation of the two handheld scanners commenced with the preparation of the test part and the calibration of the two scanners. The positioning targets were applied to the surface of the car door as shown in Figure 4a. The distance between each target was maintained in the range of 2–10 cm. The larger distances were preferably located on the flat surfaces, while the shorter distances were preferably located on the curved surfaces. The calibration plate shown in Figure 4b was used to calibrate the scanners. Notice that the room ambient light does not have an effect on the measurement results for both scanners (Courtesy: Creaform). Therefore, the effect of luminosity (surrounding light or brightness) was assumed negligible. Moreover, the same luminosity was maintained during the scanning using the two different scanners. To further validate this assumption, experiments were carried out under different intensities of room ambient light.
The procedure to compute the accuracy that can be achieved with each scanner can be realized in Figure 5. Initially, a CAD model was obtained using the CMM for the real car door part. This CAD model was referred as “reference CAD model”. Subsequently, the scanned models acquired through laser scanner, as well as the white light scanner, were evaluated with reference CAD model using 3D comparison in Geomagics (Geomagics 2014, 3D systems, Rock Hill, SC, USA).
A medium-size bridge-type CMM (Accura, Zeiss, Oberkochen, Germany) with an accuracy of (1.6 + L/333) μm, which complied with DIN EN ISO 10360-2:2001, was employed in this investigation as shown in Figure 6. A continuous passive scanning touch probe system was utilized to collect the data points on the car door. Since the accuracy of point coordinates is dependent upon scanning parameters therefore, it was very important to select the appropriate scanning parameters. The scanning parameters adopted to obtain the data points for reference CAD model were: scanning speed—5 mm/s, distance between lines—0.3 mm, distance between points—0.0025 mm, and distribution of points—uniform.
Design of experiment was employed to design and conduct the experiments, as well as to analyze the performance of the two scanners. The first step was the identification of controlled scanning parameters for both the scanners. From a literature survey and the manufacturers’ working guides, initial trial experiments factors were identified for the handheld laser scanner, and two controlling factors were found for the white light scanner as shown in Table 2. When using the white light scanner, the light power was adjusted automatically depending on the surface, and was thus not selected as a controlled scanning factor. Three levels were selected for each factor based on the initial trial experiments.
The resolution defines the ability of the scanner to capture the smallest possible detail in the specified axis; it is measured in mm. The shutter time is the time taken by the camera (of the scanner) to capture each image; it is measured in ms. Similarly, the laser power defines the power of the emitting laser from the 3D scanner and is determined by percentage.
A general full factorial design was used to generate the different factor combinations to perform the experiments randomly. Based on the number of factors and the levels, the total number of runs was equal to 27 runs for the laser scanner and 18 runs for the white light scanner. Minitab version 16 was used to determine the effects that the different factors have on the accuracy, scanning time, and number of triangles. In order to determine the ease of use and portability of each scanner, a usability (user base study) study was conducted. In this study, a number of users (minimum of 10) operated each of the two scanners several times, and their workflow was observed by expert users. Moreover, a questionnaire regarding the ease of use and portability was administered to the users. The accuracy was measured as the root mean square (RMS) deviation between the acquired data (for a given combination of factors) by laser scan and the reference CAD model using the Geomagics 3D comparison feature shown in Figure 7.
3. Results and Discussion
As shown in Figure 8, the data points captured using the laser scanner were complete and had better quality in terms of lesser noise, insignificant gaps or holes, consistent boundary, etc.
On the contrary, the data points acquired by using white light scanner possessed inconsistent edges or borders, greater noise, numerous gaps or holes, etc., as shown in Figure 9.
The primary defects observed in the data acquired by using white light scanner were missing data (e.g., small holes, gaps, etc.), erratic borders or edges, higher noise, etc., as shown in Figure 10. These gaps or irregular edges complicate the subsequent steps such as surface reconstruction process and diminish the efficiency of RE process. In addition, big holes were observed that might have resulted from unrecognized target points in which the scanner assumed the targets as holes.
The RMS value of deviations, scanning time, and triangle numbers at different combinations of scanning parameters can be seen in Table 3.
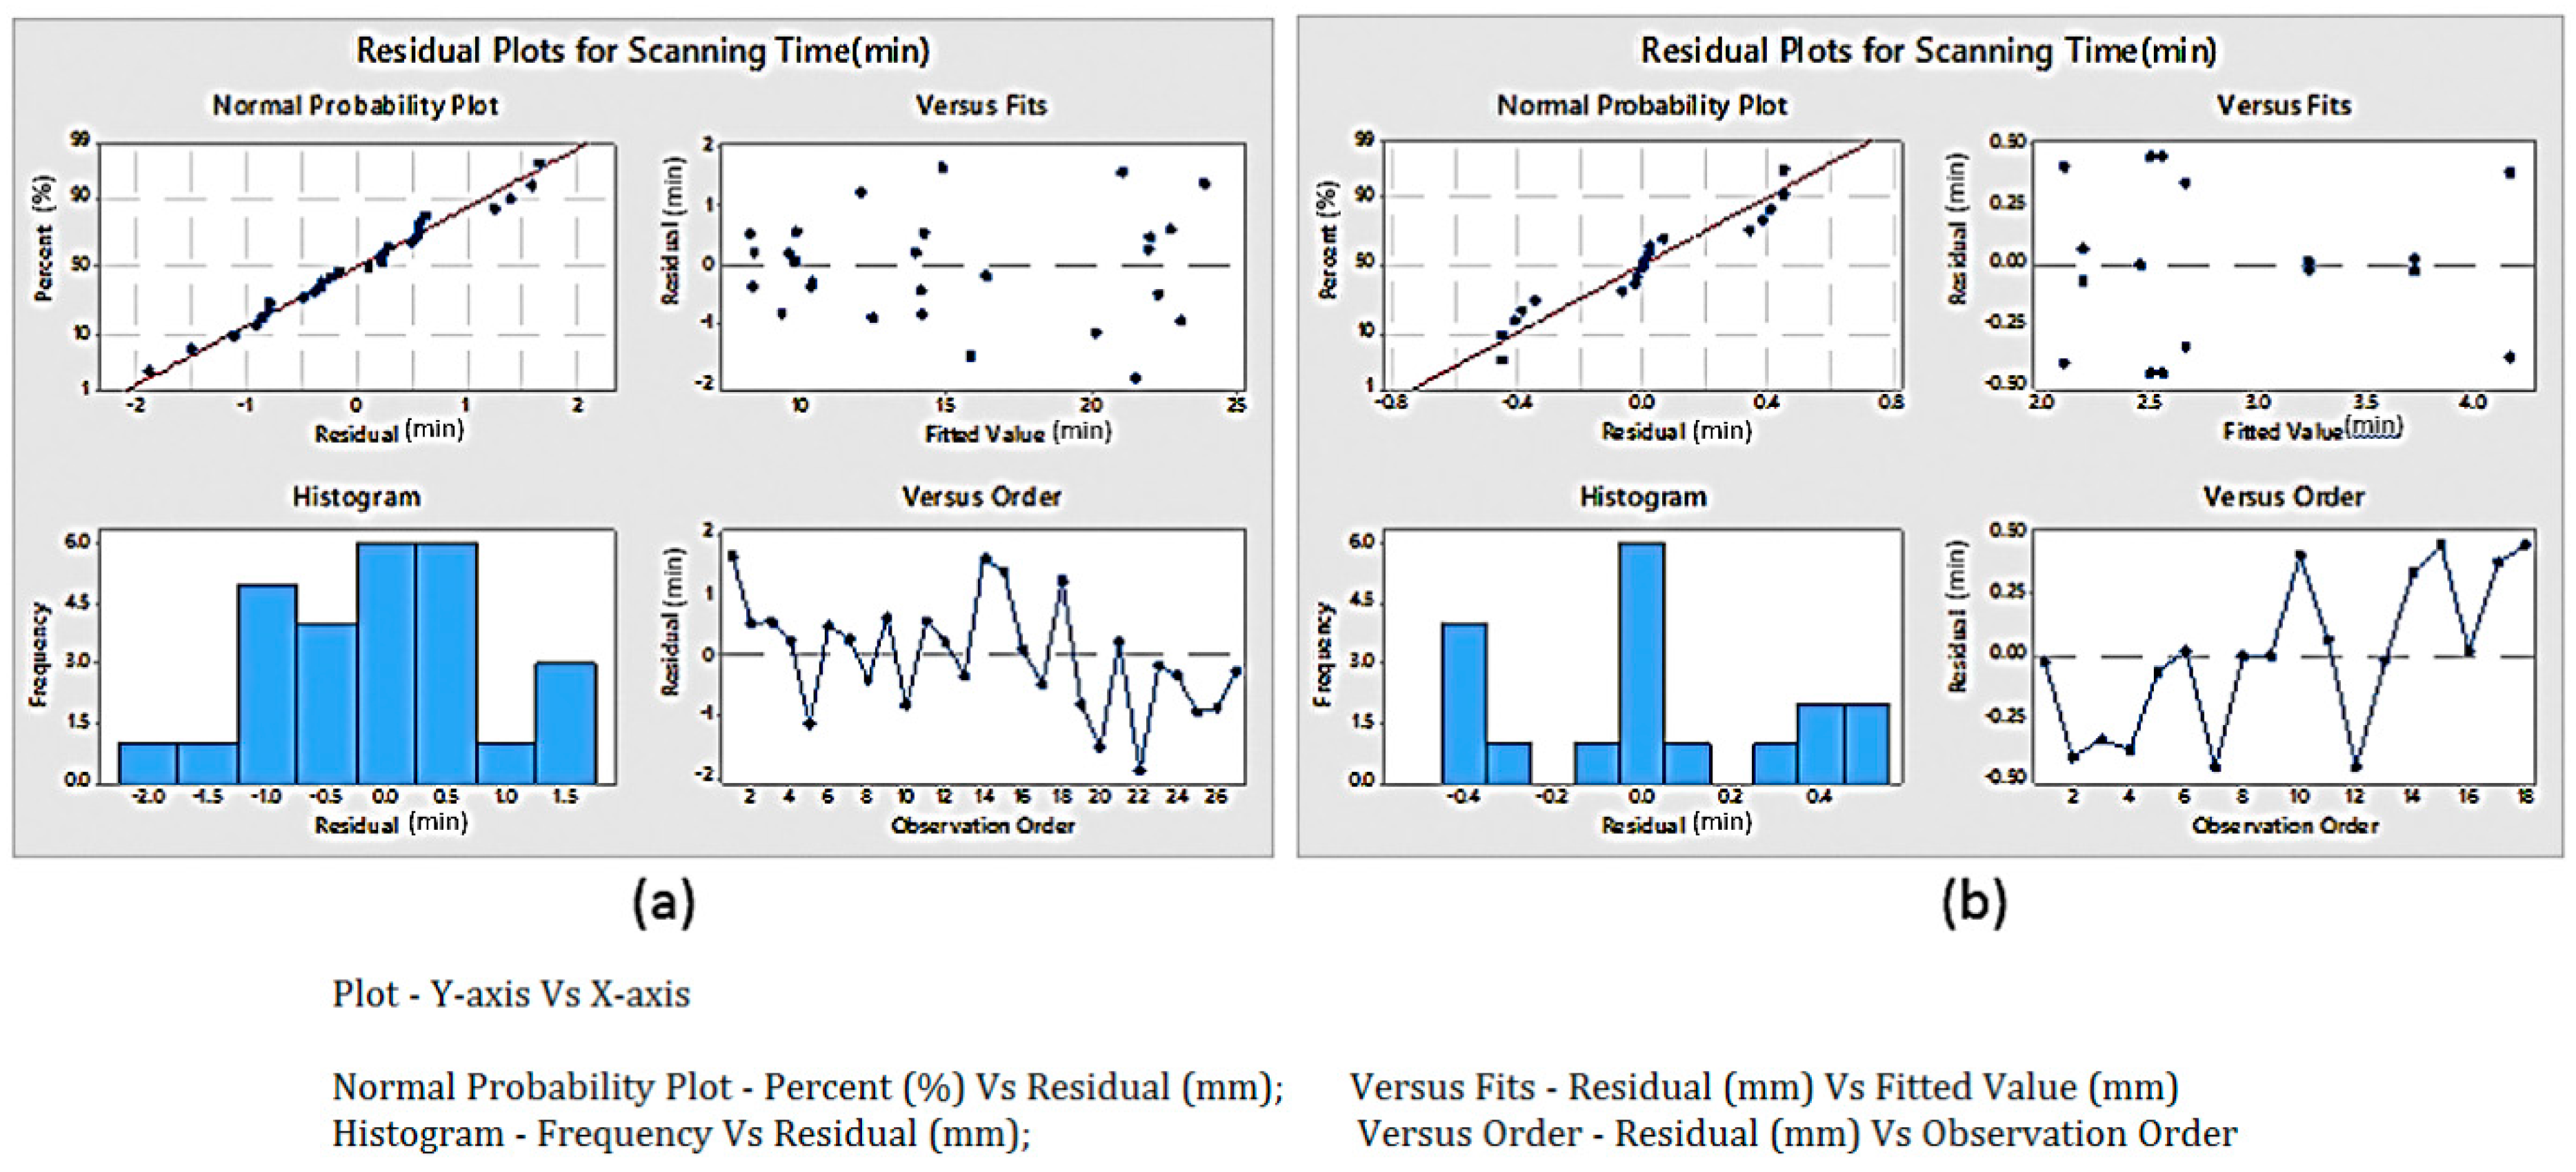
To confirm the normality of the data sets, a normality test of data points for each response was carried out. Subsequently, to analyze the results, ANOVA and main effect plots were studied. The normality assumption for accuracy shown in Figure 11 depicts that the data points were normal and could successfully be used for ANOVA. Similarly, normality tests for the other response (scanning time) of the two scanners confirmed their normality for consecutive analyses as shown in Figure 12. Normality test for the number of triangles in laser scan was valid as shown in Figure 13a, whereas the normality test for the number of triangles in white light scan was not valid as shown in Figure 13b. Therefore, the Log data transformation was conducted and the normality assumption was tested again as shown in Figure 13c. It is clear that the normality assumption was valid (refer Figure 13c).
The measurement units for residuals are same as that of the response. For example, the measurement unit for the residual of scanning time is in minutes. An ANOVA test with 95% confidence was performed to determine the significance of the parameters, as well as the interaction between them.
It can be seen that all of the adopted controlling factors, except laser power, have significant effects (p < 0.05) on the accuracy for the case of the laser scanner as shown in Table 4. It can also be seen that the shutter time and interaction of laser power and shutter time have the most significant effects, whereas no significant effects were observed for the laser power and the interaction of shutter time and resolution. However, the shutter time and the resolution do not possess a significant effect on the accuracy of the white light scanners. Apart from the resolution, no other factors have a significant effect on the scanning time or number of triangles in both types of scanners as shown in Table 5 and Table 6, respectively.
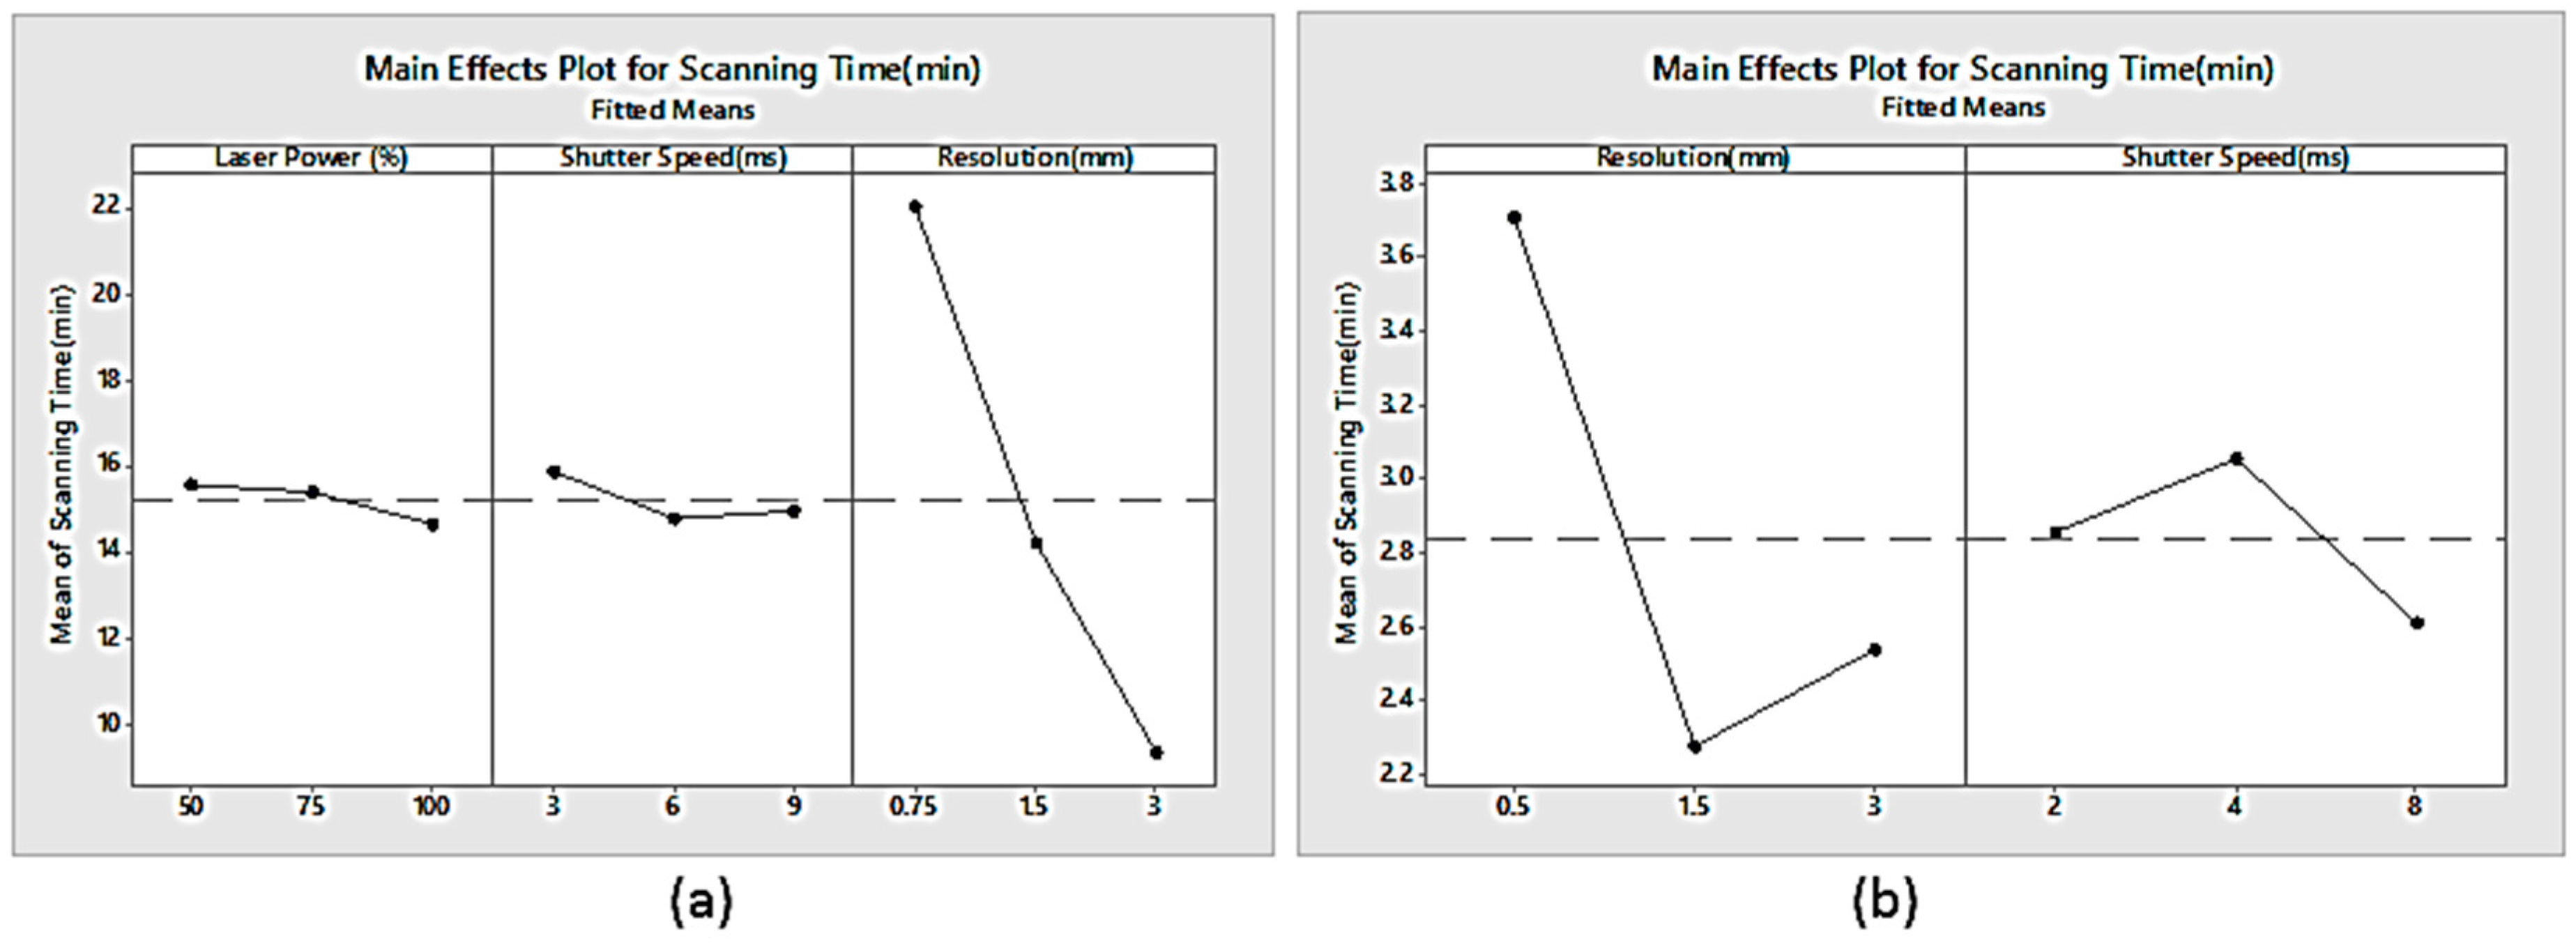
The main effects plot shown in Figure 14a clearly shows that in case of the laser scanner, the highest accuracy was achieved with a laser power of 100%, shutter time of 6 ms, and a resolution of 0.75 mm. In case of the white light scanner (Figure 14b), the highest accuracy can be achieved with a shutter time of 4 ms and a resolution of 1.5 mm. As shown in Figure 15a, the lowest scanning time was obtained with a laser power of 100%, shutter time of 6 ms, and a resolution of 3 mm in case of the laser scanner. In the case of the white light scanner, the lowest scanning time was achieved at a shutter time of 8 ms and a resolution of 1.5 mm (Figure 15b). The lowest number of triangles was obtained at a resolution of 3 mm in the case of both the laser and white light scanners as shown in Figure 16a,b.
3.1. Multi-Objective Optimization
The optimization plots obtained using response optimizer (courtesy: Minitab) for the two scanners are shown in Figure 17a. The desirability value for each case should either be one or close to one in order to validate this analysis. Since, the composite desirability (0.9405) is close to 1, it indicates that the objective of highest accuracy in the minimum scanning time with the smallest number of triangles can be accomplished with a laser power of 50%, shutter time of 6 ms, and resolution of 3 mm Similarly, the composite desirability for the white light scanner is close to 1 (0.8446). Hence, a shutter time of 8 ms and resolution of 1.5 mm can be used to achieve highest accuracy in the minimum scanning time with the smallest number of triangles as shown in Figure 17b.
The accuracy comparison reveals that the laser scanner (deviation = 0.1285 mm) provided better accuracy than the white light scanner (deviation = 0.1995 mm). However, the white light scanner required less scanning time (2.6585 min) than the laser scanner (10.3607 min) as shown in Figure 17. Similarly, the number of triangles generated by the white light scanner (142,659) was less than the number of triangles generated by the laser scanner (148,800). The triangle number is important because it determines the computer processing time, as well as the accuracy. In particular, a larger number of triangles improves accuracy, but it also increases the processing time. There should be a balance between the desired accuracy and the processing time. The processing time is defined as the time taken by the software to convert the polygon model into a final CAD model. Therefore, the data acquired by the laser scanner requires a longer processing time as compared to the polygon model captured by the white light scanner.
3.2. Cost, Portability, and Ease of Use
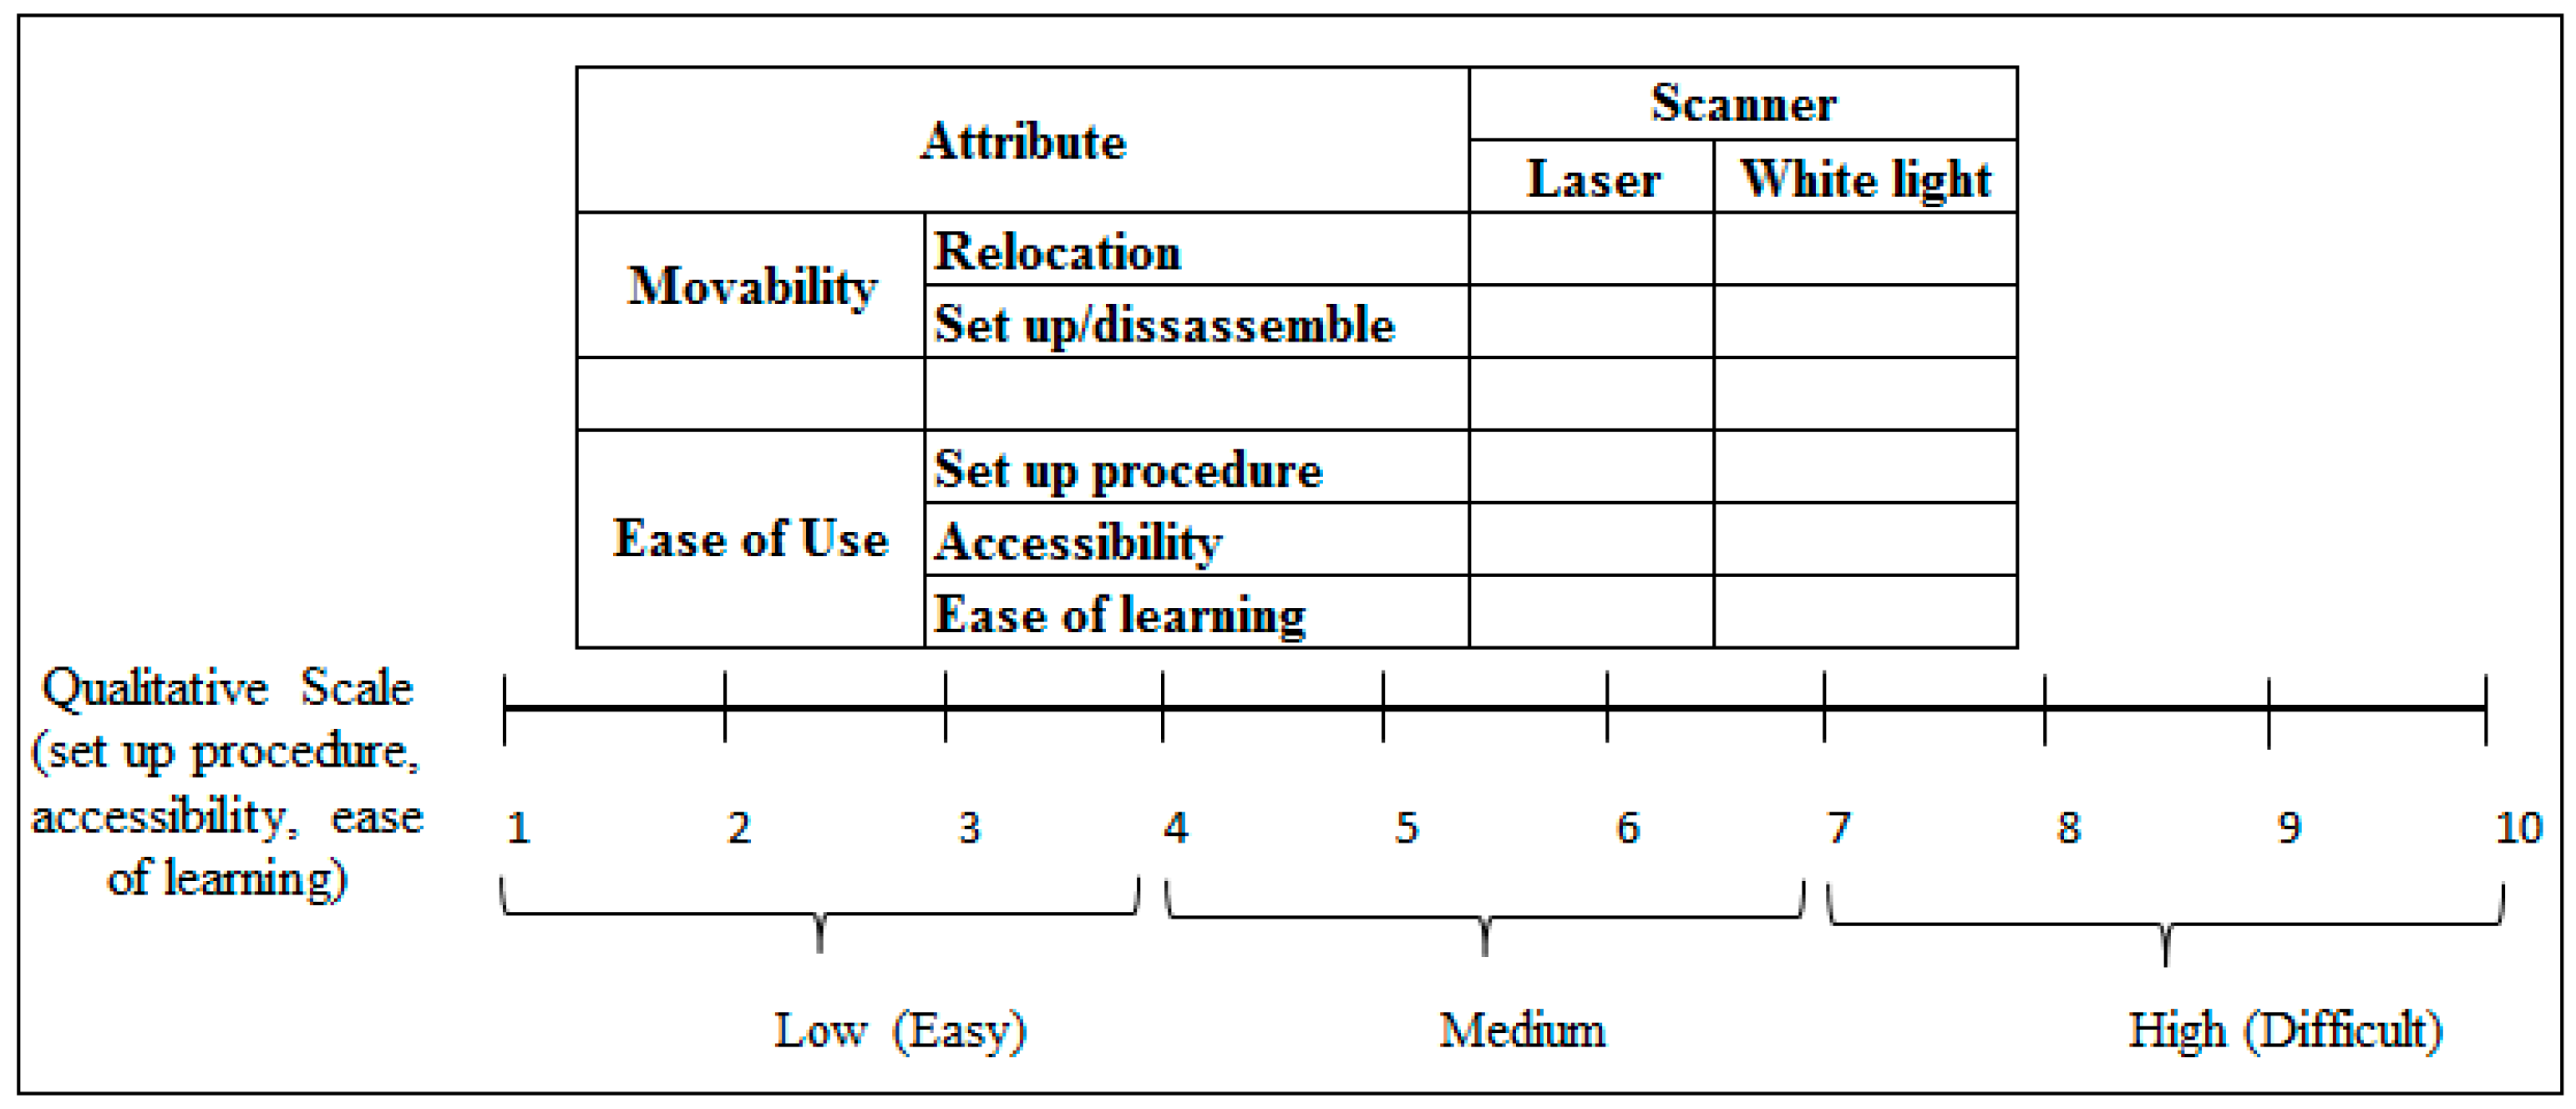
As part of this study, a user-based study was carried out and administered to the users of the scanners. It included several questions regarding the set-up procedure, ease of use, and accessibility. The users were asked to rate the set-up procedure, ease of use, and accessibility. The users were requested to rate the scanners on the scale of 1 to 10, with 1 pointing at low value, while 10 represented higher value as shown in Figure 18. Notice that the students and researchers who had undergone at least eight hours of training on the scanners or had used scanners in some of their projects were eligible for this study. A total of ten users, based on their experience, rated the different scanners. Once all the ratings were obtained, an average was computed to achieve the final ratings. Based on the study, the qualitative comparison of two scanners was obtained. It was found that the white light scanner was easy to move from one location to another as compared to the laser scanner. The reason can be attributed to its lower weight, as well as lower set up time (or dismantle time. Moreover, white light scanner was easy to use in contrast to the laser scanner. According to the majority of users, the white light scanner was easy to understand; it also had higher accessibility on the part.
3.3. Influence of Illumination
In order to evaluate the effect of the illumination on the performance of the two scanners, three levels of the illumination (221, 111 and 8 lux) were considered. The light meter LT300 (Extech instruments, Waltham, MA, USA) was used to measure the illumination values. The different levels were selected in order to represent the maximum, intermediate, and minimum illumination in the room. The optimized parameter settings of the scanners were used to acquire the data. The data set acquired by the two scanners in different light intensities showed no significant difference. For example, the deviation obtained for data acquired at different intensities showed minimal spread (standard deviation for laser scanner: 0.00858 mm and standard deviation for white light scanner: 0.0045 mm).
3.4. Validation Experiment
Twenty male university students from King Saud University (KSU) with a mean age of 25.5 ± 2.5 years were randomly selected for this study. This study aimed to validate the results obtained in the previous analysis, as well as study the effect of humans. All participants were right handed with normal vision (self-reported), and none of them had any health problems. Also, the participants were randomly selected to scan the car door part using the laser and white light scanners. All experiments were conducted using the obtained optimized parameter settings. Ten students scanned the car door part using the laser scanner, while remaining ten used the white light scanner.
When the two sets of results (ten in each set) were compared, it was found that in each of the ten runs, laser scanner provided better accuracy than the white light scanner. The white light scanner required lesser scanning time than the laser scanner. Furthermore, the number of triangles generated by the white light scanner was lesser than the number of triangles generated by the laser scanner.
4. Conclusions
The effects of different scanning parameters have been investigated in order to determine their optimal settings. The following conclusions can be drawn based on this study:
- The resolution and shutter time, as well as the interactions between resolution and laser power, and the laser power and shutter time of the laser scanner, had a significant effect on the accuracy.
- The scanning resolution had a significant effect on the scanning time and the number of triangles in the case of the handheld laser scanner.
- The scanning parameters of the white light scanner did not have a significant effect on the accuracy. However, the resolution had a significant effect on the scanning time and the number of triangles.
- The optimized scanning parameters for the two scanners were identified as follows:Laser scanner: laser power = 50%, shutter time = 6 ms, resolution = 3 mmWhite light scanner: shutter time = 3 ms, resolution = 2 mm.
- The laser scanner demonstrated better accuracy than the white light scanner, whereas the white light scanner demonstrated better acquisition speed.
- The white light scanner is comparatively lighter, possesses higher portability, requires less setup time, and is easier to use than the laser scanner. It also exhibits a shorter processing time (owing to lesser triangles). However, the laser scanner provided better accuracy.
The authors aim to study each scanner thoroughly in order to improve the quality of the acquired data. The key aspects such as holes, defects in borders, false points, etc., will be considered to refine the acquired data and hence reduce the processing time. The effect of various object materials such as transparent, fluorescent, shiny, glossy, etc., will also be investigated in the future work.
Acknowledgments
The authors are grateful to the Deanship of Scientific Research, King Saud University for funding through the Vice Deanship of Scientific Research Chairs.
Author Contributions
Wadea Ameen and Abdulrahman M. Al-Ahmari conceived and designed the study. Syed Hammad Mian and Wadea Ameen designed and conducted the experiments, wrote the manuscript as well as reviewed it. Abdulrahman Al-Ahmari supervised the work.
Conflicts of Interest
The authors declare no conflicts of interest.
References
- Calì, M.; Speranza, D.; Martorelli, M. Dynamic spinnaker performance through digital photogrammetry, numerical analysis and experimental tests. In Advances on Mechanics, Design Engineering and Manufacturing; Eynard, B., Nigrelli, V., Oliveri, S., Peris-Fajarnes, G., Rizzuti, S., Eds.; Lecture Notes in Mechanical Engineering; Springer: Cham, Switzerland, 2017; pp. 585–595. [Google Scholar]
- Scaioni, M.; Barazzetti, L.; Giussani, A.; Previtali, M.; Roncoroni, F.; Alba, M. Photogrammetric techniques for monitoring tunnel deformation. Earth Sci. Inform. 2014, 7, 83–95. [Google Scholar] [CrossRef]
- Raja, V.; Fernandes, K.J. Reverse Engineering: An Industrial Perspective; Springer: London, UK, 2008. [Google Scholar]
- Peng, Q.; Sanchez, H. 3D digitizing technology in product reverse design. In Proceedings of the Canadian Design Engineering Network (CDEN) Conference, Kaninaskis, Alberta, 18–20 July 2005. [Google Scholar]
- Wang, L.; Bi, Z.M. Advances in 3D data acquisition and processing for industrial applications. Robot. Comput. Integr. Manuf. 2010, 26, 403–413. [Google Scholar]
- Varady, T.; Martin, R.; Cox, J. Reverse engineering of geometric models—An introduction. Comput. Aided Des. 1997, 29, 255–268. [Google Scholar] [CrossRef]
- Kuş, A. Implementation of 3D optical scanning technology for automotive applications. Sensors 2009, 9, 1967–1979. [Google Scholar] [CrossRef] [PubMed]
- Creaform. Reverse Engineering of Physical Objects—Teaching Manual. 2014. Available online: https://www.creaform3d.com/sites/default/files/assets/technological-fundamentals/teaching_manual_reverse_engineering_en_18032014.pdf (accessed on 5 April 2017).
- Rianmora, S.; Rangsiyangkoon, M. Alternative Optical Acquisition Technique for Supporting Reverse Engineering Process. Int. J. Mater. Mech. Manuf. 2017, 5, 286–289. [Google Scholar]
- Tong, J.; Zhou, J.; Liu, L.; Pan, Z.; Yan, H. Scanning 3d full human bodies using Kinects. IEEE Trans. Vis. Comput. Graphic 2012, 18, 643–650. [Google Scholar] [CrossRef] [PubMed]
- Duss, A. Development Capability Profiles of Selected Reverse Engineering Techniques. Ph.D. Thesis, University of Stellenbosch, Stellenbosch, South Africa, 2012. [Google Scholar]
- Al-Ahmari, A.; Aalam, J. Optimizing parameters of freeform surface reconstruction using CMM. Measurement 2015, 64, 17–28. [Google Scholar] [CrossRef]
- Mian, S.H.; Mannan, M.; Al-Ahmari, A. Accuracy of a reverse-engineered mould using contact and non-contact measurement techniques. Int. J. Comput. Integr. Manuf. 2015, 28, 419–436. [Google Scholar] [CrossRef]
- Gerbino, S.; Del Giudice, D.M.; Staiano, G.; Lanzotti, A.; Martorelli, M. On the influence of scanning factors on the laser scanner-based 3D inspection process. Int. J. Adv. Manuf. Technol. 2016, 84, 1787–1799. [Google Scholar] [CrossRef]
- Martínez, S.; Cuesta, E.; Barreiro, J.; Álvarez, B. Methodology for comparison of laser digitizing versus contact systems in dimensional control. Opt. Lasers Eng. 2010, 48, 1238–1246. [Google Scholar] [CrossRef]
- Tóth, T.; Živčák, J.A. Comparison of the outputs of 3D scanners. Procedia Eng. 2014, 69, 393–401. [Google Scholar] [CrossRef]
- Iuliano, L.; Minetola, P.; Salmi, A. Proposal of an innovative benchmark for comparison of the performance of contactless digitizers. Meas. Sci. Technol. 2010, 21, 105102. [Google Scholar] [CrossRef]
- Barbero, B.R.; Ureta, E.S. Comparative study of different digitization techniques and their accuracy. Comput. Aided Des. 2011, 43, 188–206. [Google Scholar] [CrossRef]
- Minetola, P.; Iuliano, L.; Calignano, F. A customer oriented methodology for reverse engineering software selection in the computer aided inspection scenario. Comput. Ind. 2015, 67, 54–71. [Google Scholar] [CrossRef]
- Pagliarulo, V.; Farroni, F.; Ferraro, P.; Lanzotti, A.; Martorelli, M.; Memmolo, P.; Speranza, D.; Timpone, F. Combining ESPI with laser scanning for 3D characterization of racing tyres sections. Opt. Lasers Eng. 2017, in press. [Google Scholar] [CrossRef]
- Costa, N.R.; Lourenço, J.; Pereira, Z.L. Desirability function approach: A Review and performance evaluation in adverse conditions. Chemom. Intell. Lab. Syst. 2011, 107, 234–244. [Google Scholar] [CrossRef]
Figure 1.
Classification of data acquisition techniques [3,5,6]. CT: computed tomography; MRI: magnetic resonance imaging.
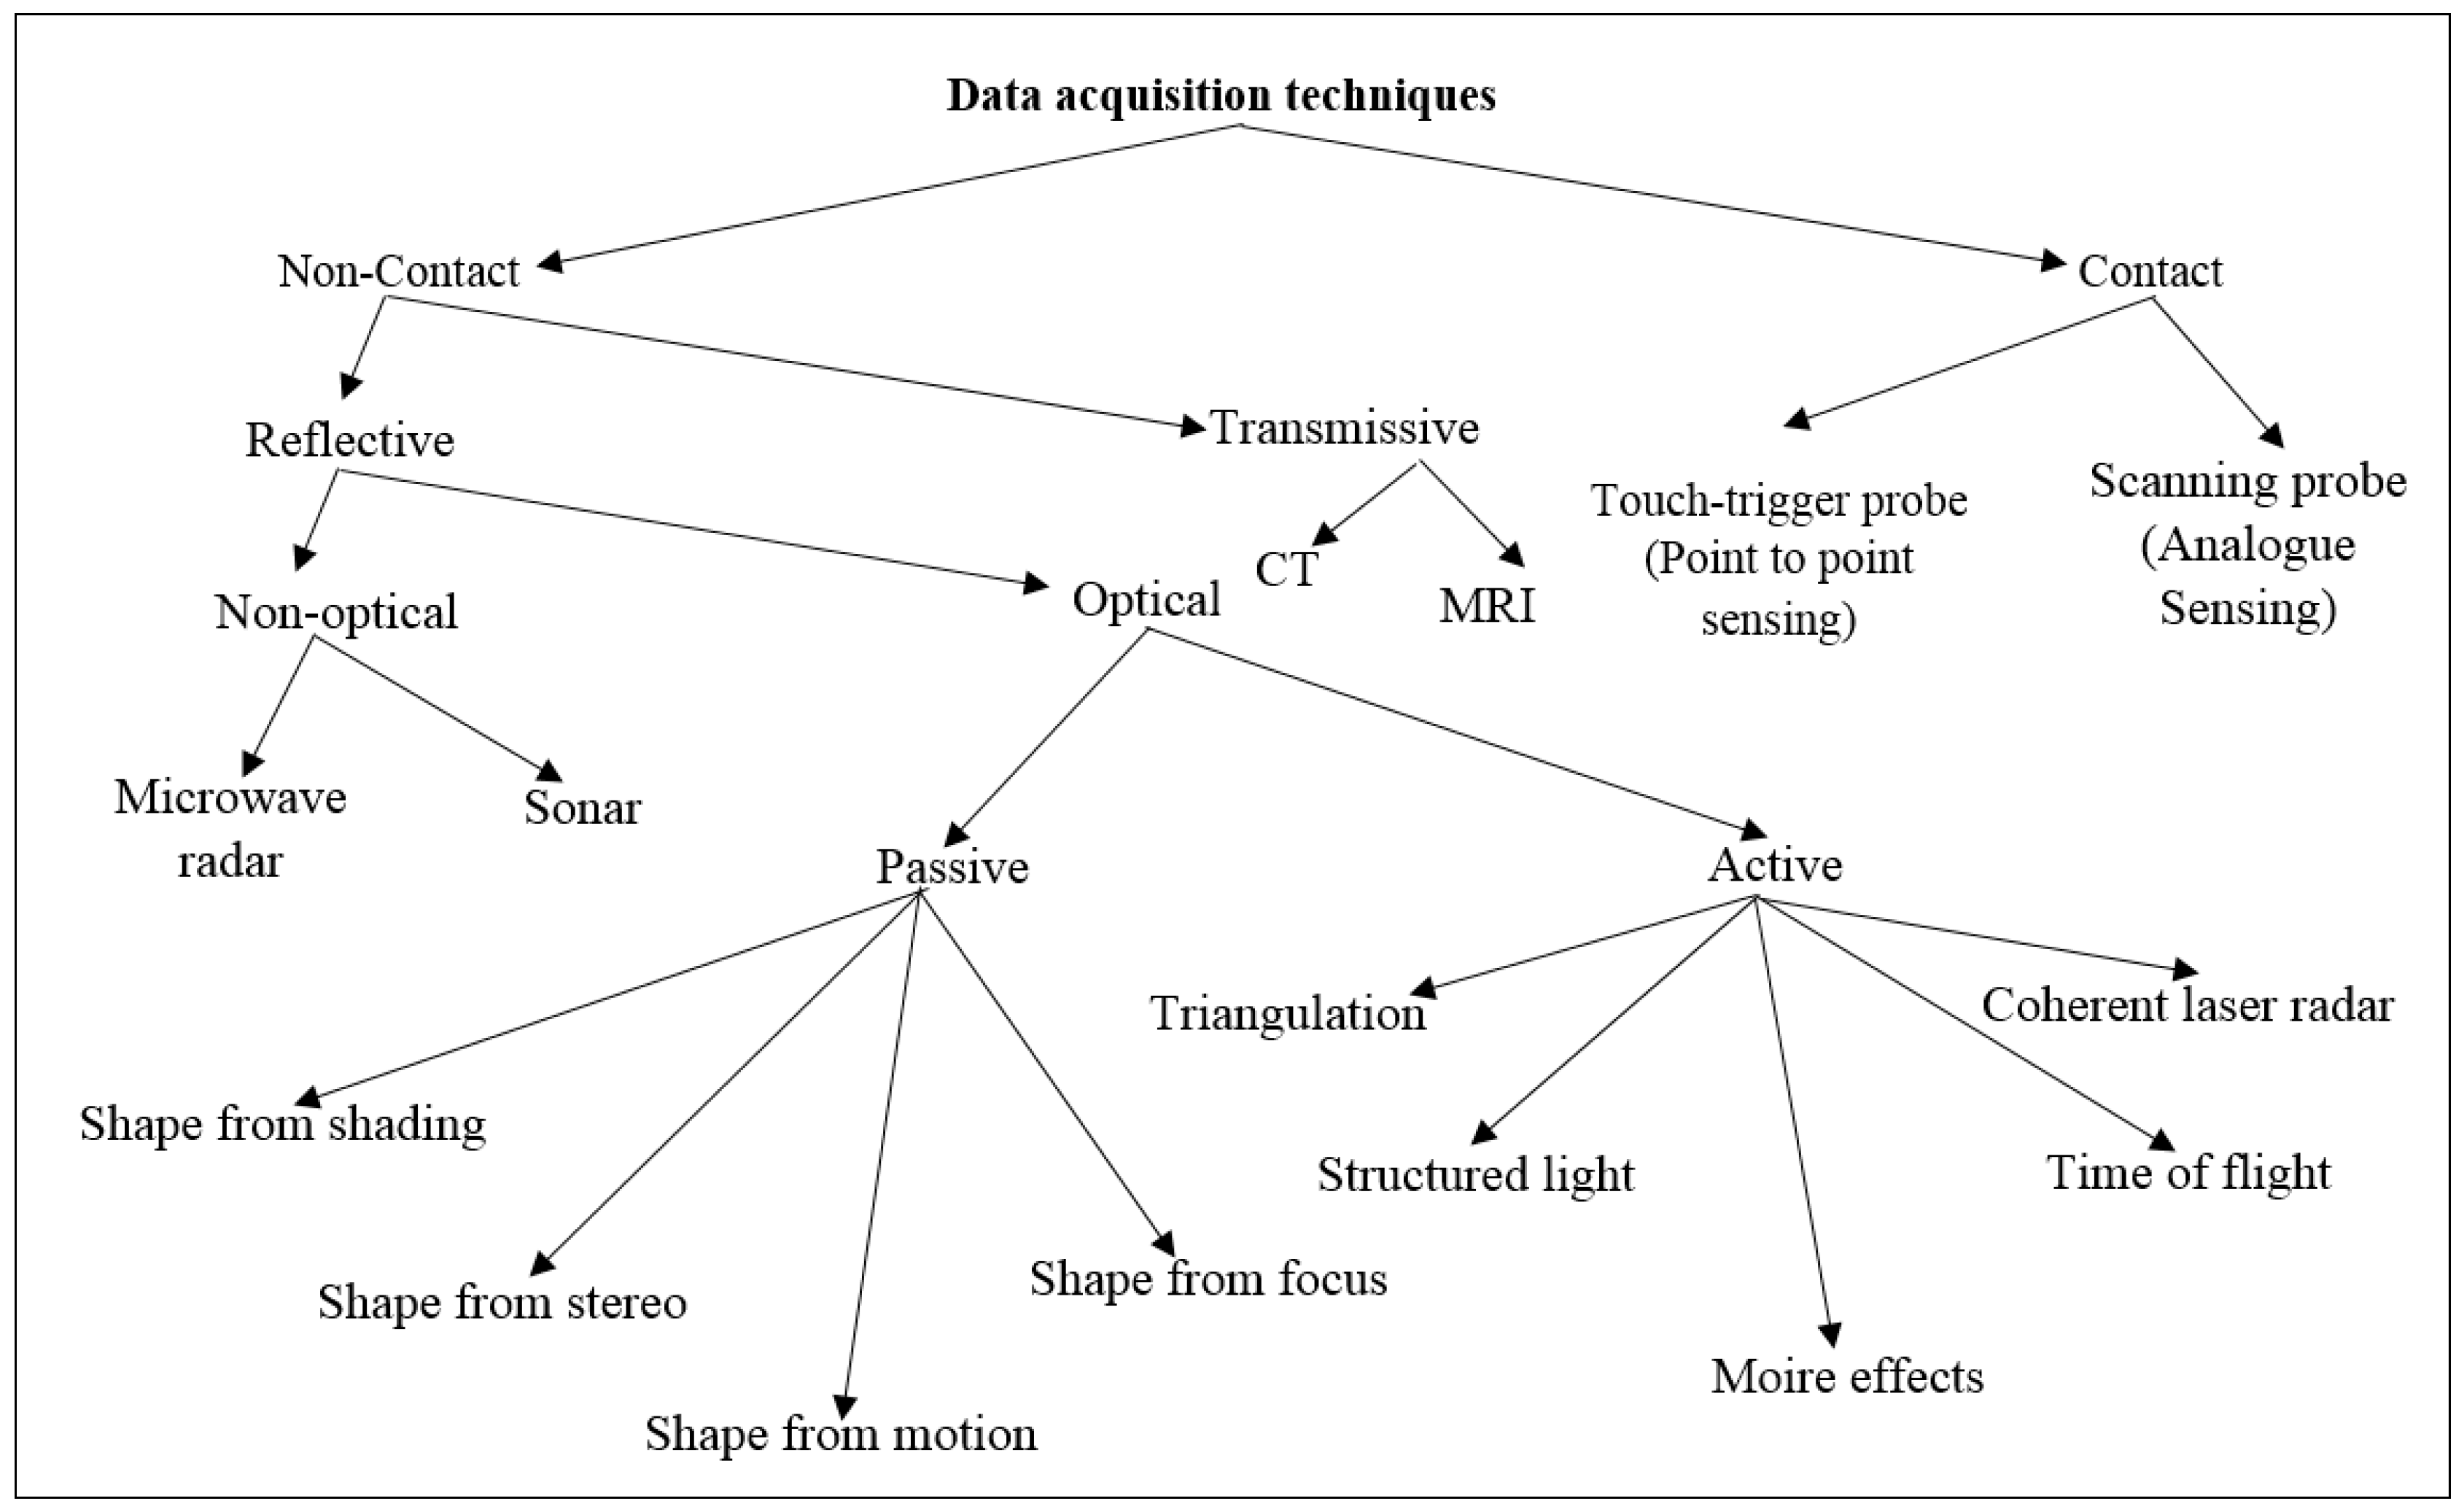
Figure 2.
Handheld scanners (a) laser scanner; (b) white light scanner.
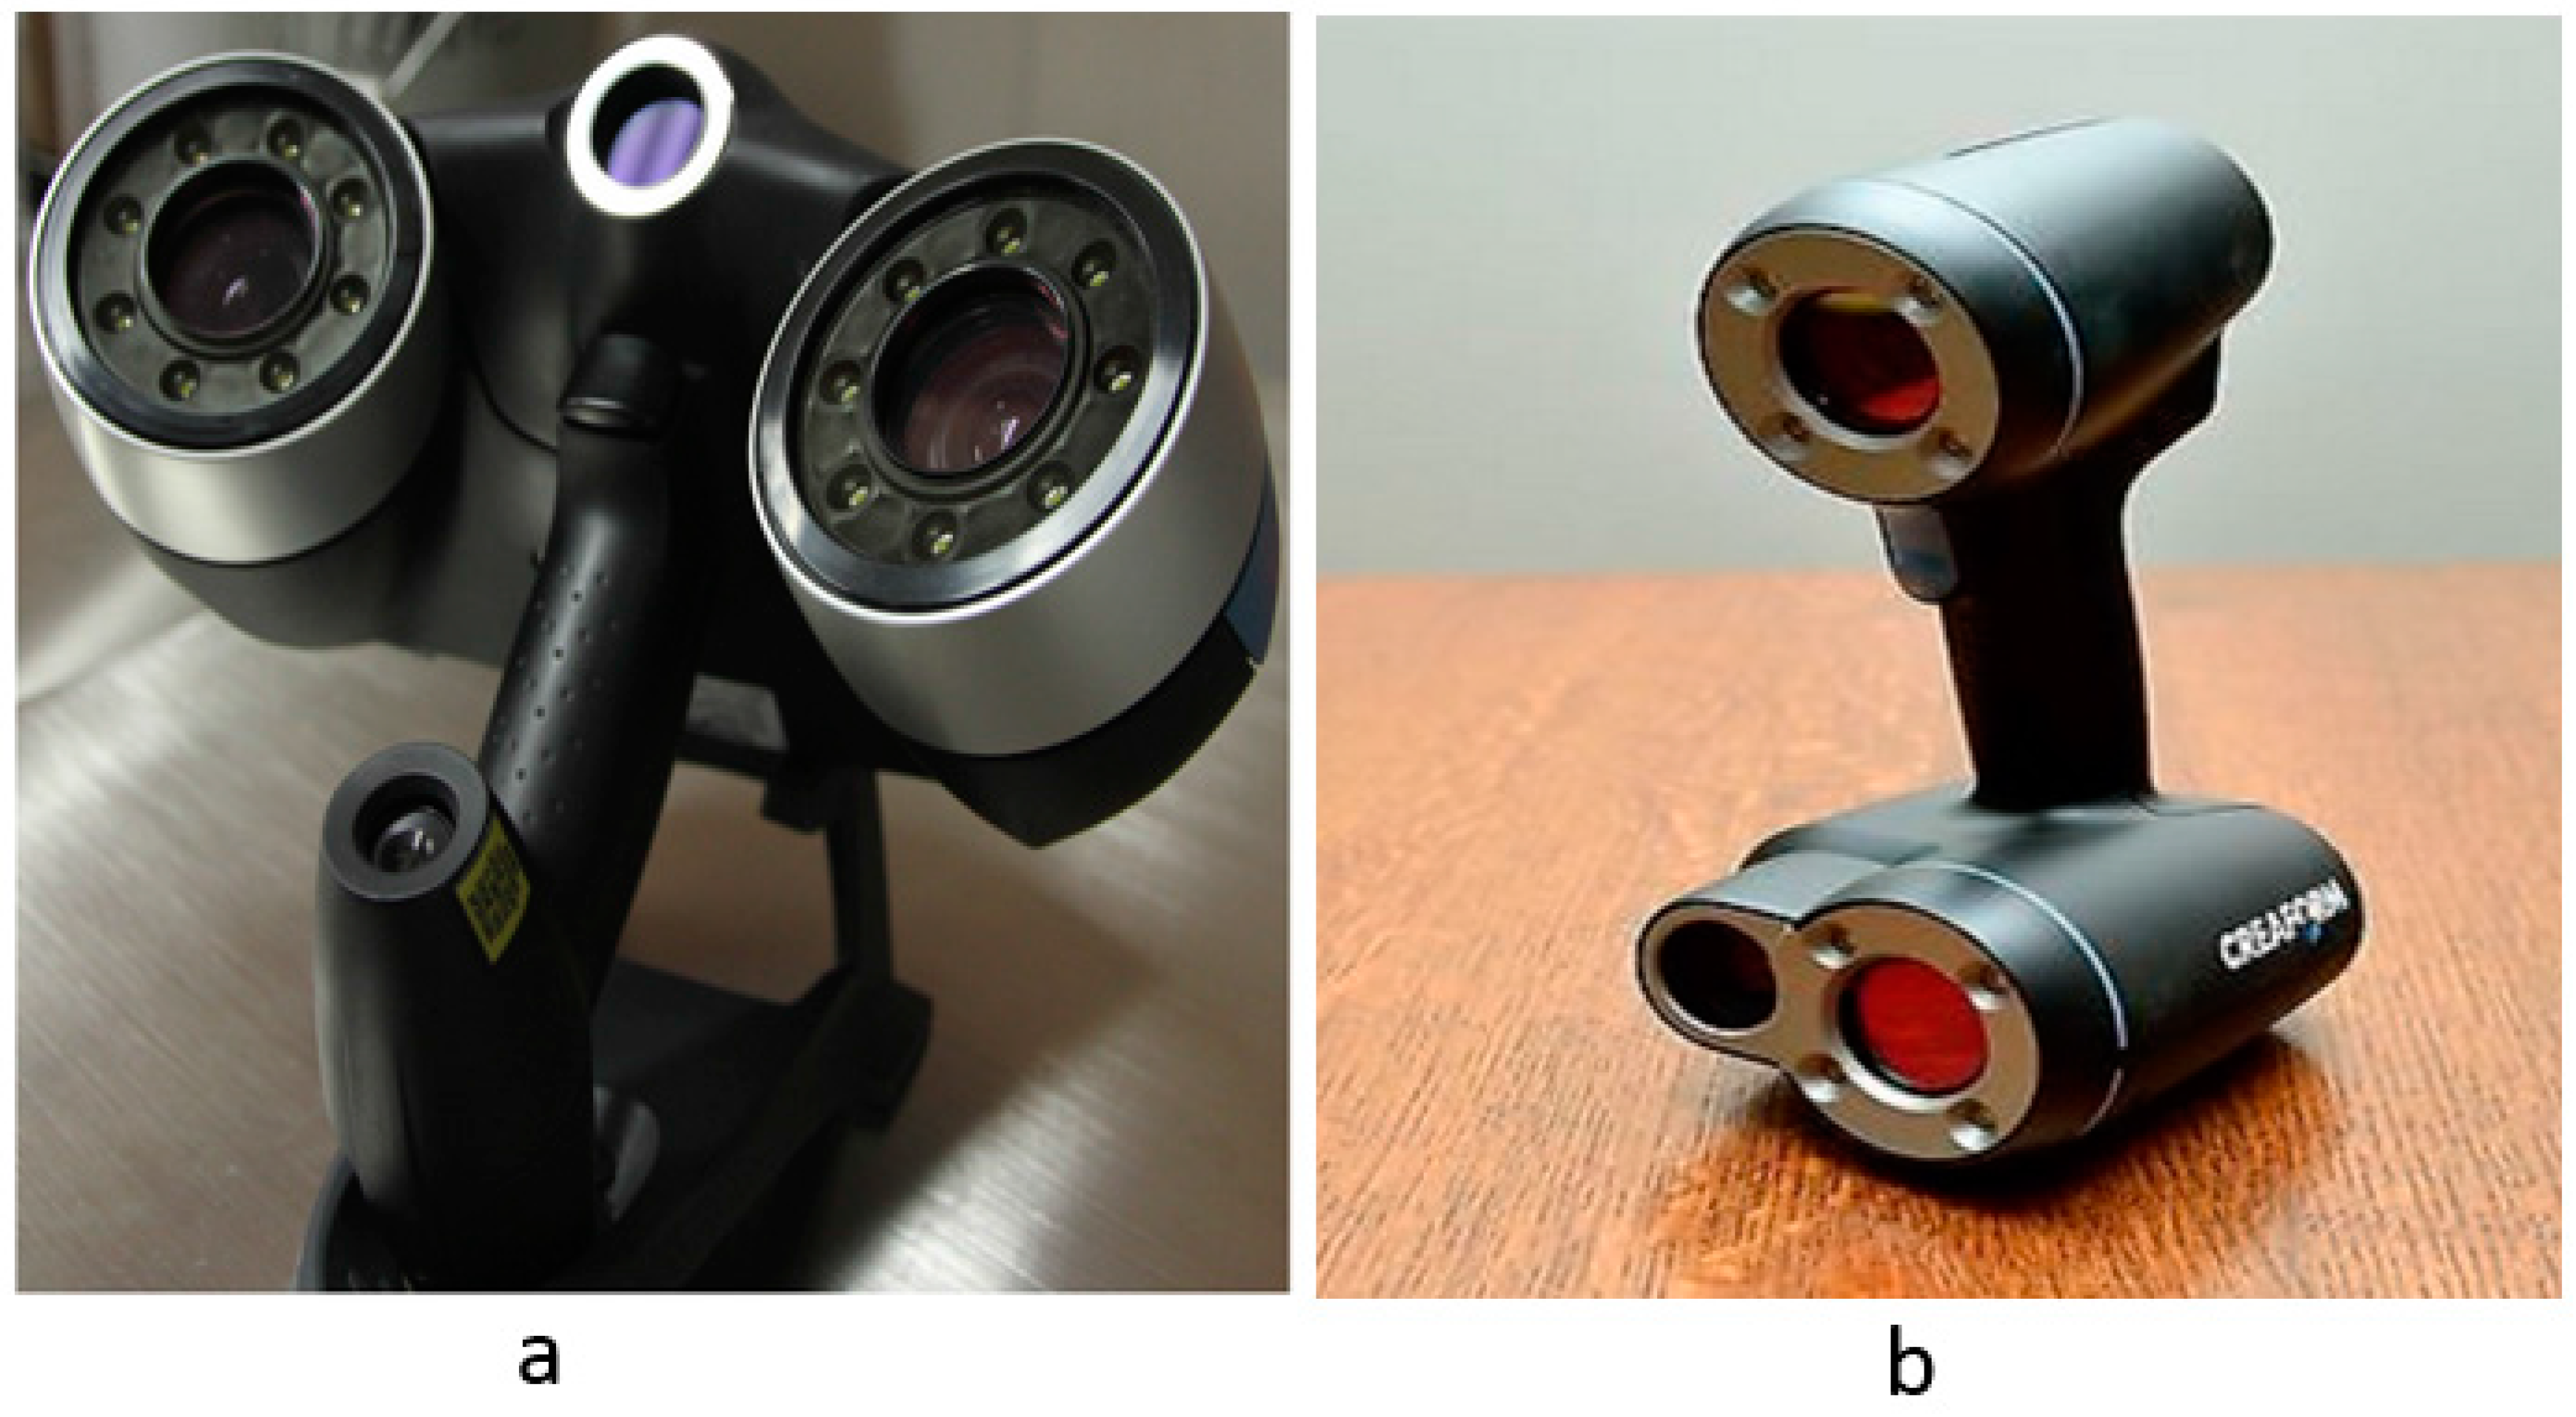
Figure 3.
Test part selected for the comparative evaluation.

Figure 4.
(a) Car door with positioning targets; (b) Calibration of the scanner.
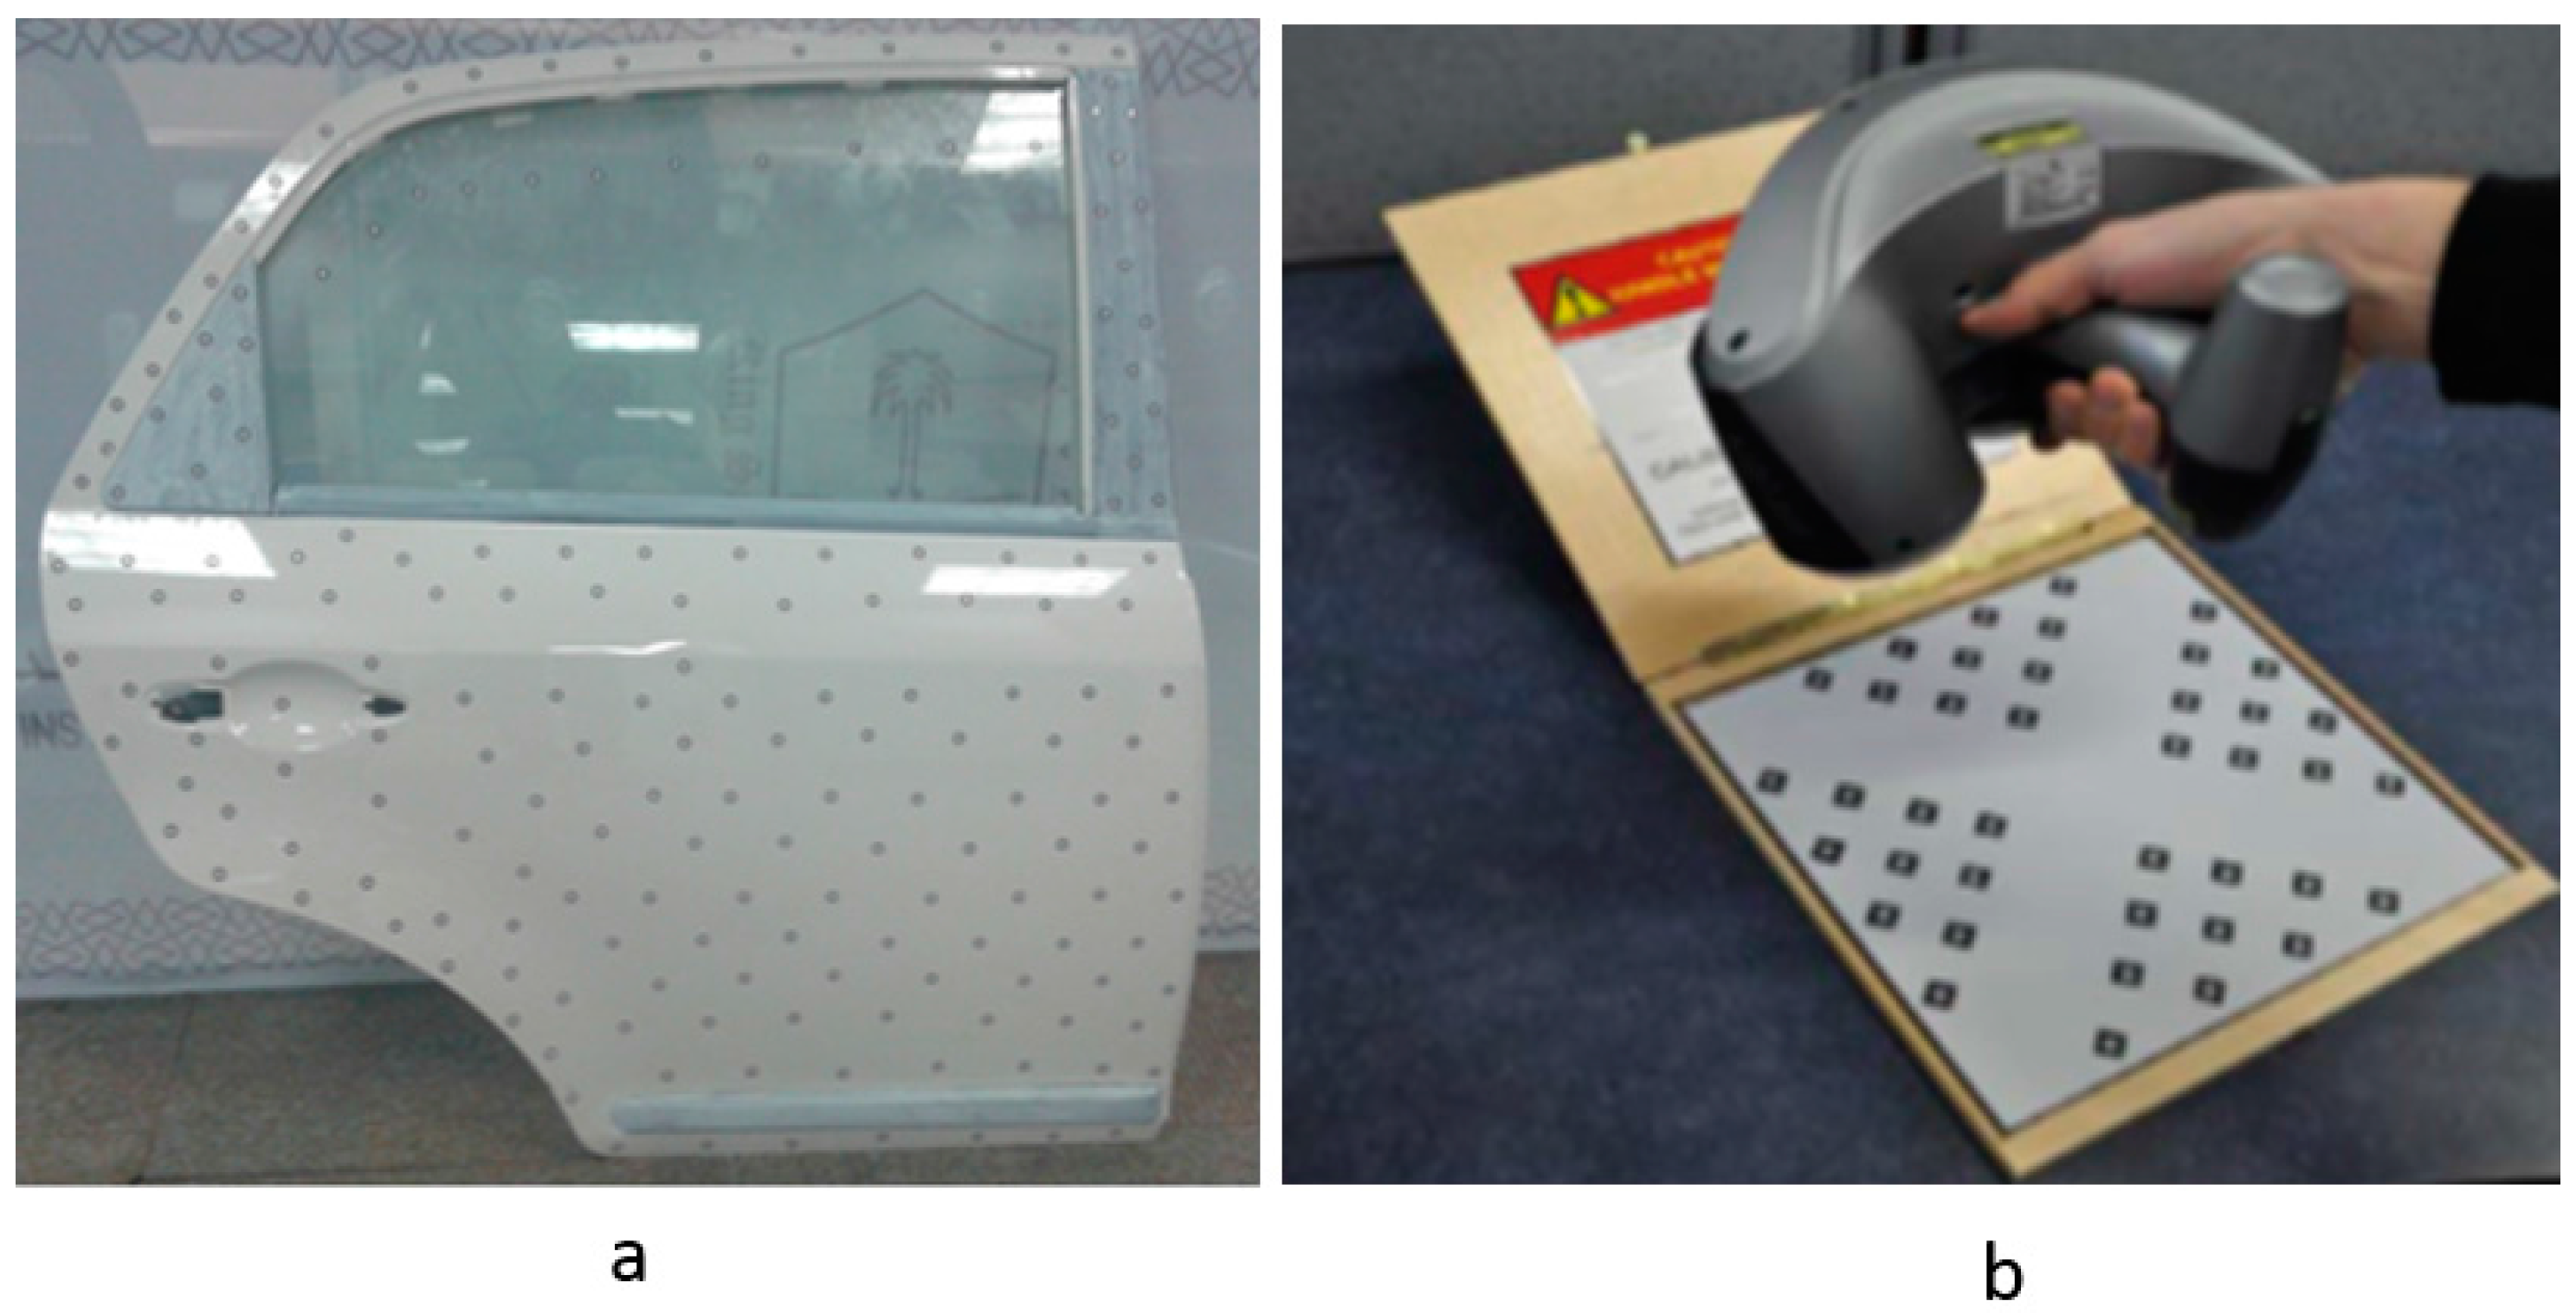
Figure 5.
Methodology adopted to compute the accuracy of two scanners. CAD: Computer-Aided Design.
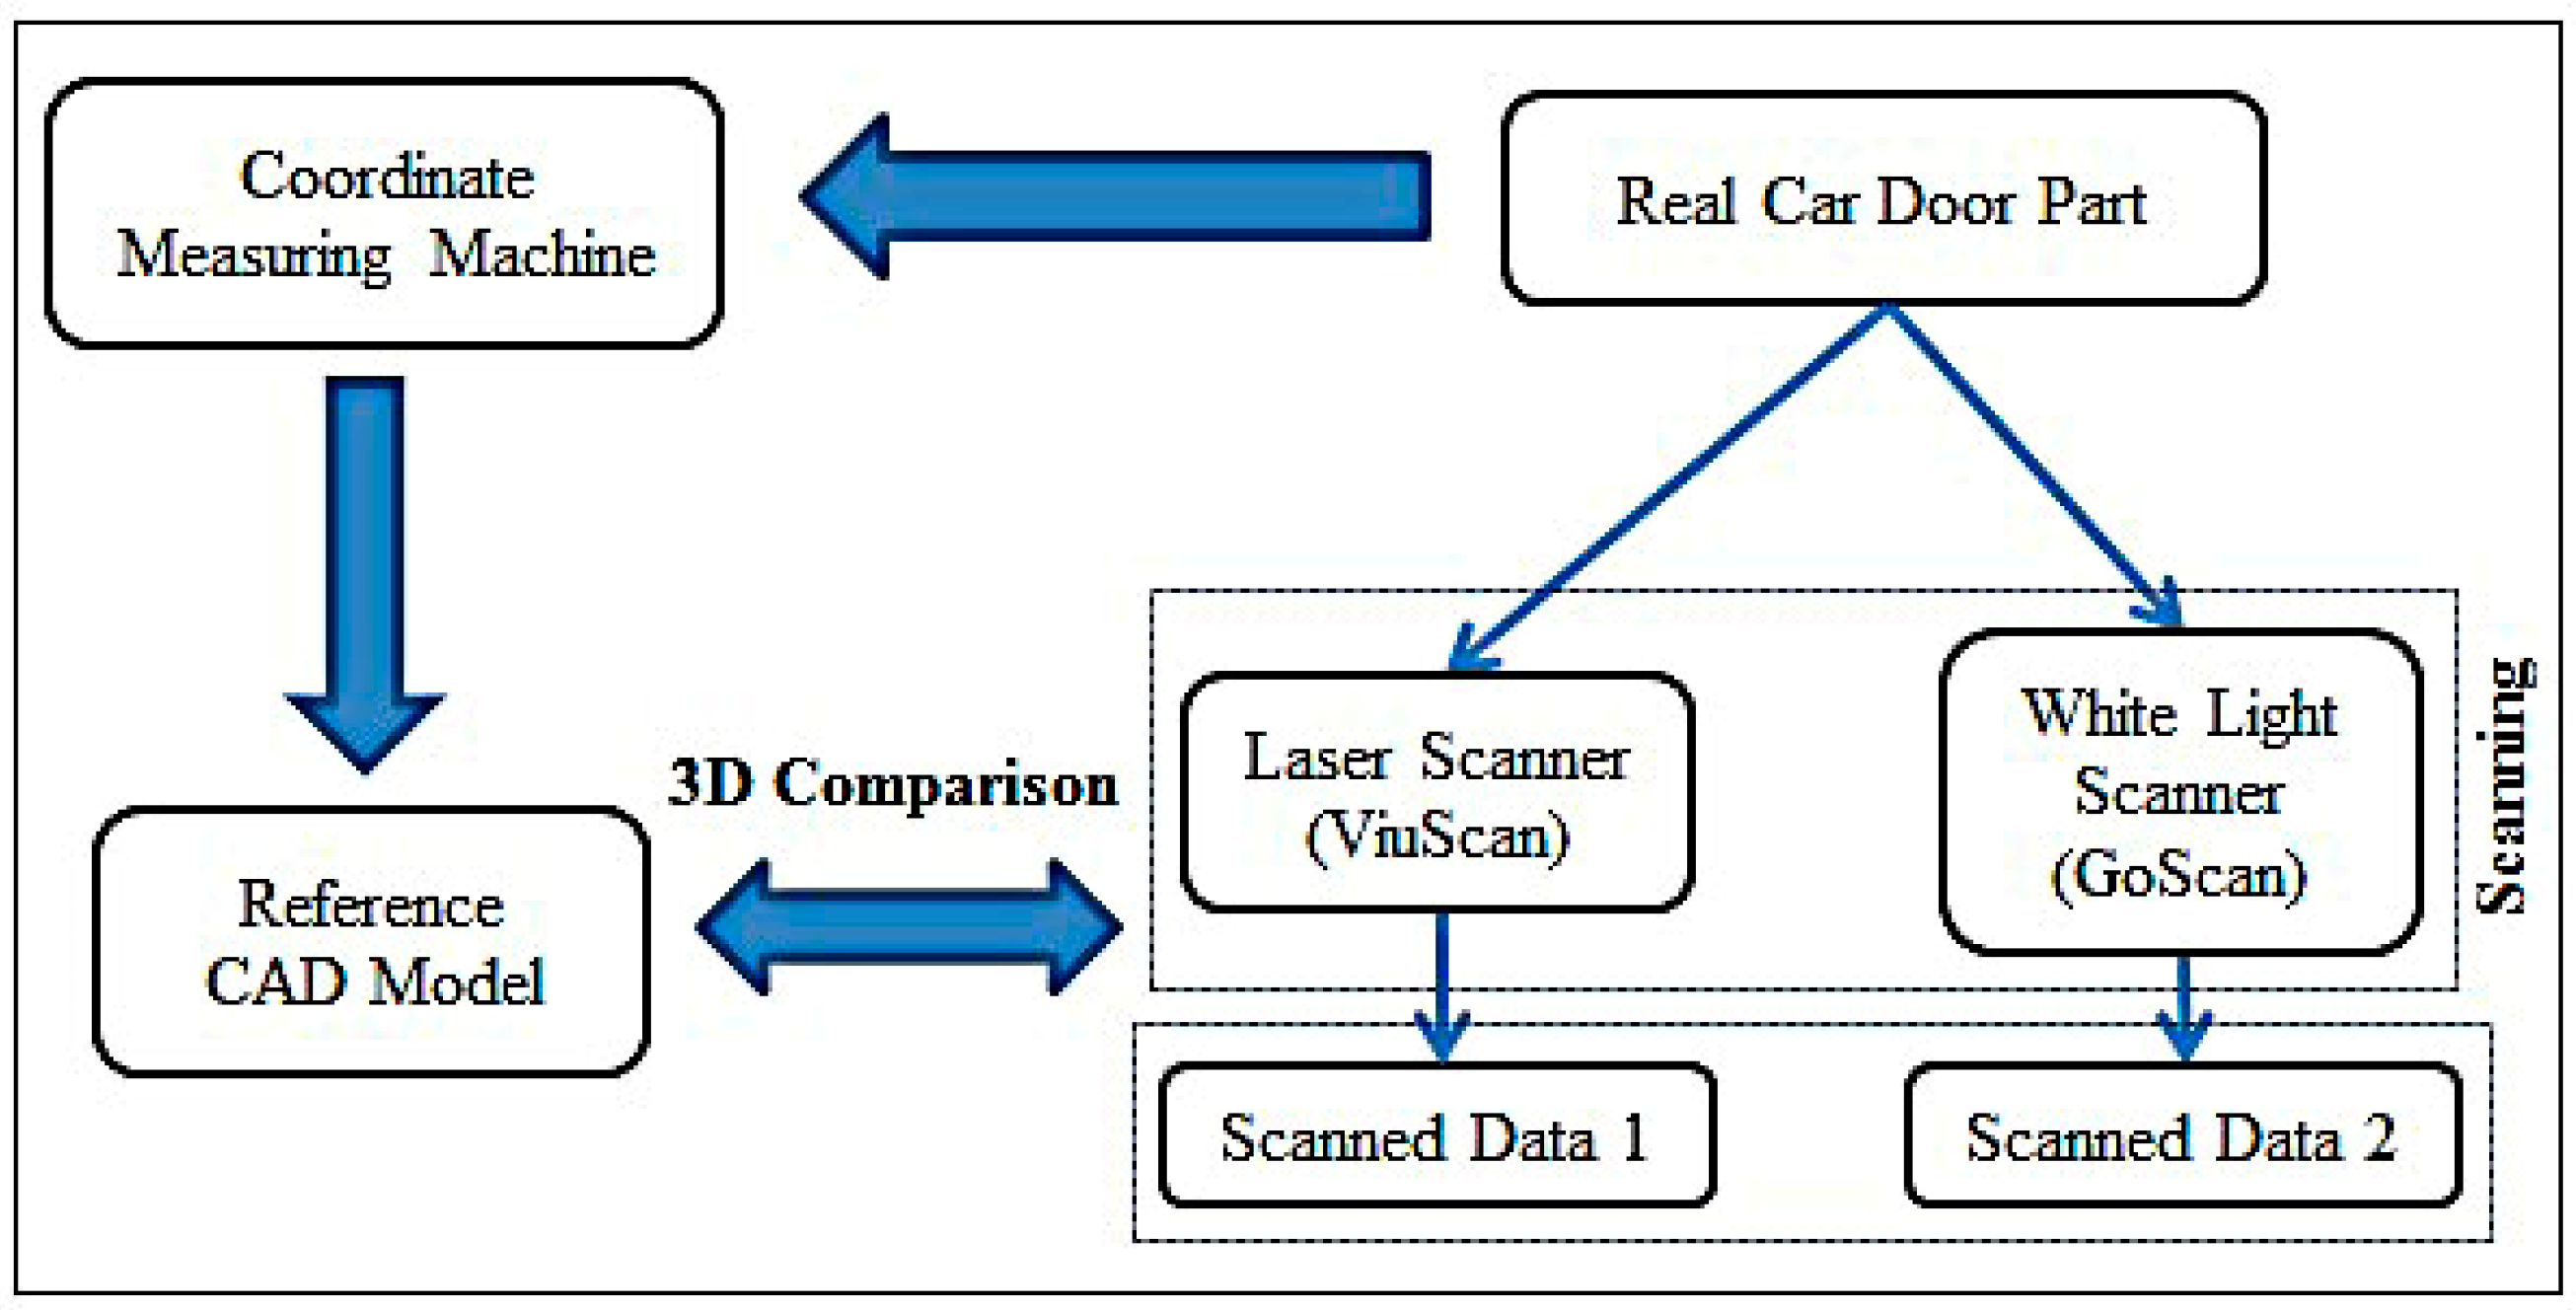
Figure 6.
Bridge-type CMM. CMM: Coordinate Measuring Machine.
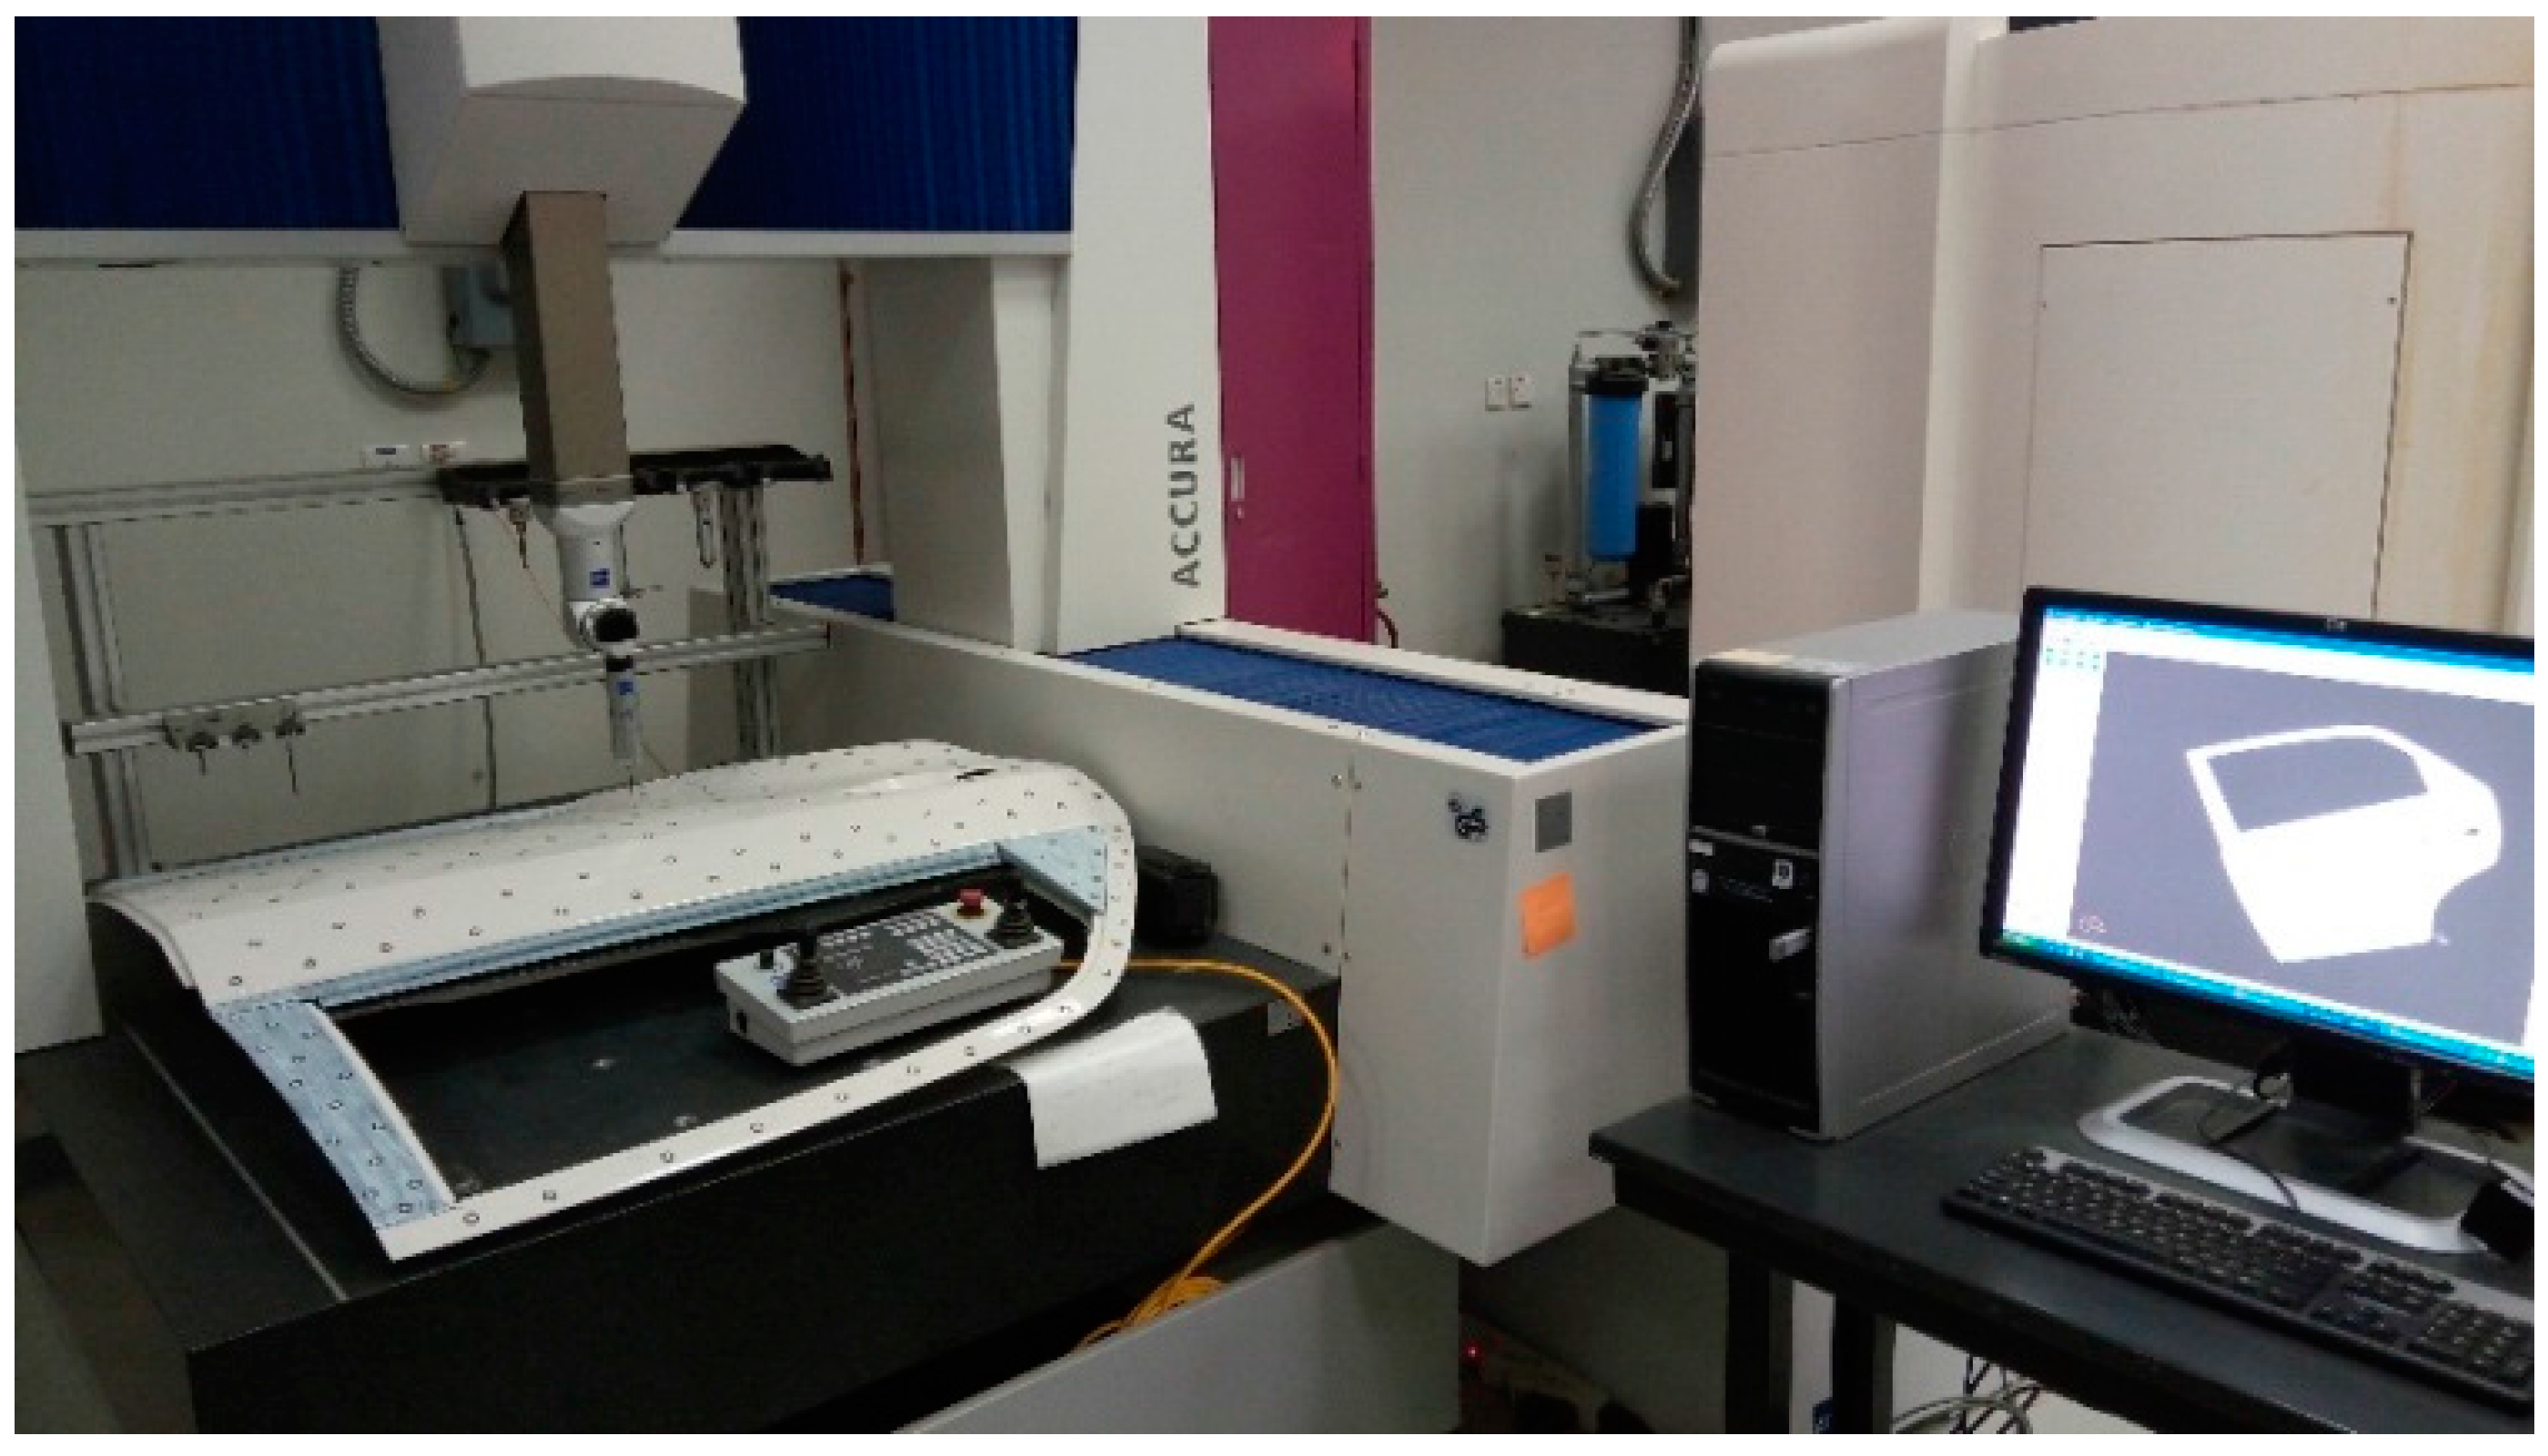
Figure 7.
Measurement of accuracy using a 3D comparison (a) best fit of scanned and CAD models (b) 3D comparison results.
Figure 7.
Measurement of accuracy using a 3D comparison (a) best fit of scanned and CAD models (b) 3D comparison results.
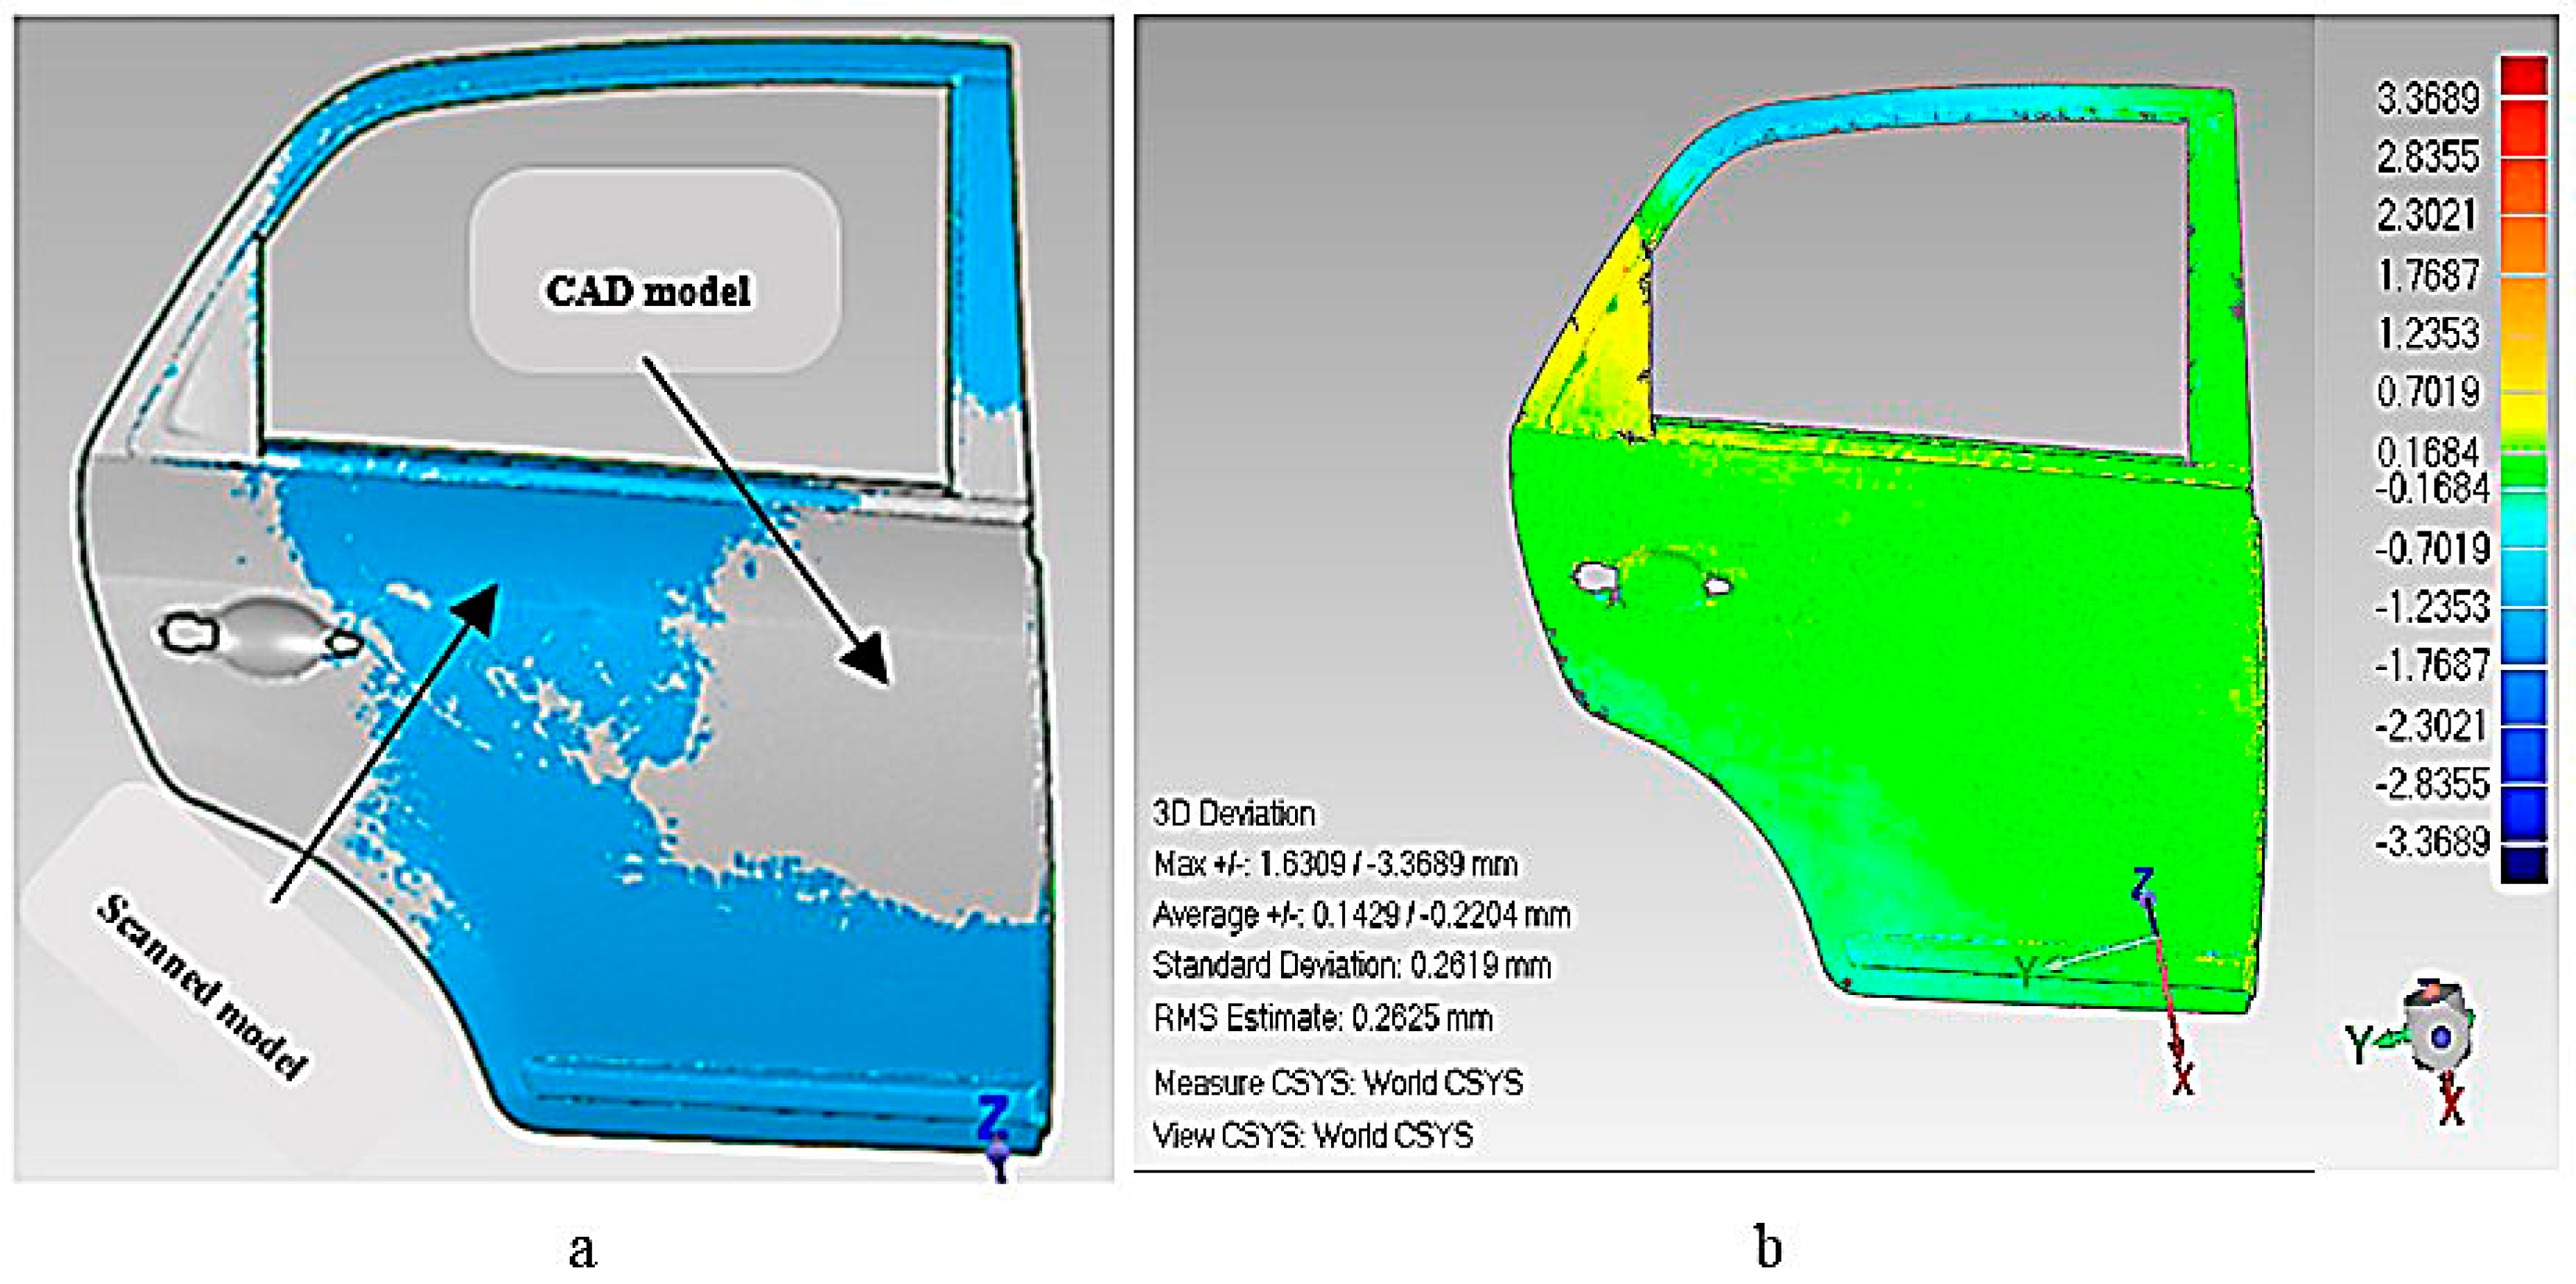
Figure 8.
Data points obtained with laser scanner—(a) best model; (b) worst model.
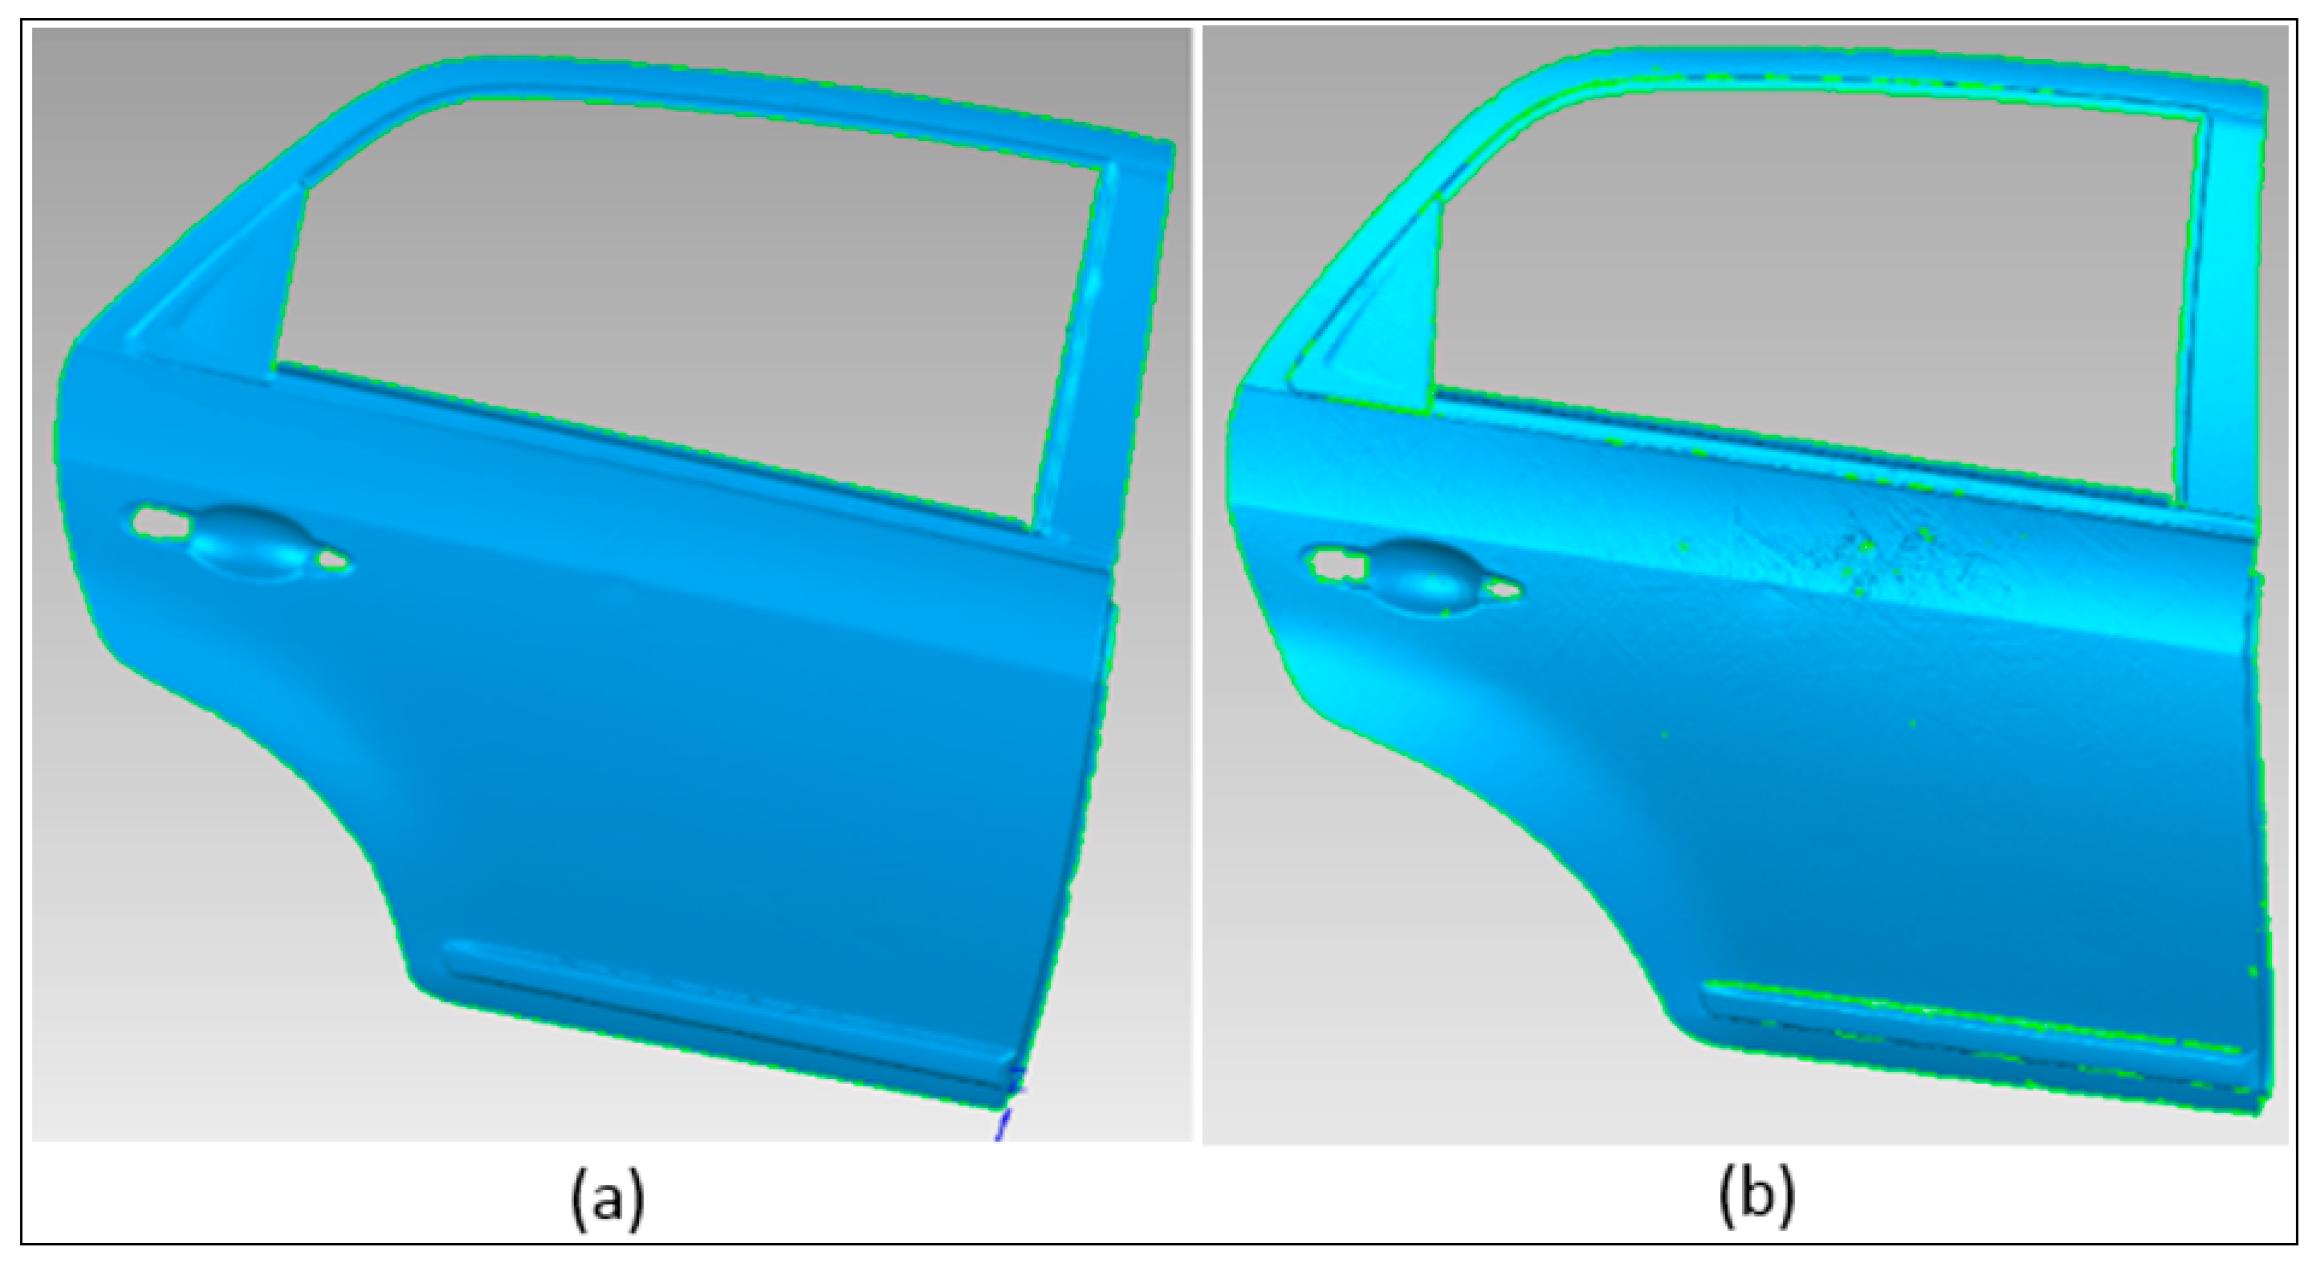
Figure 9.
Data points obtained using white light scanner—(a) best model; (b) worst model.

Figure 10.
Defects in the data points of the white light scanner—(a) missing data; (b) edge defects.
Figure 10.
Defects in the data points of the white light scanner—(a) missing data; (b) edge defects.

Figure 11.
Normality test for accuracy (a) laser scanner; (b) white light scanner.
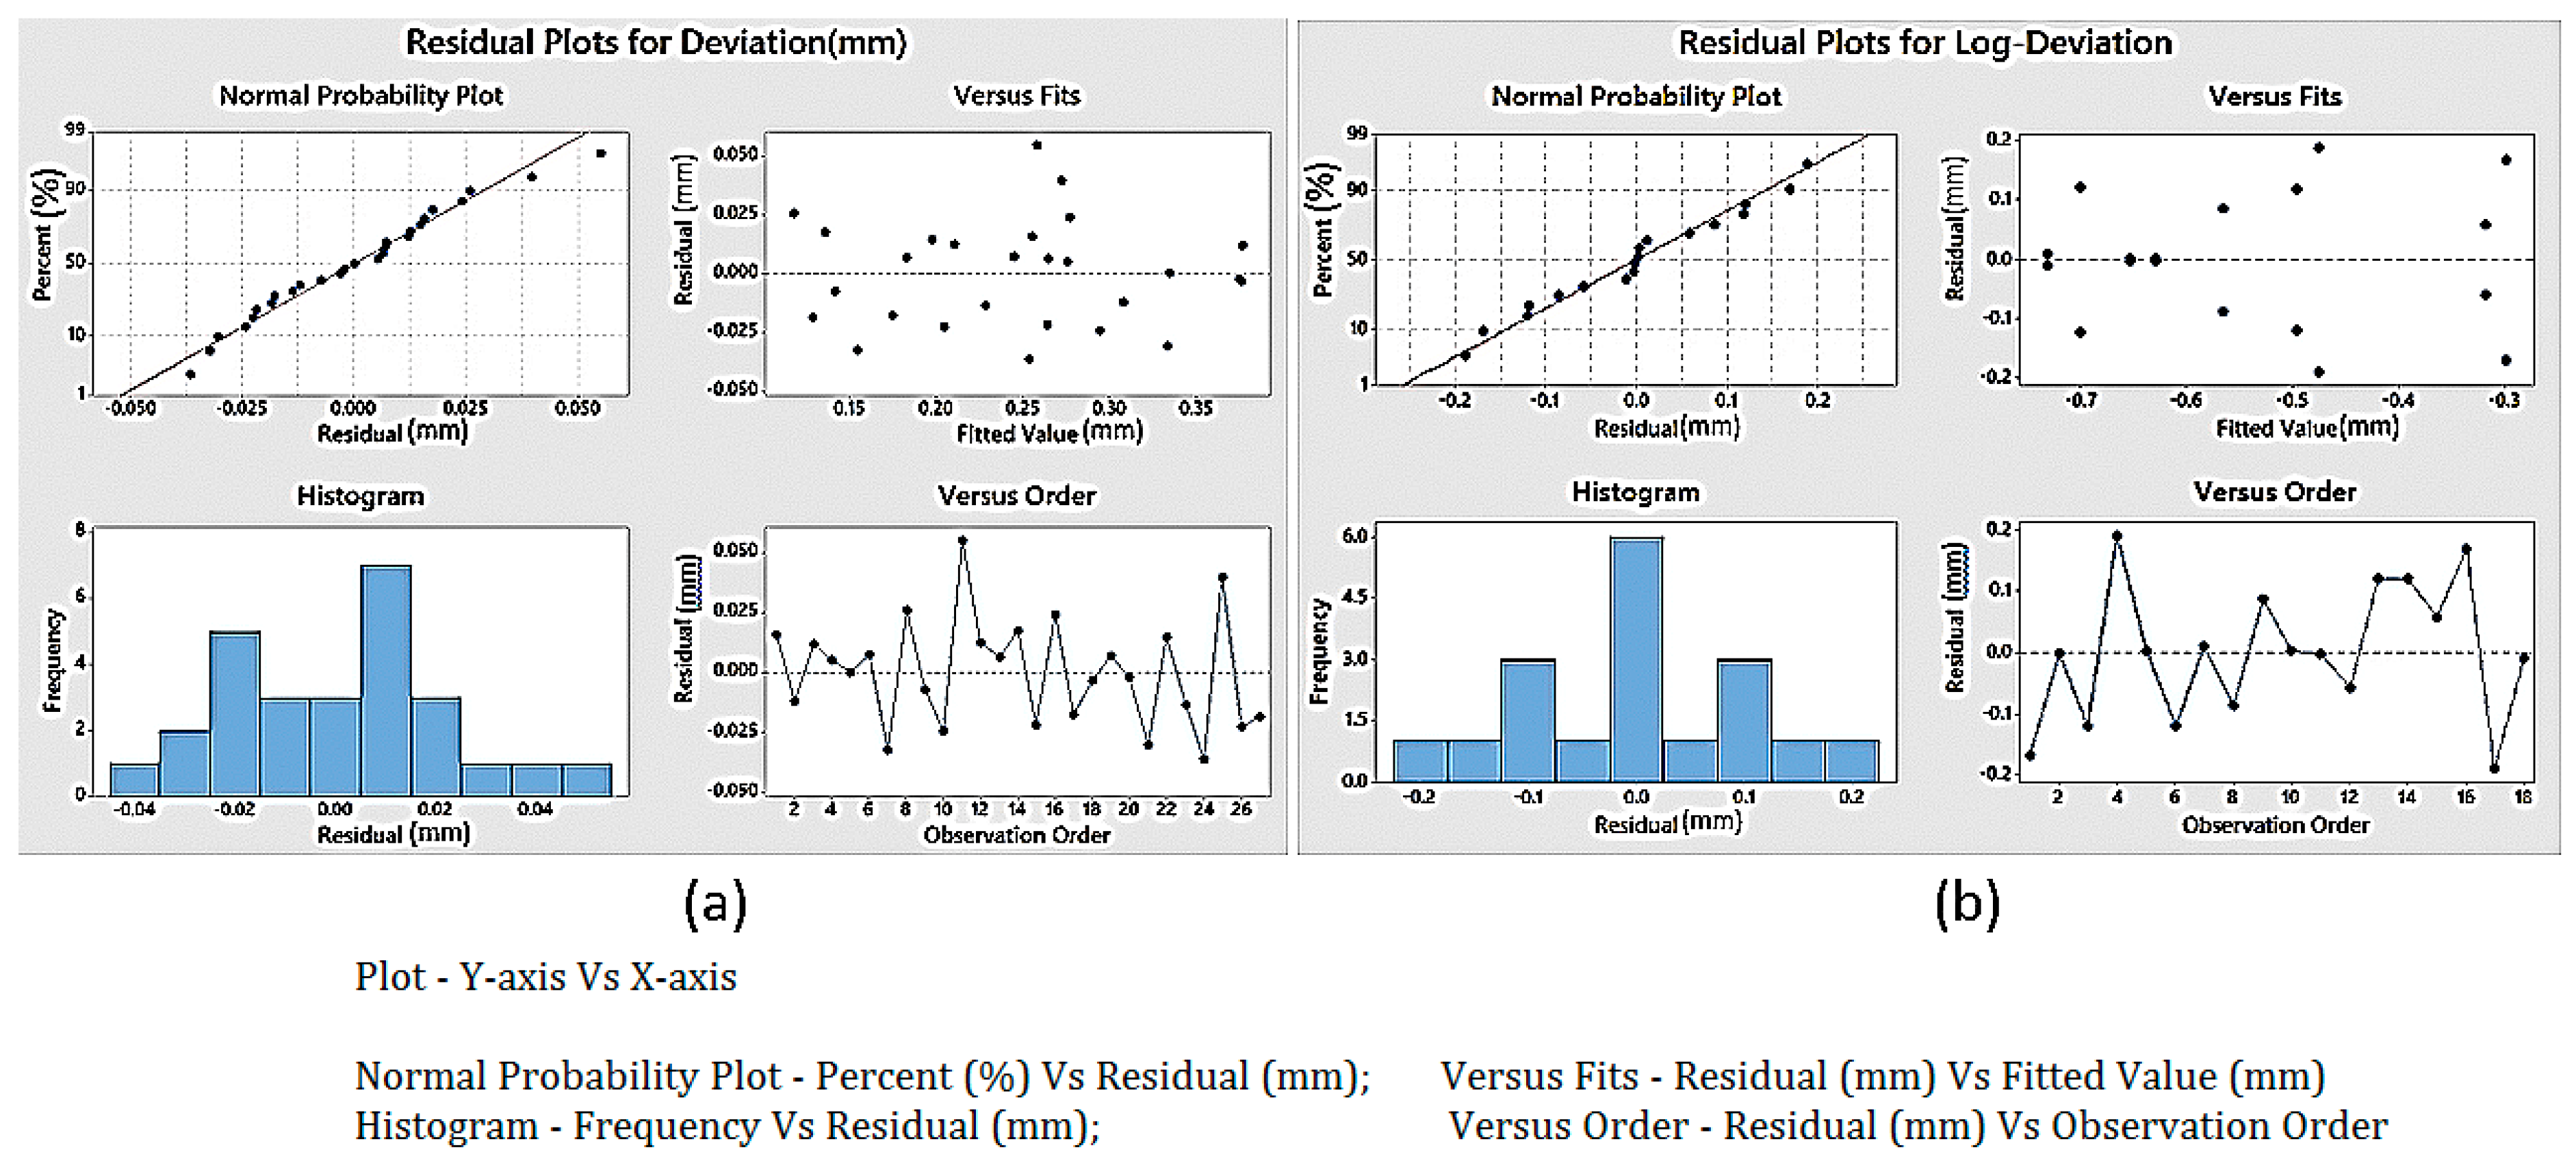
Figure 12.
Normality test for scanning time (a) laser scanner; (b) white light scanner.

Figure 13.
Normality test for triangle numbers (a) laser scanner; (b) white light scanner (c) Normality test for log-triangles numbers of white light scanner.
Figure 13.
Normality test for triangle numbers (a) laser scanner; (b) white light scanner (c) Normality test for log-triangles numbers of white light scanner.
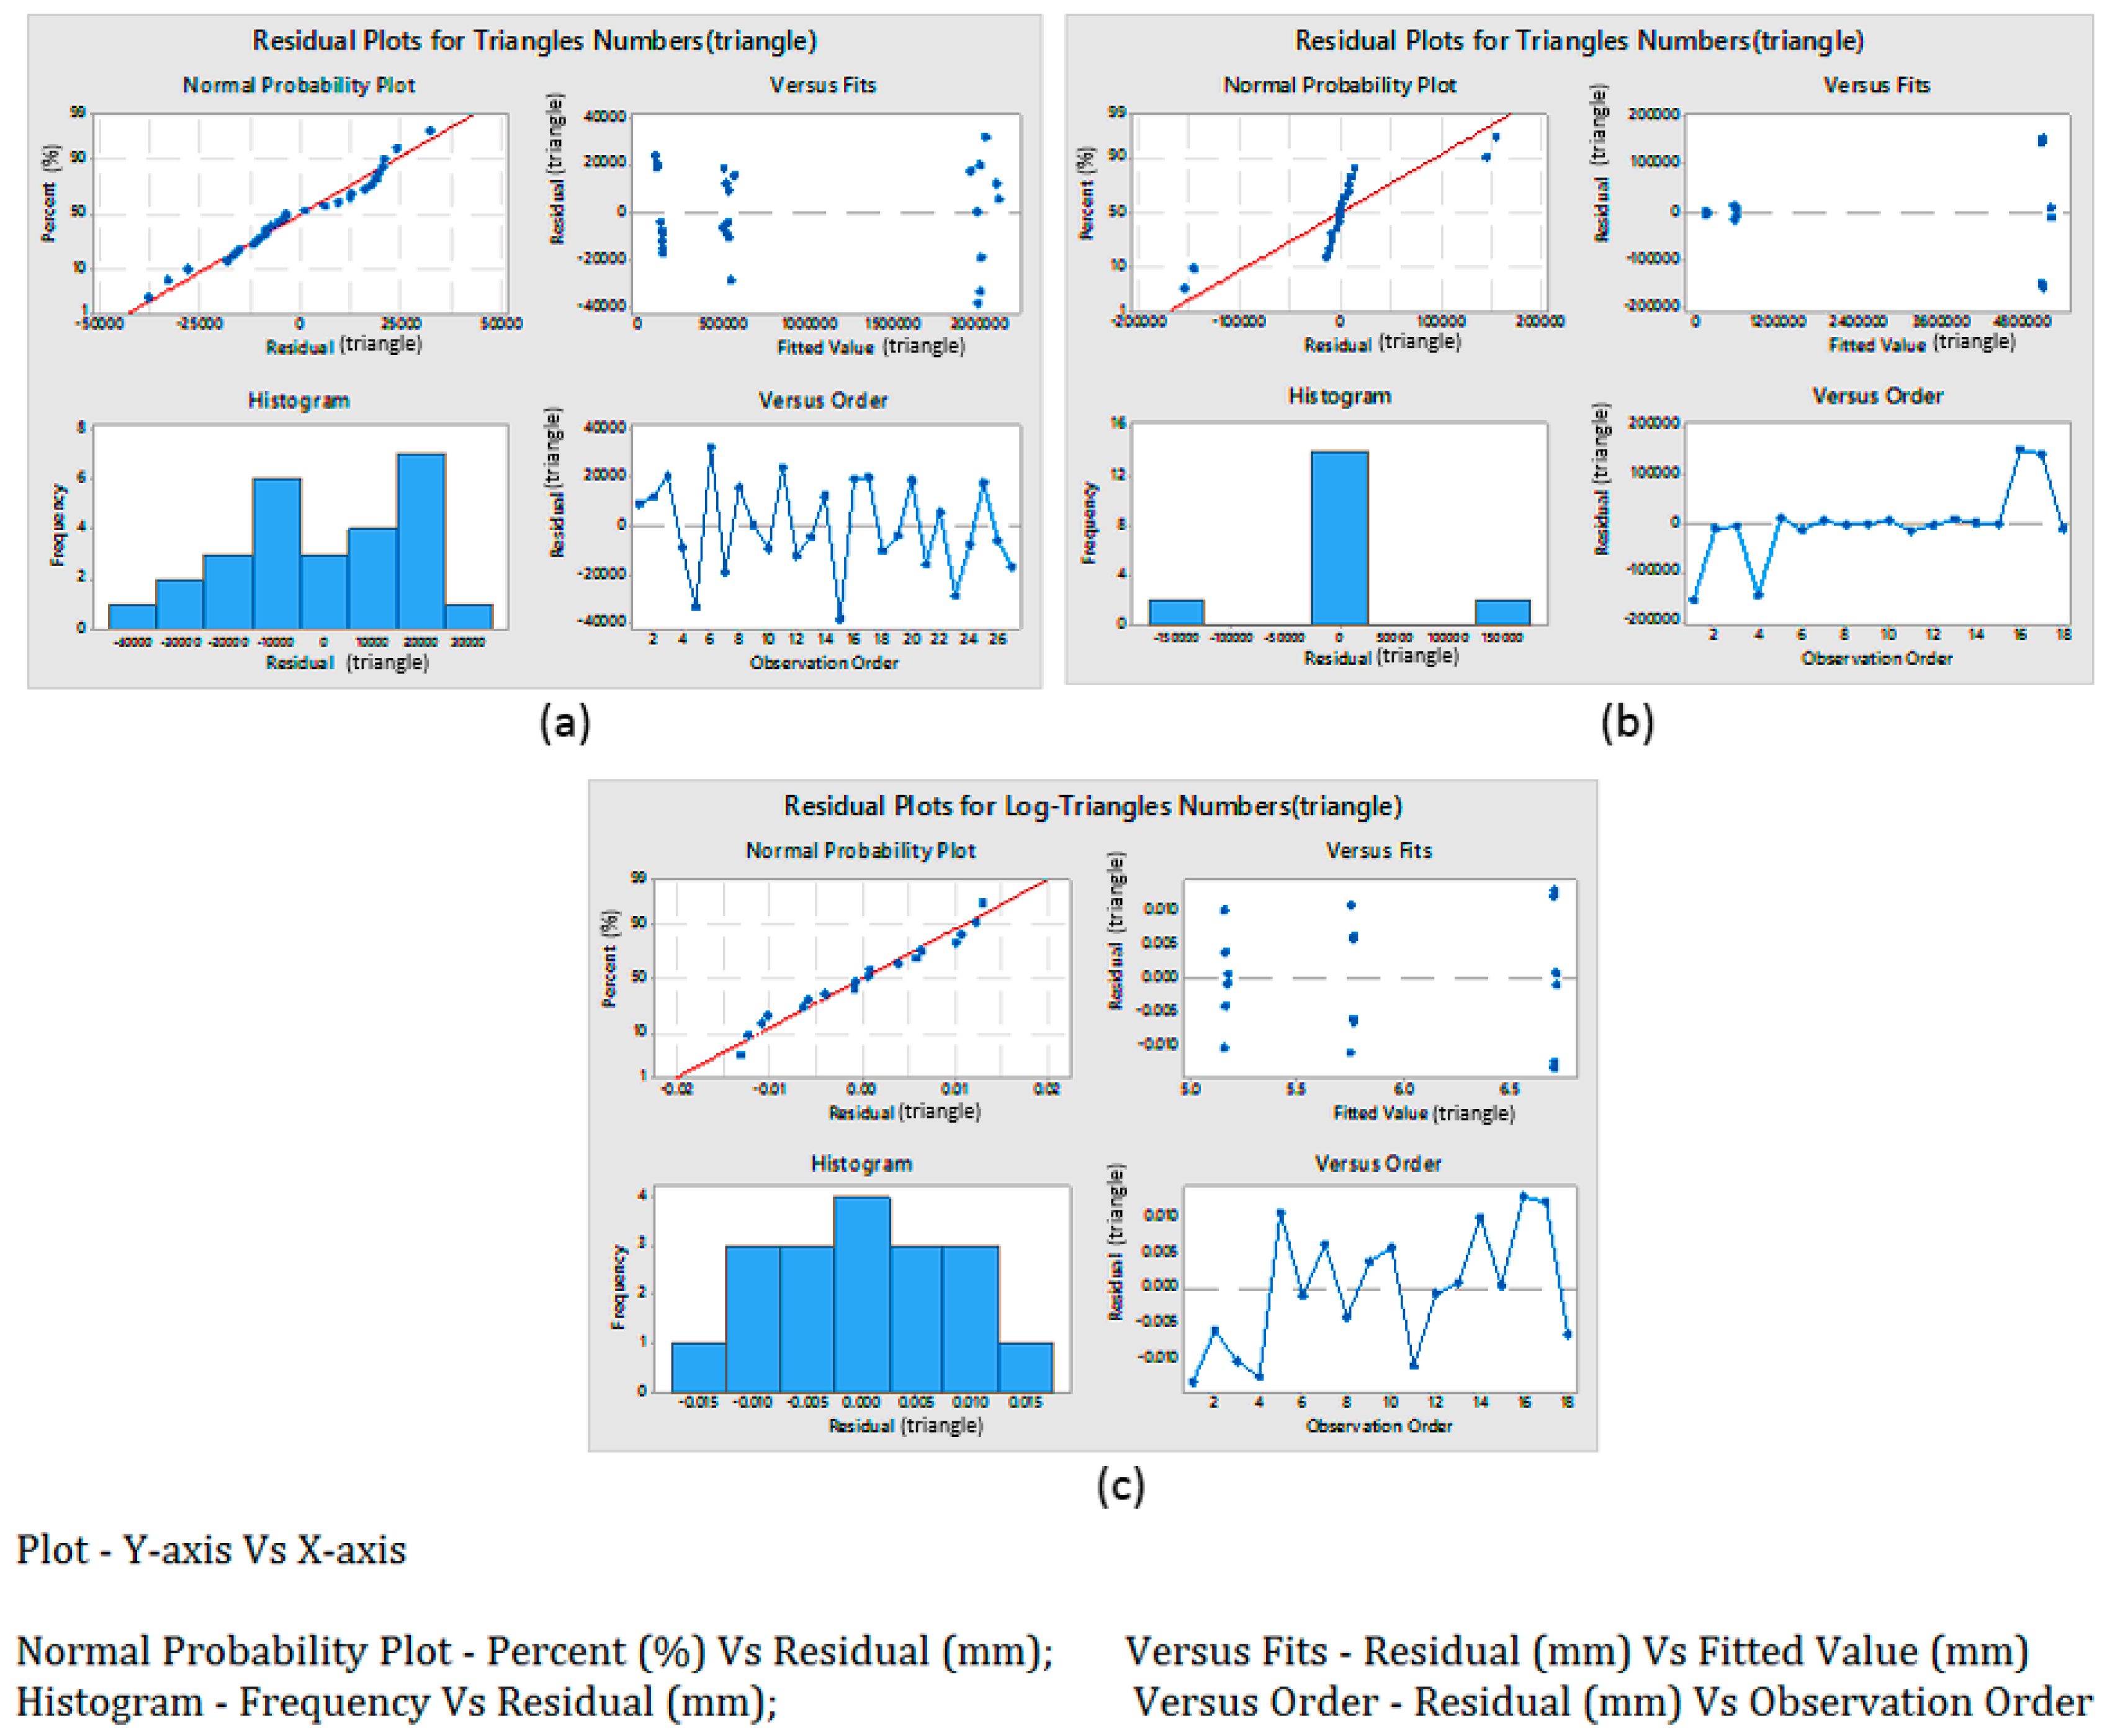
Figure 14.
Main effect plots for deviation: (a) laser scanner; (b) white light scanner.
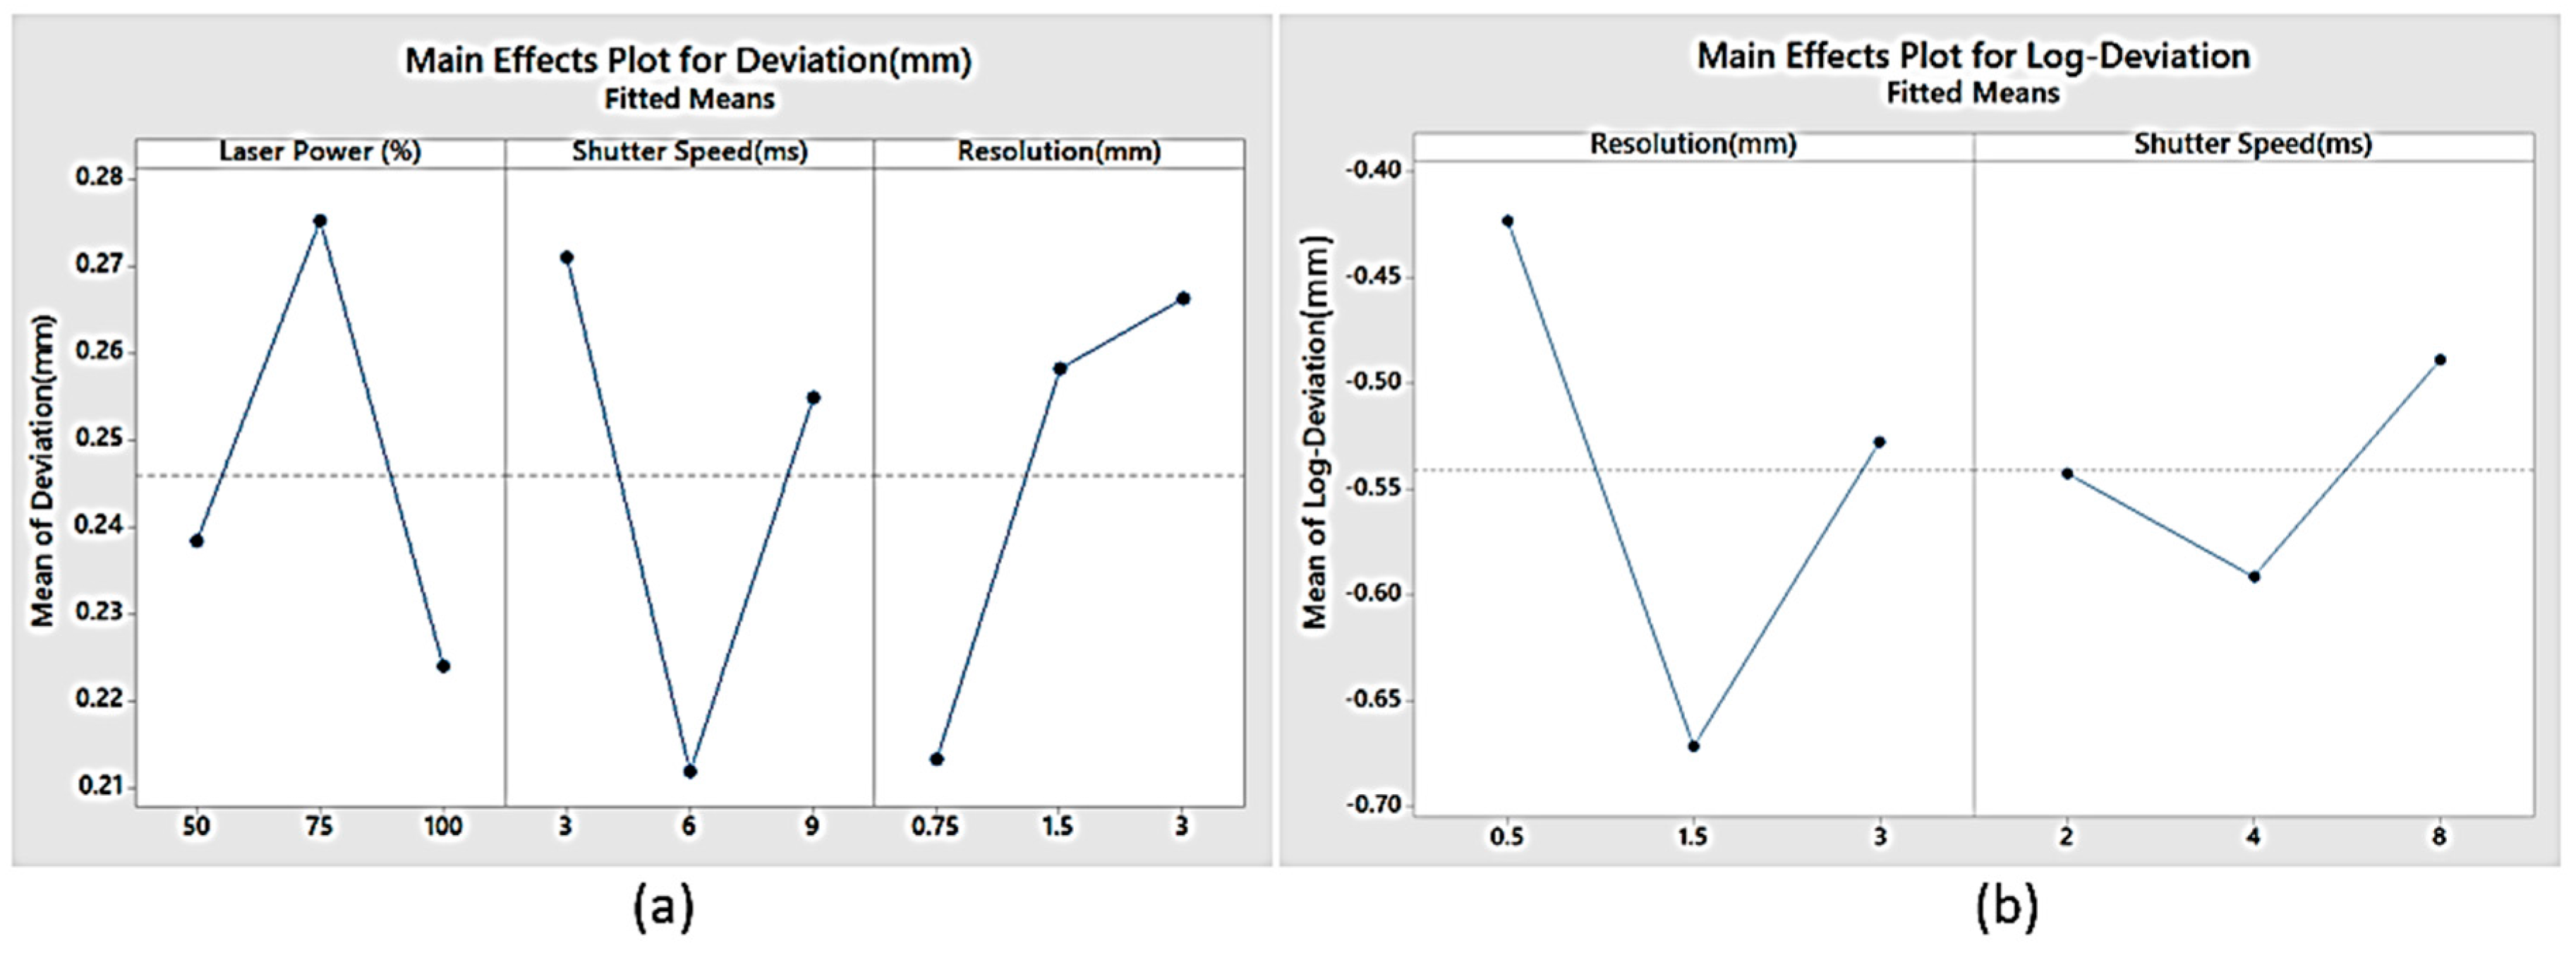
Figure 15.
Main effect plots for scanning time: (a) laser scanner; (b) white light scanner.

Figure 16.
Main effect plots for triangle numbers: (a) laser scanner; (b) white light scanner.
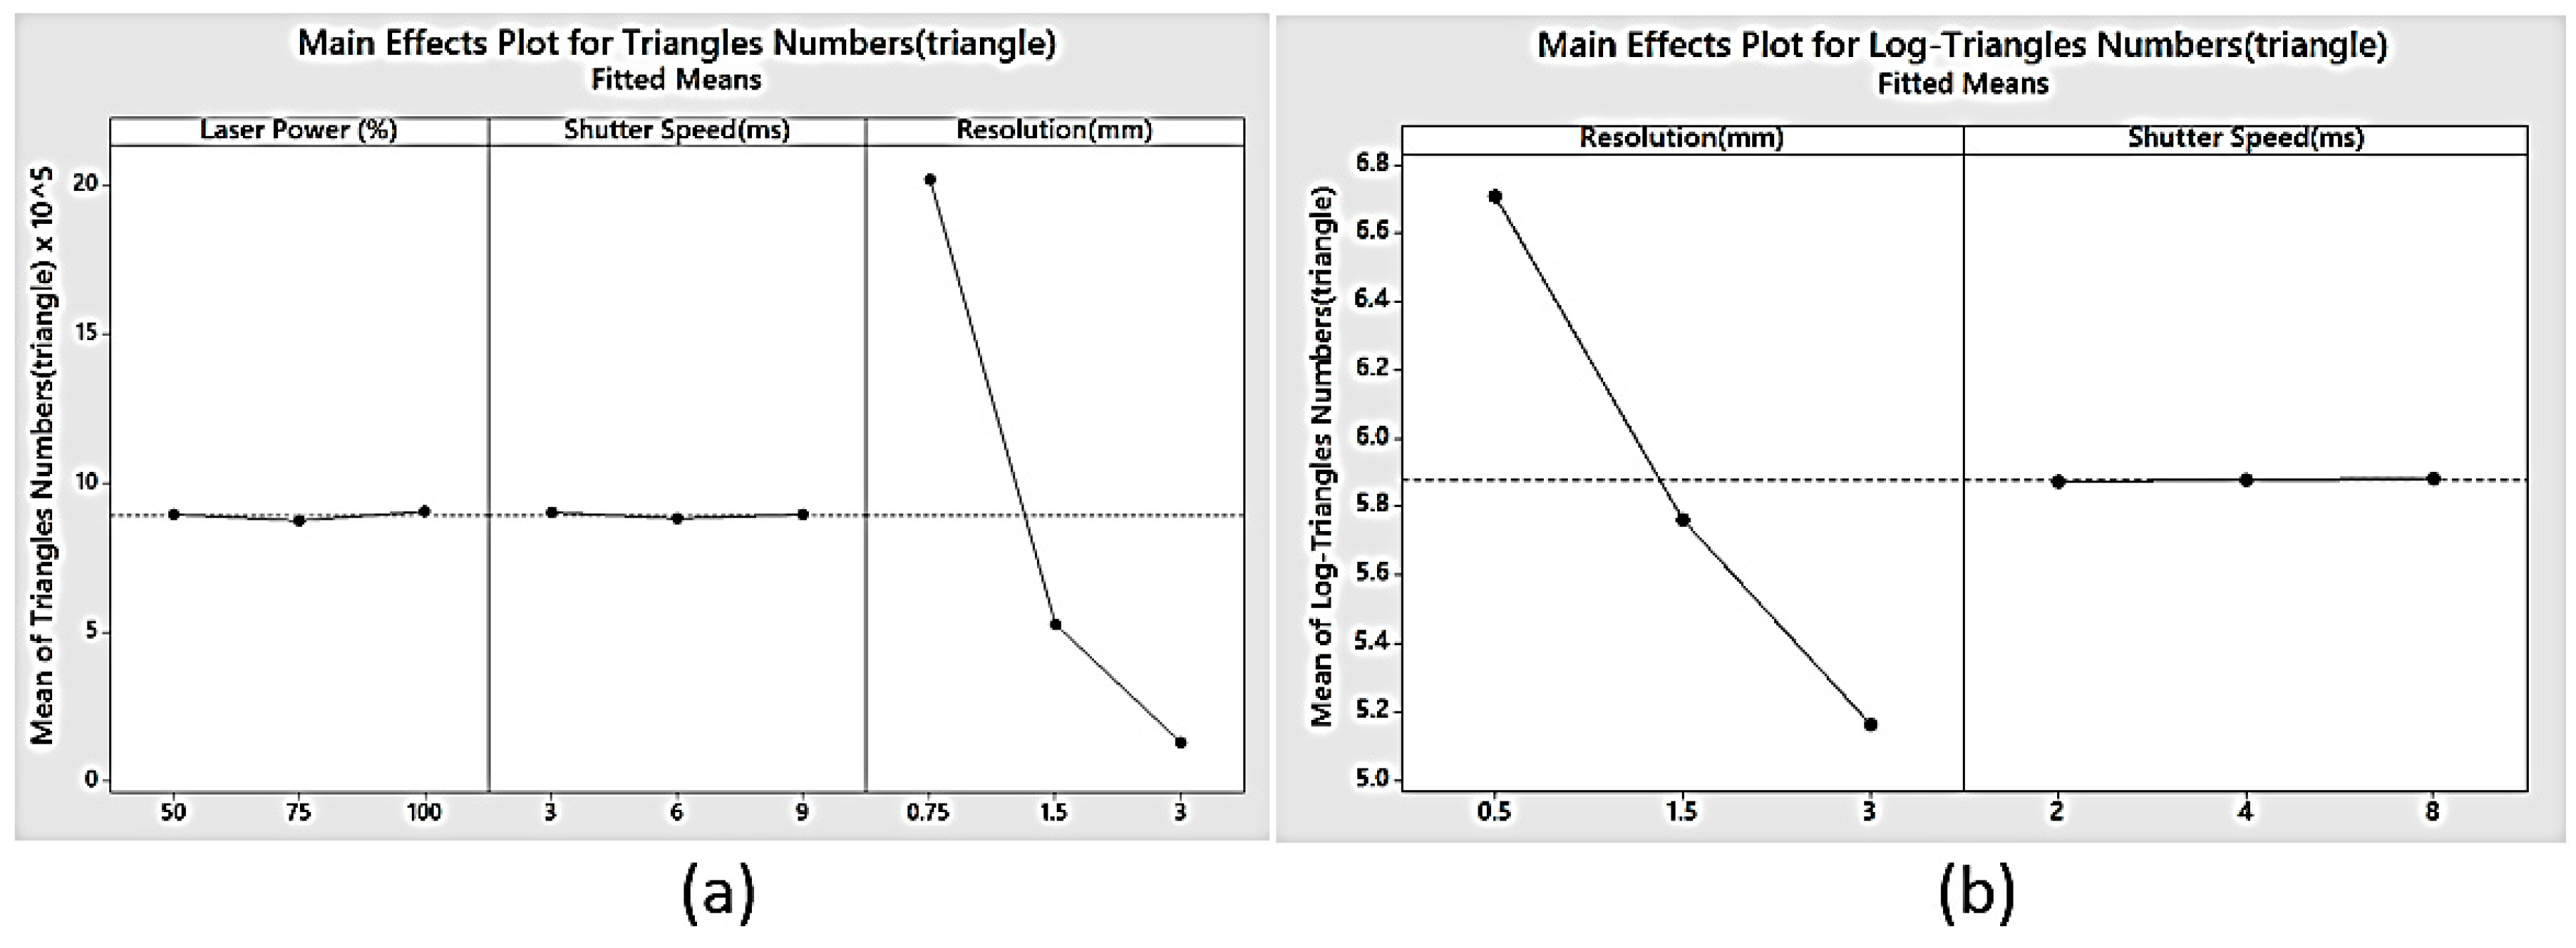
Figure 17.
Optimization Plots—handheld: (a) laser scanner; (b) white light scanner.
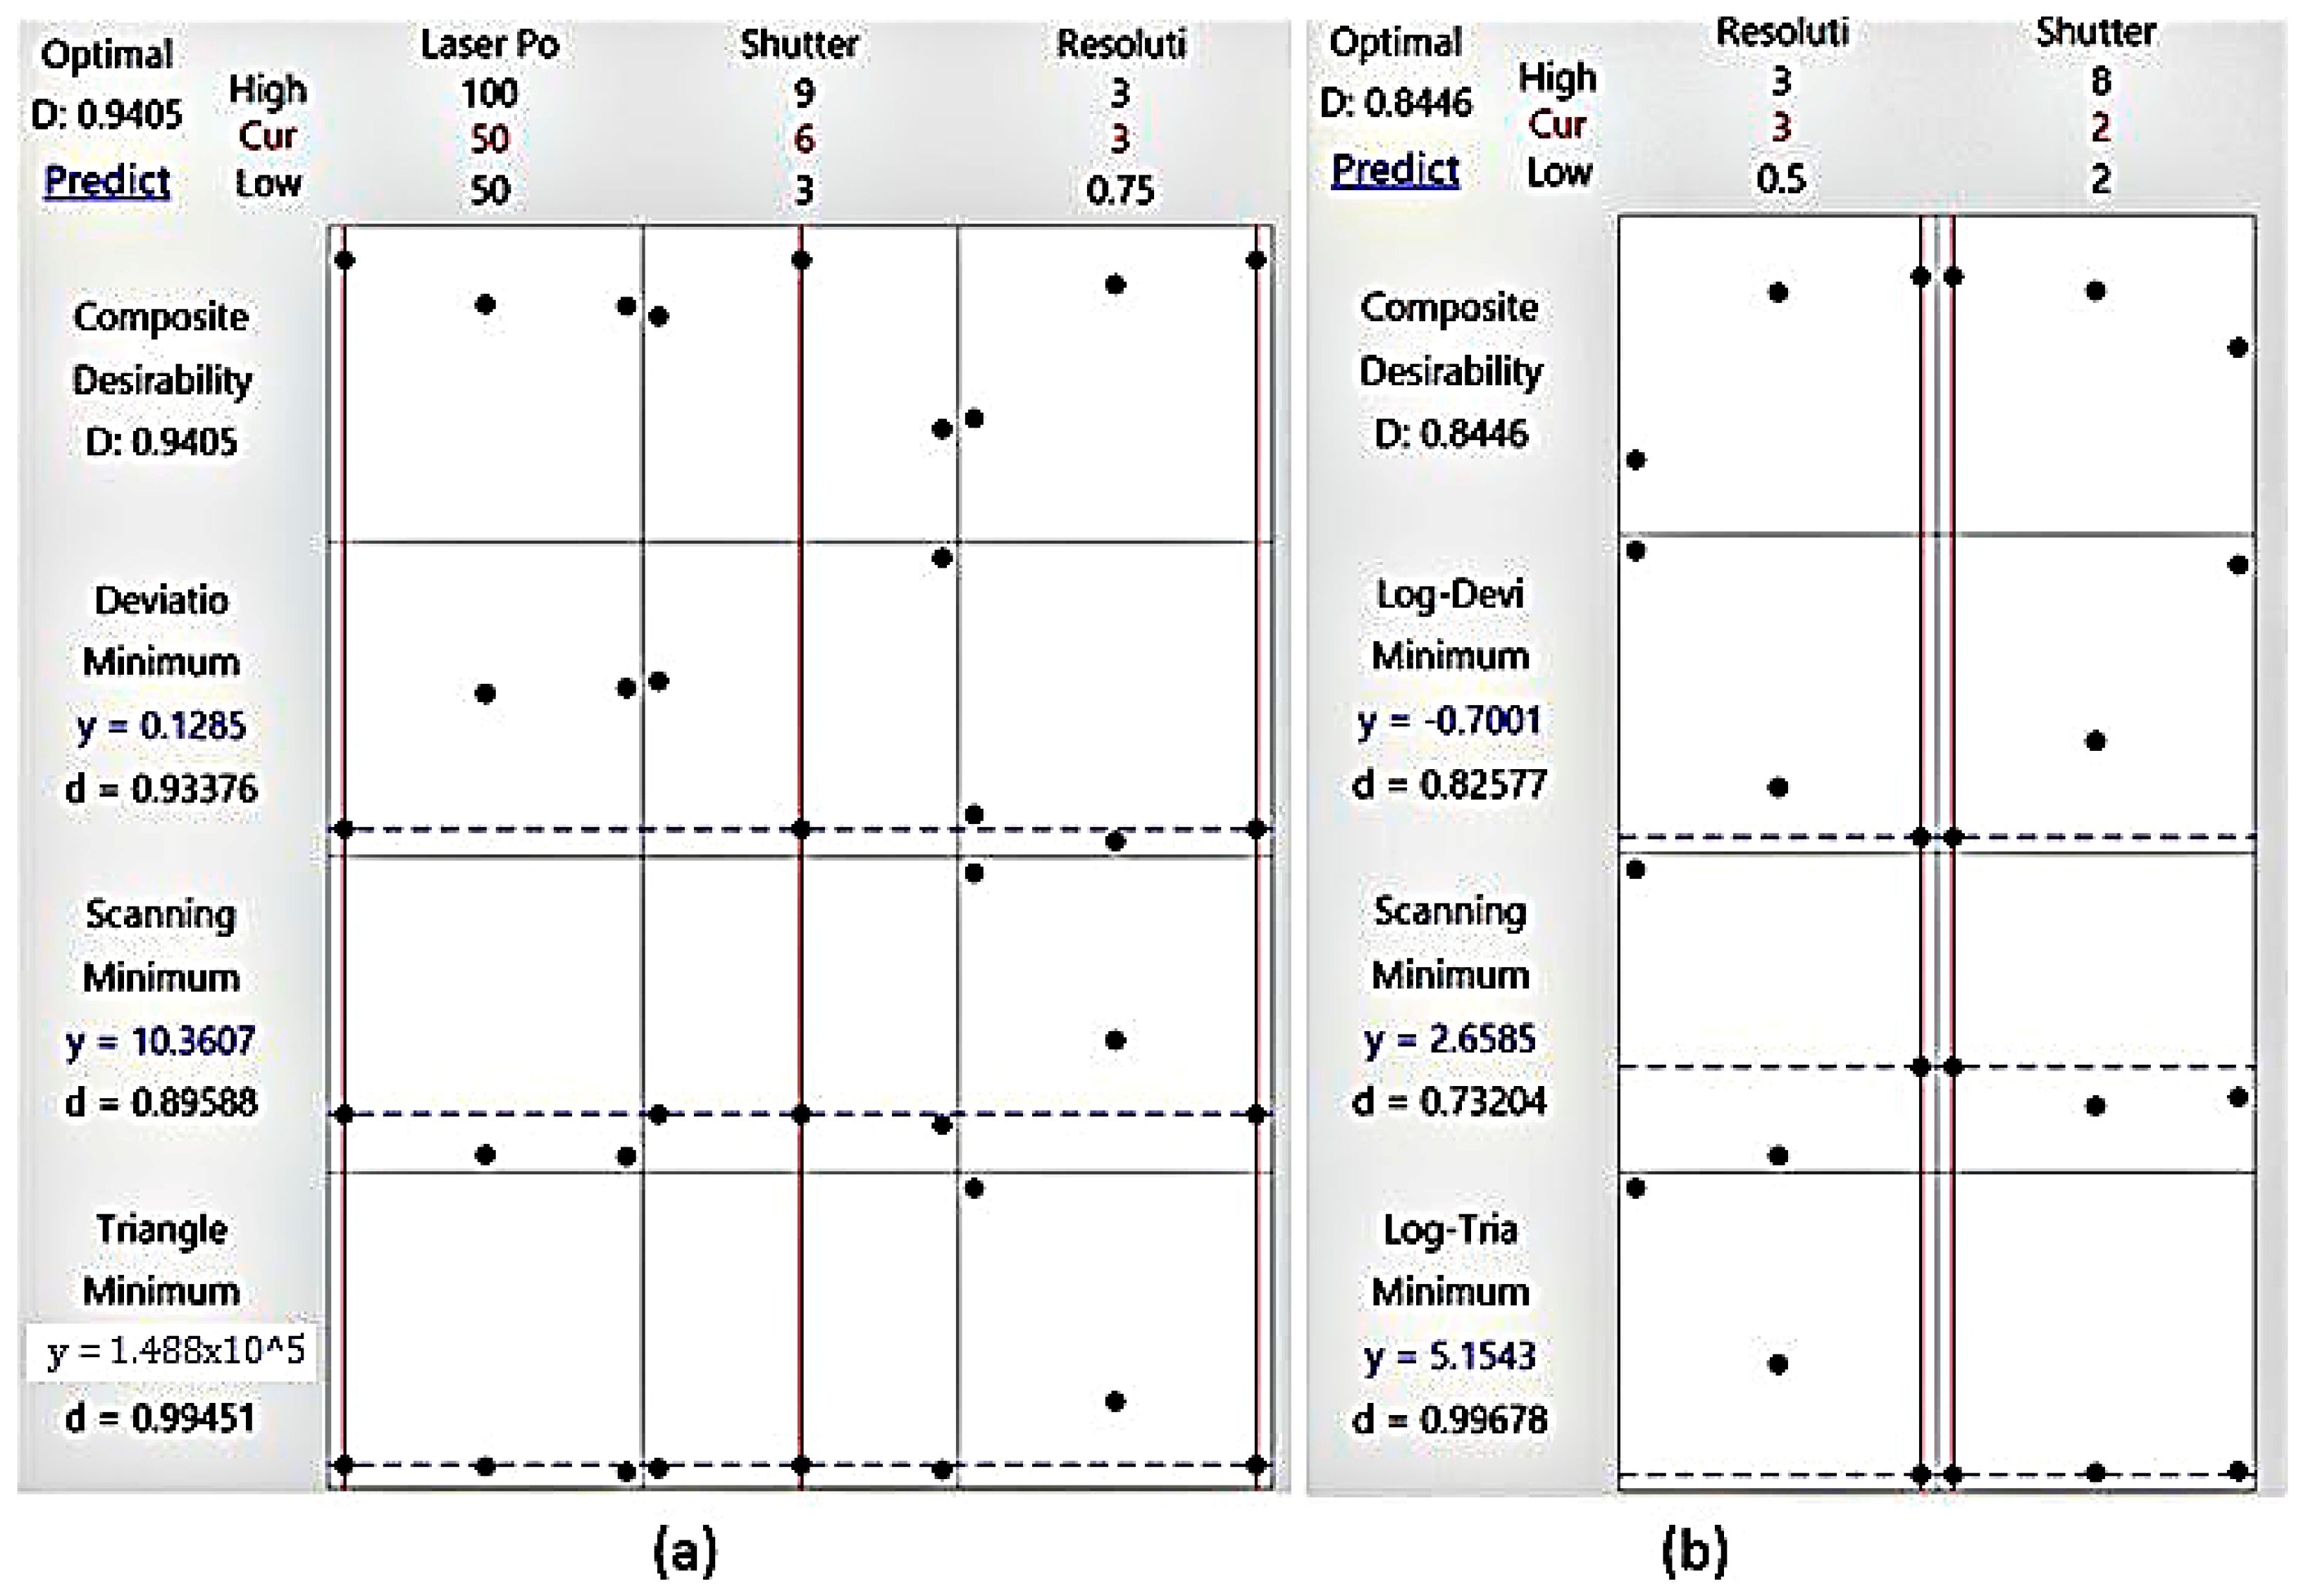
Figure 18.
Scale provided to the users for rating different scanners.

Table 1.
Technical specifications of the two data acquisition systems.
| Technical Specifications | Laser Based | White Light |
|---|---|---|
| Weight (kg) | 1.3 | 1.1 |
| Dimensions (mm) | 172 × 260 × 216 | 127 × 156 × 262 |
| Laser Class | 2 | White light (led) |
| Resolution (Normal) (mm) | 0.100 | 0.500 mm |
| Accuracy (Normal) (mm) | Up to 0.05 | Up to 0.100 |
| Volumetric Accuracy (mm/m) | 0.020 + 0.025 | 0.300 |
| Standoff Distance (mm) | 300 | 400 |
| Depth-of-Field (mm) | ±150 | 250 |
| Field of View (mm) | 220 × 220 | 380 × 380 |
Table 2.
Scanning factors with their levels.
| Laser Scanner | |||
| Factors | Level 1 | Level 2 | Level 3 |
| Resolution (mm) | 0.75 | 1.5 | 3 |
| Shutter speed (ms) | 3 | 6 | 9 |
| Laser power (%) | 50 | 75 | 100 |
| White Light Scanner | |||
| Factors | Level 1 | Level 2 | Level 3 |
| Resolution (mm) | 0.5 | 1.5 | 3 |
| Shutter speed (ms) | 2 | 4 | 8 |
Table 3.
A sample data for Laser Scanner (ViuScan) and White Light Scanner (GoScan).
| Viu Scan | ||||||
| Run No. | Laser Power (%) | Shutter Speed (ms) | Resolution (mm) | Deviation (mm) | Triangle Numbers (Triangle) | Scanning Time (min) |
| 1 | 100 | 3 | 1.5 | 0.271 | 542,682 | 16.53 |
| 2 | 50 | 9 | 1.5 | 0.296 | 531,517 | 14.77 |
| … | … | … | … | … | … | … |
| … | … | … | … | … | … | … |
| 26 | 75 | 9 | 3 | 0.182 | 130,259 | 9.82 |
| 27 | 50 | 3 | 3 | 0.11 | 127,331 | 10.03 |
| Go Scan | ||||||
| Run No. | - | Shutter Speed (ms) | Resolution (mm) | Deviation (mm) | Triangle Numbers (Triangle) | Scanning Time (min) |
| 1 | 0.5 | 2 | 0.341 | 4,963,900 | 3.7 | |
| 2 | 8 | 1.5 | 0.221 | 568,445 | 1.683 | |
| … | … | … | … | … | … | |
| … | … | … | … | … | … | |
| 17 | 4 | 0.5 | 0.217 | 5,232,900 | 4.55 | |
| 18 | 4 | 1.5 | 0.181 | 573,965 | 3 | |
Table 4.
p-Values using ANOVA for the laser-based and white light handheld scanners (accuracy).
| Controlling Factors | p-Value | |
|---|---|---|
| Laser | White Light | |
| Laser Power | 0.065 | - |
| Shutter Time | 0.035 | 0.529 |
| Resolution | 0.048 | 0.056 |
| Laser Power*Shutter Time | 0.003 | - |
| Laser Power*Resolution | 0.021 | - |
| Shutter Time*Resolution | 0.736 | 0.190 |
Table 5.
p-Values using ANOVA for the laser-based and white light handheld scanners (scanning time).
Table 5.
p-Values using ANOVA for the laser-based and white light handheld scanners (scanning time).
| Controlling Factors | p-Value | |
|---|---|---|
| Laser | White Light | |
| Laser Power | 0.473 | - |
| Shutter Time | 0.356 | 0.252 |
| Resolution | 0.000 | 0.001 |
| Laser Power*Shutter Time | 0.790 | - |
| Laser Power*Resolution | 0.686 | - |
| Shutter Time*Resolution | 0.474 | 0.589 |
Table 6.
p-Values using ANOVA for the laser-based and white light handheld scanners (triangle numbers).
Table 6.
p-Values using ANOVA for the laser-based and white light handheld scanners (triangle numbers).
| Controlling Factors | p-Value | |
|---|---|---|
| Laser | White Light | |
| Laser Power | 0.183 | - |
| Shutter Time | 0.444 | 0.289 |
| Resolution | 0.000 | 0.000 |
| Laser Power*Shutter Time | 0.264 | - |
| Laser Power*Resolution | 0.125 | - |
| Shutter Time*Resolution | 0.388 | 0.821 |
© 2018 by the authors. Licensee MDPI, Basel, Switzerland. This article is an open access article distributed under the terms and conditions of the Creative Commons Attribution (CC BY) license (http://creativecommons.org/licenses/by/4.0/).
Share and Cite
MDPI and ACS Style
Ameen, W.; Al-Ahmari, A.M.; Hammad Mian, S. Evaluation of Handheld Scanners for Automotive Applications. Appl. Sci. 2018, 8, 217. https://doi.org/10.3390/app8020217
AMA Style
Ameen W, Al-Ahmari AM, Hammad Mian S. Evaluation of Handheld Scanners for Automotive Applications. Applied Sciences. 2018; 8(2):217. https://doi.org/10.3390/app8020217
Chicago/Turabian StyleAmeen, Wadea, Abdulrahman M. Al-Ahmari, and Syed Hammad Mian. 2018. "Evaluation of Handheld Scanners for Automotive Applications" Applied Sciences 8, no. 2: 217. https://doi.org/10.3390/app8020217
Note that from the first issue of 2016, this journal uses article numbers instead of page numbers. See further details here.