Failure Monitoring and Condition Assessment of Steel-Concrete Adhesive Connection Using Ultrasonic Waves


Department of Mechanics of Materials and Structures, Faculty of Civil and Environmental Engineering, Gdansk University of Technology, Narutowicza 11/12, 80-233 Gdansk, Poland
Appl. Sci. 2018, 8(3), 320; https://doi.org/10.3390/app8030320
Submission received: 12 February 2018
/
Revised: 17 February 2018
/
Accepted: 22 February 2018
/
Published: 26 February 2018
(This article belongs to the Section Acoustics and Vibrations)
Abstract
:Adhesive bonding is increasingly being incorporated into civil engineering applications. Recently, the use of structural adhesives in steel-concrete composite systems is of particular interest. The aim of the study is an experimental investigation of the damage assessment of the connection between steel and concrete during mechanical degradation. Nine specimens consisted of a concrete cube and two adhesively bonded steel plates were examined. The inspection was based on the ultrasound monitoring during push-out tests. Ultrasonic waves were excited and registered by means of piezoelectric transducers every two seconds until the specimen failure. To determine the slip between the steel and concrete a photogrammetric method was applied. The procedure of damage evaluation is based on the monitoring of the changes in the amplitude and phase shift of signals measured during subsequent phases of degradation. To quantify discrepancies between the reference signal and other registered signals, the Sprague and Gears metric was applied. The results showed the possibilities and limitations of the proposed approach in diagnostics of adhesive connections between steel and concrete depending on the failure modes.
1. Introduction
Adhesive structural bonding is widely used in mechanical and aerospace industries [1]. In recent years, there has also been a growing interest in the use of the adhesive connections in the building industry [2]. In civil engineering structures, some applications of structural adhesives are of particular importance, such as the strengthening of existing concrete members [3,4], hybrid composite-concrete beams [5] or adhesive anchors [6]. A relatively new idea is the use of structural adhesives as shear connectors in steel-concrete composite beams (e.g., [7,8,9]). The shear strength of adhesive joints in steel-concrete composite systems has been evaluated by many researchers (e.g., Gemert [10], Barnes & Mays [11], Nehdi et al. [12], Si Larbi et al. [13], Berthet et al. [14], Jurkiewiez et al. [9], Helincks et al. [15], Meaud et al. [16], Zhan et al. [17]).
With the increasing use of adhesive connections, there is a need to develop methods of non-destructive evaluation and damage detection at an early stage of degradation. One of the most efficient techniques to characterize a contact between connected components is a method utilizing the phenomenon of elastic wave propagation. Ultrasonic waves have been successfully used in the evaluation of bolted connections between metal elements [18,19,20], adhesive connections between metal elements [21,22,23] or adhesive connection between concrete substrate and repair materials [24,25,26]. Recently, studies of damage evaluation based on the concept of ultrasound monitoring have been reported The examples of their application include monitoring of damage in concrete samples [27], reinforced concrete beams [28,29,30] or in an adhesive lap joint of metal elements [31]. However, the literature on the inspection of steel-concrete adhesive joints using ultrasonic waves is limited. Only two recent papers [32,33] concern the problem of diagnostics of interface bonding between steel and concrete. In addition, in both of them, steel-concrete specimens with artificially introduced debonding were investigated and no external load was considered. To the best of the author’s knowledge, there is no research on the non-destructive testing of steel-concrete adhesive connections during mechanical degradation.
The study presents a novel approach to the failure monitoring and condition assessment of the adhesive connection between steel and concrete. Experimental investigations are performed on nine push-out specimens consisting of a concrete cube with two adhesively bonded steel plates. The diagnostic procedure uses wave propagation signals registered during mechanical degradation and damage indices based on the Sprague and Gears metric. The influence of different failure modes on obtained results is analyzed.
2. Materials and Methods
2.1. Test Specimens
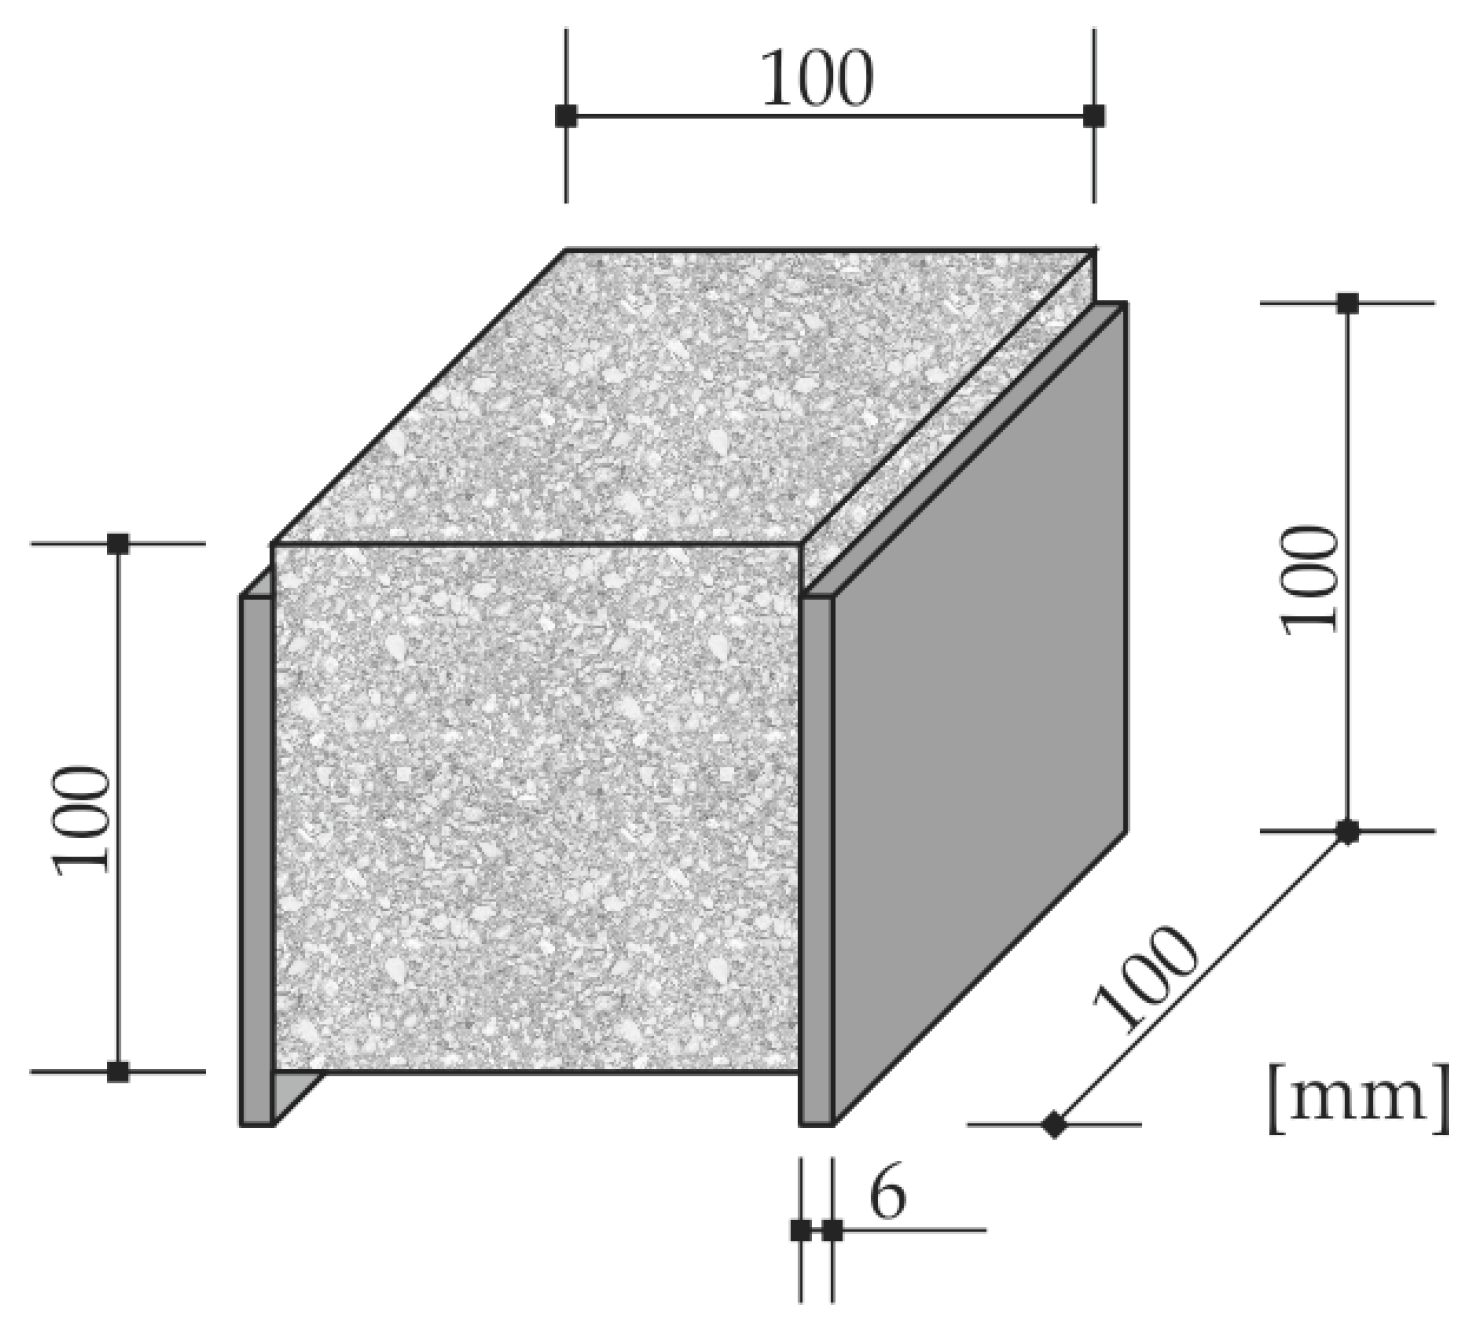
Nine steel-concrete specimens (#1 to #9) were tested in this study. Each push-out specimen consisted of two steel plates and a concrete cube (Figure 1). The plates of dimensions 6 × 100 × 100 mm3 were made of structural steel S235. The cube of dimensions 100 × 100 × 100 mm3 was made of concrete including the following ingredients: Portland cement type CEM I 42.5R (325 kg/m3), sand 0–2 mm (764 kg/m3), fine aggregate 2–8 mm (573 kg/m3), coarse aggregate 8–16 mm (573 kg/m3) and water (175 kg/m3). The adhesive connection at the steel-concrete interface was made with the use of high-strength, two-component structural epoxy paste adhesive SIKADUR 30. The bonded area was 100 mm × 90 mm on each surface of the concrete cube and the lap-joint thickness was about 1 mm.
2.2. Experimental Procedure
Experimental procedure included simultaneous push-out and wave propagation testing. Push-out tests were performed in the testing machine Zwick Z400 equipped with a compression test kit. The force and the displacement of the cross-head were recorded. The preload applied to the specimen was equal to 100 N. Then, each steel-concrete specimen was loaded with the speed of the crosshead of 0.1 mm/min up to the failure. Additionally, photographs were taken every 2 s on the front side of the specimen by the Canon EOS 5D III digital camera to observe the damage evolution and to determine the slip between steel and concrete. At each specimen, 10 pairs of magenta points with a diameter of 4 mm were attached at five levels (levels I to V, as indicated in Figure 2).
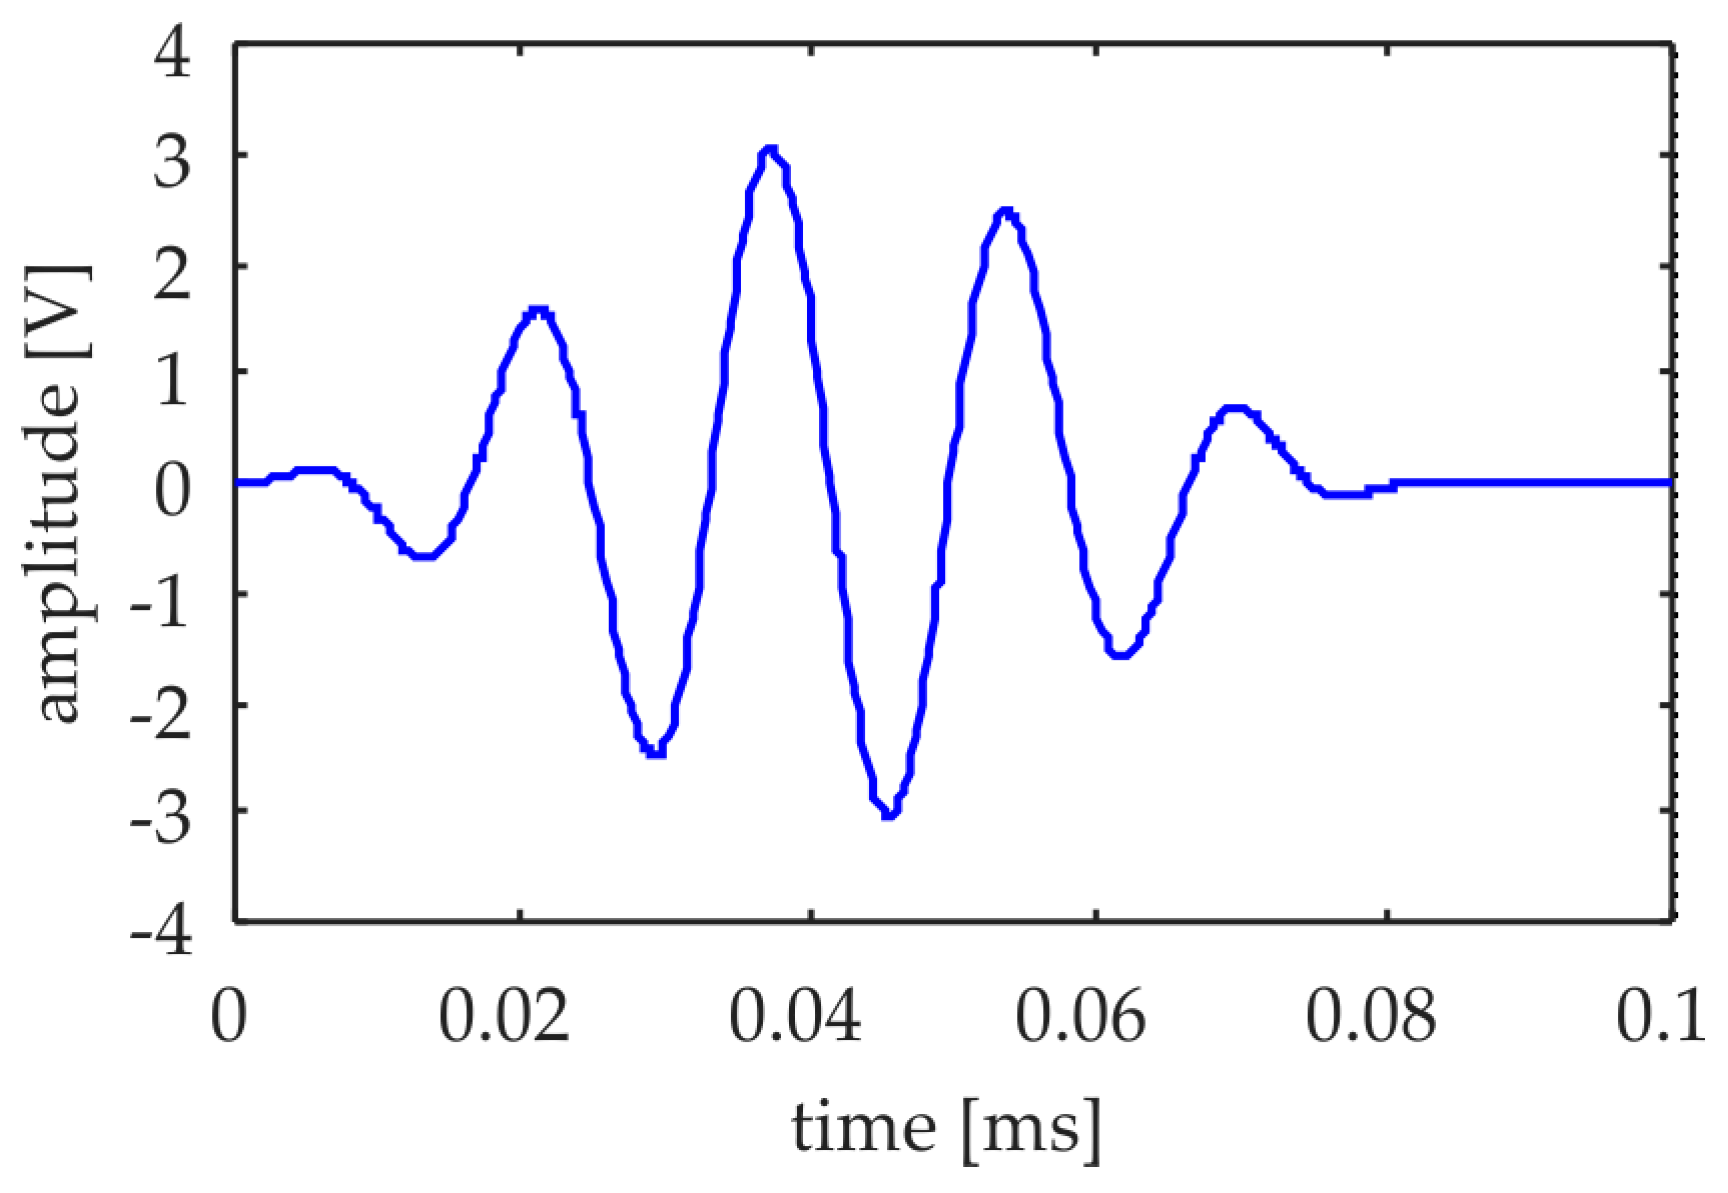
During the mechanical degradation in the testing machine, ultrasonic waves were induced and acquired every 2 s, until the specimen failure. Figure 3 shows the experimental setup. Three multilayer piezoelectric actuators NAC2024 manufactured by Noliac were used for both excitation and registration of wave propagation signals. They were adhesively bonded to the steel plates using petro wax (PCB 080A109). The configuration of piezoelectric transducers is given in Figure 2. The actuator (A) was bonded at the center of the left steel plate. The first sensor (S1) was attached next to the actuator, while the second one (S2) was attached at the center of the right steel plate. An arbitrary waveform generator (Tektronix AFG3022C) created an excitation signal in the form of a wave packet composed of a 5-cycle sine with a central frequency of 60 kHz modulated by the Hanning window (Figure 4). Then the signal was amplified 20 times by a high voltage amplifier (FLC Electronics AB A400DI). A digital oscilloscope (PicoScope 4824) was used to collect time signals of propagating waves with a sampling frequency of 20 MHz.
2.3. Data Processing for Slip Measurements
The interface slip between the steel plate and concrete cube was determined using a photogrammetric technique (c.f. [34]). The digital RGB photograph (Figure 5a) was transformed into the CMYK space according to the formula
where colors are marked as follows: c—cyan, m—magenta, y—yellow, k—black, r—red, g—green, b—blue. From the CMYK space, a component connected with magenta color was chosen for further processing (Figure 5b) in which the photograph was converted into a binary image with a threshold of 0.25 (Figure 5c). Then, for given points, the centers of gravity were calculated and the interface slips in x and y directions were determined at five levels (levels I to V).
c = 1 − r − k; m = 1 − g − k; y = 1 − b − k; k = min(c,m,k)
2.4. Data Processing for Damage Assessment
Ultrasonic signals were registered automatically in the monitoring mode. The first signal was registered at the beginning of the push-out test, i.e., for the force equal to 100 N. This signal was next considered as a reference signal. All other signals were considered as signals relating to successive states of mechanical degradation. The idea of the evaluation of damage growth proposed in this study is to monitor the changes in amplitude and phase shift of signals measured during subsequent phases of degradation of the adhesive joint. To quantify the agreement between two signals, the Sprague and Gears (S&G) metric was applied [35,36,37]. Originally, this metric was developed for comparing measured and calculated transient response histories. In the present study, the Sprague and Gears metric was applied to quantify discrepancies between the reference signal and other registered signals.
The S&G metric considers both the magnitude and the phase shift aspects. The magnitude error factor (M-error) and the phase error factor (P-error) are given by the following relations [35,36,37]
where
In Equation (4), r(t) denotes a reference signal and m(t) is a signal acquired during the monitoring of damage growth. For discretized time histories, the time integrals (4) can be calculated as
where ri and mi are the discretized values of signals r(t) and m(t), respectively and N denotes the number of samples. The characteristic features of both M and P factors are that the magnitude error is insensitive to phase discrepancies and the phase error is insensitive to magnitude discrepancies. The comprehensive error (C-error) is defined as
and it represents both the magnitude and phase errors.
3. Results and Discussion
3.1. Push-out Tests and Failure Modes
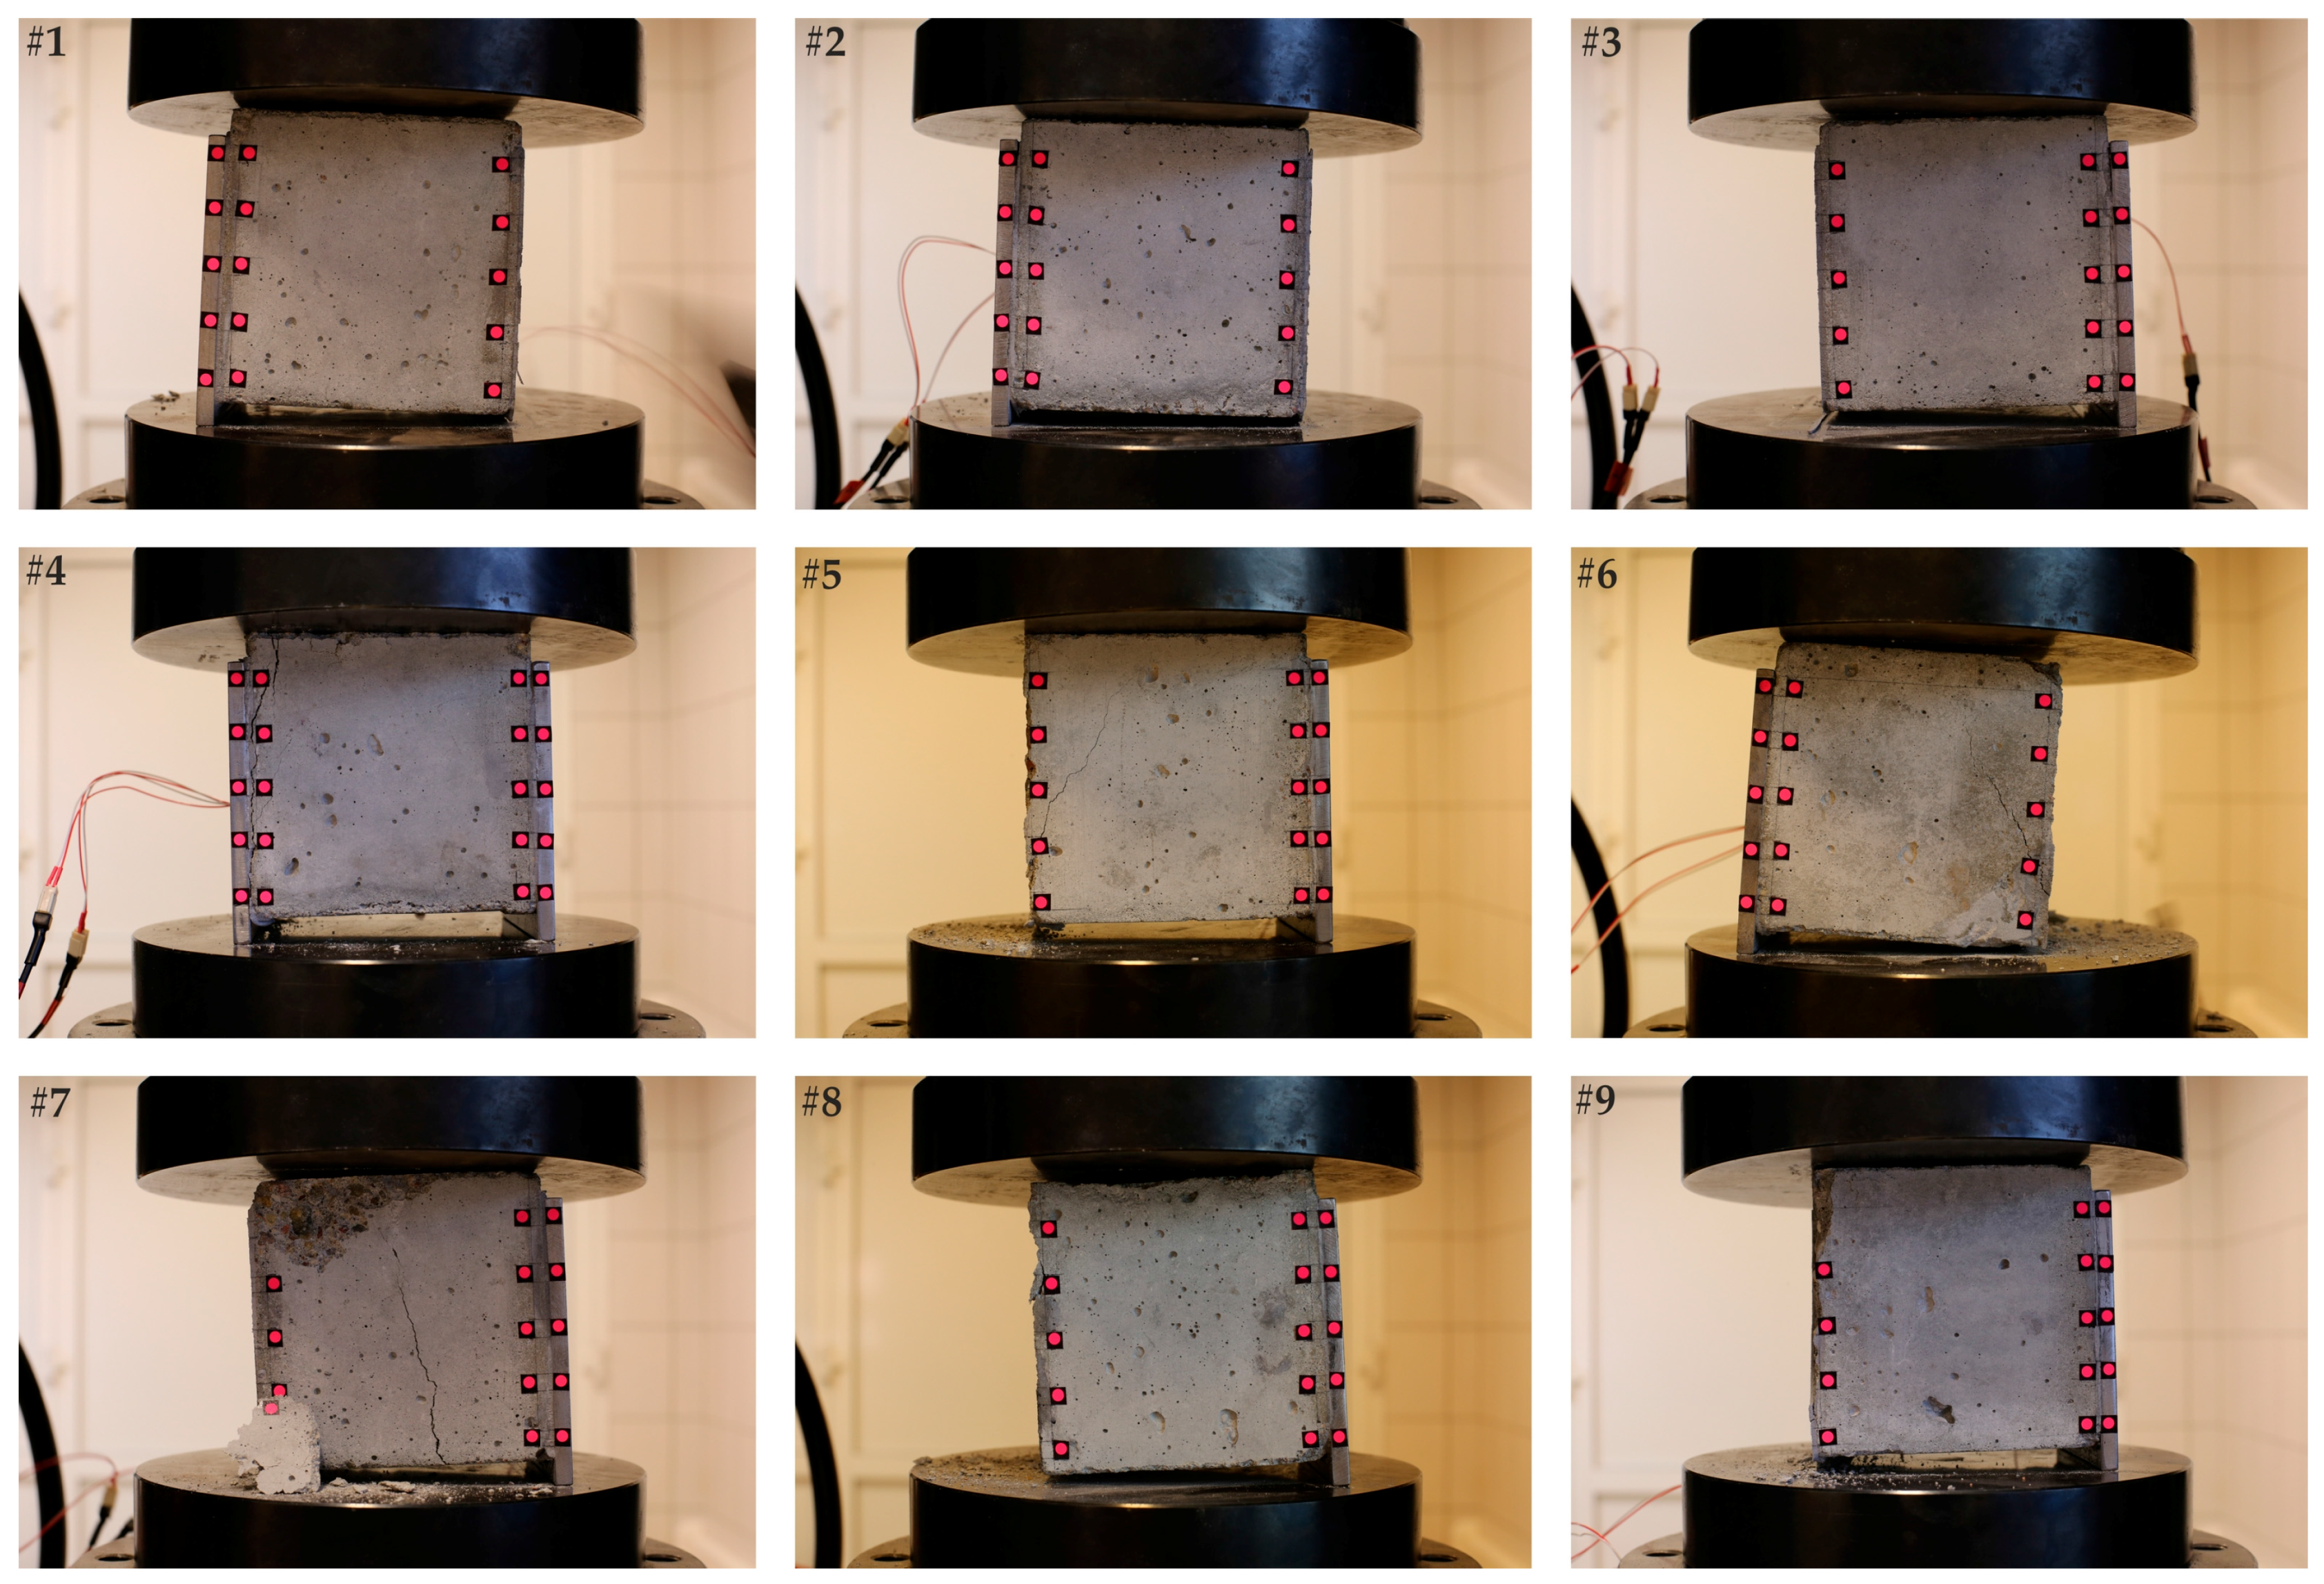
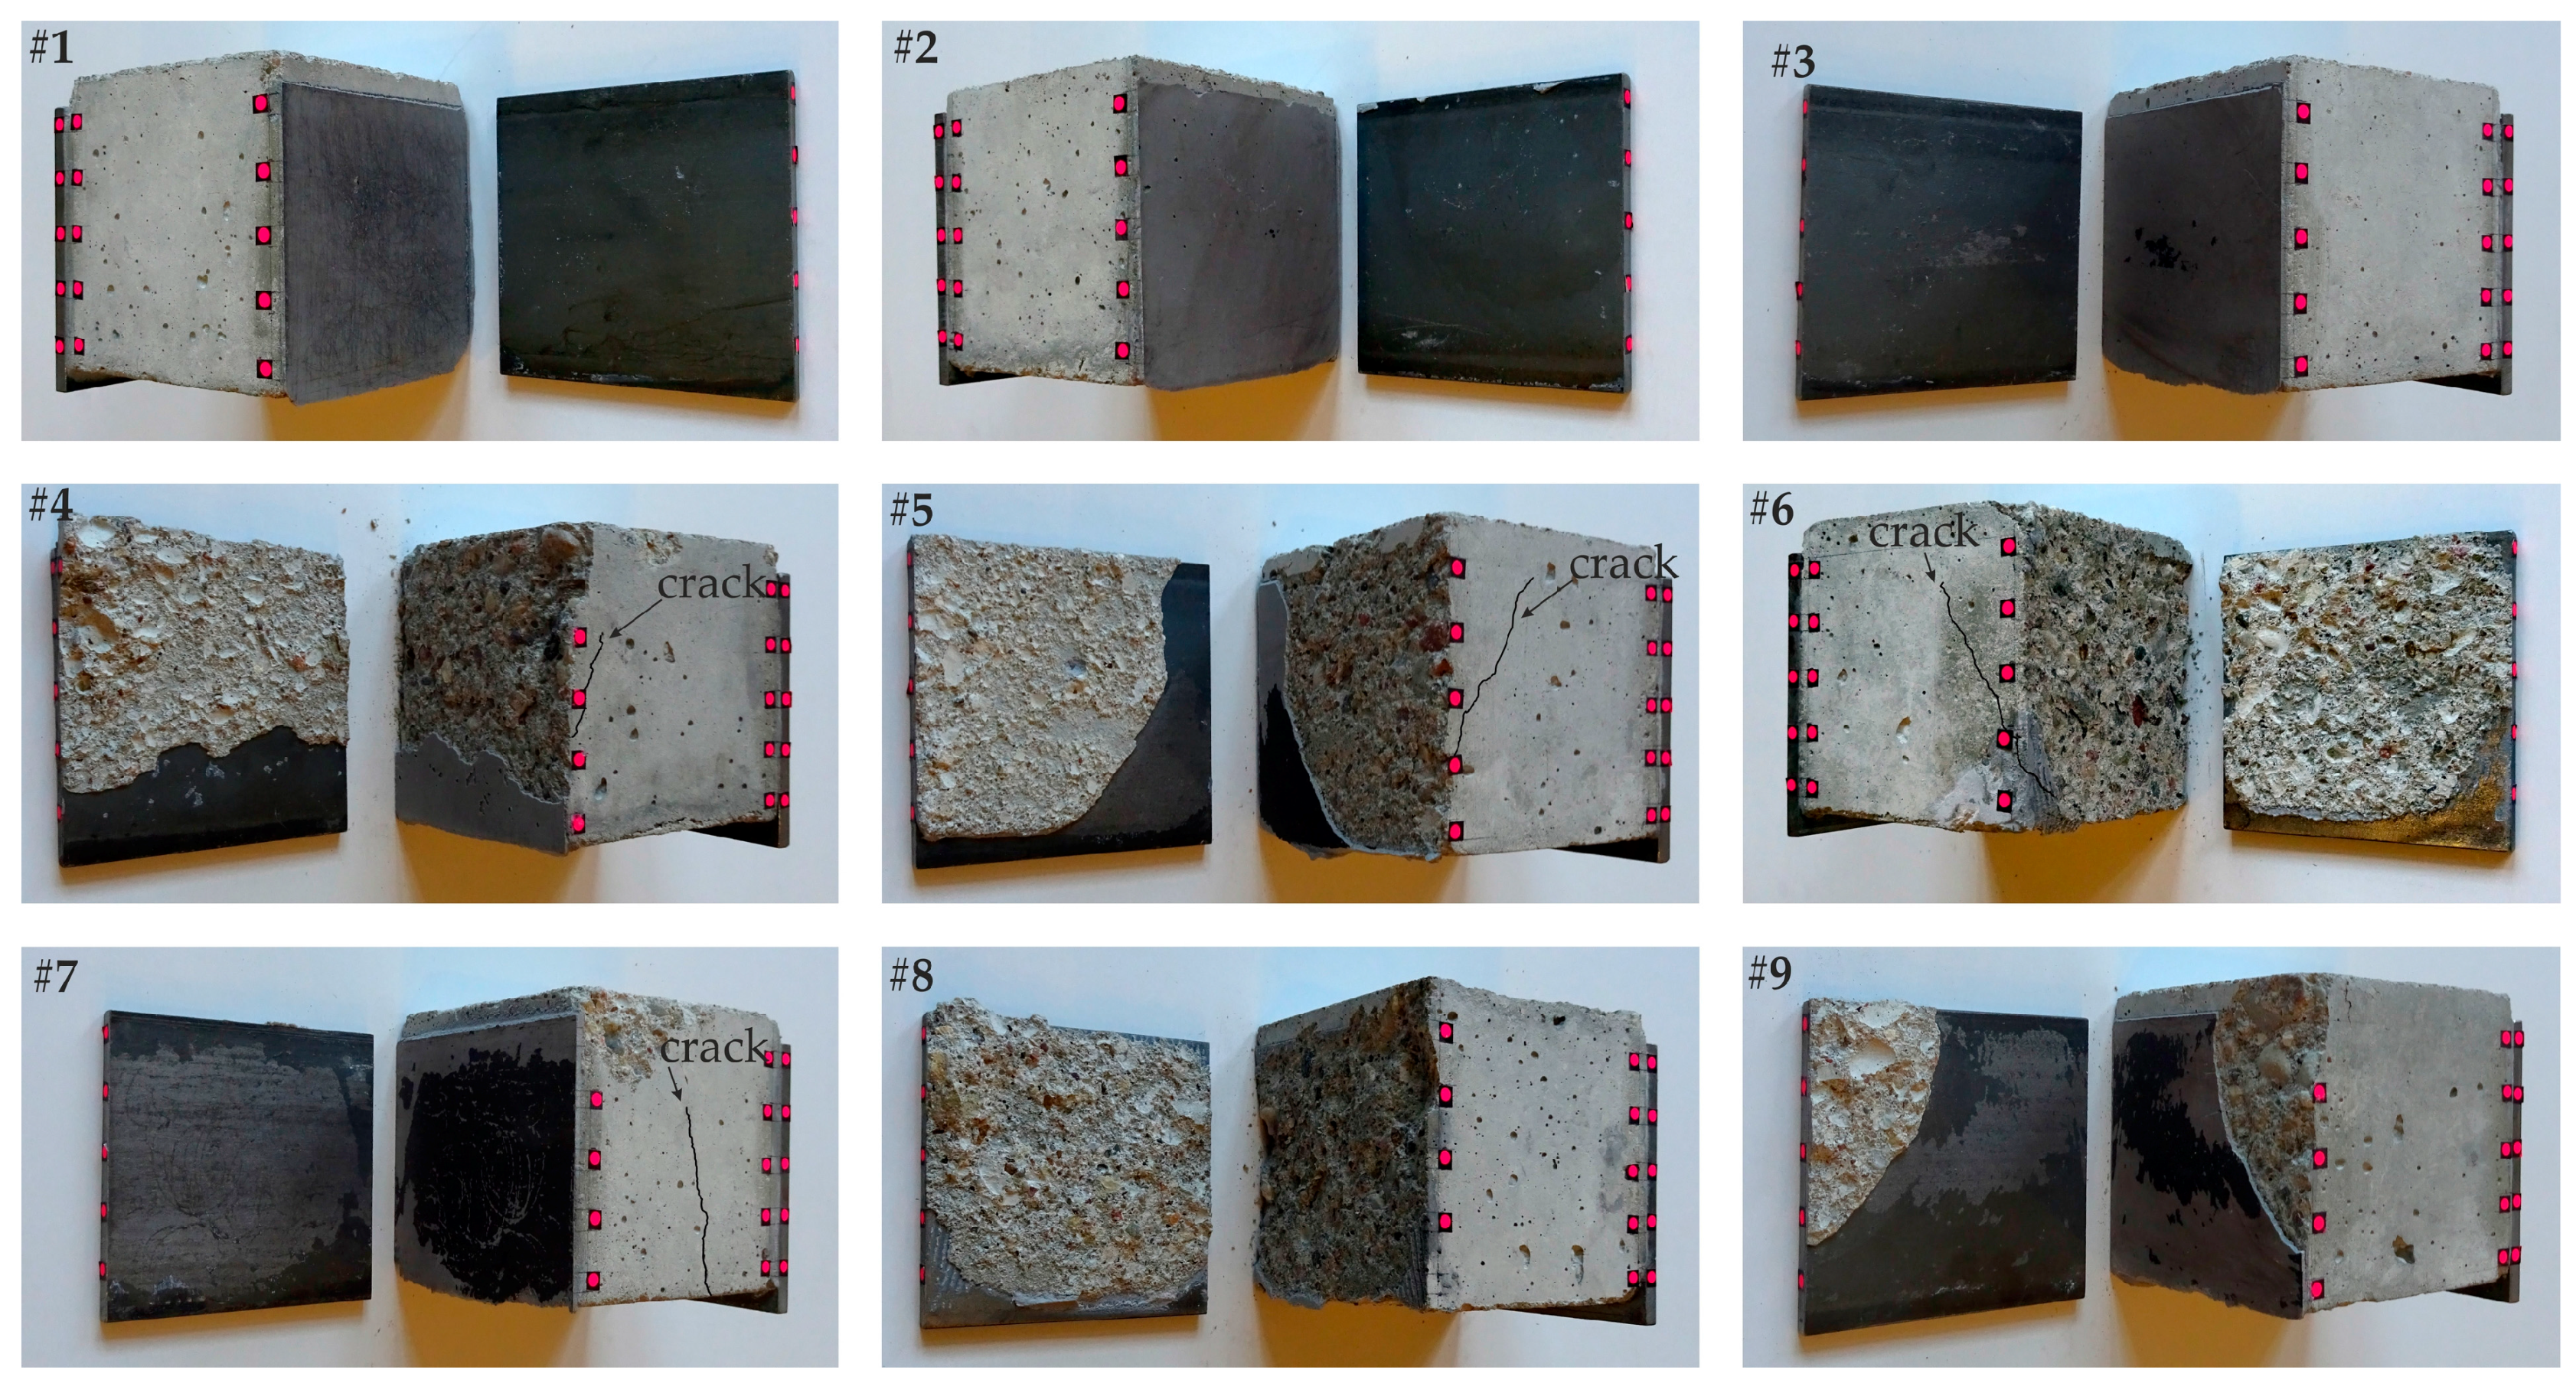
Figure 6 and Figure 7 illustrate all push-out specimens after failure. The specimens were divided into two sets according to observed failure modes. Mode I (specimens #1–#3) was an adhesive-type failure occurring at the interface between the steel plate and the adhesive layer. No damage was observed in the concrete cube. The entire adhesive layer remained on the concrete. Mode II (specimens #4–#10) included a cohesive-type failure or mixed cohesive-adhesive failure. In mode II, three sub-groups were distinguished: mode IIa (specimens #4–#6), mode IIb (specimen #7) and mode IIc (specimens #9–#10). The damage in modes IIa and IIb included two phases. In the first phase, the damage was mainly cohesive with a failure in the bulk of the concrete cube. The second phase was a separation of the steel plate from the concrete. In mode IIa, a single diagonal crack originated from the interface between steel and concrete, and then the cohesive (specimen #6) or mixed cohesive-adhesive failure (specimens #4, #5) occurred in the bulk of the adhesive layer. In mode IIb, a crack appeared in the middle of the concrete cube and then the adhesive failure occurred. The failure in mode IIc was cohesive (specimen #8) and mixed adhesive-cohesive (specimen #9) with a separation in the bulk of the adhesive layer.
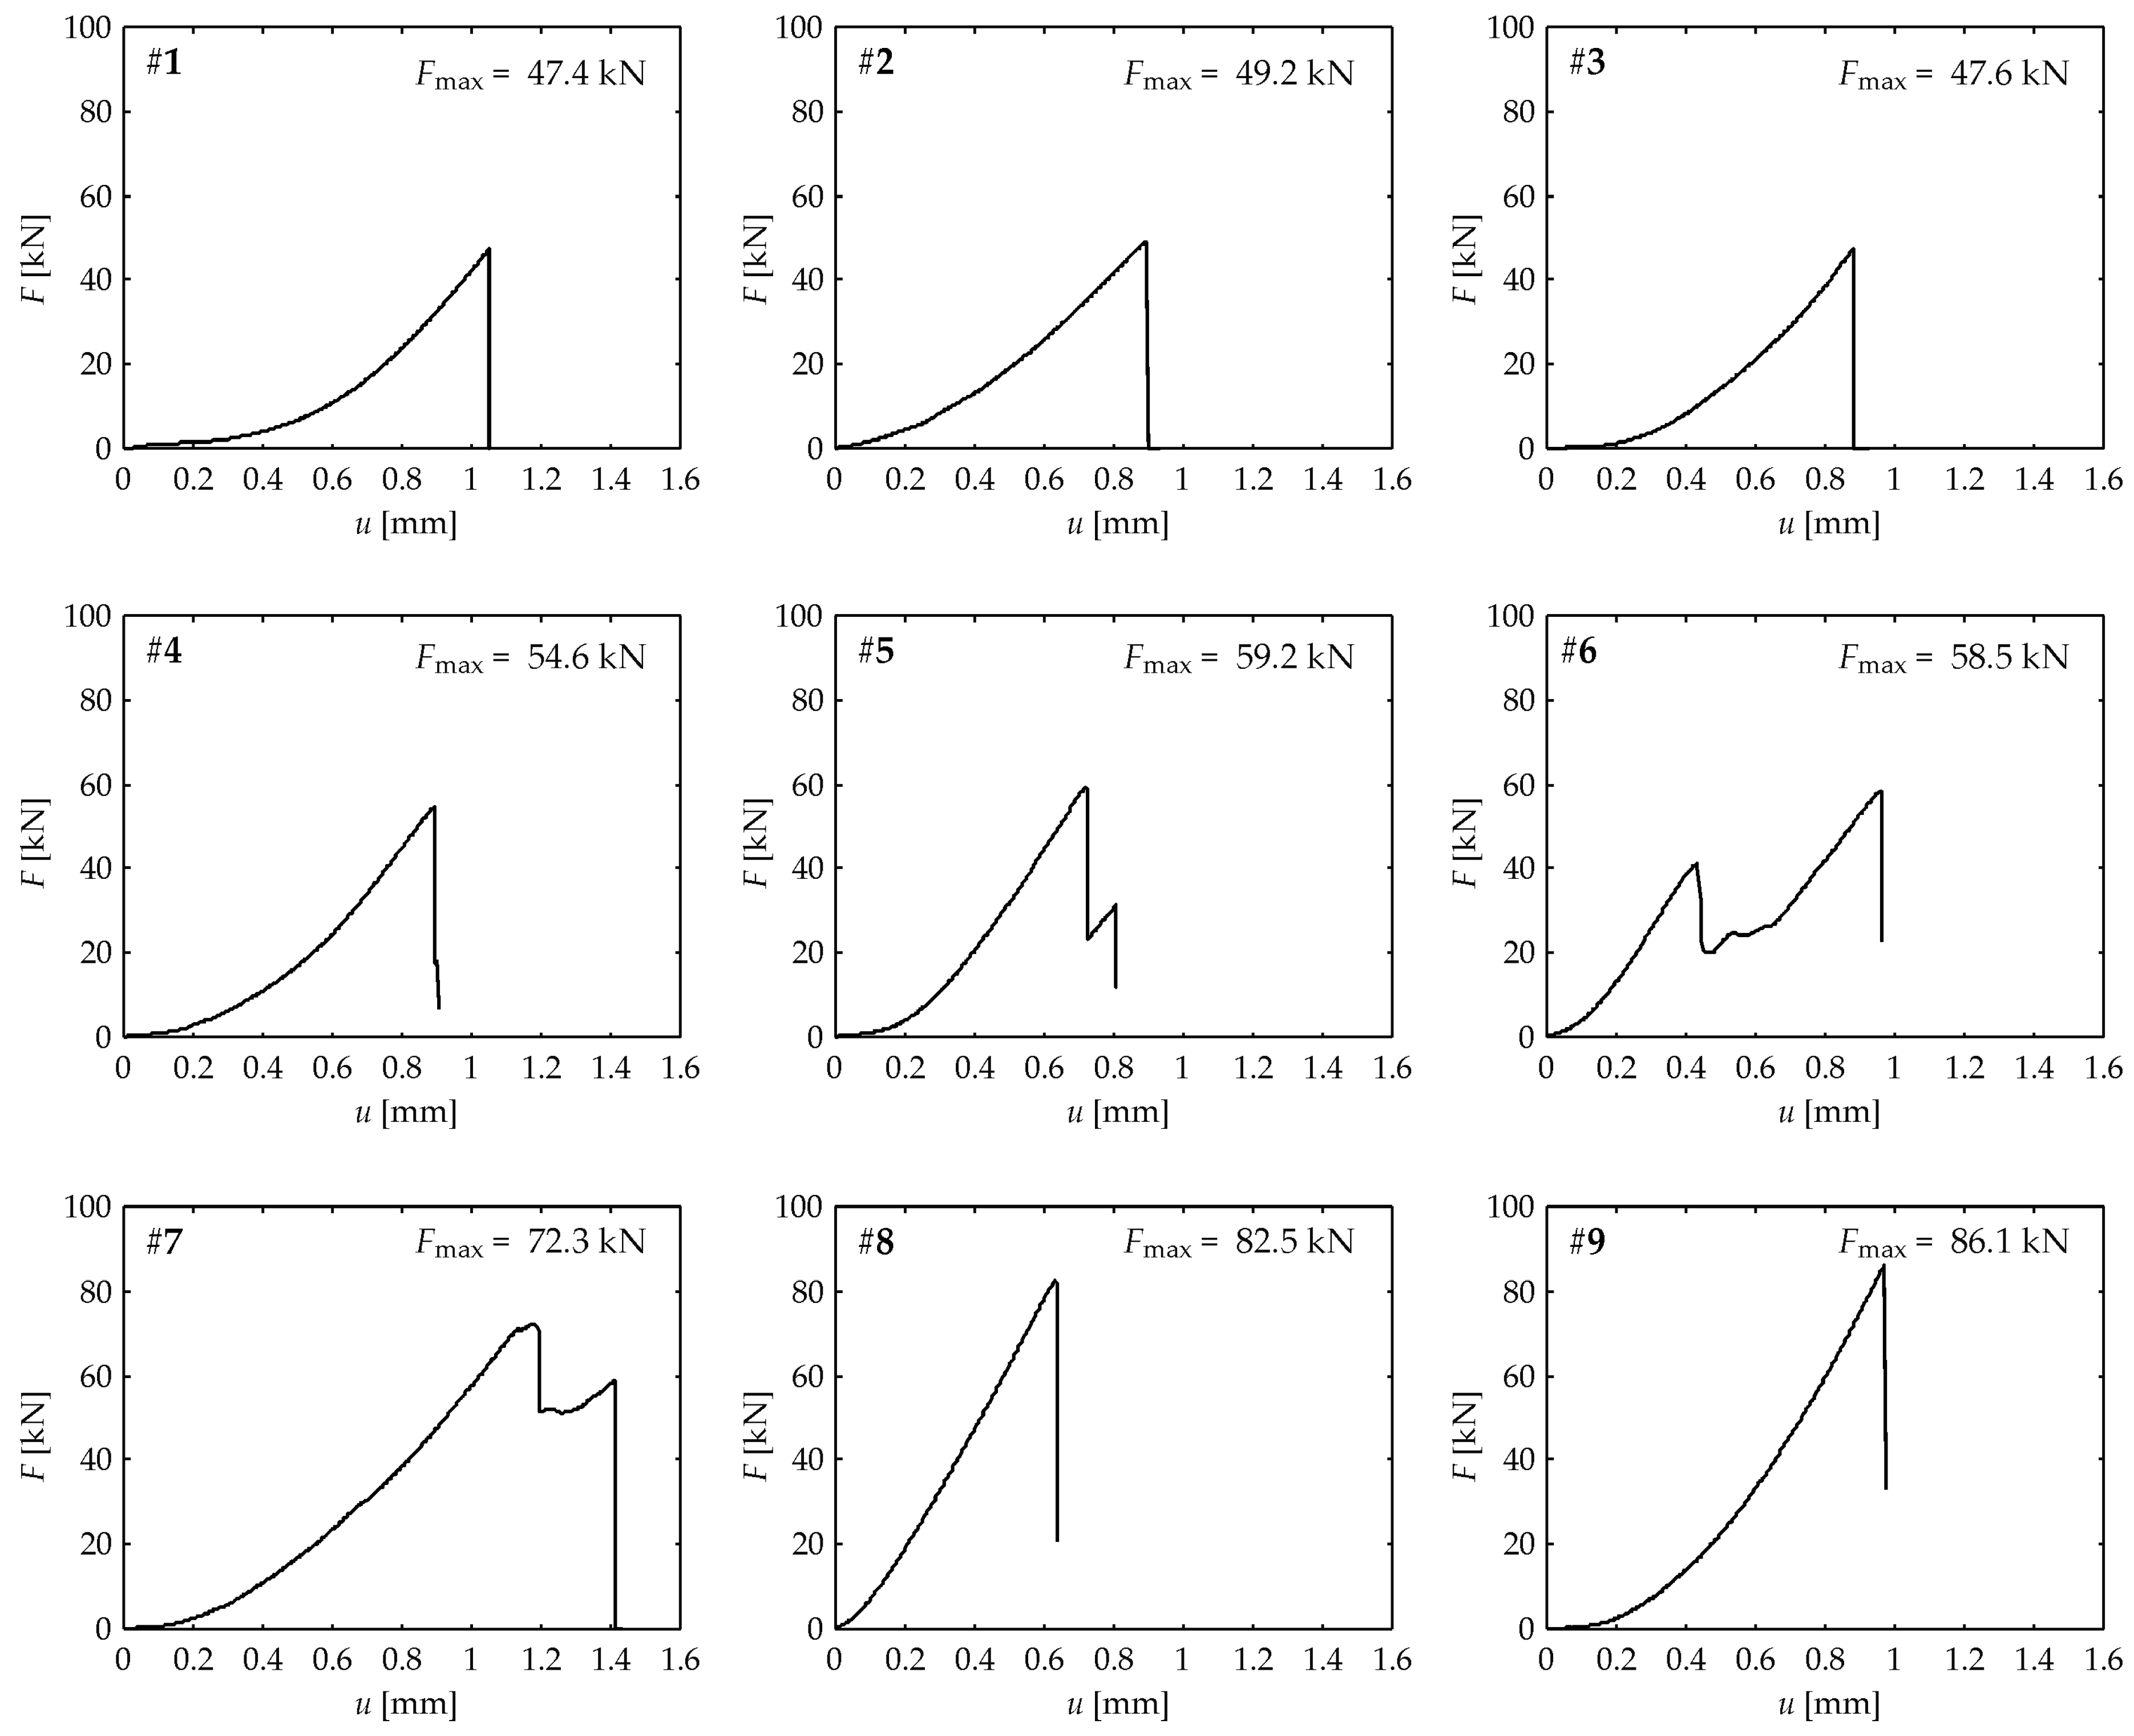
Figure 8 shows the force-displacement curves for all tested specimens. In mode I, the shape of curves for each specimen is similar. The sudden drop of the force at the moment of the adhesive failure can be observed. The maximum force was 47.4 kN (specimen #1), 49.2 kN (specimen #2) and 47.6 kN (specimen #3). The curves for the specimen failures categorized as modes IIa and IIb exhibited two drops of the force. The first drop is associated with the appearance of the crack in the concrete, while the second is associated with the separation of the steel plate. In the case of specimens with diagonal cracks, the maximum force was 54.6 kN (specimen #4), 59.2 kN (specimen #5), 58.5 kN (specimen #6). For the specimen with the crack in the middle of the concrete cube (specimen #7), the maximum force was 72.3 kN. The last two curves corresponding to mode IIc are characterized by the sudden drop of the force at the moment of the cohesive or mixed adhesive-cohesive failure. The maximum force was 82.5 kN (specimen #8) and 86.1 kN (specimen #9).
Results of the interface slip between the steel and concrete in both vertical and horizontal directions are presented in Figure 9. For each specimen, the slip values are given for this interface at which the failure occurred (i.e., the right interface for specimens #1, #2, #6 and the left interface for specimens #3, #4, #5, #7, #8, #9). The moment of initiation of the crack in the concrete cube was indicated by the dashed lines (specimens #4–#7). In the case of the adhesive or mixed adhesive-cohesive failure, the measured slip varied around zero almost to the end of the degradation process. For specimens #2, #3 and #9, the monotonic increase of the slip was observed at the end of the test. The maximum values of the slip for the specimens representing mode I and mode IIc was about 0.05 mm. In the case of specimens with the cohesive failure in the bulk of the concrete cube, a sudden increase of the slip was observed in specimens #4, #5 and #7. A different behavior can be seen for specimen #6 for which the monotonic increase occurred after the cracking of concrete cube. The maximum values of the slip for specimens representing modes IIa and IIc were about 0.4 mm.
3.2. Ultrasonic Tests
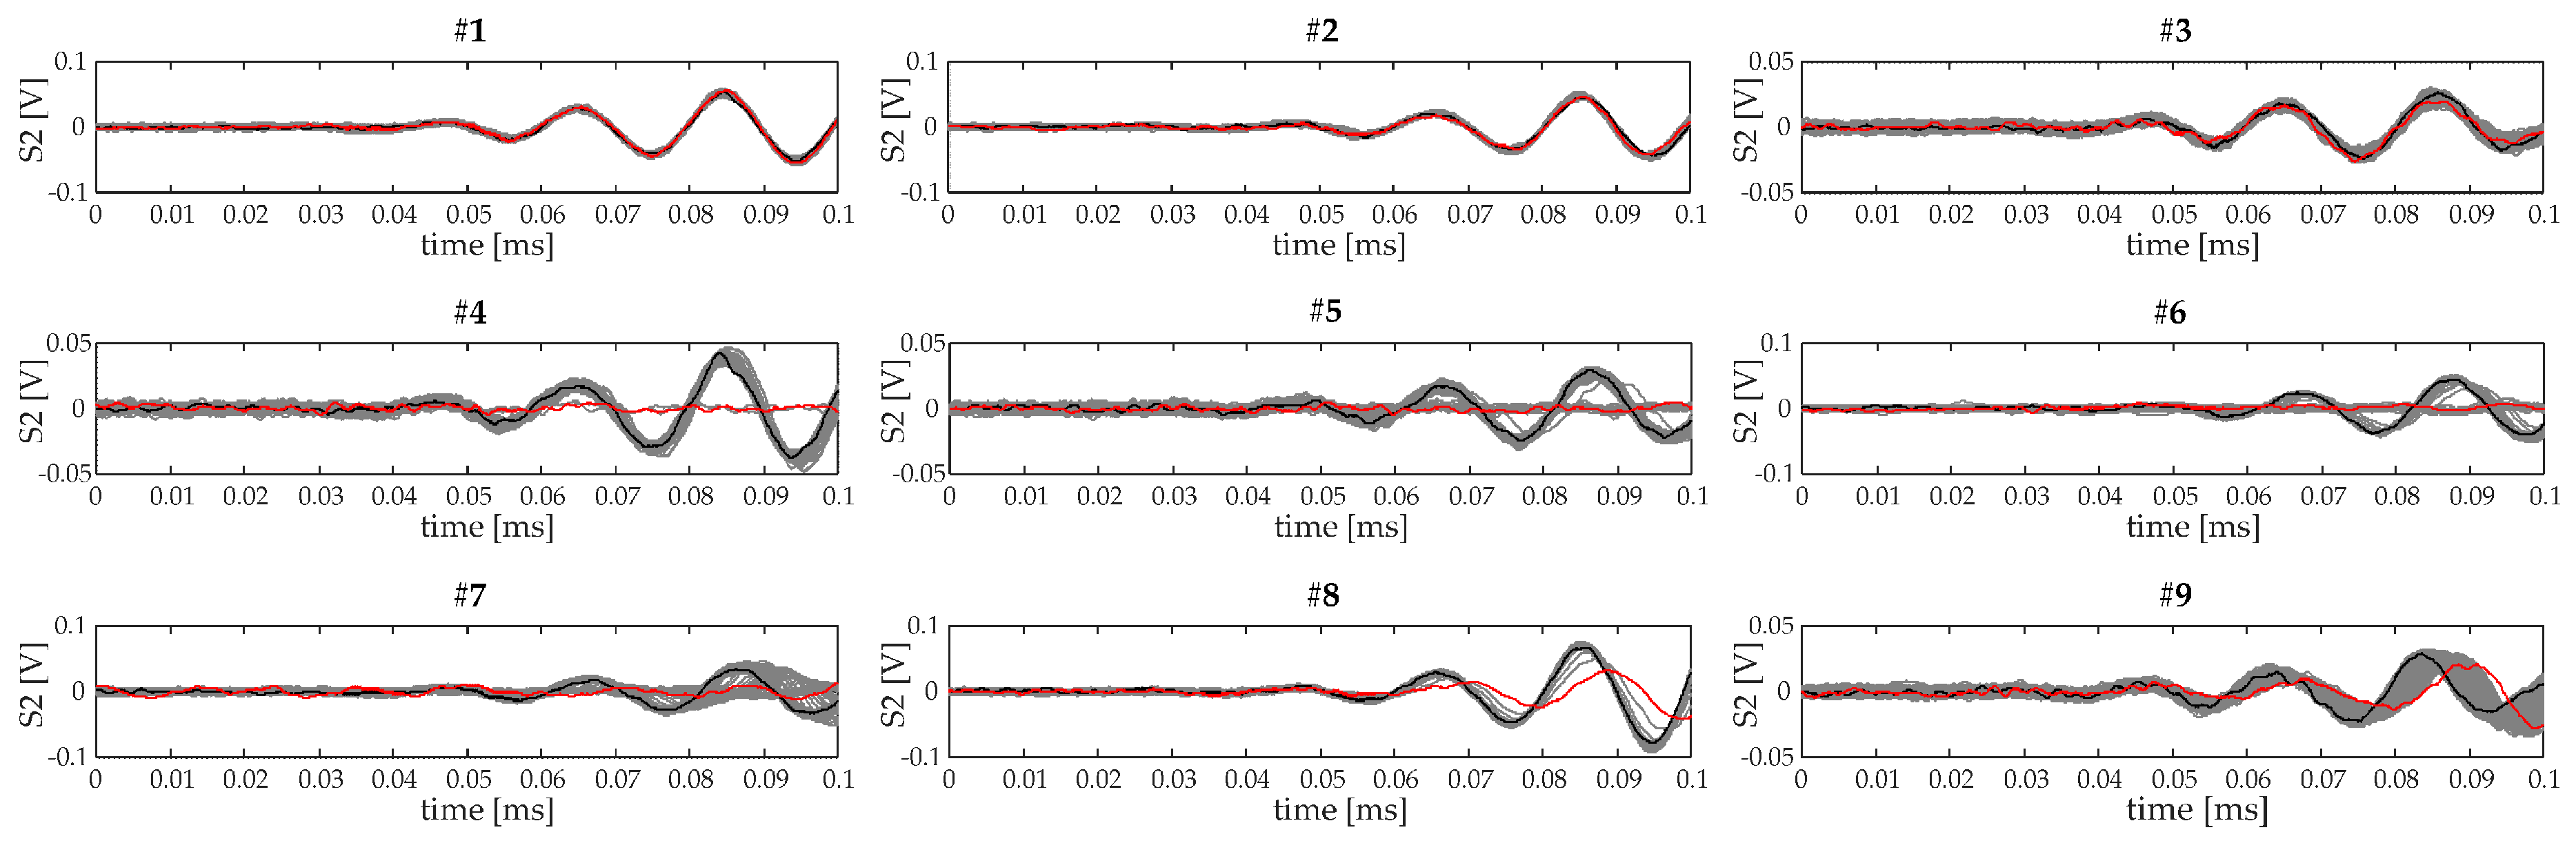
The ultrasonic waves were registered automatically every 2 seconds during push-out testing. All signals acquired by sensor S2 for specimens #1 to #9 are illustrated in Figure 10. Only an initial part of the signal with a length of 0.1 ms was analyzed to reduce the influence of interactions of waves with the compression test kit of the testing machine. The reference signal, i.e., the signal registered at the beginning of the push-out test is marked in black and the last acquired signal is marked in red. For specimens #1–#3, representing the adhesive-type failure (mode I), signals relating to successive states of mechanical degradation are similar and no significant changes in the magnitude or phase can be observed. In the case of push-out specimens #4–#10, for which the cohesive or mixed adhesive-cohesive failure occurred (mode II), experimental waveforms changed considerably during mechanical degradation.
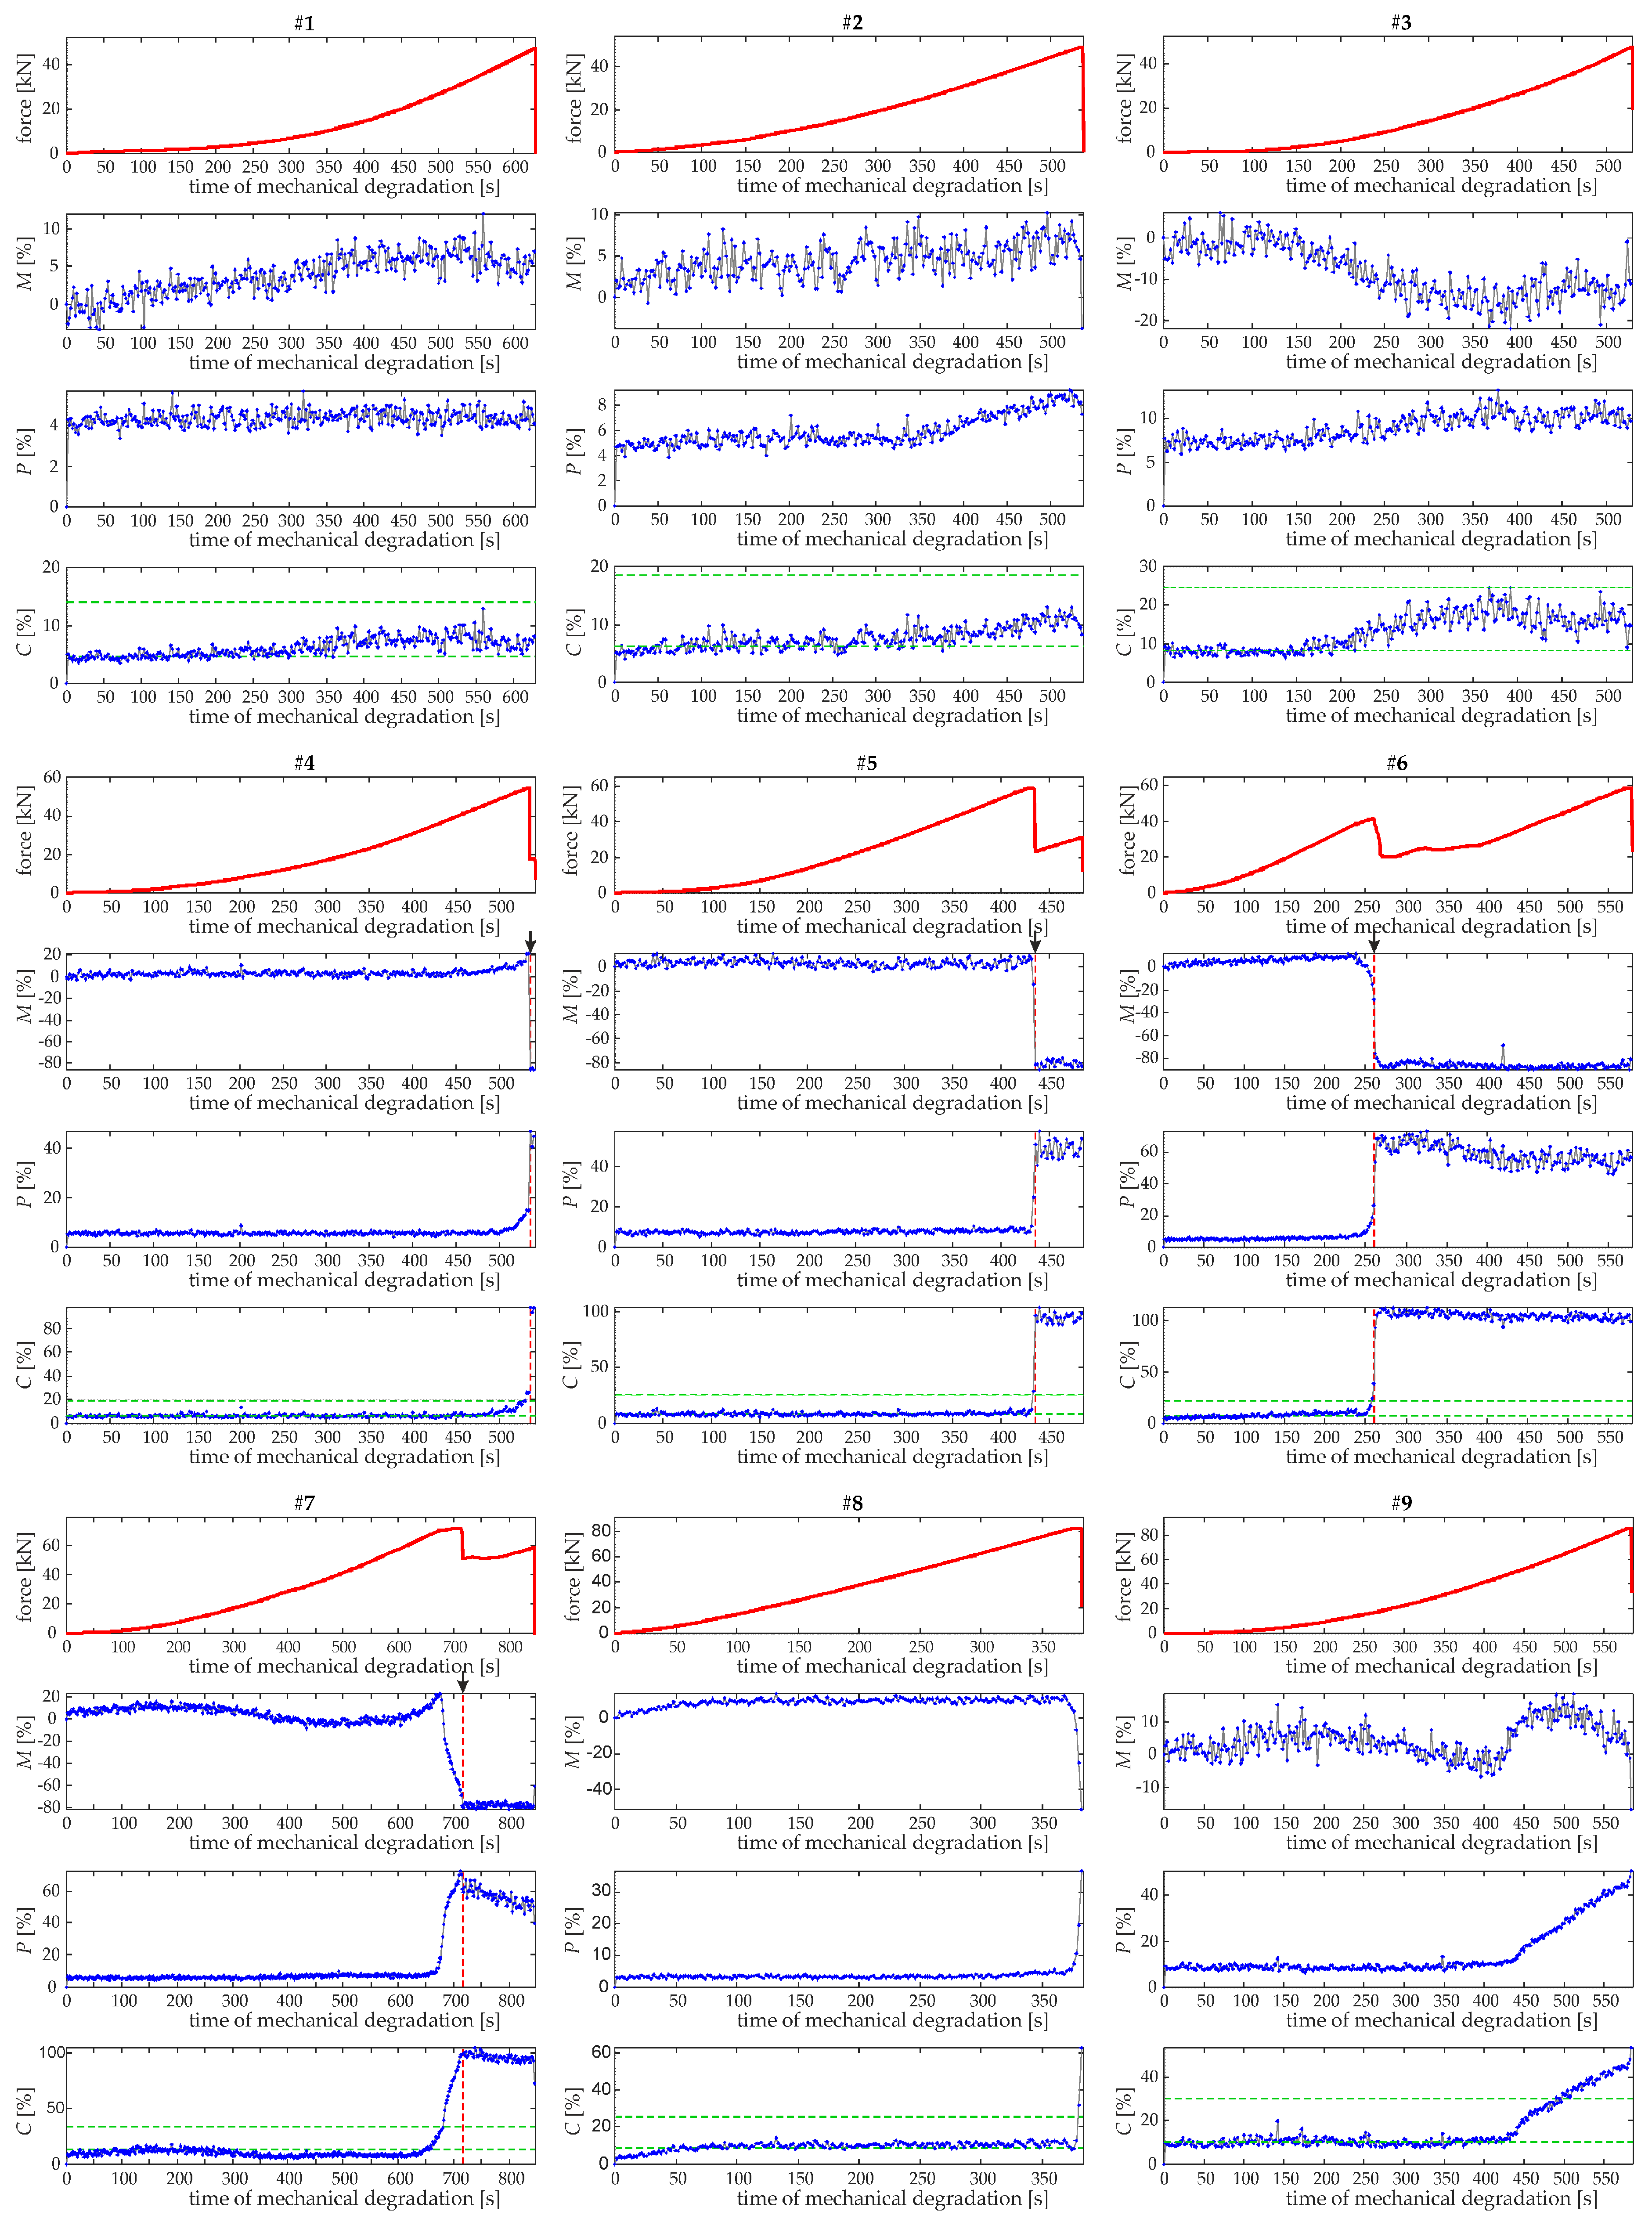
The results of applying the Sprague and Geers metric to all signals registered during the monitoring of the push-out test are presented in Figure 11. For clarity of observation, the load-time curves were provided for each specimen. Additionally, for specimens #4–#7, red dashed lines were drawn at the moment of initiation of the crack in the concrete cube. The S&G metric expresses the difference between the reference signal and the other signals registered during the push-out test. The error measures can range from 0 to 1 or more. The perfect agreement of time histories results in a zero value of the error measures, while the value of unity indicates a difference of 100%. The value of the P-error is always positive while the value of the M-error can be positive or negative, depending on whether the monitored signal has higher or lower amplitude than the reference signal. At the beginning of the process, the P-error fluctuated around the value of about 5% and the M-error around the value of about 0%. These values resulted from the presence of measuring noise in the subsequently triggered measuring signals.
Considering the specimens with the adhesive-type damage (the first row in Figure 11), all error measures are rather constant during the entire push-out test. A slight increase in the P-error value was observed for specimen #6; however, based on these errors it was not possible to detect incoming damage before the failure.
The second group are specimens belonging to failure modes IIa and IIb, for which the separation between the steel plate and concrete was preceded by the cracking of concrete. For specimens #4, #5 and #6, the increase in the P-error can be observed before the initiation of the diagonal cracks. This increase was quite sudden for specimen #5, but for specimens #4 and #6 it was gradual signaling incoming damage. Moreover, for specimen #6, the M-error gradually decreased before the initiation of the diagonal cracks. In the case of specimen #7, for which the crack appeared in the middle of the concrete cube, the gradual increase of the P-error and the decrease in the M-error can be seen, enabling detection of the micro-crack zones in the concrete long before the appearance of the macro-crack.
The last two specimens represented the failure of mode IIc. For the specimen #8, the detection of the cohesive failure was possible based on both the M and P-errors. In the case of specimen #9, the gradual increase of the P-error was observed (similarly as for specimen #2) indicating the increase in the load but not the appearance of the failure. This was because, the failure of specimen #9 was mainly adhesive, with a small area at which the cohesive failure occurred.
As a damage indicator, the C-error is proposed because it contains both the magnitude and phase errors. For each specimen, two horizontal lines were drawn in the plots of the comprehensive error (Figure 11). The first line is a mean of the 100 first values of the C-error and it determines a baseline. The second line is the baseline multiplied by a coefficient and it represents the state of possible damage. In this study, the value of the coefficient was set a priori as 3, however, in potential applications of structural monitoring, it should be verified based on comprehensive experimental data. Based on the indicator, it was not possible to recognize the upcoming separation between steel and concrete in any specimen with the adhesive failure (specimens #1–#3). In the case of specimens exhibiting the cohesive or mixed adhesive-cohesive failure, the gradual increase of the C-error enabled earlier detection of potential damage.
4. Conclusions
This paper presents the investigation on the possibility of damage assessment and monitoring at adhesively bonded interfaces between steel and concrete. The ultrasonic tests were carried out on steel-concrete specimens subjected to push-out loading. The idea of the procedure was to monitor the changes in the amplitude and phase shift of signals measured during subsequent phases of degradation of the adhesive joint. To quantify discrepancies between the reference signal and other registered signals, the damage indicator based on the C-error of the Sprague and Gears metric was proposed. The damage assessment procedure was compared with results of the monitoring of the interface slip.
The tested specimens revealed three types of failure mechanisms, namely, the adhesive, cohesive and mixed adhesive-cohesive failure. The adhesive failure occurred in a sudden manner and detection of damage before the complete separation of steel and concrete was not possible based on ultrasound monitoring. In the other cases of failure modes, i.e., the cohesive and mixed adhesive-cohesive failure, the proposed damage indicator enabled detection of potential damage. The gradual increase of the C-error was observed before the initiation of cracks in the bulk of the adhesive layer or in the bulk of the concrete cube.
The monitoring of the interface slip revealed sudden increases of its value in the case of specimens with the cohesive failure preventing earlier detection of damage. For specimen with the adhesive or mixed adhesive-cohesive failure, the gradual increase in the slip value at the final stage of the test may indicate approached failure. However, in some specimens, no increase of the slip was observed. A possible application of the interface slip monitoring in the case of the adhesive-type failure should be tested in a larger number of cases.
The results showed the possibilities and limitations of the proposed approach in diagnostics of adhesive connections between steel and concrete depending on the failure modes. The conducted research should be considered as an initial step for further analyses related to the condition assessment of adhesively bonded shear connectors.
Acknowledgments
The author would like to acknowledge the National Science Centre, Poland for the support for this research within project No. 2015/19/B/ST8/00779. The help of Jacek Lachowicz, Erwin Wojtczak and Beata Zima during preparation of steel-concrete specimens is gratefully acknowledged.
Conflicts of Interest
The author declares no conflict of interest.
References
- Adams, R.D.; Wake, W.C. Structural Adhesive Joints in Engineering; Elsevier Applied Science Publishers: Amsterdam, The Netherlands, 1986; ISBN 978-94-010-8977-7. [Google Scholar]
- Kumar, P.; Patnaik, A.; Chaudhary, S. A review on application of structural adhesives in concrete and steel–concrete composite and factors influencing the performance of composite connections. Int. J. Adhes. Adhes. 2017, 77, 1–14. [Google Scholar] [CrossRef]
- Giurgiutiu, V.; Lyons, J.; Petrou, M.; Laub, D.; Whitley, S. Fracture mechanics testing of the bond between composite overlays and a concrete substrate. J. Adhes. Sci. Technol. 2001, 15, 1351–1371. [Google Scholar] [CrossRef]
- Ali, M.S.M.; Oehlers, D.J.; Bradford, M.A. Debonding of steel plates adhesively bonded to the compression faces of RC beams. Constr. Build. Mater. 2005, 19, 413–422. [Google Scholar]
- Verbruggen, S.; De Sutter, S.; Iliopoulos, S.; Aggelis, D.G.; Tysmans, T. Experimental Structural Analysis of Hybrid Composite-Concrete Beams by Digital Image Correlation (DIC) and Acoustic Emission (AE). J. Nondestruct. Eval. 2016, 35, 1–10. [Google Scholar] [CrossRef]
- Marcon, M.; Vorel, J.; Ninčević, K.; Wan-Wendner, R. Modeling adhesive anchors in a discrete element framework. Materials 2017, 10, 917. [Google Scholar] [CrossRef] [PubMed]
- Bouazaoui, L.; Perrenot, G.; Delmas, Y.; Li, A. Experimental study of bonded steel concrete composite structures. J. Constr. Steel Res. 2007, 63, 1268–1278. [Google Scholar] [CrossRef]
- Bouazaoui, L.; Jurkiewiez, B.; Delmas, Y.; Li, A. Static behaviour of a full-scale steel-concrete beam with epoxy-bonding connection. Eng. Struct. 2008, 30, 1981–1990. [Google Scholar] [CrossRef]
- Jurkiewiez, B.; Meaud, C.; Michel, L. Non linear behaviour of steel-concrete epoxy bonded composite beams. J. Constr. Steel Res. 2011, 67, 389–397. [Google Scholar] [CrossRef]
- Van Gemert, D. Force transfer in epoxy bonded steel/concrete joints. Int. J. Adhes. Adhes. 1980, 1, 67–72. [Google Scholar] [CrossRef]
- Barnes, R.A.; Mays, G.C. The transfer of stress through a steel to concrete adhesive bond. Int. J. Adhes. Adhes. 2001, 21, 495–502. [Google Scholar] [CrossRef]
- Nehdi, M.; El Damatty, A.; Rahimi, R. Investigation on lap-joint behaviour of GFRP plates bonded to silica fume and rice husk ash concrete. Int. J. Adhes. Adhes. 2003, 23, 323–333. [Google Scholar] [CrossRef]
- Si Larbi, A.; Ferrier, E.; Jurkiewiez, B.; Hamelin, P. Static behaviour of steel concrete beam connected by bonding. Eng. Struct. 2007, 29, 1034–1042. [Google Scholar] [CrossRef]
- Berthet, J.F.; Yurtdas, I.; Delmas, Y.; Li, A. Evaluation of the adhesion resistance between steel and concrete by push out test. Int. J. Adhes. Adhes. 2011, 31, 75–83. [Google Scholar] [CrossRef]
- Helincks, P.; De Corte, W.; Klusák, J.; Boel, V.; De Schutter, G. Experimental Investigation of the Influence of the Bond Conditions on the Shear Bond Strength between Steel and Self-Compacting Concrete Using Push-Out Tests. Key Eng. Mater. 2012, 525–526, 205–208. [Google Scholar] [CrossRef]
- Meaud, C.; Jurkiewiez, B.; Ferrier, E. Steel-concrete bonding connection: An experimental study and non-linear finite element analysis. Int. J. Adhes. Adhes. 2014, 54, 131–142. [Google Scholar] [CrossRef]
- Zhan, Y.; Ma, Z.J.; Asce, F.; Zhao, R.; Li, G.; Xiang, T. Interface Behavior between Steel and Concrete Connected by Bonding. J. Bridge Eng. 2016, 21, 04016026. [Google Scholar] [CrossRef]
- Amerini, F.; Barbieri, E.; Meo, M.; Polimeno, U. Detecting loosening/tightening of clamped structures using nonlinear vibration. Smart Mater. Struct. 2010, 19, 85013. [Google Scholar] [CrossRef]
- Wang, T.; Song, G.; Wang, Z.; Li, Y. Proof-of-concept study of monitoring bolt connection status using a piezoelectric based active sensing method. Smart Mater. Struct. 2013, 22, 87001. [Google Scholar] [CrossRef]
- Kędra, R.; Rucka, M. Damage detection in a bolted lap joint using guided waves. Procedia Eng. 2017, 199, 2114–2119. [Google Scholar] [CrossRef]
- Rokhlin, S.I. Lamb wave interaction with lap-shear adhesive joints: Theory and experiment. J. Acoust. Soc. Am. 1991, 89, 2758–2765. [Google Scholar] [CrossRef]
- Di Scalea, F.L.; Bonomo, M.; Tuzzeo, D. Ultrasonic guided wave inspection of bonded lap joints: Noncontact method and photoelastic visualization. Res. Nondestruct. Eval. 2001, 13, 153–171. [Google Scholar] [CrossRef]
- Yonathan Sunarsa, T.; Aryan, P.; Jeon, I.; Park, B.; Liu, P.; Sohn, H. A Reference-Free and Non-Contact Method for Detecting and Imaging Damage in Adhesive-Bonded Structures Using Air-Coupled Ultrasonic Transducers. Materials 2017, 10, 1402. [Google Scholar] [CrossRef] [PubMed]
- Czarnecki, L.; Garbacz, A.; Krystosiak, M. On the ultrasonic assessment of adhesion between polymer coating and concrete substrate. Cem. Concr. Compos. 2006, 28, 360–369. [Google Scholar] [CrossRef]
- Garbacz, A. Application of stress based NDT methods for concrete repair bond quality control. Bull. Pol. Acad. Sci. Tech. Sci. 2015, 63, 77–85. [Google Scholar] [CrossRef]
- Garbacz, A.; Piotrowski, T.; Courard, L.; Kwaśniewski, L. On the evaluation of interface quality in concrete repair system by means of impact-echo signal analysis. Constr. Build. Mater. 2017, 134, 311–323. [Google Scholar] [CrossRef]
- Antonaci, P.; Bruno, C.L.E.; Gliozzi, A.S.; Scalerandi, M. Monitoring evolution of compressive damage in concrete with linear and nonlinear ultrasonic methods. Cem. Concr. Res. 2010, 40, 1106–1113. [Google Scholar] [CrossRef]
- Rucka, M.; Wilde, K. Experimental study on ultrasonic monitoring of splitting failure in reinforced concrete. J. Nondestruct. Eval. 2013, 32, 372–383. [Google Scholar] [CrossRef]
- Moradi-Marani, F.; Rivard, P.; Lamarche, C.P.; Kodjo, S.A. Evaluating the damage in reinforced concrete slabs under bending test with the energy of ultrasonic waves. Constr. Build. Mater. 2014, 73, 663–673. [Google Scholar] [CrossRef]
- Rucka, M.; Wilde, K. Ultrasound monitoring for evaluation of damage in reinforced concrete. Bull. Pol. Acad. Sci. Tech. Sci. 2015, 63, 65–75. [Google Scholar] [CrossRef]
- Shui, G.; Wang, Y.; Huang, P.; Qu, J. Nonlinear ultrasonic evaluation of the fatigue damage of adhesive joints. NDT E Int. 2015, 70, 9–15. [Google Scholar] [CrossRef]
- Zima, B.; Rucka, M. Guided wave propagation for assessment of adhesive bonding between steel and concrete. Procedia Eng. 2017, 199, 2300–2305. [Google Scholar] [CrossRef]
- Song, H.; Popovics, J.S. Characterization of steel-concrete interface bonding conditions using attenuation characteristics of guided waves. Cem. Concr. Compos. 2017, 83, 111–124. [Google Scholar] [CrossRef]
- Rucka, M.; Wilde, K. Crack identification using wavelets on experimental static deflection profiles. Eng. Struct. 2006, 28, 279–288. [Google Scholar] [CrossRef]
- Sprague, M.A.; Geers, T.L. A spectral-element method for modelling cavitation in transient fluid-structure interaction. Int. J. Numer. Methods Eng. 2004, 60, 2467–2499. [Google Scholar] [CrossRef]
- Schwer, L.E. Validation metrics for response histories: Perspectives and case studies. Eng. Comput. 2007, 23, 295–309. [Google Scholar] [CrossRef]
- Sarin, H.; Kokkolaras, M.; Hulbert, G.; Papalambros, P.; Barbat, S.; Yang, R.-J. Comparing Time Histories for Validation of Simulation Models: Error Measures and Metrics. J. Dyn. Syst. Meas. Control 2010, 132, 61401. [Google Scholar] [CrossRef]
Figure 1.
Geometry of push-out specimen.

Figure 2.
Steel-concrete specimen with attached piezoelectric actuator (A) and sensors (S1, S2).
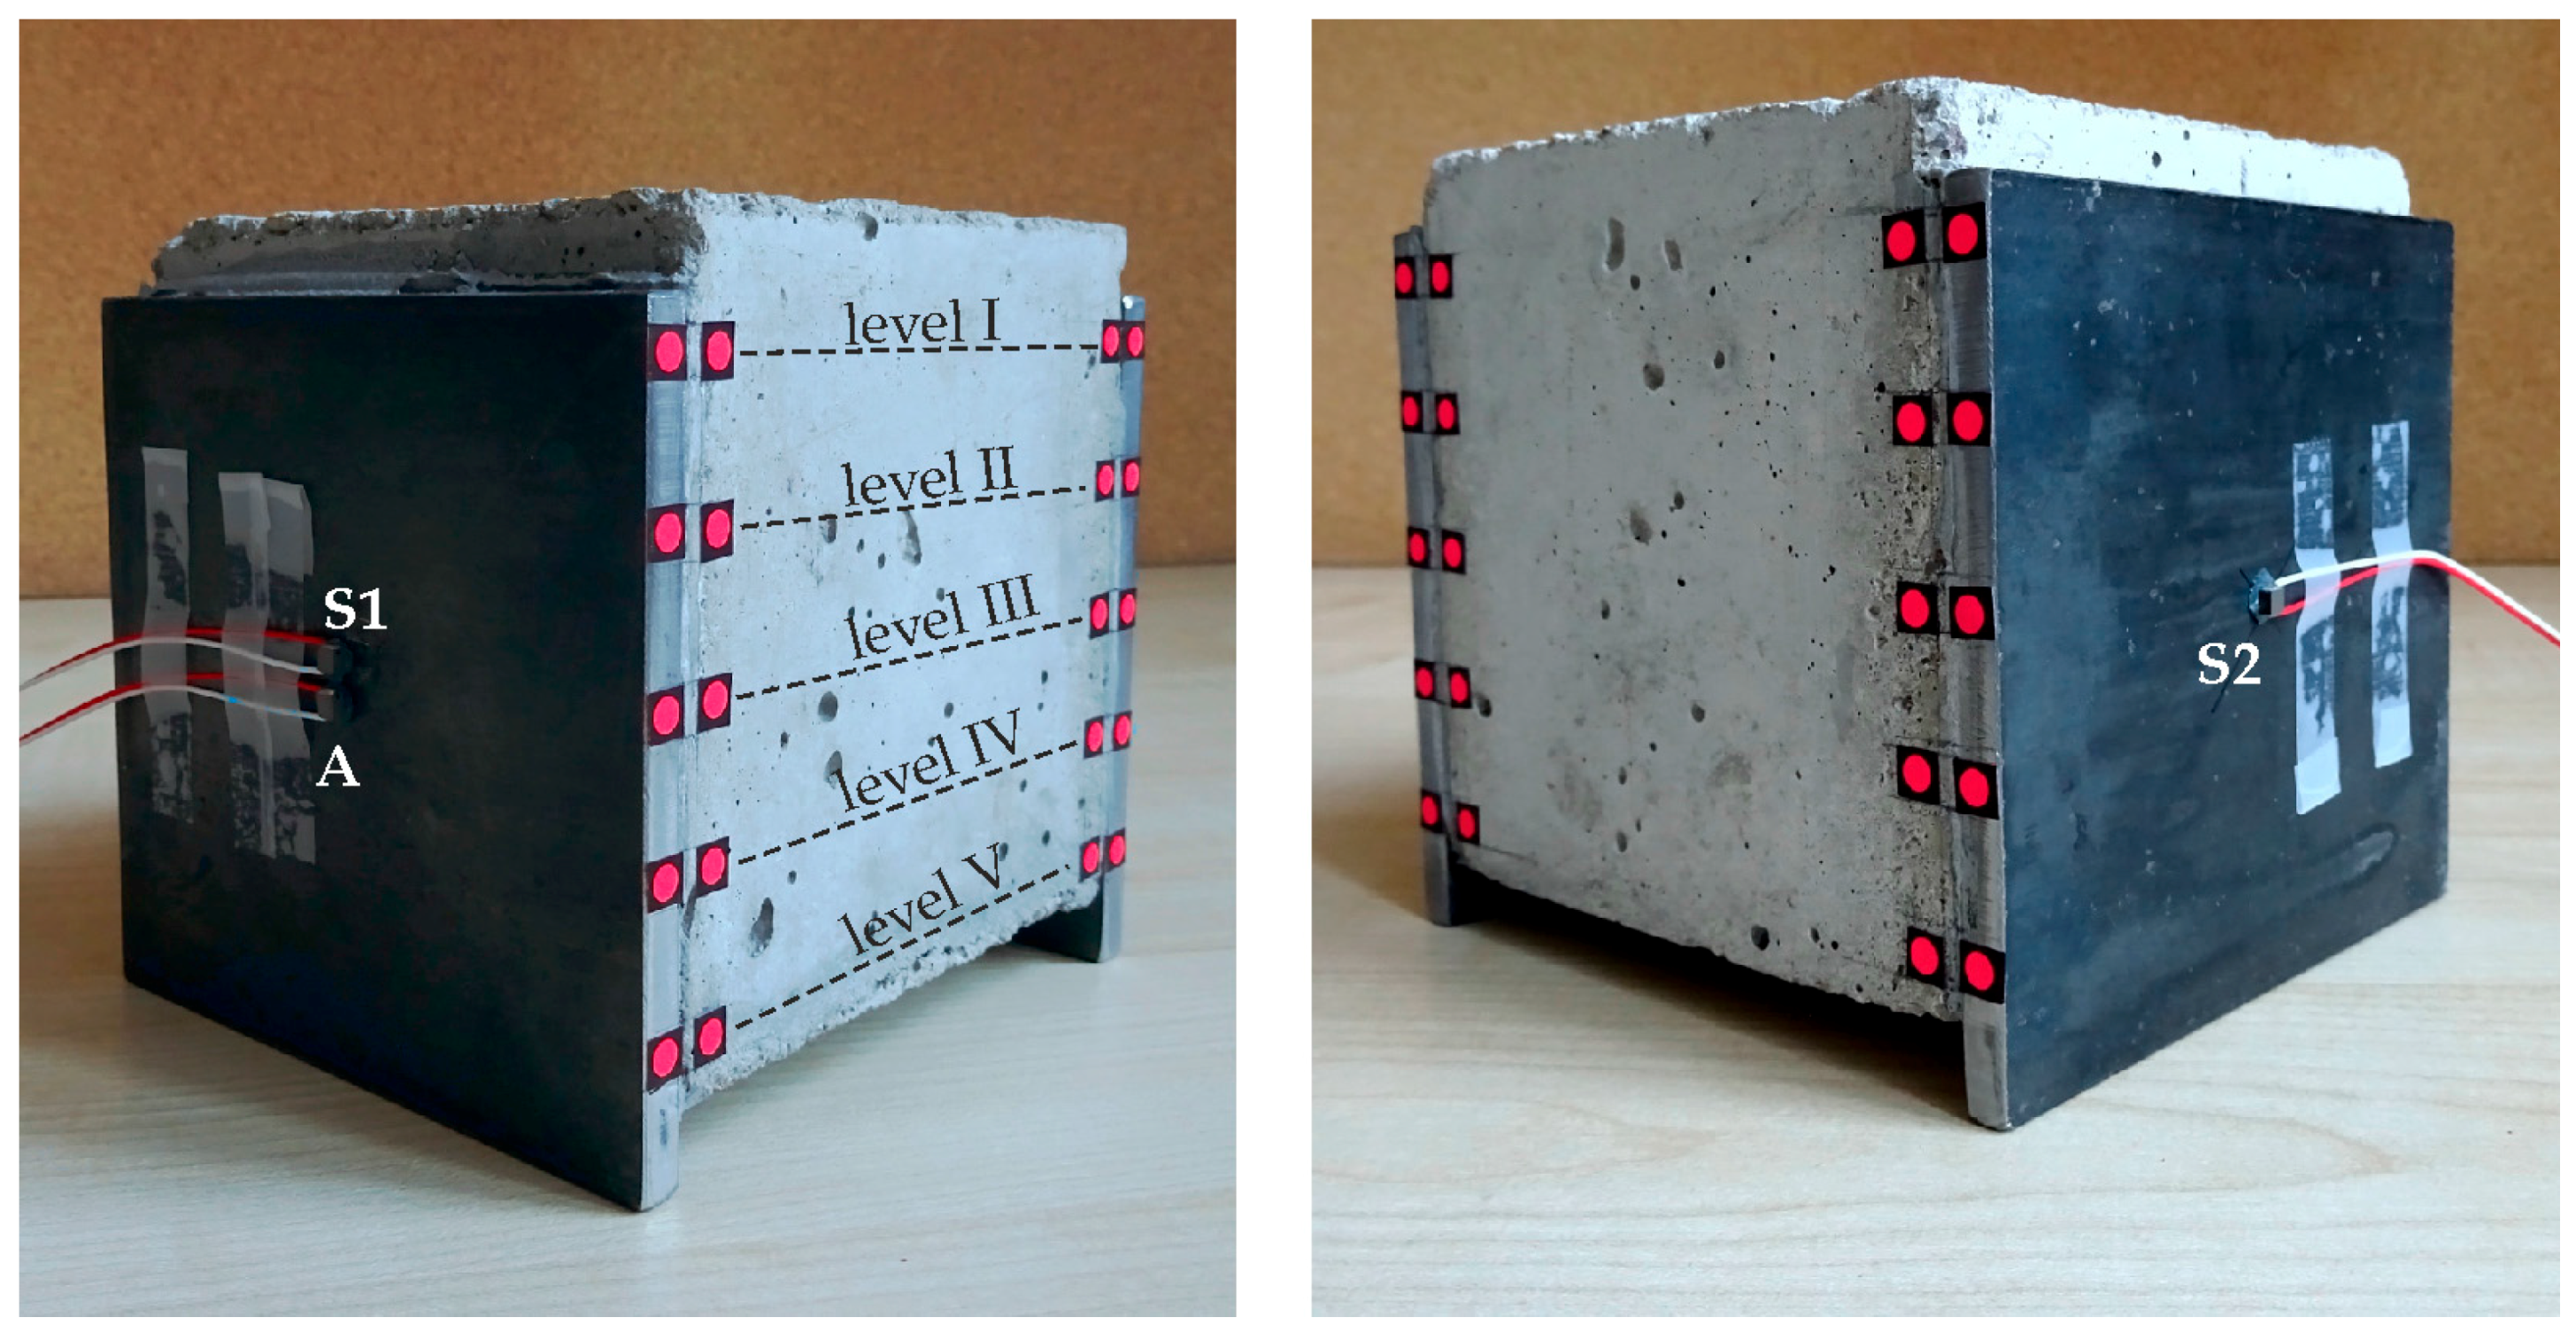
Figure 3.
Experimental setup for push-out and ultrasonic tests.
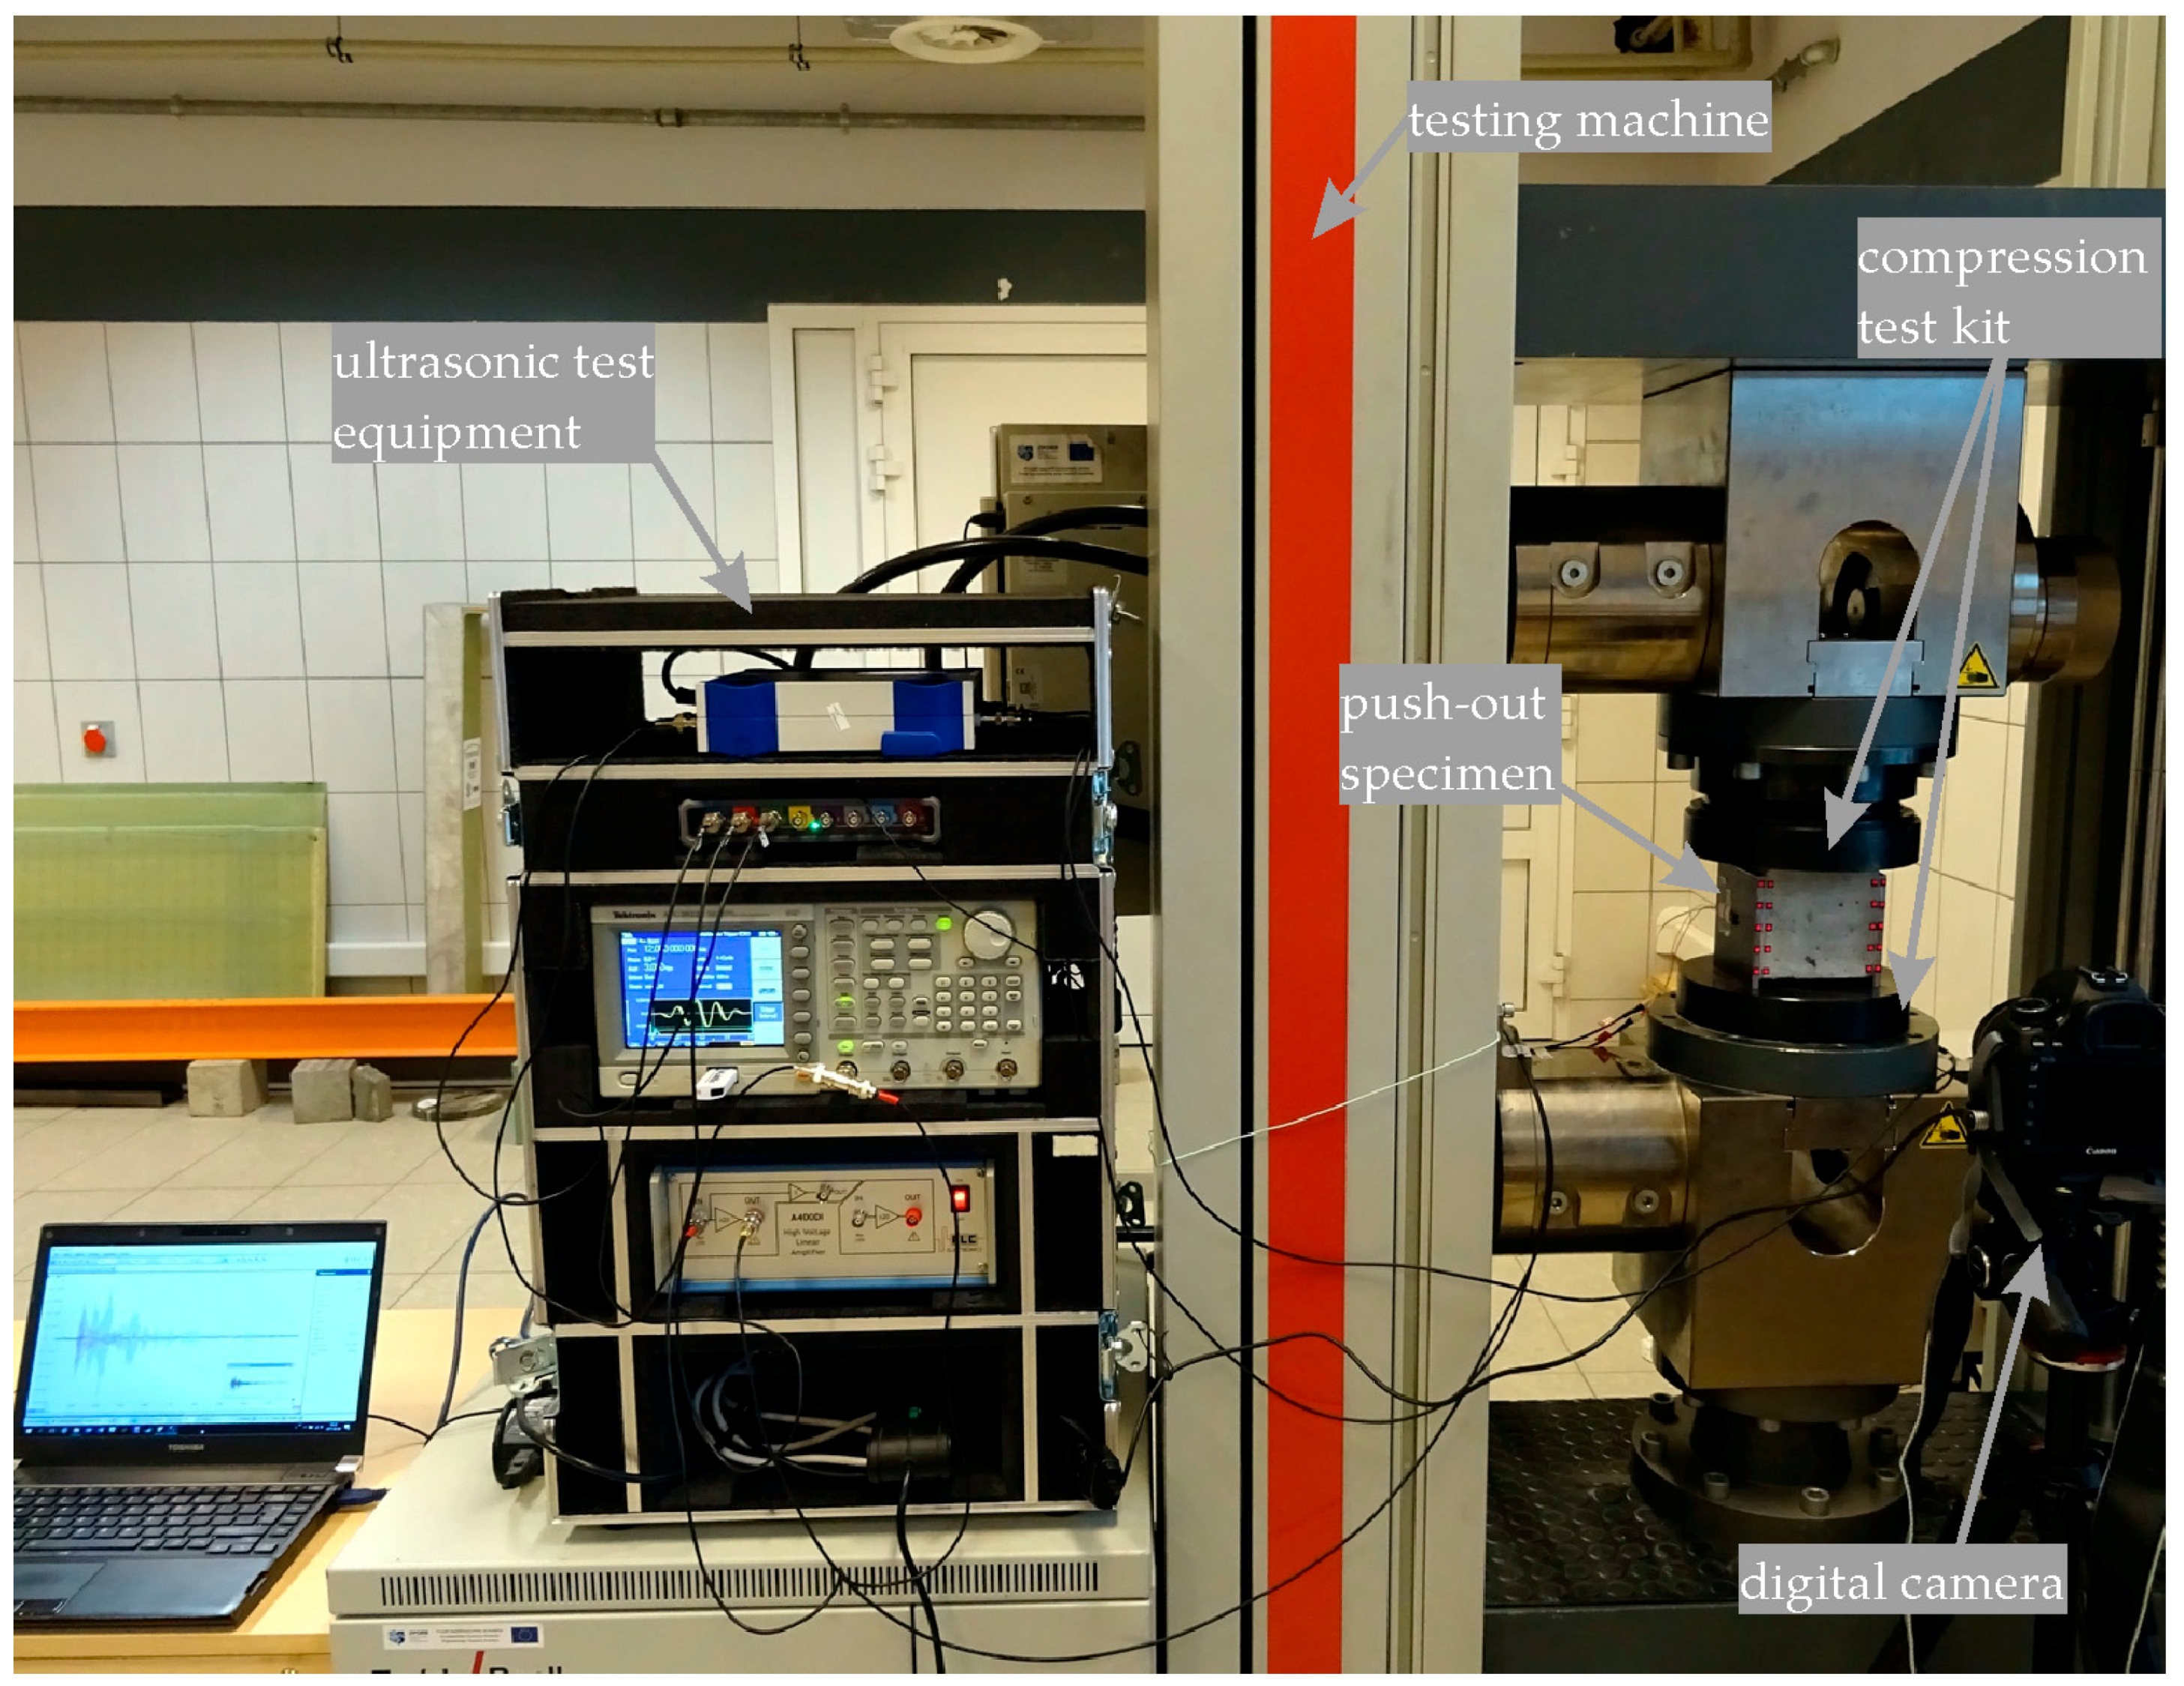
Figure 4.
Excitation signal.

Figure 5.
Digital photograph of the left adhesive joint: (a) RGB photograph; (b) magenta component; (c) binary image.
Figure 5.
Digital photograph of the left adhesive joint: (a) RGB photograph; (b) magenta component; (c) binary image.
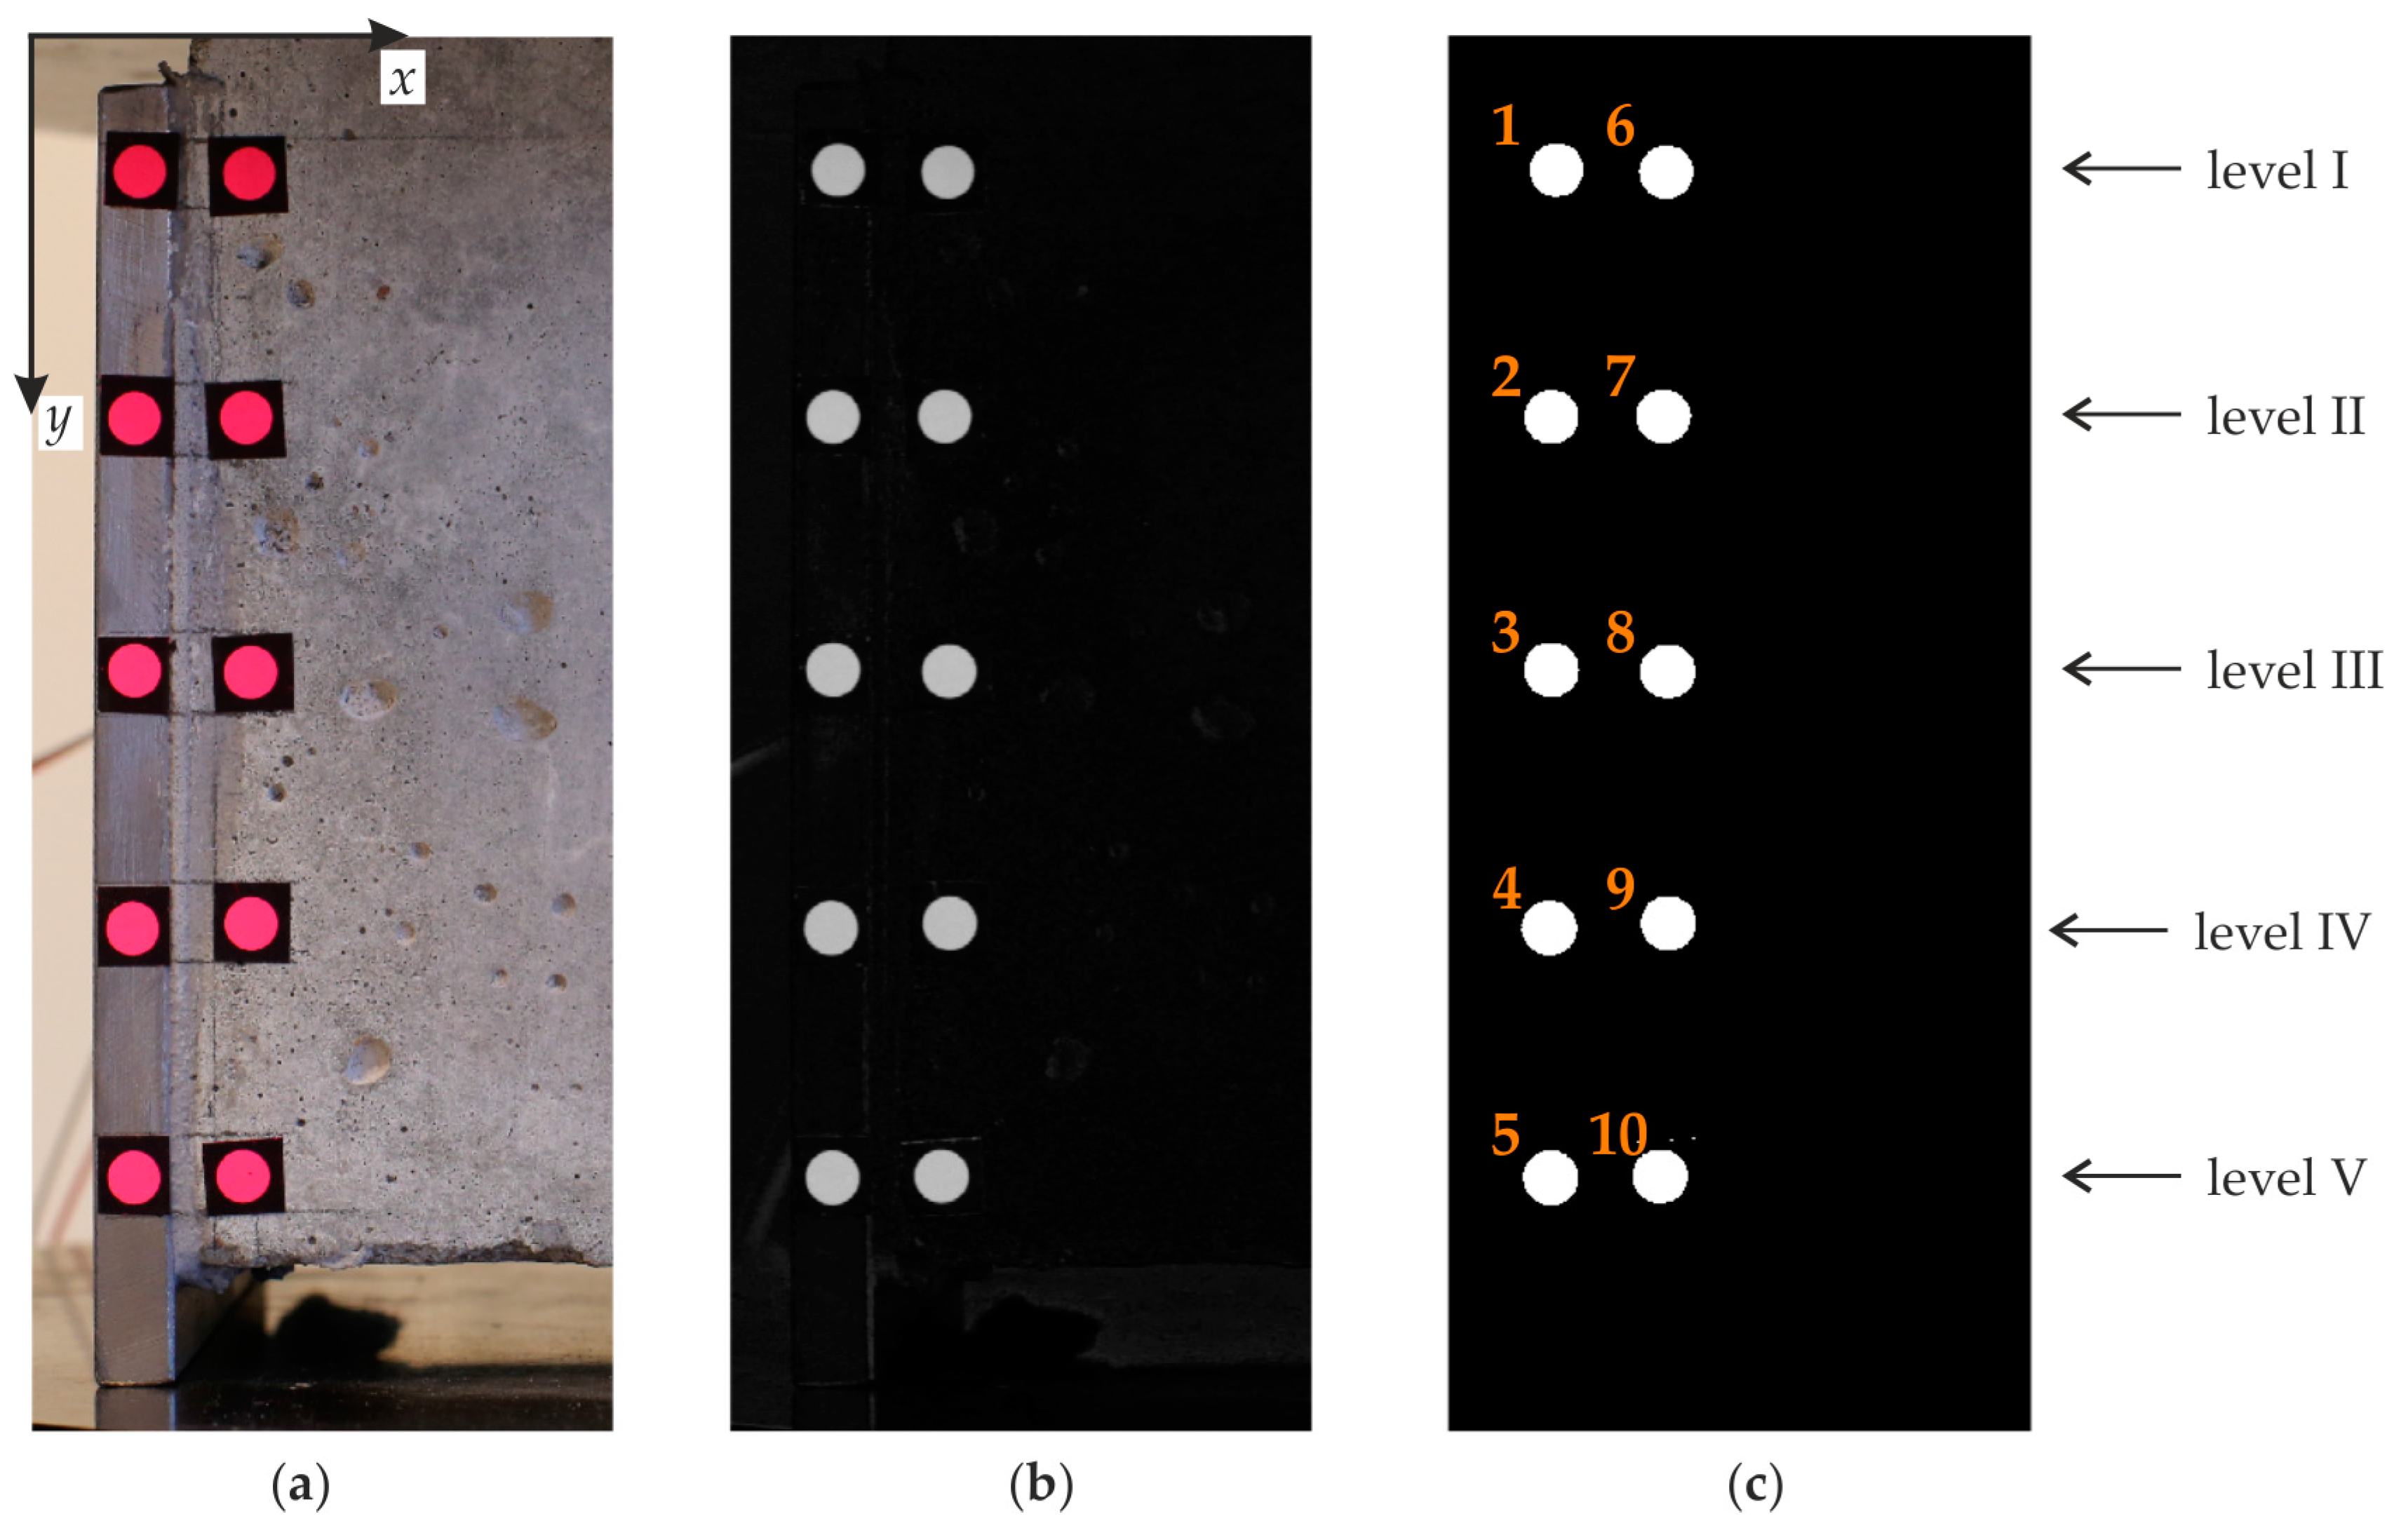
Figure 6.
Failure modes of tested steel-concrete specimens (last stage in the testing machine): mode I including specimens #1 to #3—adhesive failure and mode II including specimens #4 to #10—cohesive-type failure or mixed cohesive-adhesive failure.
Figure 6.
Failure modes of tested steel-concrete specimens (last stage in the testing machine): mode I including specimens #1 to #3—adhesive failure and mode II including specimens #4 to #10—cohesive-type failure or mixed cohesive-adhesive failure.

Figure 7.
Failure modes of tested steel-concrete specimens (photographs of the damaged steel-concrete interface after removing from the testing machine): mode I including specimens #1 to #3—adhesive failure and mode II including specimens #4 to #10—cohesive-type failure or mixed cohesive-adhesive failure.

Figure 8.
Experimental force-displacement (F-u) curves of tested push-out specimens (#1–#9).

Figure 9.
Interface slip between steel and concrete for tested push-out specimens (#1–#9).
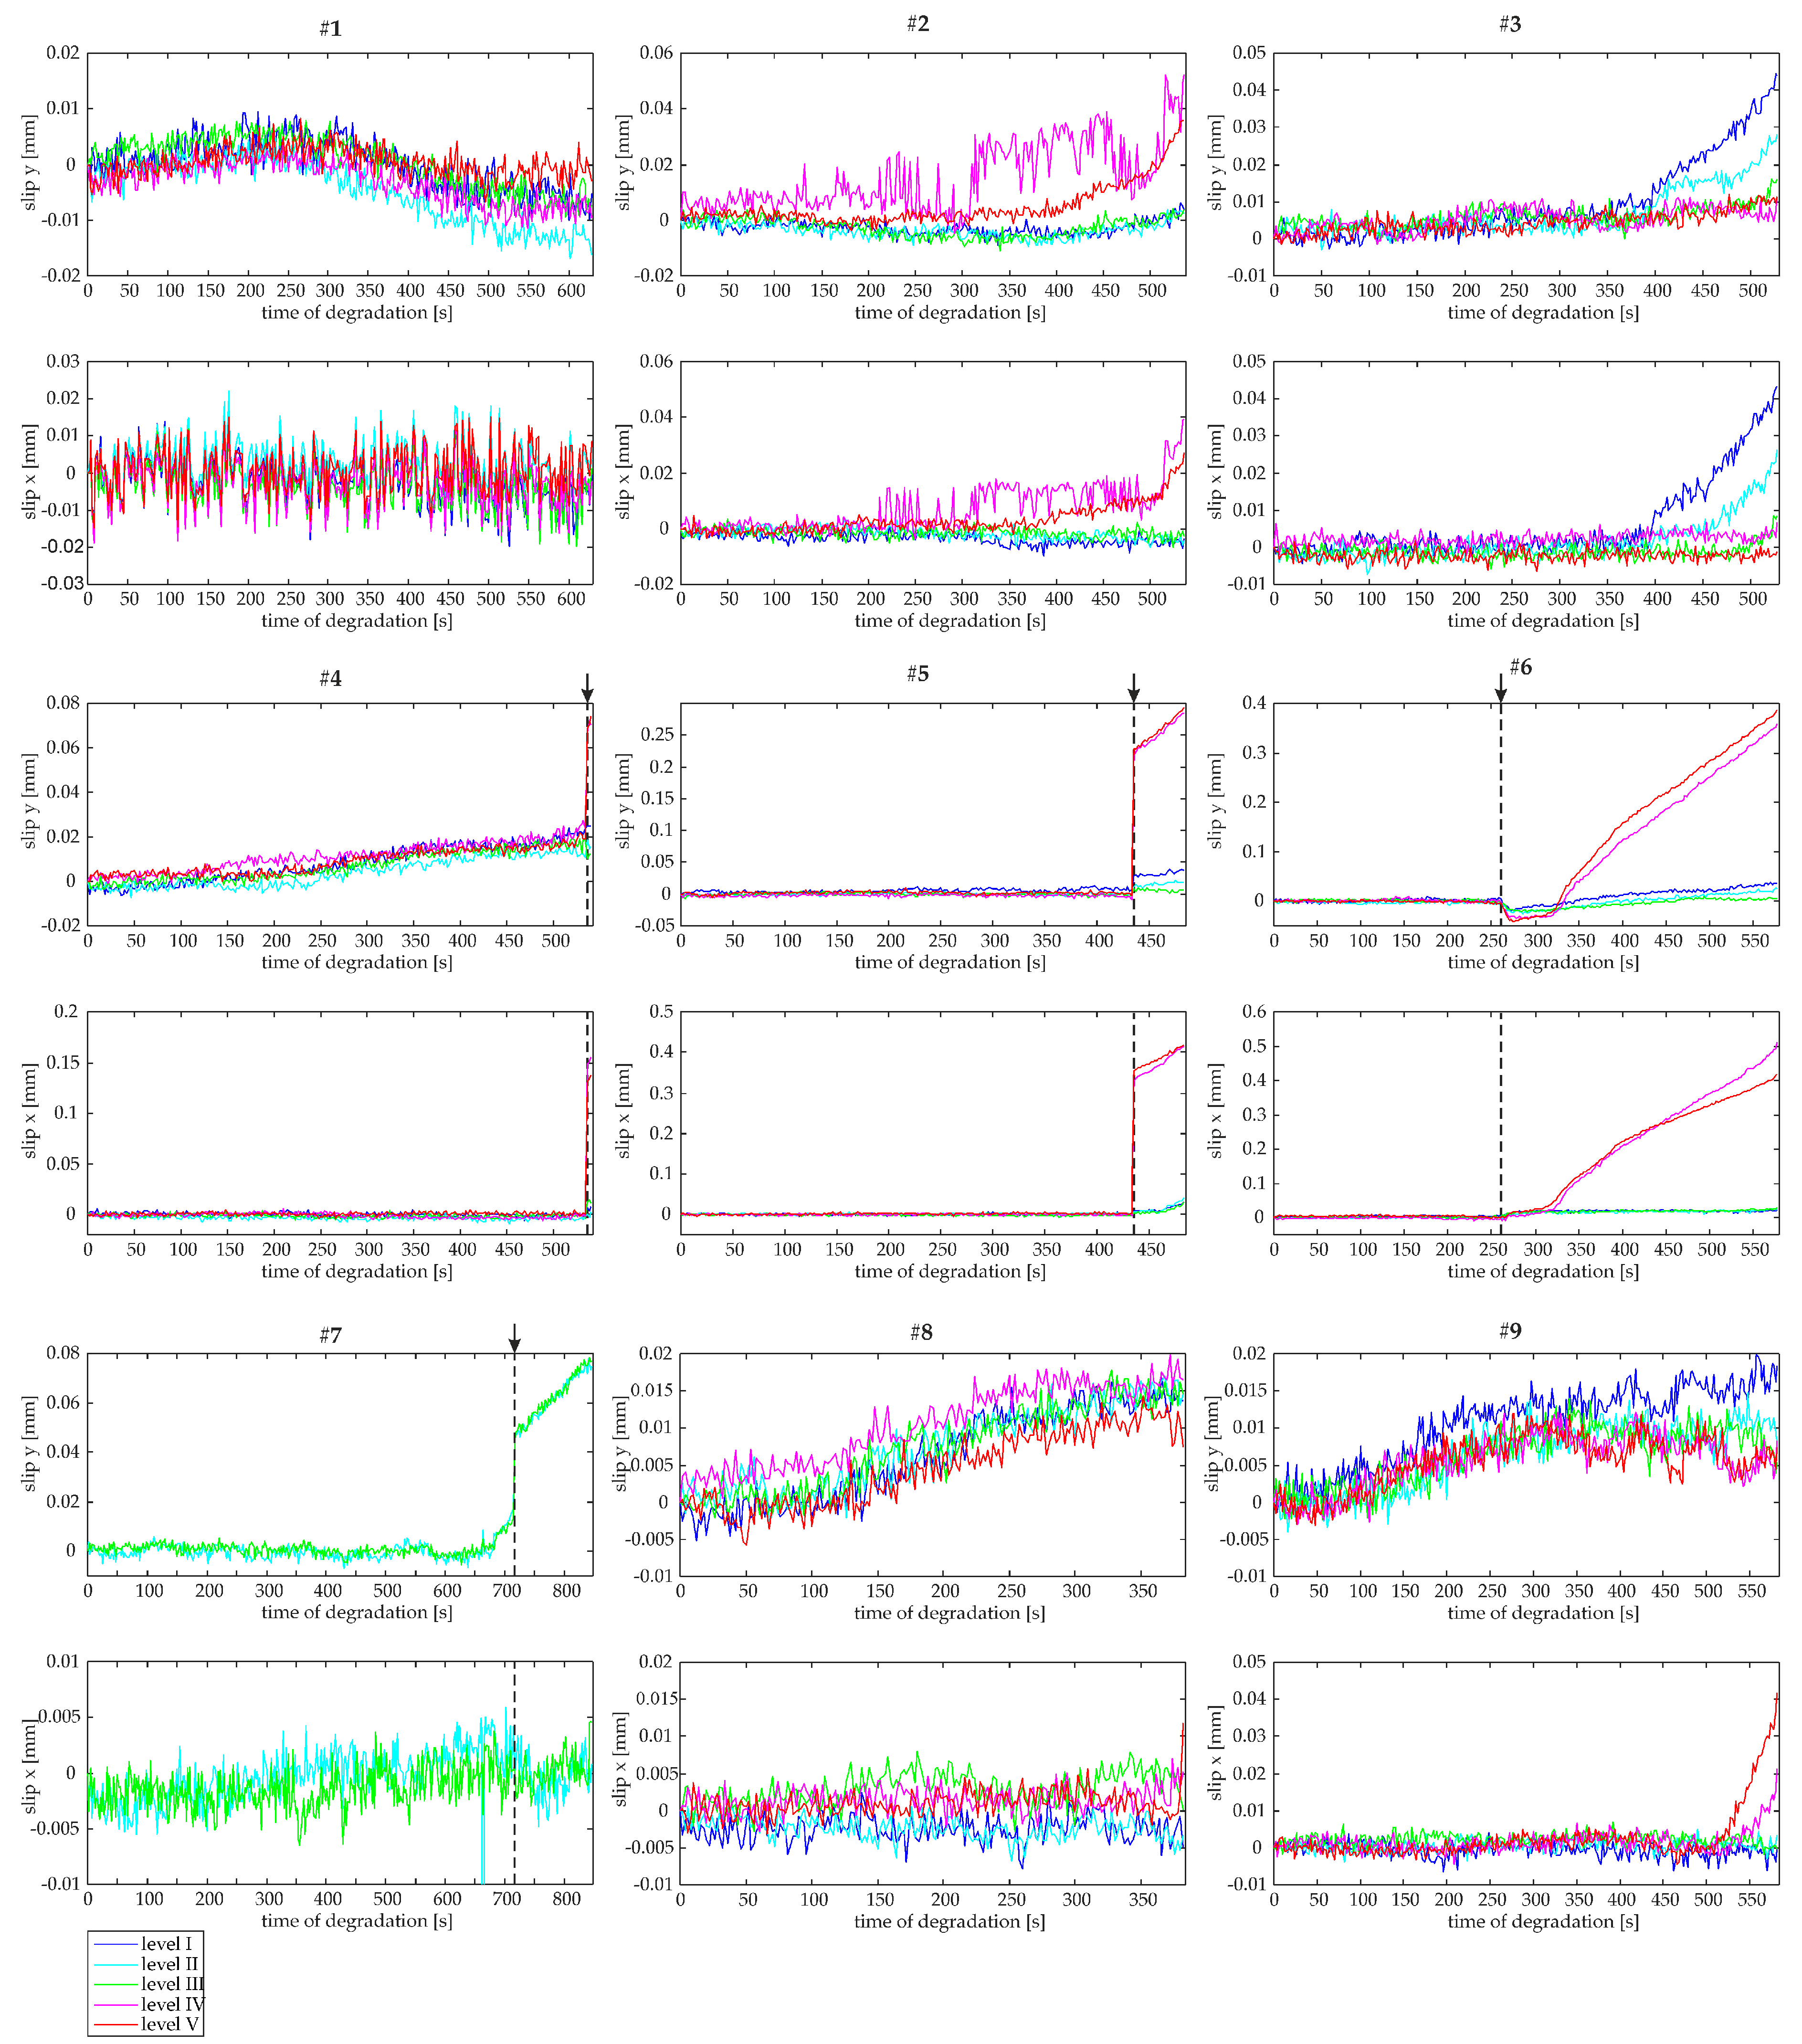
Figure 10.
Wave propagation signals registered during monitoring of steel-concrete push-out specimens (#1–#9); the first signal (reference) is given in black, the last registered signal in given in red, all other signals are given in grey.
Figure 10.
Wave propagation signals registered during monitoring of steel-concrete push-out specimens (#1–#9); the first signal (reference) is given in black, the last registered signal in given in red, all other signals are given in grey.

Figure 11.
S&G metric errors (magnitude error M, phase error P, comprehensive error C) during subsequent phases of degradation of push-out specimens (#1–#9).
Figure 11.
S&G metric errors (magnitude error M, phase error P, comprehensive error C) during subsequent phases of degradation of push-out specimens (#1–#9).
© 2018 by the author. Licensee MDPI, Basel, Switzerland. This article is an open access article distributed under the terms and conditions of the Creative Commons Attribution (CC BY) license (http://creativecommons.org/licenses/by/4.0/).
Share and Cite
MDPI and ACS Style
Rucka, M. Failure Monitoring and Condition Assessment of Steel-Concrete Adhesive Connection Using Ultrasonic Waves. Appl. Sci. 2018, 8, 320. https://doi.org/10.3390/app8030320
AMA Style
Rucka M. Failure Monitoring and Condition Assessment of Steel-Concrete Adhesive Connection Using Ultrasonic Waves. Applied Sciences. 2018; 8(3):320. https://doi.org/10.3390/app8030320
Chicago/Turabian StyleRucka, Magdalena. 2018. "Failure Monitoring and Condition Assessment of Steel-Concrete Adhesive Connection Using Ultrasonic Waves" Applied Sciences 8, no. 3: 320. https://doi.org/10.3390/app8030320
Note that from the first issue of 2016, this journal uses article numbers instead of page numbers. See further details here.