Article

Influence of Size Reduction of Fly Ash Particles by Grinding on the Chemical Properties of Geopolymers

by
Carlos Antonio Rosas-Casarez
1,
Susana Paola Arredondo-Rea
1,*,
Adriana Cruz-Enríquez
1,
Ramón Corral-Higuera
1,
Manuel De Jesús Pellegrini-Cervantes
1,
José Manuel Gómez-Soberón
2 and
Teresita De Jesús Medina-Serna
1
1
Facultad de Ingeniería Mochis, Universidad Autónoma de Sinaloa, Prol. Ángel Flores y Fuente de Poseidón, S.N., Los Mochis, Sinaloa CP 81223, Mexico
2
Escuela Politécnica Superior de Edificación de Barcelona, Universidad Politécnica de Cataluña, Av. Doctor Marañón 44-50, 08028 Barcelona, Spain
*
Author to whom correspondence should be addressed.
Appl. Sci. 2018, 8(3), 365; https://doi.org/10.3390/app8030365
Submission received: 8 January 2018 / Revised: 20 February 2018 / Accepted: 27 February 2018 / Published: 4 March 2018
(This article belongs to the Section Chemical and Molecular Sciences)

Abstract

:
Chemical properties of geopolymers were evaluated from the reduction of fly ash particle size by grinding. X-ray diffraction determined that at early curing ages new crystalline phases appear in the matrix of the geopolymer and they remain for 28 days, with increases in intensities up to 60%. In Fourier transform infrared spectroscopy, displacements were identified in the main band of the geopolymers at higher wavenumbers, attributed to the greater rigidity in the structures of the aluminosilicate gel due to the increase of the reaction products in the geopolymers obtained through fly ashsubjected to previous grinding, which is observable in the geopolymers matrix. Results indicate that the reduction of fly ash particle size by grinding has an influence on the chemical properties of geopolymers.

1. Introduction

Current research by the scientific-technical community looks for alternative solutions to problems related to energy consumption and CO2 emissions.
Global infrastructure demands require massive concrete and cement production, causing a significant negative environmental impact since its production is responsible for 5–7% of global anthropogenic CO2 emissions [1,2,3]. In addition, Portland cement production releases about 0.8 tons of carbon dioxide for every ton of clinker produced [4]. This represents a considerable fraction of total CO2 emissions. For this reason, it is important to propose alternative solutions with second-generation materials, remains of other productive cycles (waste), which reduce the environmental impact and avoid the use of new reserves. Therefore, the perspective for the future is to allow the adaptation of new materials pertaining to concrete and Portland cement, but from a new perspective of durability, as well as economic and social sustainability.
Fly ash (FA), metakaolin, and silica fume have been used as additions in the cement industries and as pozzolanic materials that improve the physical, chemical, and mechanical properties of concrete [5,6,7,8]. In the last years, FA with high silica and aluminum content (Class F, ASTM C618 [9]) has made important advances in the search for new applications [10,11,12]. Currently, the annual production of fly ash worldwide is estimated to be around 700 million tons [13,14]. These achievements are aimed at the development of binding materials due to their wide range of possible potential applications [15,16,17]. Alkaline cements, also called geopolymers, are obtained through a chemical process between fly ash and an alkaline solution at temperatures below 100 °C. This reaction results in the dissolution of reactive phases of aluminosilicates. With the progress of the reaction, water is gradually removed, and the tetrahedral groups of SiO4 and AlO4 form the polymeric precursors [18,19,20].
According to various studies, the physicochemical properties of geopolymers depend mainly on the Si/Al, Na/Al ratios and water content [21,22]. Often, these ratios are investigated indirectly, for example, by varying the activation ratio and curing conditions [23,24,25]. The chemical composition in mass is largely related to the kinetics of the geopolymer matrix; therefore, FA reactivity and the geopolymers chemical behavior depend specifically on the particle sizes and surface area [26,27]. The activation of these materials is also promoted by mechanical means, such as grinding, where results that favor geopolymerization are obtained at low curing temperatures. Through FT-IR it is demonstrated that FA with finer particles produce high reactivity indexes in the geopolymers and, therefore, an increase in the reaction product of the alkaline aluminosilicate amorphous gel. This produces an increase in compressive strength [28,29].
On the other hand, the use of X-ray diffraction (XRD) allows us to observe the formation of new phases which are characteristics of the FA geopolymerization process, such as semicrystalline and polycrystalline phases of inorganic polymers (especially zeolites) [30,31].
In this work, the influence of three different particle sizes of Mexican FA were comparatively studied in the physicochemical behavior of the geopolymers, using XRD, FT-IR, and SEM.

2. Materials and Methods

2.1. Materials

FA from José López Portillo coal-fired power plant, located in Coahuila, México, was used; its chemical composition determined by X-ray fluorescence is shown in Table 1, classifying it as a Class F fly ash (FA-1) (ASTM C618 [9]).
The FA was subjected to mechanical grinding using a ball mill for periods of one hour until the highest percentage of material was passed through #200 and #325 sieves, and average particle sizes of ≤74 µm (FA-2) and ≤45 µm (FA-3) were obtained, respectively.

2.2. Experimental Design and Sample Preparation

Three sets of geopolymers G1 (G1-7, G2-14, and G3-28), G2 (G2-7, G2-14, and G2-28), and G3 (G3-7, G3-14, and G3-28) were obtained from FA-1, FA-2, and FA-3 respectively. In addition, 8M NaOH and solution/ash ratio = 0.40 were used as the alkaline activator. The mixture was made following the methodology established in previous work [32]. They were placed in prismatic molds and then cured at 80 °C under conditions of relative humidity greater than 90% for 7, 14, and 28 days.

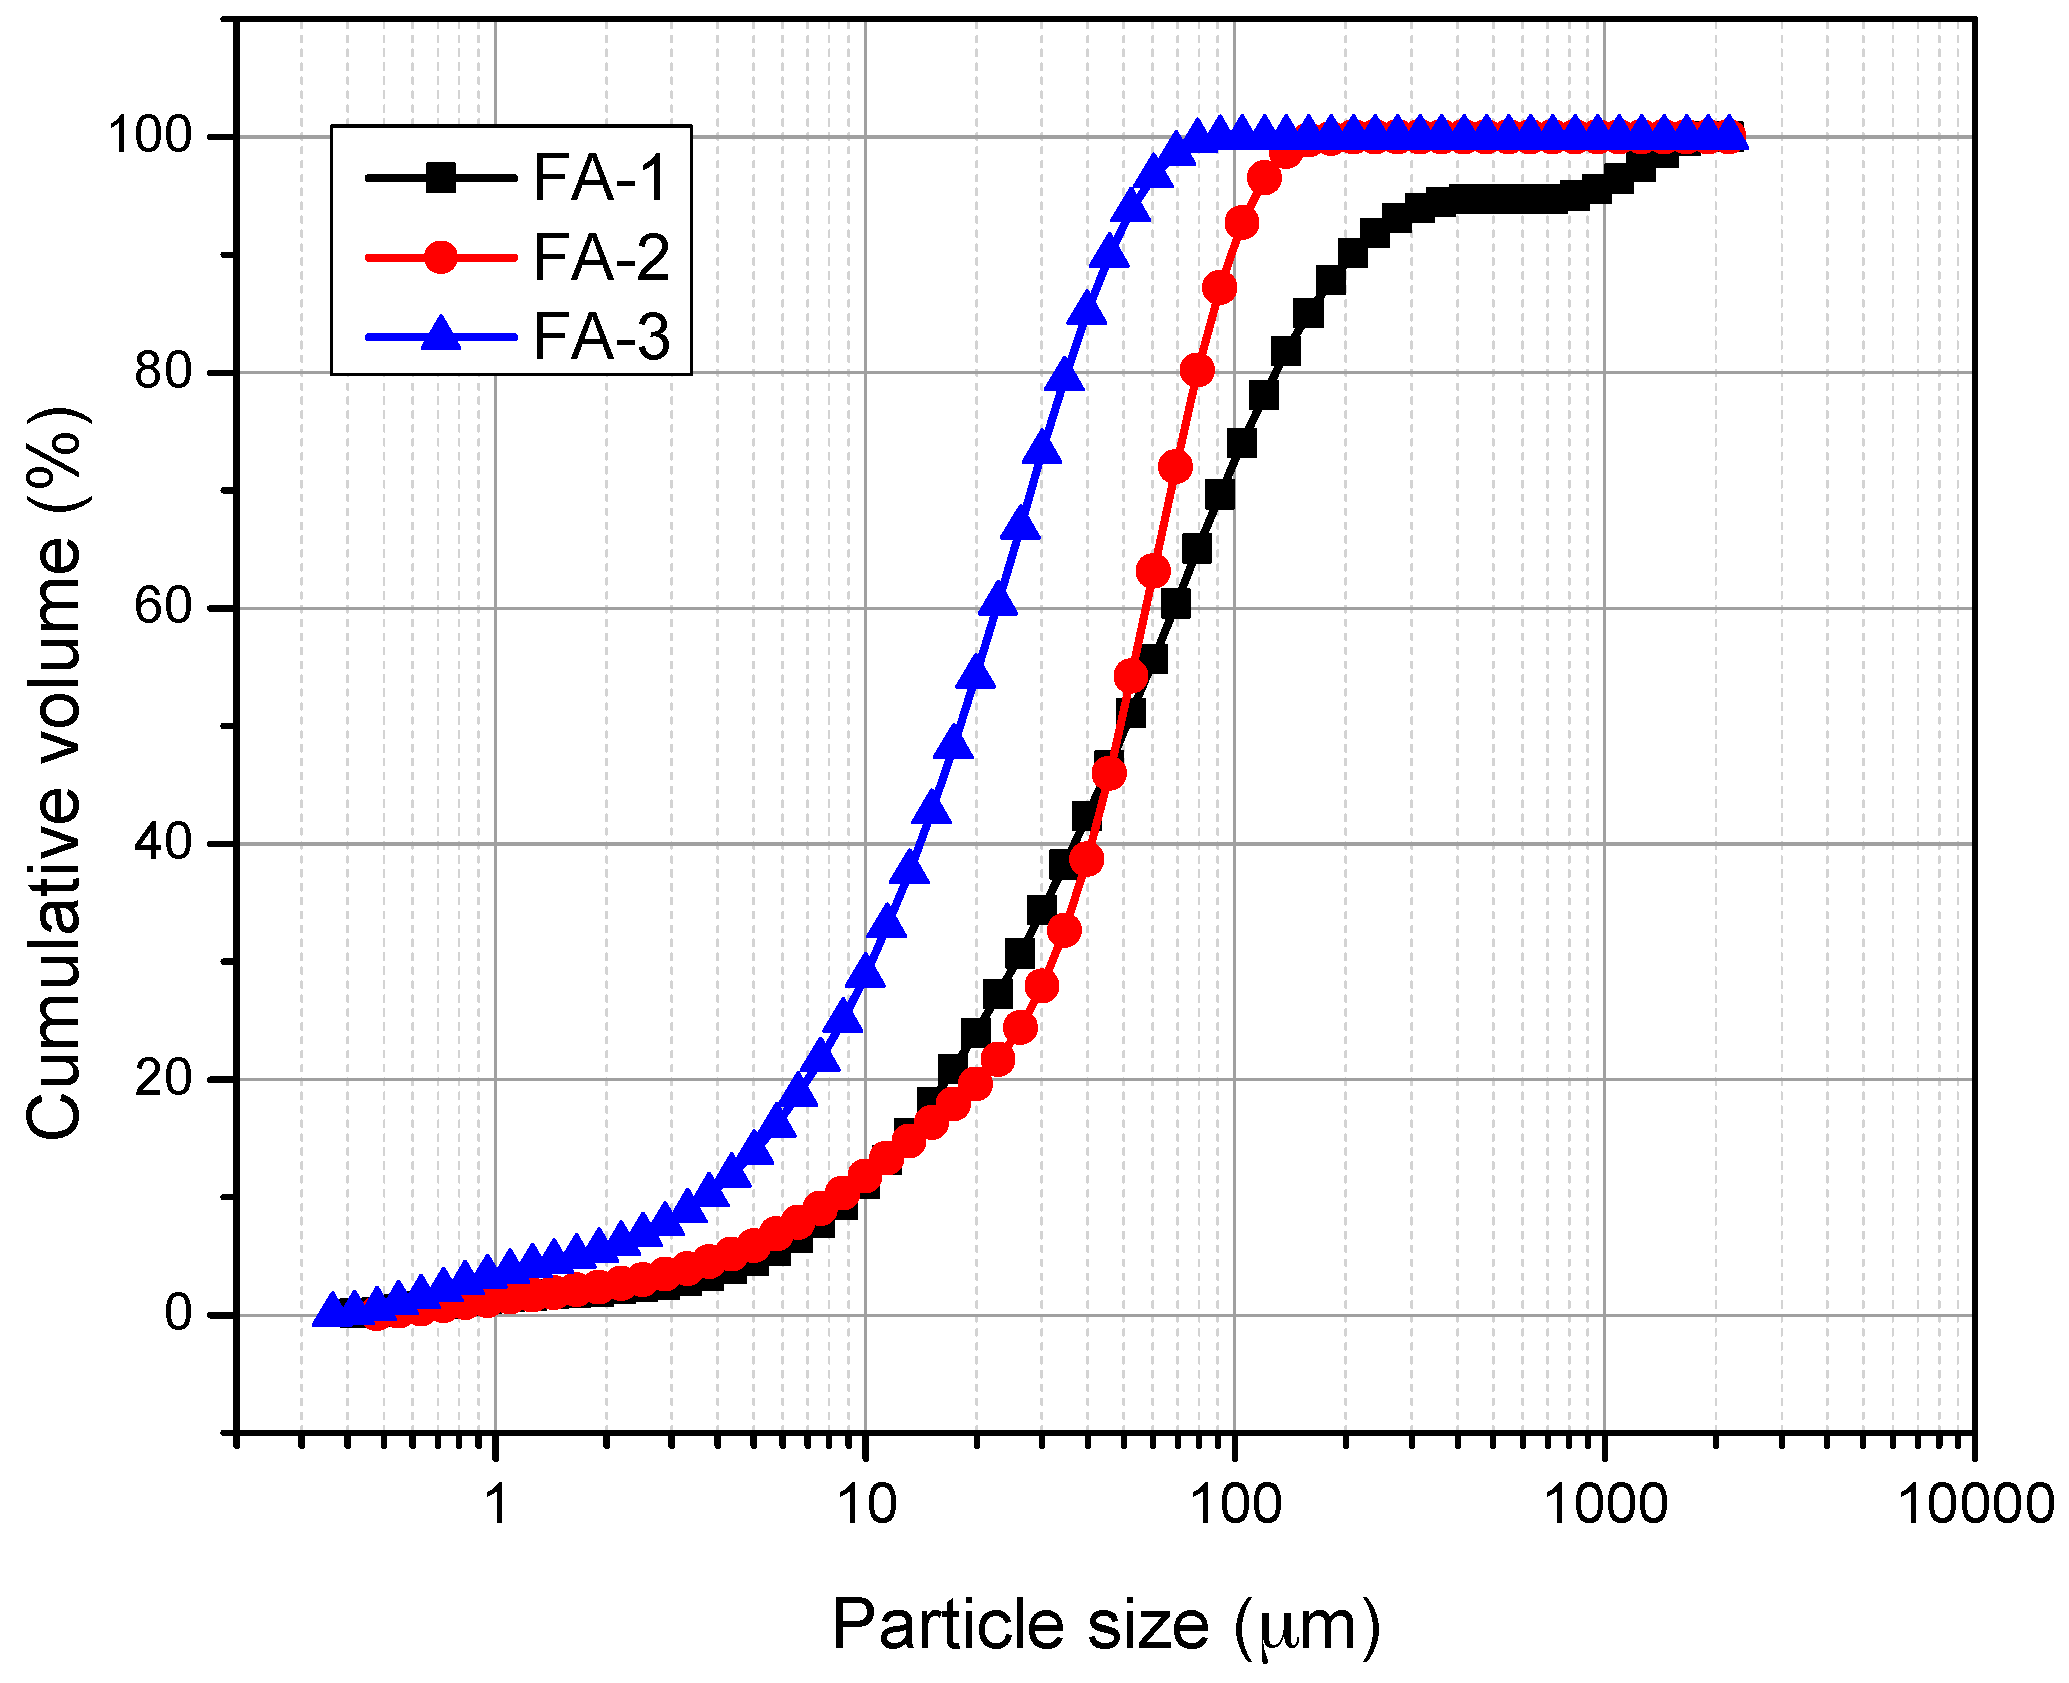
2.3. Characterization of FA

The distribution of FA particles is shown in Figure 1; it can be observed that 92% of the particles in sample FA-3 are smaller than 45 µm, while FA-1 and FA-2 have a higher percentage of particles with a size greater than 45 µm with 55% and 60%, respectively. It can also be observed that FA-1 contains particle sizes greater than 100 µm (30%). The specific surface area obtained by Brunauer-Emmett-Teller method (BET) of FA-1, FA-2, and FA-3 is shown in Table 2.
The identification of phases obtained by XRD show that the main compounds in FA-1, FA-2, and FA-3 are the mullite (Al6Si2O13) and quartz (SiO2), respectively (Figure 2a). Shown in the diffractograms are their primary peaks at 16.3 and 26.7° 2θ, in addition to an amorphous phase between 17° and 30° of 2θ, which is characteristic of this type of material [33]. The XRD patterns indicated no apparent change in the mineralogy and peak intensities in the milled samples [28].
In Figure 2b the FT-IR spectra of FA-1, FA-2, and FA-3 are shown, in which no band shifts or significant changes of FA-1 are observed respect to FA-2 and FA-3, presenting bands at 560, 792 and 1092 cm−1 attributed to symmetric stretching (Al-O-Si), symmetric stretching vibrations (Si-O-Si), and asymmetric stretching vibrations (Si-O-Si and Al-O-Si), respectively. Moreover, the bands in the regions of 1630 and 3437 cm−1 are attributable to stretching and deformation vibrations of O-H and H-O-H groups [33,34]. For this, only FA-1 was chosen as a reference for comparison with the FT-IR spectra of the different geopolymers (Figure 4 The transmittance spectra of FA-1 and the different geopolymers over the range of 1350–850 cm−1 were subjected to a deconvolution analysis using the Gaussian peak shape method).

3. Results and Discussion

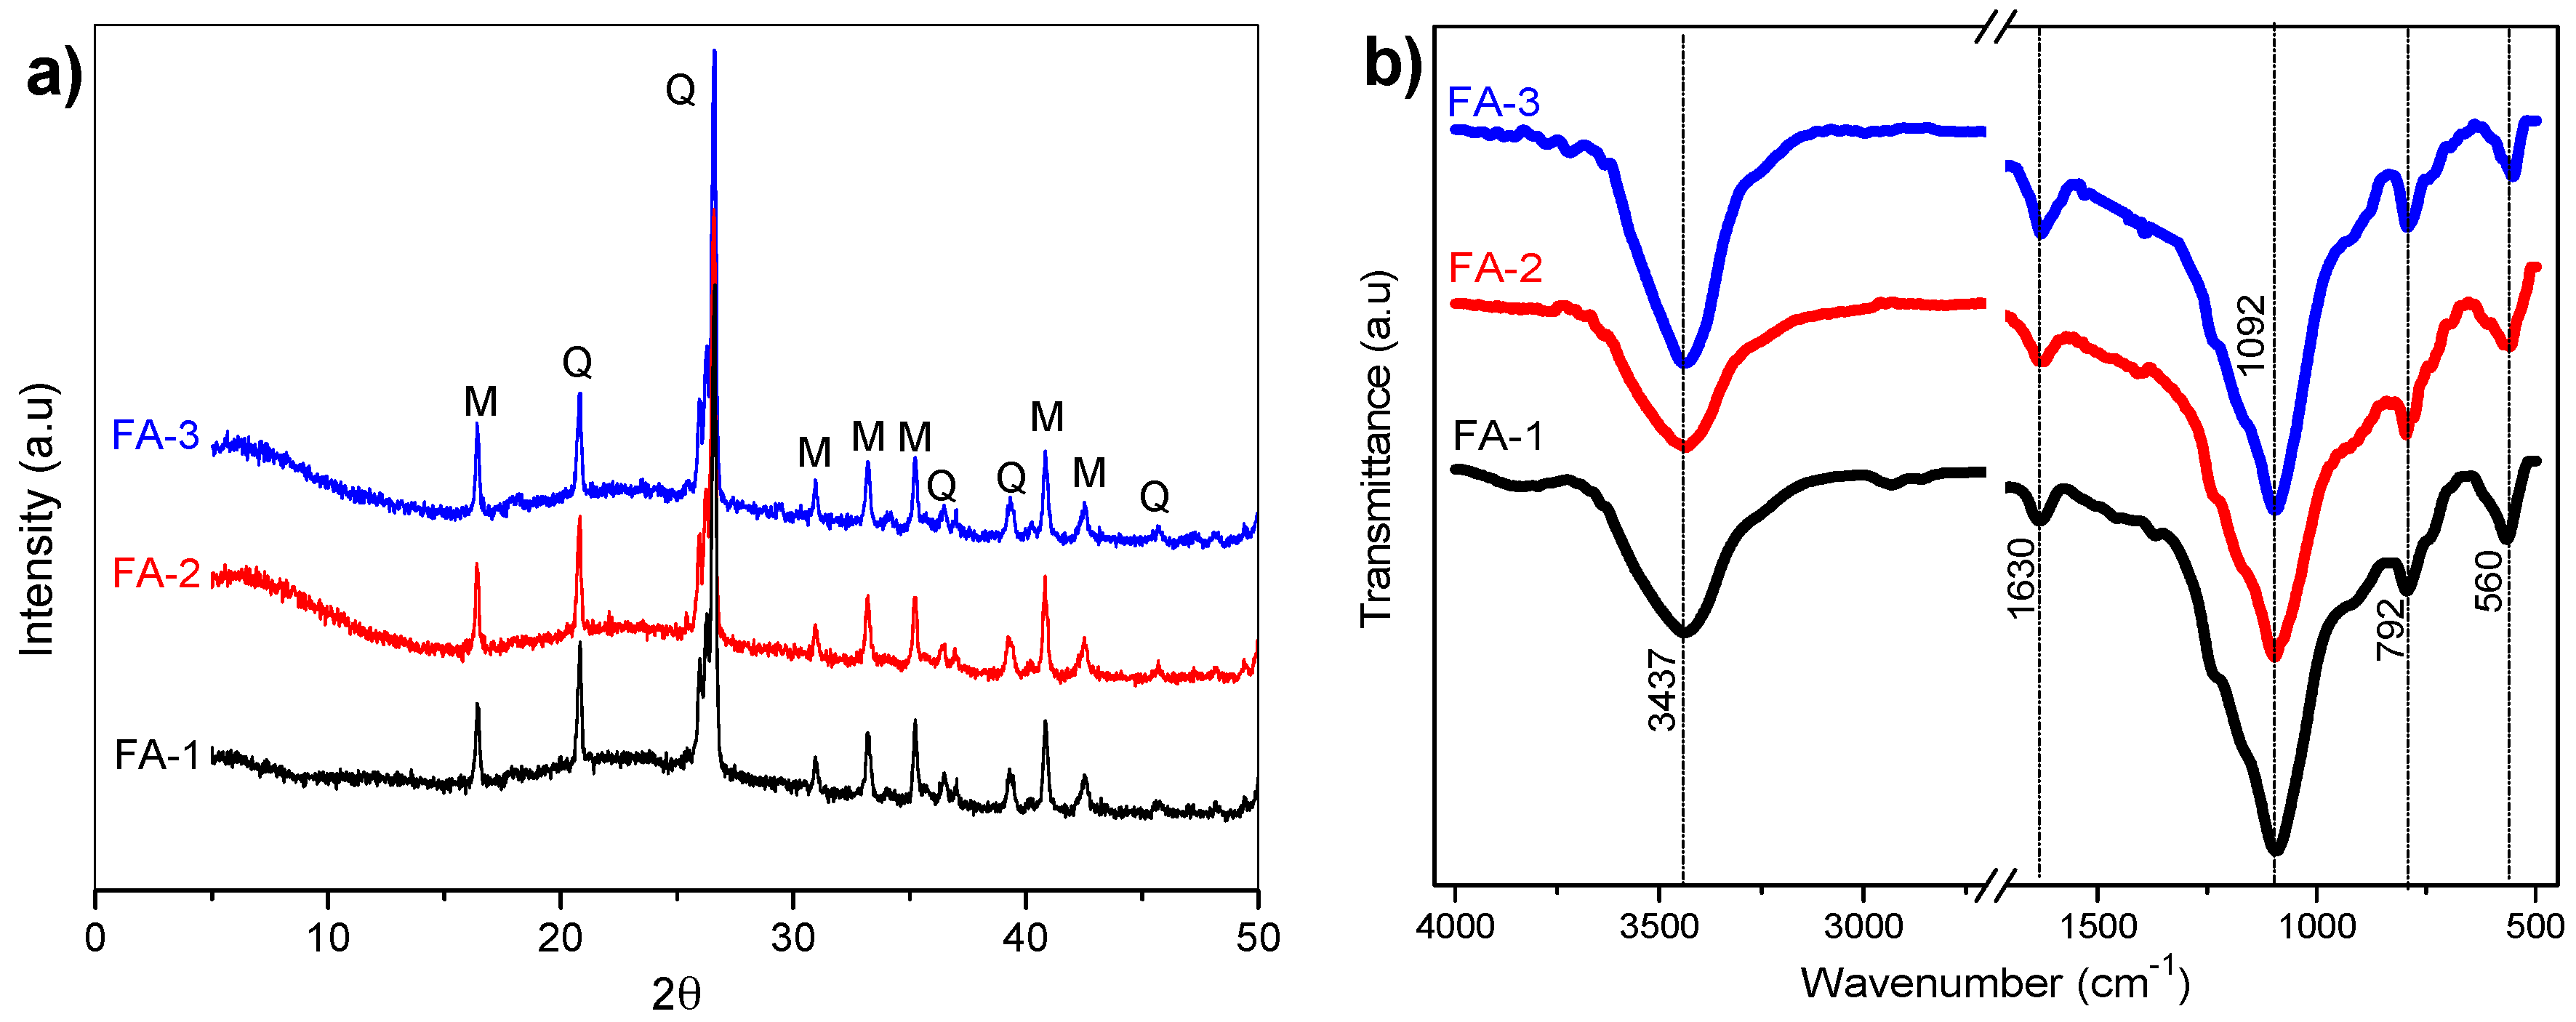
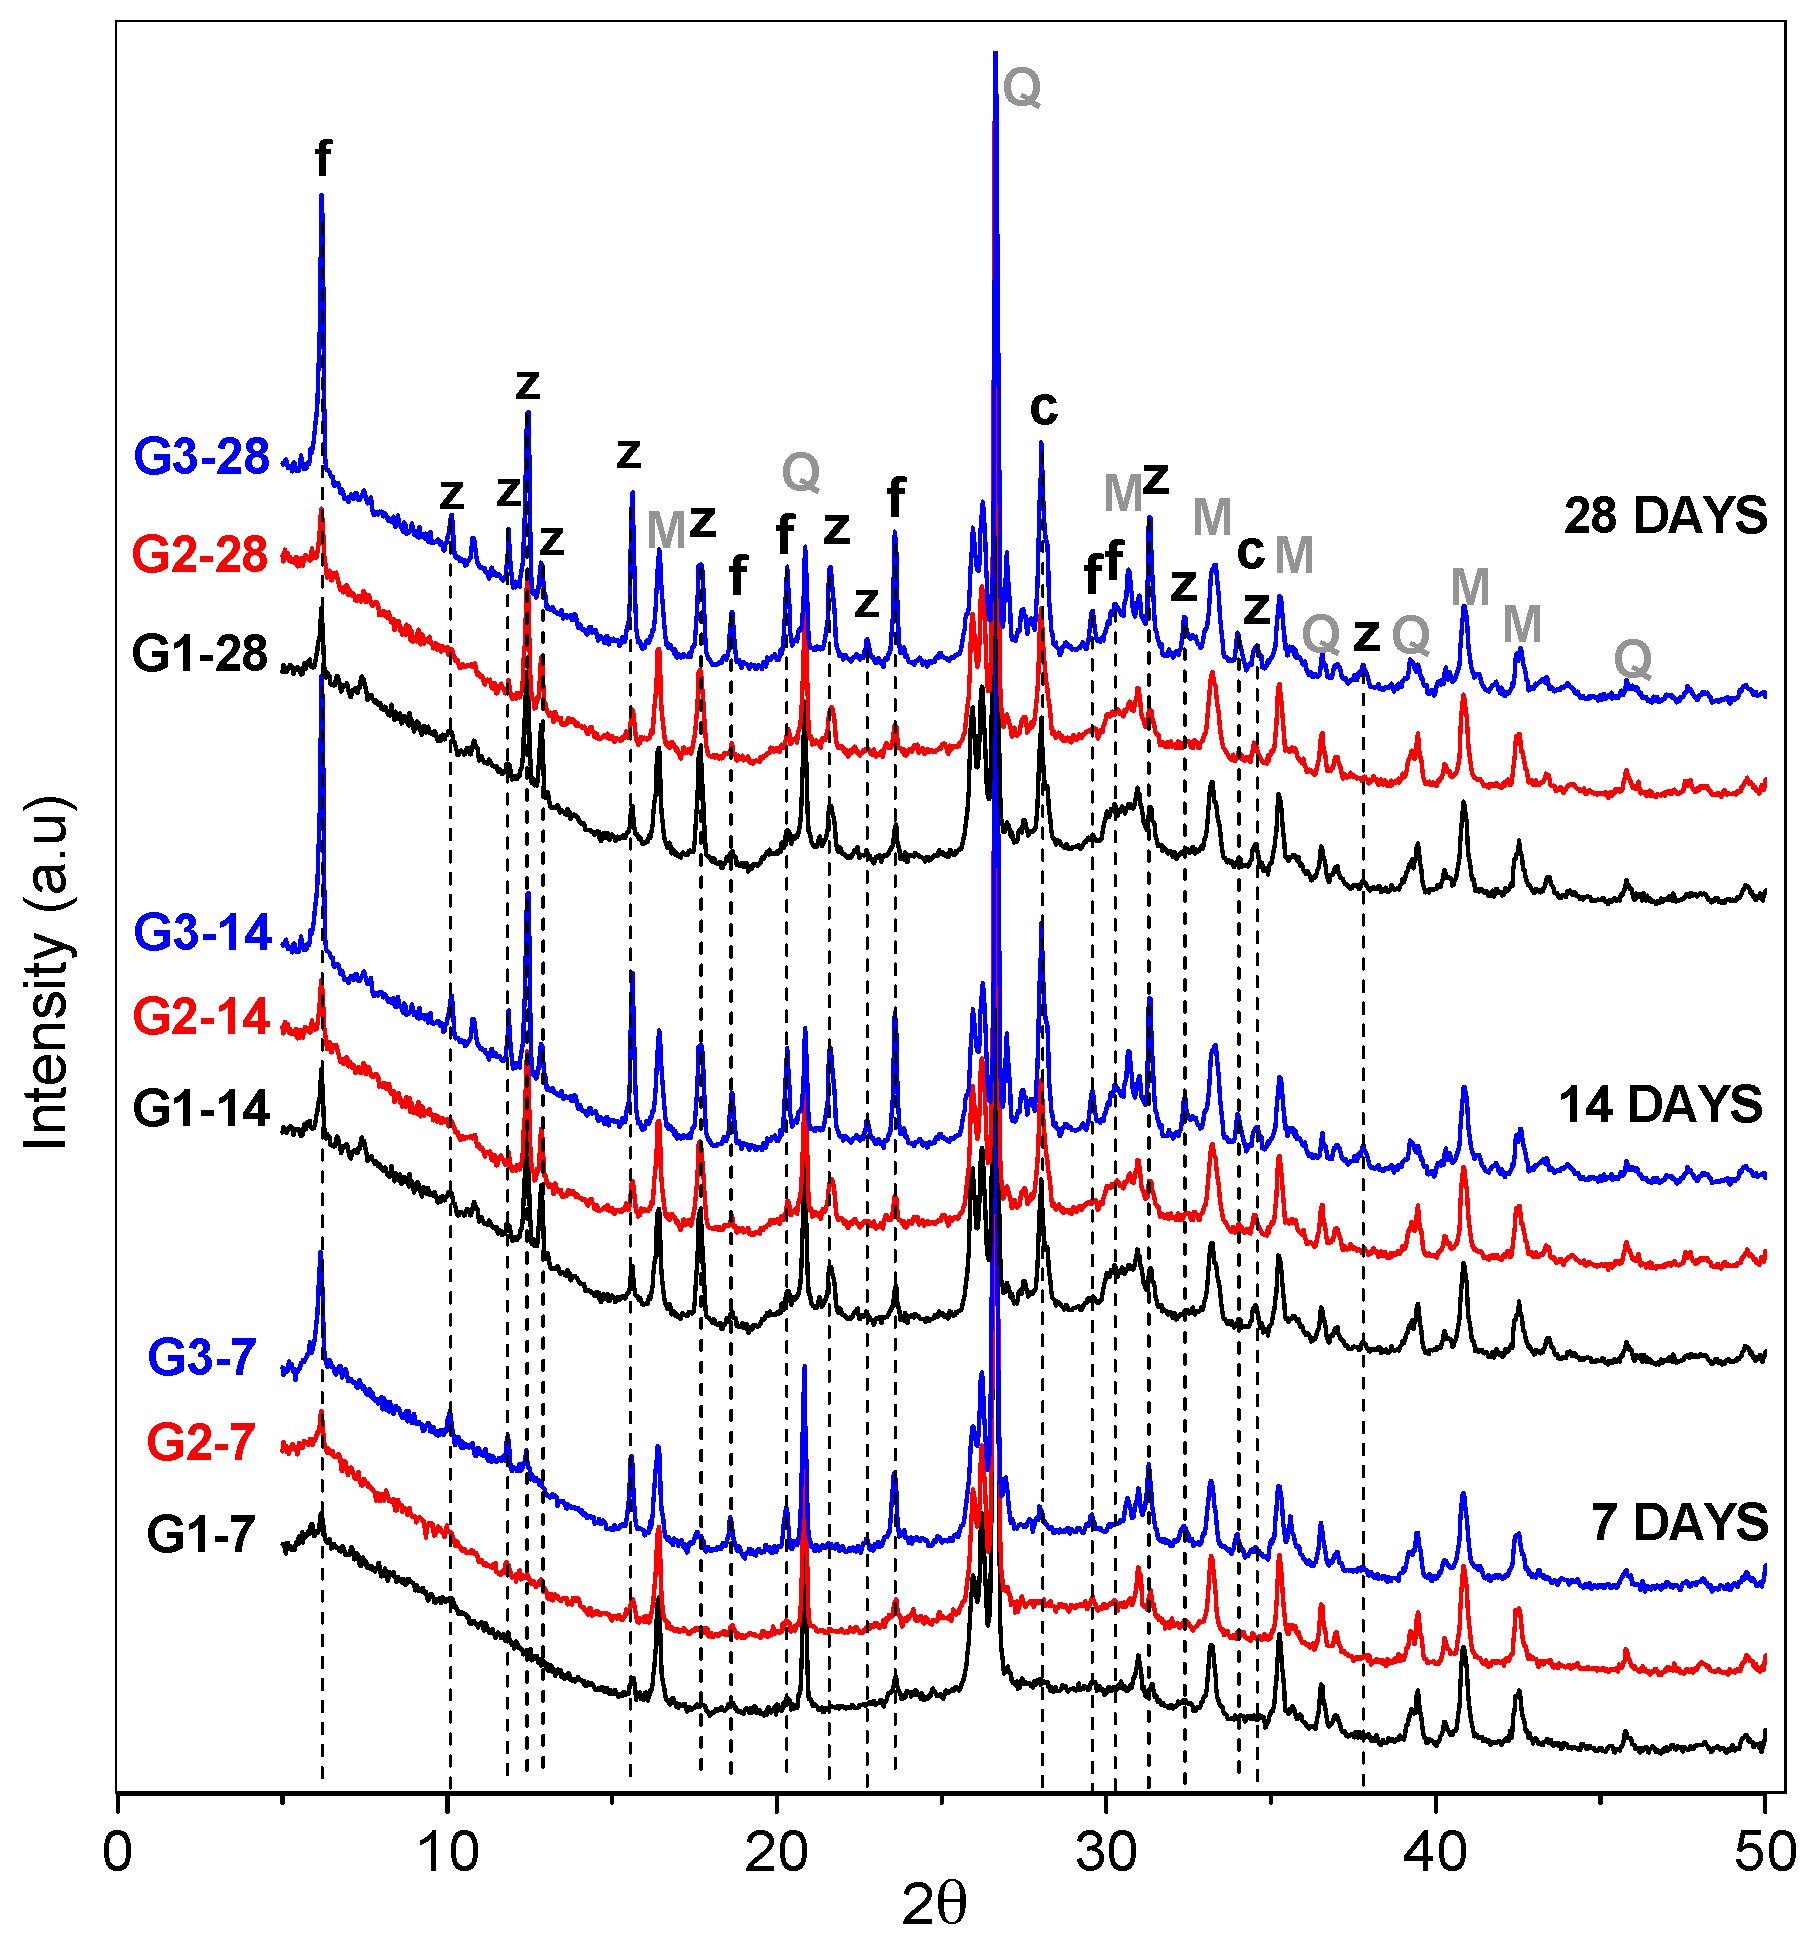
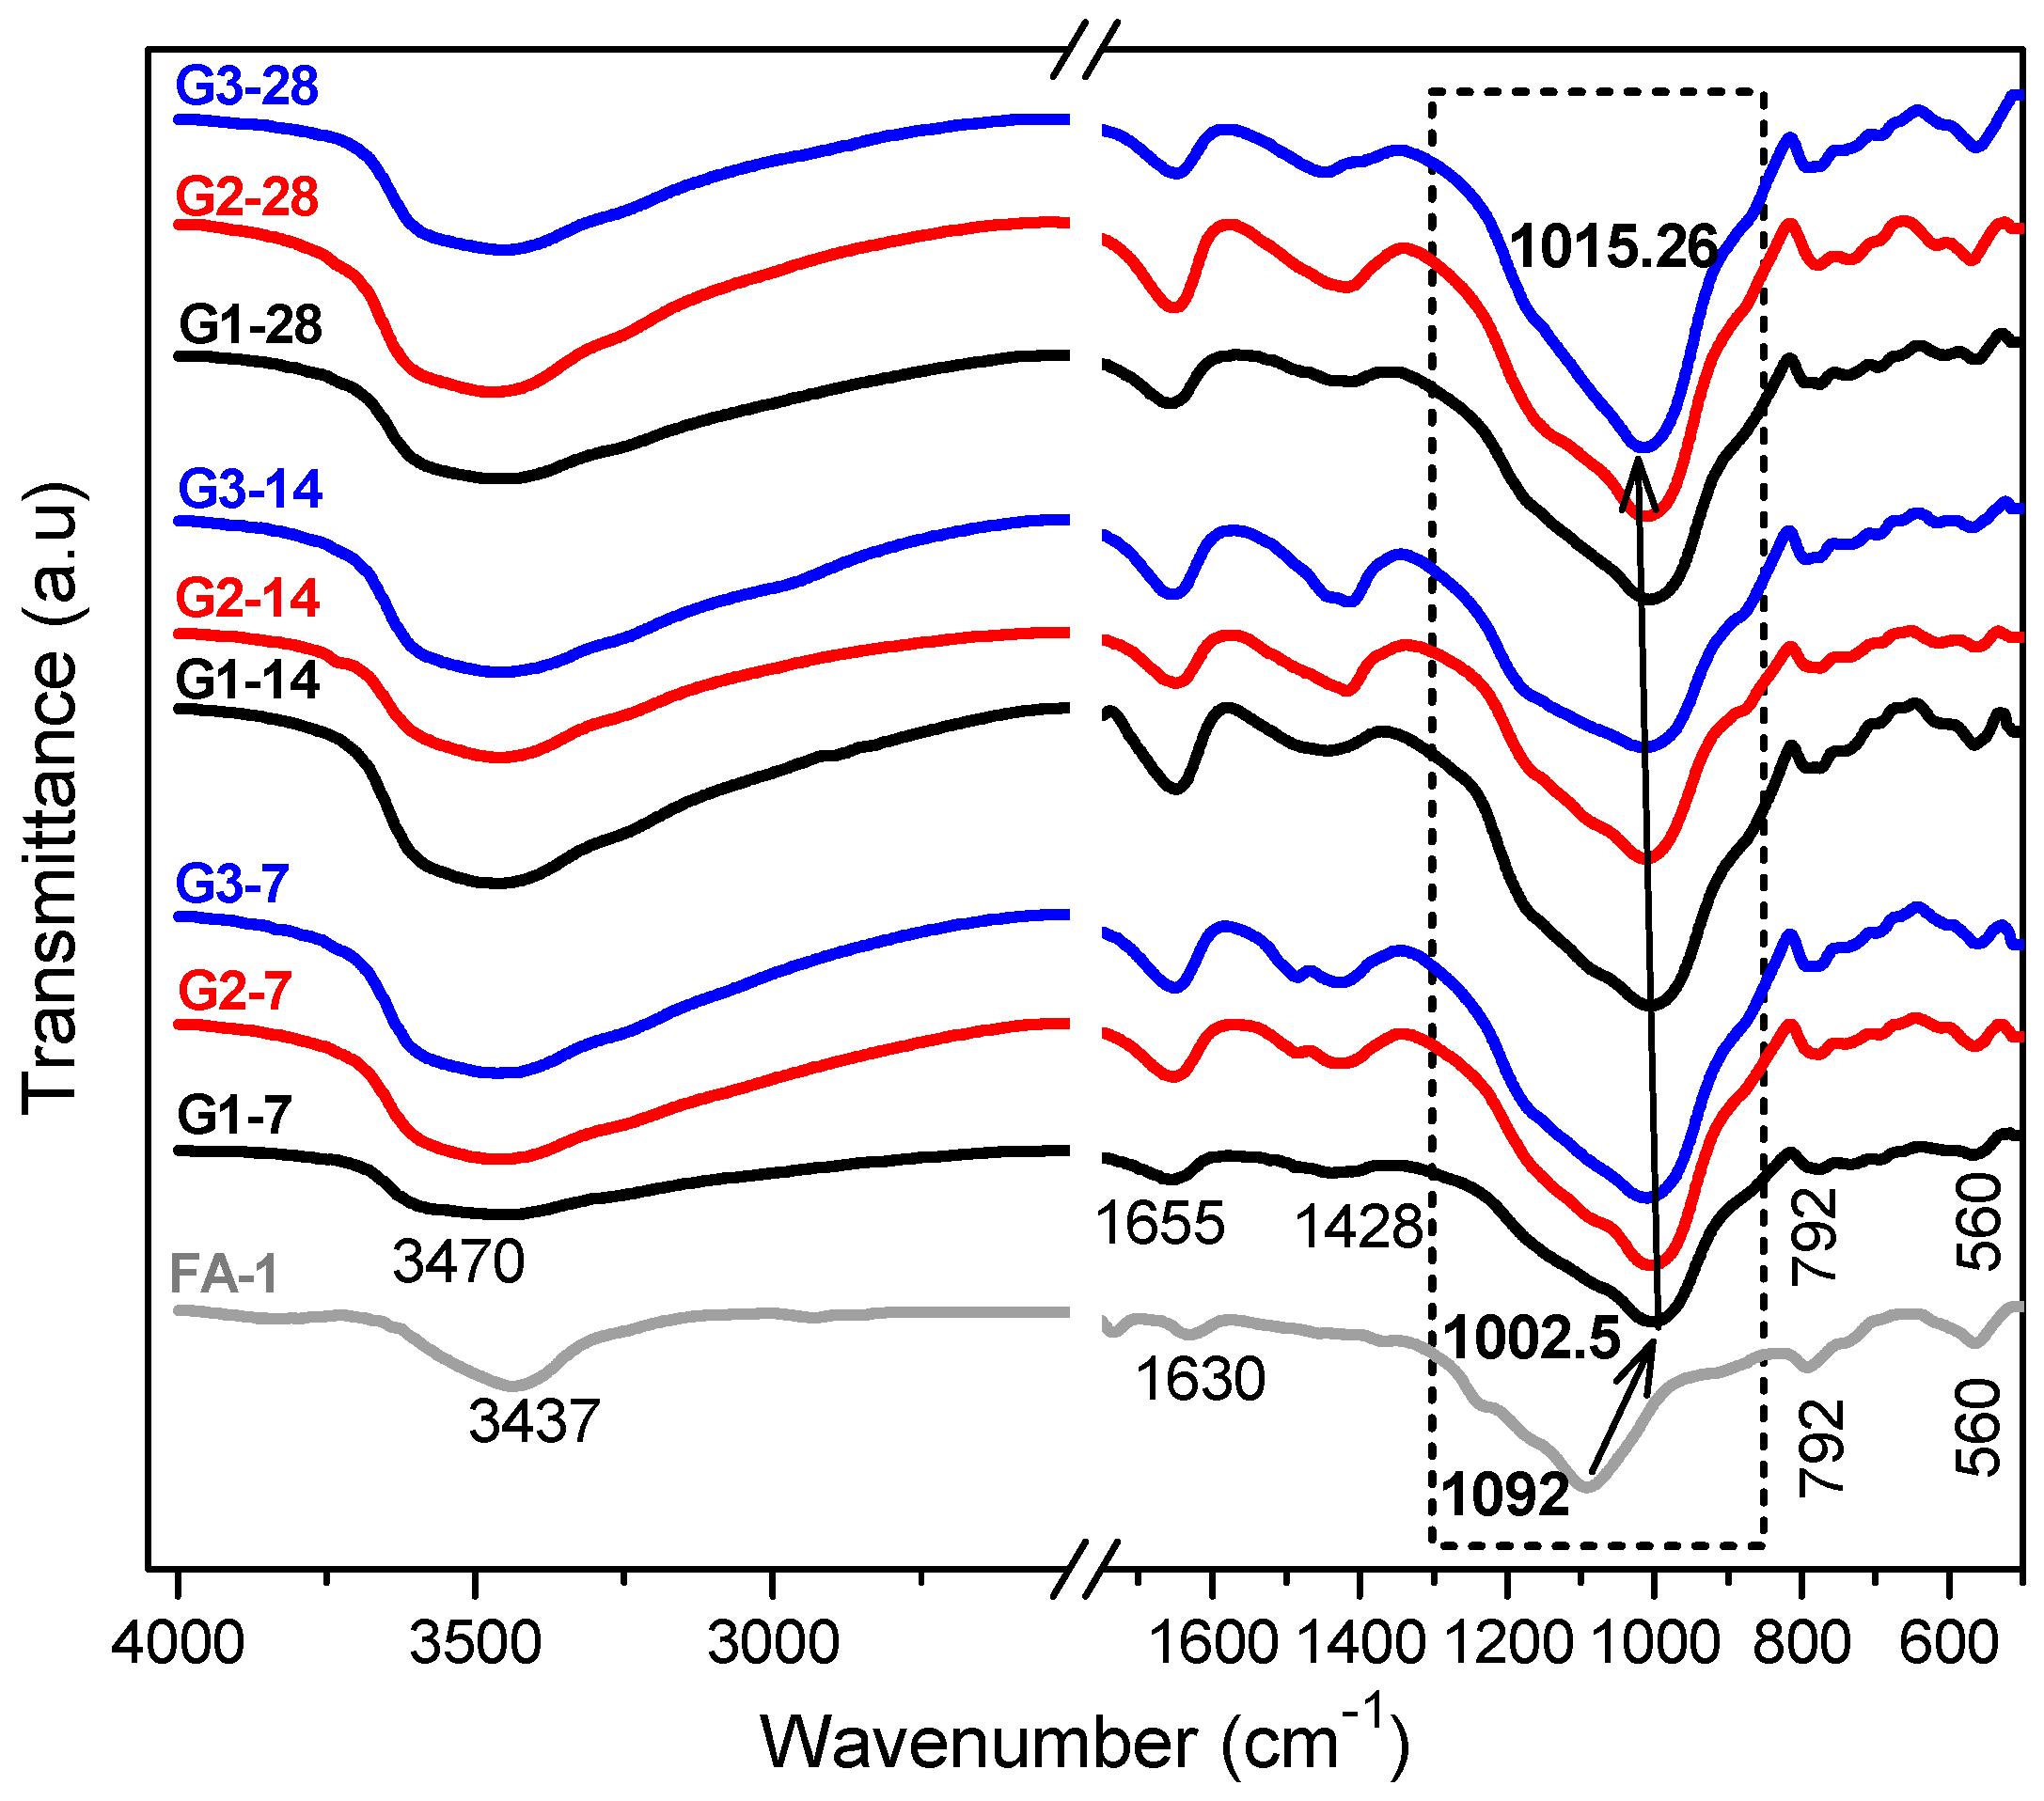
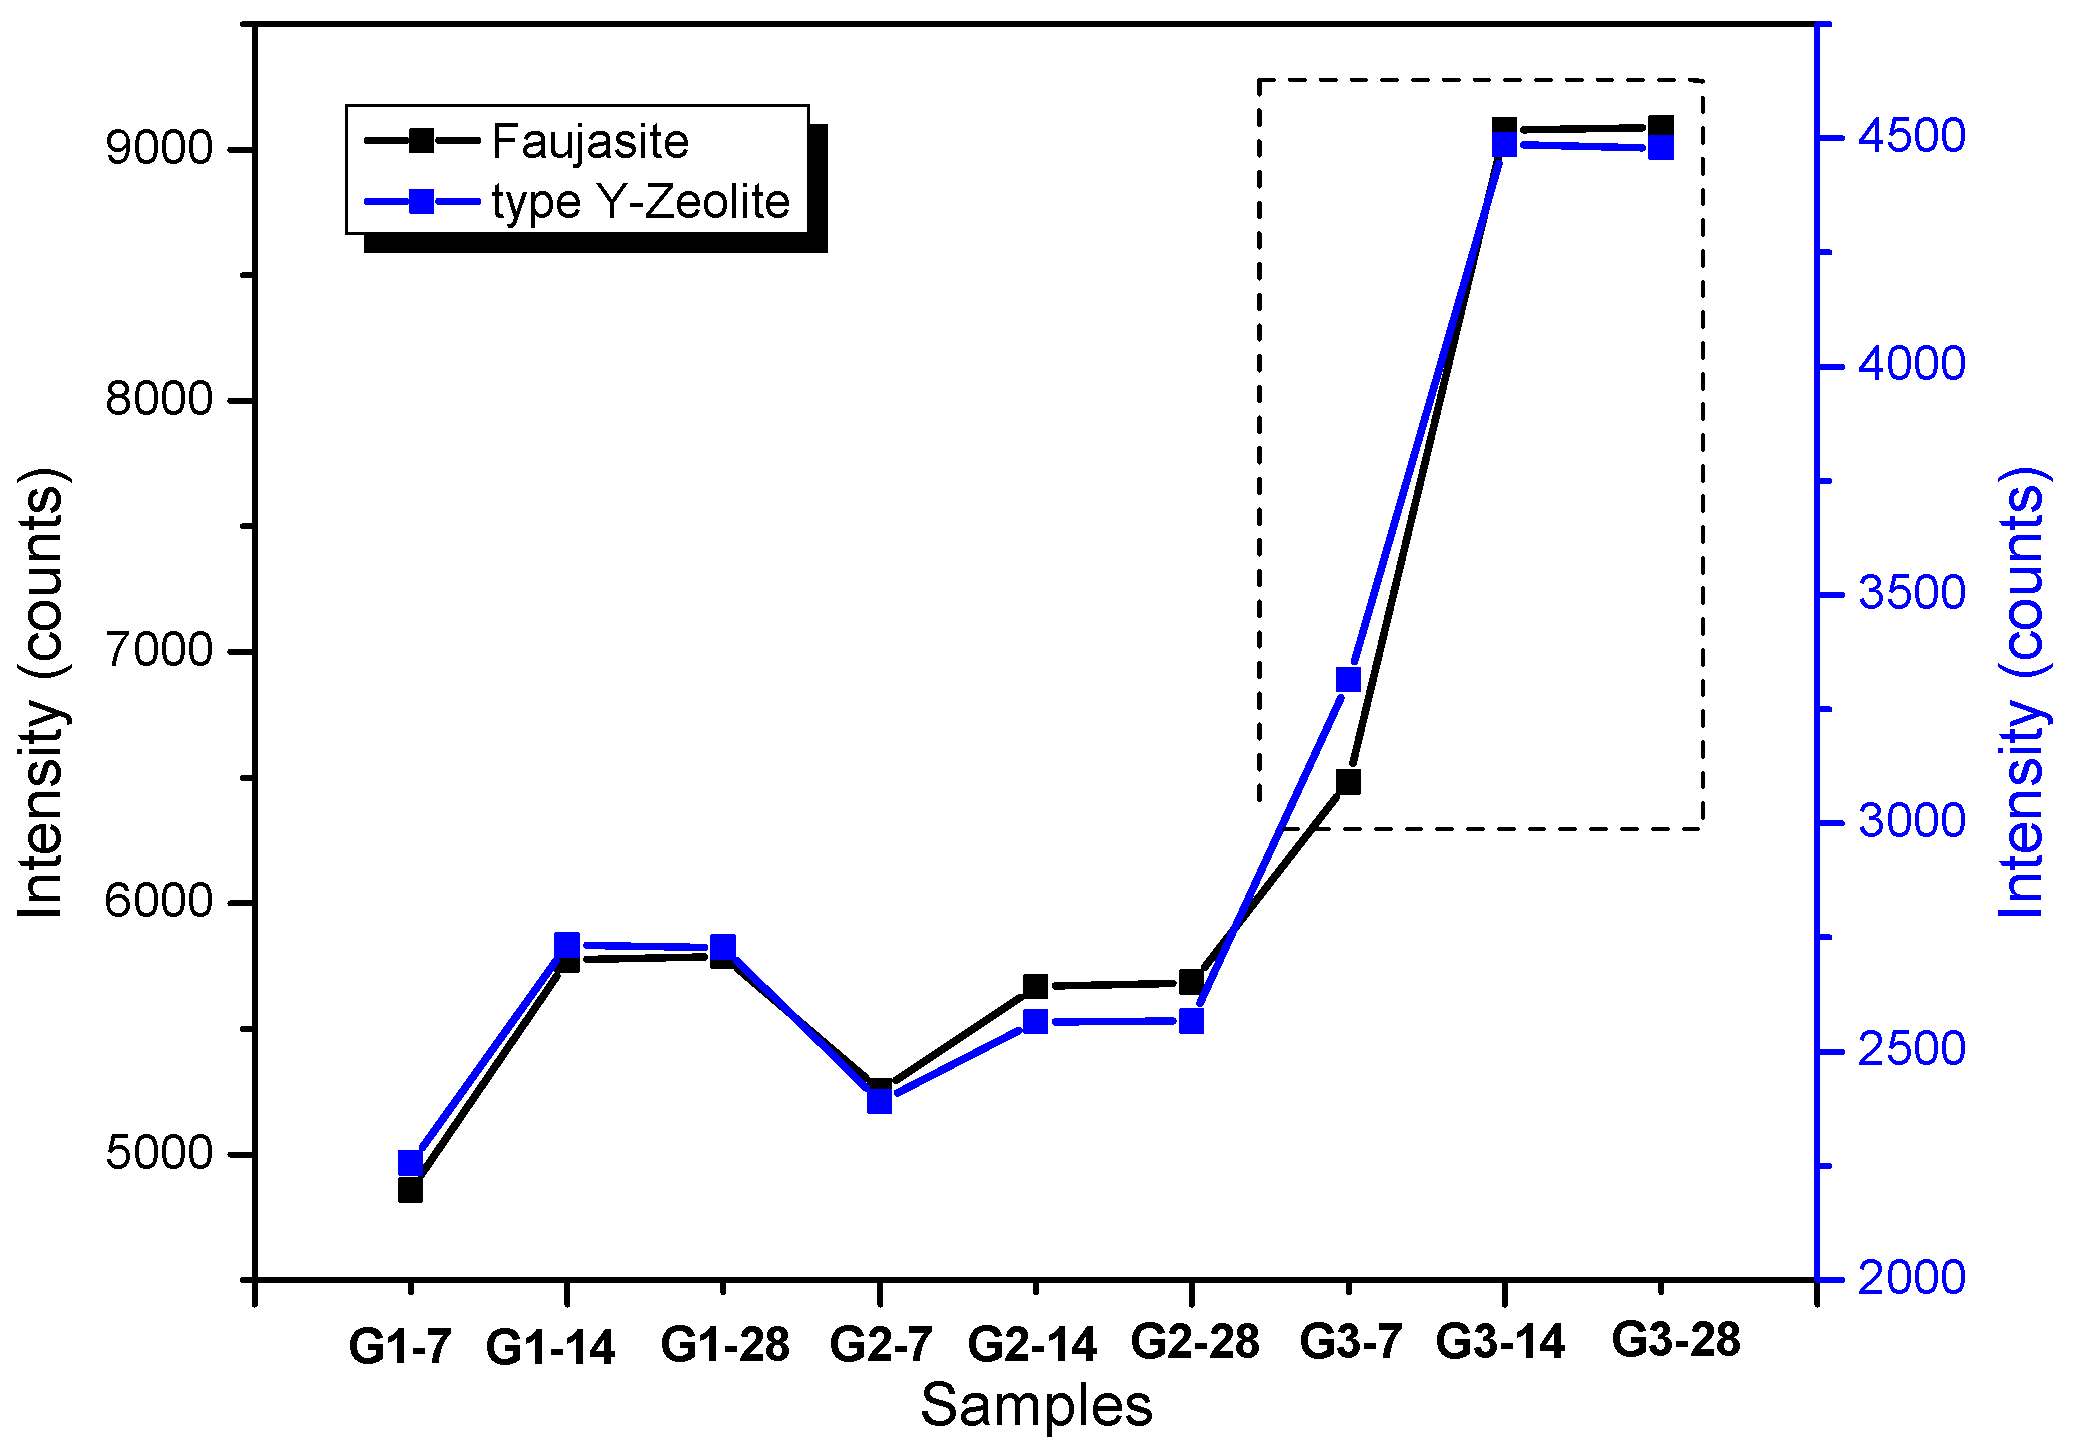
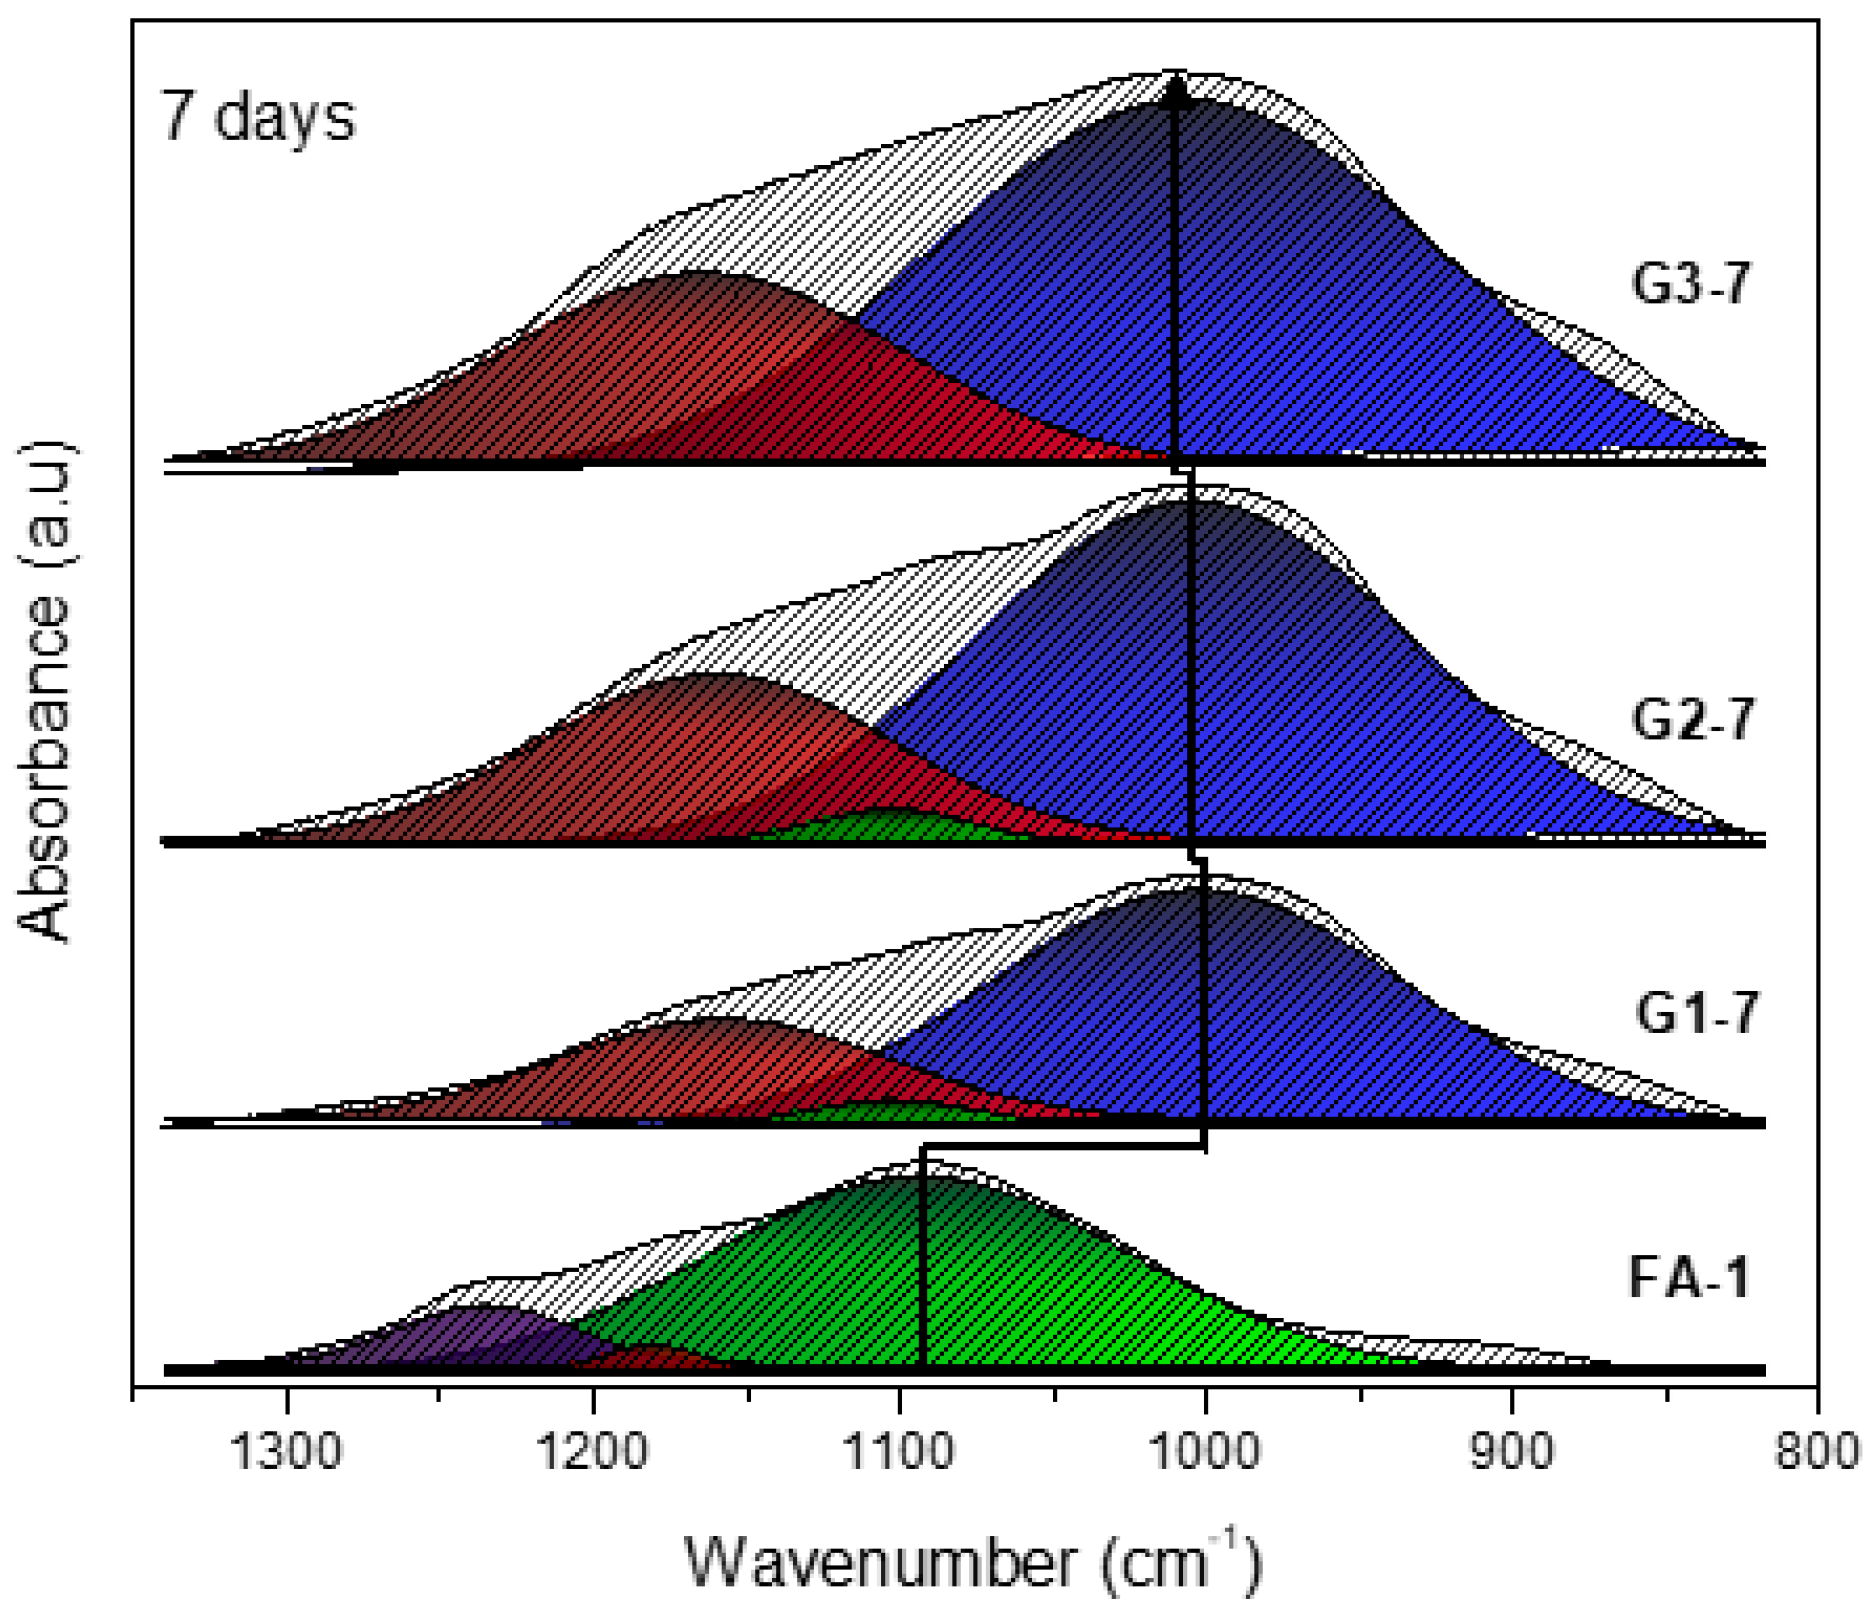
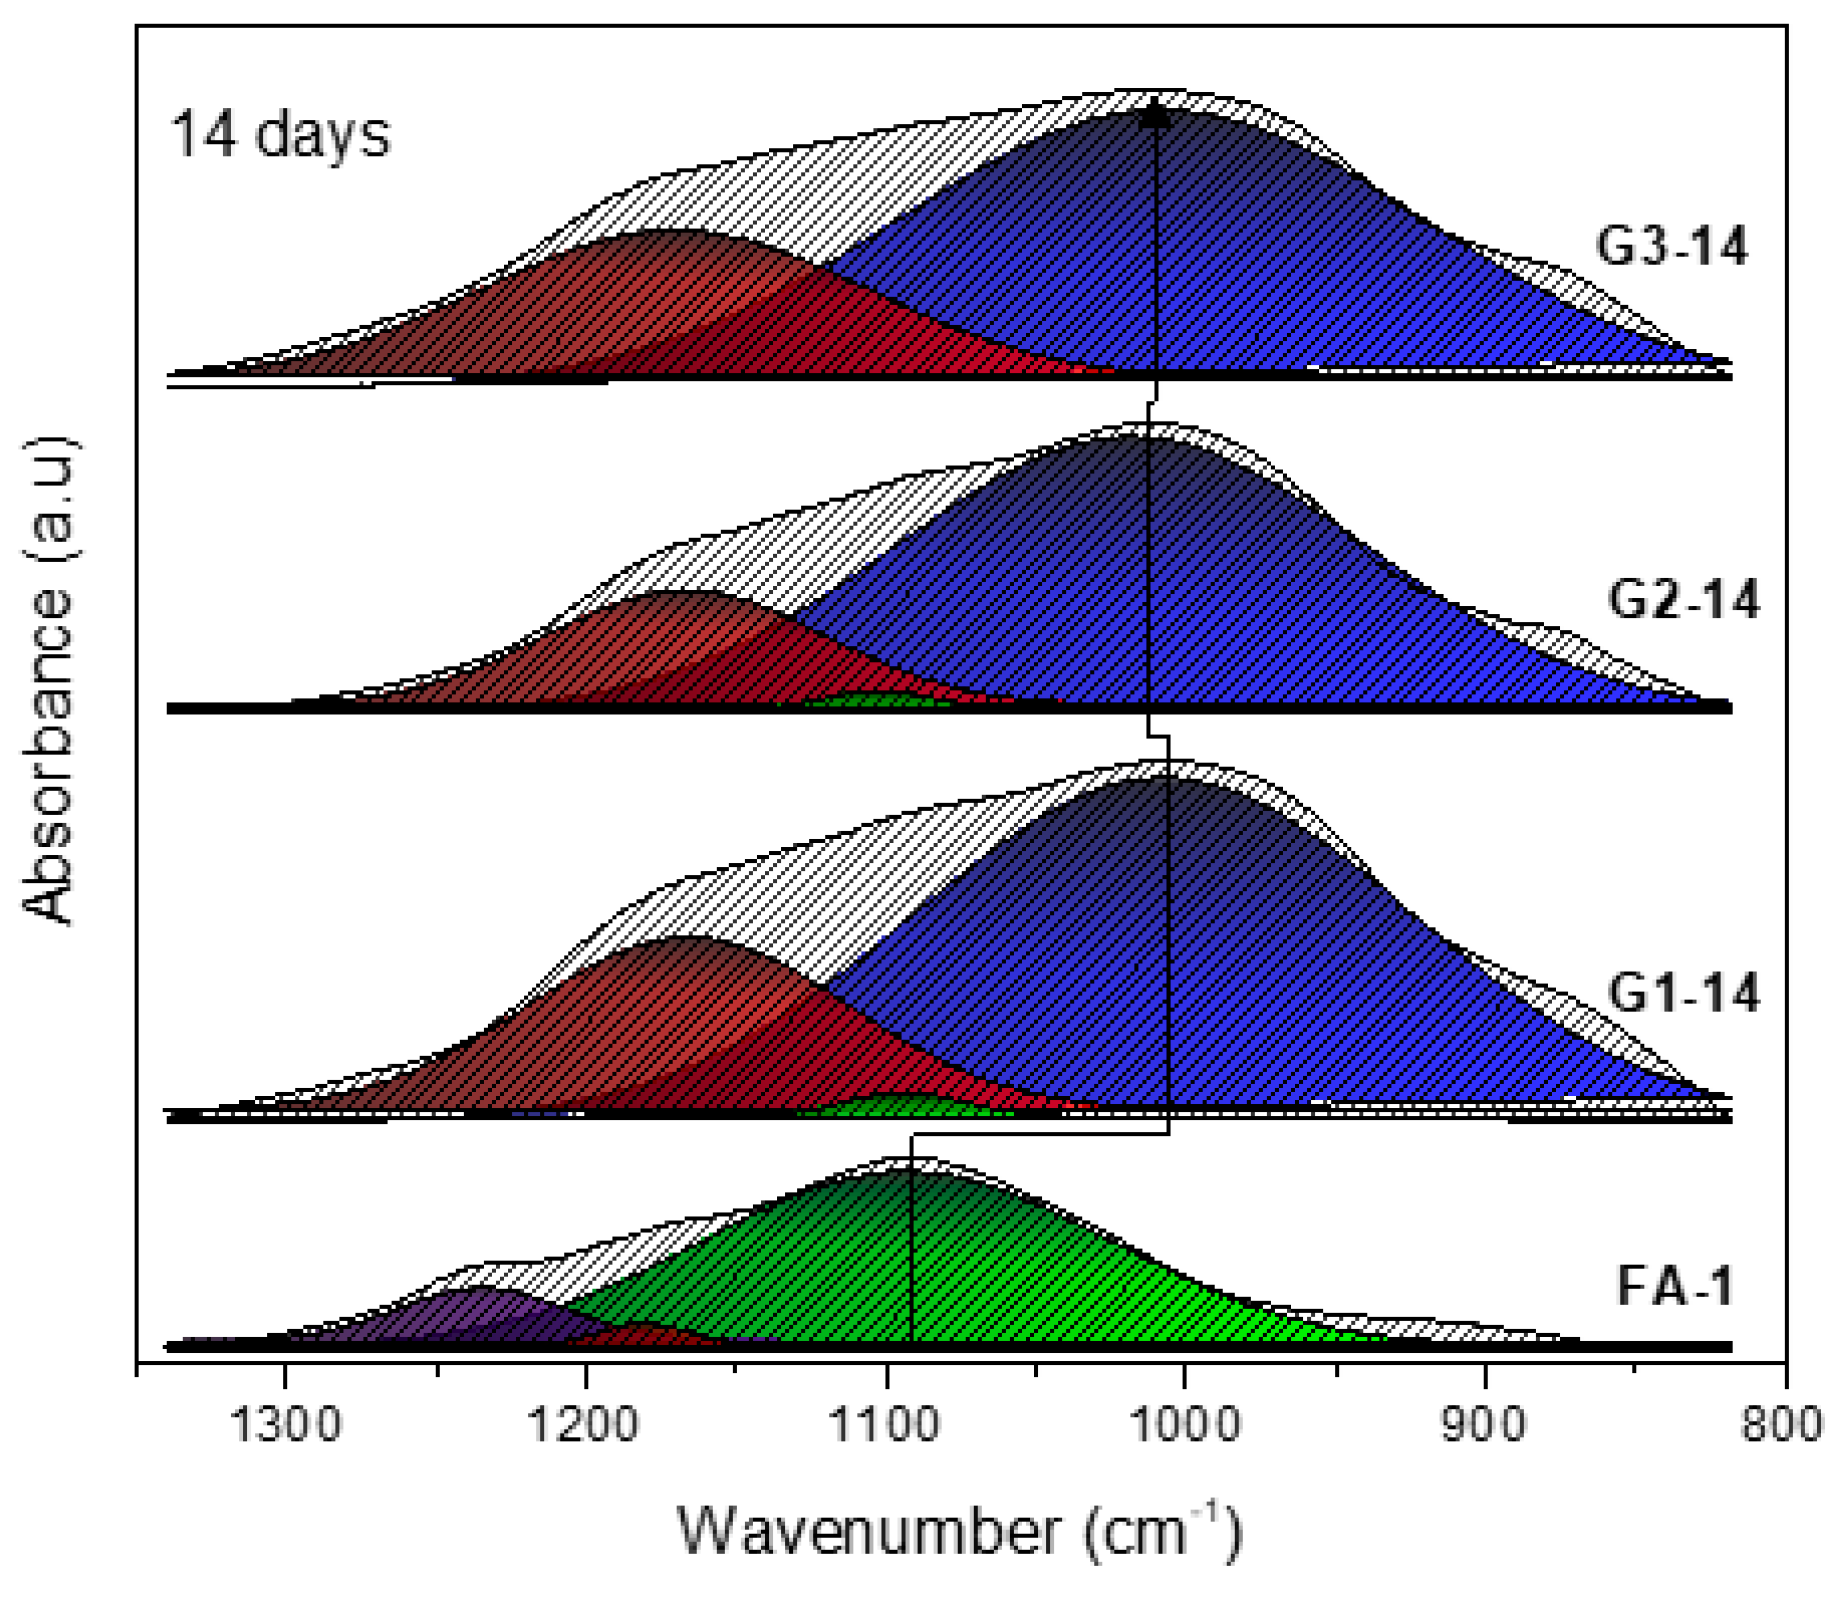
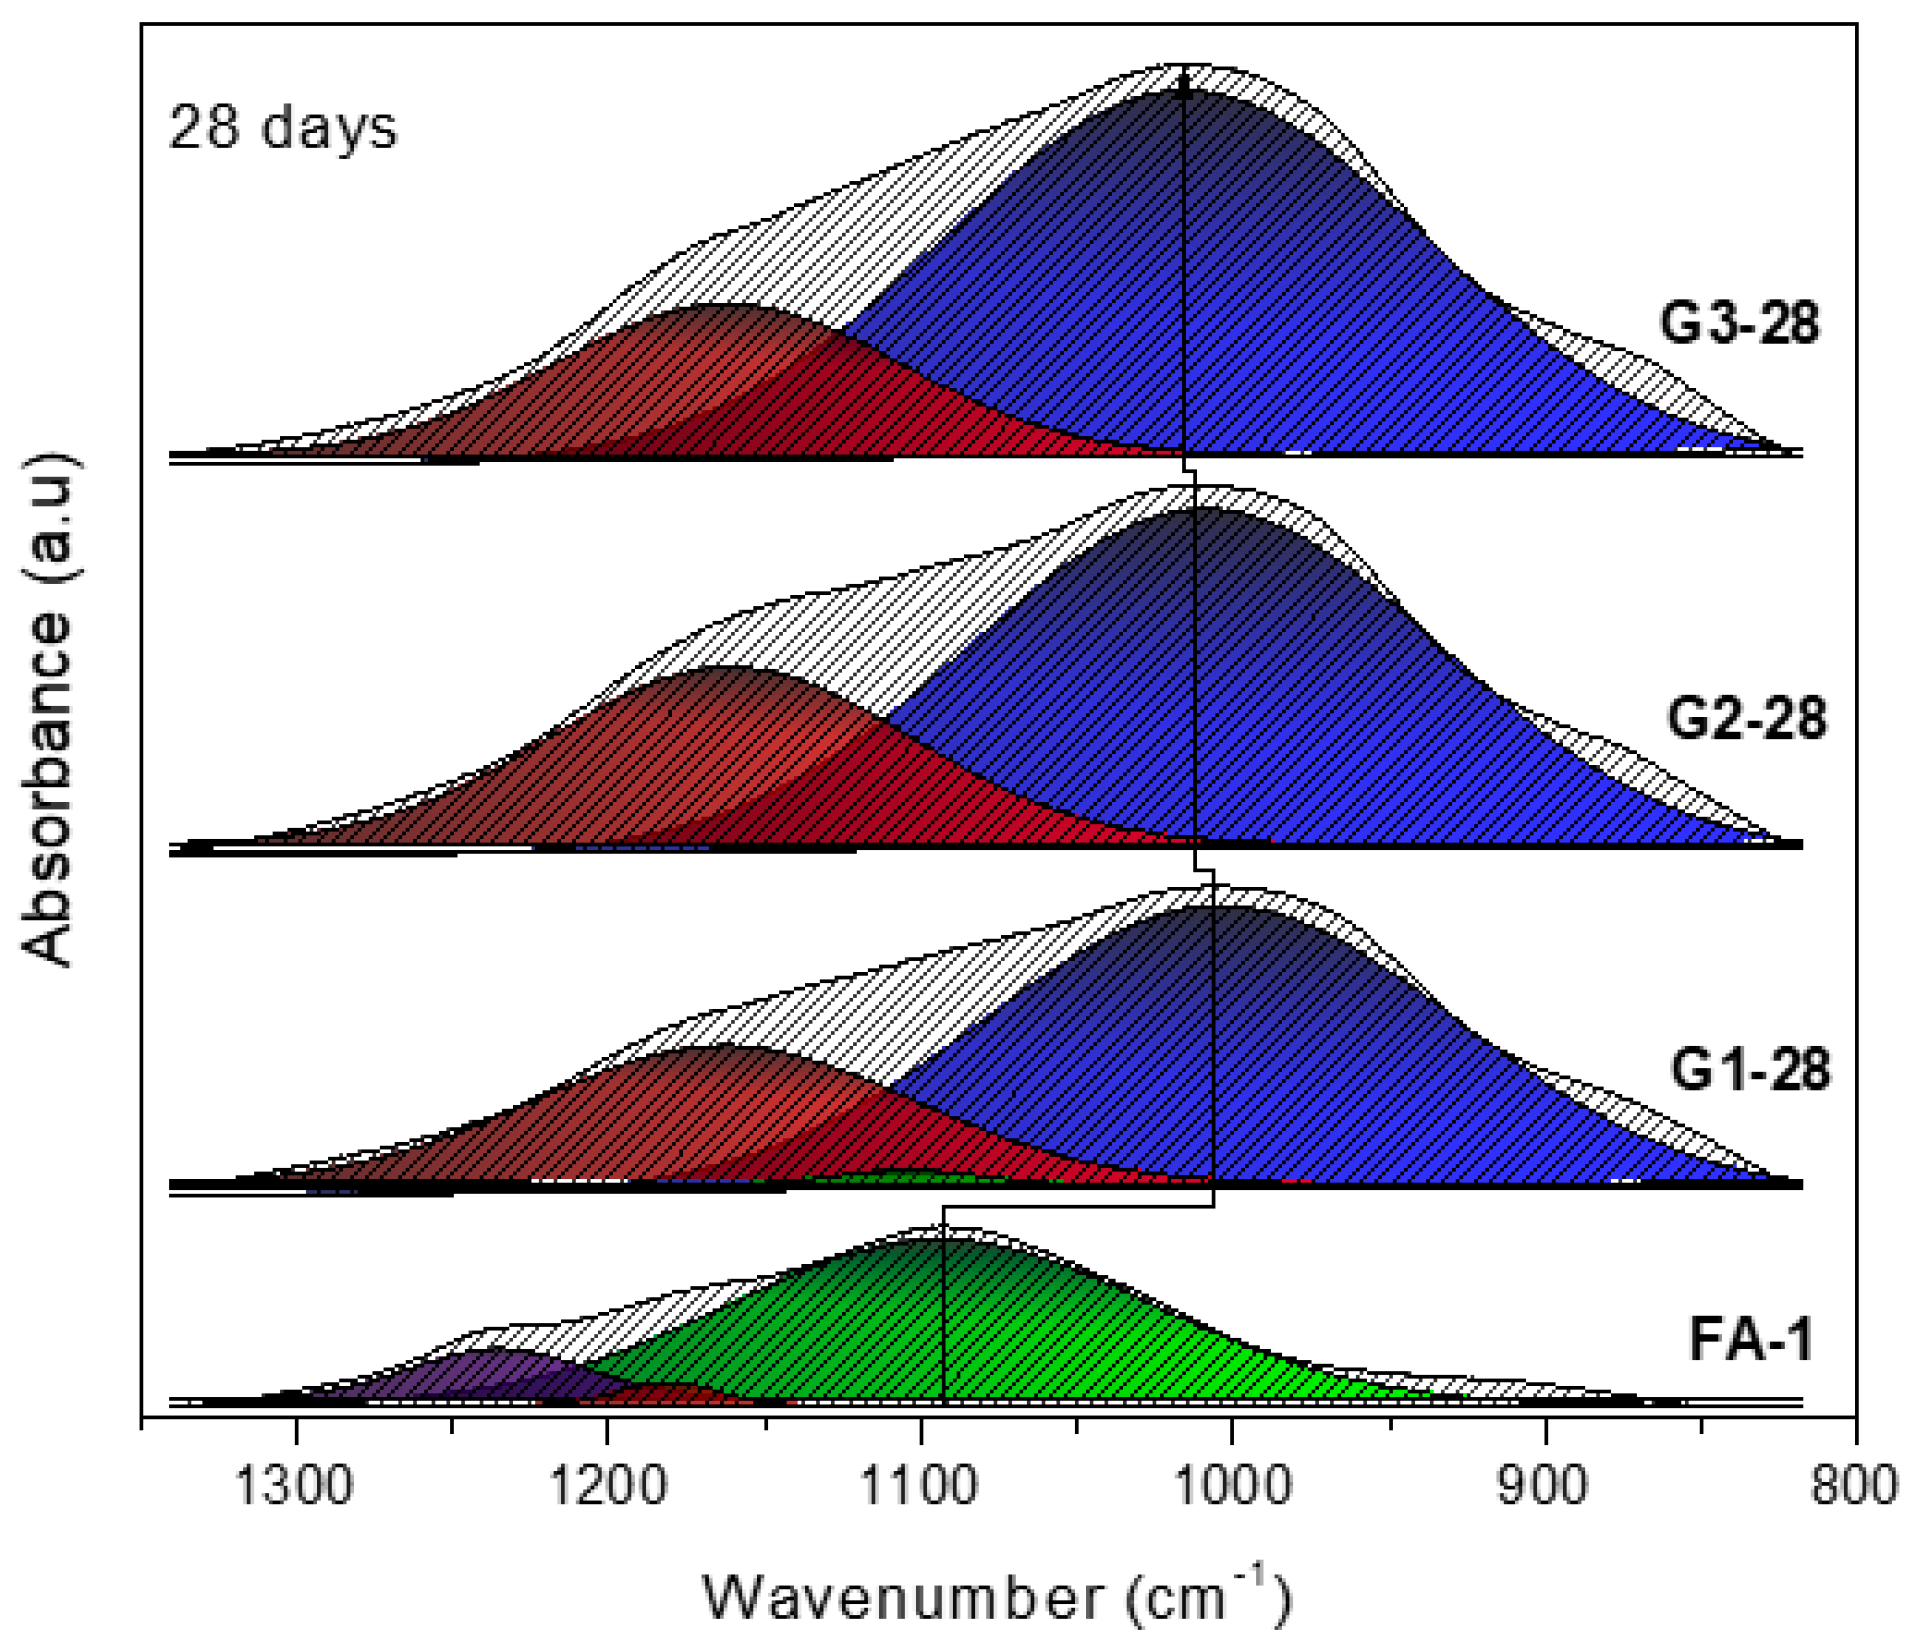
3.1. XRD and FT-IR Analysis
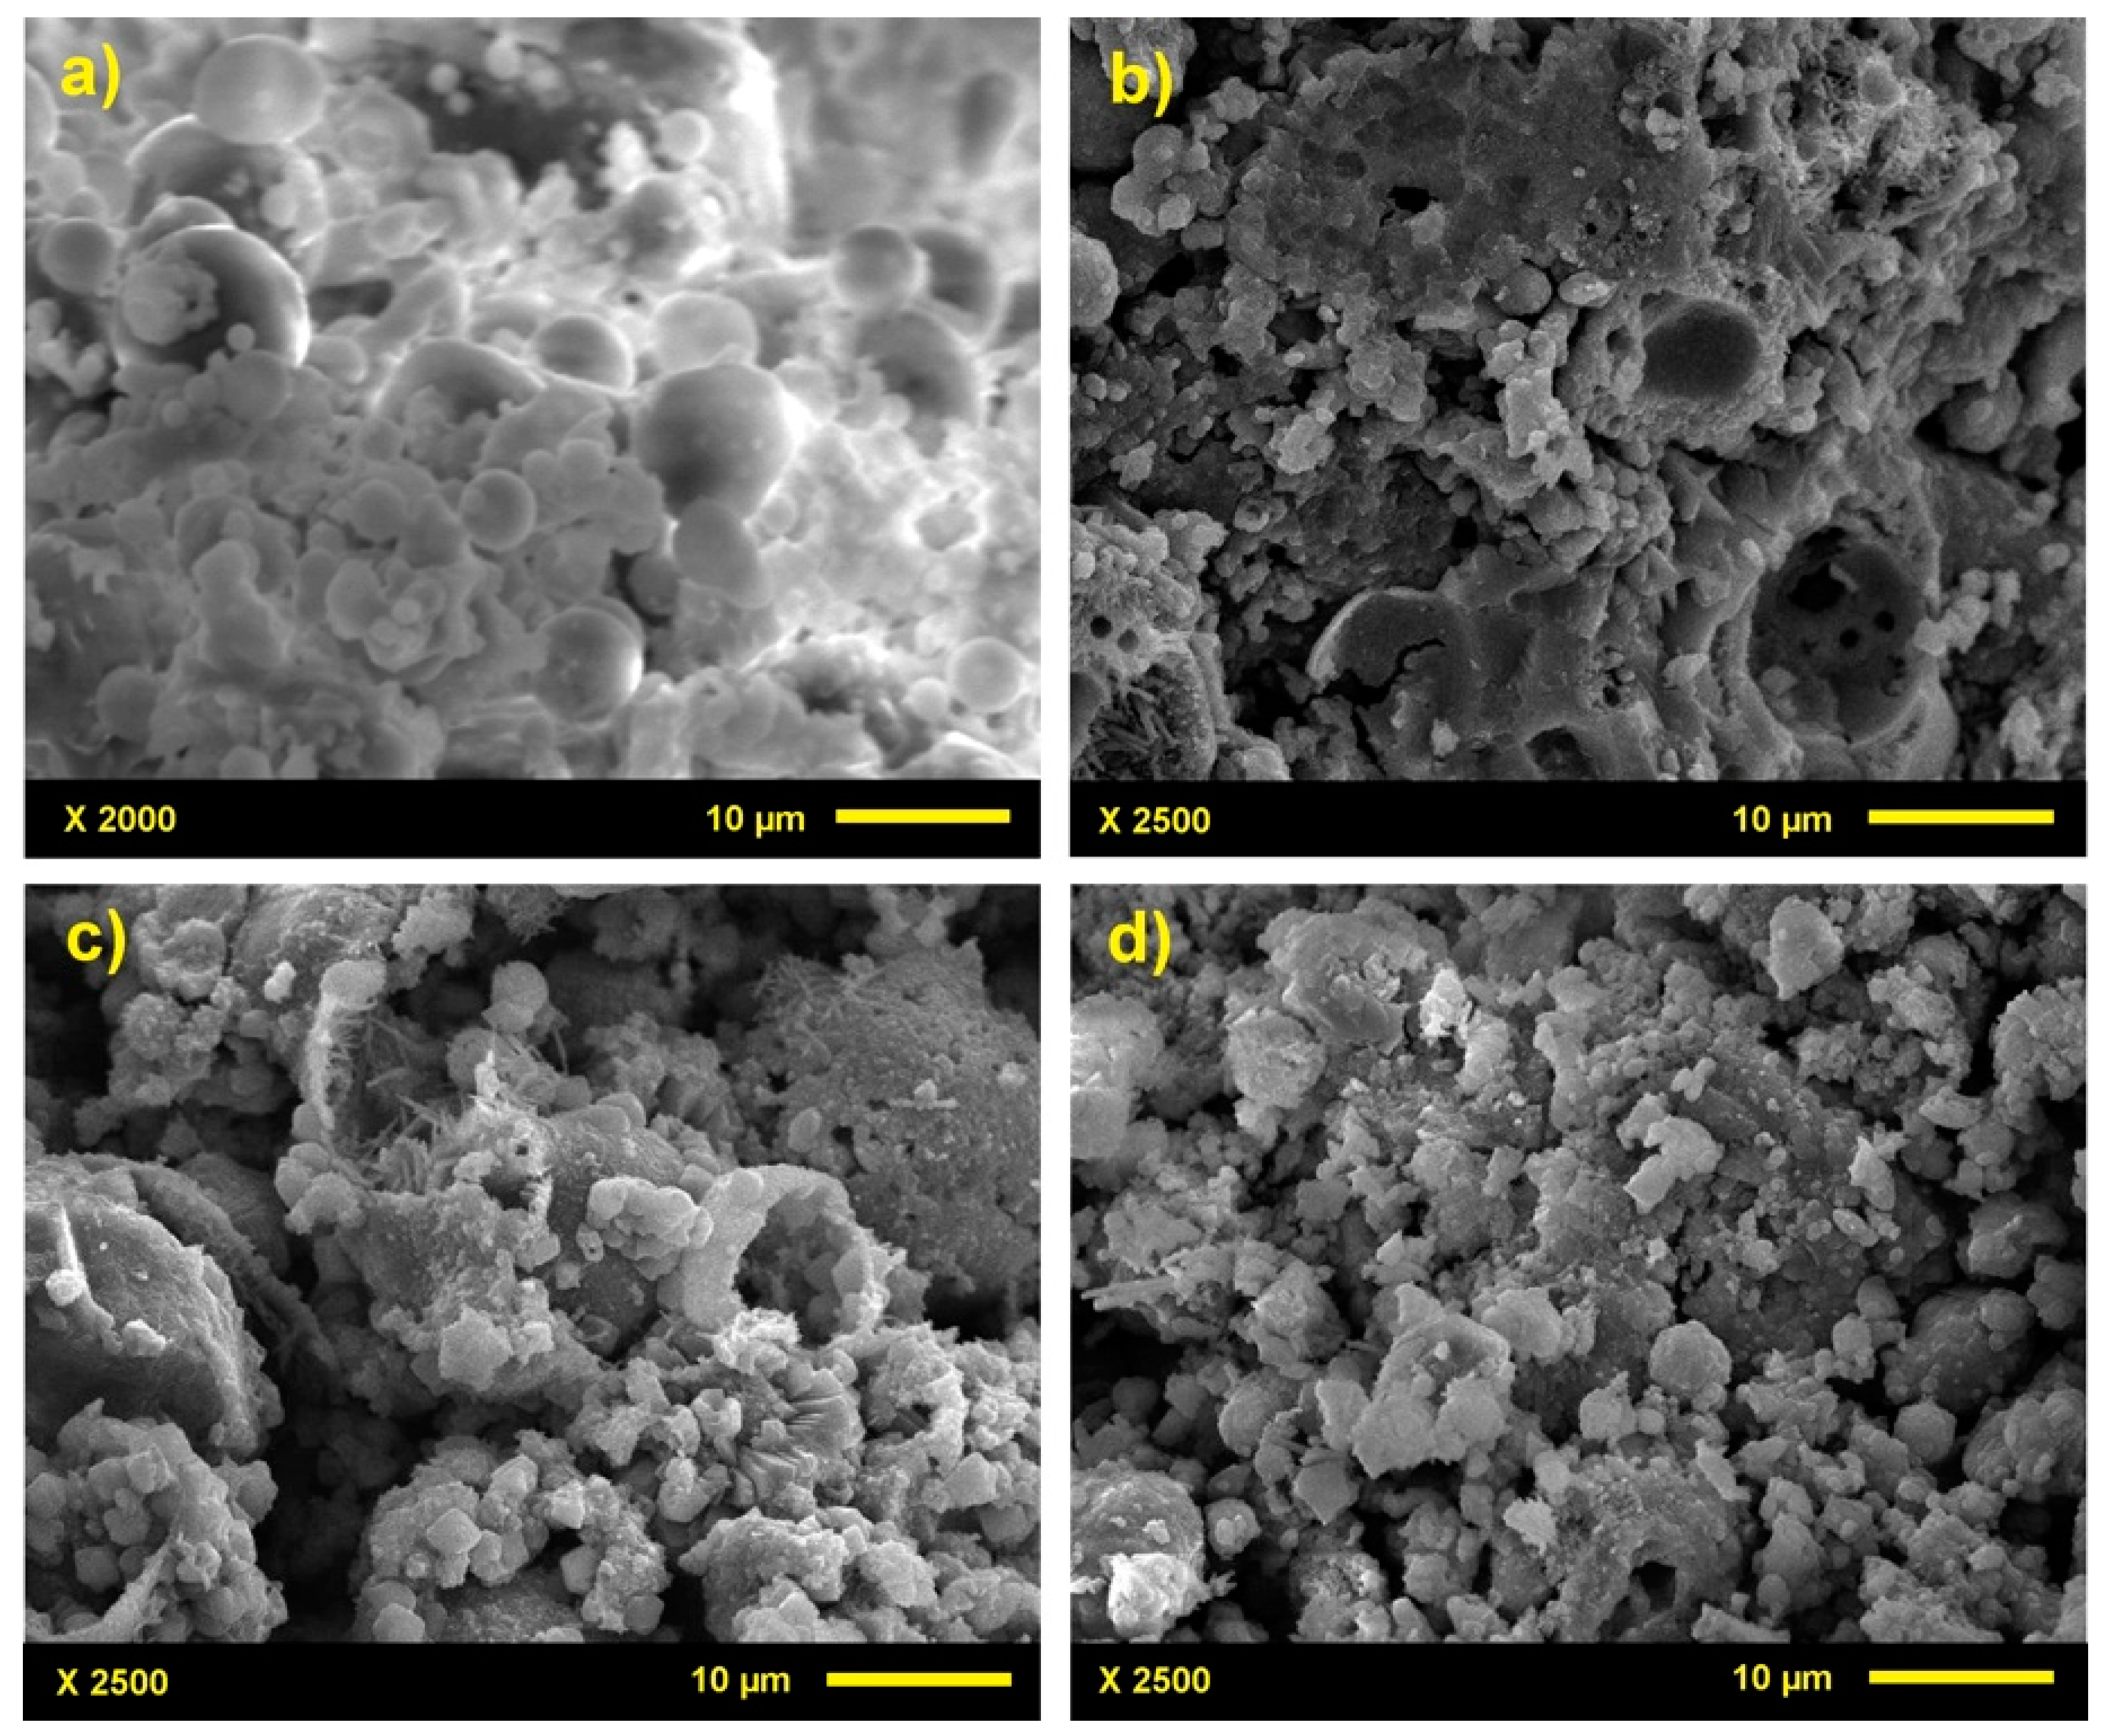
The XRD of the geopolymers show a similarity in the intensity of the peaks produced by the present crystalline phases, in relation to each type of geopolymer, highlighting quartz as the most intense peak, present at 2θ = 27°, attributed to the natural structure of the FA. The main crystalline phases of FA depend on the combustion process carried out in the coal plants; however, the crystal structures present in FA (Class F) coincide with the results of other investigations [35,36].
However, the reduction of particle size through mechanical grinding is the variable that causes a change in the XRD of the geopolymers, which is attributed, on the one hand, to the increase of the specific surface area, expanding the contact area with the alkaline activator, which promotes an increase in the reactivity of the FA. It was also observed that the mechanical grinding affected the microstructure of the FA and mainly causes a weakening in the vitreous chemical bonds of Si-O or Al-O, besides the fact that it accelerates the dissolution of these bonds, shortening the equilibrium time, gelation, and structuring of the new crystalline phases and of the different reaction products, specifically the hydrated sodium aluminosilicate gel (N-A-S-H), which is known as the reaction product that gives the mechanical properties to the geopolymer.
In Figure 3, the characteristic crystalline phases that were already present in the FA did not suffer any change with respect to the activated samples, because sodium hydroxide did not cause alterations in these phases due to the strong binding energies, which oscillate between 360 and 380 kcal/mol (five times stronger than the vitreous phase) [37], through which the alkalinity of the solution is capable of dissolving the bonds of the amorphous phase of this starting material.
A semicrystalline gel is produced in the geopolymers pastes, which is characteristic in these materials and is displayed in the range of 2θ between 20° and 40°. In addition, scattered peaks appear at different intensities, located between 5° and 50° in 2θ [38]. These results are consistent with those shown in the infrared spectra (Figure 4) that identify small bands located between 560 cm−1 and 792 cm−1, where the first can be attributed to the vibration of Al-O-Si bonds contained in the mullite and the second to Si-O-Si bonds included in the quartz [39,40]. Considering that these bands are maintained for each of the spectra of the activated materials (the sets G1, G2, and G3), it is confirmed that these crystalline phases are not modified and, therefore, the signals come from the crystals of the FA. Regarding the curing age at early ages, the sets G1 and G2 remain constant. However, set G3 presents an increase in its intensity, and this behavior remains for 14 and 28 days, indicating the development of polymerization of the material. This process reveals evolutions in the crystalline phases, determining the influence that the particle sizes of the FA have on the reactivity of the geopolymers.
As curing time passes, there is a decrease in the halo of the amorphous phase (Figure 3) located between 20° and 40° of 2θ due to its dissolution, which promotes the formation of new products and allows for the occurrence of the specific phases of the geopolymers.
In Figure 5, it is shown how faujasite and type Y-zeolite acquire intensities with similar tendencies. The largest ones are concentrated in G3-14 and G3-28, and are up to 50% more intense than those in group G1, which can be attributed to a greater development of crystallinity in its phases [41], mainly due to a greater reactivity of the FA, because of the increase of the specific surface area induced by the reduction of particle size by grinding, which causes the weakening of Si-O and Al-O bonds and thus promotes the incorporation of soluble Si and Al in the crystalline chain.
The band at 3437 cm−1 is derived from the O-H stretching present in the FA. In the same way, this band appears wider in the geopolymeric samples due to the overlapping of signals, originating from the contribution of hydroxyl systems of the alkaline activator to the chemical structure of G1, G2, and G3. On the other hand, the free water present in the FA shows a low transmittance at 1630 cm−1. This is attributed to the low contained humidity; however, in G1, G2, and G3 a more intense band appeared at 1655 cm−1 due to the presence of physically bound water (H-O-H), which was produced by the hydrolysis that occurs from the specific equilibrium process of aluminates and silicates until the final polymerization of the geopolymer.
The intensification of the band at 1428 cm−1 is attributed to the C-O bonds present in NaCO3 (Figure 3c) produced by the reaction of free NaOH in the geopolymers with CO2 from the environment.
At 1092 cm−1, a band corresponding to the FA-1 spectrum is observed and there is a shift towards lower wavenumber, in the 1000 and 1016 cm−1 range, attributed to the asymmetric stretching of the Si-O-Si and Al-O-Si bonds present in the semicrystalline gel of the specimens. The presence of this band is considered the most important, since it provides information related to the development and polymerization of the alkali-activated FA [23,38,42].
Spectra deconvolutions were performed (Figure 6, Figure 7 and Figure 8) which show these shifts of the evolution of the bands that characterize these activated materials. The assignment of bands is proposed in Table 3.
The spectra deconvolution allows us to observe the shift and the displacement of the bands of FA-1 towards lower wavenumbers with more precision, as well as to establish the changes that occur in the material during polymerization and ascertain with greater certainty that the FA was activated and a geopolymer is obtained. In the spectra analyzed by this method, it can be seen that the curing time is a factor that determines the process, but that the particle size from the first days of curing influences the polymerization process to a greater extent through the activation of the FA. The width of the blue band is wide because of the diversity of vibrations Si-O and Al-O produced by the amorphous molecule of the reaction product [44,45].
The vibrations of the bonds attributed to the vitreous phase of the FA-1 of origin, when activated, transform and vibrations at lower wavenumbers are observed, which is characteristic of the formation of the gel product of the polymerization of the activated material.
It can be observed that the green band cedes almost all of its color towards the darker blue; however, sets G1 and samples G2-7 and G2-14 continue showing small green areas, indicating the continued vibration of the amorphous material, which suggests that it is still present in some geopolymers (see Figure 6, Figure 7 and Figure 8). The change of color or the change of phase (the amorphous phase of FA-1 to the semicrystalline phase of geopolymers) is derived from the precipitation of Si and Al reactive bonds in the original FA with NaOH. The FA contains a higher percentage of Si4+ than Al3+ and, together with the reactivity of the same and the increase in the curing time, Si4+ bonds are gradually integrated into the environment of the aluminosilicate gel, so Si4+ begin to occupy the spaces of Al3+ [46]. This causes displacements to higher wavenumbers, due to the higher Si-O bond strength (80 kcal/mol) with respect to the Al-O bond strength (60 kcal/mol) [47], moving from 1002.5 cm−1 at the lowest end (G1-7) to 1015.26 cm−1 at the highest end (G3-28). With this information (1026 cm−1–1002 cm−1 = 100%), Figure 9 attempts to relate the highest wavenumber with the geopolymerization of the specimens. It can be seen that the set G3 has the highest displacements, with percentages greater than 60% in relation to the extremes. In this list, G2-14 and G2-28 are integrated with 60% and 66%, respectively. Samples that were obtained through FA without milling or sifting show percentages below 30%. As previously mentioned, the specific surface area of the FA plays a more important role in relation to the curing time, since after 14 days sets G-2 and G-3 show a high or acceptable geopolymerization.
The band that appears in a violet color in FA-1 disappears for the samples of the geopolymers. This behavior indicates that the Si-O and Al-O vibrations become part of the color blue or the crystalline phase, represented by the color red. The vibrations of the bonds found in the phases of the mullite or quartz for the FA are identified in the red band. However, this band widens considerably in the geopolymers, which is caused by the formation of new zeolitic phases.

3.2. Microstructure

Figure 10 shows the morphologies, structures, and phases of the geopolymers with a curing time of 28 days, which is when significant changes and differences between the samples are observed. The NaOH produces the phase dissolution of the FA, and forms reaction products with a homogeneous and compact matrix that does not occur in the starting material, the main characteristic of which is its spherical shape (Figure 10a) [48]. In the micrographs corresponding to the geopolymers, cavities left between the reaction products can be observed, which are mostly gels formed by long chains of silicates and aluminates balanced by the sodium ions of the NaOH used as solution. These results consistent with other investigations [49,50]. The new structures are a consequence of alkaline attack and thermal curing during the process of obtaining the geopolymers [51].
Likewise, through these images it is also possible to observe the evolution of the reaction products with different particle sizes of FA-1.
In Figure 10b there are fewer crystalline phases and a heterogeneous matrix without defined structures which is related to a low crystallinity; as the particle size decreases (Figure 10c,d), the number of crystalline products increases and is consistent with zeolitic structures attributed to the faujasite and type Y-zeolite. These structures are present in the sets G1, G2, and G3, but with higher intensity in G3 (Figure 5) inside an amorphous matrix attributed to the formation of gels in the activation and geopolymerization process [51].
This influence on the achievement of the reaction products is observed in the displacement of the bands of the FT-IR spectra and in the creation of new crystalline phases that also appear in XRD.

4. Conclusions

  • The reduction of fly ash particle size by grinding allows a greater dissolution in the alkaline activation of the raw material.
  • Deconvolutions show the displacement of the bands with greater precision, and in the same way establish whether the activation process was carried out and elucidate the evolution of how the bonds are restructured over time.
  • A smaller particle size requires less time to produce crystalline structures and gels that provide stability to the geopolymers, as well as more homogeneity in the matrix and more rigid bonds.

Acknowledgments

The authors thank to Mexican National Council for Science and Technology for its doctoral scholarship program and to Autonomous University of Sinaloa.

Author Contributions

C.A.R.-C, S.P.A.-R and J.M.G.-S wrote the paper together; C.A.R.C. and T.J.M.-S. performed the experiments; S.P.A.-R, A.C.-E. and R.C.-H supervised the research activities and provided guidance and suggestions for the project and manuscript; S.P.A.-R., A.C.-E, R.C.-H and M.J.P.-C. revised the article; all the co-authors contributed to the discussion of the results and preparation of the manuscript.

Conflicts of Interest

The authors declare no conflict of interest.

References

  1. International Energy Agency (IEA). Energy Technology Transitions for Industry. Strategies for the Next Industrial Revolution; OECD/IEA: Paris, France, 2009; p. 321. ISBN 978-92-64-06858-2. [Google Scholar]
  2. Baumert, K.A.; Herzog, T.; Pershing, J. Navigating the Numbers: Greenhouse Gas Data and International Climate Policy; World Resources Institute: Washington, DC, USA, 2005; p. 122. ISBN 1-56973-599-9. [Google Scholar]
  3. Barcelo, L.; Kline, J.; Walenta, G.; Gartner, E. Cement and carbon emissions. Mater. Struct. 2014, 47, 1055–1065. [Google Scholar] [CrossRef]
  4. Argiz, C.; Moragues, A.; Menéndez, E. Use of ground coal bottom ash as cement constituent in concretes exposed to chloride environments. J. Clean. Prod. 2018, 170, 25–33. [Google Scholar] [CrossRef]
  5. Manz, O.E. Coal fly ash: A retrospective and future look. Fuel 1999, 78, 133–136. [Google Scholar] [CrossRef]
  6. Giaccio, G.M.; Malhotra, V.M. Concrete incorporating high volumes of ASTM Class F fly ash. Cem. Concr. Aggreg. 1988, 10, 88–95. [Google Scholar]
  7. Argiz, C.; Sanjuán, M.A.; Menéndez, E. Coal Bottom Ash for Portland Cement Production. Adv. Mater. Sci. J. Eng. 2017, 2017, 1–7. [Google Scholar] [CrossRef]
  8. Sanjuán, M.A.; Argiz, C.; Gálvez, J.C.; Moragues, A. Effect of silica fume fineness on the improvement of Portland cement strength performance. Constr. Build. Mater. 2015, 96, 55–64. [Google Scholar] [CrossRef]
  9. ASTM C618. Standard Specification for Coal Fly Ash and Raw or Calcined Natural Pozzolan for Use in Concrete; American Society for Testing and Materials: West Conshohocken, PA, USA, 2015. [Google Scholar]
  10. Kriven, W.M. Geopolymer-based composites. In Comprehensive Composite Materials II; Oxford Academic Press: Oxford, UK, 2018; Volume 5, pp. 269–280. [Google Scholar]
  11. Masi, G.; Rickard, W.D.; Bignozzi, M.C.; Van Riessen, A. The effect of organic and inorganic fibres on the mechanical and thermal properties of aluminate activated geopolymers. Compos. Part B Eng. 2015, 76, 218–228. [Google Scholar] [CrossRef]
  12. Colangelo, F.; Cioffi, R.; Roviello, G.; Capasso, I.; Caputo, D.; Aprea, P.; Ferone, C. Thermal cycling stability of fly ash based geopolymer mortars. Compos. Part B Eng. 2017, 129, 11–17. [Google Scholar] [CrossRef]
  13. Ferreira, C.; Ribeiro, A.; Ottosen, L. Possible applications for municipal solid waste fly ash. J. Hazard. Mater. 2003, 96, 201–216. [Google Scholar] [CrossRef]
  14. Argiz, C.; Menéndez, E.; Moragues, A.; Sanjuán, M.A. Fly ash characteristics of Spanish coal-fired power plants. Afinidad 2015, 72, 269–277. [Google Scholar]
  15. Fernández-Jiménez, A.; Palomo, A. Composition and microstructure of alkali activated fly ash binder: Effect of the activator. Cem. Concr. Res. 2005, 35, 1984–1992. [Google Scholar] [CrossRef]
  16. De Silva, P.; Sagoe-Crenstil, K.; Sirivivatnanon, V. Kinetics of geopolymerization: Role of Al2O3 and SiO2. Cem. Concr. Res. 2007, 37, 512–518. [Google Scholar] [CrossRef]
  17. İlkentapar, S.; Atiş, C.D.; Karahan, O.; Avşaroğlu, E.G. Influence of duration of heat curing and extra rest period after heat curing on the strength and transport characteristic of alkali activated class F fly ash geopolymer mortar. Constr. Build. Mater. 2017, 151, 363–369. [Google Scholar] [CrossRef]
  18. Khale, D.; Chaudhary, R. Mechanism of geopolymerization and factors influencing its development: A review. J. Mater. Sci. 2007, 42, 729–746. [Google Scholar] [CrossRef]
  19. Criado, M.; Fernández-Jiménez, A.; Palomo, A. Alkali activation of fly ash. Part III: Effect of curing conditions on reaction and its graphical description. Fuel 2010, 89, 3185–3192. [Google Scholar] [CrossRef]
  20. Duxson, P.; Fernández-Jiménez, A.; Provis, J.L.; Lukey, G.C.; Palomo, A.; Van Deventer, J.S.J. Geopolymer technology: The current state of the art. J. Mater. Sci. 2007, 42.9, 2917–2933. [Google Scholar] [CrossRef]
  21. Criado, M.; Fernández-Jiménez, A.; De La Torre, A.G.; Aranda, M.A.G.; Palomo, A. An XRD study of the effect of the SiO2/Na2O ratio on the alkali activation of fly ash. Cem. Concr. Res. 2007, 37, 671–679. [Google Scholar] [CrossRef]
  22. Fernández-Jiménez, A.; Palomo, A.; Sobrados, I.; Sanz, J. The role played by the reactive alumina content in the alkaline activation of fly ashes. Microporous Mesoporous Mater. 2006, 91, 111–119. [Google Scholar] [CrossRef]
  23. Somna, K.; Jaturapitakkul, C.; Kajitvichyanukul, P.; Chindaprasirt, P. NaOH-activated ground fly ash geopolymer cured at ambient temperature. Fuel 2011, 90, 2118–2124. [Google Scholar] [CrossRef]
  24. Görhan, G.; Kürklü, G. The influence of the NaOH solution on the properties of the fly ash-based geopolymer mortar cured at different temperatures. Compos. Part B Eng. 2014, 58, 371–377. [Google Scholar] [CrossRef]
  25. Atiş, C.D.; Görür, E.B.; Karahan, O.; Bilim, C.; Ilkentapar, S.; Luga, E. Very high strength (120 MPa) class F fly ash geopolymer mortar activated at different NaOH amount, heat curing temperature and heat curing duration. Constr. Build. Mater. 2015, 96, 673–678. [Google Scholar] [CrossRef]
  26. Erdoğdu, K.; Türker, P. Effects of fly ash particle size on strength of Portland cement fly ash mortars. Cem. Concr. Res. 1998. 28, 1217–1222. [CrossRef]
  27. Van Jaarsveld, J.G.S.; Van Deventer, J.S.J.; Lukey, G.C. The characterization of source materials in fly ash-based geopolymers. Mater. Lett. 2003, 57, 1272–1280. [Google Scholar] [CrossRef]
  28. Kumar, S.; Kumar, R. Mechanical activation of fly ash: Effect on reaction, structure and properties of resulting geopolymer. Ceram. Int. 2011, 37, 533–541. [Google Scholar] [CrossRef]
  29. Temuujin, J.; Williams, R.P.; Van Riessen, A. Effect of mechanical activation of fly ash on the properties of geopolymer cured at ambient temperature. J. Mater. Proc. Technol. 2009, 209, 5276–5280. [Google Scholar] [CrossRef]
  30. Sun, Z.; Vollpracht, A. Isothermal calorimetry and in-situ XRD study of the NaOH activated fly ash, metakaolin and slag. Cem. Concr. Res. 2018, 103, 110–122. [Google Scholar] [CrossRef]
  31. Mucsi, G.; Kumar, S.; Csőke, B.; Kumar, R.; Molnár, Z.; Rácz, Á.; Debreczeni, Á. Control of geopolymer properties by grinding of land filled fly ash. Int. J. Miner. Process. 2015, 143, 50–58. [Google Scholar] [CrossRef]
  32. Fernández-Jiménez, A.; Palomo, A. Mid-infrared spectroscopic studies of alkali-activated fly ash structure. Microporous Mesoporous Mater. 2005, 86, 207–214. [Google Scholar] [CrossRef]
  33. Lee, W.K.W.; Van Deventer, J.S.J. Structural reorganisation of class F fly ash in alkaline silicate solutions. Colloids Surf. A Physicochem. Eng. Asp. 2002, 211, 49–66. [Google Scholar] [CrossRef]
  34. Guo, X.; Shi, H.; Dick, W.A. Compressive strength and microstructural characteristics of class C fly ash geopolymer. Cem. Concr. Compos. 2010, 32, 142–147. [Google Scholar] [CrossRef]
  35. Bakharev, T. Geopolymeric materials prepared using Class F fly ash and elevated temperature curing. Cem. Concr. Res. 2005, 35, 1224–1232. [Google Scholar] [CrossRef]
  36. Cao, J.; Dong, X.; Li, L.; Dong, Y.; Hampshire, S. Recycling of waste fly ash for production of porous mullite ceramic membrane supports with increased porosity. J. Eur. Ceram. Soc. 2014, 34, 3181–3194. [Google Scholar] [CrossRef]
  37. Watanabe, T.; Fujiwara, H.; Noguchi, H.; Hoshino, T.; Ohdomari, I. Novel interatomic potential energy function for Si, O mixed systems. Jpn. J. Appl. Phys. 1999, 38, L366. [Google Scholar] [CrossRef]
  38. Fernández-Jiménez, A.; Palomo, A. Characterisation of fly ashes. Potential reactivity as alkaline cements. Fuel 2003, 82, 2259–2265. [Google Scholar] [CrossRef]
  39. Gadsden, J.A. Infrared Spectra of Minerals and Related Inorganic Compounds; Butterworths: London, UK, 1975; p. 277. ISBN 0408706651. [Google Scholar]
  40. Criado, M.; Fernández-Jiménez, A.; Palomo, A. Alkali activation of fly ash: Effect of the SiO2/Na2O ratio: Part I: FTIR study. Microporous Mesoporous Mater. 2007, 106, 180–191. [Google Scholar] [CrossRef]
  41. Xu, H.; Van Deventer, J.S. Effect of source materials on geopolymerization. Ind. Eng. Chem. Res. 2003, 42, 1698–1706. [Google Scholar] [CrossRef]
  42. Chindaprasirt, P.; Jaturapitakkul, C.; Chalee, W.; Rattanasak, U. Comparative study on the characteristics of fly ash and bottom ash geopolymers. Waste Manag. 2009, 29, 539–543. [Google Scholar] [CrossRef] [PubMed]
  43. Provis, J.L.; Van Deventer, J.S.J. Geopolymers: Structures, Processing, Properties and Industrial Applications; Elsevier: Amsterdam, The Netherlands, 2009; p. 454. ISBN 978-1845694494. [Google Scholar]
  44. Kupwade-Patil, K.; Soto, F.; Kunjumon, A.; Allouche, E.N.; Mainardi, D.S. Multi-scale modeling and experimental investigations of geopolymeric gels at elevated temperatures. Comput. Struct. 2013, 122, 164–177. [Google Scholar] [CrossRef]
  45. Bakharev, T. Durability of geopolymer materials in sodium and magnesium sulfate solutions. Cem. Concr. Res. 2005, 35, 1233–1246. [Google Scholar] [CrossRef]
  46. Suksiripattanapong, C.; Horpibulsuk, S.; Chanprasert, P.; Sukmak, P.; Arulrajah, A. Compressive strength development in fly ash geopolymer masonry units manufactured from water treatment sludge. Constr. Build. Mater. 2015, 82, 20–30. [Google Scholar] [CrossRef]
  47. Rodríguez, E.; Mejía, R.; Bernal, S.; Gordillo, M. Effect of the SiO2/Al2O3 and Na2O/SiO2 ratios on the properties of geopolymers based on MK. Rev. Fac. Ing. Univ. Antioq. 2009, 49, 30–41. [Google Scholar]
  48. Rees, C.A.; Provis, J.L.; Lukey, G.C.; Van Deventer, J.S. Attenuated total reflectance Fourier transform infrared analysis of fly ash geopolymer gel aging. J. Langmuir. 2007, 23, 8170–8179. [Google Scholar] [CrossRef] [PubMed]
  49. Palomo, A.; Grutzeck, M.W.; Blanco, M.T. Alkali-activated fly ashes: A cement for the future. Cem. Concr. Res. 1999, 29, 1323–1329. [Google Scholar] [CrossRef]
  50. Liu, S.; Liu, J.; Du, H.; Hou, F.; Ren, S.; Geng, H. Structure formation process, heat-insulation property and cyclic compression–resilience performance of mullite fibres/whiskers frameworks. RSC Adv. 2014, 4, 9451–9456. [Google Scholar] [CrossRef]
  51. Fernández-Jiménez, A.; Palomo, A.; Criado, M. Microstructure development of alkali-activated fly ash cement: A descriptive model. Cem. Concr. Res. 2005, 35, 1204–1209. [Google Scholar] [CrossRef]
Figure 1. Particle size distribution of FA-1, FA-2, and FA-3.
Applsci 08 00365 g001
Figure 2. Analysis of FA-1, FA-2, and FA-3 by: (a) X-ray diffraction (Q: quartz, M: mullite); (b) FT-IR spectroscopy.
Applsci 08 00365 g002
Figure 3. X-ray diffraction pattern of geopolymers (Q; quartz, M; mullite, f; faujasite, z; type Y-Zeolite, c; sodium carbonate).
Applsci 08 00365 g003
Figure 4. FT-IR spectra of FA-1 and obtained geopolymers at different curing days.
Applsci 08 00365 g004
Figure 5. Intensities ratio of faujasite and type Y-zeolite phases obtained by X-ray diffraction.
Applsci 08 00365 g005
Figure 6. FT-IR deconvolution spectra in the range of 1350–850 cm−1 (geopolymers at 7 curing days).
Applsci 08 00365 g006
Figure 7. FT-IR deconvolution spectra in the range of 1350–850 cm−1 (geopolymers at 14 curing days).
Applsci 08 00365 g007
Figure 8. FT-IR deconvolution spectra in the range of 1350–850 cm−1 (geopolymers at 28 curing days).
Applsci 08 00365 g008
Figure 9. Geopolymerization by displacements (in %) of the FT-IR band (1200–850 cm), considering that the G3-28 sample has 100% and the G1-7 sample has 0% of geopolymerization.
Applsci 08 00365 g009
Figure 10. SEM micrographs of: (a) FA-1, (b) G1-28, (c) G2-28, (d) G3-28.
Applsci 08 00365 g010
Table 1. Chemical composition of fly ash.
CompositionSiO2Al2O3Fe2O3CaOMgOK2ONa2OSO3TiO2LOI *
% by weight56.926.245.564.250.721.210.3460.711.212.47
* Loss on ignition.
Table 2. Specific surface area of FA-1, FA-2, and FA-3.
SampleSpecific Surface Area (m2/kg)
FA-1975
FA-21107
FA-31371
Table 3. Characteristic IR vibrational bands of geopolymers [43].
Band (cm−1)ColorAssignment
1230–1250Asymmetric stretching (Si-O-Si and Al-O-Si)
1150–1200Asymmetric stretching (Si-O-Si)
1050–1150Asymmetric stretching of amorphous phase (Si-O-Si and Al-O-Si)
980–1030Asymmetric stretching of N-A-S-H gel (Si-O-Si and Al-O-Si)

