Simplified Modeling Strategy for the Thermomechanical Analysis of Massive Reinforced Concrete Structures at an Early Age


1
CNRS, Univ. Grenoble Alpes, Grenoble INP, 3SR, F-38000 Grenoble, France
2
INSA-Lyon, Univ. Lyon, GEOMAS, F-69621 Villeurbanne CEDEX, France
*
Author to whom correspondence should be addressed.
Appl. Sci. 2018, 8(3), 448; https://doi.org/10.3390/app8030448
Submission received: 22 January 2018
/
Revised: 20 February 2018
/
Accepted: 1 March 2018
/
Published: 15 March 2018
(This article belongs to the Special Issue Modelling of Early Age Cracking Risks and Serviceability of Concrete Structures)
Abstract
:Featured Application
This work is intended to provide the tools needed for predicting the behavior of massive concrete structures in order to better control early-age cracking.
Abstract
The objective of this work is to propose a comprehensive and efficient modeling approach to simulate the entire loading program of the RG8 test (both the restrained shrinkage and mechanical parts) performed within the framework of the French national program CEOS.fr. This effort was made possible by introducing a multi-fiber beam discretization that included a thermomechanical model coupled with a unilateral concrete damage model. Due to the massiveness of the test structure, the scale effect needed to be taken into account. This step could be accomplished through use of a Weibull law. Extensive results were obtained during the experiment, some of which focused on deformations and forces developed in the structure by restrained shrinkage, the times of crack appearance and opening, and the consequences of damage sustained on the residual mechanical performance of the beam. A comparison with calculation output has demonstrated the ability of our modeling approach to simulate phenomena at both global and local levels, thus confirming the relevance of model choices made.
1. Introduction
Research conducted in France within the scope of the CEOS.fr national program has highlighted the importance of taking into account, as of the design stage, Thermo-Hydro-Mechanical (THM) effects in massive structures. These effects cause premature cracking that can significantly undermine the durability and mechanical responses of such structures [1].
The CEOS.fr program included experiments on large test samples that were used to adopt an international benchmark devoted to modeling the test beam behavior. An interactive workshop—called “ConCrack2”—was held in June 2011; its results were published in a report [2], excerpts of which appeared in a special issue of the EJECE journal [3].
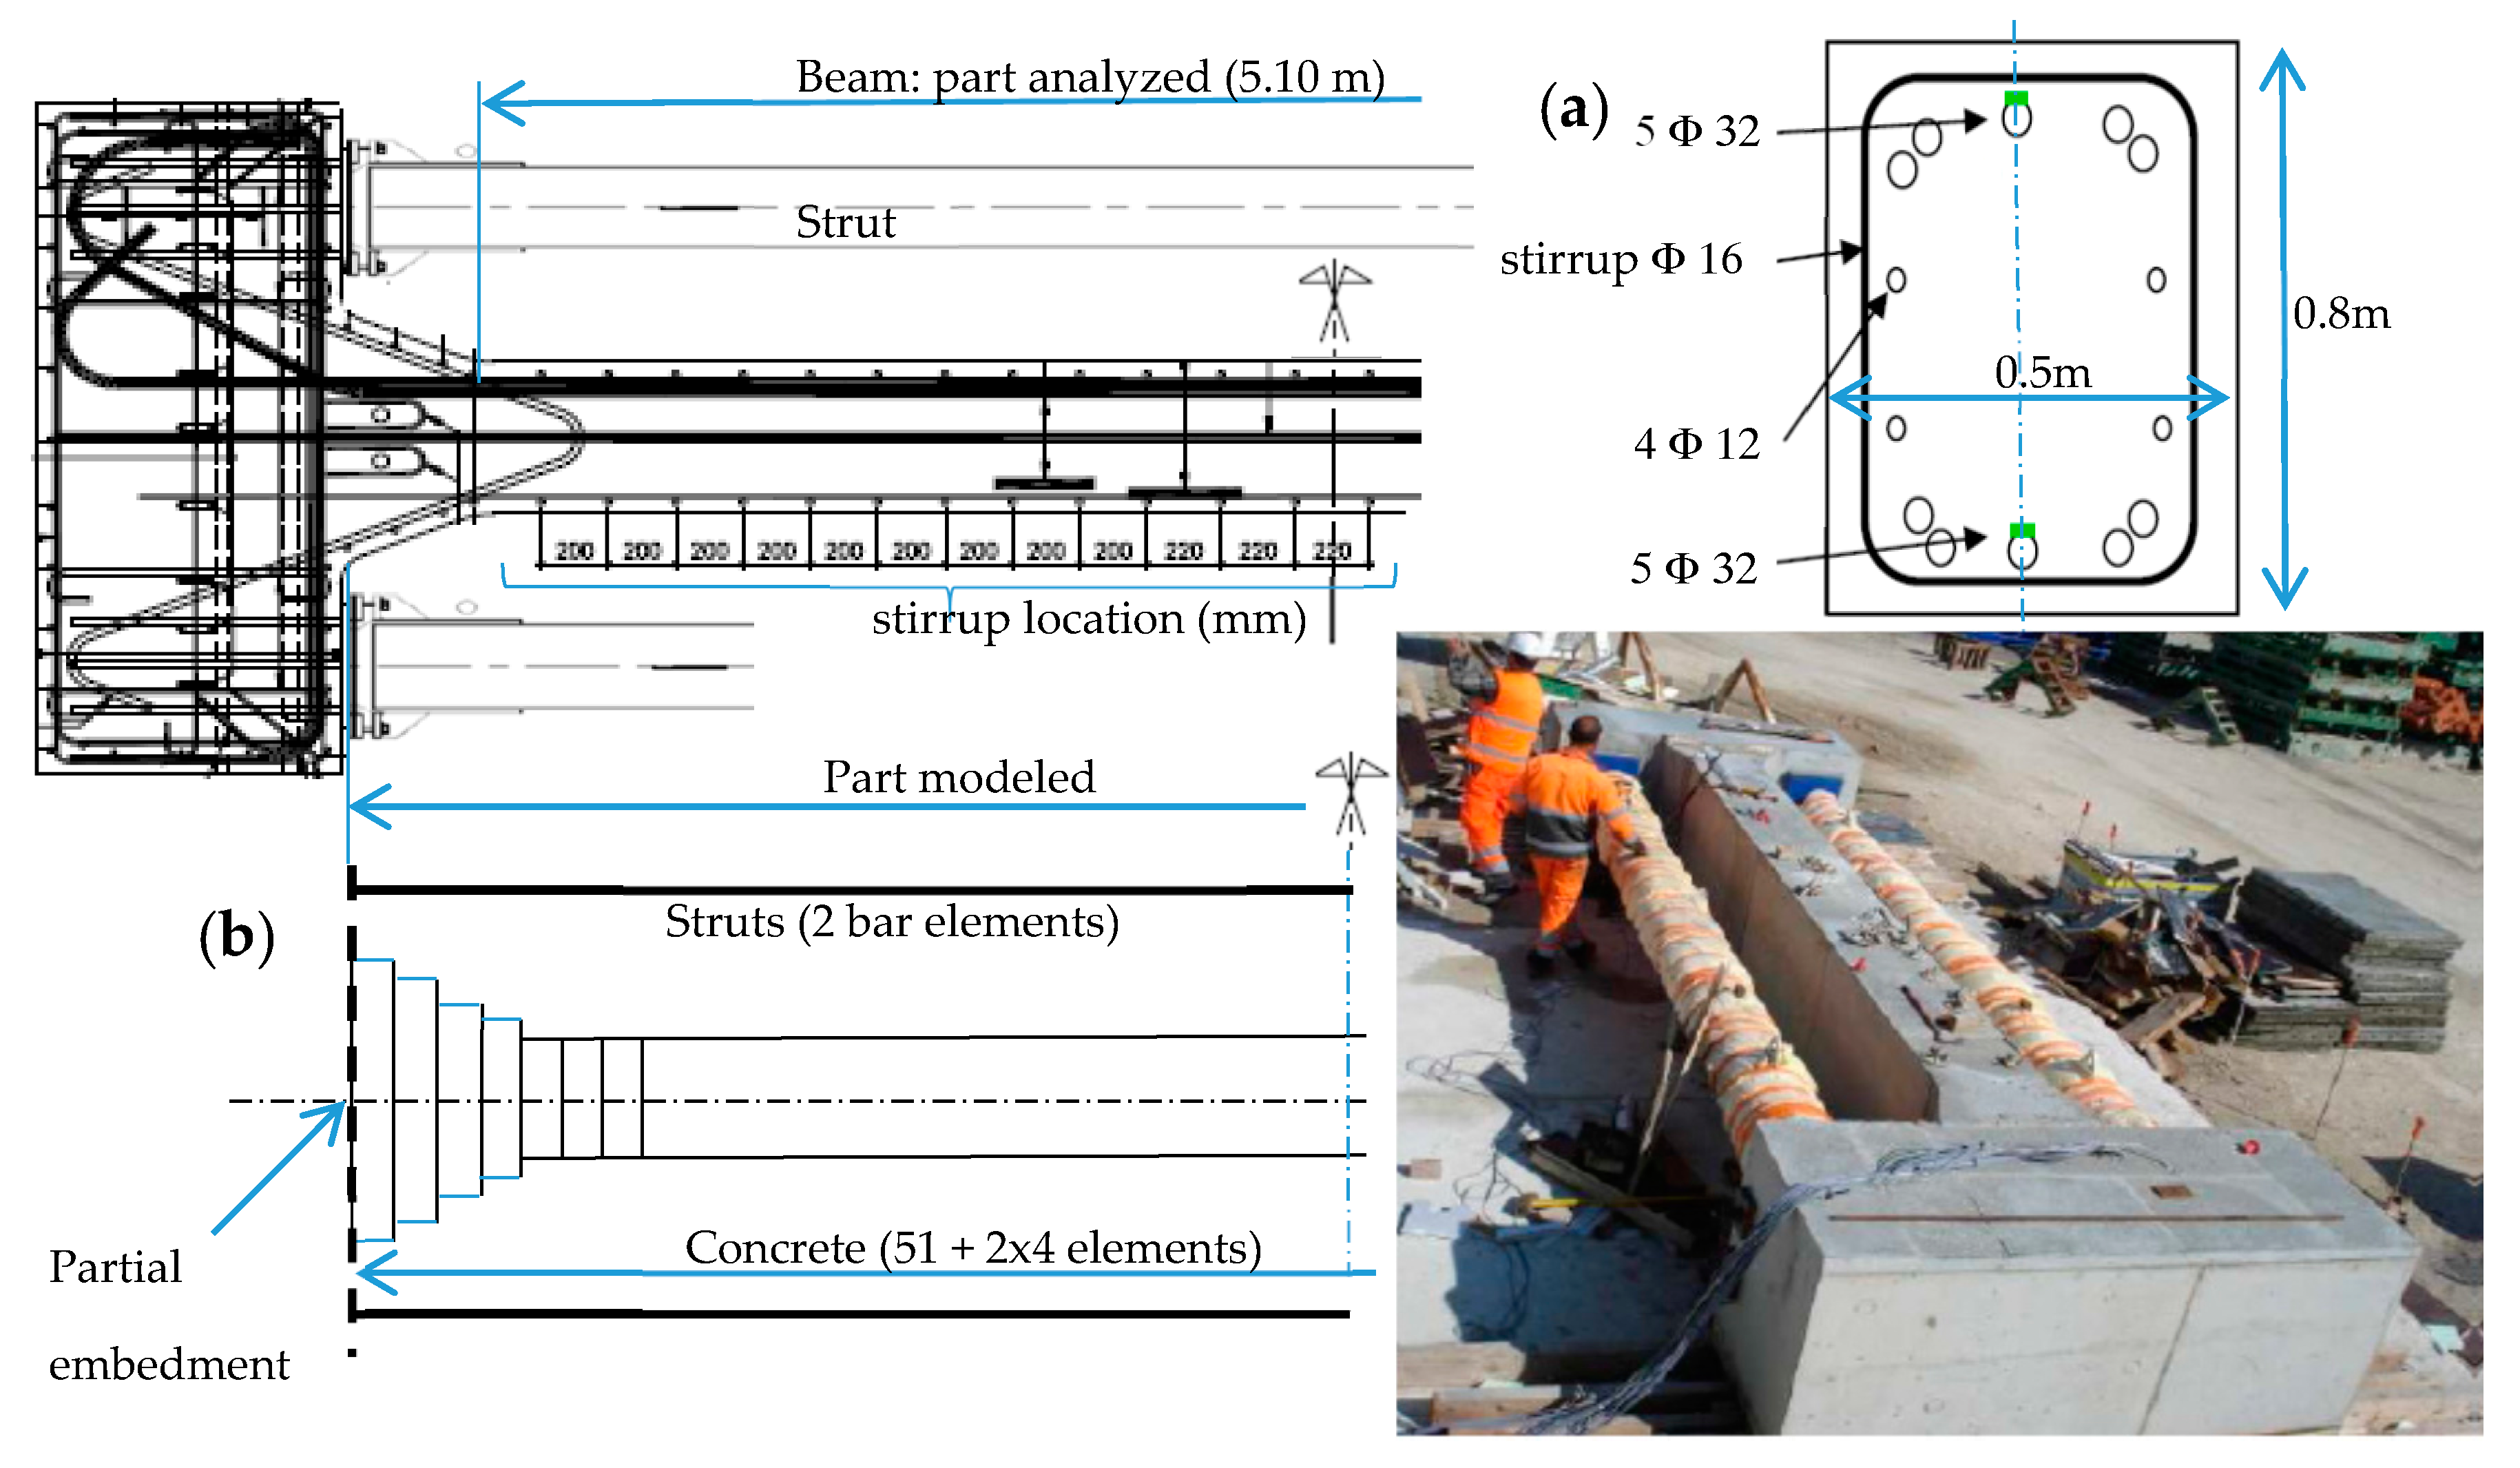
The experimental program featured beams under restrained shrinkage during concrete maturation, through use of two steel struts (RG8 test, see Figure 1). Based on a set-up with extensive instrumentation, measurements were continuously performed for several weeks after casting and, during a second phase, the beam was tested in bending in order to determine process-related THM effects on the mechanical performance of the structure (global stiffness, strength, etc.).
The purpose of the present study is to propose a comprehensive and efficient modeling tool in order to simulate the entire loading program of the RG8 test. As demonstrated by the benchmark participants [2], the problem to be solved encompasses many coupled phenomena (temperature increase, gradual concrete maturation, creep, restrained shrinkage effects, etc.). Treated by means of a classical FEM description, this approach entails a highly sophisticated numerical simulation [4]. In an effort to drastically reduce the size of the model, the present contribution makes use of a simplified description based on a multi-fiber beam discretization. Such a discretization step has already been proposed by [5] in order to model a massive reinforced concrete beam that is undergoing mechanical loading after free shrinkage. This step has proven its relevance; hence, we are pursuing herein its application to the case of restrained shrinkage. The multi-fiber description includes a THM model [6] coupled with a unilateral concrete damage model [7]. For massive structures, the CEOS.fr program has focused on the need to treat the scale effect. Such a treatment is undertaken herein through the application of a Weibull law that transposes the measured mechanical characteristics of concrete from a standardized test piece (height 32 cm, diameter 16 cm) to the scale of the test beam (5.10 m × 0.8 m × 0.5 m) [8].
In this framework, an in-depth comparison between experimental and numerical results obtained during the RG8 test is presented in this paper. More specifically, we are interested in deformations and forces developed in the structure by restrained shrinkage, the times of crack appearance and opening, and the consequences of damage sustained on the residual mechanical performance of the beam. A wide array of results were found to be of critical engineering importance for the crack control of concrete structures.
2. The RG8 Test
Several specimen geometries have been introduced to assess the restrained shrinkage-cracking behavior of concrete materials. On the one hand, at the material scale, the ring test has been used on numerous occasions [6,9], while on the other hand, with regard to structures, some tests have focused in particular on beams or slabs in order to study the role of the substratum on crack development [10,11]. These tests, however, have generally been carried out on smaller-sized elements. For this reason, the CEOS.fr program has targeted the study of large-scale specimens with well identified boundary conditions and accurate crack pattern monitoring (see [2,3] for details).
Blocks Subjected to Restrained Shrinkage
Three blocks (RG8, RG9 and RG10) were designed to study the restrained shrinkage of massive concrete structures at an early age. Produced using the same concrete (C50/60), RG8 served as the reference, while RG10 used a thicker concrete cover (5 cm instead of 3 cm) and the RG9 reinforcement ratio was reduced (to 0.56% instead of 2%).
The RG specimens were divided into three parts (Figure 1):
- A central block (5.10 m × 0.80 m × 0.50 m), plus a 0.4-m transition zone on each side with a gradual increase in the width. The reinforcement map is given in Figure 1a; in the cross-section, it includes a combination of 32-mm diameter (10) and 12-mm diameter (4) reinforcements; stirrups are 16 mm in diameter, and they are spaced at 200 mm.
- Two heads (0.9 m × 2.2 m × 0.9 m) serve to support the struts described below;
- Two steel struts fastened on the two heads to restrain strain evolution, as shown in the picture in Figure 1.
Due to hydration effects, the evolution in both temperature and shrinkage was substantial in such a massive structural element. The purpose here is to show how this evolution, in a situation where shrinkage is restrained, promotes the formation of cracks prior to any external mechanical loading. The two steel struts restrain shrinkage of the central part of the beam and, consequently, cause cracking at an early age.
3. Models
3.1. Multi-Fiber Beam Modeling
To decrease the number of degrees of freedom, 3D Timoshenko multi-fiber beam elements were used [12]. The main advantage of such a description lies in the fact that the behavior is based on a 1D nonlinear model for both the concrete and rebar. Compared to a classical 3D FEM, this technique significantly reduces the size of the problem; on the other hand, however, the kinematic constraints must be assured between two successive elements so that displacement remains continuous and sections remain plane during loading.
Concrete: The useful part (5.1 m) was modeled using 51 elements 0.10 m in length. The section was divided into 5 × 8 fibers 0.10 m to a side. The beam was completed on both sides by a part with a variable cross-section up to the strut support. The heads of the beam are not represented. However, their presence creates a mechanical effect on the discretized part (Figure 1b), which results in a moment applied on both sides of the beam (partial embedment), as evaluated from knowledge of the geometry of these heads and the position of beam supports that alter dead load effects during the experiment.
Reinforcements: Only the longitudinal reinforcements are represented by bar elements, placed in accordance with the reinforcement mapping of the beam (Figure 1a).
Struts: These elements are depicted with bar elements with respect to the characteristics of the actual struts (0.32-m diameter tube with a total stiffness of 3.25 GN/m). Struts and rebar are connected to the same embedment as the concrete beam.
3.2. Models for Concrete
As mentioned above, the early-age phenomena are strongly coupled. The following phenomena are distinguished herein:
- Concrete maturation;
- Evolution of mechanical performance with maturation;
- Autogenous shrinkage of concrete;
- Basic creep of concrete;
- Thermal deformation of both concrete and steel;
- Elasto-damaging behavior of concrete;
- Elastoplastic behavior of reinforcements;
Moreover, analyzing the concrete mass structure requires taking into consideration the scale effects on concrete behavior.
3.2.1. Early-Age Thermal Model
Hydration is a thermo-activated phenomenon. The structure thus heats up under the effect of internal heat sources, especially due to its massive nature. Exhaustion of the reaction and exchanges with the outside cause the structure to cool until reaching equilibrium. At the same time, the material is subject to various volumetric variations, and the mechanical performance of the material improves.
At this stage, two major assumptions were adopted:
- the thermal problem was treated independently from the mechanical problem;
- temperature variations were assumed to be identical in each section of the beam (independence with respect to the longitudinal axis x).
Heat evolution
The three following primary equations in this problem [6] must now be solved:
- The energy balance equation:
= dx/dt, in which T is the temperature (in °K), k the thermal conductivity (W·m−1·K−1), L the latent hydration heat (J·m−3), and C the volumetric thermal capacity (J·m3·K−1).
- ξ is the degree of hydration, as given by the Arrhenius equation:
Ea is the activation energy (J·mol−1), R the ideal gas constant (R = 8.3145 J·K−1·mol−1), and A(ξ) the chemical affinity (s−1).
ξ evolves between ξ0, the percolation threshold (close to 0), and ξ∞, the degree of hydration upon completion of the hydration reaction. To describe the corresponding state of the medium, the maturity M is introduced [13]:
< >+ is the positive part operator. M evolves between 0 (beginning of the process) and 1 (end of hydration).
In introducing the maturity concept into the expression derived by Sciumé et al. [14], the chemical affinity, A(ξ), is given by:
Ai is the initial affinity, ζ governs the deceleration phase of the hydration process, and Ap is the maximum value of the affinity function attained for M = Mp.
- The external exchange is solved as follows:
ϕ is the heat flux (W·m−2), n the vector normal to the surface, Ts the surface temperature (K), and Text the external temperature (K). h is the exchange coefficient whose value changes when the mold is removed from 2, calculated by taking into account the insulation produce by the formwork, to 10 W·m−2·K−1 [15].
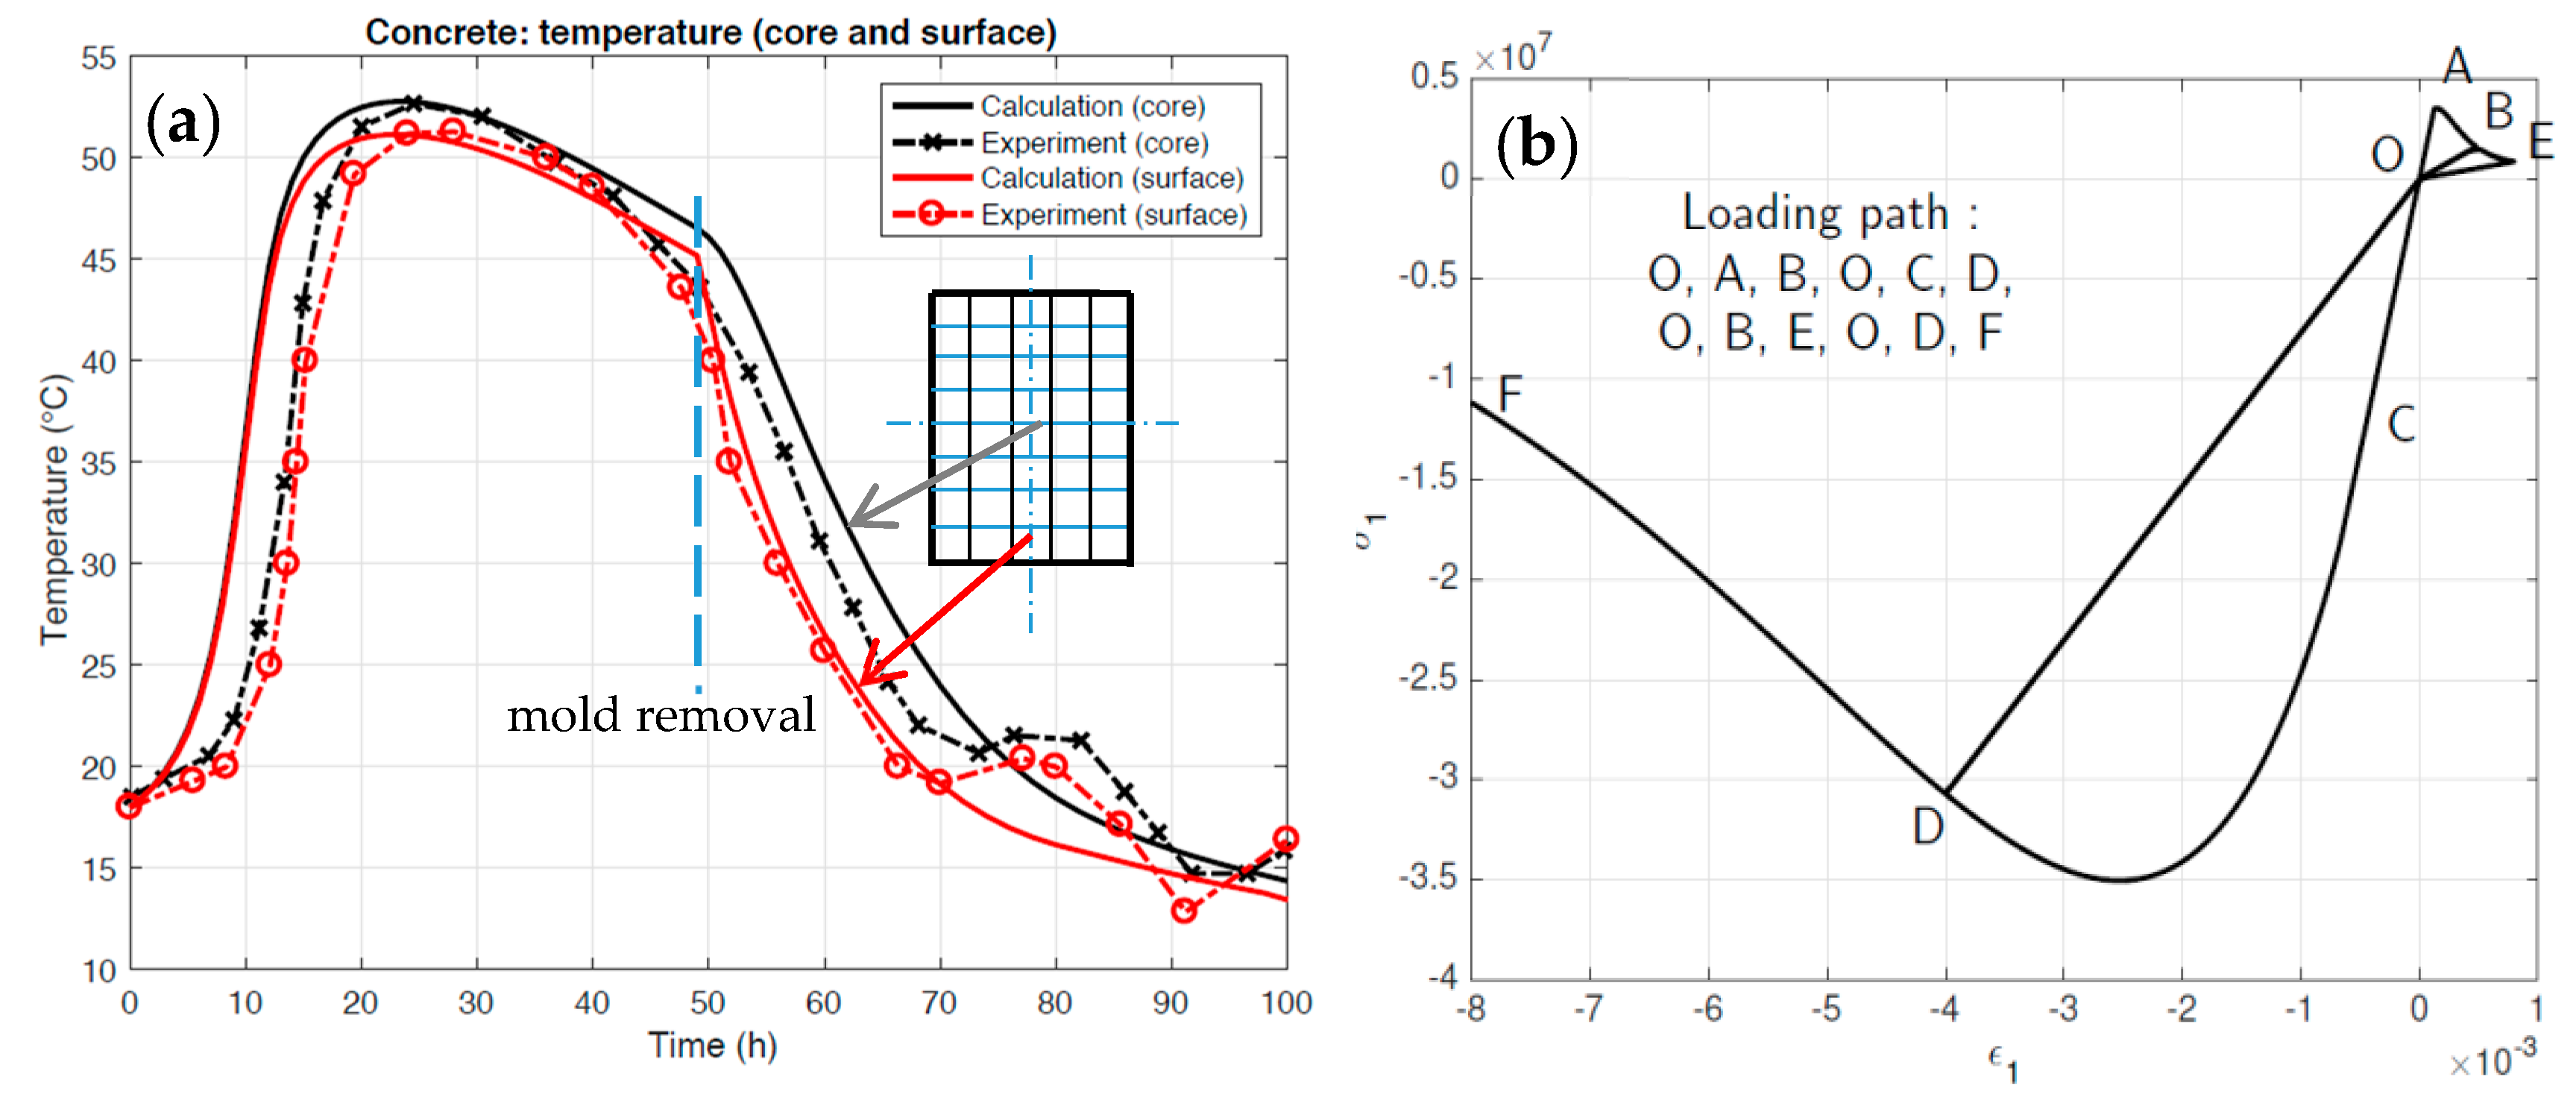
Figure 2a shows the results obtained after identifying the parameters (see Appendix A, Table A1 for their numerical values) involved in the temperature evolution both at the beam center and near the surface. A good level of agreement is obtained with the measurements performed in situ.
3.2.2. Mechanical Model
This modeling step is based on use of the μ damage model [7]. Due to the use of Timoshenko multi-fiber beams, this model is applied in its 1D version. Within this framework, the associated equations are, respectively, for tension and compression:
in which Yt = Max(ε0t, max εt), with ε0t being the tensile strain threshold, Yc = Max(ε0c, max(−εc)), with ε0c being the compressive strain threshold. Generally speaking, ε0t corresponds to the tensile strain at peak (ft), which then allows writing: ε0t = ft/E.
The post-peak in tension is calibrated using the so-called Hillerborg method [16], in the context of using multi-fiber beam elements, for which it was demonstrated that damage is typically diffuse for reinforced concrete structures [7]. Moreover:
The definition of Gf was derived from [17,18]. εf is the fracturing strain and c the mean crack spacing, as estimated here close to the stirrup spacing, i.e., 200 mm (this assumption has been verified by the experimental results presented in Section 4.2.3.).
Figure 2b shows the corresponding uniaxial response with a specific loading path, from OAB in tension to ODF in compression, while highlighting the range of evolution in stiffness due to crack opening and closure (i.e., the unilateral effect).
3.2.3. Thermo-Chemo-Mechanical Coupling
The mechanical performance of concrete gradually increases with the hydration process. Given in Equation (3), maturity M describes the state of evolution of the medium. When ξ = ξ0, the percolation threshold (assumed to lie close to 0) M = 0; moreover, when ξ = ξ∞, the degree of hydration upon completion of the reaction (as calculated from the w/c ratio of the concrete mix thanks to the relation proposed by [19]) M = 1.
In this framework, M is utilized in a simple way to forecast:
- Young’s modulus: E(M) = ME∞, with E∞ being the value when M = 1 (mature concrete);
- Concrete tensile strength: ft(M) = E(M). ε0t (ε0t is assumed to be constant regardless of the maturity).
These relations constitute a specific case of those proposed by [20]. From this set-up, it is now easy to describe the nonlinear material behavior.
With i = t in tension and i = c in compression, the following can be written:
3.2.4. Scale Effect
In accordance with Weibull theory, it was showed in [8] that the tensile strain threshold for a uniform tension is , in which m is the Weibull coefficient, and W0 is a material parameter. The ratio between the tensile threshold value stemming from a laboratory test (volume Vtd) and the tensile threshold required to be used on the RG8 test is then given by:
From a study on various concretes, a relation tying the compressive strength (fc) with the Weibull parameter was proposed in [21]. In the present case, in which fc = 63.5 MPa, m is estimated to be equal to 13.5. As deduced from (10) and the tensile strength value (ftd = ε0tE) obtained on a conventional cylindrical sample (i.e., diameter: 0.16 m, height: 0.32 m), the ratio between the tensile strengths (ftd/ftRG8) is therefore equal to roughly 1.55. The tests employed in the present study, however, are splitting tests on same-sized cylindrical samples. A recent study [22] using the concept of high-strength volume (HSV, [23]) has shown that the equivalent tensile volume in such a splitting test amounts to close to 4% of the total sample volume. From the Weilbull approach, it can thus be deduced that the tensile strength, which must be introduced into the RG8 test, equals approximately half the nominal splitting strength (2.2 MPa vs. 4.6 MPa).
3.2.5. Global Description of the Problem
This description is based on the following strain superposition [6]:
From this premise, the global behavior can be written:
is the effective stress. = σ/(1 − d), and then (12) has introduced damage into the whole process. εth and εau are the thermal strain and the autogenous shrinkage respectively:
α being the thermal dilation coefficient (K−1) and κ∞ being the final value of shrinkage (μm/m).
Creep is described by a series of three Kelvin-Voigt models, whose behavior is given by:
εbc is the basic creep. is the characteristic time of a given Kelvin-Voigt model, with:
kbc_∞ is the final stiffness, when M = 1.
4. Application to the RG8 Test
For the various equations presented in the previous section and from laboratory tests conducted on samples, the various parameters identified are listed in Table A1, Appendix A.
4.1. Thermo-Chemo-Mechanical Loading
Loading is correlated first and foremost with temperature evolution, which pertains to both concrete and the reinforcements. Two main stages have been observed:
- From 0 to 120 h, the temperature variation is mostly due to hydration effects. Thanks to the energy balance Equation (1), this evolution has been evaluated; Figure 2a shows good agreement with the in situ experimental measurements both at the center and near the surface of the beam section;
- From 120 h to 700 h (i.e., the time corresponding to strut removal), the temperature variation is mainly due to external temperature evolution (day-night changes). Due to the massiveness of the beam, this change only concerns material close to the surface and, for the sake of simplification, the calculation has been performed with a constant temperature of 12 °C. At the same time, the struts are sensitive to the day-night temperature differential. The cycle lasts 24 h, and in accordance to the measured temperature, the discrepancy is assumed to lie between 9° and 15 °C.
4.1.1. Shrinkage and Creep
Like for temperature, due to the massiveness of the structure and the relatively compressed experimental period (1 month), drying has not been considered for the structure.
In this context, from laboratory tests performed on cylindrical samples (height 32 cm, diameter 16 cm, details are given in the report [24]):
- Autogenous shrinkage was calibrated in order to obtain κ∞ (Equation (14)).
- From compression tests loaded at 2 days and 7 days, the basic creep model (Equations (15) and (16)) was also calibrated (see results in Appendix A, Table A1). In order to optimize coverage of the entire test duration, the characteristic times of the three K-V models were: τ1 = 0.1 day, τ2 = 1 day, and τ3 = 10 days.
4.1.2. Maturity and Mechanical Performance of Concrete
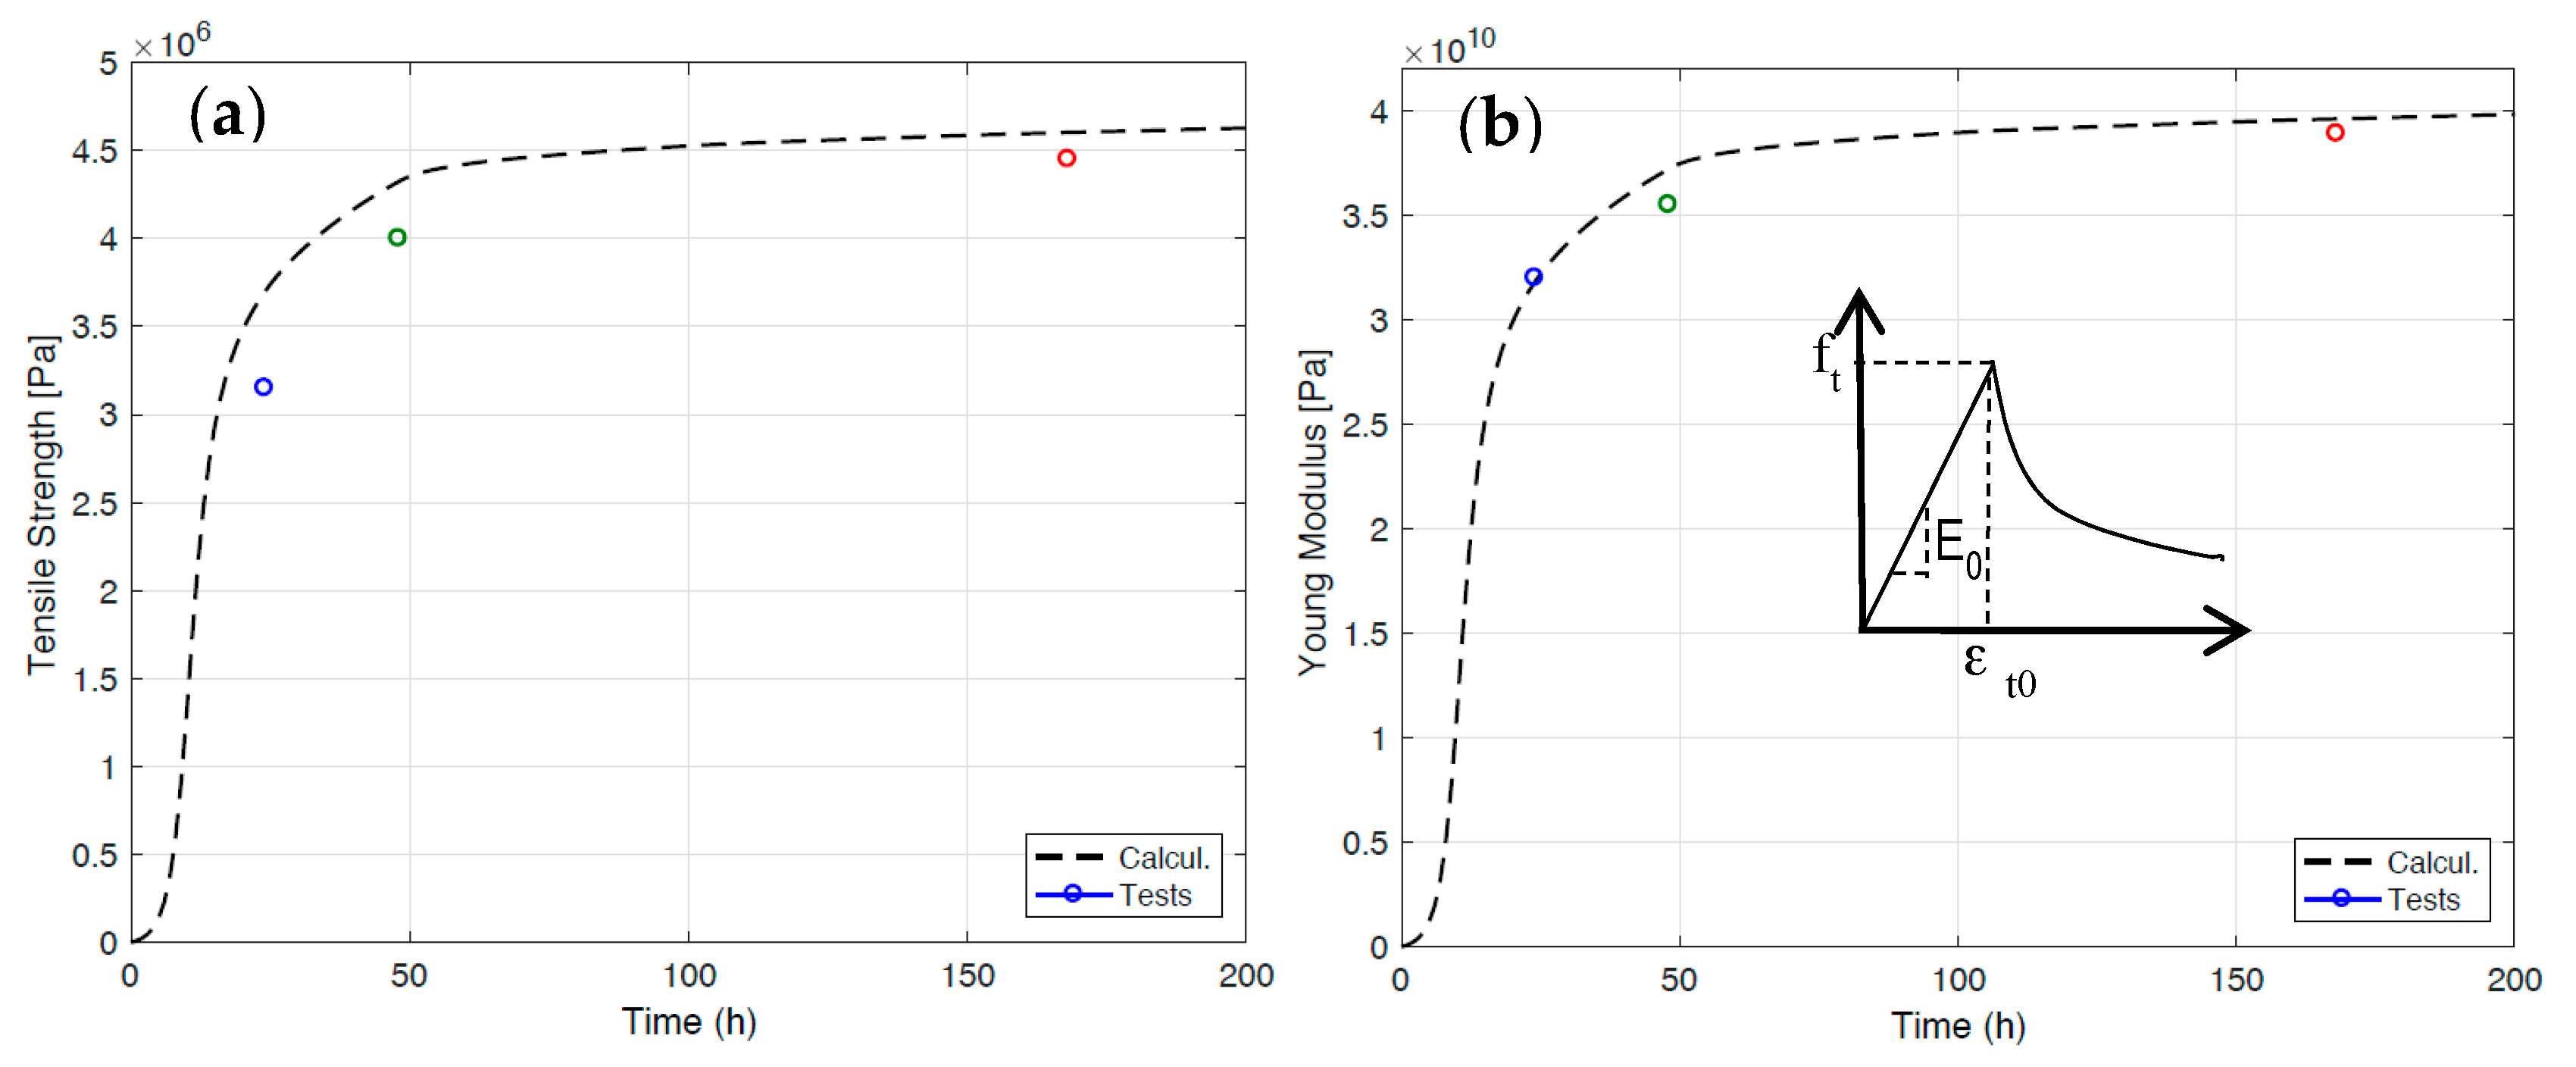
From Equations (2) and (3) and the temperature evolution, M(t) is calculated. From Equation (9), Young’s modulus and tensile strength can both be determined at a given time. As shown in Figure 3, the results obtained are in close agreement with those derived from tests performed on concrete samples.
4.1.3. Mechanical Loading
From 0 to 700 h, as shown in Figure 4 (red curves), the struts were loaded, in tension during the first 50 h due to the thermal dilation of concrete and then in compression due to concrete shrinkage. At the same time, the struts were submitted to the external temperature change: a 24-h cyclic evolution with an average value of 12 °C and an amplitude of 6 °C (smoothing of the actual curves). From the time of mold removal (Figure 2a), the gravity load was assumed to be active along the entire beam.
At 700 h, the struts were removed, and a few days later the beam was tested on a test bench. The supports were spaced 5.1 m apart and located at the end of the beam part where the cross-section was constant. A four-point bending load was used, with 1.6 m spacing between the loads, as shown in Section 4.2.3).
4.2. Results
Due to the complexity of the phenomena involved, many results were obtained, but only the main ones are presented herein. The full set of experimental results can be found in [24,25]. As indicated above, the structure has been extensively instrumented. This set-up made it possible to accurately track the evolution in 3 specific cross-sections in the center and on both sides of the beam at roughly 1 m from the central section. The following results pertain to these sections, which were instrumented with strain gauges on the rebar, vibrating wires close to the upper and lower surfaces, and 3 optical fibers distributed on a median plane of the beam covering 2.5 m of its central zone.
4.2.1. From 0 to 120 h: Maturation and Cracking Period
Relative forces developed in the central section—Within a given cross-section, three main structural elements were considered: concrete, rebar, and struts. From the strain gauges located on the rebar, and assuming that they remain elastic, it is straightforward to deduce the stress acting at a given time on each element, from which the force Frb absorbed by the set of reinforcements within a given section can be deduced. Strain gauges were also placed on the struts. With knowledge of the strut surface area, the force Fst being exerted on them can also be deduced. At a given time, each cross-section is in equilibrium. From this balance, the force Fc supporting the concrete section can be deduced as:
in which Es is the Young’s modulus for steel, Ai and εi are, respectively, the area and strain on rebar i I, and Ast and εst are, respectively, the cross-sectional area of each strut and corresponding strain.
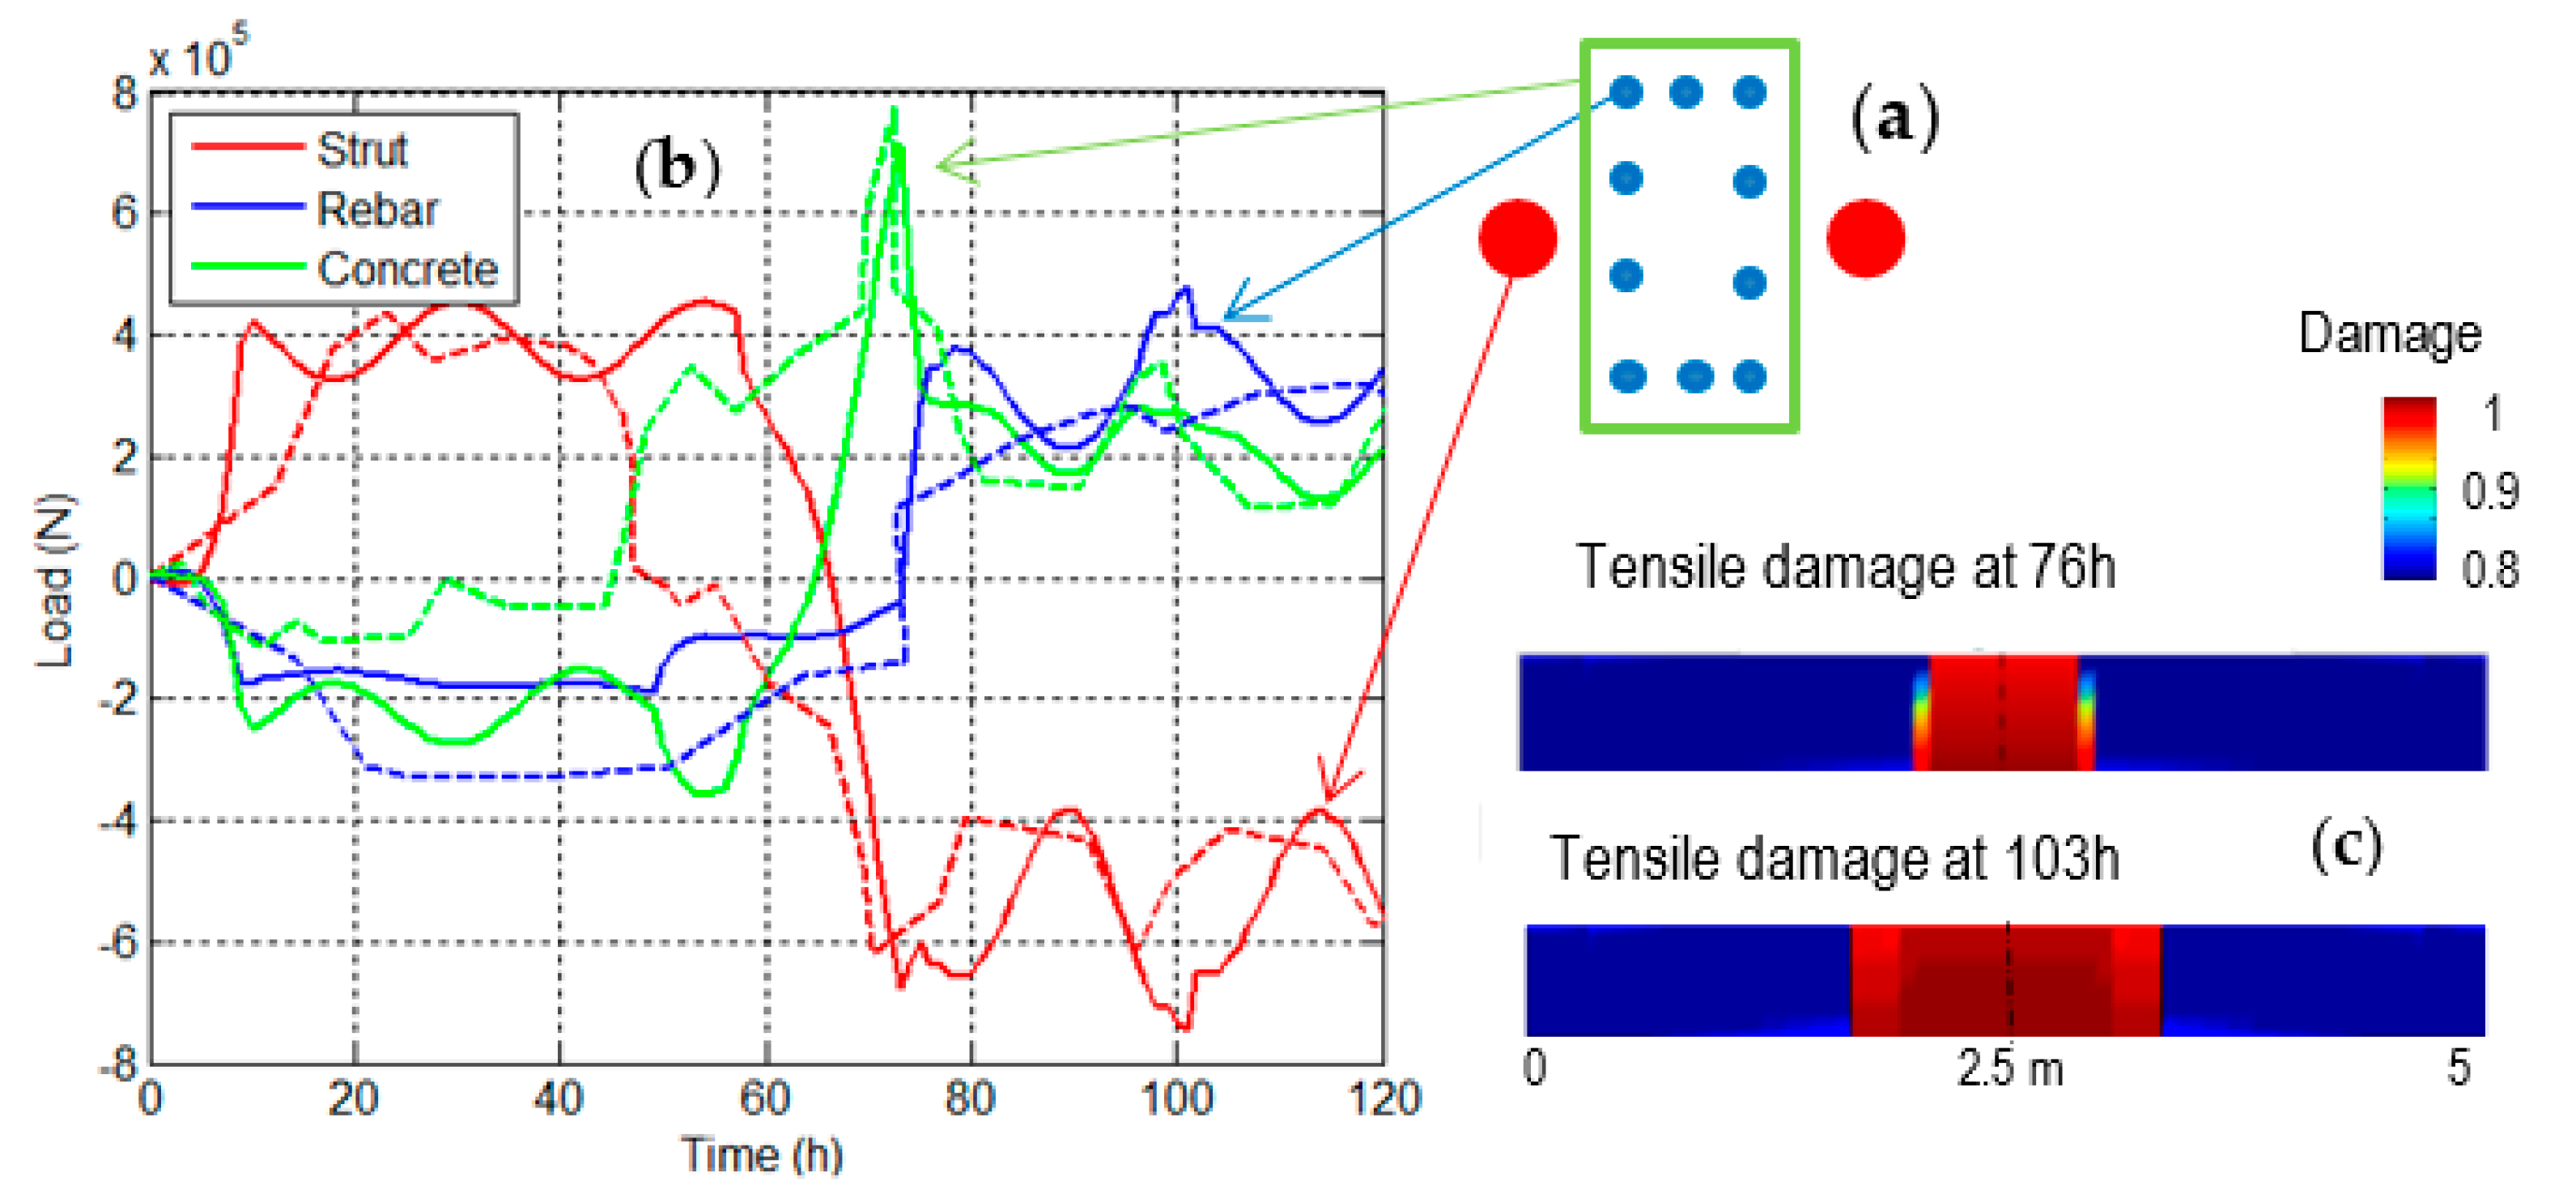
The evolution in these three global forces is compared in Figure 4b.
It should be emphasized that the comparison between calculation (solid line) and experiment (dashed line) is in good agreement.
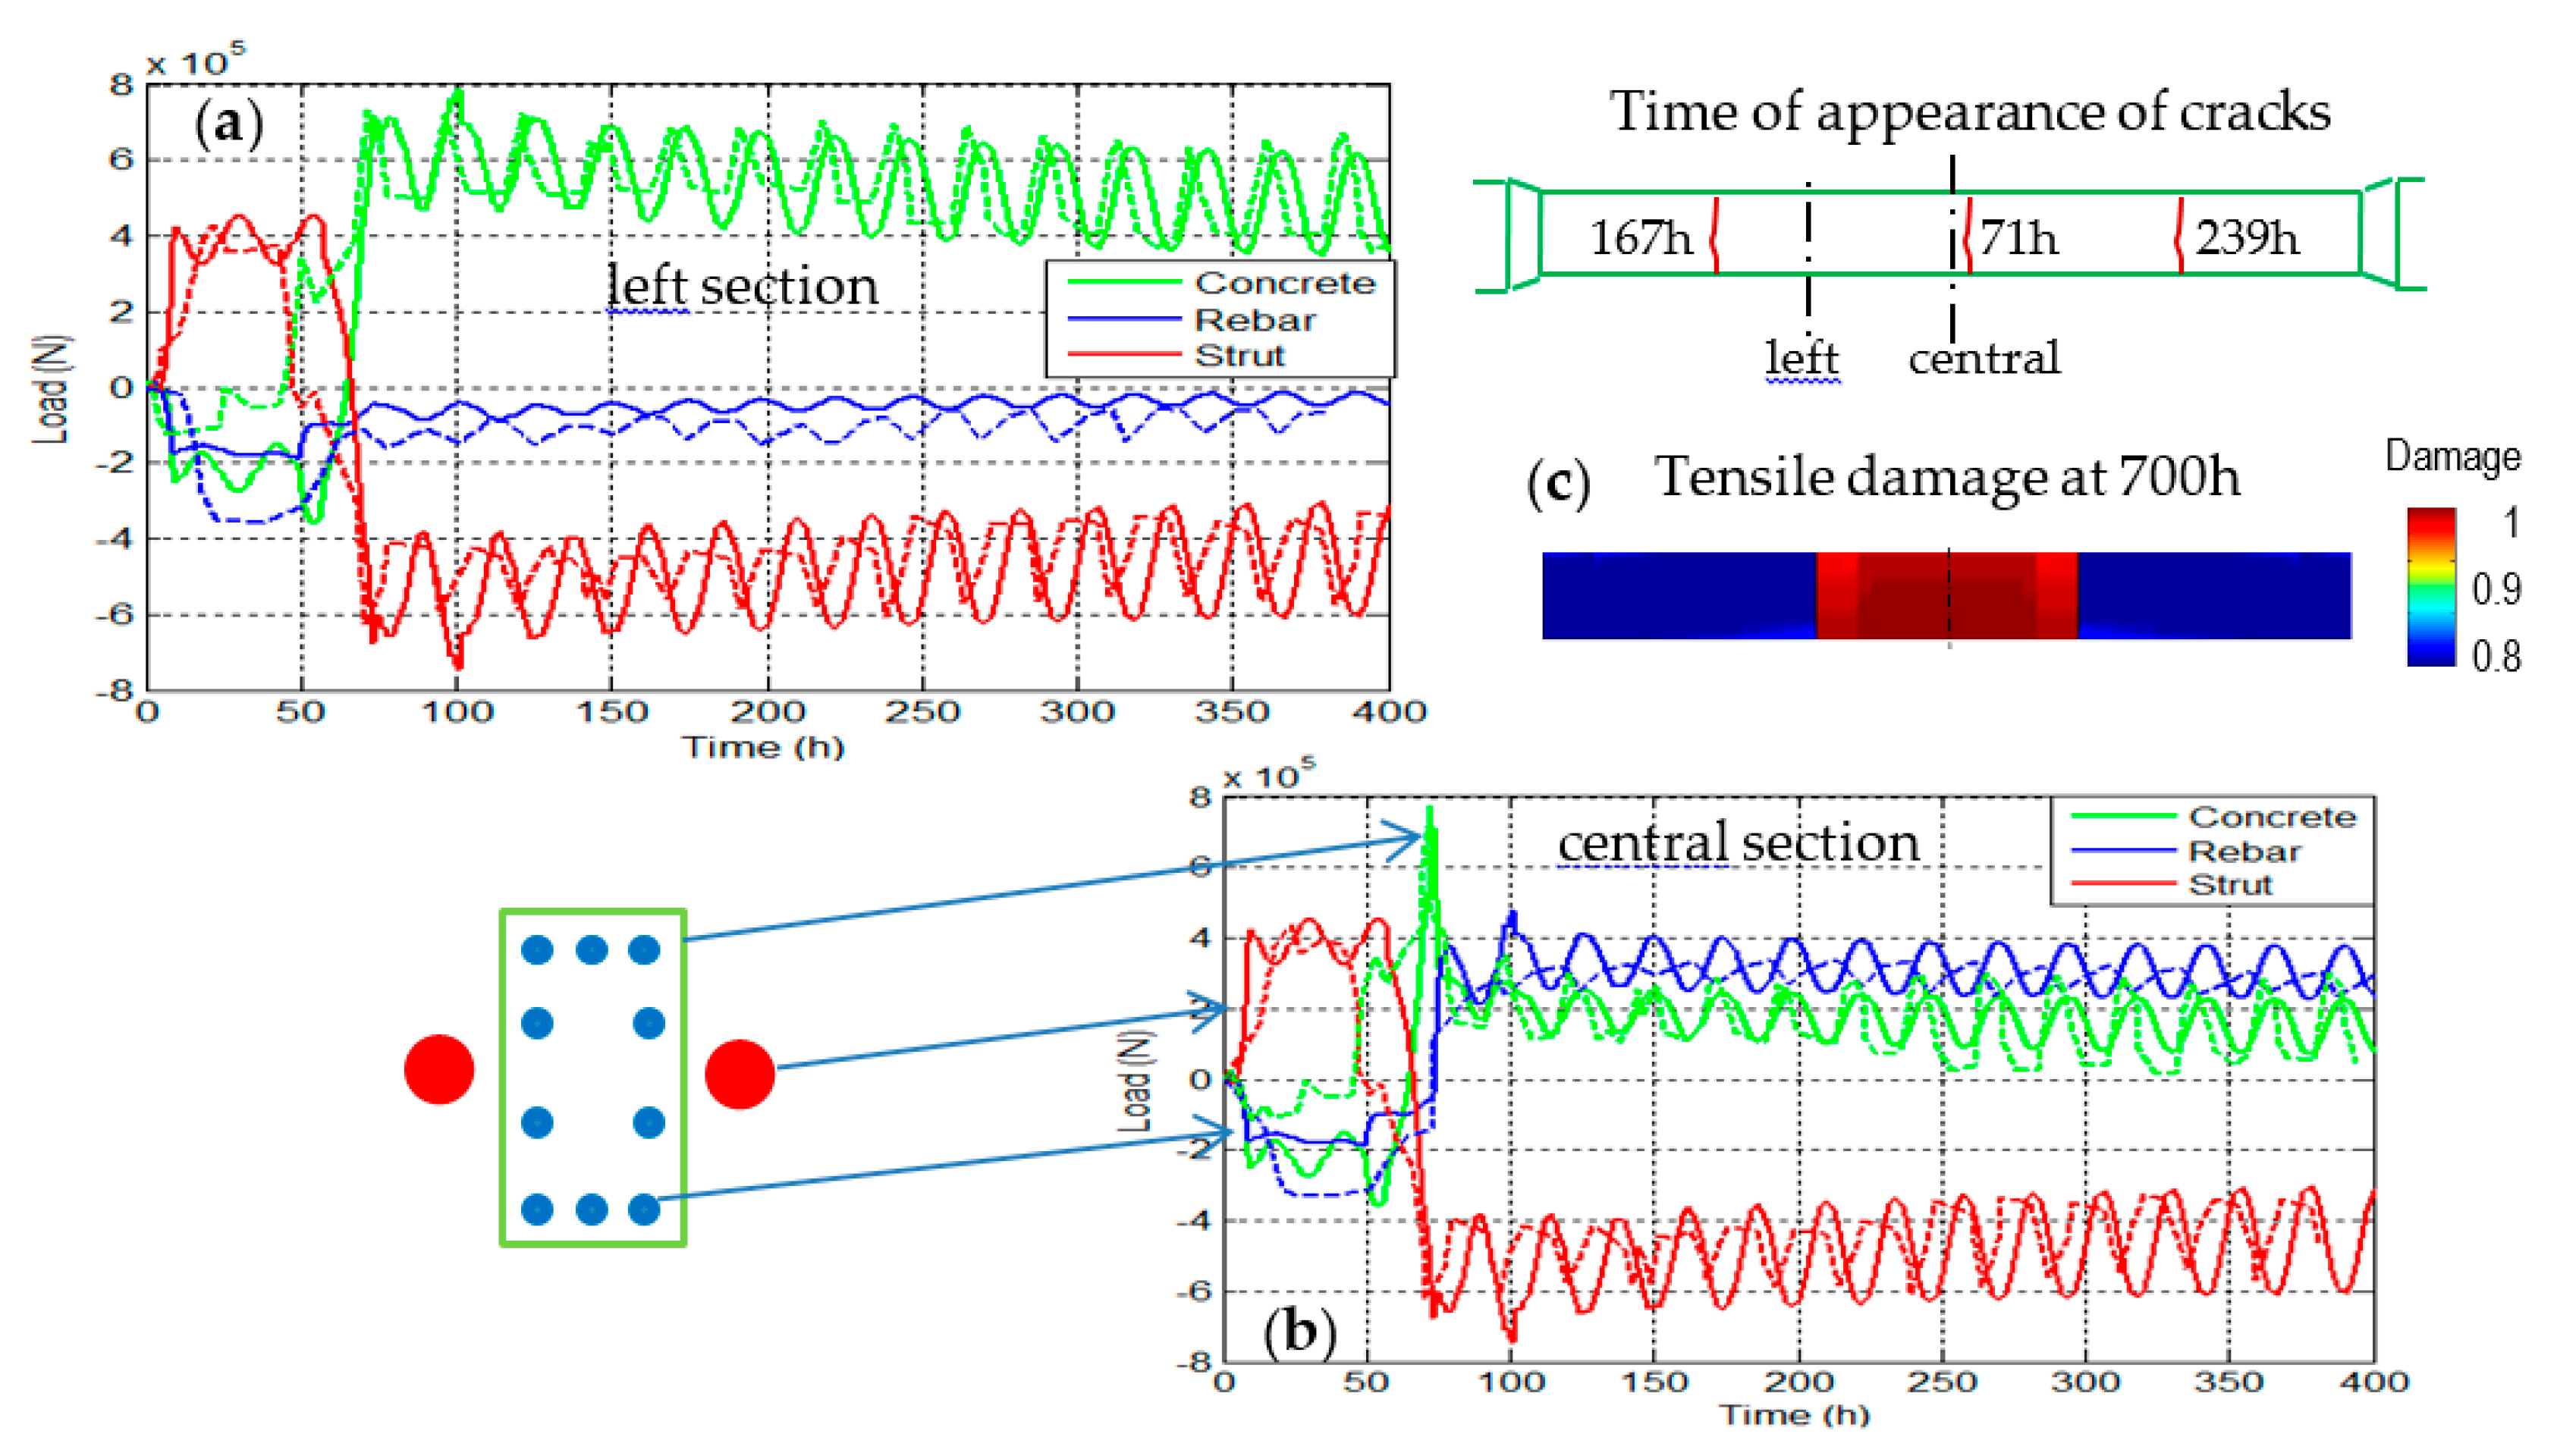
After a period during which the struts are in tension and both the concrete and rebar in compression, the sign of the forces changes at around 50 h, with an initial crack appearing on the concrete (hour 71 measured and hour 76 calculated). Due to bending caused by the gravity load, the crack is located in the central beam section. This phenomenon leads to a concrete force peak followed by a sudden decrease of this force, with a concurrent increase in the rebar-related force. At 103 h, the calculation forecasts a second series of cracking, which, due to the diffuse description of the damage, appears to be an extension on both sides of the previous cracking area (Figure 4c). This second cracking process was observed experimentally at approx. 167 h.
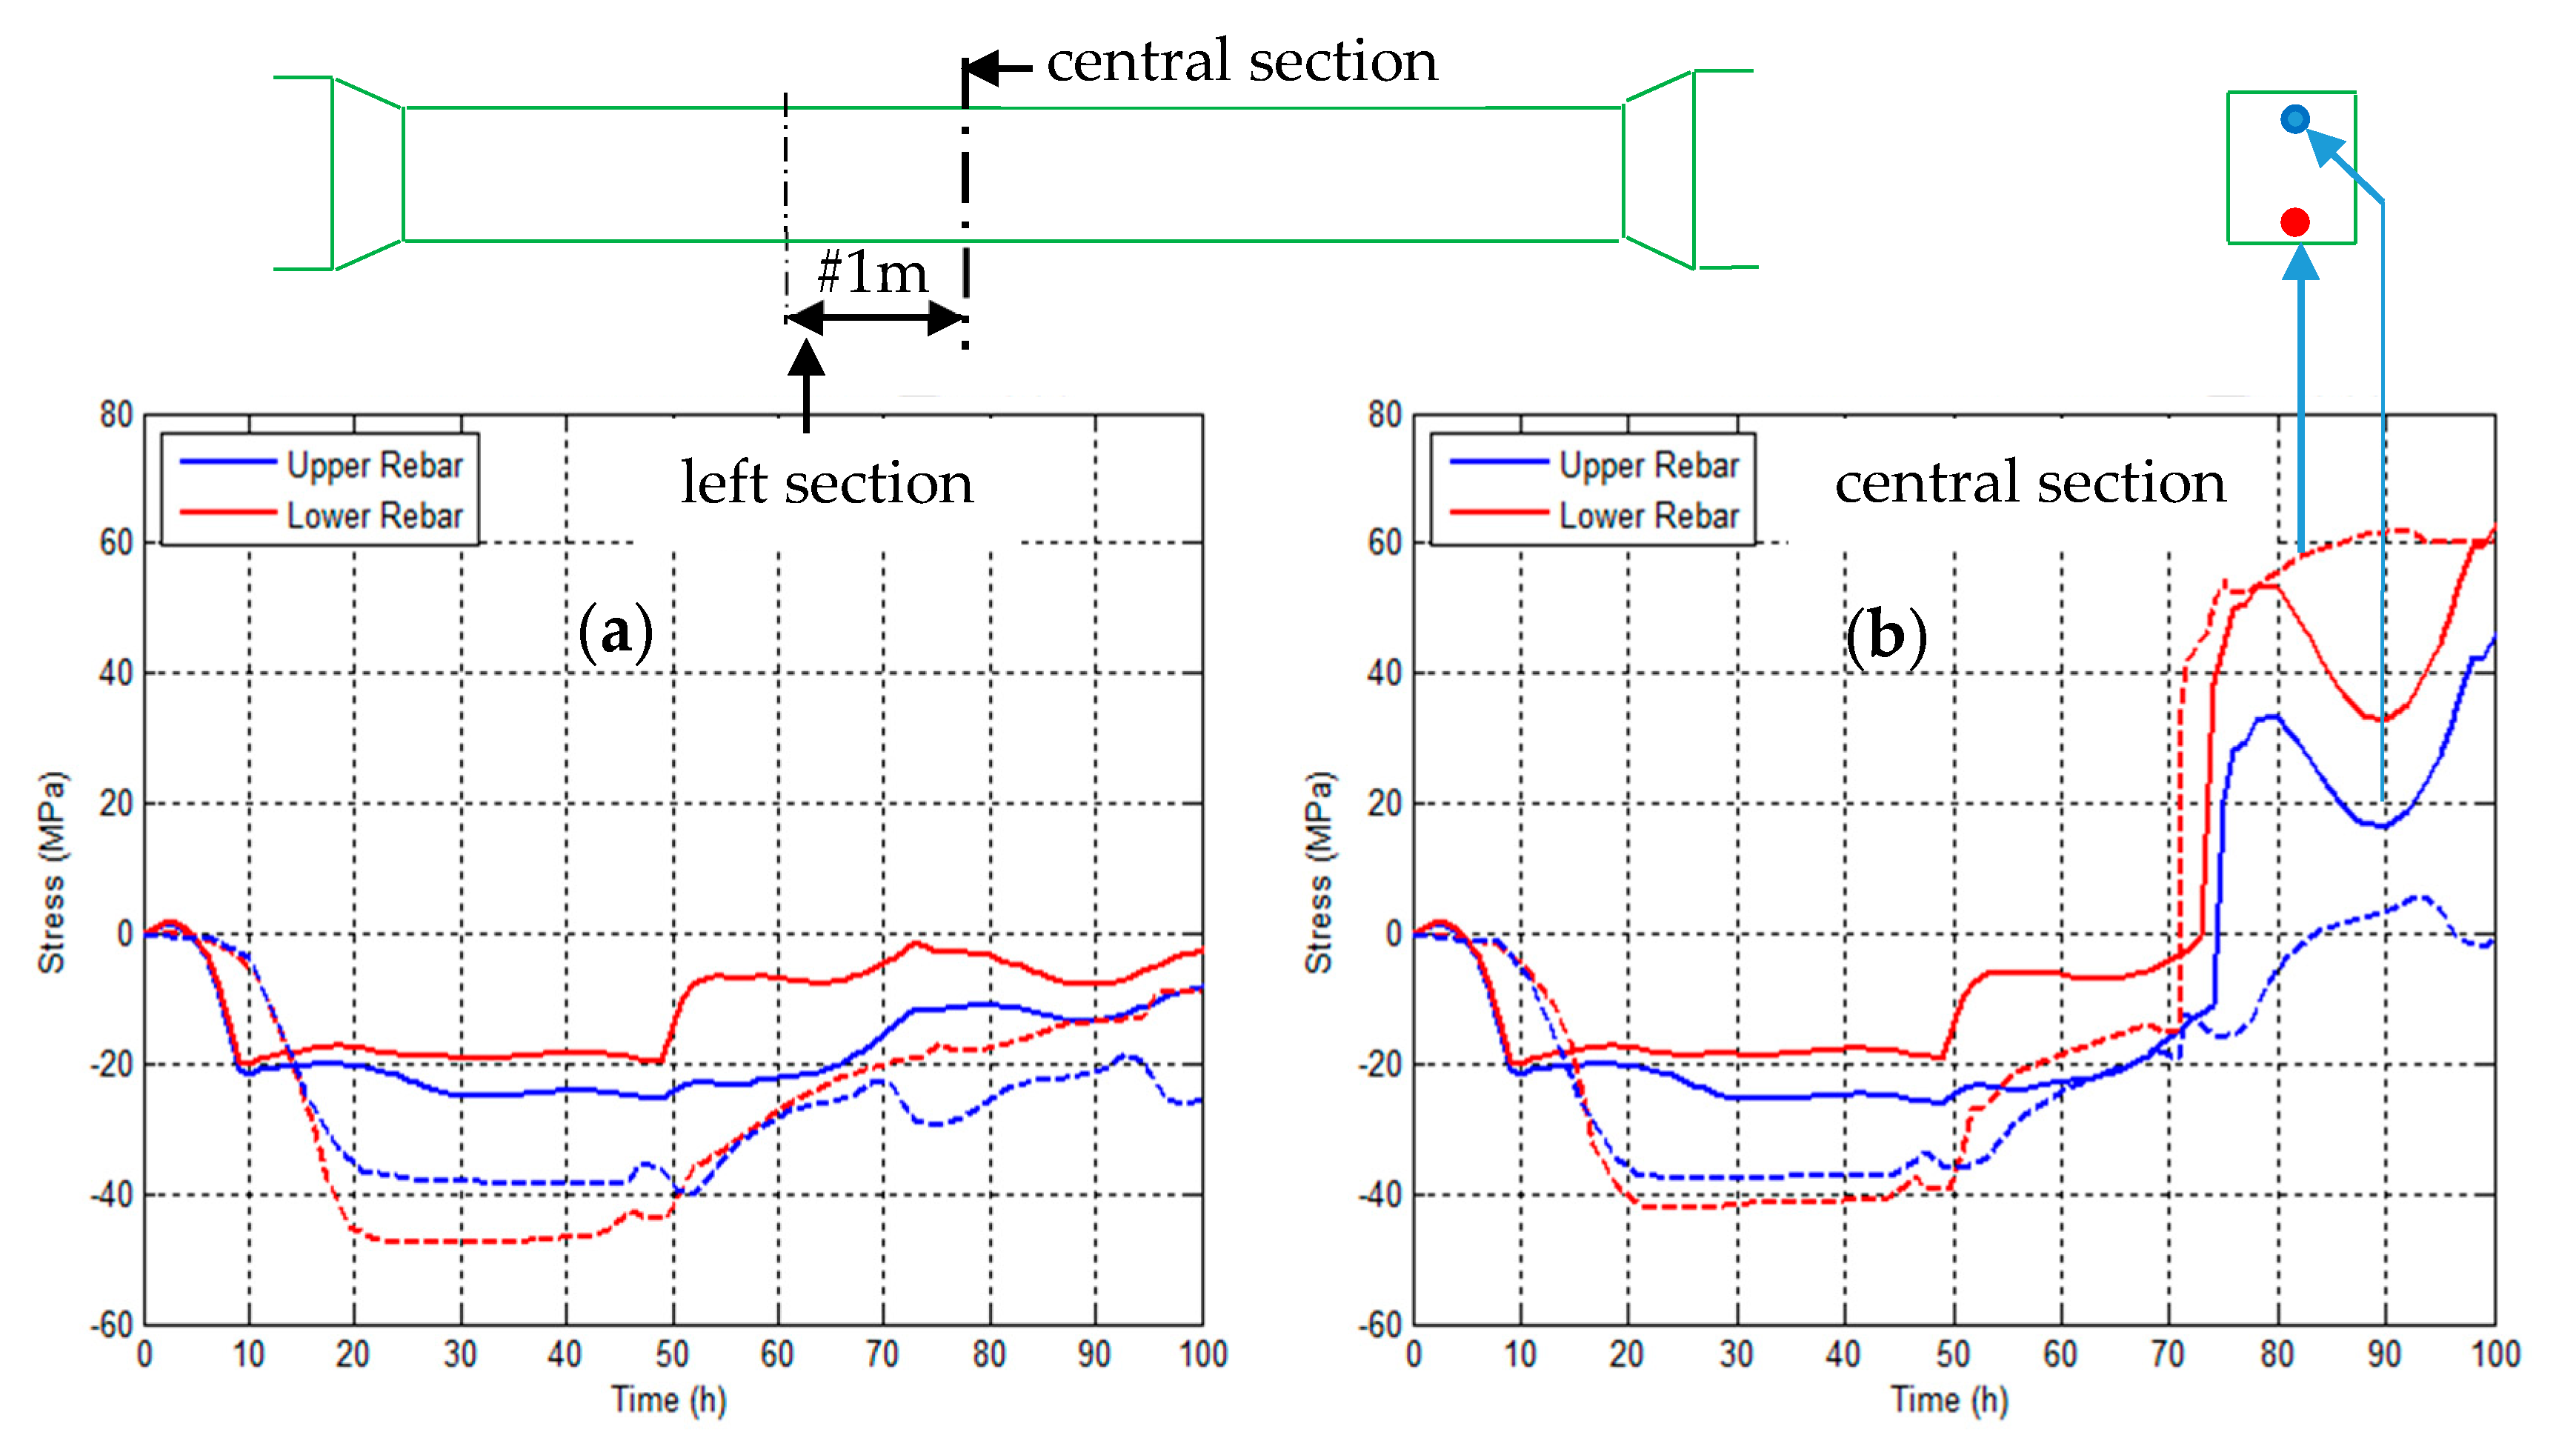
Local stress evolution in the rebar. During this restrained shrinkage process, the rebar remained elastic. Figure 5b provides the stress evolution over time that corresponds to both the upper rebar (blue line) and lower rebar (red line) in the central section for the first 100 h. The jump caused by rebar loading due to the initial cracking is clearly visible. For the lower rebar, this jump has been correctly predicted, and the difference obtained for the upper rebar is the counterpart due to use of the Timoshenko beam approach (a plane section remains plane, which is not the case in practice).
Figure 5a shows the same stress evolution but outside the cracking zone (this section lies roughly 1 m from the central section). For both the pre-cracking experiment and calculation (at about 70 h), the evolution in this section is the same as in the central section. After this time threshold, the stress only evolves slightly and, due to concrete shrinkage, stress in the rebar remains negative.
Cracking and crack opening. The experimenters placed three optic fibers in the beam, as shown in Figure 6. The active zone of the fibers lies at 2.50 m. On the same beam portion, changes in displacement have been compared (experiment vs. calculation). The offset between the two series of curves (dashed line: experiment—solid line: calculation) is due to the difficulty encountered in setting the reference zero on the optic fibers, but in both cases a spike clearly appears during cracking. It is assumed that this spike corresponds to the crack opening, from which the crack width can be deduced. Based on Figure 6, the values obtained experimentally and by calculation lie within the same range.
4.2.2. From 0 to 700 h: Restrained Shrinkage
The initial period was primarily marked by heating and cooling of the concrete during hydration. Beyond 120 h, maturation continues, and the beam undergoes the effects of night-day temperature variations, which generate a near cyclic stress in the struts that is transmitted to the beam. This effect is clearly visible for the load evolution in all three systems (concrete, struts, and rebar), as shown in Figure 7.
It should be emphasized that:
- 3 main cracks are observed during the experiment. The calculation exhibits an initial cracking zone in the beam center at 76 h, as shown in Figure 4c, which is consistent with the first experimental crack appearing at 71 h. At 103 h, the cracking zone extends on both sides at the same time, while the experimental cracks appear on the left side at 167 h and then on the right side at 239 h. It can thus be concluded that the calculation indeed provides for these two cracking phases (left and right of the central zone) but prematurely with respect to the experiment. In the case of the present loading (tension + bending), as demonstrated in [7] for multi-fiber beams, the damage is diffuse and the resultant mesh is insensitive. This diffuse characteristic and the loading mesh symmetry are probably at the origin of the simultaneous appearance of the left and right zones.
- Figure 7a,b display the global responses of all 3 systems (struts, concrete, and rebar). In the central section, once the concrete is cracked, the rebar and struts are the main active systems. In the left section outside the cracking zone, the main active systems are the struts and concrete, as the load supported by the rebar is close to zero. After 120 h, the mean values of these loads are practically constant, and the small cyclic evolution that appears is due to the cyclic day-night temperature variations, which generate a quasi-cyclic load in the struts that is subsequently transmitted to the beam.
4.2.3. Final Stage: 4-Point Bending Loading
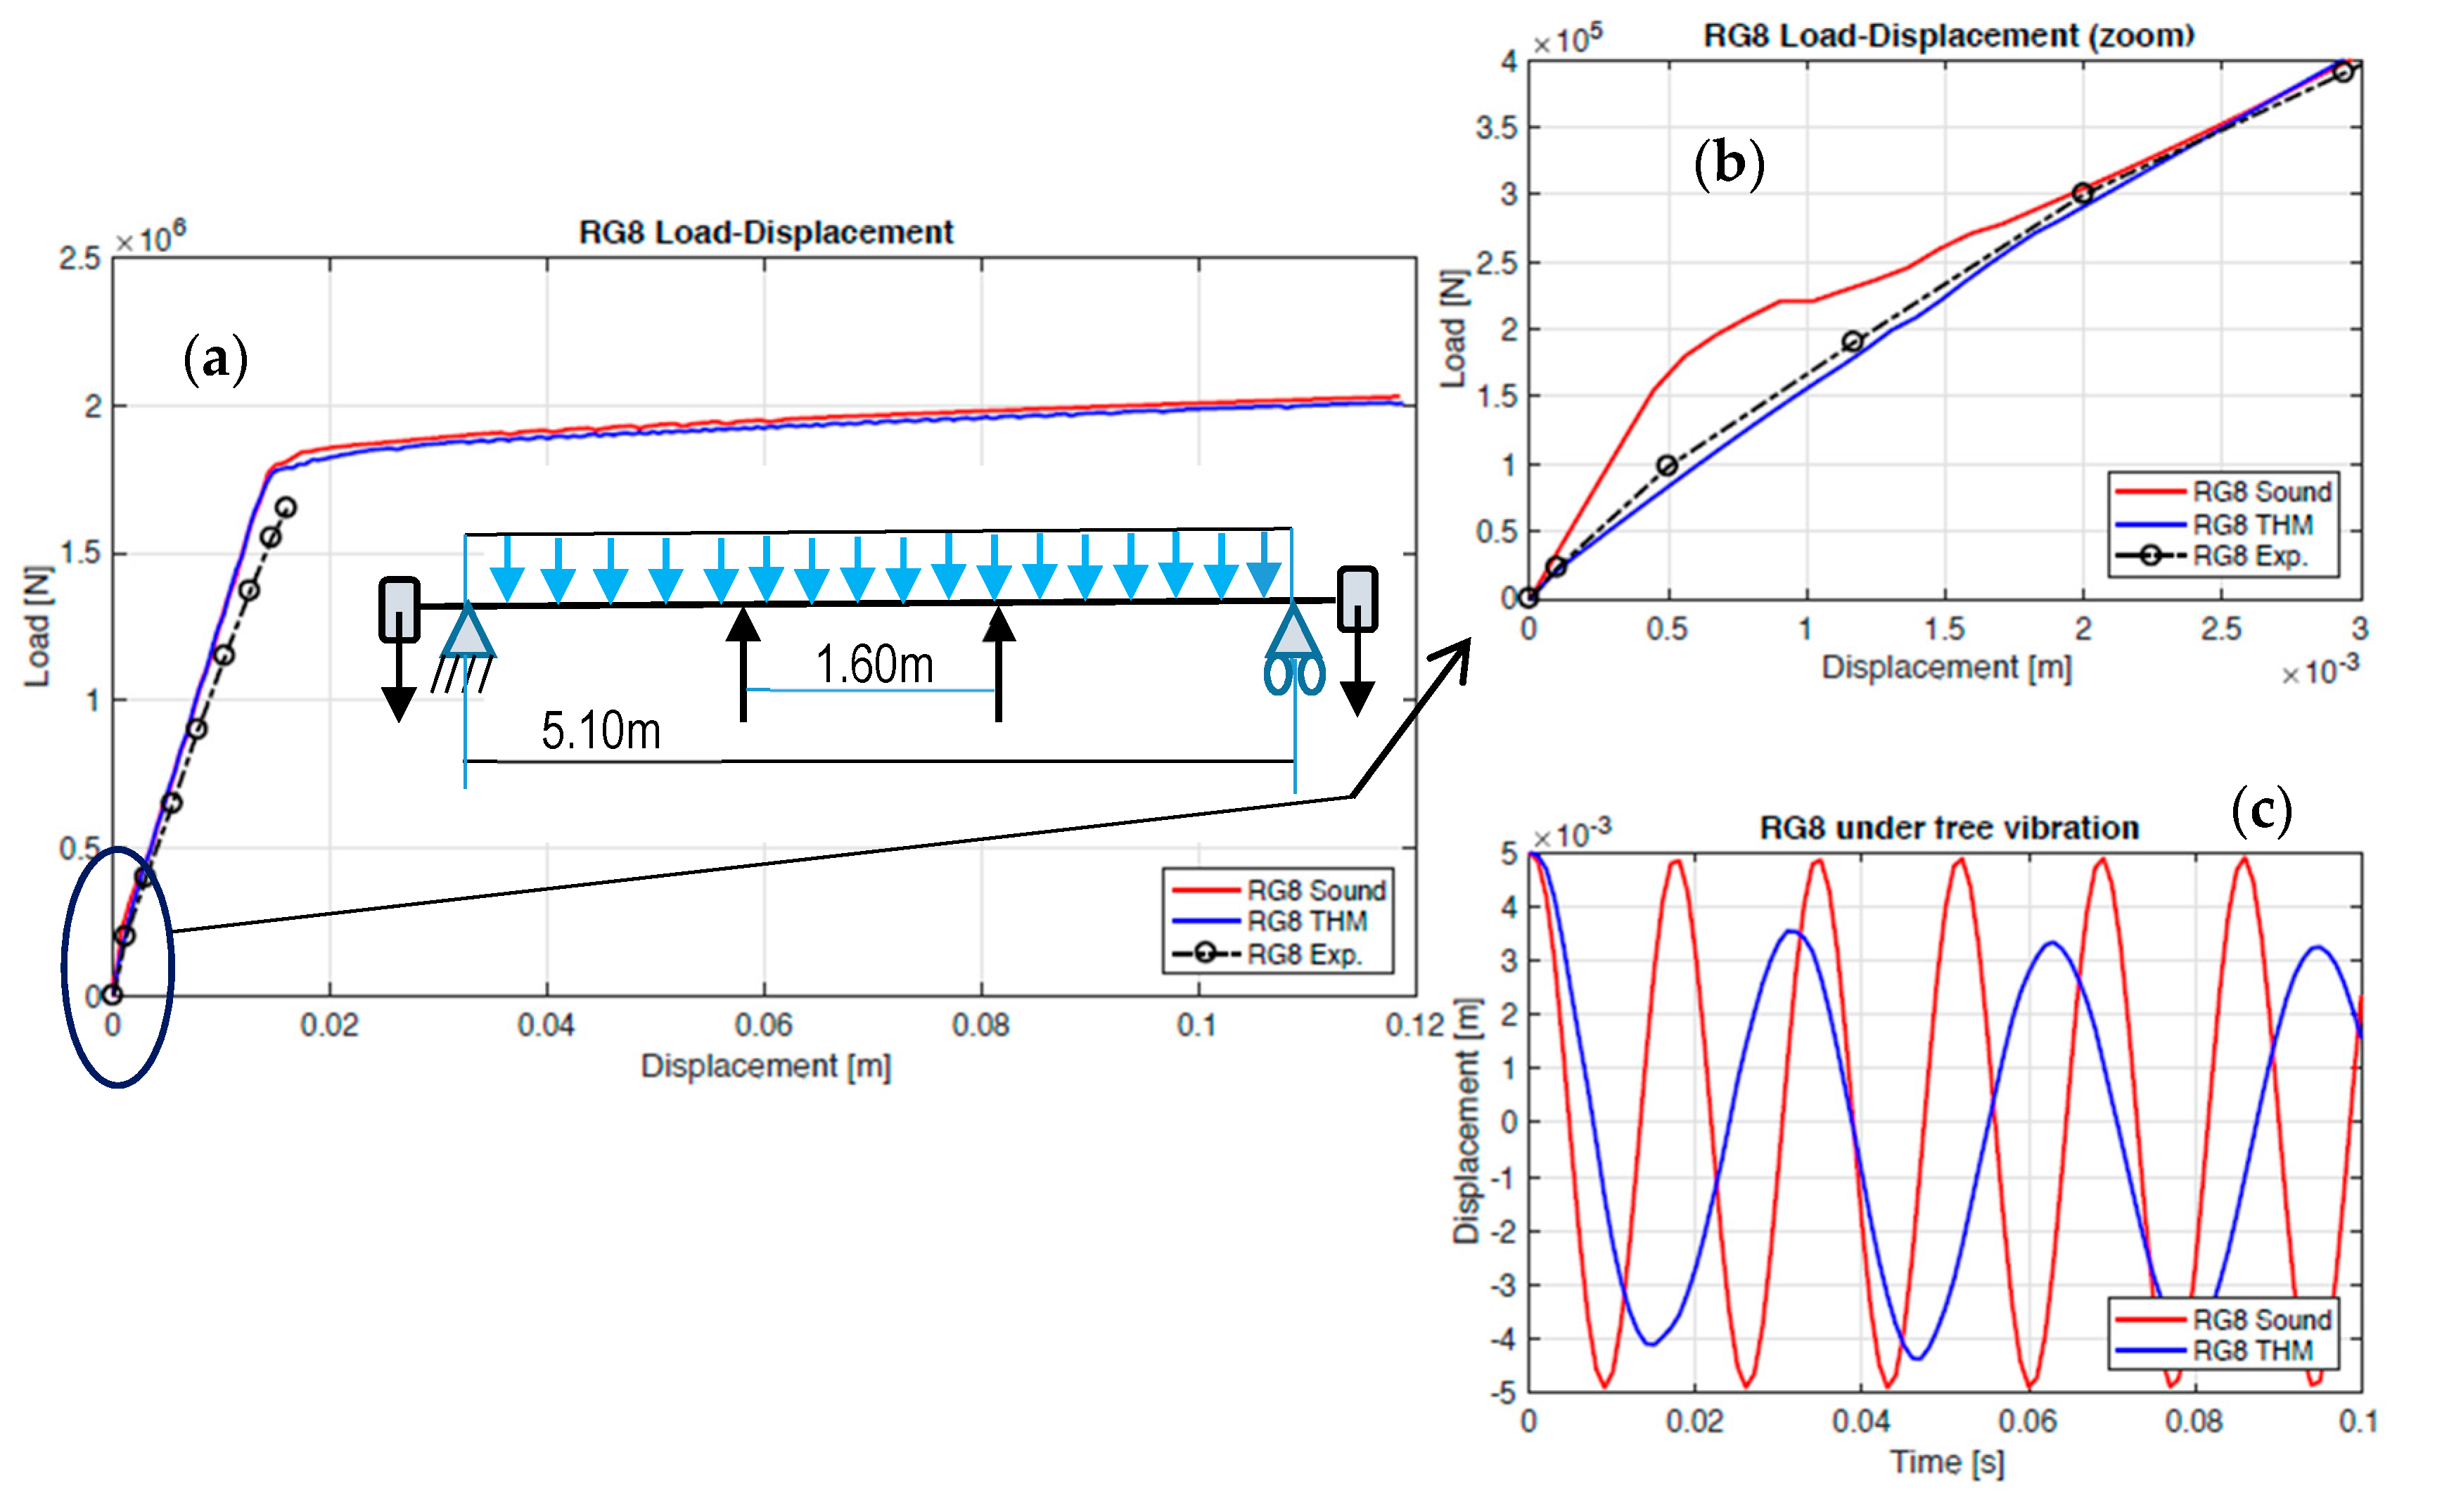
After 700 h, the struts were removed, and a few days later the beam was placed on a test bench for a monotonic 4-point bending loading. The supports were spaced 5.1 m apart and located at the end of the beam part where the section was constant and the loads were spaced at 1.6 m, as shown in Figure 8.
With regard to the global behavior of the beam, Figure 8a compares three curves, namely:
- The experimental curve (dashed black line): the beam was only loaded up to the serviceability limit state (SLS).
- The calculated curve for the beam after the restrained shrinkage loading program (blue curve).
- The calculated curve for the same beam considered to be structurally sound (red curve). This loading triggers plasticity on the rebar; the steel behavior considered here is an elastoplastic model with linear hardening (fe = 500 MPa).
It should be emphasized that:
- The calculated RG8 curve is in good compliance with the experimental curve.
- The two calculated curves (RG8 and structurally sound beams) are very close during most of the loading evolution.
- A tremendous difference is observed between the initial stiffness values. The initial stiffness is strongly reduced (about 50%) due to concrete cracking produced by the restrained shrinkage. An additional calculation has shown that the first vibration mode is equal to 31.7 Hz instead of 59.2 Hz for the sound beam, which leads to a very different dynamic response (Figure 8c). This decrease must be taken into account in cases of dynamic loading, such as an earthquake.
Figure 9 presents the cracking evolution observed during loading compared to the damage evolution obtained by calculation at the same level of loading.
It should be emphasized that:
- At a low loading level (205 kN), cracking appears in the center of the beam between cracks due to restrained shrinkage, while the diffuse damage, as developed during the restrained shrinkage phase, is located in the same area and remains relatively unchanged during the first loading phase.
- For the following phases (685 kN and 1100 kN), cracks and damage develop on the upper part of the beam (loading occurs from the bottom up); moreover, the damage contour, which is always diffuse, is quite consistent with the crack pattern.
The main conclusions drawn are as follows:
- The initial stiffness is heavily influenced by the restrained shrinkage treatment. The ultimate beam strength however remains the same, with or without this treatment.
- The calculations have yielded consistent results in terms of both global behavior (load-displacement) and local indicators (damage vs. crack pattern).
5. Conclusions
The aim of the present study has been to propose a comprehensive and efficient modeling approach for simulating the entire loading program for the RG8 test. The problem to be solved included many coupled phenomena (temperature increase, gradual concrete maturation, creep, restrained shrinkage effects, etc.), and it has been proven herein that such an approach can be implemented using a simplified model based on a multi-fiber beam description and relying on appropriate nonlinear models.
The simulation has allowed for the replication of the main observed phenomena, especially the triggering of the initial crack (at 76 h), and the subsequent behavior over 700 h has been correctly reproduced. Many other results have been obtained, notably in relation to local behavior (strain, damage, crack opening, etc.).
As regards the mechanical bending behavior following the early-age phase, simulations show that the THM treatment strongly affects the initial stiffness (i.e., a drop on the order of 50%) without jeopardizing the final static strength.
It can thus be concluded that THM effects on a large test body generate premature cracking, which implies two major types of consequences:
- On structural durability, such as steel corrosion or the alkali-aggregate reaction, sulfate attack, and freeze-thaw [26].
- On its mechanical response, especially in a dynamic loading, such as an earthquake (in the present case, the first natural frequency was reduced by nearly 50%).
In addition, the presented modeling strategy, based on 1D nonlinearity descriptions, leads to a highly stable, low-cost calculation on the ATL4S software platform (developed at INSA-Lyon under the Matlab® platform) [27], which is a critical issue for engineering purposes.
Acknowledgments
The authors would like to thank the French national program CEOS.fr for its financial support and for providing the experimental results.
Author Contributions
J.M. & M.B. built the various models and contributed to performing the numerical calculations; S.G. designed the computing platform (ATL4S) and, in this pursuit, developed all the numerical schemes used. All authors have given their final approval for this paper’s publication.
Conflicts of Interest
The authors hereby declare no conflict of interest.
Appendix A

Table A1.
Properties and parameters used for modeling purposes.
| Concrete at Early-Age | C (KJ/°C·m3) | k | L | h | κ | α | k1bc_∞ | k2bc_∞ | k3bc_∞ |
| (W/mK) | (KJ/m3) | (W/m2K) | (μm/m) | (μm/m°C) | (Gpa) | (Gpa) | (Gpa) | ||
| 2400 | 2.8 | 157,840 | 2 & 10 | 110 | 12 | 3 × 10¹¹ | 9 × 10¹⁰ | 2.5 × 10¹⁰ | |
| Ai (s−1) | Ap (s−1) | Mp | ζ | ξ0 | ξ∞ | ||||
| 64.85 | 1660 | 0.172 | 75 | 0 | 0.8 | ||||
| Concrete damage model | E∞ (Gpa) | εP | Gf (N/m) | εf | At | Bt | ε/ | Ac | Bc |
| 40 | 0.53 × 10⁻⁴ | 60 | 3.5 × 10⁻⁴ | 0.815 | 19,250 | 3.75 × 10⁻⁴ | 1.5 | 355 | |
| Steel model | Es (GPa) | σy (MPa) | Et (GPa) | α (μm/m°C) | |||||
| 210 | 500 | 5 | 7.5 |
References
- Barre, F.; Bisch, P.; Chauvel, D.; Cortade, J.; Dubois, J.P.; Erlicher, S.; Sellier, A. Control of Cracking in Reinforced Concrete Structures: Research Project CEOS.fr; Mazars, J., Ed.; Wiley: London, UK, 2016. [Google Scholar]
- Buffo-Lacarriere, L.; Rospars, C.; Delaplace, A.; Duong, A.; Jason, L. International Benchmark ConCrack—Synthesis of the Results; Workshop Concrack 2; International Robot Exhibition (IREX): Paris, France, 2011. [Google Scholar]
- Mazars, J. Control of cracking of RC structures: CEOS.fr international benchmark. Eur. J. Environ. Civ. Eng. 2014, 18, 721–844. [Google Scholar] [CrossRef]
- Sellier, A.; Buffo-Lacarrière, L. Towards a simple and unified modelling of basic creep, shrinkage and drying creep of concrete. Eur. J. Environ. Civ. Eng. 2011, 13, 1161–1182. [Google Scholar] [CrossRef]
- Ferreira, D.; Crespo, M.D.; Marí, A.; Bairán, J. Thermo-mechanical simulation of the ConCrack Benchmark RL1 test with a filament beam model. Eng. Struct. 2014, 73, 143–159. [Google Scholar] [CrossRef]
- Briffaut, M.; Benboudjema, F.; Torrenti, J.M.; Nahas, G. Numerical analysis of the thermal active restrained shrinkage ring test to study the early age behaviour of massive concrete structures. Eng. Struct. 2011, 33, 1390–1401. [Google Scholar] [CrossRef]
- Mazars, J.; Grange, S. Simplified Modeling of Reinforced Concrete Structures for Engineering Issues. Comput. Concr. 2015, 16, 683–701. [Google Scholar] [CrossRef]
- Mazars, J.; Pijaudier-Cabot, G.; Saouridis, C. Size effect and continuous damage in cementitious materials. Int. J. Fract. 1991, 51, 159–173. [Google Scholar]
- Swamy, R.; Bandyopadhyay, A.; Stavrides, H. The Ring Method of Measuring Restrained Shrinkage in Mortar and Concrete. Cem. Concr. Aggreg. 1979, 1, 13–20. [Google Scholar]
- Kianoush, M.R.; Acarcan, M.; Ziari, A. Behavior of Base Restrained Reinforced Concrete Walls under Volumetric Change. Eng. Struct. 2008, 30, 1526–1534. [Google Scholar] [CrossRef]
- Raoufi, K.; Pour-Ghaz, M.; Poursaee, A.; Weiss, J. Restrained Shrinkage Cracking in Concrete Elements: Role of Substrate Bond on Crack Development. J. Mater. Civ. Eng. 2011, 23, 895–902. [Google Scholar] [CrossRef]
- Kotronis, P.; Mazars, J. Simplified modelling strategies to simulate the dynamic behaviour of R/C walls. J. Earthq. Eng. 2005, 9, 285–306. [Google Scholar] [CrossRef]
- Mazars, J.; Bournazel, J.P. Modelling of damage processes due to volumic variations for maturing and matured concrete. In Concrete from Material to Structure; Malier, Y., Bournazel, J.-P., Eds.; RILEM: Paris, France, 1998; pp. 43–54. [Google Scholar]
- Sciumè, G.; Benboudjema, F.; De Sa, C.; Pesavento, F.; Berthaud, Y.; Schrefler, B. A multi-physics model for concrete at early age applied to repairs problems. Eng. Struct. 2012, 57, 374–387. [Google Scholar] [CrossRef]
- Briffaut, M.; Benboudjema, F.; Torrenti, J.-M.; Nahas, G. Effects of early-age thermal behaviour on damage risks in massive concrete structures. Eur. J. Environ. Civ. Eng. 2012, 16, 589–605. [Google Scholar] [CrossRef]
- Hillerborg, A.; Modeer, M.; Peterssonn, P.E. Analysis of crack formation and growth in concre-te by means of fracture mechanics and finite elements. Cem. Concr. Res. 1976, 6, 773–782. [Google Scholar] [CrossRef]
- Planas, J.; Elices, M.; Guinea, G.V. Measurement of the fracture energy using three-point bend tests: Part 2, influence of bulk energy dissipation. Mater. Struct. 1992, 25, 305–316. [Google Scholar] [CrossRef]
- Bazant, Z.P. Concrete fracture models: Testing and practice. Eng. Fract. Mech. 2002, 69, 165–205. [Google Scholar] [CrossRef]
- Waller, V. Relation Entre Formulation d’un Beton et Propriétés Mécaniques, Formulation et Chaleur D’hydratation, cas de Cendre Volantes. Ph.D. Thesis, Ecole Nationale des Ponts et Chaussées, Paris, France, 1999. [Google Scholar]
- De Schutter, G. Degree of hydration based Kelvin model for the basic creep of early age concrete. Mater. Struct. 1999, 32, 260–265. [Google Scholar] [CrossRef]
- Rossi, P.; Wu, X. Scale effect on concrete in tension. Mater. Struct. 1994, 27, 437–444. [Google Scholar] [CrossRef]
- Sellier, A. Millard, Weakest link and localisation WL2: A method to conciliate probabilistic and energetic scale effects in numerical models. Eur. J. Environ. Civ. Eng. 2014, 18, 1177–1191. [Google Scholar]
- Kuguel, R. A Relation between Theoretical Stress Concentration Factor and Fatigue Notch Factor Deduced from the Concept of Highly Stressed Volume; ASTM: West Conshohocken, PA, USA, 1961; Volume 61, pp. 732–748. [Google Scholar]
- Buffo-Lacarriere, L.; Baron, S.; Barré, F.; Chauvel, D.; Darquennes, A.; Dubois, J.-P.; Gayete, J.; Grondin, F.; Kolani, B.; Torrenti, J.M.; et al. Restrained shrinkage of massive reinforced concrete structures: Results of the project CEOS.fr. Eur. J. Environ. Civ. Eng. 2015, 20, 785–808. [Google Scholar] [CrossRef]
- Cheops Data. Available online: http://www.ceosfr.irex.asso.fr/en/ (accessed on 30 June 2017).
- Tang, S.; Yao, Y.; Andrade, C.; Li, Z.J. Recent durability studies on concrete structure. Cem. Concr. Res. 2015, 78, 143–154. [Google Scholar] [CrossRef]
- Grange, S. ATL4S—A Tool and Language for Simplified Structural Solution Strategy; Internal Report; GEOMAS INSA-Lyon: Villeurbanne, France, 2016. [Google Scholar]
Figure 1.
Overview of the RG8 beam and reinforcement detail: (a) reinforcement map of the beam; (b) multi-fiber beam mesh and boundary conditions.
Figure 1.
Overview of the RG8 beam and reinforcement detail: (a) reinforcement map of the beam; (b) multi-fiber beam mesh and boundary conditions.

Figure 2.
(a) Temperature evolution at the center (black curves) and near the surface (red curves) of the beam (experiment-calculation comparison); (b) uniaxial behavior for concrete exhibiting the unilateral effect.
Figure 2.
(a) Temperature evolution at the center (black curves) and near the surface (red curves) of the beam (experiment-calculation comparison); (b) uniaxial behavior for concrete exhibiting the unilateral effect.

Figure 3.
Evolution in early-age concrete properties; test (circles)-model (curves) comparison: (a) tensile strength ft; (b) Young’s modulus.
Figure 3.
Evolution in early-age concrete properties; test (circles)-model (curves) comparison: (a) tensile strength ft; (b) Young’s modulus.

Figure 4.
Evolution during the 0–120 h time frame: (a) the 3 section elements: struts (red), rebar (blue), concrete (green); (b) global forces supported by the 3 systems in the central beam section (dashed line: experiment—solid line: calculation); and (c) damage contour at 76 h (time of initial cracking) and 103 h (time of extended cracking).

Figure 5.
Stress evolution on rebar (dashed line: experiment—solid line: calculation): (a) in a section outside the cracking zone (left section), and (b) in the central beam section.
Figure 5.
Stress evolution on rebar (dashed line: experiment—solid line: calculation): (a) in a section outside the cracking zone (left section), and (b) in the central beam section.

Figure 6.
Strain evolution in concrete, as measured by optic fibers, compared to the strain calculated at the same location (dashed line: experiment—solid line: calculation). Crack openings, appearing in the table, are deduced directly from the strain jumps.
Figure 6.
Strain evolution in concrete, as measured by optic fibers, compared to the strain calculated at the same location (dashed line: experiment—solid line: calculation). Crack openings, appearing in the table, are deduced directly from the strain jumps.
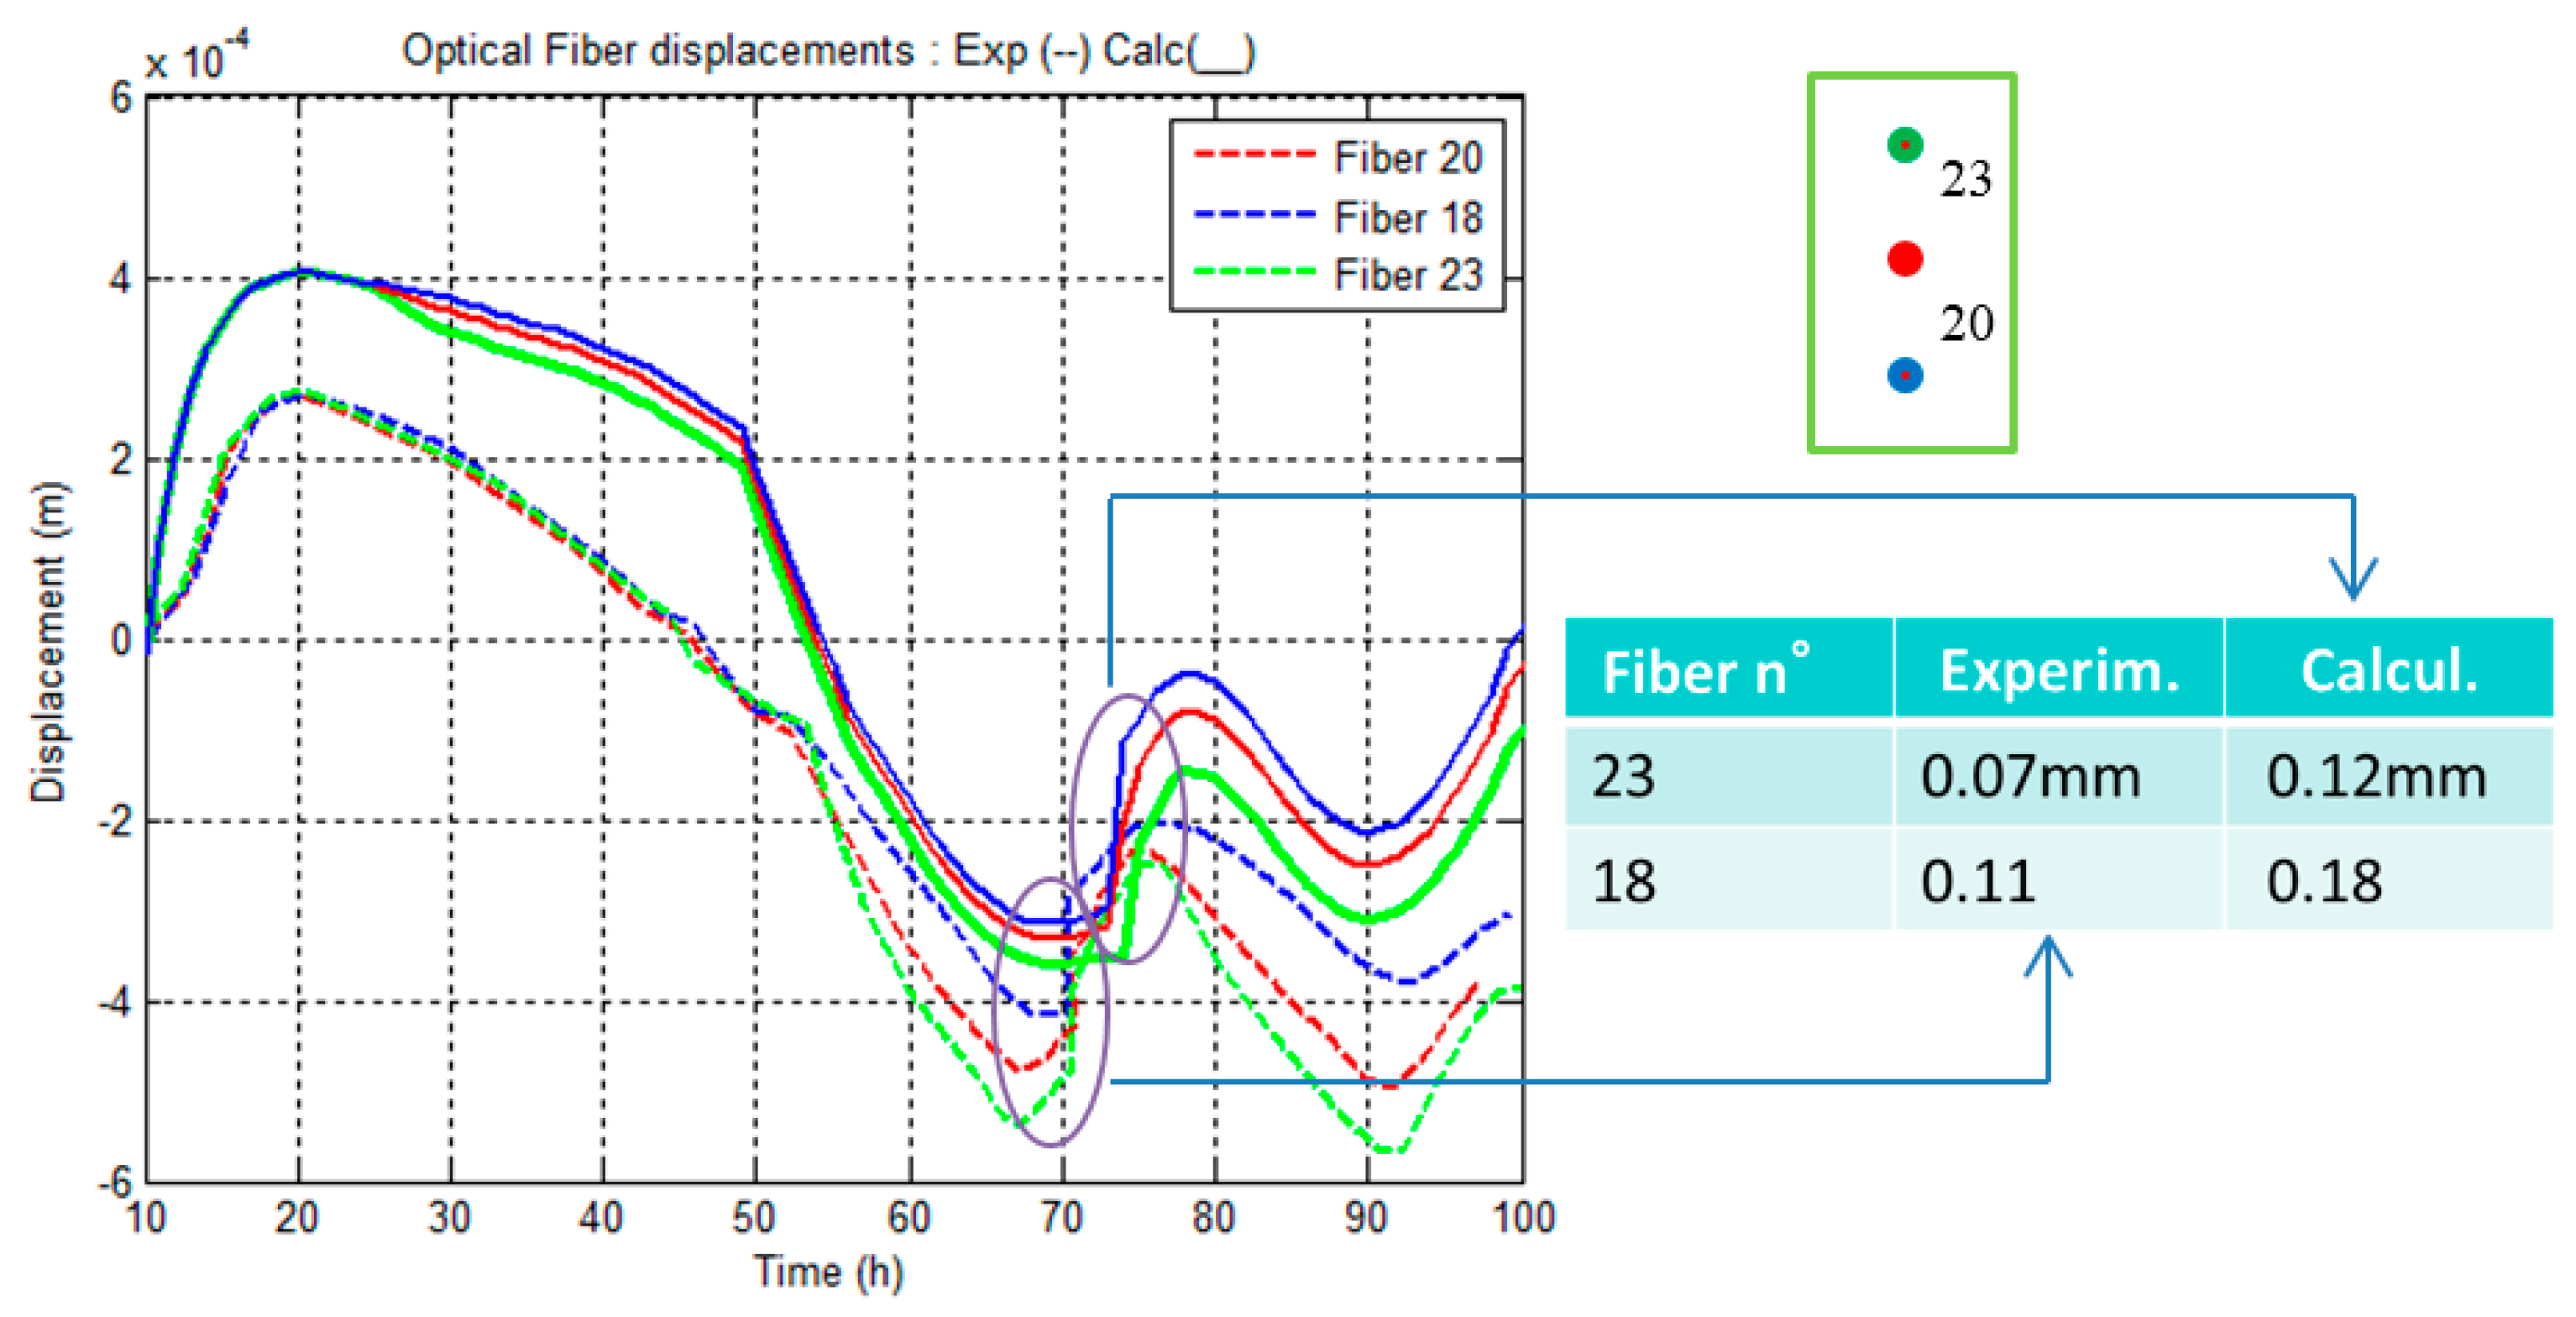
Figure 7.
0–700 h evolution: (a) global forces supported by the 3 systems in the left section, 1 m from the beam center, outside the cracking zone (dashed line: experiment—solid line: calculation); (b) global forces supported by the 3 systems in the central section (inside the cracking zone); and (c) cracks observed and tensile damage contour at the end of the process (700 h).

Figure 8.
The four-point bending RG8 test: (a) total force-displacement responses (experiment, RG8 beam, and structurally sound beam); (b) close-up on the first 3-mm displacement showing the large difference between the two original stiffnesses (RG8 beam and sound beam); and (c) the corresponding free vibrations responses.

Figure 9.
The four-point bending RG8 test. (Left) load-displacement responses; (Right) cracking and damage evolution at various loading stages.
Figure 9.
The four-point bending RG8 test. (Left) load-displacement responses; (Right) cracking and damage evolution at various loading stages.

© 2018 by the authors. Licensee MDPI, Basel, Switzerland. This article is an open access article distributed under the terms and conditions of the Creative Commons Attribution (CC BY) license (http://creativecommons.org/licenses/by/4.0/).
Share and Cite
MDPI and ACS Style
Mazars, J.; Grange, S.; Briffaut, M. Simplified Modeling Strategy for the Thermomechanical Analysis of Massive Reinforced Concrete Structures at an Early Age. Appl. Sci. 2018, 8, 448. https://doi.org/10.3390/app8030448
AMA Style
Mazars J, Grange S, Briffaut M. Simplified Modeling Strategy for the Thermomechanical Analysis of Massive Reinforced Concrete Structures at an Early Age. Applied Sciences. 2018; 8(3):448. https://doi.org/10.3390/app8030448
Chicago/Turabian StyleMazars, Jacky, Stéphane Grange, and Matthieu Briffaut. 2018. "Simplified Modeling Strategy for the Thermomechanical Analysis of Massive Reinforced Concrete Structures at an Early Age" Applied Sciences 8, no. 3: 448. https://doi.org/10.3390/app8030448
Note that from the first issue of 2016, this journal uses article numbers instead of page numbers. See further details here.