Oil Spill Detection and Mapping Using Sentinel 2 Imagery


Remote Sensing Laboratory, National Technical University of Athens, 15780 Athens, Greece
*
Author to whom correspondence should be addressed.
J. Mar. Sci. Eng. 2018, 6(1), 4; https://doi.org/10.3390/jmse6010004
Submission received: 4 December 2017
/
Revised: 29 December 2017
/
Accepted: 3 January 2018
/
Published: 6 January 2018
(This article belongs to the Special Issue Maritime Environment Monitoring)
Abstract
:Two object-based image analysis methods are developed for detecting oil spills from known natural outflows as well as light oil spill events using Sentinel 2 imagery. The methods are applied to Sentinel 2 images of a known area of natural oil outflow as well as on a Sentinel 2 image of a recent oil spill event along the south coast of Athens, Greece. The preliminary results are considered very successful and consistent, with a high degree of applicability to other Sentinel 2 satellite images. Further testing and fine tuning of the proposed object-based methodology should be carried out using atmospheric correction and ground truth.
1. Introduction
Several times multispectral imagery has been used for the detection of oil spills. Although clouds affect the temporal resolution of such images, the potential of optical sensors for detecting oil pollution phenomena is considerable. An oil spill’s spectral signature depends on favorable lighting and sea conditions, oil optical properties, film thickness, and the optical properties of the water column. Based on spectro-radiometric measurements, Brown et al. [1] observed that oil has no specific characteristics that distinguish it from the background. Klemas [2], in his study, states that oil sheen shows up as silvery and reflects light over a wide spectral region. Heavy oil appears brown, peaking in the 600 to 700 nm region, while mousse looks red-brown and peaks closer to 700 nm. A study of oil spectra in shallow seawater showed that for crude oils and light petroleum product, a thin oil spill has similar spectral characteristics to background spectra [3]. In the case of open ocean images [4,5], the organic compounds in the oil and oil/water mixtures have absorption features that are distinct from those from water and clouds. Simulations that have been performed by varying the water optical properties and considering different crude and refined oils provided some general rules [6]: very thin oil films (sheens) are more easily detected at viewing directions near the sun-glint zone, while very thick films are more likely to be detected at viewing angles away from the sun. For films of intermediate thickness, the detectability depends mainly on the oil’s specific optical properties.
Using Landsat 7 Enhanced Thematic Mapper (ETM) imagery, Zhao et al. [7] observed features of weathered oil suspended in the water column with bright contrast, and oil film floating on the sea surface with dark contrast. Lee et al. [8] developed an algorithm for discriminating film-like oil from thick oil using DubaiSat-2 and Landsat Operational Land Imager (OLI) data. Taravat et al. [9] performed ratio operations on Landsat 7 ETM images to enhance oil spill features. They concluded that the bands’ difference between 660 and 560 nm, division at 660 and 560, and division at 825 and 560 nm, normalized by 480 nm, provide the best result. Then these ratio images fed the input nodes of a multilayer perceptron neural network in order to perform a pixel-based supervised classification. Bradford et al. [10] performed selective color band combinations, contrast enhancement, and histogram warping before applying an image segmentation process that separates out contiguous regions of oil and provides a raster mask to an analyst. Corucci et al. [11] exploited many different machine learning techniques such as simple statistical classifiers, radial basis function and multilayer perceptron neural networks, adaptive neuro-fuzzy inference system (ANFIS), and support vector machine (SVM) in order to investigate the potential of oil spill classification from optical satellite images.
Object-based image analysis (OBIA) has often been applied, mainly to synthetic aperture radar (SAR) imagery, for oil spill detection. The object-based process for typical SAR-based oil spill detection consists of three steps: image segmentation for dark-spot identification, feature extraction, and oil spill and look-alike discrimination. Segmentation techniques are used to create objects that exhibit high local contrast and thus may be considered dark spots [12]. Then fine designed and appropriately combined gray, geometric, and textural features, as well as fuzzy logic, are employed to classify dark spots as oil spill or seawater. Although there are many recent studies [13,14,15] that profit from object-based SAR image analysis to perform oil spill detection, studies employing object-based analysis on multispectral image are rarely found in the literature. There are, however, certain limitations to detecting oil spills in SAR images as oil spill detection relies on the fact that the oil film decreases the backscattering of the sea surface, resulting in a dark formation that contrasts with the brightness of the surrounding spill-free sea. For C band SAR images, like Sentinel 1a and 1B, a minimum wind field of 2–3 m/s creates sufficient brightness in the image and makes the oil film visible. On the other hand, when the wind speed is too high, it causes the spill to disappear [16,17]. Thus, an alternative method for detecting oil spills with other types of data is considered very useful.
Maianti et al. [18] applied OBIA on Moderate Resolution Imaging Spectroradiometer (MODIS) bands and MODIS-based indexes for monitoring oil spill dynamics. Kolokoussis et al. [19] developed an object-based method for oil spill detection using very high multispectral images such as Ikonos, QuickBird, RapidEye, and WorldView2, as well as high-resolution satellite images such as Landsat TM. Reiche et al. [20] created an object-based mapping and classification system for terrestrial oil spill pollutions in West Siberia using QuickBird data.
Sentinel-2A and Sentinel-2B high-resolution multispectral data are available since June 2015 and March 2017, respectively. Nevertheless, their efficiency in oil spill detection has not yet been sufficiently investigated. In this study, motivated by the high-quality results obtained by the OBIA method presented in [19], we adapted the developed method for exploiting Sentinel-2 data characteristics. Oil spills resulting from the underwater natural oil outflow close to Zakynthos Island, Greece, and the oil spill caused by the “Agia Zoni II” tanker sunk in the Saronic Gulf, Greece, have been used for evaluation of the results.
2. Materials and Methods
2.1. Study Areas
Two study areas (Figure 1) have been used in this work; the first (area A) is an area with a known natural oil outflow, 6 km south of Zakynthos Island in Greece. This area has been pointed out by [19] and is known to provide 15 km long natural oil spills during the summer period every year.
The second area (area B) is the Saronic Gulf, east of Salamina Island and south of Athens. In this area an oil spill has been caused by the “Agia Zoni II” tanker sunk on 10 September 2017. As shown in Figure 1, the sinking of the “Agia Zoni II” tanker had a largeenvironmental impact, affecting most of the southern coastal area of Athens from Piraeus to Agios Kosmas (shown with red arrows in Figure 1). The 45-year-old vessel has been carrying 2500 tons of crude oil.
2.2. Datasets
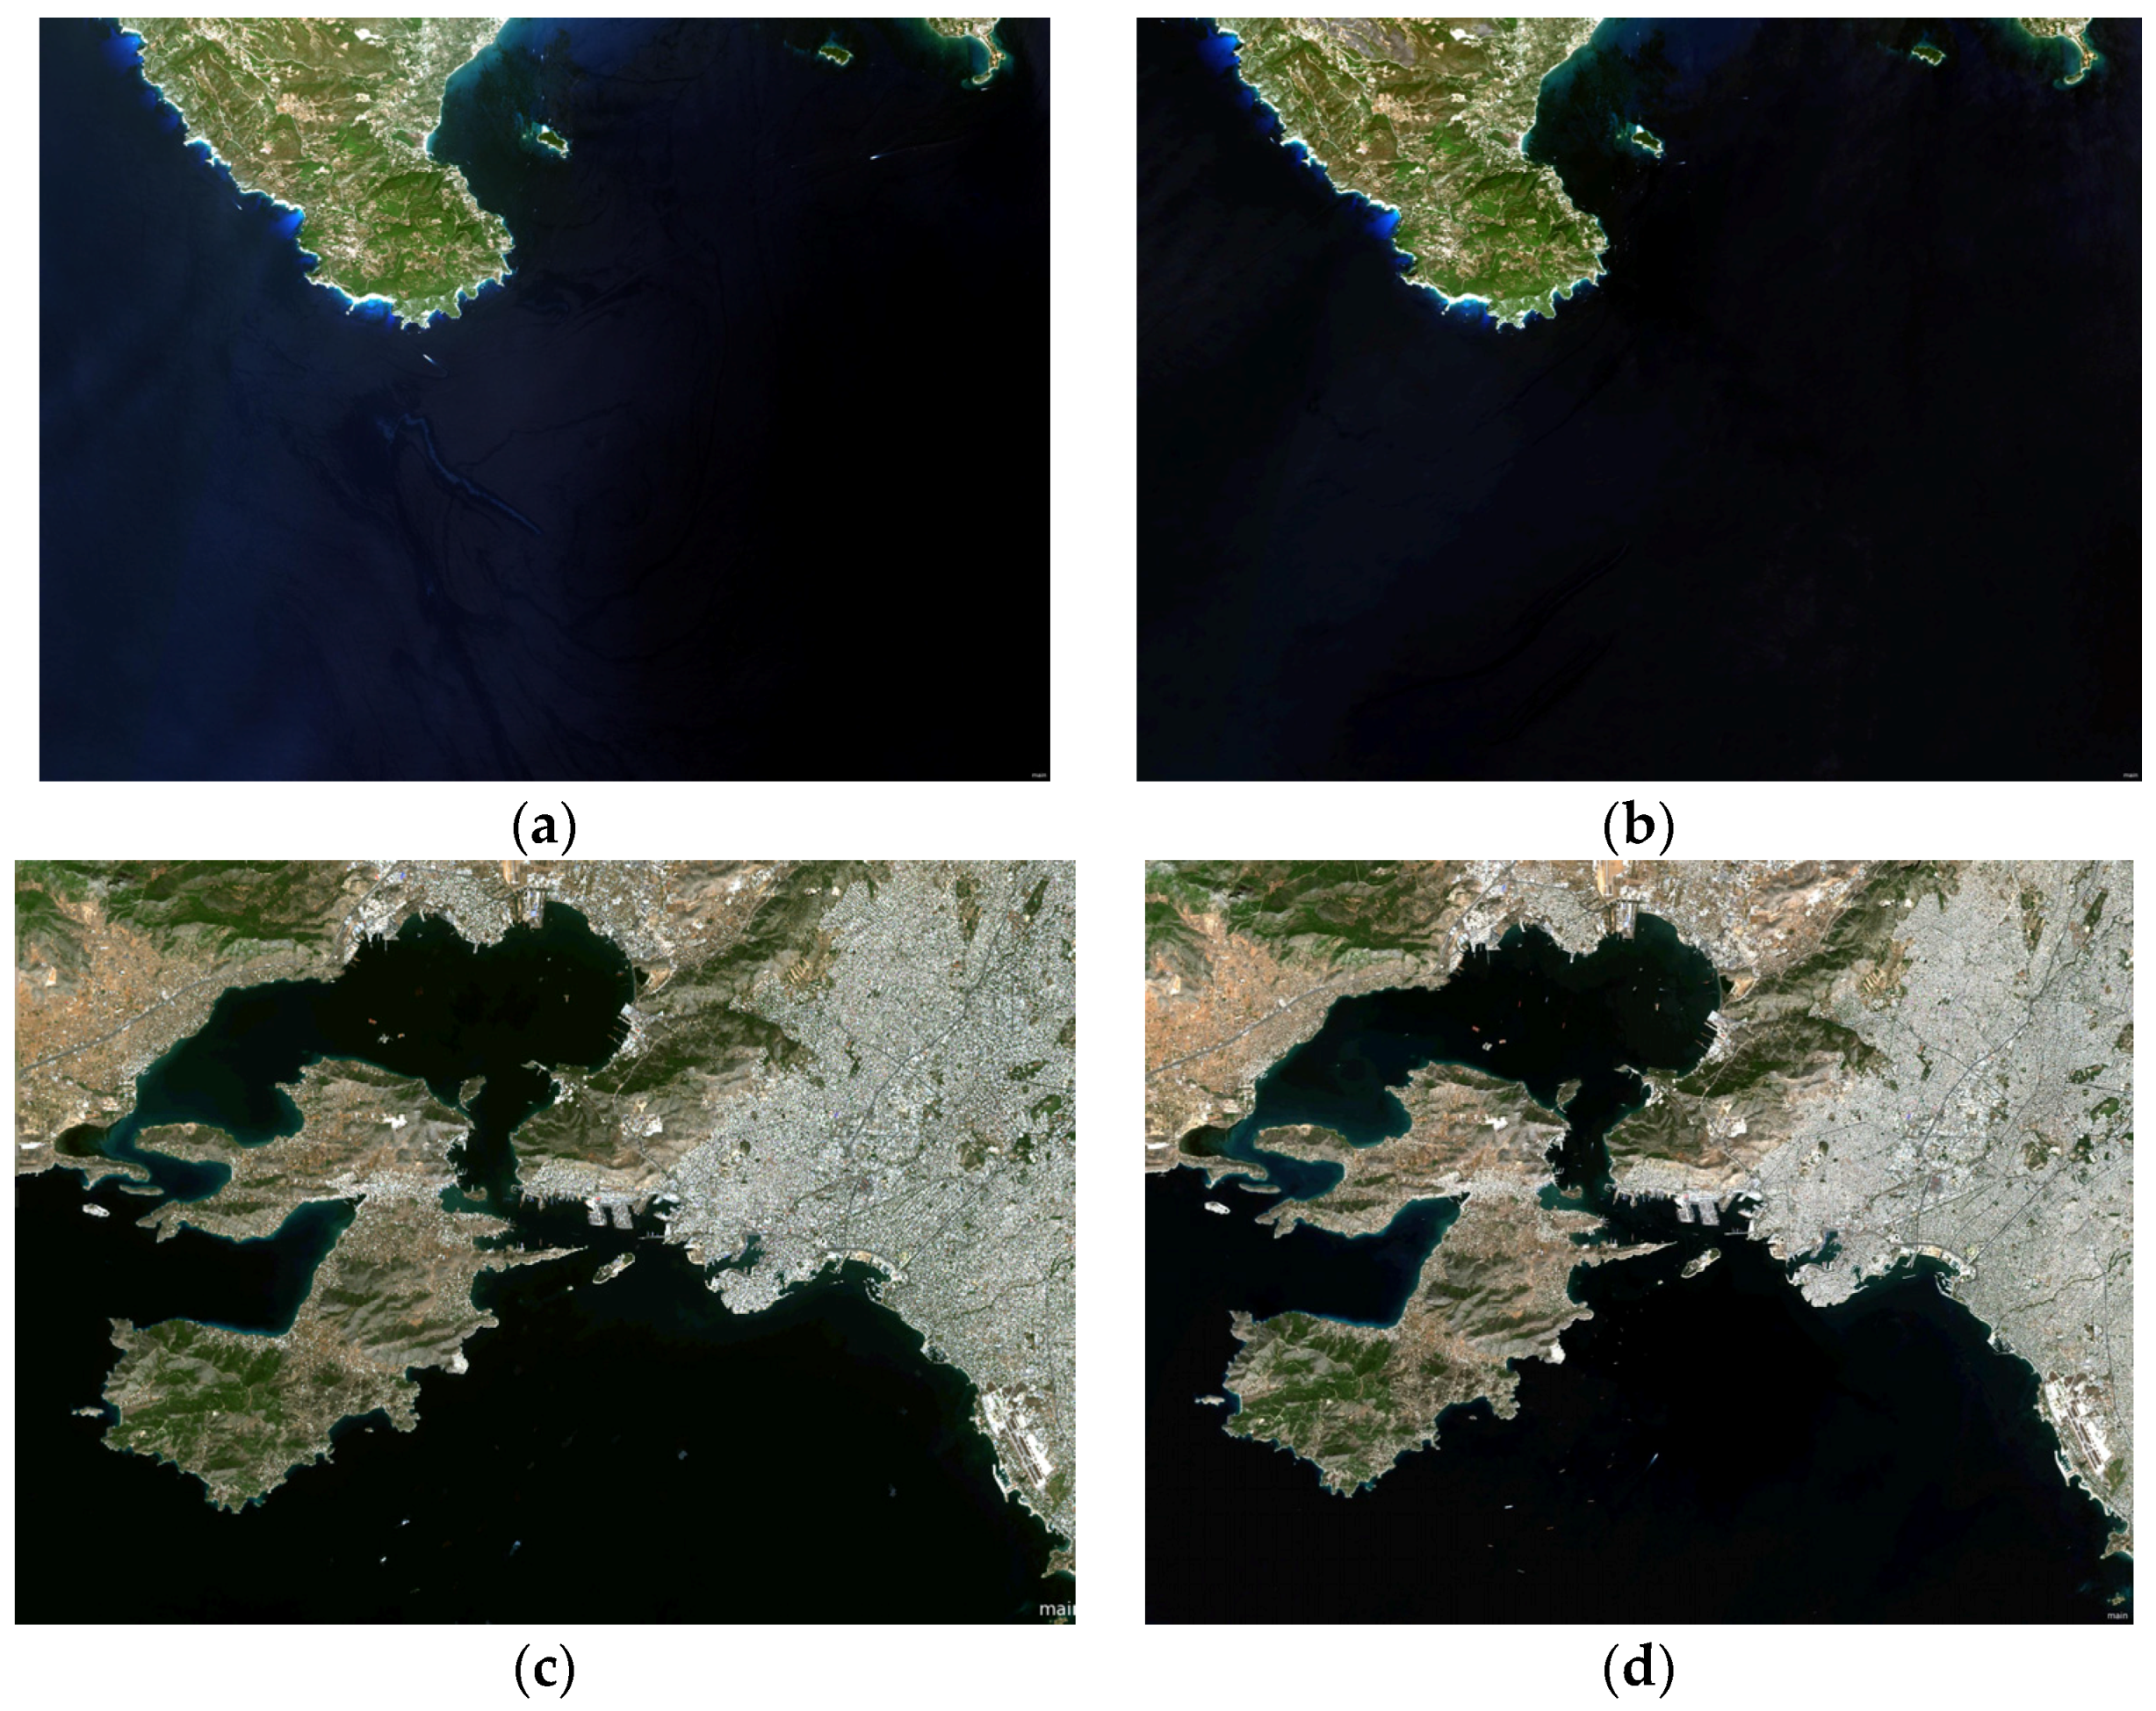
In this work three Sentinel 2A and one Sentinel 2B images have been used (Table 1). Furthermore, two Sentinel 1A/1B images (Table 1) have initially been used for identifying the oil spill caused by the “Agia Zoni II” tanker. Unfortunately, due to very low wind speeds in the days following the “Agia Zoni II” sinking, the oil spill could not be safely detected on the Sentinel 1A and 1B images (Figure 2).
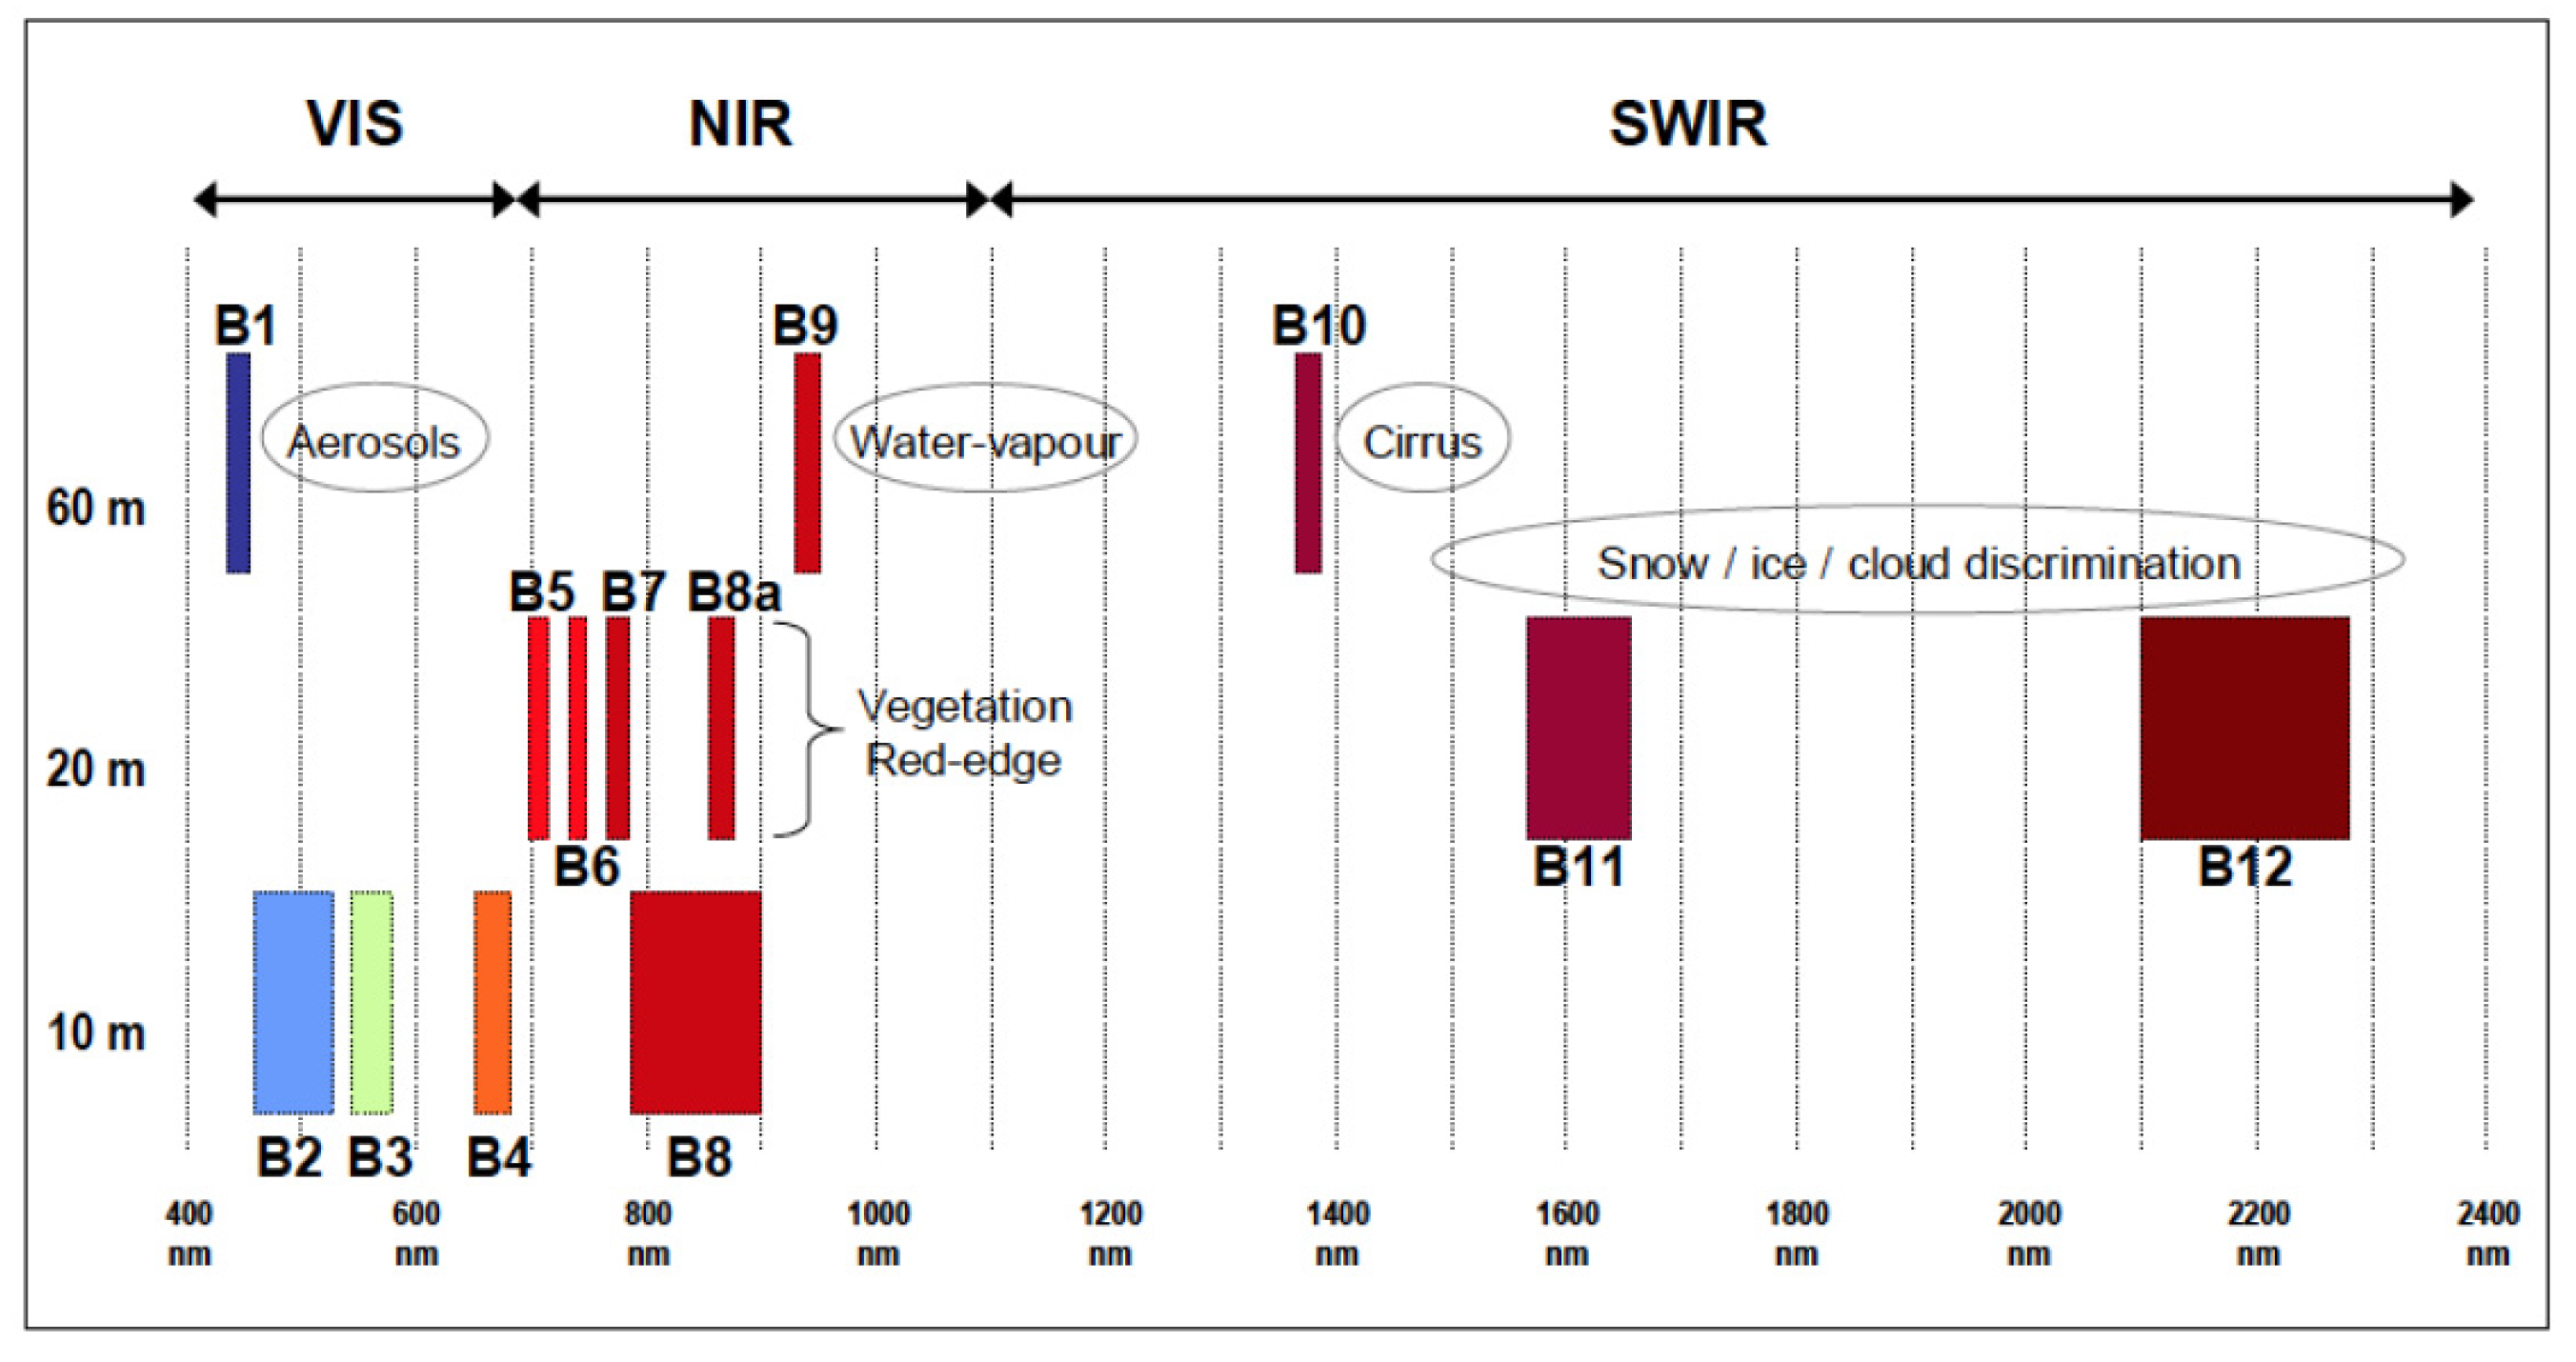
For the object-based image analysis of the Sentinel 2 images, bands 1, 2, 3, 4, 8, 9, and 11 were used. The spatial and spectral characteristics of the Sentinel 2A and 2Bimage bands are shown in Figure 3. The images were preprocessed (import, resampling to same resolution, subset) in Sentinel Application Platform (SNAP) 5.0, but were not atmospherically corrected since the relevant module sen2cor is not appropriate for water surfaces. Other, still experimental tools like ACOLITE and C2RCC (the latter available in SNAP 6.0 prerelease) will be tried in the future. OBIA of appropriate subsets of the Sentinel 2A and 2B images (Figure 4) has been carried out with eCognition Developer 8.7.
2.3. The Developed Methodology
Initial step for any OBIA methodology is the segmentation of the remote sensing images in order to create image objects. Segmentation involves merging the pixels in the image into image object primitives called objects or segments with certain homogeneity and geometric criteria. Multiresolution segmentation is a process that creates several levels with image objects at various scales. Lower-level image objects (sub-objects) are smaller in size while higher-level image objects (super-objects) are larger. There is a topological restriction in multiresolution segmentation that smaller objects are contained but never intersect with larger objects. In eCognition the criteria used during multiresolution segmentation are: (a) the scale, which defines the maximum size of the objects; (b) the color and shape weights (with sum to 1 constraint), which give priority to spectral homogeneity or to shape characteristics; and (c) the smoothness and compactness weights (with sum to 1 constraint), which have to do with the shape characteristics and force the segmentation to create regular shaped or compact objects. Additionally, the weights of the image layers (bands), which are taken into consideration during segmentation, can be adjusted appropriately and it is a common practice that, unless needed, the lower-resolution image bands are not used during segmentation in order to achieve better image object shapes.
The basic spectral signature of an image object can be derived from the mean value of its pixels for every image band. Nevertheless, image objects have a large variety of useful features besides their spectral information; a few of them are listed later on since they have been used in this study (Table 2 and Table 3). Standard deviation (StdDev) can be calculated within an image object for every band. Brightness difference of an object to its neighbor, sub- or super-objects, or even to the whole scene can be calculated for every image band as well. Any custom ratio (e.g., B2/B11) or index (e.g., NDVI, NDWI, etc.) can be calculated for an object based on its mean values at the relevant image bands. Image objects also have geometric features like area, border length, length, width, length/width, etc. Additionally, in OBIA class-related features (e.g., distance to a certain class) are also available and can be applied after an initial classification. Thus, the final classification of an image object can depend on the classes of its neighbor, sub- or super-objects. In order to take these class-related features into consideration, OBIA classification procedures are usually iterative processes.
After several trials for the best segmentation of Sentinel 2 images for oil spill detection, it has been decided that the most appropriate procedure is the multiresolution segmentation of the images in two levels. The scope of the first level was to create small objects based mostly on spectral behavior, while the objects of the second level were much larger but as compact as possible in order to create uniform objects. The second level with the large objects was necessary as it has been shown [19] that one of the oil spill detection features is the brightness difference of the smaller with the larger objects.
The segmentation parameters that have been used can be summarized as follows:
- Level-1 segmentation (small objects)
- Weight for high resolution (10 m) bands 2, 3, 4, and 8:1
- Weight for lower resolution (60 and 20 m) bands 1, 9, and 11:0
- Scale 10, color 0.8—shape 0.2, compactness 0.5—smoothness 0.5
- Level-2 segmentation (large objects)
- Weight for high resolution (10 m) bands 2, 3, 4, and 8:1
- Weight for lower resolution (60 and 20 m) bands 1, 9, and 11:0
- Scale 80, color 0.1—shape 0.9, compactness 1.0—smoothness 0.0
Using the above scale parameters and segmentation criteria, the size of the image objects of the lower level (Level 1) ranged from 0.001 to 0.15 km2, while the image objects of the upper level (Level 2) ranged from 0.3 to 1.5 km2.
After segmentation, interpretation of the images and examination of various features of the image objects in various band ratios has been performed. After several trials it has been decided that the following ratios had to be used:
As already pointed out in [19], the oil spill objects present higher standard deviation and higher brightness compared to their much larger super-objects (Figure 5b, Figure 6b, and Figure 7b). In addition, the ratio B2/B11 proved to perform well in the detection of oil spill areas when away from sun-glint, while the custom feature StdDev(B2)*B2/B11 proved to be a much better indicator of oil spill objects even in sun-glint areas. Their combined use provided the best results.
Figure 8 summarizes the OBIA method developed within this study for the detection of oil spills using Sentinel 2 imagery, for single date processing. The criterion “Distance to neighbor land objects” has been set in order to avoid misclassification of shallow waters as oil spills due to bottom contributions in the reflectance values.
Table 2 summarizes the fuzzy rule set values that have been used for the image object features used.
There is a drawback to using single-date images: false detection of oil spills in areas of high bottom reflectance. This mostly happens close to the seashore, but could also happen in areas of low depth elsewhere. The best way to avoid these errors is to use multitemporal imagery and require that the oil spill is detected only in one image. The combined use of multitemporal images is shown in Figure 9. In case application of the multitemporal mode of the proposed methodology is not possible, it is better to keep oil spill detection at a sufficiently large distance from the seashore using the “distance from land” rule (Figure 8).
Table 3 summarizes the fuzzy rule set values for the multitemporal OBIA method. These values have been applied to all the Sentinel images used in this work, providing successful oil spill detection results.
3. Results
Figure 10a–c presents the classification results for Zakynthos, 7 August 2017; Zakynthos, 27 August 2017; and the Saronic Gulf, respectively. The Sentinel 2 images of Zakynthos and the Saronic Gulf have been processed with both the single-date and multitemporal OBIA methods, with the latter providing better results. No ground truth was available for any of these areas, but: (a) the natural oil spill of Zakynthos is a well-known area whose behavior has been studied by Kolokoussis et al. [19], and accurate results can be drawn by photointerpretation; and (b) the oil spill detections on the Saronic Gulf image are realistic and in accordance with the reported seashore pollution. According to careful photointerpretation of the images, the Zakynthos classification results, at least for the known natural flow, are considered very successful. Moreover, evidence of smaller natural outflows close to the shore (Figure 10a,b) is also provided. The Saronic Gulf image oil spill classification seems to present a significant commission error close to the refinery area at the north of Salamina Island, which cannot be linked to the sinking of the Agia Zoni II. If indeed false, this detection has to be studied further. Since this is a more complex and unstudied area, ground truth would be necessary in order to estimate the classification accuracy and, thus, no further processing was carried out at this point.
4. Discussion
Sentinel 2 imagery offers fine spatial and spectral resolution for oil spill detection, and the proposed methodology seems to provide successful results in the case of natural oil outflows as well as light oil spill events. The proposed oil spill detection methodology has been based on OBIA, which is considered to be of fundamental importance. Some of the main image object features (standard deviation within an object, brightness difference to larger super objects, and size of objects) that were used for the detection cannot be utilized by pixel-based classification methods. Moreover, class-related features are not available in most pixel-based classifiers. Among the two proposed methods, the first method can be applied on single-date images, but its results will suffer from some commission errors in shallow water. The second method is applied on multitemporal data, with one image acquired on a date without oil spills and a second one after an oil spill event. With the latter method, the aforementioned commission errors in shallow water can be successfully avoided.
The proposed multitemporal OBIA methodology has provided very accurate results and is in accordance with the previous work of the authors [19], where Ikonos, QuickBird, RapidEye, and Landsat Thematic Mapper (TM) images were used for the detection of natural oil flows. Sentinel 2 gives timely and freely available satellite image data and, due to the fine resolution, provides much better results than Landsat imagery, comparable to those achieved with the high-resolution satellite images in [19]. The proposed methodology has been tested on natural oil outflows as well as light oil spill events but has not been tested on heavy oil spill events like the Deep Horizon oil spill [21], which are known to have different spectral behavior.
Atmospheric corrections are a very important preprocessing step in remote sensing, but the existing algorithms for water areas are still experimental and thus were not used at this point, but should be used in future experiments. Ground truth data are of fundamental importance for the development of any remote sensing methodology, but in the case of oil spills it is very difficult to organize and carry out this type of data collection. The main reason for this is that there are absolute restrictions concerning experiments with oil in seawater, and thus someone has to be ready to act only when an oil spill event takes place. Nevertheless, this work has to be validated in the future with ground truth data in order to derive valid conclusions.
5. Conclusions
Two OBIA methods have been developed and used on Sentinel 2 imagery in order to detect oil spills, with the latter providing more consistent results. The first method can be applied on a single date Sentinel 2 image, but its results suffer from some commission errors in shallow water areas. For improving the methodology performance for oil-spill events close to shore, a second improved multitemporal method has also been proposed. Using this method, oil spills close to shore, such as those caused by the accident of the Agia Zoni II tanker in the Saronic Gulf, have been successfully detected. The preliminary results are considered successful and consistent, with a high degree of applicability to other Sentinel 2 satellite images. Further testing and fine tuning of the proposed object-based methodology has to be carried out using atmospheric correction and ground truth.
Acknowledgments
This study has received funding from the Horizon 2020 research and innovation program under the Marie Sklodowska-Curie grant agreement No. 691071. We would like to thank the European Space Agency (ESA) for supplying the Sentinel-1 and 2 images.
Author Contributions
V. Karathanassi had a major contribution to the literature review and scientific background; P. Kolokoussis conceived, designed and performed the experiments; P. Kolokoussis and V. Karathanassi discussed/evaluated the results and wrote the paper.
Conflicts of Interest
The authors declare no conflict of interest.
References
- Brown, H.M.; Bittner, J.P.; Goodman, R.H. The Limits of Visibility of Spilled Oil Sheens. In Proceedings of the Erim Conferences, Second Thematic International Airborne Remote Sensing Conference and Exhibition, San Francisco, CA, USA, 24–27 June 1996; Volume III, p. 327. [Google Scholar]
- Klemas, V. Tracking Oil Slicks and Predicting their Trajectories Using Remote Sensors and Models: Case Studies of the Sea Princess and Deepwater Horizon Oil Spills. J. Coast. Res. 2010, 26, 789–797. [Google Scholar] [CrossRef]
- Karathanassi, V. Spectral Unmixing Evaluation for Oil Spill Characterization. Int. J. Remote Sens. Appl. 2014, 4. [Google Scholar] [CrossRef]
- Clark, R.N.; Swayze, G.A.; Leifer, I.; Livo, K.E.; Lundeem, S.; Eastwood, M.; Green, R.O.; Kokaly, R.; Hoefen, T.; Sarture, C.; et al. A Method for Qualitative Mapping of Thick Oil Using Imaging Spectroscopy; United States Geological Survey: Reston, GA, USA, 2010. Available online: http://pubs.usgs.gov/of/2010/1101 (accessed on 11 October 2017).
- Hu, C.; Weisberg, R.H.; Liu, Y.; Zheng, L.; Daly, K.L.; English, D.C.; Zhao, J.; Vargo, G.A. Did the northeastern Gulf of Mexico become greener after the Deepwater Horizon oil spill? Geophys. Res. Lett. 2011, 38, L09601. [Google Scholar] [CrossRef]
- Carnesecchi, F.; Byfield, V.; Cipollini, P.; Corsini, G.; Diani, M. An optical model for the interpretation of remotely sensed multispectral images of oil spill. In Proceedings of the SPIE 2008, Remote Sensing of the Ocean, Sea Ice, and Large Water Regions, Cardiff, UK, 15–18 September 2008; Volume 7105. [Google Scholar] [CrossRef]
- Zhao, J.; Temimi, M.; Ghedira, H.; Hu, C. Exploring the potential of optical remote sensing for oil spill detection in shallow coastal waters—A case study in the Arabian Gulf. Opt. Express 2014, 22, 13755–13772. [Google Scholar] [CrossRef] [PubMed]
- Lee, M.S.; Park, K.A.; Lee, H.R. Detection and dispersion of oil spills from satellite optical images in a coastal bay. In Proceedings of the 2016 IEEE International Geoscience and Remote Sensing Symposium (IGARSS), Beijing, China, 10–15 July 2016. [Google Scholar]
- Taravat, A.; Del Frate, F. Development of band ratioing algorithms and neural networks to detection of oil spills using Landsat ETM+ data. EURASIP J. Adv. Signal Process. 2012, 2012, 107. [Google Scholar] [CrossRef]
- Bradford, N.B.; Sanchez-Reyes, P.J. Automated oil spill detection with multispectral imagery. In Proceedings of the SPIE 8030, Ocean Sensing and Monitoring III, Orlando, FL, USA, 25–29 April 2011; Volume 8030. [Google Scholar] [CrossRef]
- Corucci, L.; Nardellib, F.; Cococcionia, M. Oil Spill Classification from Multi-Spectral Satellite Images: Exploring Different Machine Learning Techniques. In Proceedings of the Remote Sensing of the Ocean, Sea Ice, and Large Water Regions 2010, Toulouse, France, 20–23 September 201.
- Karathanassi, V.; Topouzelis, K.; Pavlakis, P.; Rokos, D. An object-oriented methodology to detect oil spills. Int. J. Remote Sens. 2006, 27, 5235–5251. [Google Scholar] [CrossRef]
- Lang, H.; Zhang, X.; Xi, Y.; Zhang, X.; Li, W. Dark-spot segmentation for oil spill detection based on multi-feature fusion classification in single-pol synthetic aperture radar imagery. J. Appl. Remote Sens. 2017, 11, 015006. [Google Scholar] [CrossRef]
- Su, T.F.; Li, H.Y.; Liu, T.X. Sea Oil Spill Detection Method Using SAR Imagery Combined with Object-Based Image Analysis and Fuzzy Logic. Adv. Mater. Res. 2015, 1065–1069, 3192–3200. [Google Scholar] [CrossRef]
- Chen, Z.; Wang, C.; Teng, X. Oil spill detection based on a superpixel segmentation method for SAR image. In Proceedings of the2014 IEEE International Geoscience and Remote Sensing Symposium (IGARSS), Quebec City, QC, Canada, 13–18 July 2014. [Google Scholar]
- Topouzelis, K.; Kitsiou, D. Detection and classification of mesoscale atmospheric phenomena above sea in SAR imagery. Remote Sens. Environ. 2015, 160, 263–272. [Google Scholar] [CrossRef]
- Topouzelis, K. Oil spill detection by SAR images: Approaches and Algorithms. Invited paper for the special issue: Synthetic Aperture Radar (SAR). Sensors 2008, 8, 6642–6659. [Google Scholar] [CrossRef] [PubMed] [Green Version]
- Maianti, P.; Rusmini, M.; Tortini, R.; Gianinetto, M. Monitoring large oil slick dynamics with moderate resolution multispectral satellite data. Nat. Hazards 2014, 73, 473–492. [Google Scholar] [CrossRef]
- Kolokoussis, P.; Karathanassi, V. Detection of Oil Spills and Underwater Natural Oil Outflow Using Multispectral Satellite Imagery. Int. J. Remote Sens. Appl. 2013, 3, 145–154. [Google Scholar]
- Reiche, J.; Hese, S.; Schmullius, C. Objektbasierte Klassifikation terrestrischer Ölverschmutzungen mittel shochauflösender Satellitendaten in West-Sibirien. Photogramm. Fernerkund. Geoinf. 2017, 11, 275–288. [Google Scholar]
- Liu, Y.; MacFadyen, A.; Ji, Z.G.; Weisberg, R.H. (Eds.) Monitoring and Modeling the Deepwater Horizon Oil Spill: A Record-Breaking Enterprise; Geophysical Monograph Series; AGU/Geopress: Washington, DC, USA, 2011; Volume 195, p. 271. [Google Scholar]
Figure 1.
Study areas A and B. Within area A, the purple arrow shows the location of the natural outflow. Within area B, the purple arrow shows the position where the “Agia Zoni II” tanker sunk, while the red arrows show the coastal areas affected by the oil spill (coordinate reference system of the map is WGS84/UTM zone 34 North).
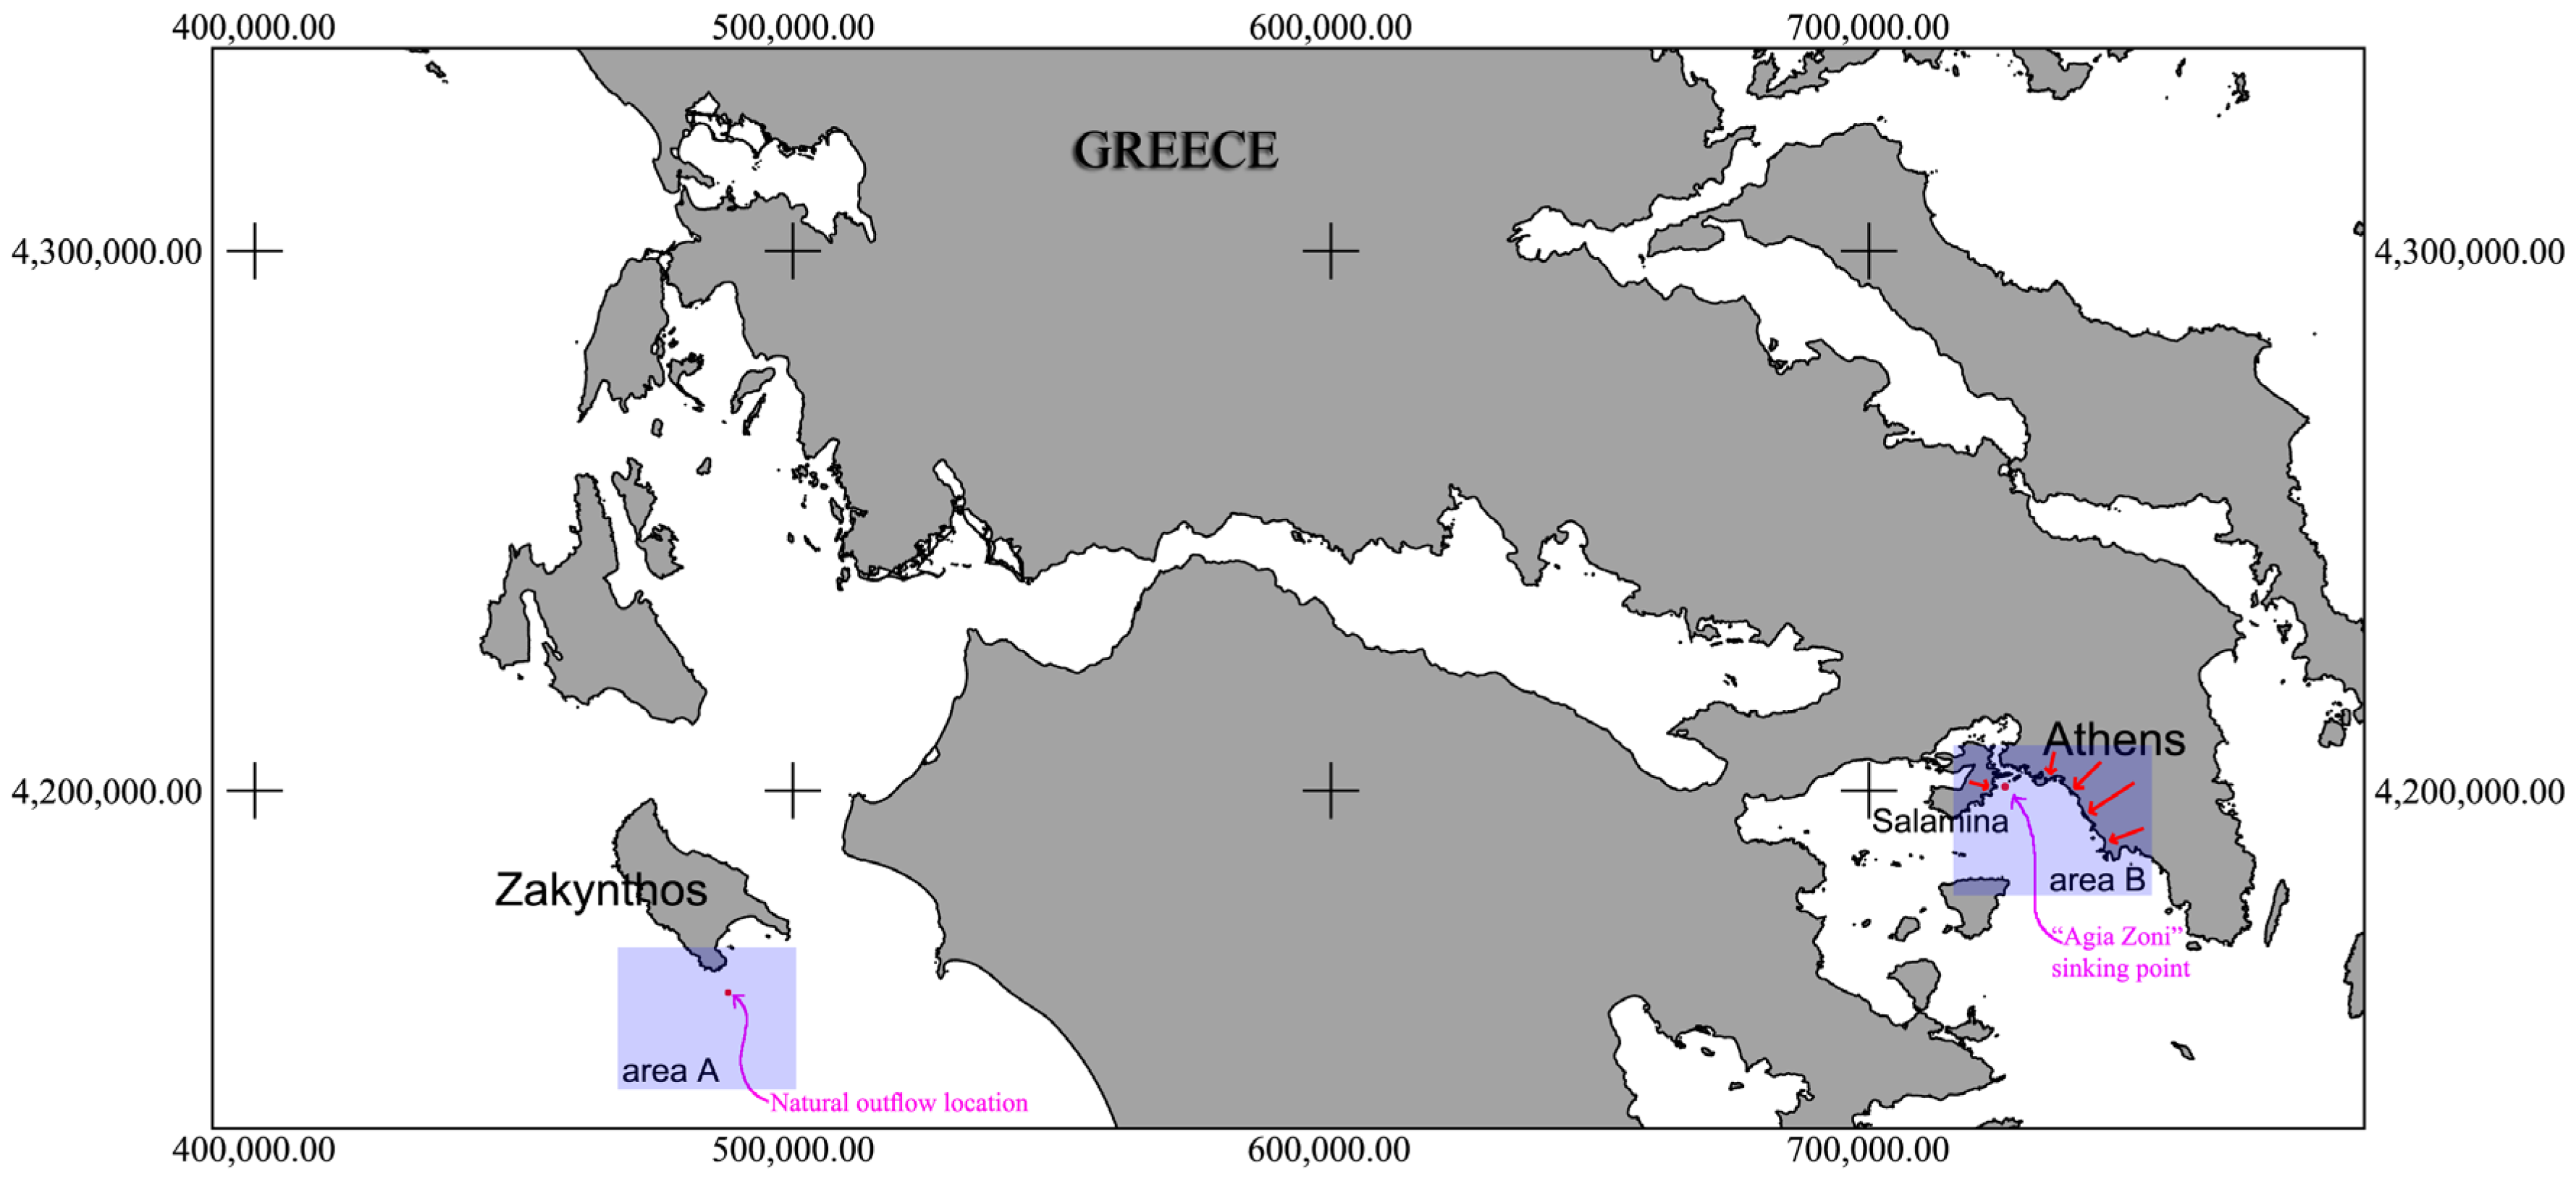
Figure 2.
Sentinel 1A and 1B images of the Saronic Gulf: (a) Sentinel 1B image of 14 September 2017; (b) Sentinel 1A image of 15 September 2017. Both images present large dark areas, caused by low wind speeds, which cannot be associated with oil spills.
Figure 2.
Sentinel 1A and 1B images of the Saronic Gulf: (a) Sentinel 1B image of 14 September 2017; (b) Sentinel 1A image of 15 September 2017. Both images present large dark areas, caused by low wind speeds, which cannot be associated with oil spills.
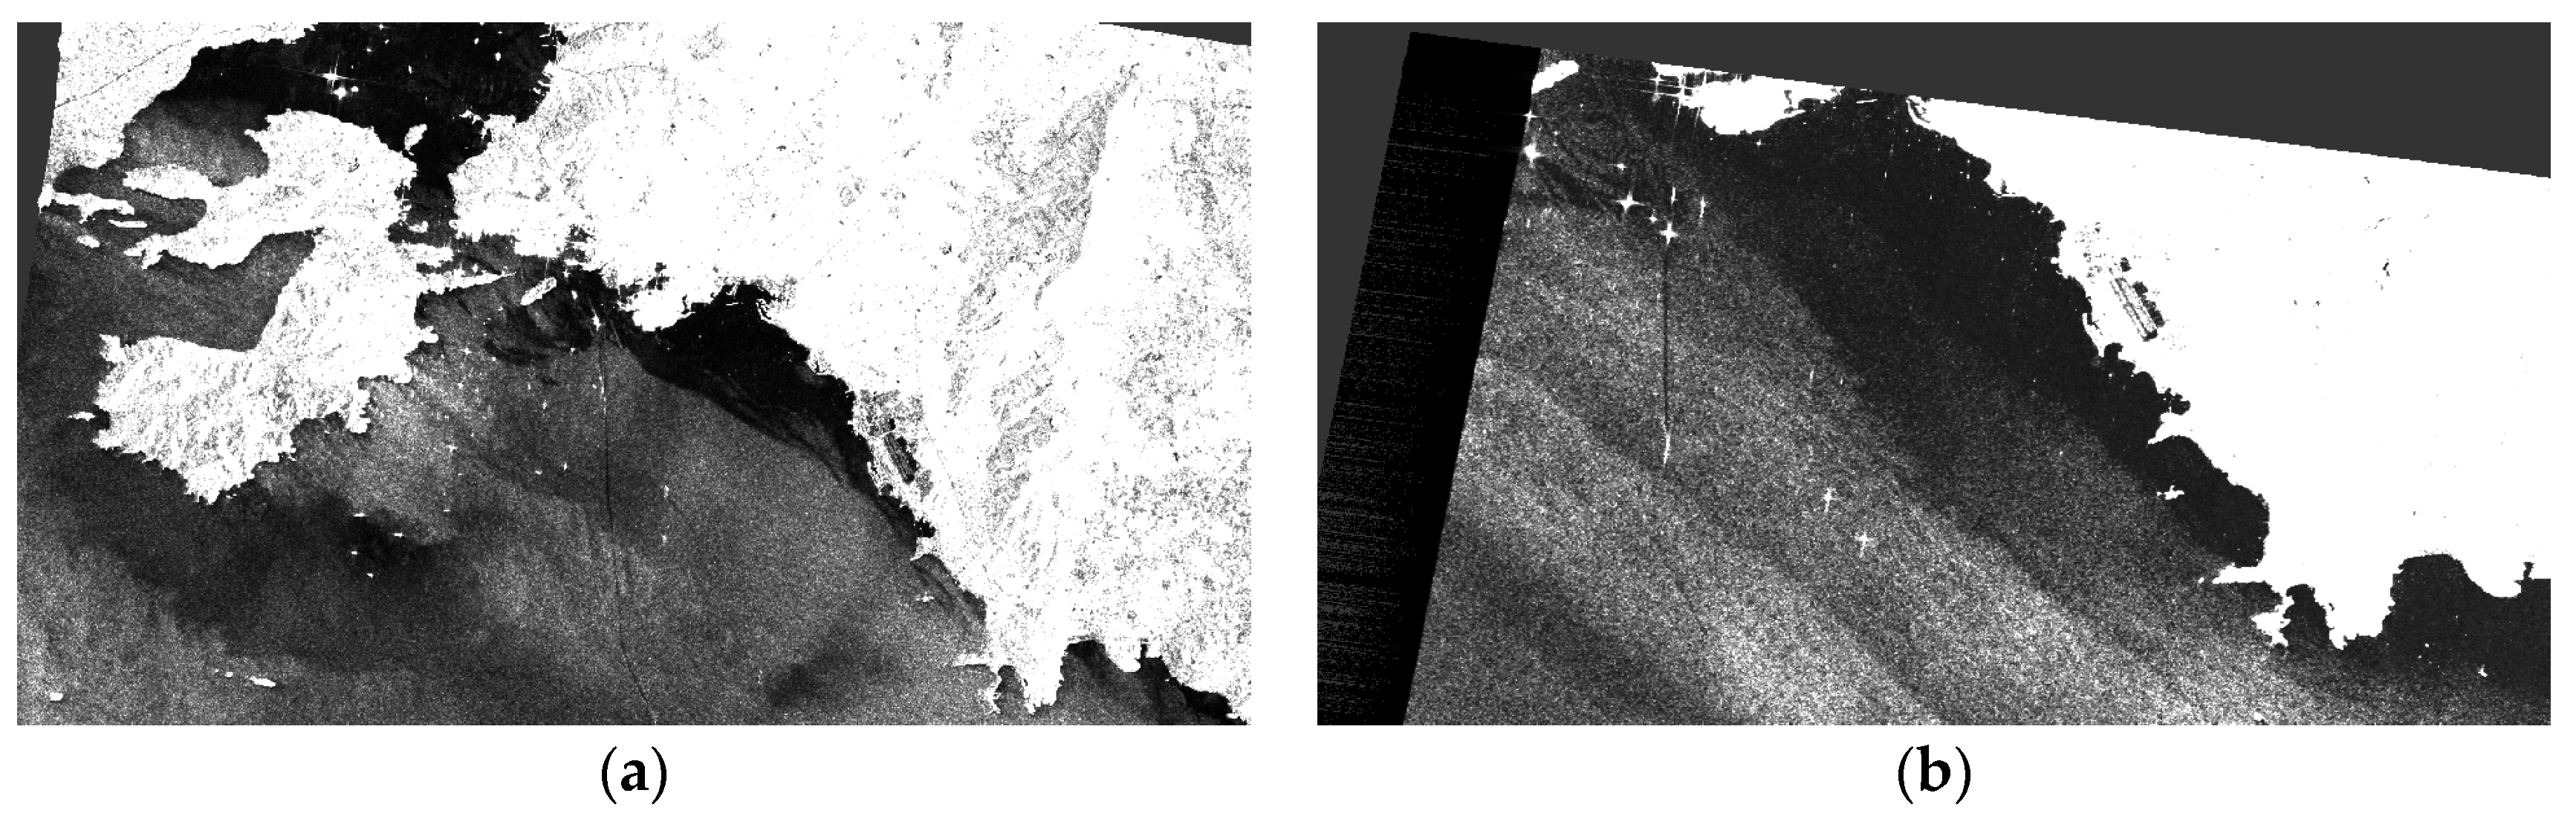
Figure 3.
The bands of Sentinel 2A and 2B.

Figure 4.
The Sentinel 2A subsets used for OBIA: (a) Zakynthos, 7 August 2017; (b) Zakynthos 27 August 2017; (c) Saronic Gulf (Salamina) 9 September 2017, before the oil spill event and (d) Saronic Gulf (Salamina) 13 September 2017, after the oil spill event. Natural color composite 432(RGB).
Figure 4.
The Sentinel 2A subsets used for OBIA: (a) Zakynthos, 7 August 2017; (b) Zakynthos 27 August 2017; (c) Saronic Gulf (Salamina) 9 September 2017, before the oil spill event and (d) Saronic Gulf (Salamina) 13 September 2017, after the oil spill event. Natural color composite 432(RGB).

Figure 5.
Image object features calculated for the Sentinel 2A subset of the Zakynthos image acquired on 7 August 2017: (a) NDWI; (b) Band 2 mean difference to super objects; (c) B2/B11; and (d) StdDev(B2)*B2/B1.
Figure 5.
Image object features calculated for the Sentinel 2A subset of the Zakynthos image acquired on 7 August 2017: (a) NDWI; (b) Band 2 mean difference to super objects; (c) B2/B11; and (d) StdDev(B2)*B2/B1.
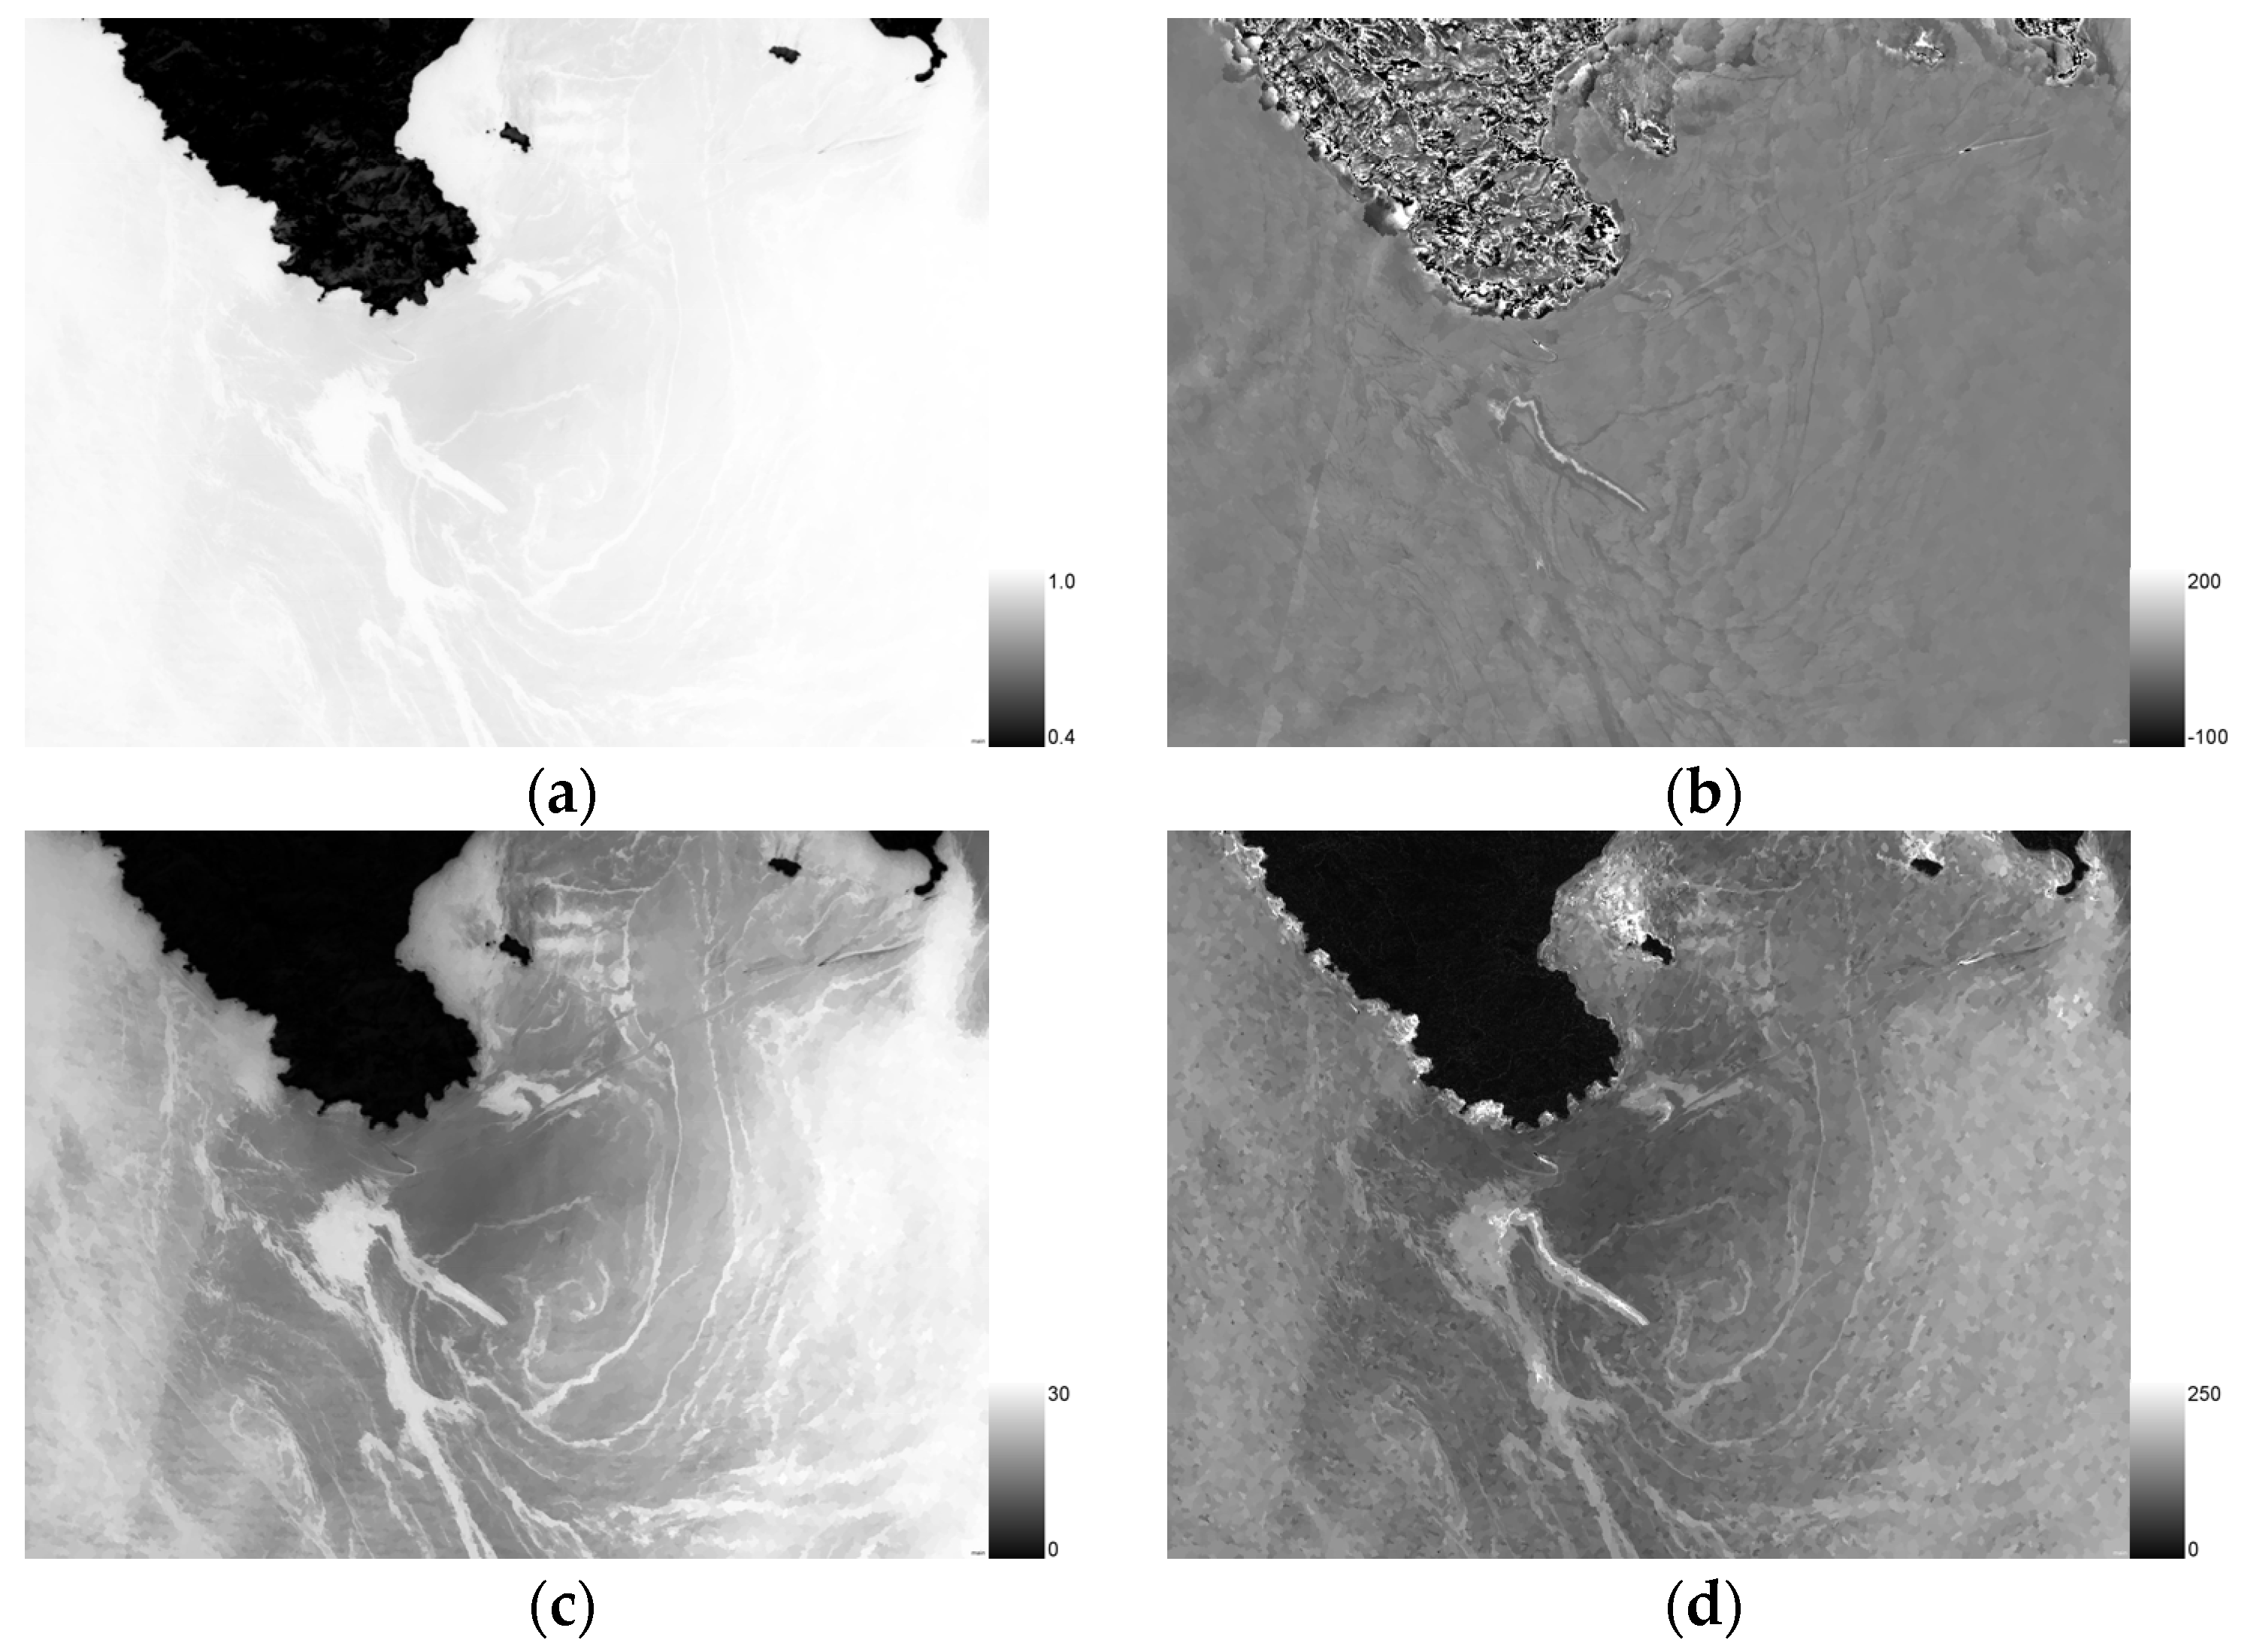
Figure 6.
Image object features calculated for the Sentinel 2A subset of the Zakynthos image acquired on 27 August 2017: (a) NDWI; (b) Band 2 mean difference to super objects; (c) B2/B11; and (d) StdDev(B2)*B2/B11.
Figure 6.
Image object features calculated for the Sentinel 2A subset of the Zakynthos image acquired on 27 August 2017: (a) NDWI; (b) Band 2 mean difference to super objects; (c) B2/B11; and (d) StdDev(B2)*B2/B11.
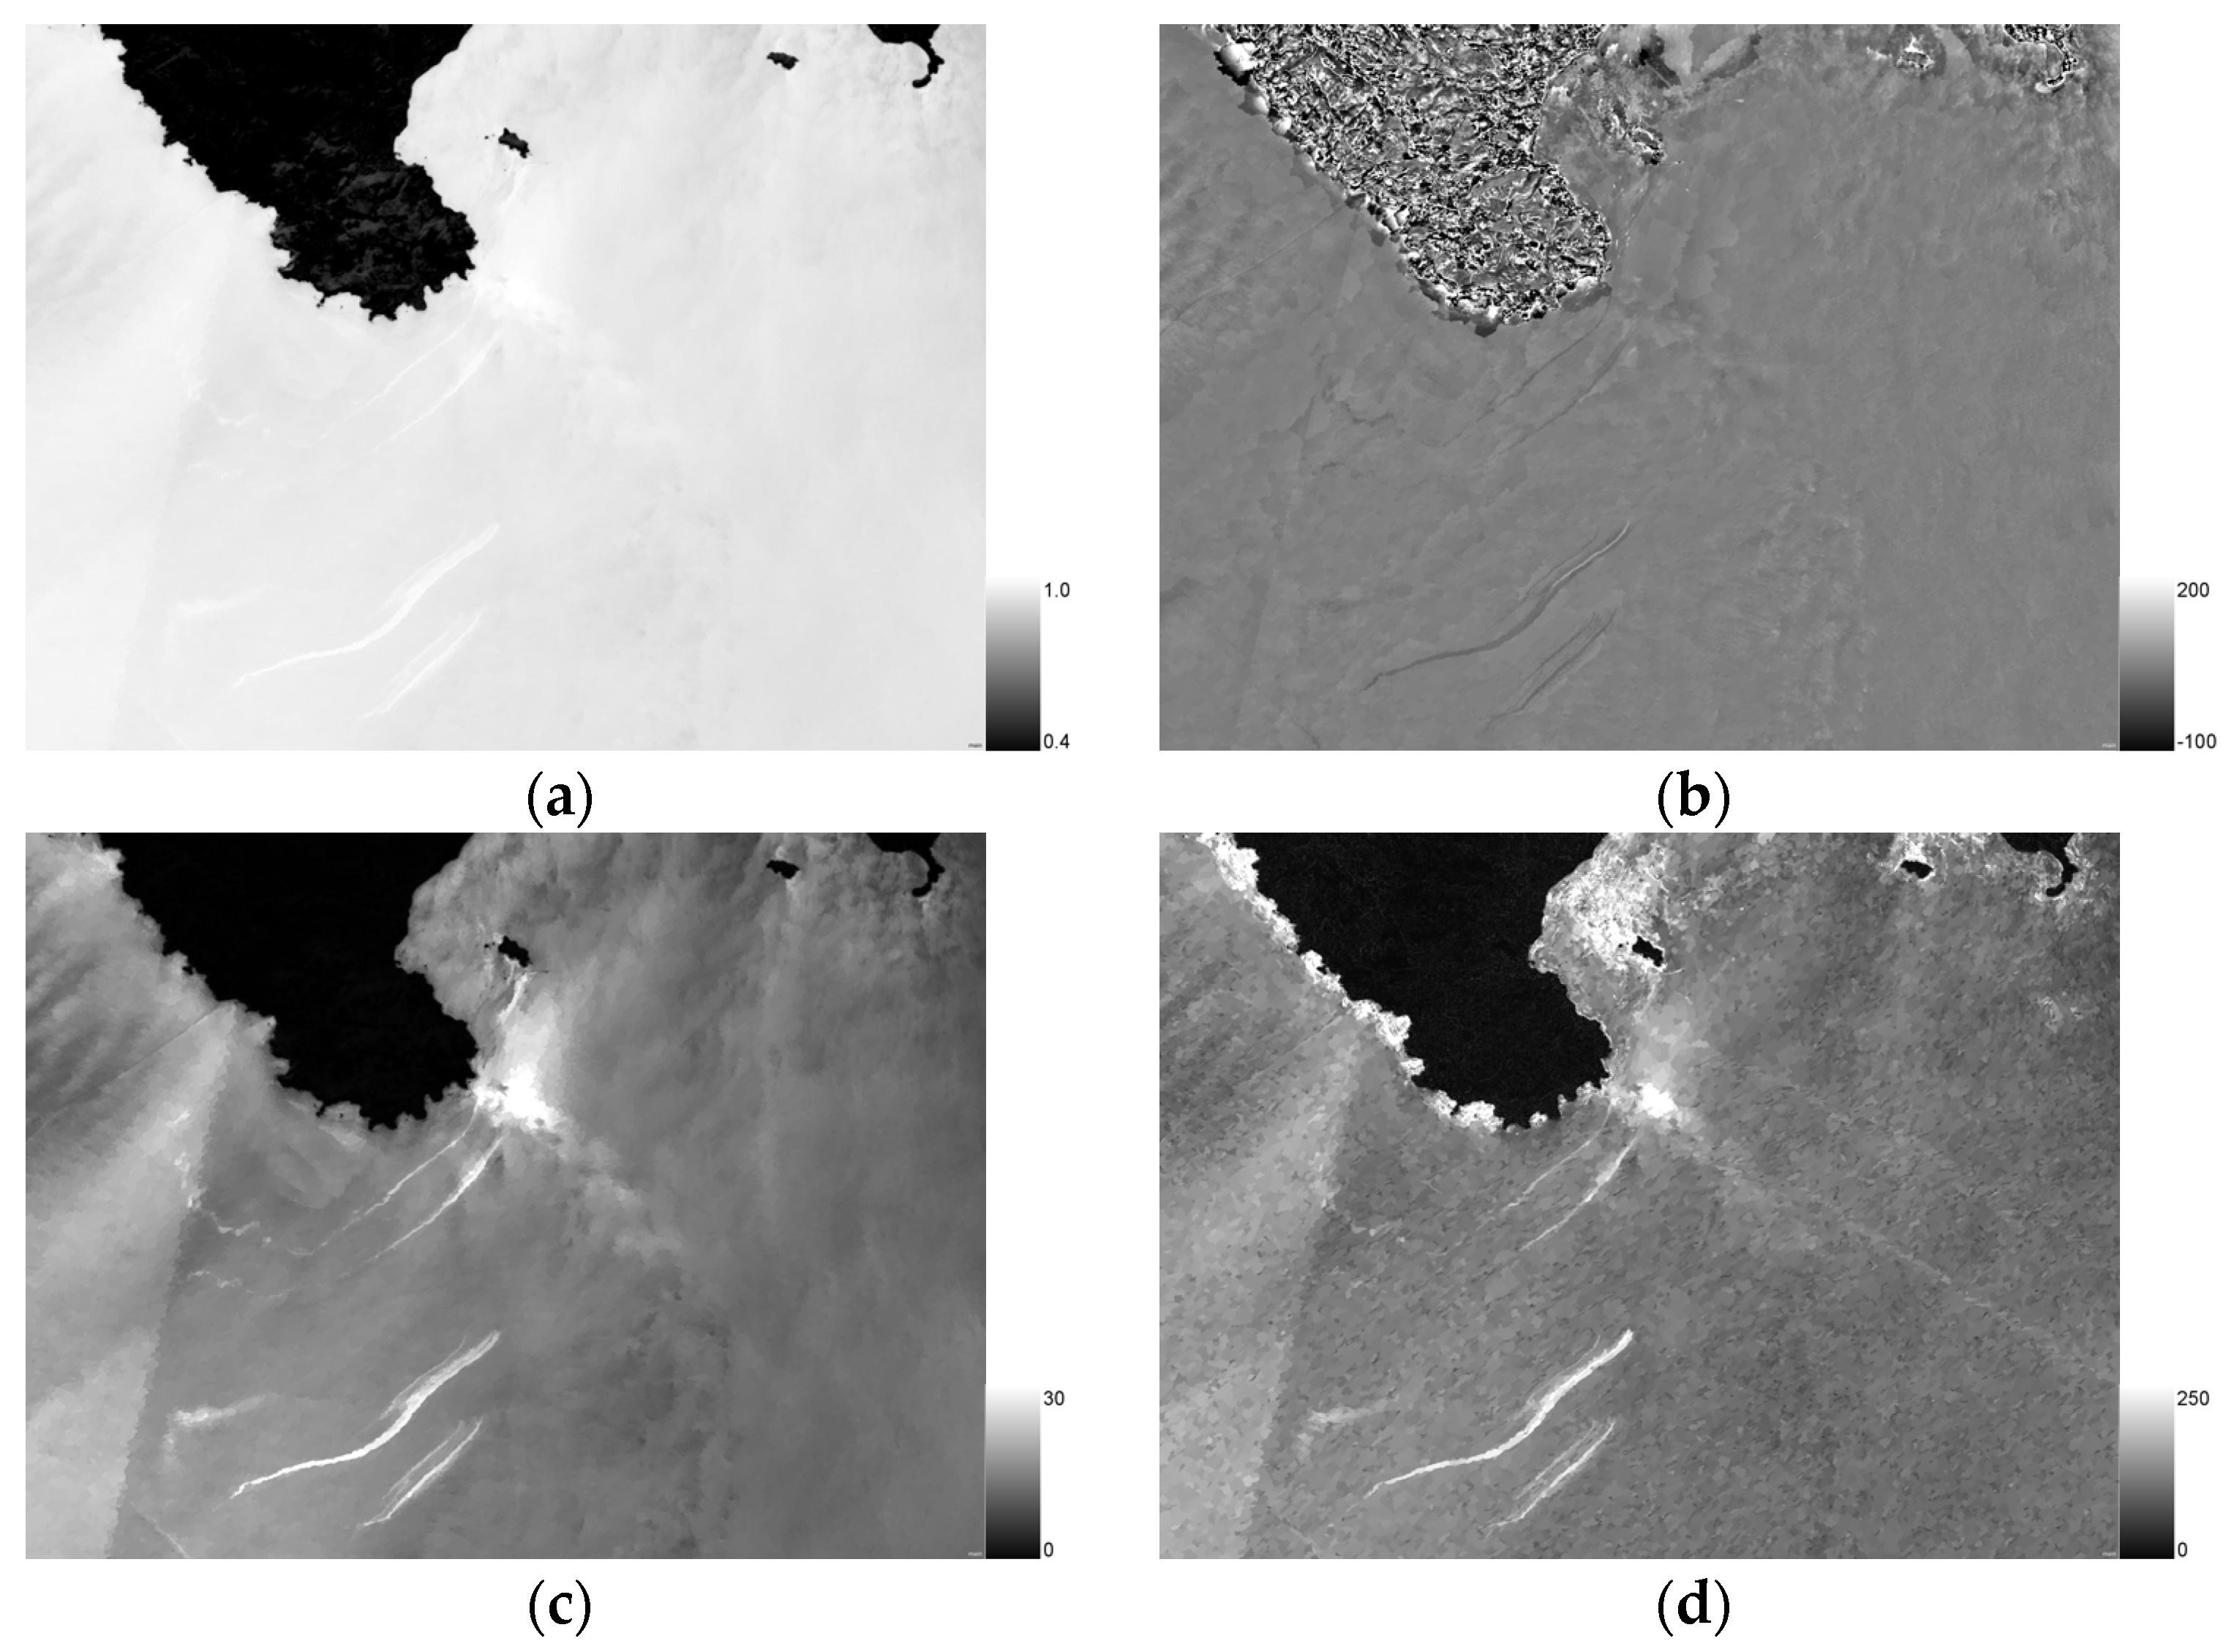
Figure 7.
Image object features calculated for the Sentinel 2A subset of the Saronic Gulf image acquired on 13 September 2017: (a) NDWI; (b) Band 2 mean difference to super objects; (c) B2/B11; and (d) StdDev(B2)*B2/B11.
Figure 7.
Image object features calculated for the Sentinel 2A subset of the Saronic Gulf image acquired on 13 September 2017: (a) NDWI; (b) Band 2 mean difference to super objects; (c) B2/B11; and (d) StdDev(B2)*B2/B11.
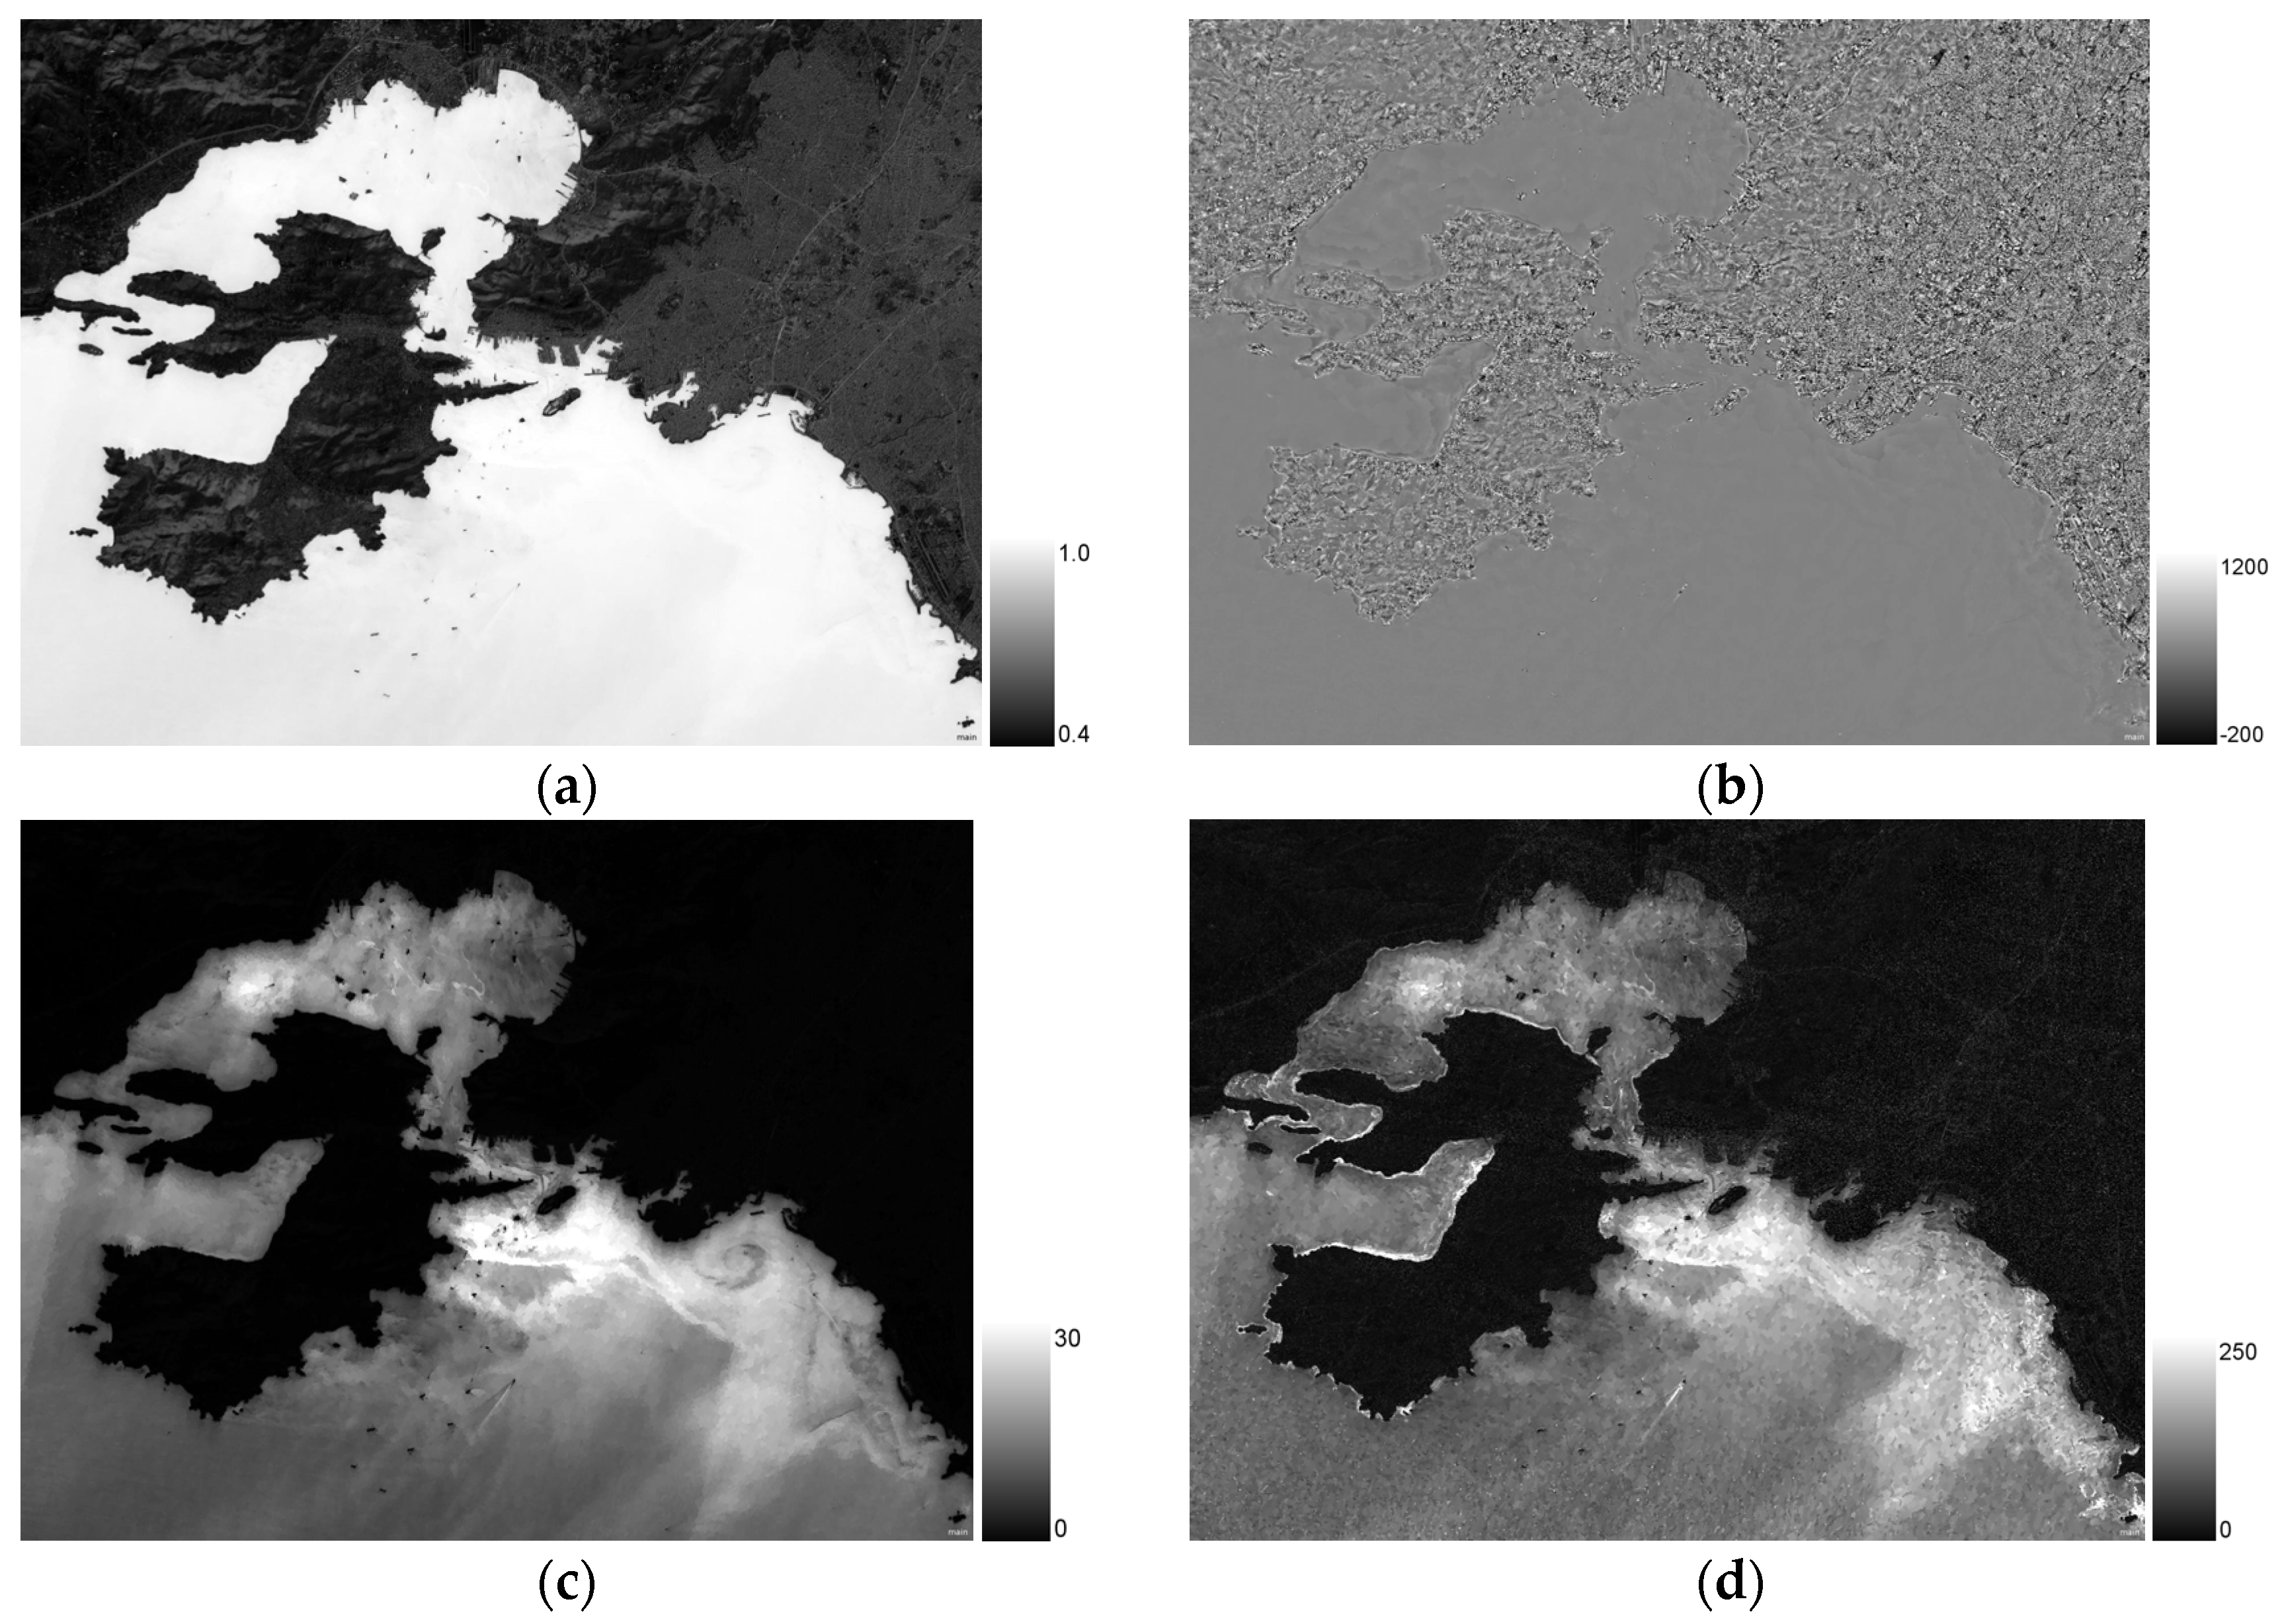
Figure 8.
Single-date OBIA method.
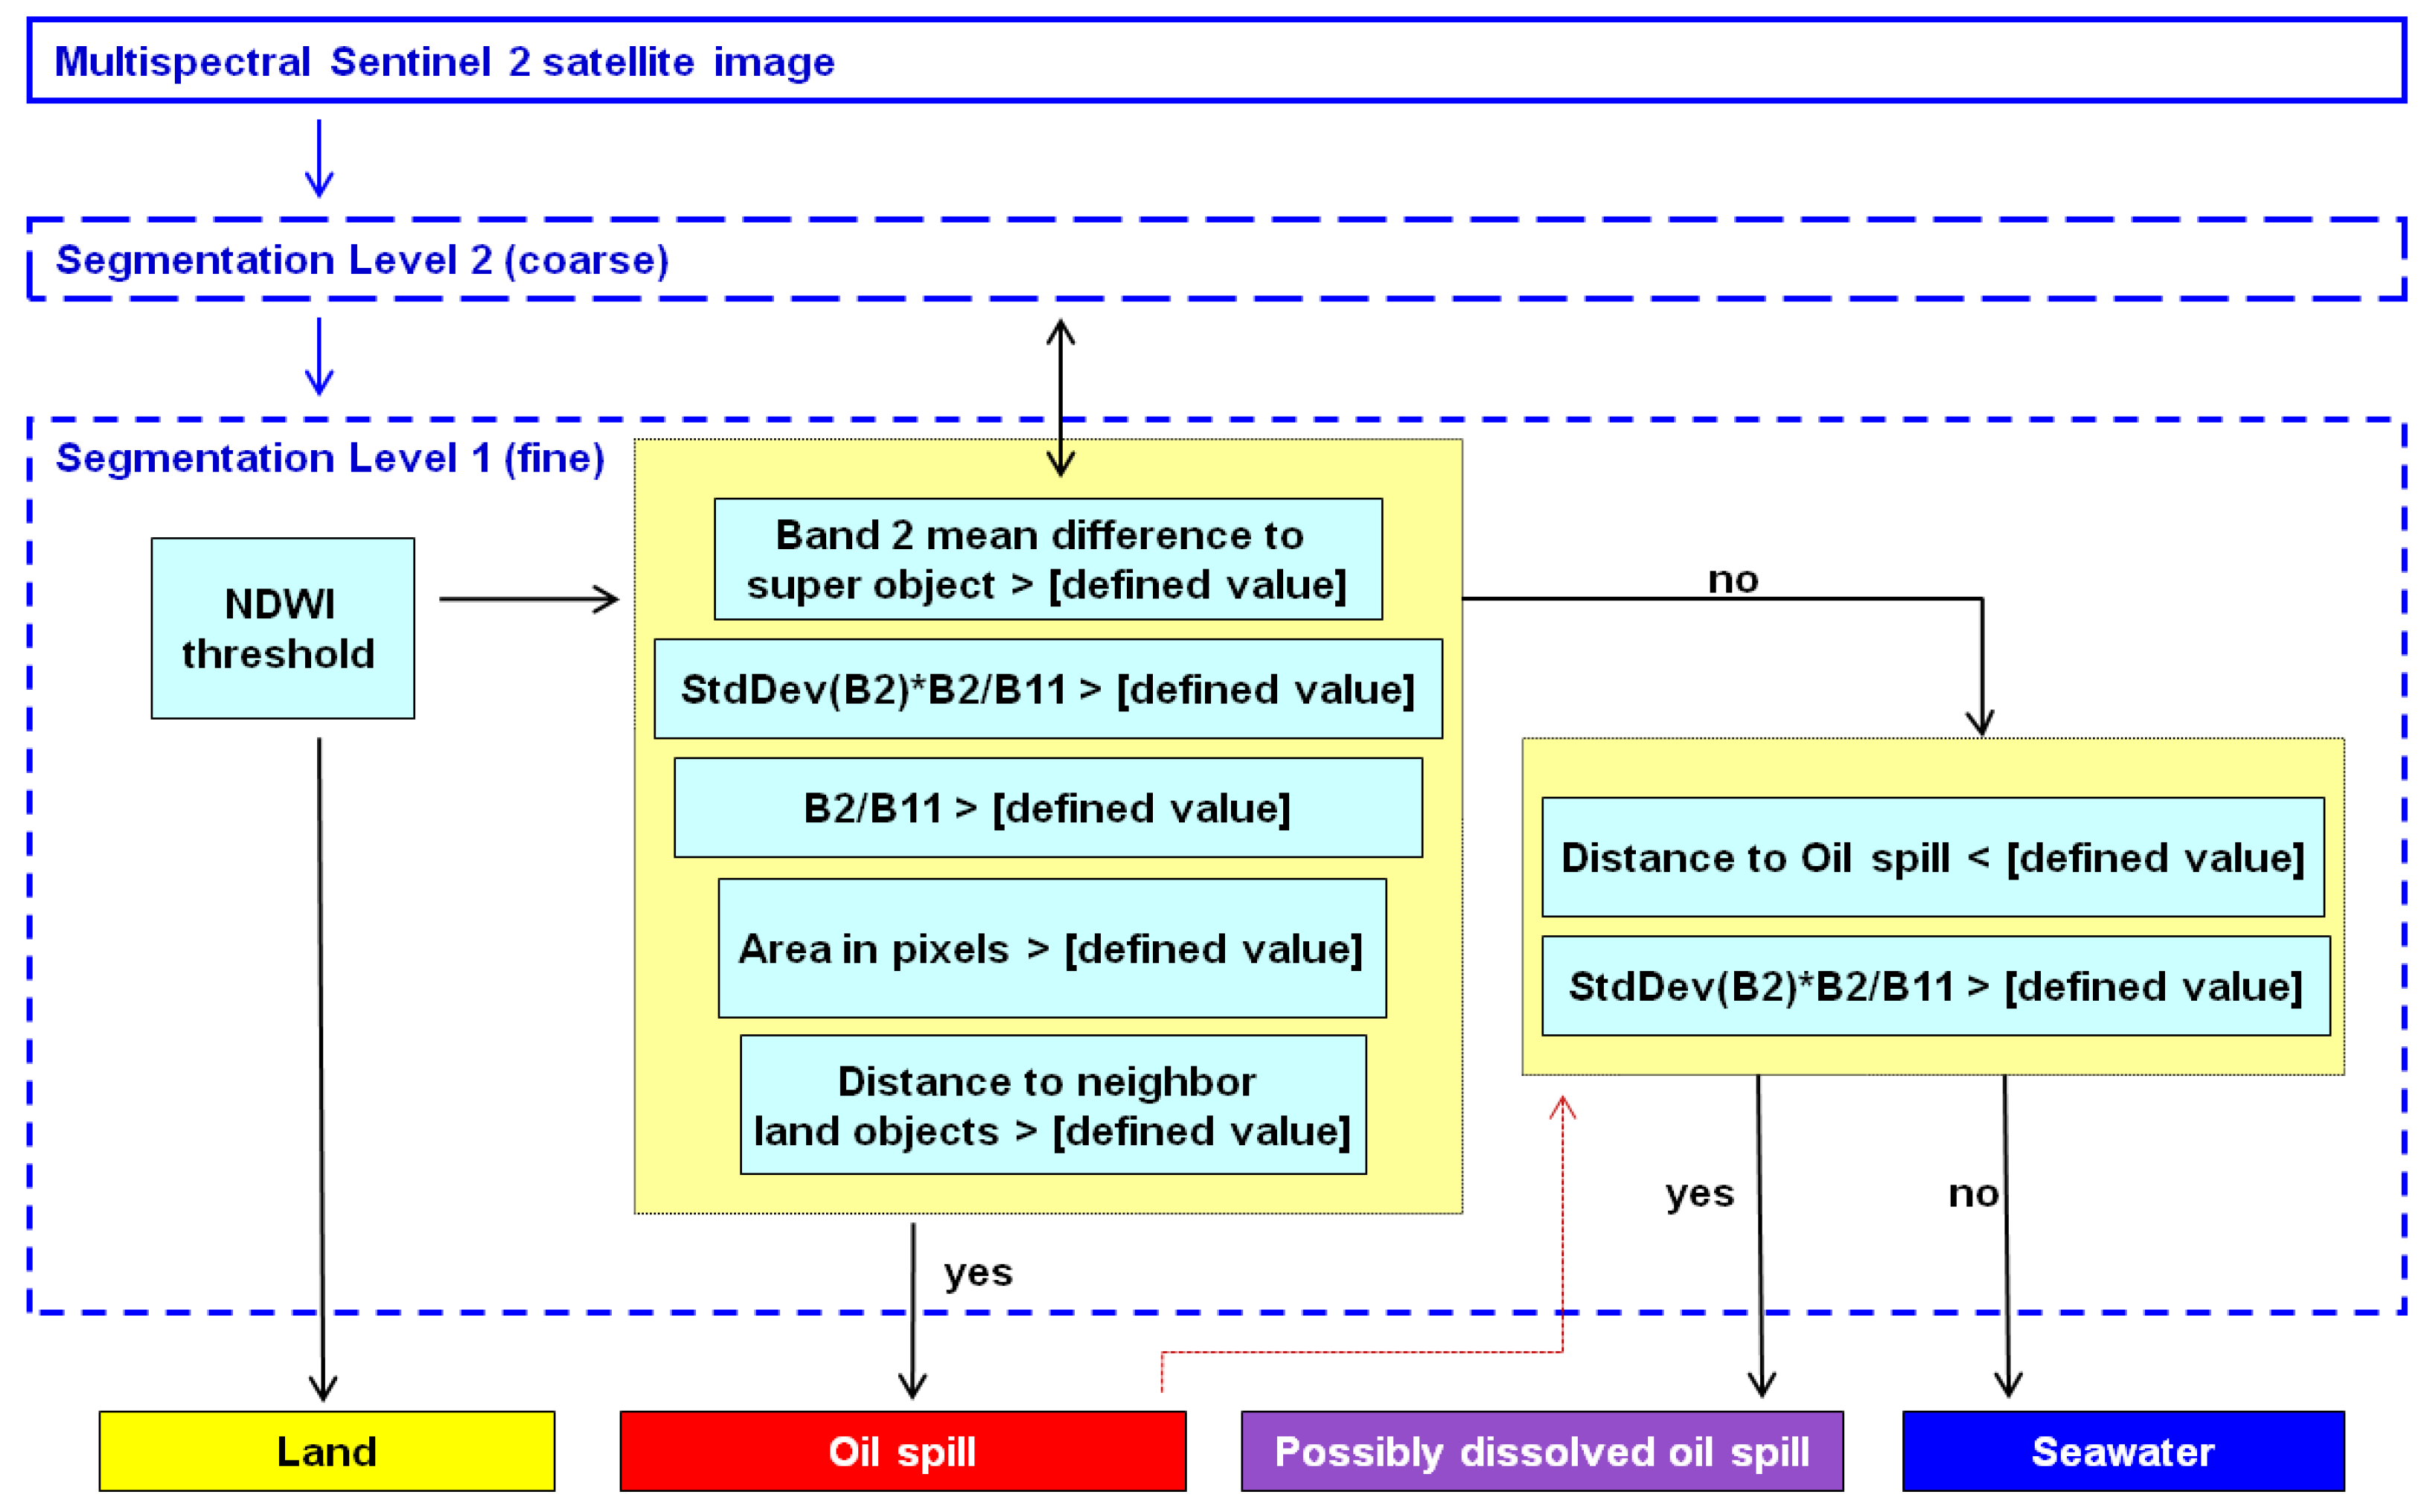
Figure 9.
Multitemporal OBIA method.
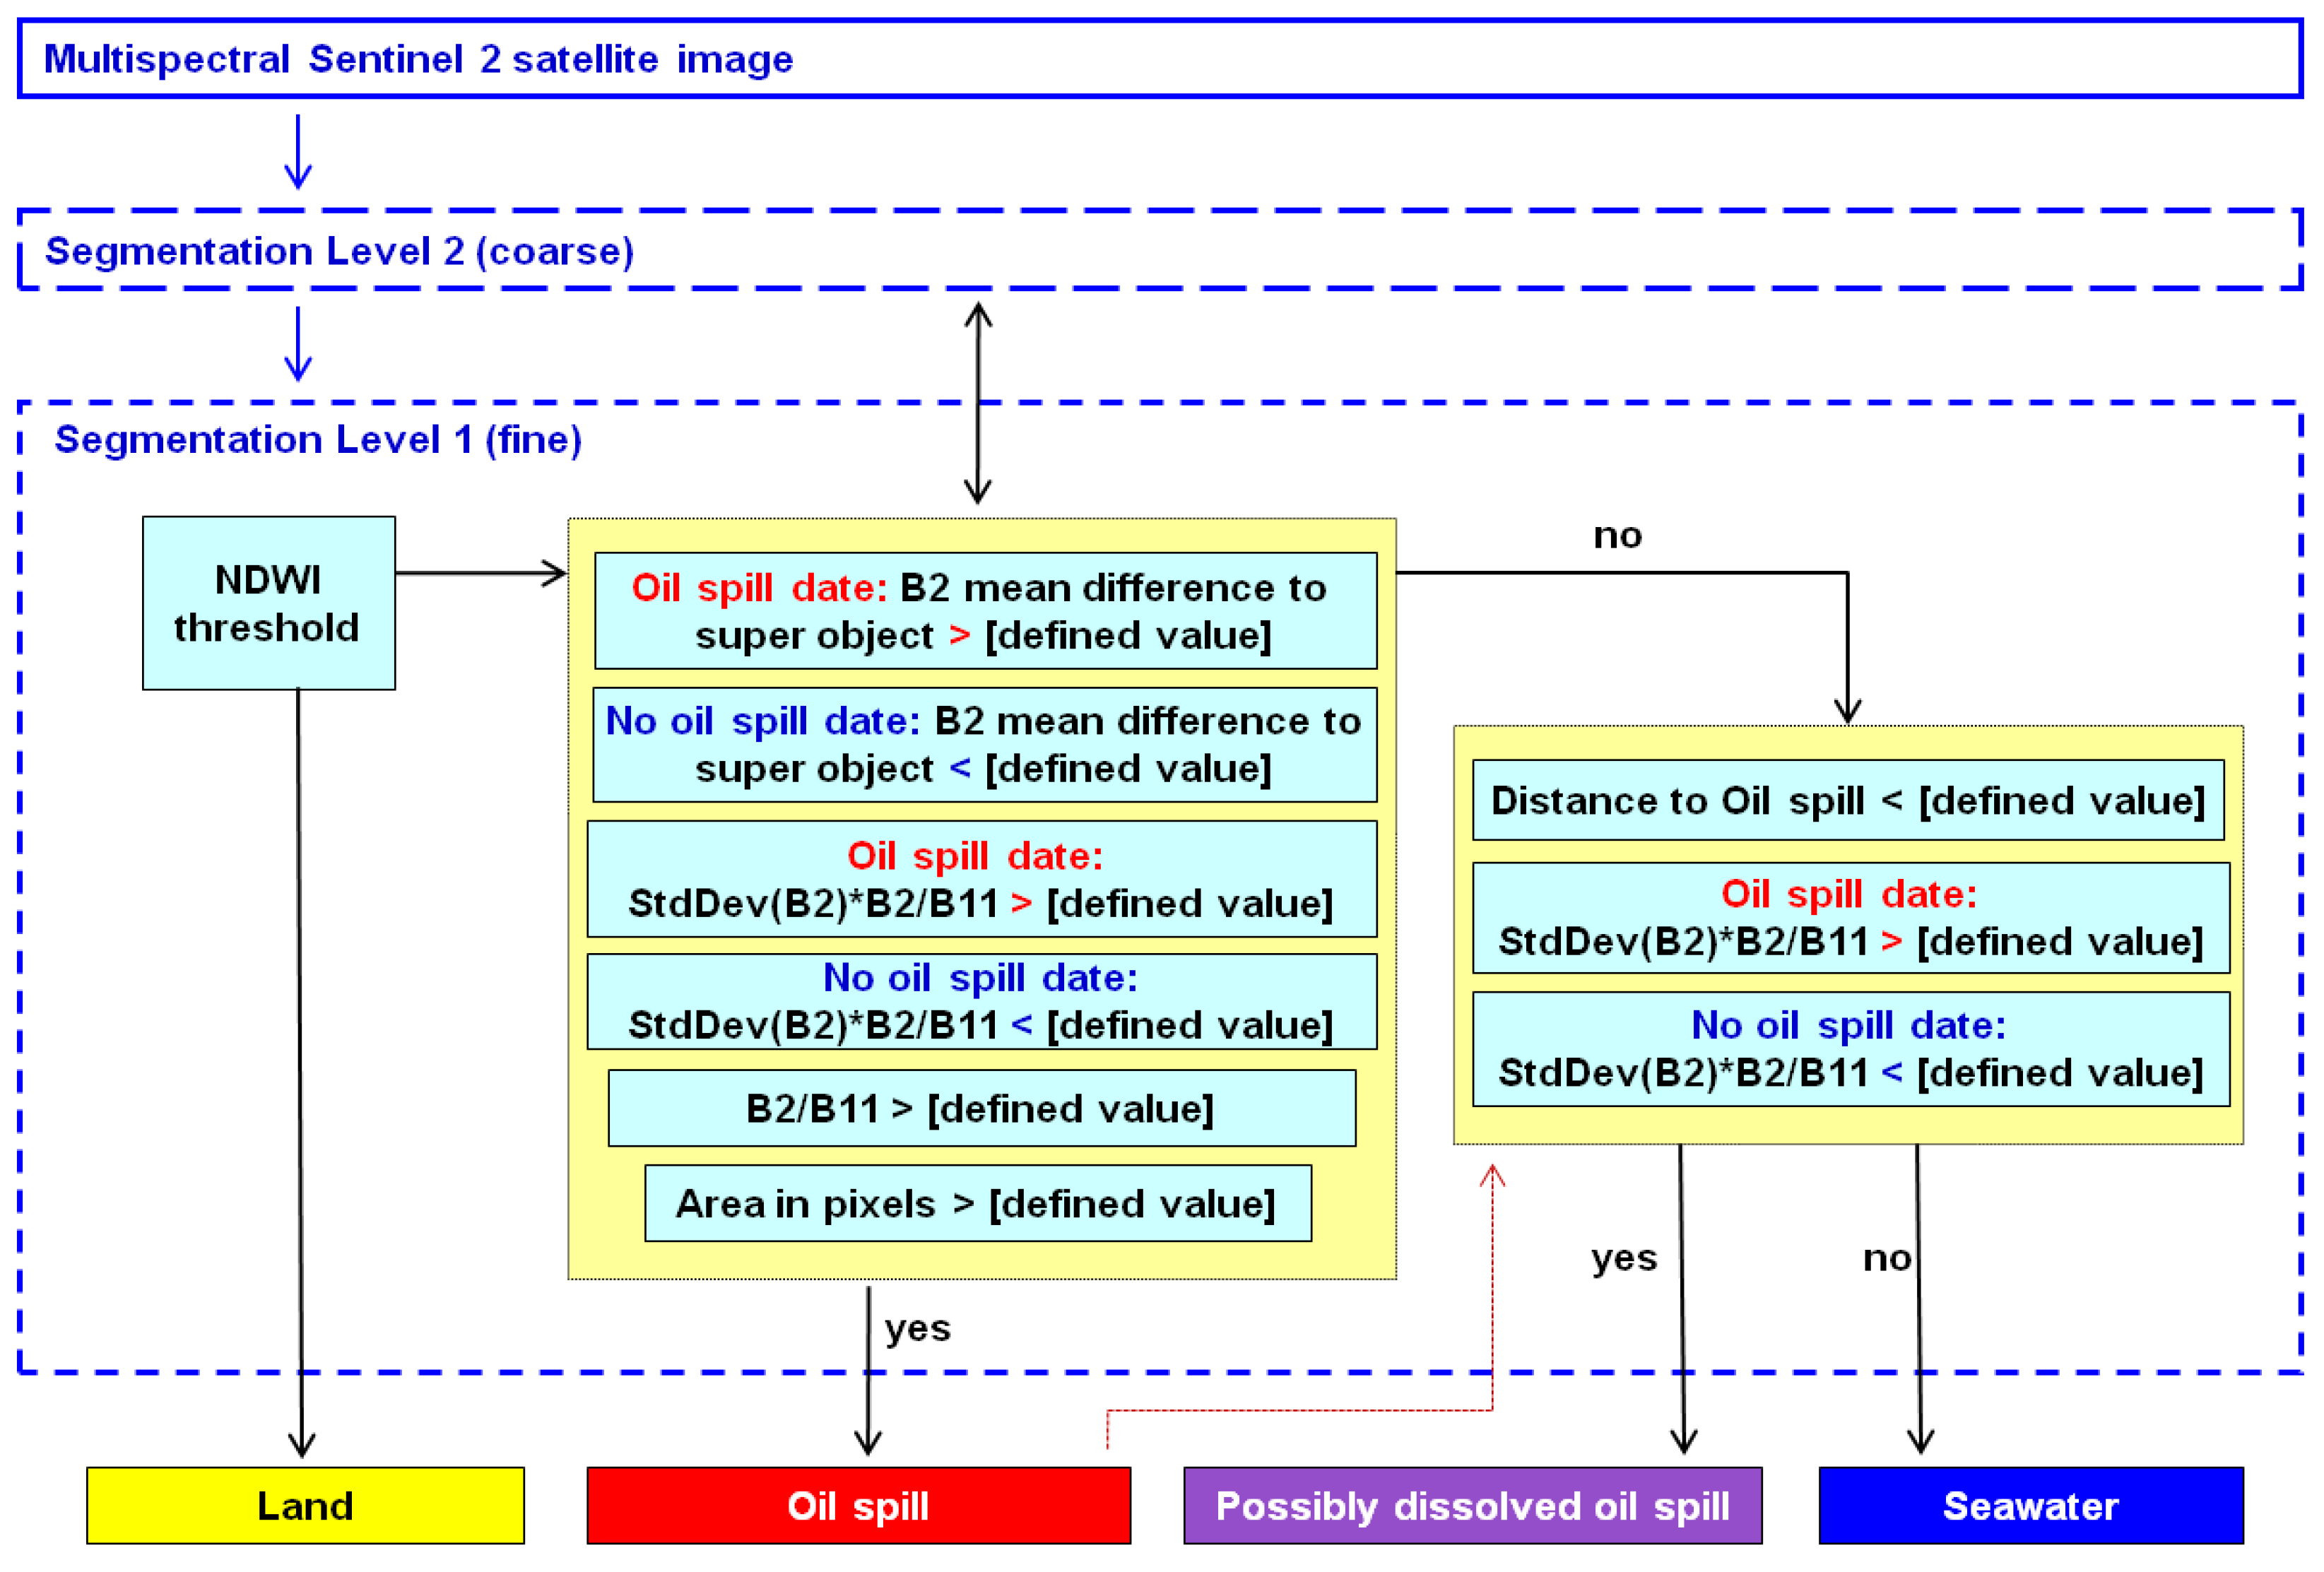
Figure 10.
OBIA classification results for: (a) Zakynthos, 7 August 2017; (b) Zakynthos, 27 August 2017; and (c) Saronic Gulf, 13 September 2017.
Figure 10.
OBIA classification results for: (a) Zakynthos, 7 August 2017; (b) Zakynthos, 27 August 2017; and (c) Saronic Gulf, 13 September 2017.


Table 1.
List of the Sentinel satellite images used.
| Geographic Area | Date | Sentinel Satellite | Sentinel-2 Image |
|---|---|---|---|
| Zakynthos | 7 August 2017 | 2A | L1C_T34SDG_A011101_20170807T092725 |
| Zakynthos | 27 August 2017 | 2A | L1C_T34SDG_A011387_20170827T092818 |
| Salamina | 13 September 2017 | 2A | L1C_T34SGH_A011630_20170913T091832 |
| Salamina | 8 September 2017 | 2B | L1C_T34SGH_A002650_20170908T091906 |
| Salamina | 15 September 2017 | 1A | S1A_IW_GRDH_1WDV_20170915T042323 _20170915T042348_018381_01EF05_7D8E |
Table 2.
Feature values used for the fuzzy rules of the single-date OBIA method.
| Class | Feature | Decision Value | Fuzzy Limits |
|---|---|---|---|
| Seawater | NDWI | >0.4 | 0.35  0.45 0.45 |
| Oil spill | B2 mean difference to super objects | >11 | 10  12 12 |
| StdDev(B2)*B2/B11 | >135 | 130  140 140 | |
| B2/B11 | >13 | 12  14 14 | |
| Area in pixels | >20 | 19  21 21 | |
| Distance to Land objects (meters) | >350 | 300  400 400 | |
| Possibly dissolved oil spill | Distance to oil spill (meters) | <275 | 250  300 300 |
| StdDev(B2)*B2/B11 | >125 | 120  130 130 |
Table 3.
Feature values used for the fuzzy rules of the multitemporal OBIA method.
| Class | Feature | Decision Value | Fuzzy Limits |
|---|---|---|---|
| Seawater | NDWI | >0.4 | 0.35  0.45 0.45 |
| Oil spill | B2 mean diff. to sup. obj. (oil spill date) | >11 | 10  12 12 |
| B2 mean diff. to sup. obj. (no oil spill date) | <11 | 10  12 12 | |
| StdDev(B2)*B2/B11 (oil spill date) | >135 | 130  140 140 | |
| StdDev(B2)*B2/B11 (no oil spill date) | <135 | 130  140 140 | |
| B2/B11 | >13 | 12  14 14 | |
| Area in pixels | >20 | 19  21 21 | |
| Possibly dissolved oil spill | Distance to oil spill (meters) | <275 | 250  300 300 |
| StdDev(B2)*B2/B11 (oil spill date) | >125 | 120  130 130 | |
| StdDev(B2)*B2/B11 (no oil spill date) | <135 | 130  140 140 |
© 2018 by the authors. Licensee MDPI, Basel, Switzerland. This article is an open access article distributed under the terms and conditions of the Creative Commons Attribution (CC BY) license (http://creativecommons.org/licenses/by/4.0/).
Share and Cite
MDPI and ACS Style
Kolokoussis, P.; Karathanassi, V. Oil Spill Detection and Mapping Using Sentinel 2 Imagery. J. Mar. Sci. Eng. 2018, 6, 4. https://doi.org/10.3390/jmse6010004
AMA Style
Kolokoussis P, Karathanassi V. Oil Spill Detection and Mapping Using Sentinel 2 Imagery. Journal of Marine Science and Engineering. 2018; 6(1):4. https://doi.org/10.3390/jmse6010004
Chicago/Turabian StyleKolokoussis, Polychronis, and Vassilia Karathanassi. 2018. "Oil Spill Detection and Mapping Using Sentinel 2 Imagery" Journal of Marine Science and Engineering 6, no. 1: 4. https://doi.org/10.3390/jmse6010004
Note that from the first issue of 2016, this journal uses article numbers instead of page numbers. See further details here.