
Growing Economic Inequality and Its (Partially) Political Roots

1
Department of Political Science, Boston College, Chestnut Hill, MA 02467, USA
2
Goldman School of Public Policy, University of California–Berkeley, Berkeley, CA 94720, USA
3
Department of Government, Harvard University; Cambridge, MA 02138, USA
*
Author to whom correspondence should be addressed.
Religions 2017, 8(5), 97; https://doi.org/10.3390/rel8050097
Submission received: 13 February 2017
/
Revised: 2 May 2017
/
Accepted: 2 May 2017
/
Published: 18 May 2017
(This article belongs to the Special Issue Growing Apart: Religious Reflection on the Rise of Economic Inequality)
Abstract
:Growing economic inequality fosters inequality in the political processes of American democracy. Since the 1970’s inequalities in earnings and wealth have increased dramatically in the United States creating a higher level of inequality in disposable income than in other developed democracies. The United States also lags behind other rich nations in the way it provides for those at the bottom of the income distribution, and there is no evidence that the opportunities for success promised by the American Dream compensate for inequality in America. Technological and economic developments are significant causes of this growing economic inequality. The role of politics is more controversial, but government policy influences the distribution of income and education by the way it determines government benefits, taxes and the way markets function. For a number of reasons—including, most importantly, the relationship between education and income and the ability of the affluent to make large campaign donations—those who are economically well-off speak more loudly in politics. They are more likely to engage in most forms of individual political participation—not only ones that involve using cash but also ones that cost nothing except time. Moreover, when it comes to political voice through organizations, a professionalized domain dominated by hired experts in which the volume of political voice can be altered to reflect available economic resources, affluent interests are more likely to be organized and active. This essay considers the growing economic inequalities that form an important part of the backdrop for unequal political voice.
- ❖
- In 2013, America’s 25 highest-paid hedge fund managers made more than twice as much as all the kindergarten teachers in the country taken together (Krugman 2014).
- ❖
- In 2013, the combined family wealth of just six members of the Walton family added up to more than the wealth of 52.5 million, or 42.9 percent, of American families1.
- ❖
- The minimum wage was $2.65 per hour in 1978. Had it kept up with the cost of living, it would have been $9.62—not $7.25—in 2014. If it had kept up with the increase in compensation of CEOs of large corporations, it would have been $95.97 in 20142.
- ❖
- As measured by the poverty gap—that is, the percentage by which the mean income of the poor falls below the poverty line—the poor in the United States are quite poor indeed. In a group of 34 rich countries, only in Korea, Mexico, and Spain is the poverty gap higher3.
- ❖
- In state university systems, merit aid flows disproportionately to those who are less needy: about 1 in 5 students from households with incomes over $250,000 receive merit aid—in contrast to 1 in 10 from families making less than $30,000 (Rampell 2013).
When it comes to money, Americans are very unequal. Economic inequality has grown over the last generation, and disparities in income have consequences for which voices are heard in American politics. Those who are economically well-off speak more loudly in politics by giving more money and by engaging more frequently in almost all forms of political participation—even ones that cost nothing. The affluent are also better represented and more active when it comes to political voice through organizations where professionals can be hired as lobbyists.
Political and economic inequalities intersect in several ways. Not only is money a critical resource for both individual and organizational input into politics, but economic disparities shape the content of political conflict. Although the list of contentious political issues in contemporary America is long and varied, matters associated with differences in income and material well-being—ranging from tax policy to health care policy to Social Security—generate a great deal of political conflict4. Not only do economic differences produce political conflict, growing economic inequalities result from public policy as well as economic and technological change.
1. Increasing Economic Inequality
By a variety of metrics, economic inequality grew over the past generation5. Detailed information on household income—earnings, dividends, rents, and government transfers such as Social Security—goes back to the passage of the constitutional amendment authorizing the federal income tax in 1913. The share of pretax national income commanded by the top 10 percent and the top 1 percent of American households rose after World War I and peaked in the late 1920s. Then, during World War II, it decreased markedly, remaining relatively stable until the 1970s. During this period, increased income resulting from growth in both productivity and national income benefited the vast majority of middle-class and poor households below the top tenth while the most affluent lagged behind. Then, in the late 1970s, income inequality began to climb.
Figure 1 presents striking evidence about what happened between 1979 and 2011. As measured in constant dollars, the average after-tax household income for those at the bottom of the economic ladder—and for the middle-class households in the middle three-fifths—grew quite modestly over this period. In contrast, household incomes for those in the top fifth increased substantially: the growth in dollars in household income of those in the highest fifth was larger than the average 2011 income of those in the fourth quintile on the economic ladder. Even more notable is the extent to which this growth was concentrated in the top 1 percent of households. This upward redistribution benefited an extremely narrow slice of households: only the top 10 percent saw their share of after-tax income grow, and the gains went disproportionately to the top 1, and even the top 1, percent.
Discussions of increasing economic inequality tend to focus attention on the extent to which the rich have become richer compared to the middle class. A trend less often noticed is the fact that, by some metrics, the poor have gotten poorer. After decreasing for a number of years during the 1960s, the poverty rate leveled off and has varied within a relatively narrow range since then6. The relative stability of the poverty rate, which separates families into groups of poor and non-poor, obscures the trend towards deeper poverty among poor households. Between 1996 and 2011, the number of people who live in extreme poverty—that is, those who live for at least one month a year on no more than $2 a day per person—has doubled7.
1.1. Earnings
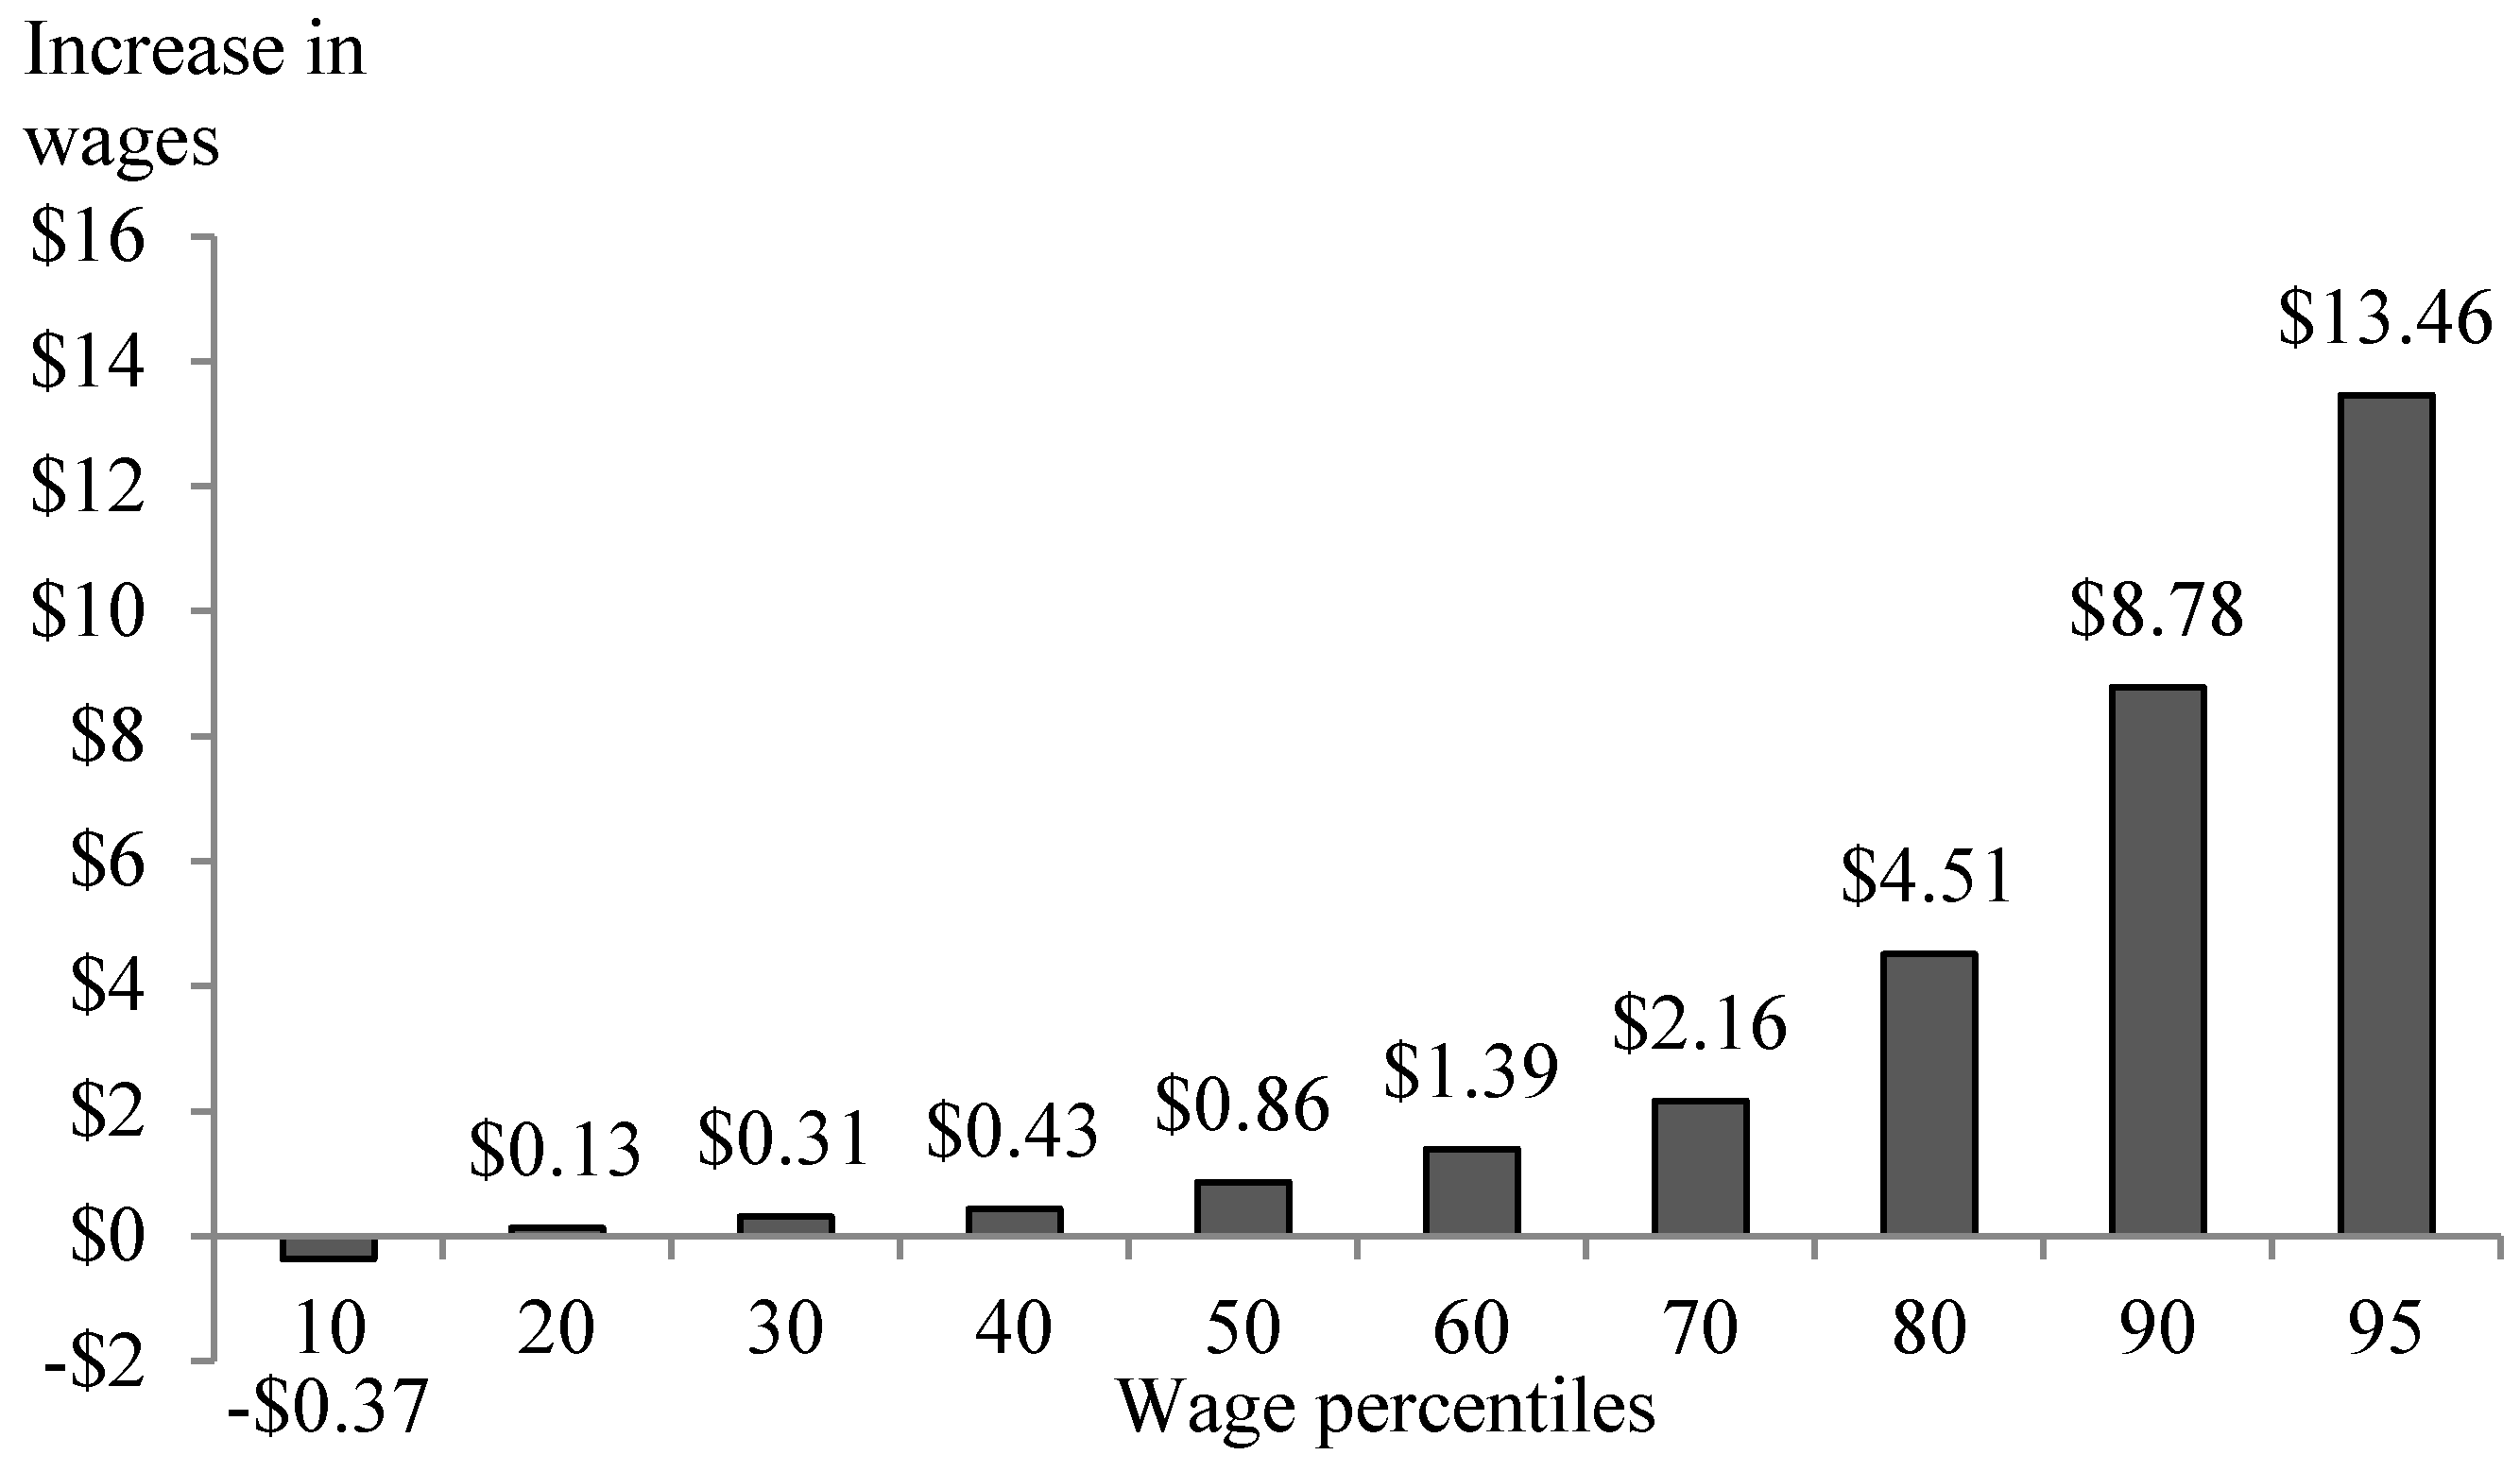
The story about earnings and wealth parallels that for household income. For most households, the principal source of income is earnings, that is, wages and salaries derived from paid work. Wage and price controls during World War II resulted in substantial wage compression, especially among high-wage earners. Surprisingly, when the controls were lifted, the share of wages commanded by top earners did not immediately bounce back to prewar levels. However, in the 1970s it began to increase steadily before skyrocketing in the late 1980s and late 1990s. As shown in Figure 2, between 1979 and 2015—a period during which productivity gains were substantial—workers in the lowest decile actually lost ground in terms of real wages, and improvements in real wages for all but those in the top two deciles were modest.
Although much has been made of the increasing returns to education, what is striking is the extent to which the fruits of economic and productivity growth in recent decades accrued so disproportionately to those at the very, very top and not to the low- and middle-wage workers or even to workers who have college diplomas or advanced degrees. Between 1979 and 2010, the wage and salary income of the vast majority of Americans in the bottom 90 percent grew in real terms by 15 percent. Those at the top of the pyramid in the 90th-to-99th percentile saw their paychecks grow by 46 percent. The analogous figures for those in the stratosphere, the top 1 percent and the tippy-top 0.1 percent, are 131 percent and 278 percent, respectively (Mishel et al. 2012, p. 196).
Meanwhile, the total compensation of CEOs at the nation’s largest corporations shot up by almost 1000 percent between 1978 and 20148, a trend fueled, at least in part, by the restructuring of executive pay, in particular the inclusion of stock options in compensation packages. In 1965, CEO compensation was, on average, 20 times that of the median worker in the firm. By 2013, that ratio had jumped to 295.9 (Box 1 below provides more details). In that year, Disney’s CEO earned 2238 times the median worker in his company (Morgenson 2015). What is noteworthy is that colossal CEO pay packages seem unrelated to performance9. One study showed the compensation of CEOs of large companies that had been through bankruptcy to be only 4 percent below the median for all CEOs of large companies10. A New York Times study of 51 Securities and Exchange Commission fraud settlements demonstrated that, even when the profits being rewarded turn out to be based on fraud, it is the corporation that is held to account, not the executives involved11.
- ❖
- In the nation’s largest firms, CEO compensation rose 941 percent between 1978 and 2015, a rate far higher than the increase in the stock market (543 percent) or the pay of the top 0.1 percent of earners (320 percent).
- ❖
- Between 1973 and 2015, productivity increased 73 percent in the United States—at the same time that the average hourly earnings of nonsupervisory workers went up a mere 11 percent.
Sources: (Mishel and Schieder 2016; Economic Policy Institute 2016).
At the same time, the safety net provided by fringe benefits from private employers frayed in terms of both availability and generosity12. Although the Affordable Care Act increased the share of Americans with health insurance, copays and deductibles also increased. In addition, the share of workers who qualify for unemployment compensation if they lose their jobs declined and defined-contribution retirement plans replaced defined-benefit pensions so that workers cannot rely upon a steady, predictable pension when they retire. In 1980, 84 percent of full-time workers in private establishments with at least 100 employees had defined-benefit pension plans. By 2015, that figure had fallen to 25 percent13.
1.2. Wealth
The pattern of substantial, and increasing, inequality is even more dramatic for wealth: that is, the assets held by a household—for example, housing, consumer durables such as cars, businesses, savings, or investments—minus any outstanding mortgage, college loans, or consumer debt. Wealth—especially financial wealth like equities, bank deposits, or bonds—has always been more unevenly divided than either earnings or household income. In 2012, the top 1 percent commanded fully 42 percent of the national wealth.
Looking over time, the changes in the concentration of wealth parallel the U-shaped pattern for earnings and household income. The share of wealth owned by the top 1 percent reached a peak in the late 1920s, bottomed out in the 1970s, before turning upward again in the late 1970s. Between 1978 and 2012, the share of the nation’s wealth held by the top 0.1 percent rose sharply from 7 percent to 22 percent. In fact, the share of wealth commanded by those at the very top was nearly as much as for all those in the bottom 90 percent, 23 percent, down from 35 percent in the mid-1980s (Saez and Zucman 2016, pp. 520, 523).
An important aspect of the unequal division of wealth is the divide by race or ethnicity. Black and Latino households command, on average, much less wealth than non-Hispanic white households, and these inequalities in wealth are much more pronounced than analogous inequalities in income or wages. Blacks and Latinos are less likely to be homeowners and more likely to owe more than they own14.
2. The United States in Comparative Perspective
Most rich countries have witnessed increasing income inequality in recent decades15, but the United States and the United Kingdom have led the way. The United States was actually less economically unequal than the powers of Europe in the early twentieth century. By the twenty-first century, the United States was the most economically unequal in a group of fourteen rich countries (Atkinson 2015, p. 26).
A key driver of increasing inequality in the United States is the explosion in compensation to those at the top. In what Thomas Piketty calls a “hypermeritocratic society,” the “peak of the income hierarchy is dominated by very high incomes from labor rather than by inherited wealth” (Piketty 2014, p. 265). Whether they are quarterbacks or Oscar-winning actors or, more commonly, financiers and corporate chieftains, America’s winners are very well paid indeed. In contrast, at the bottom of the hierarchy, the compensation for low-skilled work is quite stingy compared to other countries. Furthermore, government benefits are not particularly generous, and taxes are not especially redistributive in the United States. Taken together, these multiple factors interact to produce a higher level of inequality in disposable income in the United States than in other developed democracies16.
3. Does American Affluence Compensate?
Two arguments are made to blunt concerns about the level of income inequality in the United States. The first is that the high level of affluence in America implies a higher, even though unequal, standard of living for all. Not unexpectedly, Americans in top deciles continue to be better off than their counterparts in other affluent countries. In the middle, the United States has long outranked other affluent countries with respect to median income, but other countries are catching up fast and, in 2014, median income in Canada surpassed that in the United States (Leonhardt and Quealy 2014). Toward the bottom of the income ladder, however, the United States lags behind other rich nations. According to one comparative study, “Low paid workers in the United States—the most productive economy in the world—have markedly lower living standards than low paid workers in other advanced economies.” (Freeman 1997) The combination of the relatively low wages of low-paid American workers and the lack of income support for the non-working poor implies that the incomes of households in the lowest decile in the United States are quite low when compared to their counterparts elsewhere (Mishel et al. 2009, p. 382, Figure 8E). In summary, American affluence compensates somewhat for those in the middle and not at all for those toward the bottom of the ladder.
4. What about the American Dream?
The second argument focuses on the opportunities for achieving the “American Dream.” Discussions about realizing the American Dream come in two versions. One emphasizes that life gets better with absolute improvements in standard of living over the life cycle or across generations, regardless of whether the improvement also involves a relative as well as an absolute rise. The sluggish wage growth over much of the period since the mid-1970s implies that achieving this version of the American Dream has become harder for middle- and lower-income Americans. Over the life cycle, earnings tend to increase with age as workers gain experience and seniority, but they increase less sharply than they once did (Mishel et al. 2012, p. 143, Figure 3A). American standards of living have improved even though wages have stagnated but only because families are smaller than in the post–Baby Boom era; work force participation, especially by married women, has risen; and consumer indebtedness has increased.
Another definition of achieving the American Dream posits that opportunities for success, while differential, are available to the talented and industrious, irrespective of initial circumstances of disadvantage. American ideology to the contrary, rags-to-riches—and riches-to-rags—stories, however newsworthy, are exceptional. We are not all equal at the starting point, and recent research shows considerable correspondence in the economic deserts of successive generations17. Children who have the good fortune to be born to affluent well-educated parents are better off in a myriad of ways. Among others, they are more likely to
- Grow up with two biological parents;
- Live in a home environment that cultivates attitudes, interests, habits, and personality traits that are helpful in school and the marketplace;
- Benefit from parental investments in their development ranging from stimulating conversations to music lessons to summer camp;
- Attend schools with experienced teachers, educationally engaged fellow students, AP courses, and organized sports;
- Achieve academically in school;
- Be able to afford rising college tuitions and to have advisors at home and school able to guide them through the process of applying to college and finding financial aid, if needed;
- Matriculate in college and, ultimately, graduate;Be located in social networks that provide mentors and contacts along the way18.
The investments made by parents in their children’s development and well-being are not necessarily financial. Although many of the enrichment opportunities provided by affluent parents are expensive, many aspects of a stimulating and nurturing home environment have no price tag. In fact, on average, it is probably more advantageous to have well-educated parents than rich ones. Still, it is hardly surprising that those who are savvy enough to have chosen affluent, well-educated parents are much more likely to end up affluent and well educated themselves (see Box 2 below for more details).
| The class-based gap in parental expenditures on their children’s development—in such things as books, high-quality child care, summer camp, and private school—has grown. In the 1972–1973 period, families in the highest income group spent $2701 more per year on child enrichment than did families in the lowest income group. By the 2005–2006 period, the disparity had grown to $7,557. |
| Source: (Duncan and Murnane 2011b, p. 11). Data for lowest and highest income quintiles in 2008 dollars. |
These class-based gaps in the experiences and well-being of children have, unfortunately, grown markedly in recent decades—a cause for concern about both the current circumstances and future mobility prospects of children whose parents are less affluent and well-educated19.
The United States is anything but the leader when it comes to providing opportunities for success regardless of the previous condition of disadvantage. In a group of thirteen affluent democracies, the Nordic countries exhibit the most social mobility from generation to generation as measured by the correspondence between fathers’ and son’s earnings. Along with the U.K. and Italy, the United States has the least. What is more, among rich countries, those with higher levels of income inequality tend also to be those where the advantage passes from one generation to the next20. In summary, there is no evidence at all that the opportunities for success to the talented and industrious promised by the American Dream compensate for inequality in America.
5. How Do We Explain Increasing Economic Inequality?
There is widespread agreement that multiple factors contribute to increasing income inequality and that those factors are difficult to disentangle. There is also consensus that structural and economic trends exacerbate economic inequality. Among them is skill-based technological change in which machine tools, computers, and robots operated by high-skilled workers replace low-skilled workers; international trade and domestic outsourcing in which lower-paid workers are substituted for better-paid ones; and winner-take-all markets in which the most successful, not only in athletics and entertainment but also in the corporate and financial sectors, are able to command stratospheric compensation21.
At this point, the agreement breaks down. Some maintain that the growth of economic inequality can be explained primarily by the operations of increasingly efficient markets. Others point out that markets reflect more than simply an equilibrium achieved by impersonal forces of supply and demand and that market outcomes are “the result of the bargaining power of different participants,” (Atkinson 2015, p. 147) an insight that provides the conceptual framework for the Progressive-era observation that “an empty stomach can make no contracts.”22
A special point of contention is the role of politics. Economists differ with regard to the weight they place on government policy in explaining increasing economic inequality. Clearly, technological and economic developments are significant causes of growing economic inequality. Still, the economic argument about increasing return to education does not explain the explosion of compensation at the very top. Furthermore, these economic and technological changes, which are present across developed economies, cannot explain why the growth of inequality has differed so substantially across nations and why it has been especially pronounced in the United States. Christopher Jencks has a blunt rejoinder, “The answer turns out to be pretty simple: ‘It’s politics, stupid.’” (Jencks 2005, p. 134). If it is politics, then to what extent have policies exacerbated inequality or failed to deter its growth?
5.1. Benefits and Taxes
Discussions of how policy affects income inequality usually begin with the government benefits and taxes that modify market outcomes. In all rich democracies, the sum total of what governments distribute, often on a means-tested basis, in benefits and extract in taxes ameliorates income inequality. The reduction in inequality from these tools is not especially pronounced in the United States. Clearly, since the late 1970s, the redistributive effects of benefits and taxes have not kept pace with growing inequality in market outcomes before benefits and taxes.
In 1988, Ronald Reagan famously observed, “We fought a war against poverty, and poverty won.” While Reagan may have the better quotation, in fact, government benefits do reduce poverty,23 and decreases in benefits increase poverty. The 1996 welfare reform replaced the major income support, Aid to Families with Dependent Children (AFDC), with Temporary Assistance to Needy Families (TANF), which is time-limited and, on average, provides a less generous level of support. While the welfare rolls were already declining at the time that welfare reform was passed, the drop in coverage has been marked: in 2014, the TANF caseload was only 27 percent of what it was at the height of the old welfare program in 1994 (Edin and Shaefer 2015, p. 7). That a much smaller share of poor families receive TANF benefits and that inflation-adjusted TANF benefits are, on average, lower than at the time of welfare reform is at least part of the story of the increase of the proportion of families with children that are deeply poor. The decline of TANF has reduced government benefits that redistribute income, but that is not the end of the story.
The main income support for the poor is now the Earned Income Tax Credit (EITC), a tax benefit that is tied to work. The EITC ameliorates income inequality, but the link to employment means that it only helps those who are able to find jobs. As a result, it has limited countercyclical impact in economic downturns (Bitler and Hoynes 2016). Two other programs partly fill the gap. During the Great Recession, SNAP—the Supplemental Nutrition Assistance Program, the heir to what was known as “food stamps”—and Unemployment Insurance provided compensatory assistance with the result that, according to a Congressional Budget Office Report, the reduction in income inequality from government benefits was somewhat higher in 2011 than it had been in 197924. With economic recovery and the expiration of the temporary boost to SNAP benefits, SNAP spending has declined and with it the temporary boost in the redistributive impact of government benefits (Rosenbaum and Keith-Jennings 2016).
The American tax system is complicated. While it is broadly progressive, in certain respects, it is friendlier to those with higher incomes. Most people’s federal taxes are fairly straightforward and are withheld from their paychecks25. In contrast, for those with complex investments and financial dealings, the federal tax code is riddled with tax-reducing deductions and loopholes inserted by lobbyists and exploited by lawyers and accountants. Because such provisions are so byzantine, they are open to legitimate differences of interpretation as well as flagrant dishonesty. Significantly, in the late 1990s, Congress passed legislation crippling the tax enforcement capacity of the IRS and has subsequently eroded its funding. Nevertheless, after federal taxes, income inequality is somewhat less pronounced than before the federal government takes its bite.
Unlike federal taxes, state and local taxes, which vary substantially from state to state, are not progressive overall. With each rung up the economic ladder, the proportion of income paid in state and local taxes diminishes. In 2015, the share of income paid by the lowest 20 percent of households, those with incomes below $19,000, was 10.9 percent; by the middle 20 percent, those with incomes between $35,000 and $56,000, 9.4 percent; and by the top 1 percent, who had incomes over $471,000, only 5.4 percent (Institute on Taxation and Economic Policy 2015).
After decades of tinkering with the federal tax code, federal taxes now do less to ameliorate income inequality than they did in 197926. A number of the alterations to federal taxes have had a regressive impact27. Compared to those further down, the affluent realize a higher share of their incomes from unearned income—that is, income like rents and dividends not derived from wages and salary. Therefore, the successive reductions of the capital gains tax to 15 percent have, on average, reduced the tax bills of those at the top of the income ladder. Similarly, changes to the federal estate tax have reduced estate taxes for the very wealthy28.
Perhaps most notably, income taxes on high salaries have been reduced substantially. Beginning in the 1980s, most affluent countries lowered marginal income tax rates, but the U.S and the U.K., which had relatively higher rates during the 1960s, went further than most29. During the Reagan administration, the marginal federal income tax rate fell from 70 percent to 28 percent. Under Clinton, it rose to 39.6 percent before being lowered to 35 percent under George W. Bush. In fact, the most important effect of reductions in the marginal rate on earned incomes may be less on who pays what in taxes than on the pay itself. The era of lower marginal income tax rates has also been the era of soaring compensation. When federal taxes gobbled so much of the high pay, there was less incentive to try to extract the last dollar. With lower marginal rates, the payoff for demanding a big raise has skyrocketed30.
5.2. Government Policy and the Shaping of Market Outcomes
Less widely discussed than the way that government benefits and tax policies modify market incomes is how profoundly government policies shape the operations of markets. Beginning with the capacity of governments to enforce the contracts upon which market exchanges rely, capitalist systems are embedded in a myriad of policies that shape their functioning. Two issues at stake in the 2016 presidential election—immigration and trade agreements, both of which have implications for economic distribution—are shaped fundamentally by policy decisions. They are but two of the many matters germane to economic inequality in which both market operations and government policies have consequences. That is why, according to Joseph Stiglitz, we must understand “the array of laws and policies that lie beneath the surface—the rules that determine the balance of power between public and private, employers and workers, innovation and shared growth and all the other interests that make up the modern economy.” (Stiglitz 2015)
As with immigration and trade, policies with the potential to enhance workers’ paychecks often have politically powerful opponents and inevitably involve tradeoffs among valued outcomes. Furthermore, agreement on a desired result may not be matched by consensus among economists on how to achieve it.
One policy, not always cited in discussions of growing economic inequality, is the use of fiscal and monetary tools to maintain full employment and, thus, promote higher wages. Slack labor markets tend to place workers, especially low-wage workers, at a disadvantage. Since the Reagan years, economic policy has not always made full employment a priority (Baker and Bernstein 2013; Mishel et al. 2014, pp. 26–31). Another rarely cited partial explanation for growing economic inequality is reduced competition among firms in various economic sectors. When fewer employers are competing for workers, employers gain leverage in setting wages. Concerns about the impact of mergers on competition for employees, and therefore on wages, are notably absent from merger complaints (Council of Economic Advisers Brief 2016). Besides, antitrust enforcement has not been especially vigorous in recent decades.
A policy that is mentioned more frequently is the minimum wage which, by placing a floor under wages, has a mildly equalizing effect on earnings. Unlike many policies ranging from Social Security benefits to the cap on payroll taxes, the minimum wage, established in the Fair Labor Standards Act of 1938, is not indexed to inflation or to the median wage. The value of the minimum wage peaked in real terms in 1968 and has declined 24 percent since then, even though the half century since then has witnessed substantial economic growth (Elwell 2014, Table 1). It is also not especially generous in comparison with other affluent democracies. In a group of 13 affluent countries, only in Spain and Japan is the minimum wage a smaller percentage of median earnings than in the United States (Atkinson 2015, p. 149). Therefore, what the government has not done—or, at least, what it has not done very often since the Reagan Administration—raise the minimum wage, has contributed to income inequality.
Overtime pay presents a parallel case. Like the minimum wage, guaranteed overtime pay, mandated in the Fair Labor Standards Act, is not indexed. Because the threshold for overtime eligibility is not automatically adjusted with inflation, the share of salaried workers who qualify for overtime pay had sunk to 11 percent in 2014—from 65 percent in 197531.
In an era when workers have, on average, reduced leverage in bargaining with employers, employers have adopted a number of practices to keep labor costs down. Among them are hiring outside contractors to do work once undertaken by regular employees who qualified for such fringe benefits as health insurance; requiring employees with complaints about pay or employment practices to submit to binding arbitration rather than to sue in court; enjoining employees from discussing matters of pay with one another; failing to pay mandated minimum wage or overtime; and requiring new employees—not just engineers in Silicon Valley who might have access to trade secrets but such low-wage employees as fast-food workers or camp counselors—to sign non-compete agreements limiting their freedom to seek better-paid jobs32.
All of these practices could be modified by government policy. In some cases, policy makers have chosen to eschew any policy remedy or have been met with successful opposition by affected business interests. In others, the policy tools are in place but inadequately enforced. For example, when it comes to paying below minimum wage or depriving employees of overtime, the number of federal inspectors was cut by nearly a third between 1980 and 2007. Even with the reduced capacity to enforce wage and overtime guarantees, more than $1 billion of stolen wages were recovered in 2012, a figure that is thought to be a small fraction of the national total (Stiglitz 2015, p. 47).
The growth of the financial sector and the explosion of its profitability and the compensation of its higher-ups along with consumer losses during the Great Recession clearly exacerbated income inequality. Nevertheless, it is difficult to assess the contribution to that outcome of government action and inaction with respect to investments, borrowing, and other financial transactions33. Political conflict about government regulation of finance tends to involve lobbying by organized interests—for example, credit card companies, banks, and other financial institutions. As is so often the case, policy impact is buried in the details, details that have been scrutinized and shaped by interests with insider status, policy expertise, and deep pockets.
A number of government actions in the post-2000 era seem to have been particularly friendly to business. For example, the 2005 bankruptcy reform that made it harder for consumers—and nearly impossible for indebted students34—to discharge debts by declaring bankruptcy is surely more advantageous to credit card companies, mortgage lenders, car lenders, and for-profit universities than to indebted consumers. Similar arguments are made about policy developments with regard to the increased protection of intellectual property and the relaxation of antitrust enforcement (Reich 2015).
Much of the story of the financial sector in recent decades, however, involves the absence of regulation. The 1999 repeal of the 1933 Glass-Steagall Act, which had separated investment banking from commercial banking, involved explicit deregulation. However, the absence of regulation can also reflect successful industry opposition, as in the case of the complex financial instruments known as derivatives, as well as the failure of enforcing agencies to regulate vigorously—whether out of ideological conviction, coziness with the industry, or insufficient budgets.
Combined with technological developments that transformed how financial transactions take place, this unregulated environment incubated new ways of doing financial business. Speculation in arcane and complex financial instruments and other forms of financial risk-taking, predatory lending and, sometimes, actual fraud ended up jeopardizing the solvency of financial institutions and leaving many consumers indebted or foreclosed. When the collapse of major financial institutions was imminent, the government came through with a bailout that, while eventually repaid in full, cost more than the government spent on the unemployed who lost jobs during the ensuing recession and helped bankers retain their bonuses while leaving behind those who had lost homes to foreclosure. In the aftermath, Congress legislated new financial regulations in the 2010 Dodd-Frank Wall Street Reform and Consumer Protection Act. Although passed with a party-line vote, the bill involved substantial compromise. Both the bill itself and its implementation, which has not been especially forceful, have been controversial. With the recent transition to the Trump administration, the fate of Dodd-Frank remains in doubt.
5.3. Declining Unions and Growing Economic Inequality
Any account of the growth of economic inequality must include a discussion of the decline of labor union membership and power, a development with consequences for both economic and political inequality. Unions operate in several ways to boost workers’ power and enhance their earnings. Union members are more likely to be politically active even beyond what we would expect on the basis of their education and incomes. Furthermore, labor unions represent their members’ economic interests—and the economic interests of ordinary citizens more generally—in politics. Unions also provide workers a collective voice in the workplace.
The share of the workforce that is unionized actually peaked in the 1950s, but the past three decades have witnessed striking attrition in the proportion of workers who are union members and the slightly higher proportion who are covered by union contracts. It is notable that, even as the size of the workforce expanded substantially, the absolute number of union members declined by nearly five million over this period. In 1977, 26.5 percent of all wage and salary workers were members of unions; by 2014, the figure had dropped to 11.1 percent35. America’s circumstances are not unique and over the last generation, the erosion in the proportion of the workforce that is unionized has been common across industrial democracies. In a group of twenty advanced democracies, the proportion of unionized workers diminished between 1979 and the late 1990s in fourteen of them36. Still, even if the United States is hardly alone in the drop in union density, the United States has, in comparative terms, very low levels of union membership.
The decrease in union ranks has occurred entirely in the private sector. The proportion of private-sector workers who were union members decreased steadily, from 21.7 percent in 1977 to 6.6 percent in 2014. In contrast, the share of public-sector workers who are union members fluctuated within a very narrow range and ended the period at a slightly higher level, 35.7 percent, than at the beginning. While the share of the workforce employed in the public sector fell from 18.7 percent to 15.2 percent over this period, the share of union members who are public-sector employees rose sharply, from 31.4 percent to 54.4 percent.
There is no question that the decline of union membership has had an impact on the growth of income inequality, although there is disagreement about how much. The union wage premium—that is, the increment to wages and benefits accruing solely from union membership with other relevant factors taken into account—has diminished since the 1980s. Still, union membership clearly boosts compensation—especially for private-sector employees, for men, for blue-collar workers, and for workers with no post-secondary education37. In fact, one study estimates that union decline explains between a fifth and a third of the growth in wage inequality among men (Western and Rosenfeld 2011).
At the same time that the weakening of union economic power has had consequences for the size of workers’ paychecks and the conditions under which they work, union decline has diminished their political capacity to support policies that protect the economic interests of ordinary workers and to oppose policies that benefit the privileged. An indicator of the political weakness of organized labor is the finding in a recent study that when asked to name their principal antagonists on the issues on which they were currently working, not one of the corporate lobbyists mentioned a union (Drutman 2015, pp. 78–79). Thus, union decline has operated through both the workplace and politics to enhance income inequality.
What explains the steep decline in the share of American workers who are union members? A number of factors account for this trend38. One is structural changes in the American economy, in particular the decrease in manufacturing employment. Another is diminished support for unionization among workers. Unions themselves made miscalculations. There is evidence that the leadership of the American Federation of Labor and Congress of Industrial Organizations (AFL-CIO), especially George Meany, did not devote sufficient attention or resources to organizing. Furthermore, employers have been increasingly aggressive. Aided by consultants who specialize in “union prevention,” businesses have become substantially more hostile to union-organizing drives in both tone and tactics.
Finally, the weakening of labor has undoubtedly had a political component39. A significant blow to organized labor unions was the passage in 1947 of the employer-friendly Taft-Hartley Act, which proscribed a number of labor practices and permitted states to pass “right-to-work” laws outlawing the union shop. Although attempts have been made to alter or repeal it, Taft-Hartley remains in place today. In fact, organized labor has not succeeded in realizing any of its major legislative goals in decades. During both the Carter and Obama administrations, Congresses controlled by Democrats handed legislative defeats to organized labor40.
Political developments in the early years of the Reagan administration are critical. In a turning point in labor history, during the summer of 1981, Reagan dismissed striking air traffic controllers and replaced them with nonunion employees, after which employers have felt free to replace striking workers. In addition, Reagan was able to name appointees to the National Labor Relations Board (NLRB) who were unfriendly to labor. The result was policy changes that have facilitated management’s capacity to act aggressively against unions41. The NLRB was able to weaken worker protections under the National Labor Relations Act by overturning worker-friendly precedents, many of them long standing, through a series of decisions in carefully selected cases. At the same time, whether by accident or design, the number of decisions in cases of unfair labor practices dwindled, and the backlog of unresolved cases expanded to the largest number in history (Gross 1995, p. 253). More recently, at the state level, bolstered by friendly state legislatures, Republican governors in a number of states have dealt with revenue shortfalls by cutting the medical benefits and pensions of unionized public employees and, more fundamentally, targeting their collective bargaining rights.
6. Conclusions
Economic deserts are not only unequally distributed but are more unequally distributed now than at any time in several generations and are more unequal in the United States than in most developed democracies. Those at the top have garnered most of the income gains while incomes in the middle and lower ranges have stagnated, and the number of desperately poor has risen.
What we have seen undermines several clichés about economic life in America. For one, it is often argued that a rising economic tide lifts all boats. However, growing prosperity and productivity in recent decades have lifted the yachts but left the dinghies still grounded. Moreover, with the stagnation in middle- and lower-class income and earnings, no longer does American affluence imply that low-income workers are better off in absolute terms than they are elsewhere. Finally, in spite of rhetoric about America as the land of opportunity, well-educated, affluent parents are ordinarily able to pass their high status along to their children, and the rates of upward mobility in the United States are actually lower than in most affluent democracies. Besides, the possibilities for those of modest origins to become successful have surely not increased in this era of increasing economic inequality. Indeed, they may have diminished.
It is difficult to sort out the causes of economic inequality, but there is agreement that technological change, international trade, and domestic outsourcing are significant factors. Although the role of politics is more controversial, an environment of government policy shapes the way the markets function, and government policies influence the distribution of income. In addition, government inaction has exacerbated income inequality. Public officials have had policy instruments at their disposal—for example, raising the minimum wage regularly or establishing prudent standards for mortgage loans—that might have decelerated the rate of growth of economic inequality. Thus, the sum total of government action and inaction has been insufficient to keep up with growing income inequality in the United States and has had less impact on the increase than in other affluent democracies.
Another factor that has added to economic inequality is the decline of unions and the resulting reduction in the economic and political power of workers. Even though private-sector union membership is a fraction of what it once was, unionized workers still command better wages and benefits than otherwise similar non-union workers. The weakness of unions also has implications for the inequalities of political voice. Among organized interests, unions are the most important advocates for the economic needs and concerns of ordinary workers. Labor union membership has a mobilizing effect for individuals: compared to their non-union counterparts, union members are more likely to vote or to engage in other political activity.
We are concluding this essay in the same week as the announcement of the broad outlines of a tax plan that, in one assessment, “shifts trillions to the wealthiest.” (Davis and Cohen 2017). Should this tax plan be enacted in roughly its proposed form, it would hardly ameliorate the current levels of economic inequality and would serve as additional evidence that politics matters for economic outcomes.
Author Contributions
Kay Lehman Schlozman took the lead in drafting this chapter but all authors contributed to it.
Conflicts of Interest
The authors declare no conflict of interest.
References
- Atkinson, Anthony. 2015. Inequality: What Can Be Done? Cambridge: Harvard University Press. [Google Scholar]
- Baker, Dean, and Jared Bernstein. 2013. Getting Back to Full Employment. Washington: Center for Economic and Policy Research. [Google Scholar]
- Bartels, Larry M. 2016. Unequal Democracy, 2nd ed. Princeton: Princeton University Press. [Google Scholar]
- Bebchuk, Lucian, and Jesse Fried. 2004. Pay without Performance: The Unfulfilled Promise of Executive Compensation. Cambridge: Harvard University Press. [Google Scholar]
- Bitler, Marianne, and Hilary Hoynes. 2016. The More Things Change, the More They Stay the Same? The Safety Net and Poverty in the Great Recession. Journal of Labor Economics 34: S403–44. [Google Scholar] [CrossRef]
- Bivens, Josh. 2014. Walton Family Net Worth is a Case Study Why Growing Wealth Concentration Isn’t Just an Academic Worry. Economic Policy Institute Working Economics Blog. October 3. Available online: http://www.epi.org/blog/walton-family-net-worth-case-study-growing/ (accessed on 18 December 2015).
- Blau, Peter M., and Otis Dudley Duncan. 1967. The American Occupational Structure. New York: Wiley. [Google Scholar]
- Bowles, Samuel, Herbert Gintis, and Melissa Osborne Groves, eds. 2005. Unequal Chances: Family Background and Economic Success. Princeton: Princeton University Press. [Google Scholar]
- Brewer, Mark D. 2007. Split: Class and Cultural Divides in American Politics. Washington: CQ Press, 2007. [Google Scholar]
- Bridges, Benjamin, and Robert V. Gesumaria. 2015. The Supplemental Poverty Measure (SPM) and Children: How and Why the SPM and Official Poverty Estimates Differ. Social Security Bulletin 75: 55–81. [Google Scholar]
- Bureau of Labor Statistics. 2015. CPI Inflation Calculator. Available online: http://www.bls.gov/data/inflation_calculator.htm (accessed on 26 December 2015).
- Burtless, Gary, and Christopher Jencks. 2003. American Inequality and Its Consequences. In Agenda for the Nation. Edited by Henry J. Aaron, James M Lindsay and Pietro S. Nivola. Washington: Brookings Institution. [Google Scholar]
- Congressional Budget Office. 2011. Trends in the Distribution of Household Income between 1979 and 2007. October 25, Xii. Available online: https://www.cbo.gov/publication/42729 (accessed on 2 January 2016).
- Congressional Budget Office. 2014. The Distribution of Household Income and Federal Taxes, 2011. November 12. Available online: https://www.cbo.gov/publication/49440 (accessed on 2 January 2016).
- Corak, Miles. 2013. Income Equality, Equality of Opportunity, and Intergenerational Mobility. Journal of Economic Perspectives 27: 79–102. [Google Scholar] [CrossRef]
- Council of Economic Advisers Brief. 2016. Labor Market Monopsony: Trends, Consequences, and Policy Responses. October. Available online: https://www.whitehouse.gov/sites/default/files/page/files/20161025_monopsony_labor_mrkt_cea.pdf (accessed on 15 January 2017).
- Dadush, Uri, Kemal Dervis, Sarah Puritz Milsom, and Bennett Stancil. 2012. Inequality in America: Facts, Trends, and International Perspectives. Washington: Brookings. [Google Scholar]
- Davis, Julie Hirschfield, and Patricia Cohen. 2017. Trumps Plan Shifts Trillions to Wealthiest. New York Times, April 28. [Google Scholar]
- Drutman, Lee. 2015. The Business of America Is Lobbying. Oxford and New York: Oxford University Press. [Google Scholar]
- Duncan, Greg J., and Richard J. Murnane, eds. 2011a. Whither Opportunity? Rising Inequality, Schools, and Children’s Life Chances. New York: Russell Sage. [Google Scholar]
- Duncan, Greg J., and Richard J. Murnane. 2011b. Introduction: The American Dream, Then and Now. In Whither Opportunity? Rising Inequality, Schools, and Children’s Life Chances. Edited by Greg J. Duncan and Richard J. Murnane. New York: Russell Sage. [Google Scholar]
- Economic Policy Institute. 2015. CEO Pay Has Grown 90 Times Faster than Typical Worker Pay Since 1978. July 1. Available online: http://www.epi.org/publication/ceo-pay-has-grown-90-times-faster-than-typical-worker-pay-since-1978/ (accessed on 26 December 2015).
- Economic Policy Institute. 2016. The Productivity–Pay Gap. August. Available online: http://www.epi.org/productivity-pay-gap/ (accessed on 14 January 2017).
- Edin, Kathryn J., and H. Luke Shaefer. 2015. $2.00 a Day: Living on Almost Nothing in America. Boston: Houghton Mifflin Harcourt. [Google Scholar]
- Elwell, Craig K. 2014. Inflation and the Real Minimum Wage: A Fact Sheet. Congressional Research Service. Available online: https://www.fas.org/sgp/crs/misc/R42973.pdf (accessed on 8 March 2016).
- Employment Benefit Research Institute. 2015. EBRI Databook on Employee Benefits. Available online: https://www.ebri.org/pdf/publications/books/databook/DB.Chapter%2005.pdf (accessed on 8 March 2016).
- Fieldhouse, Andrew. 2013. Rising Income Inequality and the Role of Shifting Market-Income Distribution, Tax Burdens, and Tax Rates. Economic Policy Institute, June 14. Available online: http://www.epi.org/publication/rising-income-inequality-role-shifting-market/ (accessed on 2 January 2016).
- Financial Crisis Inquiry Commission. 2011. The Financial Crisis Inquiry Report. In U.S. Government Printing Office. Available online: https://www.gpo.gov/fdsys/pkg/GPO-FCIC/pdf/GPO-FCIC.pdf (accessed on 14 January 2016).
- Flanagan, Robert J. 2005. Has Management Strangled U.S. Unions? Journal of Labor Research 26: 35. [Google Scholar] [CrossRef]
- Formisano, Ronald P. 2015. Plutocracy in America. Baltimore: Johns Hopkins University Press, pp. 77–80. [Google Scholar]
- Freeman, Richard B. 1997. When Earnings Diverge: Causes, Consequences, and Cures for the New Inequality in the United States. Washington: National Policy Association, p. 19. [Google Scholar]
- Freeman, Richard B. 2007. America Works: The Exceptional U.S. Market. New York: Russell Sage Foundation. [Google Scholar]
- Freeman, Richard B., and Lawrence Katz. 1994. Rising Wage Inequality: The United States vs. Other Advanced Countries. In Working under Different Rules. Edited by Richard B. Freeman. New York: Russell Sage Foundation. [Google Scholar]
- Ganzeboom, Harry B. G., Donald J. Treiman, and Wout C. Ultee. 1991. Comparative Intergenerational Stratification Research: Three Generations and Beyond. Annual Review of Sociology 17: 277–302. [Google Scholar] [CrossRef]
- Goldfield, Michael. 1987. The Decline of Organized Labor in the United States. Chicago: University of Chicago Press. [Google Scholar]
- Gornick, Janet C., and Branko Milanovic. 2015. Income Inequality in the United States in Cross-National Perspective: Redistribution Revisited. LIS Center Research Brief. May 4. Available online: https://www.gc.cuny.edu/CUNY_GC/media/CUNY-Graduate-Center/PDF/Centers/LIS/LIS-Center-Research-Brief-1-2015.pdf (accessed on 14 January 2017).
- Gross, James A. 1995. Broken Promise: The Subversion of U.S. Labor Relations Policy, 1947–1994. Philadelphia: Temple University Press. [Google Scholar]
- Hacker, Jacob S. 2006. The Great Risk Shift: The Assault on American Jobs, Families, Health Care, and Retirement and How You Can Fight Back. Oxford: Oxford University Press. [Google Scholar]
- Hacker, Jacob S., and Paul Pierson. 2010. Winner-Take-All Politics. New York: Simon and Schuster. [Google Scholar]
- Hauser, Robert M., and David L. Featherman. 1977. The Process of Stratification. New York: Academic Press. [Google Scholar]
- Hirsch, Barry, and David Macpherson. 2015. Union Membership and Coverage Database from the CPS. Available online: http://www.unionstats.com/ (accessed on 31 December 2015).
- Hout, Michael. 1988. More Universalism, Less Structural Mobility. American Journal of Sociology 93: 1358–400. [Google Scholar] [CrossRef]
- Huang, Chye-Ching, and Brandon DeBot. 2015. Ten Facts You Should Know About the Federal Estate Tax. Center on Budget and Policy Priorities, March 23. Available online: http://www.cbpp.org/sites/default/files/atoms/files/1-8-15tax.pdf (accessed on 2 January 2016).
- Institute on Taxation and Economic Policy. 2015. Who Pays?: A Distributional Analysis of the Tax Systems in All Fifty States, 5th ed. January. Available online: http://www.itep.org/whopays/full_report.php (accessed on 2 January 2016).
- Isaacs, Julia B., Isabel V. Sawhill, and Ron Haskins, eds. 2008. Getting Ahead or Losing Ground: Economic Mobility in America. Washington: Brookings Institution and Economic Mobility Project. [Google Scholar]
- Jacobson, Darien B., Brian G. Raub, and Barry W. Johnson. 2007. The Estate Tax: Ninety Years and Counting. Internal Revenue Service. In Compendium of Federal Transfer Tax and Personal Wealth Studies. Available online: https://www.irs.gov/pub/irs-soi/11pwcompench1aestate.pdf (accessed on 15 May 2017).
- Jencks, Christopher. 2005. Why Do So Many Jobs Pay So Badly? In Inequality Matters. Edited by James Lardner and David A. Smith. New York: New Press. [Google Scholar]
- Johnston, David Cay. 2007. The Great Tax Shift. In Inequality Matters. Edited by Lardner and Smith. New York: The New Press, pp. 168–73. [Google Scholar]
- Katz, Michael B. 2001. The Price of Citizenship: Redefining the American Welfare State. New York: Henry Holt. [Google Scholar]
- Kens, Paul. 1998. Lochner v. New York: Economic Regulation on Trial. Lawrence: University Press of Kansas. [Google Scholar]
- Krueger, Alan. 2012. The Rise and Consequences of Inequality. Presentation Made to the Center for American Progress. January 12. Available online: https://www.americanprogress.org/events/2012/01/12/17181/the-rise-and-consequences-of-inequality/ (accessed on 30 December 2015).
- Krugman, Paul. 2014. Now That’s Rich. New York Times, May 9. [Google Scholar]
- Leonhardt, David, and Kevin Quealy. 2014. U.S. Middle Class Is No Longer the World’s Richest. New York Times, April 23. [Google Scholar]
- Levy, Paul Alan. 1985. The Unidimensional Perspective of the Reagan Labor Board. Rutgers Law Journal 16: 269–390. [Google Scholar]
- Lichtenstein, Nelson. 2002. State of the Union. Princeton: Princeton University Press. [Google Scholar]
- Lieber, Ron. 2010. Student Debt and a Push for Fairness. New York Times, June 5. [Google Scholar]
- Mishel, Lawrence. 2012. Unions, Inequality, and Faltering Middle-Class Wages. Economic Policy Institute. August 29. Available online: http://www.epi.org/publication/ib342-unions-inequality-faltering-middle-class/ (accessed on 4 January 2016).
- Mishel, Lawrence, and Jessica Schieder. 2016. Economic Policy Institute. CEO Compensation Grew Faster Than The Wages of the Top 0.1 Percent and the Stock Market. July 13. Available online: http://www.epi.org/publication/ceo-compensation-grew-faster-than-the-wages-of-the-top-0-1-percent-and-the-stock-market/ (accessed on 16 May 2017).
- Mishel, Lawrence, and Ross Eisenbrey. 2015. How to Raise Wages: Policies That Work and Policies That Don’t. Briefing Paper #391. Washington: Economic Policy Institute, March 16. [Google Scholar]
- Mishel, Lawrence, Jared Bernstein, and Heidi Shierholz. 2009. The State of Working America, 2008/2009. Ithaca: Cornell University Press, ILR Press. [Google Scholar]
- Mishel, Lawrence, Josh Bivens, Elise Gould, and Heidi Shierholz. 2012. The State of Working America, 12th ed. Ithaca: Cornell University Press. [Google Scholar]
- Mishel, Lawrence, John Schmitt, and Heidi Shierholz. 2014. Wage Inequality: A Story of Policy Choices. New Labor Forum 23: 26–31. [Google Scholar] [CrossRef]
- Moe, Terry. 1987. Interests, Institutions, and Positive Theory: The Politics of the NLRB. Studies in American Political Development 2: 266–71. [Google Scholar] [CrossRef]
- Morgenson, Gretchen. 2015. Comparing Paychecks with CEOs. New York Times, April 12. [Google Scholar]
- OECD. 2014. OECD Factbook 2014: Economic, Environmental and Social Statistics. Paris: OECD Publishing, pp. 66–67. Available online: http://dx.doi.org/10.1787/factbook-2014-en (accessed on 18 December 2015).
- Opfer, Chris. 2017. Trump Freezes Overtime, Pay Regulations. Bloomberg BNA. January 24. Available online: https://www.bna.com/trump-freezes-overtime-n73014450151/ (accessed on 26 April 2017).
- Piketty, Thomas. 2014. Capital in the Twenty-First Century. Cambridge: Harvard University Press. [Google Scholar]
- Piketty, Thomas, and Emmanuel Saez. 2003. Income Inequality in the United States, 1913–1998. Quarterly Journal of Economics 118: 1–39. [Google Scholar] [CrossRef]
- Putnam, Robert D. 2015. Our Kids: The American Dream in Crisis. New York: Simon and Schuster. [Google Scholar]
- Rampell, Catherine. 2013. Freebies for the Rich. New York Times Magazine, September 29, 14. [Google Scholar]
- Reich, Robert B. 2012. Beyond Outrage. New York: Random House, Vintage Books. [Google Scholar]
- Reich, Robert B. 2015. The Political Roots of Widening Inequality. The American Prospect, April 28, 28–29. [Google Scholar]
- Rosenbaum, Dottie, and Brynne Keith-Jennings. 2016. SNAP Costs and Caseloads Declining. Center on Budget and Policy Priorities, March 8. Available online: http://www.cbpp.org/research/food-assistance/snap-costs-and-caseloads-declining (accessed on 16 August 2016).
- Rosenfeld, Jake. 2014. What Unions No Longer Do. Cambridge: Harvard University Press. [Google Scholar]
- Saez, Emmanuel, and Gabriel Zucman. 2016. Wealth Inequality in the United States since 1913: Evidence from Capitalized Income Data. Quarterly Journal of Economics 131: 519–78. [Google Scholar] [CrossRef]
- Sanger-Katz, Margot. 2016. Bucking a Health Trend, Fewer Kids Are Dying. New York Times, June 19. [Google Scholar]
- Schlozman, Kay Lehman, Sidney Verba, and Henry E. Brady. 2012. The Unheavenly Chorus: Unequal Political Voice and the Broken Promise of American Democracy. Princeton: Princeton University Press. [Google Scholar]
- Short, Kathleen. 2015. The Supplemental Poverty Measure: 2014. In Current Population Reports; September. Available online: https://www.census.gov/content/dam/Census/library/publications/2015/demo/p60-254.pdf (accessed on 16 May 2017).
- Smeeding, Timothy M. 2005. Public Policy, Economic Inequality, and Poverty: The United States in Comparative Perspective. Social Science Quarterly 86: 955–83. [Google Scholar] [CrossRef]
- Stiglitz, Joseph E. 2013. The Price of Inequality. New York: W.W. Norton. [Google Scholar]
- Stiglitz, Joseph E. 2015. Rewriting the Rules of the American Economy. The Roosevelt Institute. Available online: http://rooseveltinstitute.org/rewriting-rules-report/ (accessed on 14 January 2017).
- Stonecash, Jeffrey M. 2010. Class in American Politics. In New Directions in American Politics. Edited by Jeffrey M. Stonecash. New York: Routledge. [Google Scholar]
- Wage and Hour Division. 2015. History of Federal Minimum Wage Rates under the Fair Labor Standards Act. Available online: https://www.dol.gov/whd/minwage/chart.htm (accessed on 16 May 2017).
- Warren, Elizabeth, and Amelia Warren Tyagi. 2003. The Two-Income Trap. New York: Basic Books. [Google Scholar]
- Western, Bruce, and Jake Rosenfeld. 2011. Unions, Norms, and the Rise in U.S. Wage Inequality. American Sociological Review 76: 532. [Google Scholar] [CrossRef]
- Ziliak, James P. 2015. Income, Program Participation, and Financial Vulnerability: Research and Data Needs. Journal of Economic and Social Measurement 40: 34–36. [Google Scholar] [CrossRef]
| 1 | Walton Family Net Worth is a Case Study Why Growing Wealth Concentration Isn’t Just an Academic Worry. Economic Policy Institute Working Economics Blog, posted October 3 (Bivens 2014). |
| 2 | The minimum wage for 1978 is found at U.S. Department of Labor, Wage and Hour Division. 1938–2009. (Wage and Hour Division 2015); cost of living adjustment is taken from U. S. Department of Labor, Bureau of Labor Statistics (2015), CPI Inflation Calculator; the rate of growth of CEO pay (including the value of stock options exercised in a given year plus salary, bonuses, restricted stock grants, and long-term incentive payouts) for chief executives of the top 350 U.S. firms is taken from Lawrence Mishel and Alyssa Davis. (Economic Policy Institute 2015). |
| 3 | Data are for the 34 members of the Organization for Economic Cooperation and Development (OECD). The poverty rate is the proportion of the population whose incomes are below half the median for the population as a whole. (OECD 2014, pp. 66–67) |
| 4 | |
| 5 | For extensive additional bibliography and discussion of technical matters, see (Schlozman et al. 2012, chp. 3). See, also, (Piketty and Saez 2003, pp. 1–39; Burtless and Jencks 2003, chp. 3; Mishel et al. 2012; Piketty 2014, esp. Part III; Atkinson 2015, chp. 1). |
| 6 | There is controversy among economists about the long-used official definition of poverty. An alternative measure, which takes account of in-kind government benefits, shows lower rates of poverty among children and higher rates among adults, especially the elderly. See (Bridges and Gesumaria 2015, pp. 55–81; Short 2015, pp. 60–254). |
| 7 | (Stiglitz 2013, p. 20). On desperate poverty, see (Edin and Shaefer 2015). |
| 8 | (Economic Policy Institute 2015). The figure is for chief executives of the top 350 U.S. firms and includes the value of stock options exercised in a given year plus salary, bonuses, restricted stock grants, and long-term incentive payouts. |
| 9 | See (Bebchuk and Fried 2004) |
| 10 | Cited in (Reich 2012, p. 11) |
| 11 | Cited in (Stiglitz 2013, p. 257). |
| 12 | On the erosion of the private welfare state, see (Katz 2001, chps. 6–8; Hacker 2006). |
| 13 | Figure taken from Employment Benefit Research Institute (2015, Table 5.1a), EBRI Databook on Employee Benefits. |
| 14 | Discussion in this paragraph is taken from (Mishel et al. 2012, pp. 376, 385–95). |
| 15 | This section draws on arguments and data in (Burtless and Jencks 2003; Smeeding 2005; Piketty 2014, especially chps. 8–9; Atkinson 2015, chp. 2). Making cross-national comparisons with regard to these issues poses technical dilemmas. See these sources as well the discussions and citations in (Schlozman et al. 2012, pp. 76–79). |
| 16 | |
| 17 | In a vast literature, see, for example, (Blau and Duncan 1967; Hauser and Featherman 1977; Hout 1988, pp. 1358–400; Ganzeboom et al. 1991, p. 284; Burtless and Jencks 2003); the essays in (Bowles et al. 2005); and the essays in (Isaacs et al. 2008). |
| 18 | On the class gaps in child well-being, see (Putnam 2015). With respect to the educational system, see the essays and references in (Duncan and Murnane 2011a), in particular, (Duncan and Murnane, “Introduction,” chp. 1; Reardon, Sean F. “The Widening Academic Achievement Gap between the Rich and the Poor: New Evidence and Possible Explanations,” chap. 5; and Bailey, Martha J., and Susan M. Dynarski, “Inequality in Postsecondary Education,” chp. 6.) |
| 19 | An exception to the pattern of growing gaps between rich and poor children is diminution in the disparity in health between rich and poor for children and young adults. See (Sanger-Katz 2016) |
| 20 | (Corak 2013, Figure 1). See also, (Krueger 2012). |
| 21 | Discussion of such factors is contained in (Dadush et al. 2012, chp. 4). See also, (Atkinson 2015, chp. 3). |
| 22 | Testimony before the Massachusetts legislature, cited without additional bibliographic information in (Kens 1998, p. 19). On the extent to which executive pay reflects forces other than the operations of markets, see (Bebchuk and Fried 2004, Parts I and II). |
| 23 | For evidence and citations supporting the contention that government benefits reduce poverty, see (Ziliak 2015, pp. 34–36). |
| 24 | (Congressional Budget Office 2014, pp. 25–27). A parallel CBO analysis undertaken three years earlier found the opposite, a decrease in the redistributive impact of government benefits, for the period between 1979 and 2007. See (Congressional Budget Office 2011, Xii). |
| 25 | Material in the paragraph is taken from (Johnston 2007, pp. 168–73). |
| 26 | (Congressional Budget Office 2014, Figure 15). See also, (Fieldhouse 2013). |
| 27 | Information in this paragraph is taken from (Stiglitz 2013, pp. 89–92); and (Formisano 2015, pp. 77–80). |
| 28 | For information about the estate tax, see (Jacobson et al. 2007, volume 2, chp. 1); (Jacobson et al. 2007) and (Huang and DeBot 2015). |
| 29 | (Atkinson 2015, pp. 181–82). See also, (Piketty 2014, pp. 499, 508). |
| 30 | Among others, this argument is made by Piketty (2014, pp. 508–12), who finds no evidence that the explosion in compensation has been accompanied by enhanced productivity by high earners. |
| 31 | (Mishel and Eisenbrey 2015, p. 10). In the final year of the Obama administration, the Department of Labor put out a rule making many additional workers eligible for overtime pay. Immediately after Trump took office, this rule was suspended. See (Opfer 2017). |
| 32 | These and other practices are discussed in (Stiglitz 2015) and (Council of Economic Advisers Brief 2016). The specific examples of lower-wage workers who are required to sign non-competes are in (Council of Economic Advisers Brief 2016, p. 8). |
| 33 | For conflicting views on the causes of the 2008 financial crisis, see (Financial Crisis Inquiry Commission 2011), including the two dissenting reports. Material in the remainder of this section is taken from (Warren and Tyagi 2003, pp. 126–29, 152–56; Stiglitz 2013, pp. 46, 93, 112–15, 239–45, 252, 310; Reich 2012, pp. 57–58). |
| 34 | One provision in the 2005 bankruptcy act made it extremely difficult to discharge private student loans—in contrast to, for example, consumer debt—through bankruptcy. See (Lieber 2010). |
| 35 | Data taken from the Union Membership and Coverage Database constructed by Barry Hirsch and David Macpherson. (Hirsch and Macpherson 2015) |
| 36 | (Flanagan 2005, p. 35. Table 1). See (Mishel et al. 2009, p. 375). Of the thirteen countries about which they present data, union coverage is lowest in the United States. |
| 37 | See (Mishel 2012; Rosenfeld 2014, chps. 2–3). |
| 38 | For a more extensive discussion and additional bibliographical sources, see (Schlozman et al. 2012, pp. 87–94); as well as (Freeman 2007, chp. 5). See also (Goldfield 1987; Freeman and Katz 1994; Hacker and Pierson 2010, pp. 56–61; Rosenfeld 2014, chp. 1). |
| 39 | On these factors, see (Lichtenstein 2002, chps. 3–4). |
| 40 | |
| 41 |
Figure 1.
Growing Economic Inequality: After-Tax Household Income by Income Group, 1979–2011 (2011 Dollars). Source: (Congressional Budget Office 2014).
Figure 1.
Growing Economic Inequality: After-Tax Household Income by Income Group, 1979–2011 (2011 Dollars). Source: (Congressional Budget Office 2014).
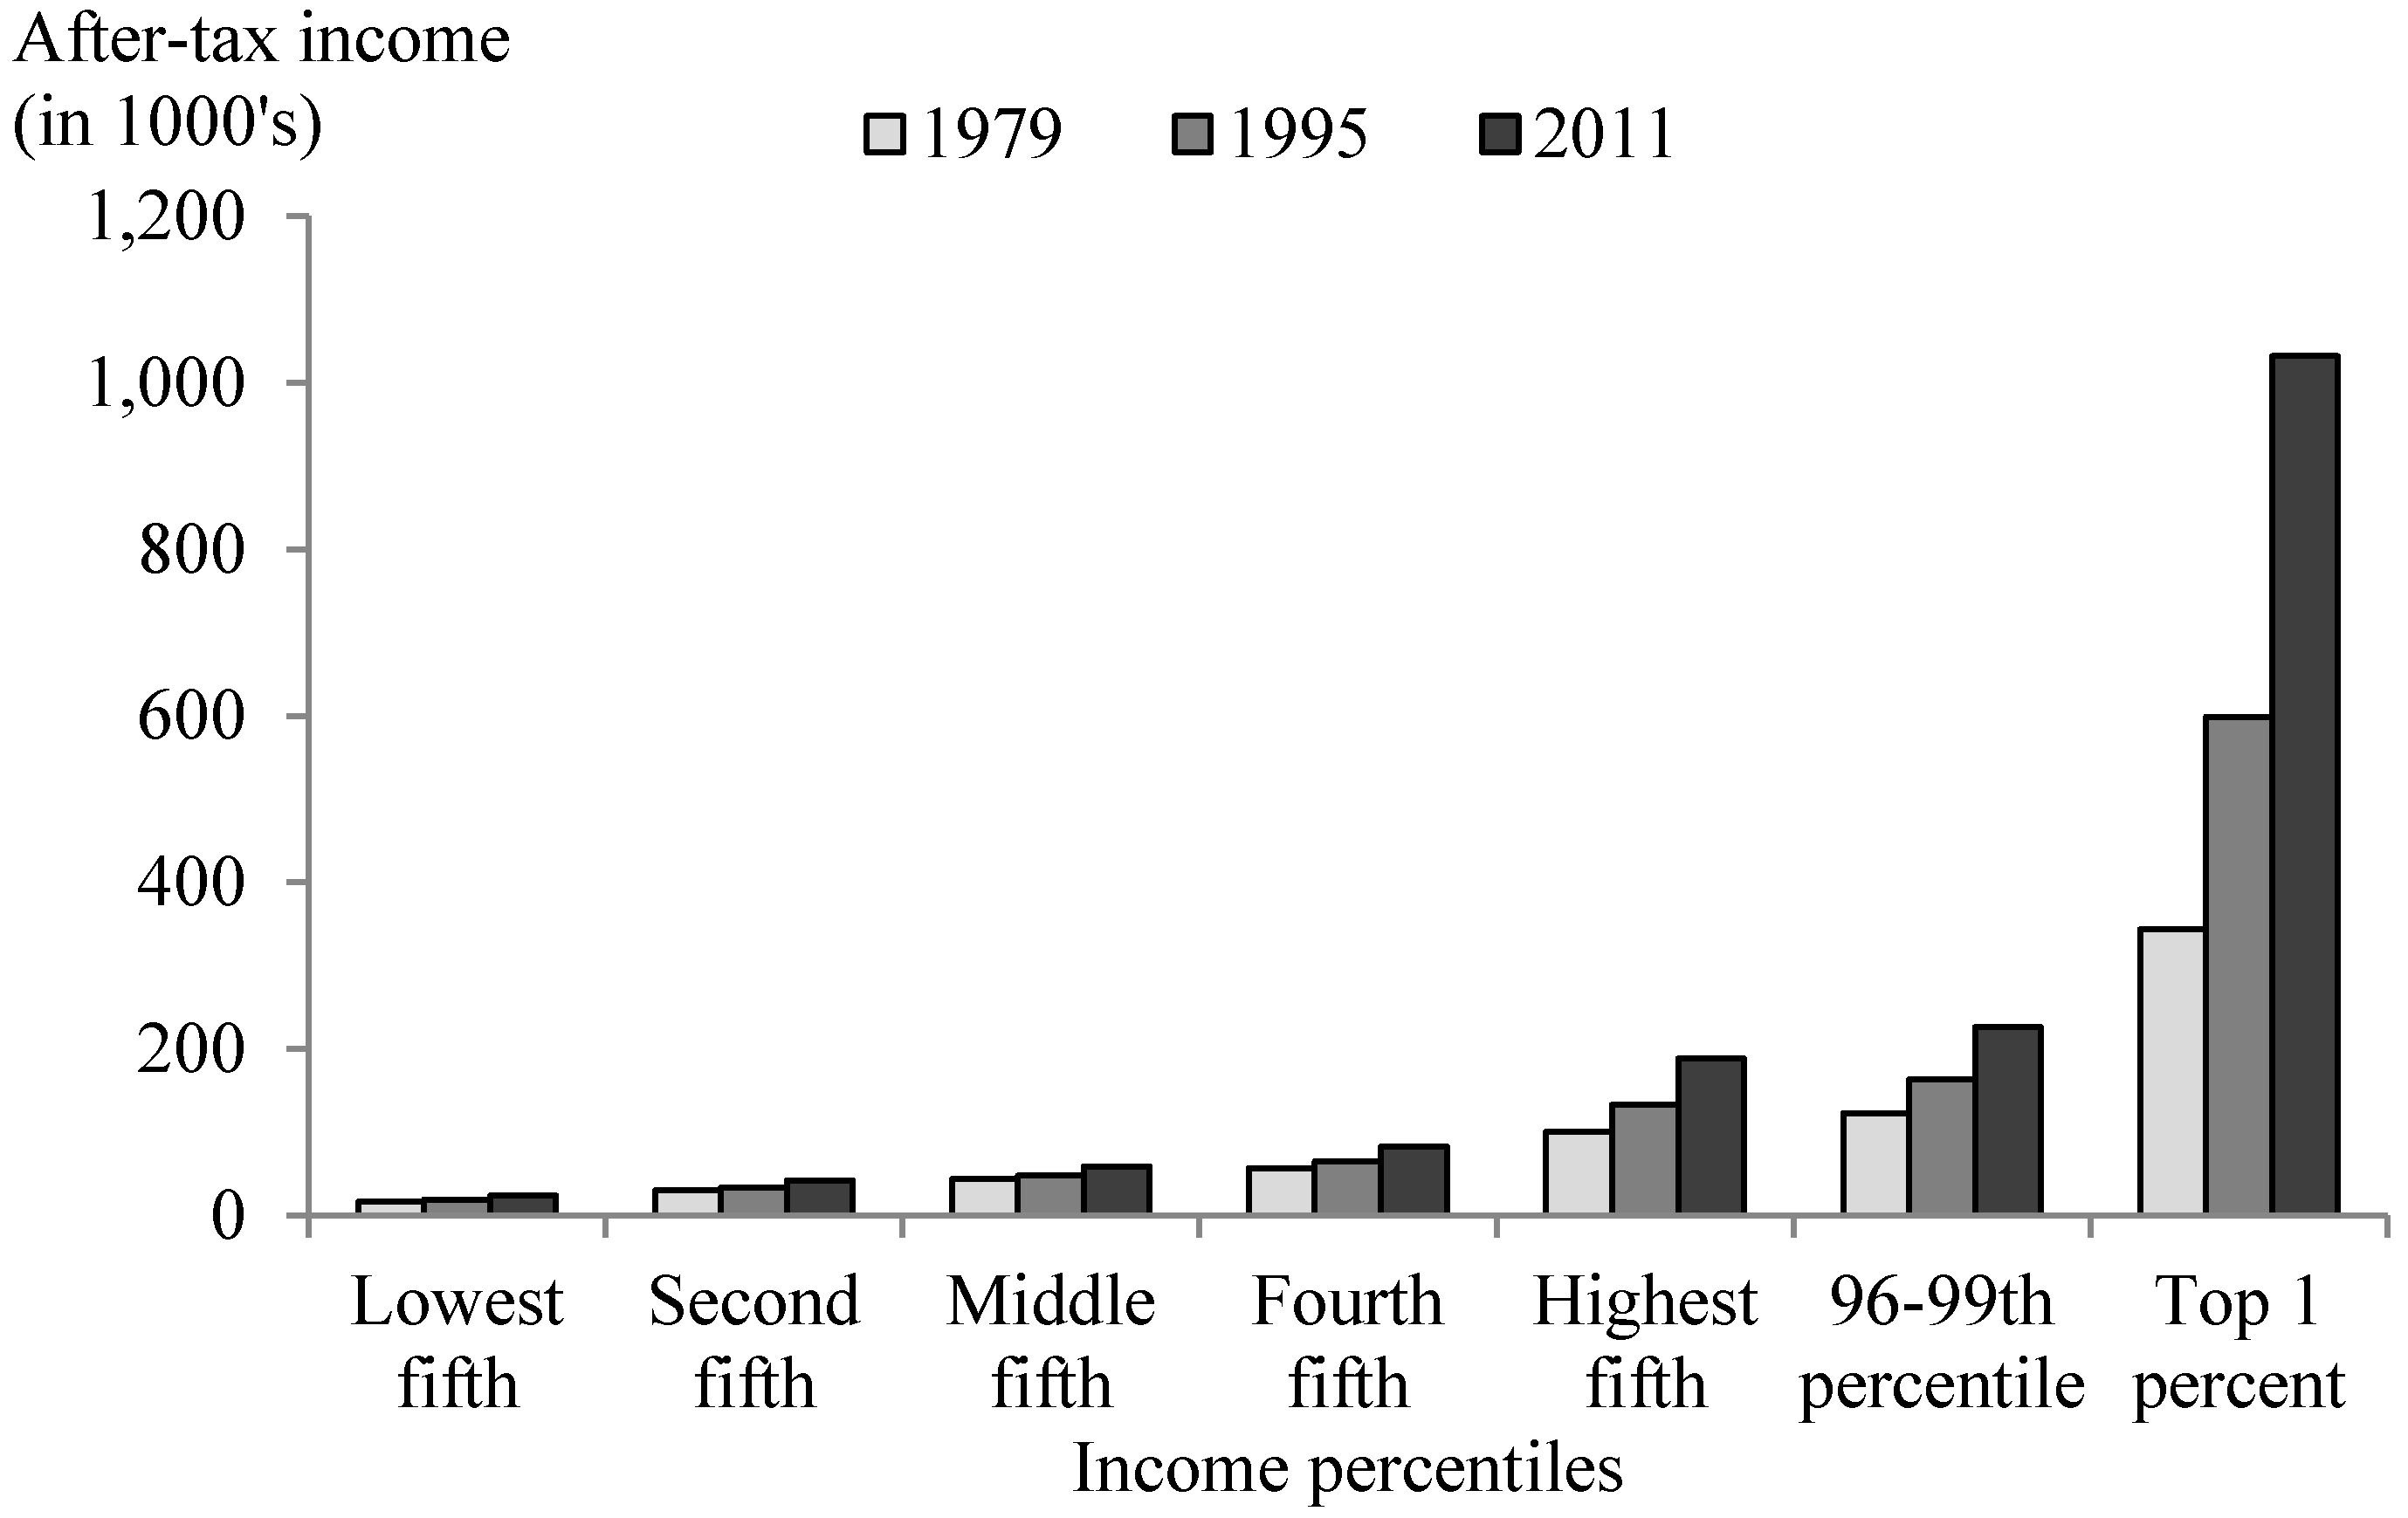
Figure 2.
Growing Wage Inequality: Change in Hourly Wages by Wage Percentile, 1979–2011 (2011 Dollars). Source: Calculated from data presented in “Hourly wages of all workers, by wage percentile, 1973–2011” (Mishel et al. 2012, p. 186).
Figure 2.
Growing Wage Inequality: Change in Hourly Wages by Wage Percentile, 1979–2011 (2011 Dollars). Source: Calculated from data presented in “Hourly wages of all workers, by wage percentile, 1973–2011” (Mishel et al. 2012, p. 186).

© 2017 by the authors. Licensee MDPI, Basel, Switzerland. This article is an open access article distributed under the terms and conditions of the Creative Commons Attribution (CC BY) license (http://creativecommons.org/licenses/by/4.0/).
Share and Cite
MDPI and ACS Style
Schlozman, K.L.; Brady, H.E.; Verba, S. Growing Economic Inequality and Its (Partially) Political Roots. Religions 2017, 8, 97. https://doi.org/10.3390/rel8050097
AMA Style
Schlozman KL, Brady HE, Verba S. Growing Economic Inequality and Its (Partially) Political Roots. Religions. 2017; 8(5):97. https://doi.org/10.3390/rel8050097
Chicago/Turabian StyleSchlozman, Kay Lehman, Henry E. Brady, and Sidney Verba. 2017. "Growing Economic Inequality and Its (Partially) Political Roots" Religions 8, no. 5: 97. https://doi.org/10.3390/rel8050097
Note that from the first issue of 2016, this journal uses article numbers instead of page numbers. See further details here.