Impact of Reciprocity in Information Spreading Using Epidemic Model Variants


University School of Information, Communication and Technology (USIC&T), Guru Gobind Singh (GGS) Indraprastha University, New Delhi 110078, India
*
Author to whom correspondence should be addressed.
Information 2018, 9(6), 136; https://doi.org/10.3390/info9060136
Submission received: 25 April 2018
/
Revised: 31 May 2018
/
Accepted: 1 June 2018
/
Published: 5 June 2018
Abstract
:The use of online social networks has become a standard medium of social interactions and information spreading. Due to the significant amount of data available online, social network analysis has become apropos to the researchers of diverse domains to study and analyse innovative patterns, friendships, and relationships. Message dissemination through these networks is a complex and dynamic process. Moreover, the presence of reciprocal links intensify the whole process of propagation and expand the chances of reaching to the target node. We therefore empirically investigated the relative importance of reciprocal relationships in the directed social networks affecting information spreading. Since the dynamics of the information diffusion has considerable qualitative similarities with the spread of infections, we analysed six different variants of the Susceptible–Infected (SI) epidemic spreading model to evaluate the effect of reciprocity. By analysing three different directed networks on different network metrics using these variants, we establish the dominance of reciprocal links as compared to the non-reciprocal links. This study also contributes towards a closer examination of the subtleties responsible for maintaining the network connectivity.
1. Introduction
In recent years, information spreading on social networks has witnessed a massive surge due to the emergence of online social media as communication channels.
In today’s virtual world, the exchange of information takes place through online social networks with the users as nodes and their relationships as the connectors between nodes. Due to the diffusion of information from one user to another, there is a rapid growth in the amount of information present online [1]. Social network analysis (SNA) is a graph-theoretic based approach to understand and analyse human social interactions, wherein the users are interdependent actors, and links are the channels for flow of information [2]. Amongst other inferences, SNA assists in determining the importance of structural relations to analyse observed behaviours and investigate community structure of other formal and informal networks [3]. With the rapid growth in social networks, these relationships and interactions play a significant role as a user may add some of their followers with factors such as homophily as their neighbours. The terms like “reciprocity”, “intensity” and the “durability” of a network express the quality of relations [4]. Reciprocity is a behavioural response to perceived kindness and unkindness, where kindness comprises of both, the distributional fairness as well as intentional fairness. It is defined as the ratio of the number of bidirectional links, to the total number of links L [5]. As is evident from the published studies, reciprocity is a robust determinant of human behaviour. Durability quantifies the longevity of the underlying relations and obligations activated in particular transactions. Intensity parameter determines the strength of the obligations in relation and reflects the strength of the commitment or the multiplicity of the relationship.
Based on the experiments and questionnaire investigations performed by the researchers of different domains, it is established that reciprocity implies a practice that cannot be justified merely in terms of selfish and purely outcome-oriented preferences.
By their edge properties, online social networks are broadly classified into two classes: directed and undirected networks. Undirected networks such as Flickr and Facebook do not allow users to have a connection unless both acknowledge the friendship, whereas networks such as Anybeat and Twitter can have both unidirectional and bidirectional links known as directed networks. Directed networks have a crucial role in identifying local and community networks to study social interactions [6,7]. In the directed networks, reciprocal links have noticeable effects on dynamical processes, network growth, and higher-order structures such as motifs and communities [8]. Different empirical studies related to the determination of influence (or centrality) or popularity, community finding, and viral marketing have been reported in the literature [9,10,11,12,13].
Previous studies explore the issues related to current and future paths of diffusion, identification of influential nodes and impact of the removal of certain links [14,15,16,17].
This study is motivated by the previous work of Zhu et al. [18] who analysed the significance of reciprocal links in social networks using parameters of structural robustness, i.e., Susceptibility, Giant component size and Average network distance. The work presented here, however, employed variants of epidemic models based information spreading mechanism to empirically investigate the relative importance of reciprocal links using a different set of network characteristics.
In recent years, the information diffusion models originated from a disease spreading mechanisms have drawn the attention of social scientists. Epidemic models approximate real-world scenario. Understanding of information spreading using these models is investigated by different authors and is reasonably accepted by the community [19,20,21]. Researchers [22,23,24] have made ongoing improvements based on classical models, developing new models to study the diffusion process more precisely. In addition, Woo J and Chen H [25] exclaimed the importance of epidemic models showing that the SIR model is a plausible model to describe the diffusion process of a topic. When applied to social networks, the researchers have developed pertinent models by considering parameters like influence, trust [26], reciprocity [18], information content, time, network structure and social factors [27]. Zhu et al. [18] developed a directed SI model by adopting the classic SI model on directed social networks and considered the transmission probability as one of the prominent factors. Xu et al. [20] developed a single layer SEIR model (S-SEIR) to affirm the impact of user’s behaviour and value of information, both, on the transmission of information. J Cannarella and J Spechler [22] proposed another variation, irSIR, and simulated the adoption and abandonment of user views. Feng et al. [23] suggested another variation (FSIR) to incorporate the effect of neighbours in shaping individual’s opinion to spread the information. Wang et al. [24] proposed another variant (ESIS) by adding an “Emotions” component. In their study, the fraction of information with some emotional context was modeled as edge weight. Other specific features of information spreading include tie strength, decaying effect, information contents, non-redundancy of contacts, memory effects, and social reinforcement [13,27,28,29,30,31,32,33].
Further, the structure of the network (number of nodes, reciprocity, clustering coefficients, betweenness centrality, community size, etc.) determines the speed and the level of diffusion in random networks. Different centrality measures like betweenness, degree centrality have a positive correlation in the information spreading, while other centrality measures, such as eccentricity and the information index, have a negative correlation. A positive correlation implies that choosing a node with the maximum centrality value will influence the largest number of users, while negative correlation deals with selecting the node with the lowest centrality value to have the same effect [34]. In this study, we used one of the centrality measures (closeness centrality) to select the opinion leader node for information spreading. However, other measures such as “percolation centrality” and “trust relationships” have also been reported in the literature [35,36]. Further, small world and artificial networks display high clustering coefficients, power law distributions and individual communities between any couple of nodes [37,38] (see Section 3). Watts [39] initiated the importance of strong connections or reciprocity in diffusion rather than the number of initially affected nodes. Considering topologies in identifying the dynamics of random and scale-free networks using evolutionary game theoretic and graph theoretic techniques have also been appraised as well [40,41].
In this study, we empirically analysed the impact of reciprocal links in a directed network affecting the information dissemination. We used three different directed networks of sufficient size, i.e., Epinions, Google+ and LiveJournal, along with varying factors of the network. This study considered one of the variants of the classic epidemic spreading model Susceptible–Infected (SI) model [42] to evaluate the effect of reciprocal links. This study affirms the preponderance of reciprocal links over the non-reciprocal ones. Due to the high variability of both the message and frequency of human responses, dynamic and multiple diffusion models are also introduced in this work where the person can be susceptible again.
This paper is structured as follows. Section 2 gives an overview of information spreading measures and relevant metrics. Section 3 provides the network characteristics of the datasets along with the preprocessing steps. Section 4 elaborates the proposed variations of SI epidemic models and discusses the derived results in light of the network’s structural metrics. In Section 5, we present the conclusions and future directions of our research.
2. Information Spreading Mechanisms and Measures
The dissemination of information is one of the essential purposes of social networks (e.g., massive online social networks) that can range anywhere from rumors to news or from messages to opinions. The process of message diffusion is similar to an epidemic model spreading process [15,43]. In epidemic spreading, there are two types of users: (1) those infected with pathogens; and (2) those susceptible to the pathogens. Similarly, in social networks, information can be transmitted from the communicators to the recipients. The epidemic models explain the individual’s characteristics’ effect on aggregate diffusion dynamics. The SI models are broadly categorised into compartmental models: SIS and SIR models. The SIS model assumes that the nodes are initially Susceptible (S) and are infected once encountered with Infected (I) neighbour and can Recover (R) and may become susceptible again (S). However, SIR model exclaims that the infected person will not become susceptible again. In the diffusion process, the probability by which individuals may become susceptible is known as the transmission probability.
Table 1 outlines essential enhancements of the classical SI model.
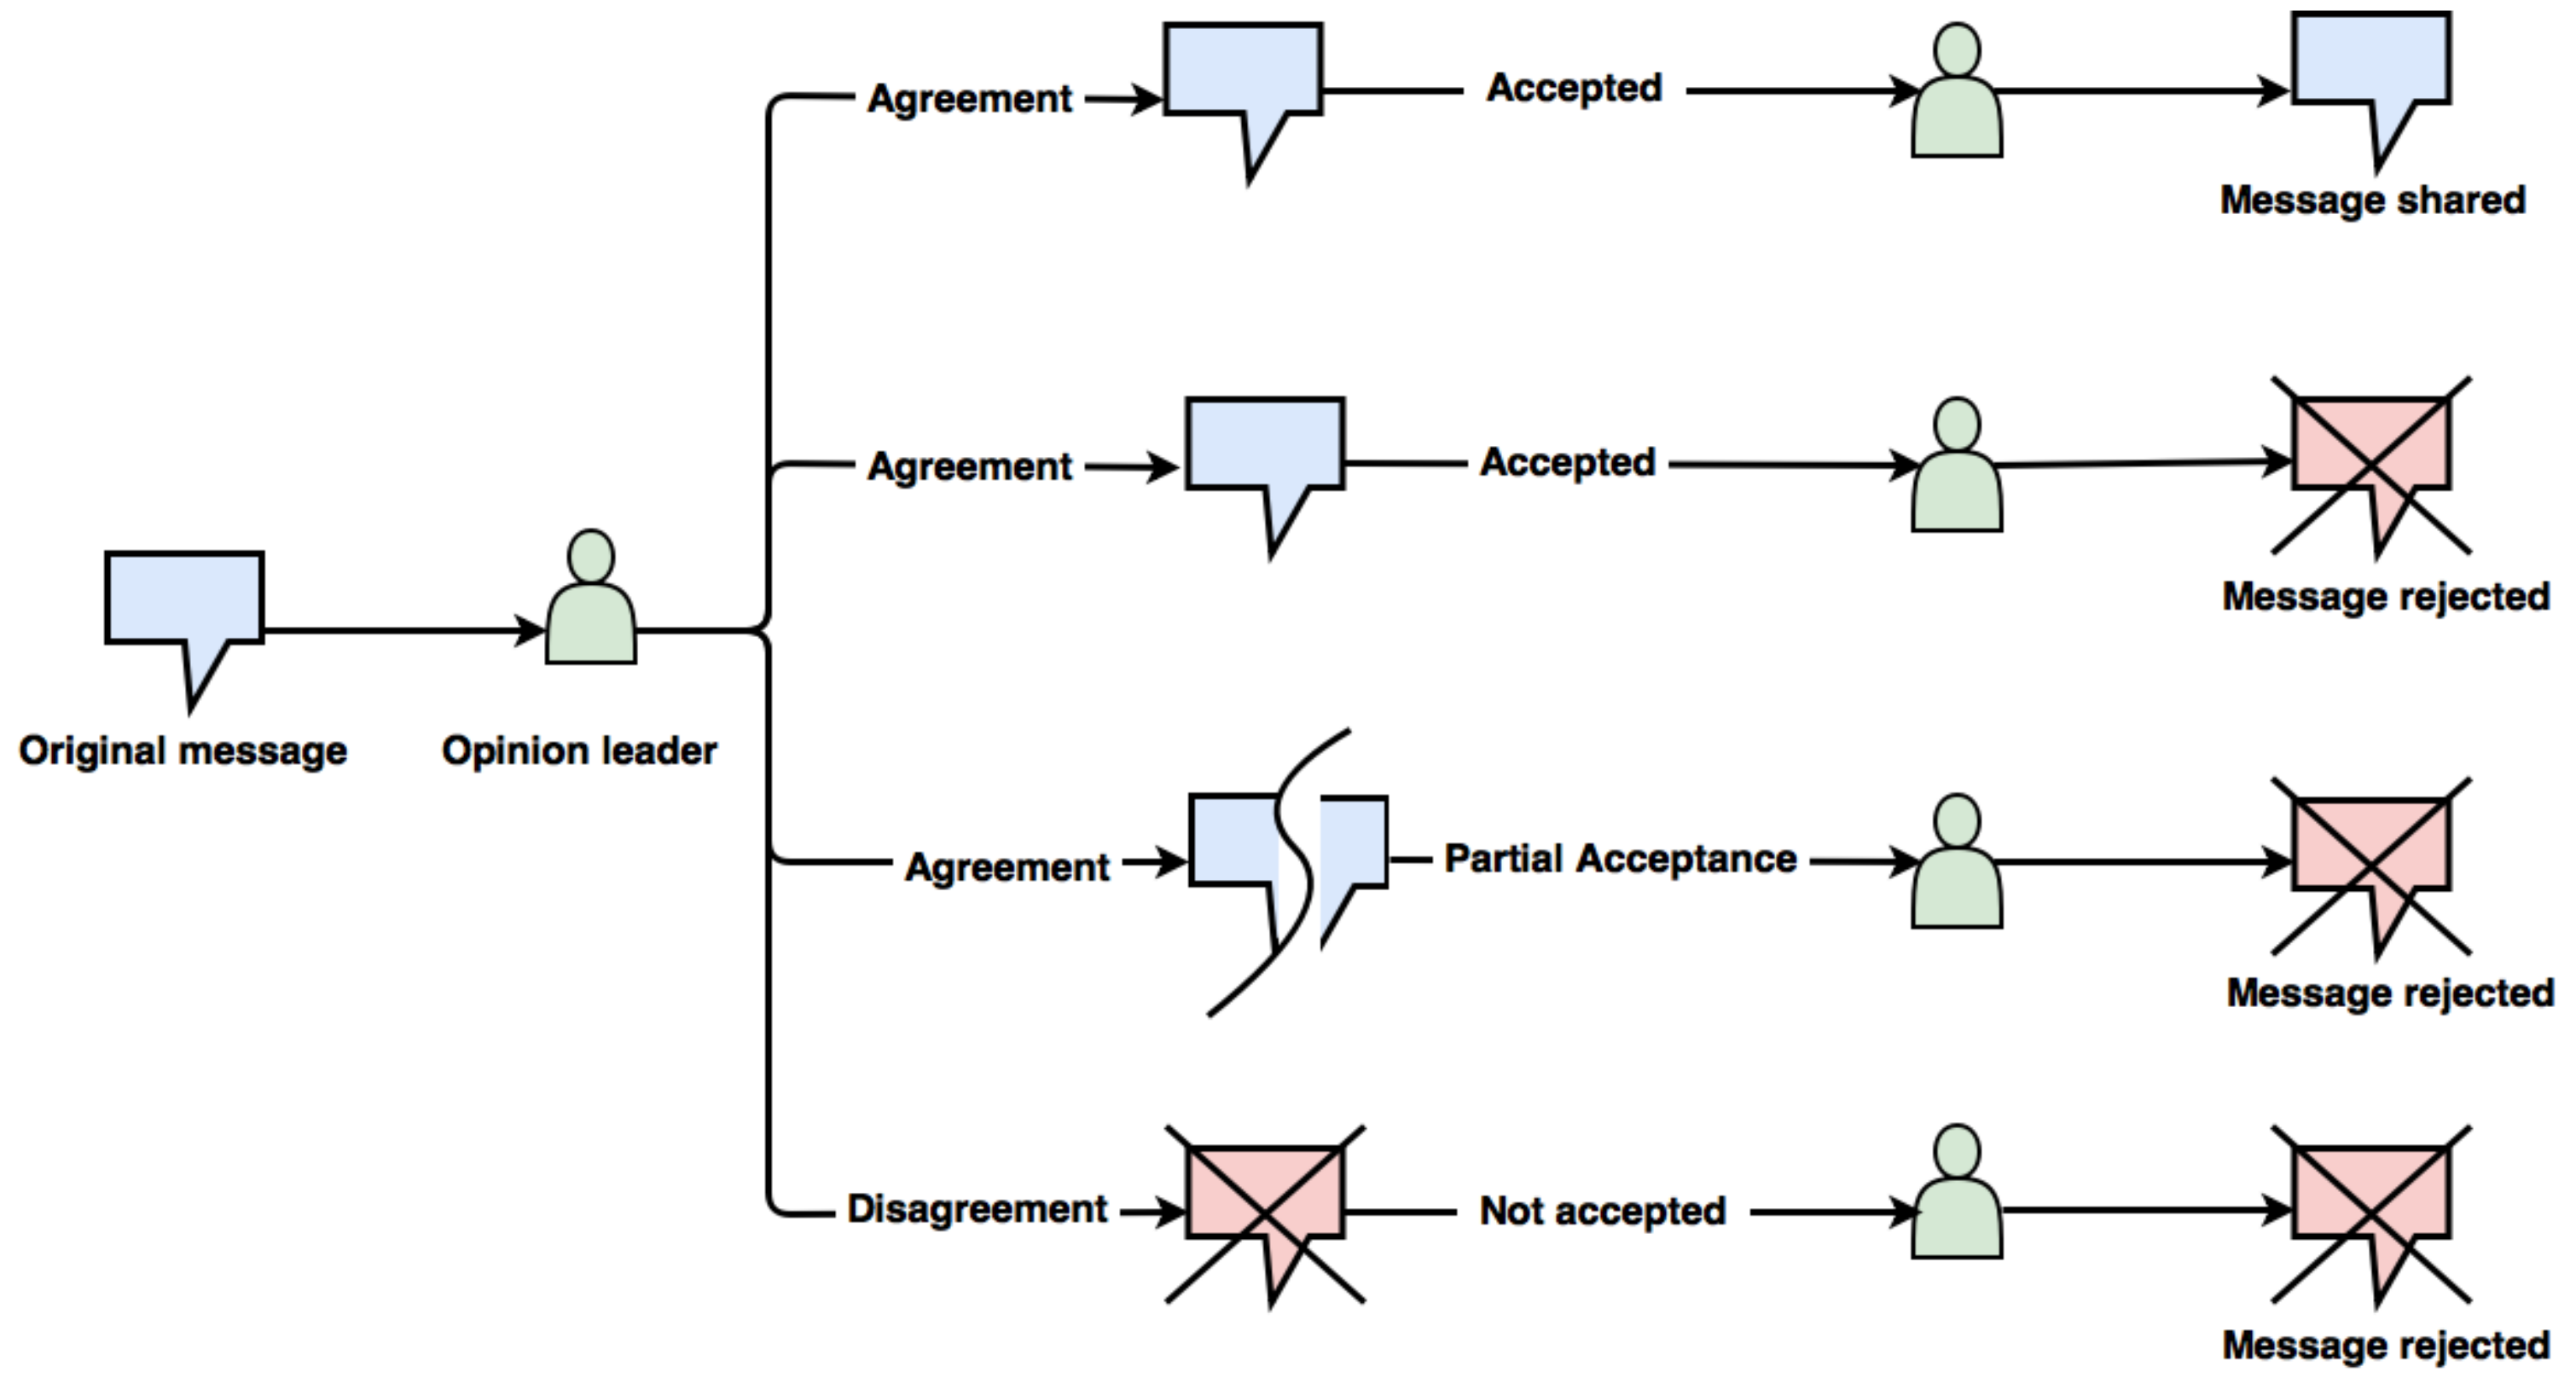
Figure 1 elucidates the user’s behaviour towards the incoming messages in a network. The message spreading process begins with the opinion leader of the network to obtain maximum diffusion rate. The leader can have different mind sets regarding the further dissemination of information. The leader may agree with the message and have the willingness to spread the message to its neighbours. The neighbouring nodes may, however, either diffuse the message in the network or reject it. Further, a case may arise where the neighbours of the leader may partially accept that message. In another scenario, the opinion leader itself is not interested in sharing the information amongst its peers and refuses to spread the message to its immediate neighbours. In this exposition, we use transmission probability to model the willingness of a user to spread the information received.
The reciprocity correlates the closeness of a node with its neighbours, thereby identifying the relationship closeness in a network [44]. Further, the reciprocity of the neighbour of an influential node affects the social density (strength of relationships) of the network. In prior studies, Yoganarasimhan (2012) [45] examined the role of size and structure of a network along with the position of initial seed in the spread of the popularity of youtube’s videos. Although many previous studies consider static network structures [46,47], few consider dynamically evolving community [48] to analyse networks. However, this study examines the importance of the influential spreaders’ effect that diminishes with time and changing behaviour. The distance from the influential spreader affects the diffusion proficiency underlying the centralities and density.
The succeeding section outlines commonly used centrality measures along with their potential use in the identification of an opinion leader.
2.1. Opinion Leaders
Centrality is a structural characteristic of individuals in the network indicating the fitness of an individual within the network. Therefore, it is a natural choice to find the most critical node (opinion leader) [16]. It can help to maximise or minimise diffusion of exhibited behaviour within the network. The most commonly used centrality measures include degree centrality, closeness centrality, betweenness centrality, eccentricity centrality and eigenvector centrality [52,53]. No single measure of centrality, however, suits all applications. We use these centrality measures to disintegrate the network with a minimum number of steps, thereby minimising the diffusion area. Among different measures to identify the influential spreaders in a network, K-core [54,55,56] and centrality based measures [52] are the most popular ones. However, K-core works well with the undirected graphs, though other analogous measures have been proposed for directed graphs as well [57].
Since diffusion processes are triggered when the message is passed on to the opinion leader, the centrality measures prove to be the criteria for identification:
2.1.1. Degree Centrality
The degree centrality assigns the highest score (in terms of the number of incident edges) to the vertex having the largest number of first-neighbours. Degree centrality is defined analogously to the degree of a node but normalised over the maximum number of the neighbours this node can have. In the message dissemination or infection, it refers to the probability of receiving information or being infected [52]. Degree centrality () of a node v is calculated as:
where is the degree of a node, n is the total number of the nodes in the network, and is number of nodes j that are adjacent to node v.
2.1.2. Radius Centrality
Radius Centrality chooses the node with the smallest value of the longest shortest path starting from each node [52]. Thus, it can identify the most influential node for the most remote nodes.
Radius centrality () of a node v is measured as:
where is the shortest path between vertex i and j.
2.1.3. Closeness Centrality
The closeness centrality is based on the idea of communicating between different vertices and the vertex, which is “closer” to all vertices. The farness of a node u is defined as “the sum of its distances to all other nodes”, and similarly its closeness is defined as “the inverse of the farness” [58]. Closeness is considered as a temporal factor for spreading of information sequentially within a network [59]. Closeness Centrality () of a node v is calculated as:
where v and t are the nodes of G.
2.1.4. Betweenness Centrality
In between two randomly chosen vertices, the vertices that have a high probability to occur on a randomly chosen shortest path between those two vertices have a high betweenness. Thus, the more times the node acts as a bridge between the randomly chosen shortest path of two vertices, higher is its betweenness centrality [52]. Hence, concerning diffusion, more a vertex is in between, more are its chances of participating in the information spreading process. Betweenness Centrality of a node v is measured as:
where is total number of shortest paths from node i to node j and is the number of those paths that intersect node v in graph G.
We take closeness centrality measure to find the starting node as “opinion leader”, because members occupying central locations concerning closeness can be very influential in disseminating information to other members of the given network [60]. Thereafter, the starting node transmits the initial message to the network beginning from this node. Furthermore, we have also used degree centrality measure because the nodes with high degree centrality usually have increased interactiveness and thus are more likely to engage in information dissemination (see Section 4.7.2) [46].
3. Methods and Material
3.1. Data and Analysis
In this paper, we consider three publicly available datasets that support the follower–followee relationship: Epinions [61], Google+ [62,63] and LiveJournal [7,64,65]. Figure 2 describes the procedural workflow employed in this study to conduct empirical analysis. The basic description of different datasets used is as follows :
- Epinions: This is a who-trust-whom online social network of a general consumer review site Epinions.com. Users of the site form “trust” relationships by deciding whether to “trust” each other.
- Google+: It is a social networking service offered by Google, where the user can add any other user of the network to his circles, thereby creating a directed social network.
- LiveJournal: It is an online social network that allows members of the web site to maintain their journals, individual and group blogs, and it allows people to declare which other members are their friends.
Owing to the significantly larger size LiveJournal dataset (4,847,571 vertices and 68,475,391 edges), we sample it to a manageable size using the following procedure. The other datasets (Epinions and Google+) have been utilised wholly. To establish the similarity of the sampled and the original network of LiveJournal, we compare the global clustering coefficients of the sampled graphs to the unsampled graph. The global clustering coefficient C measures the transitivity of the network [38]. It is defined as the fraction of the number of closed triplets to the total number of triplets in the network, where one closed triplet is equivalent to 3 × Number of triangles. This measure can be applied to both undirected and directed networks and is often referred as transitivity [66].
The value of global clustering coefficient for the original data set (Live Journal) as calculated by the equation is 0.12, while for the sampled data set is 0.409. Both the values affirm the randomness in the network owing to tending the value towards 0, and not a small-world network. The variance in the values is not rapid, thus implying that the sampling percentage used (2.41%) is under threshold value at which the network breaks [67]. Leskovec (2006) [68] demonstrated that a sampling percentage up to the mark of 15% is usually suitable to match the characteristics of the real graph.
Table 2 describes the specific parameters of three datasets including LiveJournal dataset after sampling. The total nodes represent the total number of users; total edges represent the summation of all the links that exhibit the follower–followee relationship between the users. Reciprocity is calculated using the formula mentioned in the Section 1. Leader Node is the node having the highest closeness centrality and is treated as the starting node to which the message is given in the first place during diffusion.
4. Results and Discussion
4.1. Simple Diffusion
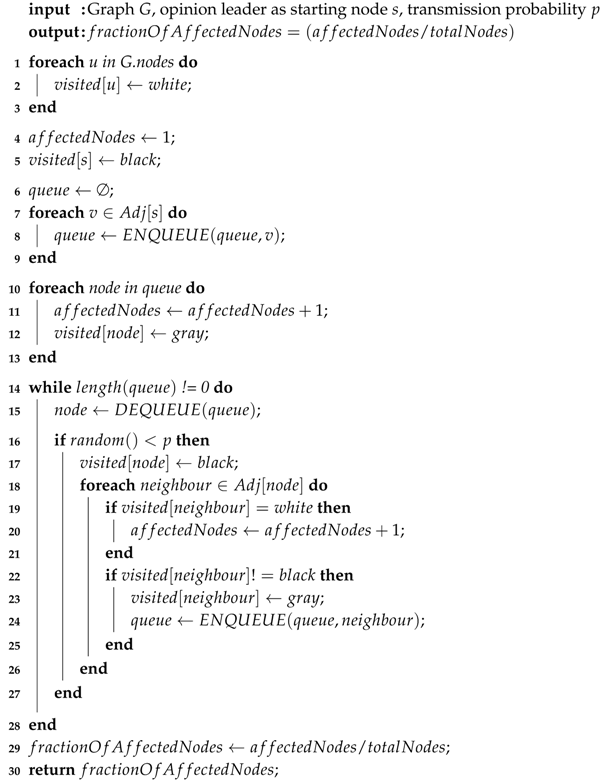
It mimics the SI epidemic model but also includes the transmission probability to model the user’s decision. As illustrated in Algorithm 1, a user (opinion leader) broadcasts a message m to all its neighbours. All nodes that receive the message m may choose to disseminate this message to their adjacent nodes with a probability p (transmission probability), which shows the willingness of the user to forward the message further. This process gets repeated until the message m diffuses to all the achievable nodes.
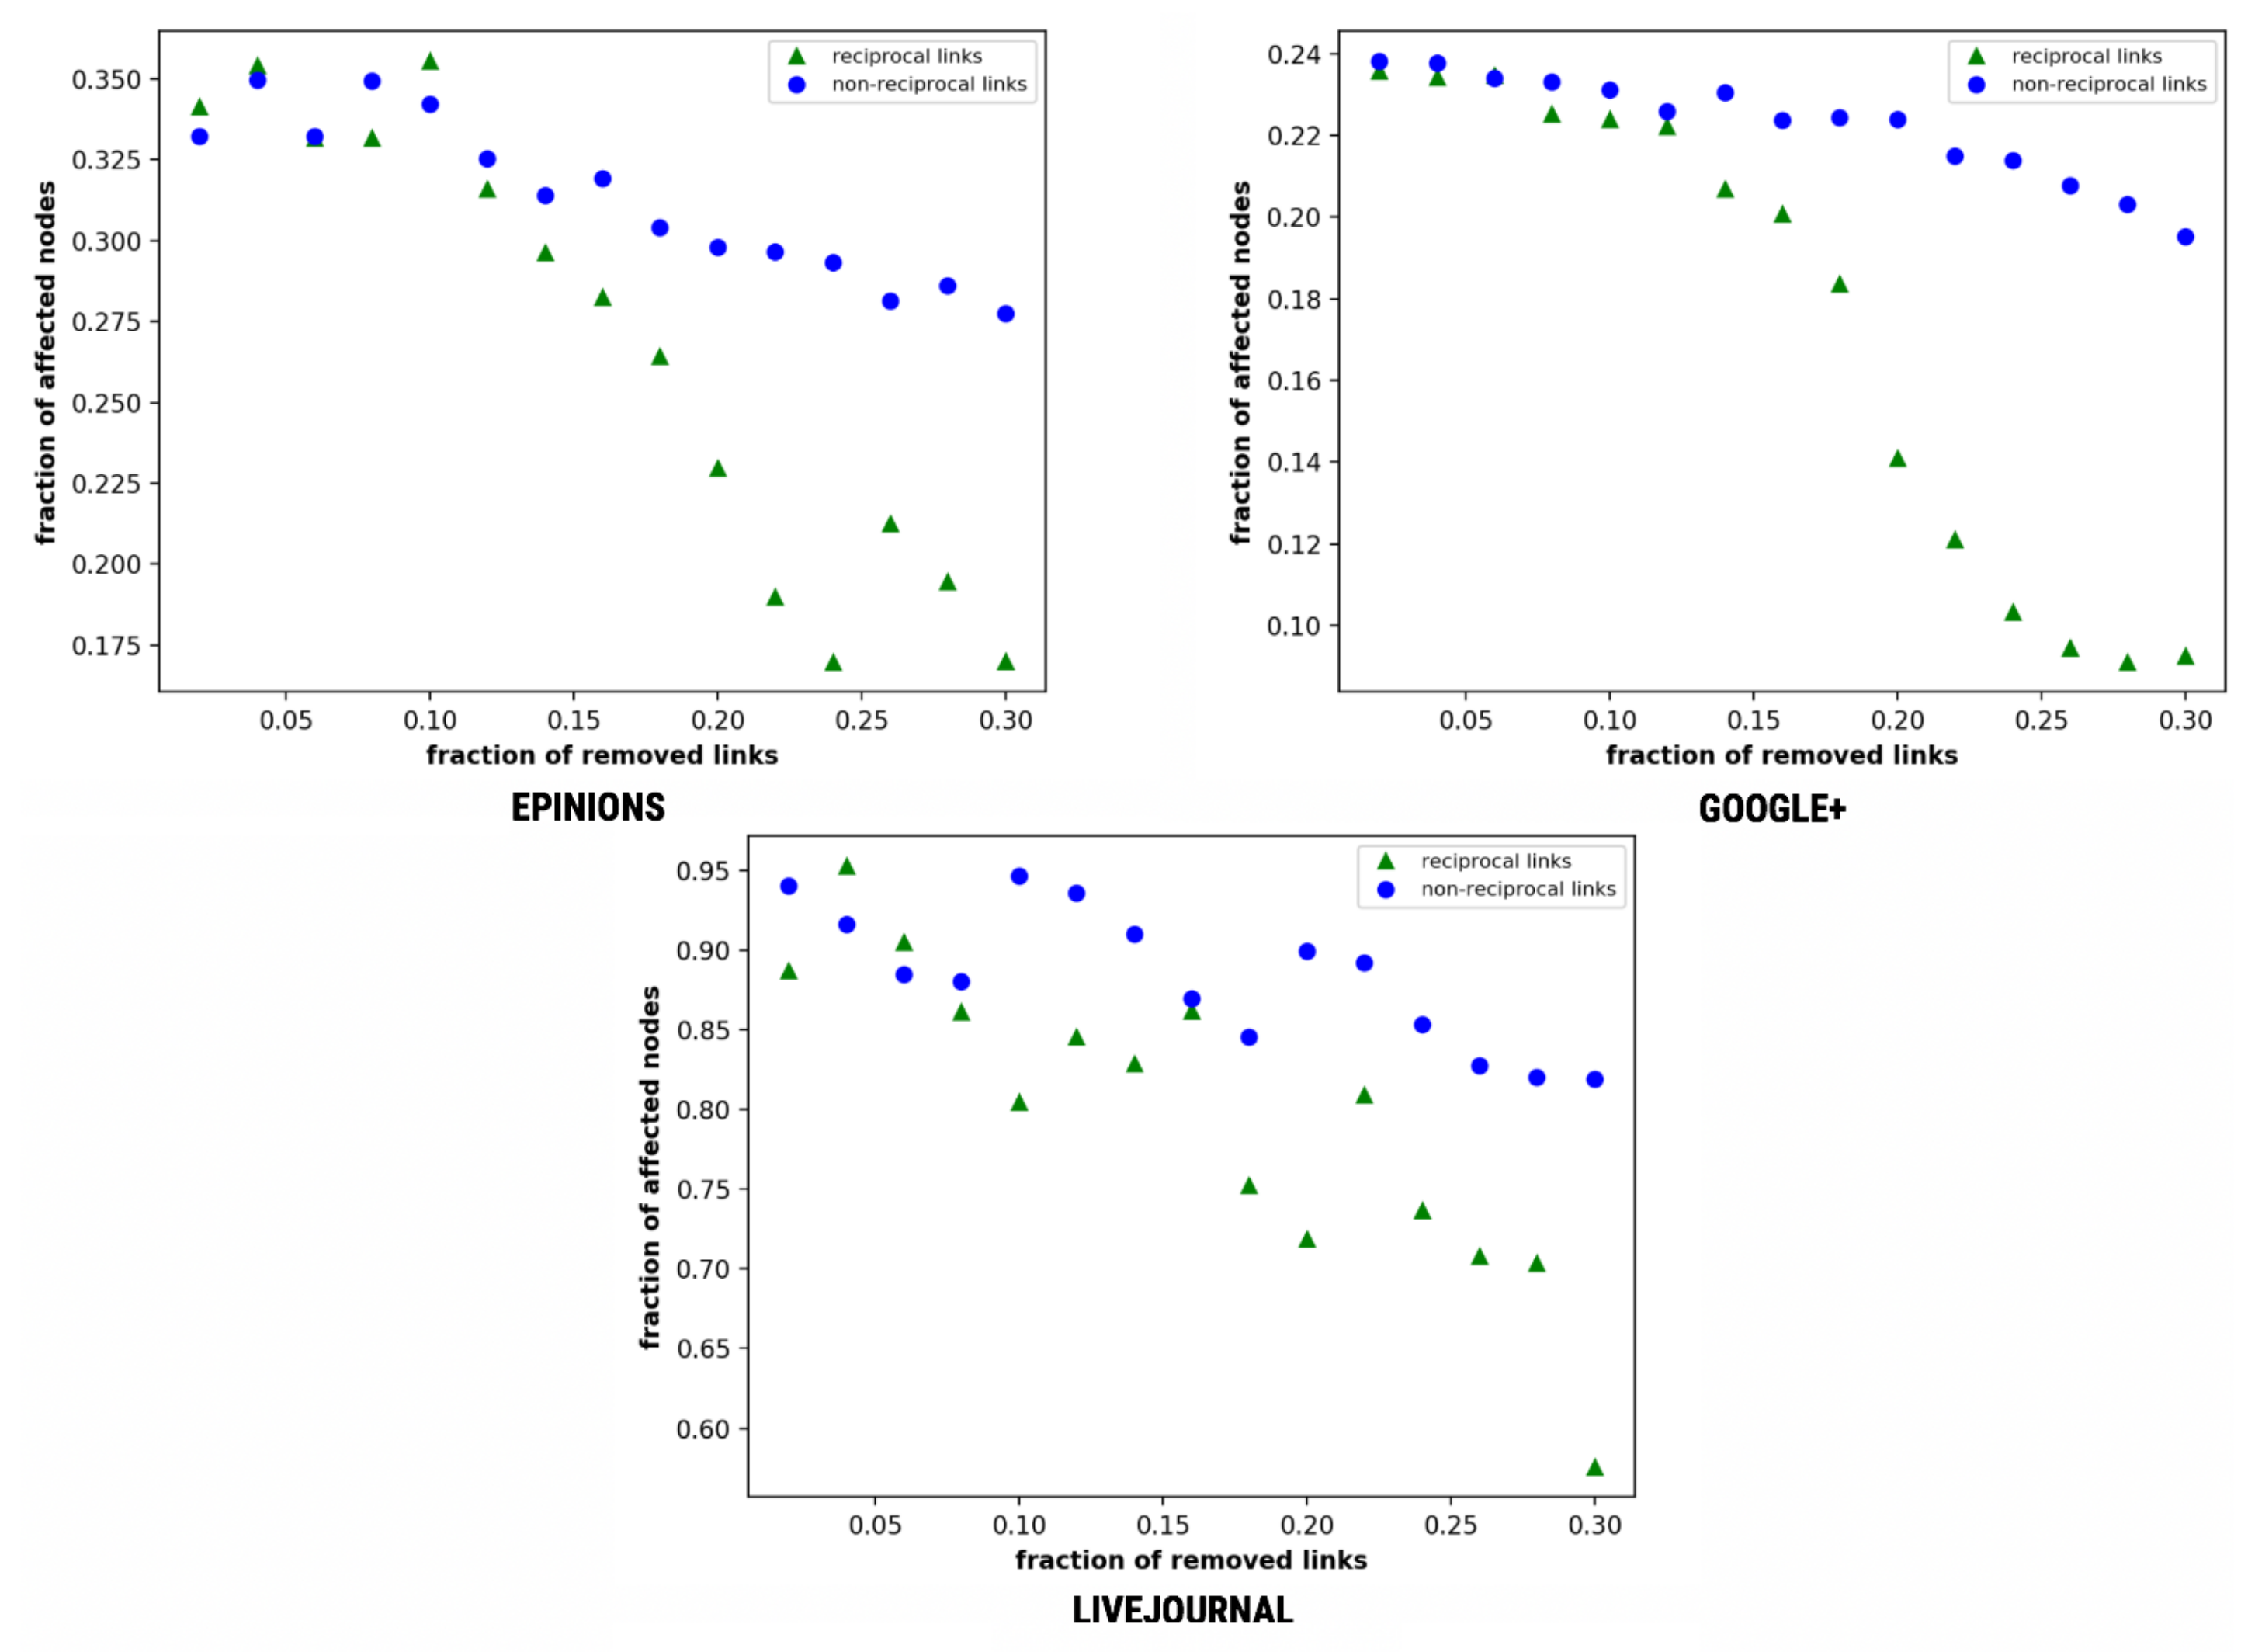
This mechanism is implemented using a sequence of steps, as illustrated in Algorithm 1. Initially, we evaluate the effects of reciprocal links on message diffusion by removing both reciprocal and non-reciprocal links, where a single reciprocal link corresponds to two non-reciprocal links [18] and calculate the total number of users who have received the given message m. Figure 3 illustrates this comparison.
As depicted in Figure 3, the fall of reciprocal links is much faster as compared to the non-reciprocal links. Epinions and Google+ tend to downfall at 0.12 and 0.08, respectively. LiveJournal represents small fall in the non-reciprocal and altering steep-downfall in reciprocal links with clear distinction at f = 0.16. The difference in the fraction of affected nodes on the removal of reciprocal links to the non-reciprocal is 0.24. Further, we consider the transmission probability p as 0.38 that can be varied as per problem domain and requirements.
| Algorithm 1: Simple diffusion process (Adapted from [18]) |
 |
4.2. Multiple Diffusion
A variant of the message spreading procedure mentioned above is described below. In the previous procedure, if a user i receives a message m and chooses not to broadcast it, then this user will not ever broadcast the message m in the future, even if the user i gets the same message multiple number of times. This variant employs the Susceptible–Infected–Susceptible (SIS) epidemic model, wherein a user who has already received a message, but chose not to broadcast it, may try again to re-broadcast the same message. This process of spreading is discussed below.
- Broadcast a message m from a starting node (opinion leader) to all its neighbours (adjacent nodes).
- Each node that receives the message, and has not already broadcasted can choose to re-broadcast it to all adjacent nodes with a transmission probability p.
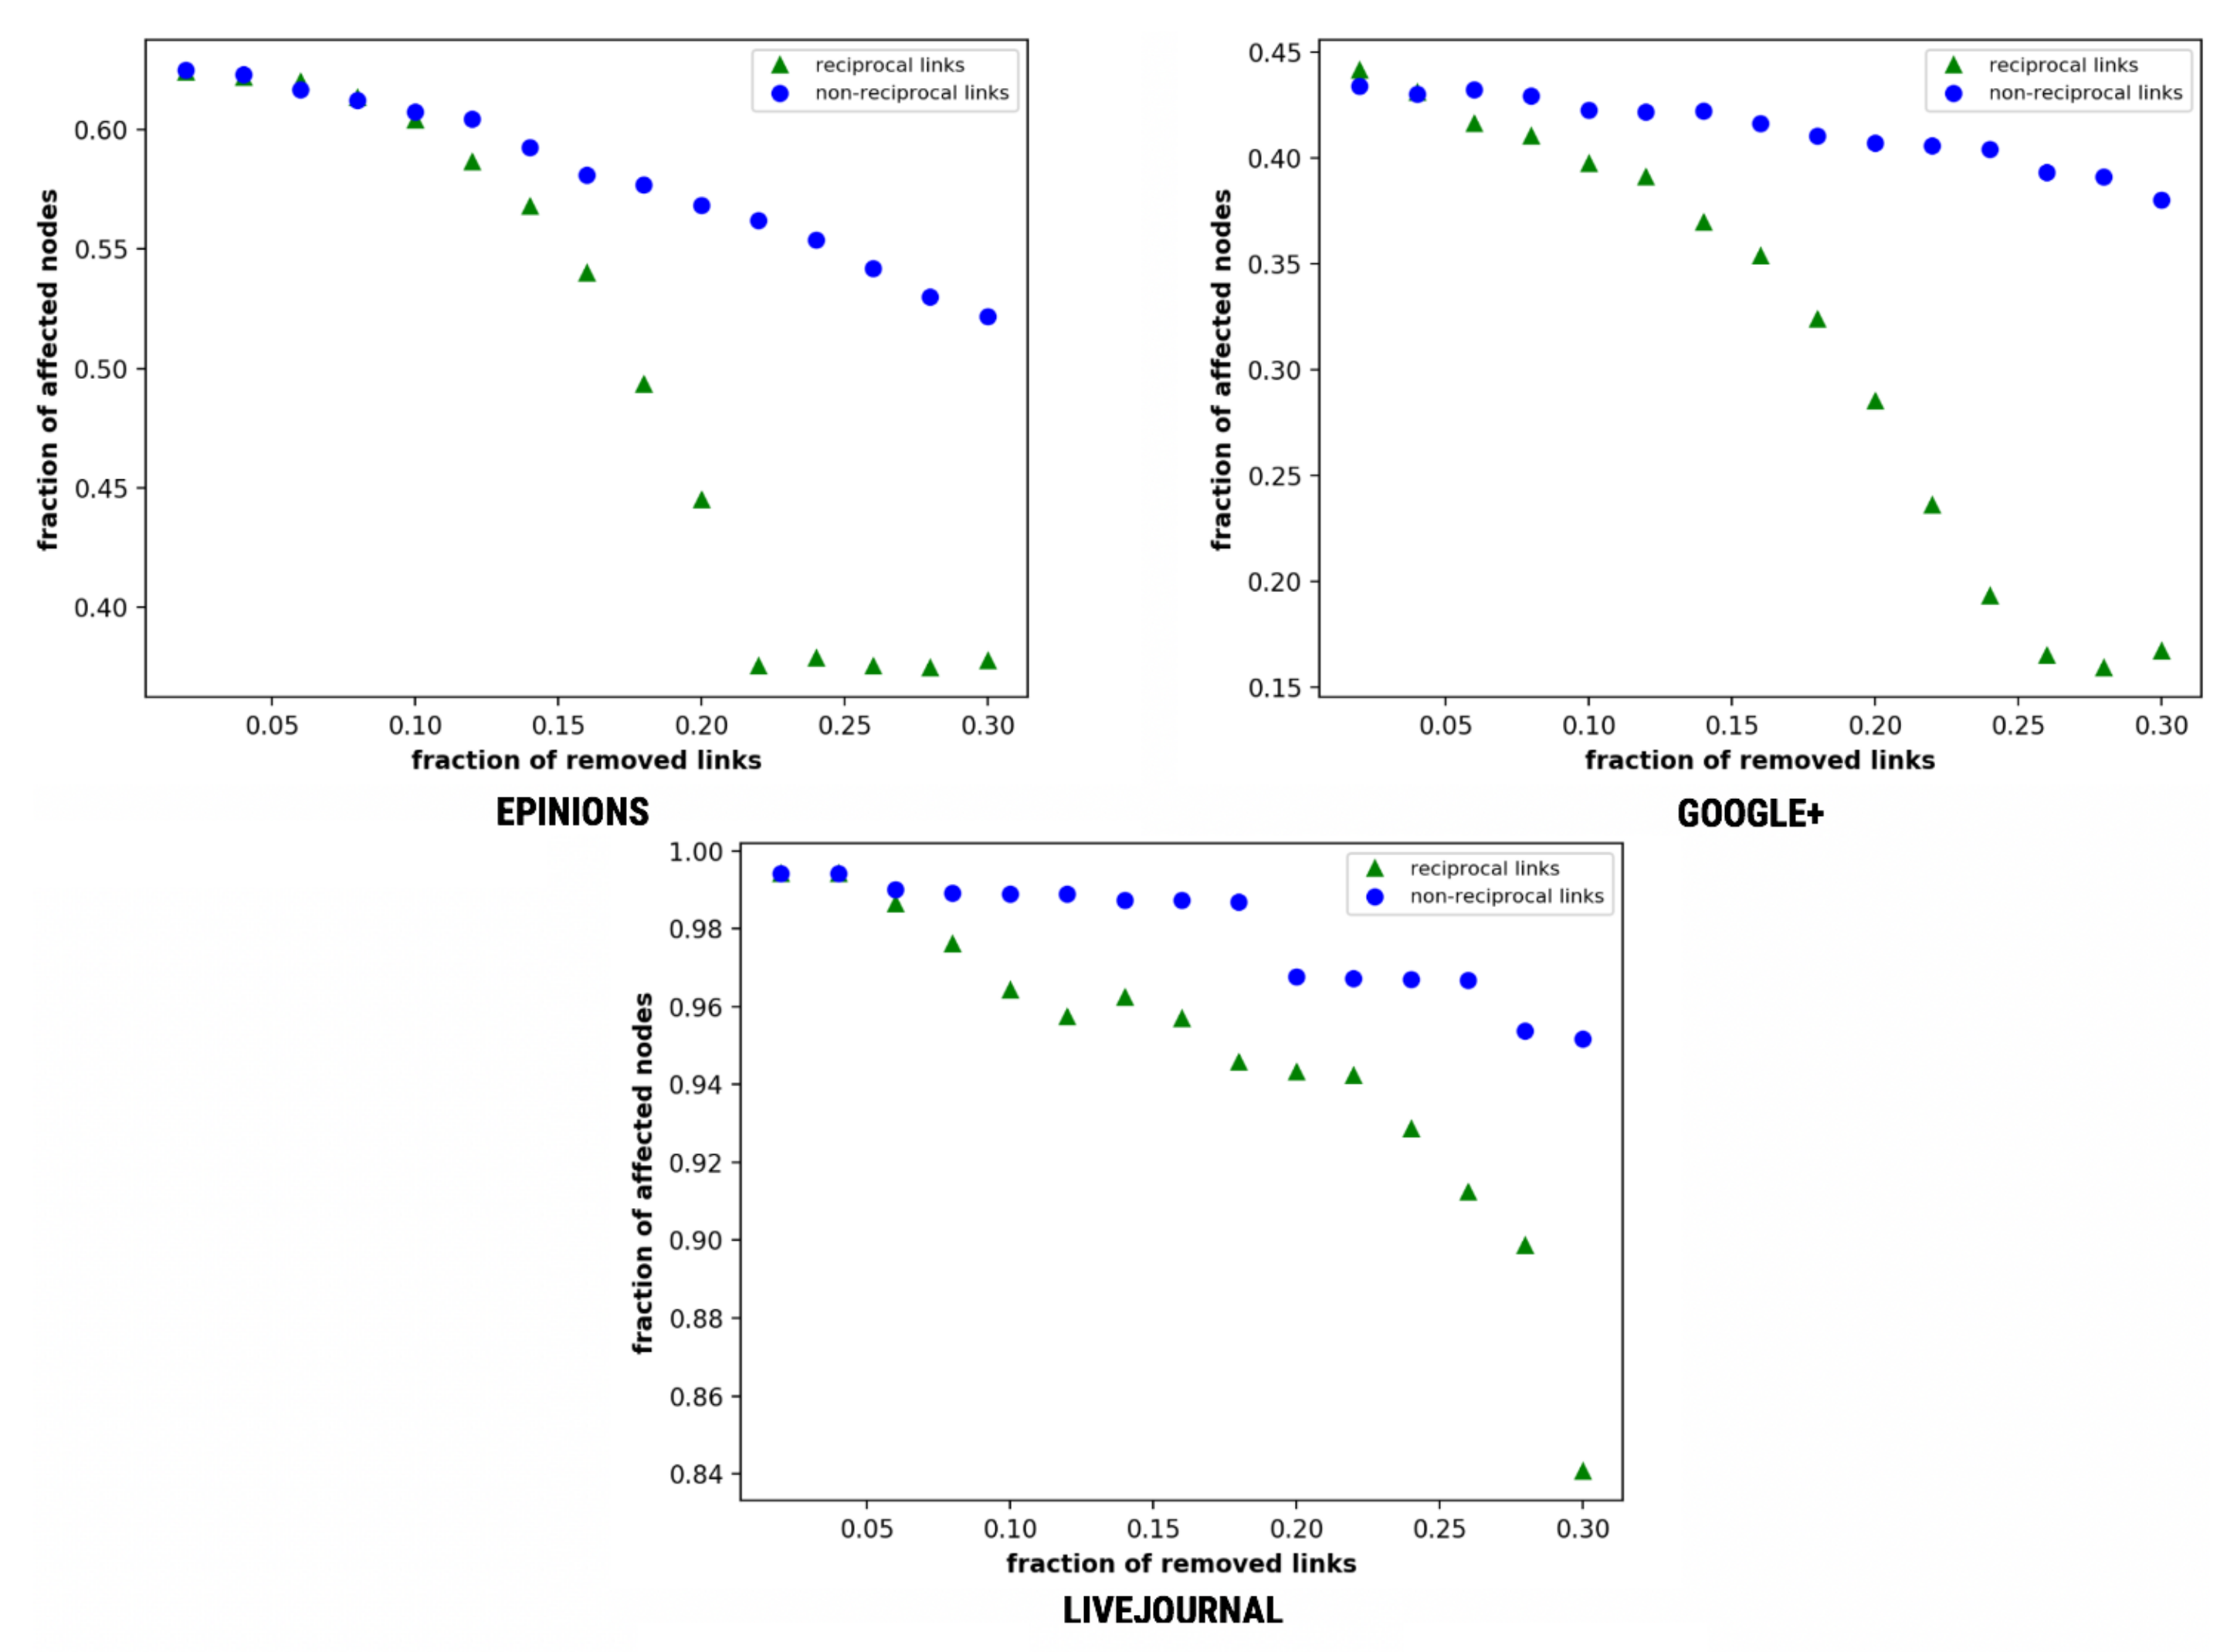
Algorithm 2 illustrates the steps involved in the implementation of this variant. We observe the influence of reciprocal and non-reciprocal links on message spreading by removing them continuously and evaluating the total number of nodes affected.
Epinions and Google+ show a sharp decline and eventually collapse on the removal of reciprocal links at f = 0.22 and f = 0.268, respectively (see Figure 4).
| Algorithm 2: Multiple diffusion |
 |
4.3. Dynamic Diffusion
Another variant depicting the information spreading mechanism share similarities to the above model, but the retransmission probability p of a node increases by a constant factor each time user i receives the message. Thus, if a node a gets a message m three times, its new transmission probability becomes 3 × p. The transmission probability changes dynamically based upon the number of hits of the same message on a given node. Algorithm 3 describes the implementation details of this variant.
| Algorithm 3: Dynamic diffusion |
 |
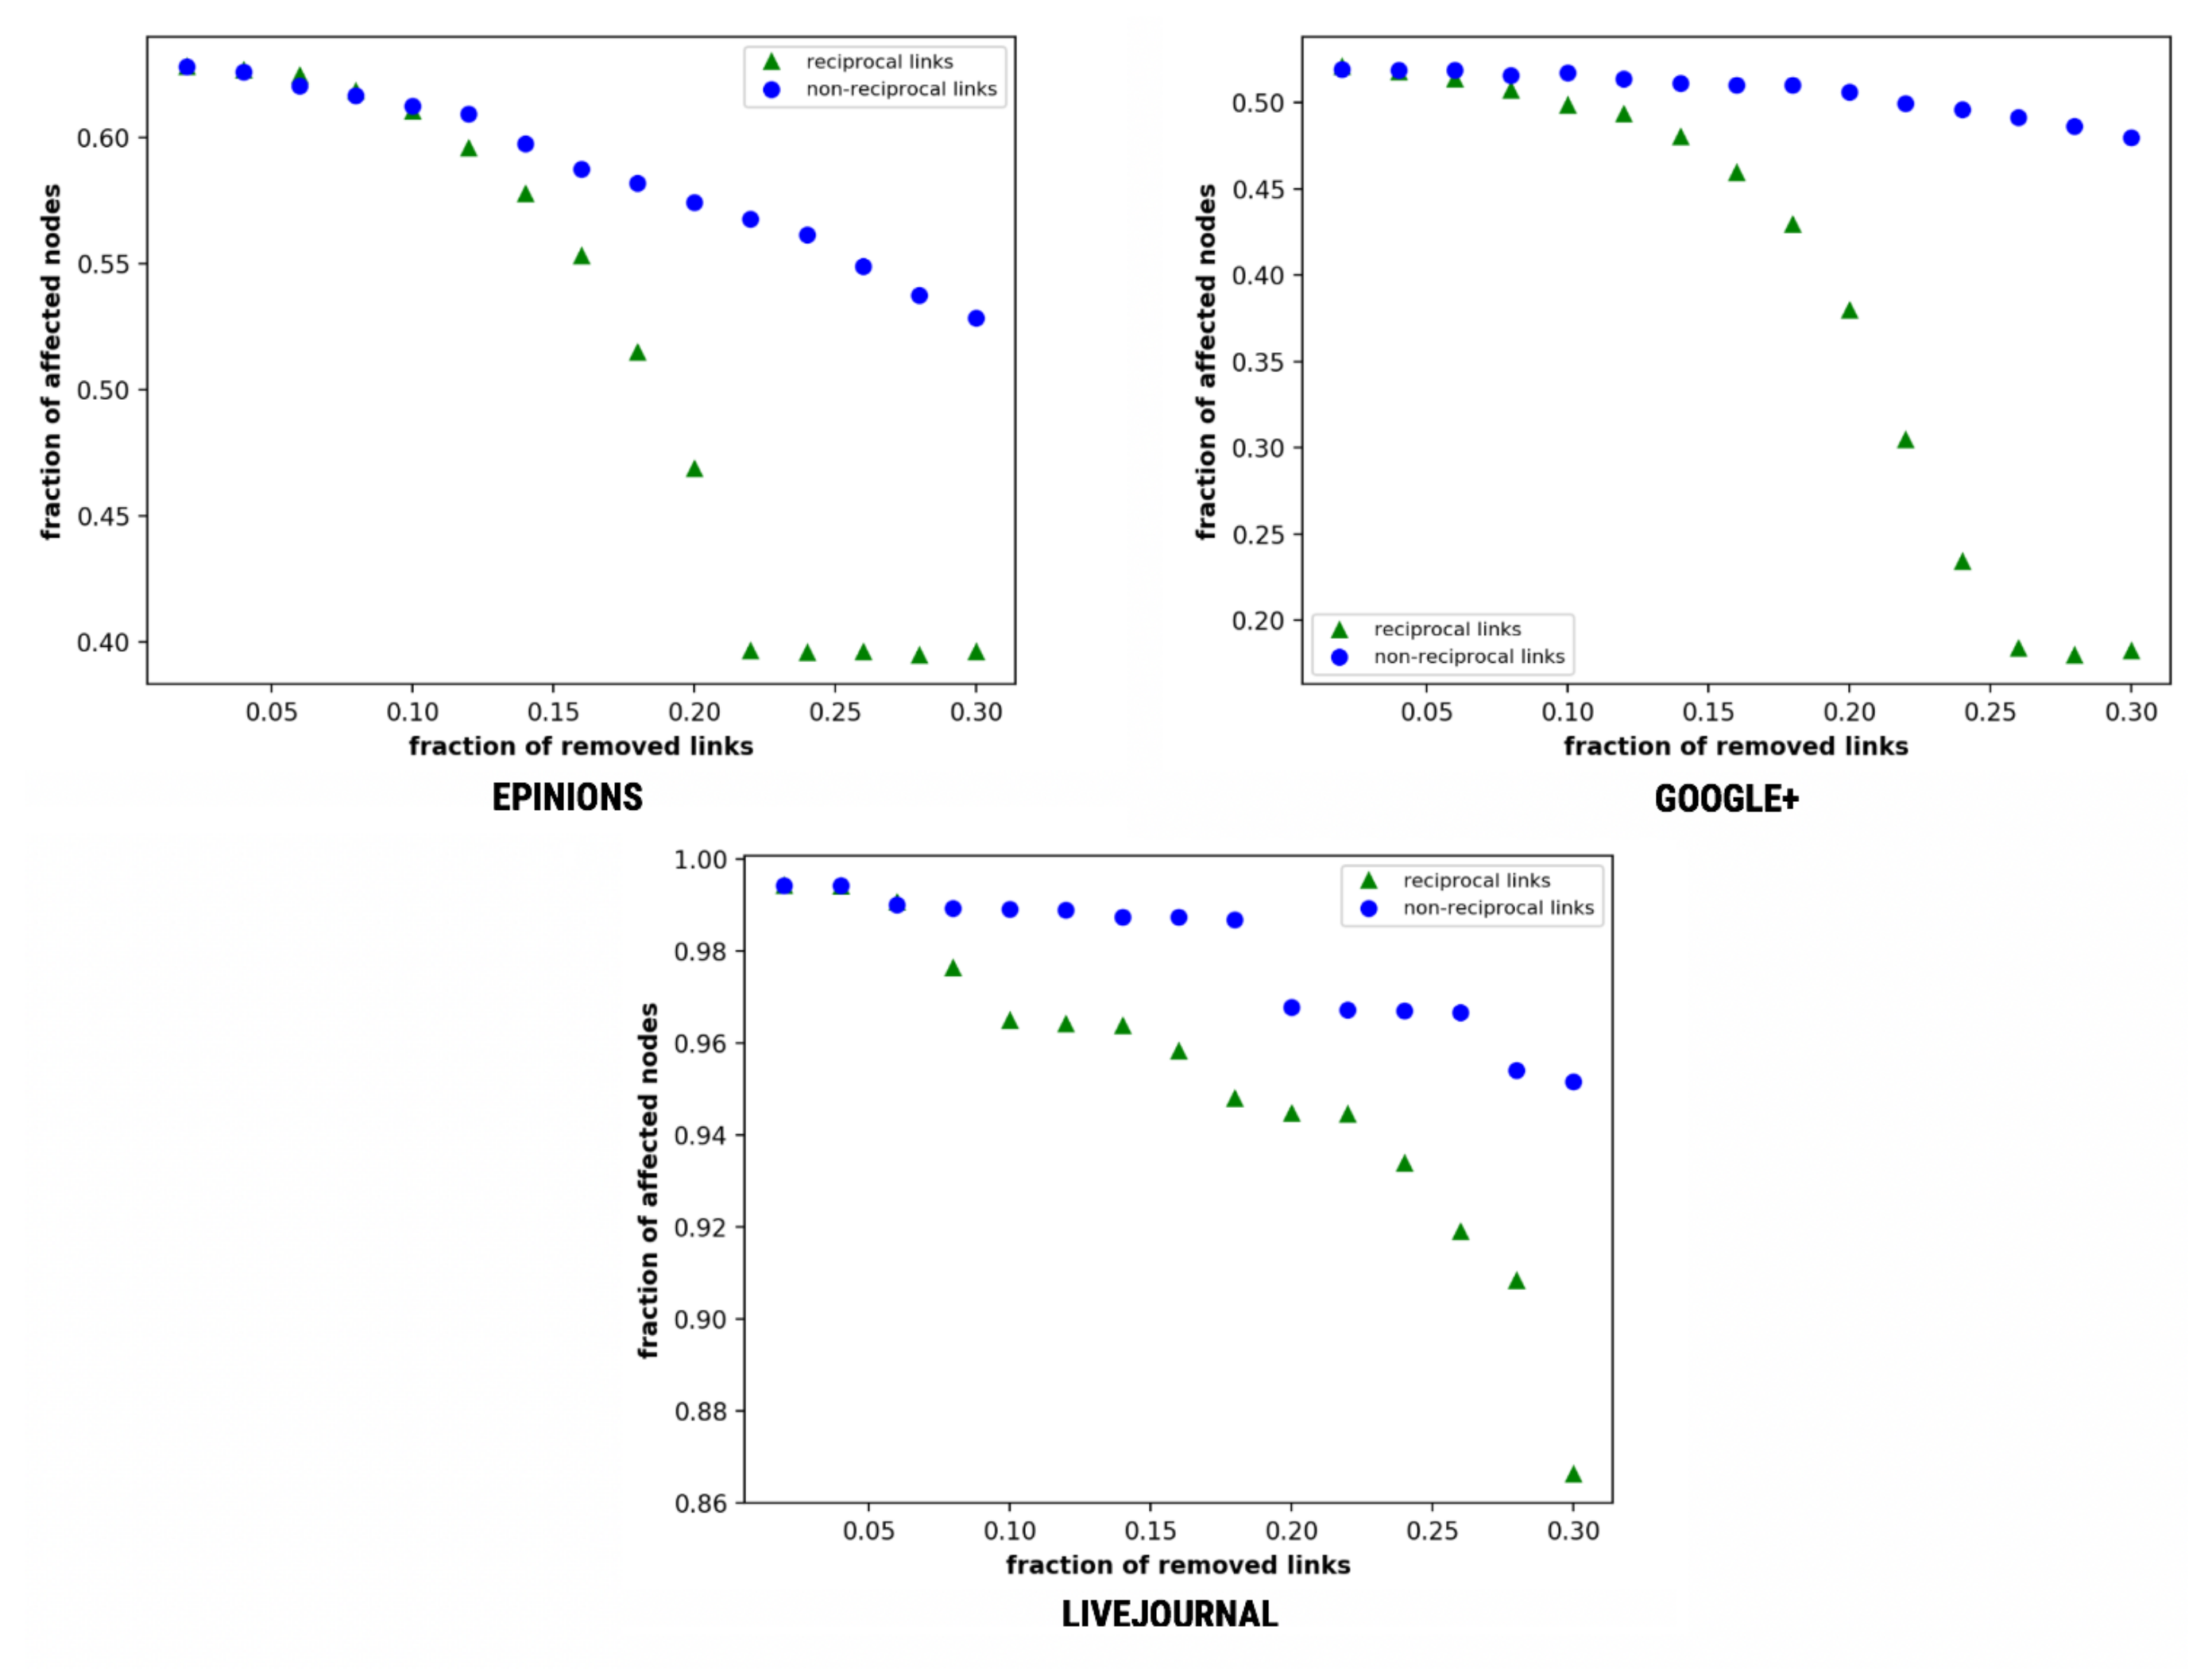
Figure 5 depicts the effect of reciprocal links in message spreading using this variation. As illustrated in the figure, the fraction of both reciprocal and non-reciprocal links varies at the start of simulations thus display no effect of the network density. However, the fall of reciprocal links is much faster as compared to the non-reciprocal links. Epinions represent the impact on the fraction of affected nodes due to the removal of non-reciprocal friendships from 0.51 to 0.479, but reciprocal varies on the whole social web from 0.52 to 0.1825. Google+ also follows a similar trend as in Epinions. LiveJournal being a large dataset exhibits a clear distinction at f = 0.08.
4.4. Edge Diffusion
This variant of information diffusion relates to the social networks, where the communication is mostly one on one with p as the probability of the message travelling along an edge, instead of a vertex’s broadcasting probability. This is similar to the innovation diffusion model (cascade model) with an edge as the key spreader. If the connection is strong enough to share the information, user i spreads the message to its both ends. Algorithm 4 outlines the implementation of edge based diffusion.
In Figure 6, we observe that in the three datasets, the fraction of affected nodes fall at a steeper rate when the value of the fraction of removed links (f) reaches 0.08, 0.18 and 0.1825, respectively.
| Algorithm 4: Edge diffusion |
 |
4.5. Weighted Diffusion
Another way of information dissemination is illustrated below. In the previous models, the network topology was not considered during the process of message diffusion. This model is a variation of the traditional SI epidemic model that acknowledges the strength of each user with all its neighbours. This “strength” of the user is calculated by considering the out-degree of each user. In an edge , the weight of edge is the “strength” (out-degree) of node v. Kamp [69] suggested the spread of information in weighted networks by assigning weights to the users on the basis of the interactions made with their corresponding neighbours. We, however, adopt their model by assigning weights according to the “strength” of neighbouring nodes. The information diffusion in this model follows the given steps and Algorithm 5 depicts the working procedure of this mechanism.
- A user i, who is considered as a start node, broadcasts a message m to all its neighbours.
- The maximum weighted node of all nodes that receive this message m can only broadcast the message to its adjacent nodes with a probability p. Here, probability p is the same transmission probability describing the willingness of the user to diffuse the given message m.
- The above process is repeated until the message m diffuses to all the achievable nodes.
Figure 7 represents the effect of reciprocal links in message spreading using this variation. It further verifies the reciprocity’s effect on diffusion with lower number of people getting affected on decreasing the removed links. Epinions shows a sharp decline in decreasing reciprocity with a maximum difference of 0.116 in both the curves. Google+ shows only 9% of people being affected by removal of reciprocal links at f = 0.3. LiveJournal follows a similar trend with only 62% of the nodes being affected by the removal of 30% of the total links in the network at f = 0.3.
| Algorithm 5: Weighted diffusion |
 |
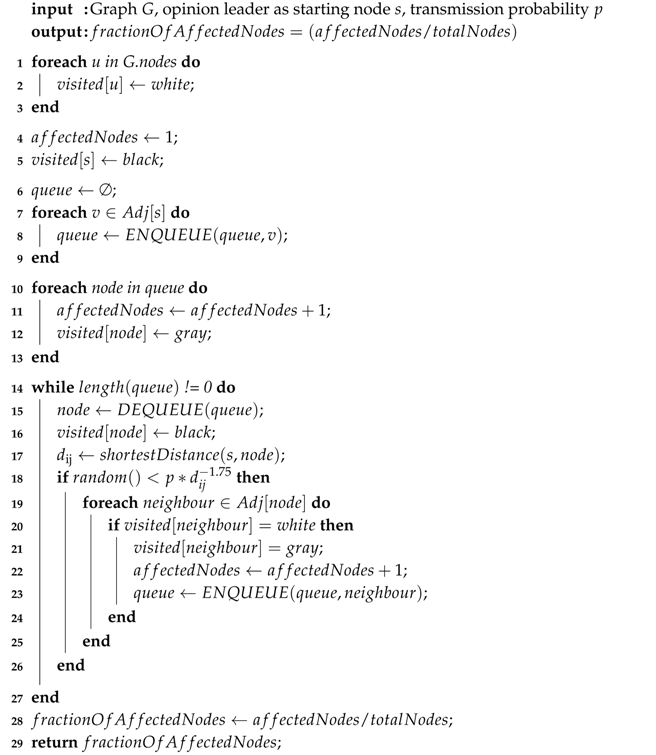
4.6. Decay Diffusion
This model is built upon the traditional SI epidemic model keeping the distance between the message generating source node and the current node into consideration. The decaying transmission probability symbolises common interests of closer individuals. Here, we estimate the shortest distance between the source node and the current node with a decaying transmission probability as , where is the distance in the organisational hierarchy between individuals i and j. This decay in one-time transmission probability is adapted from the published study by Fang Wu [70]. The information diffusion in this model follows the given steps:
- A user i, who is considered as a start node, broadcasts a message m to all its neighbours.
- As the message spreads in the network, the transmission probability of each node decays by a multiple of . The farther the message is from its origination source, the lesser is the willingness of the user to share.
- The above process gets repeated until message m diffuses to all achievable nodes.
Algorithm 6 provides a detailed implementation insight of this variant. As evident in Figure 8, the fraction of both reciprocal and non-reciprocal links varies, but the fall of reciprocal links is much faster as compared to the non-reciprocal links. Further, Epinions shows non-reciprocal links facing abrupt downfalls and Google+ depicts reciprocal links fraction being least at every removed fractions step. At f = 0.14, 0.24 and 0.3, the fraction of affected nodes in reciprocal and non-reciprocal, respectively, are (0.016, 0.012), (0.0049, 0.012) and (0.007, 0.009) LiveJournal depicts a clear downfall following the trend (see Figure 8).
| Algorithm 6: Decay diffusion |
 |
In Figure 9, Dynamic diffusion helps in disseminating maximum information, while Decay diffusion propagates the least. Multiple, Weighted, Edge and Simple diffusion exhibit similar decreasing effects. Decay diffusion shows the minimal spreading with 0.0910, 0.0391 and 0.6175 as the fraction of affected nodes in Epinions, Google+ and LiveJournal, respectively.
4.7. Network Structure
We observe from the above results that the reciprocal links play an important role in information spreading as compared to the non-reciprocal links. To explain the reason behind such behaviour, we examine the effect of the removal of reciprocal and non-reciprocal links on the network’s structural properties. Network properties are analysed using the following measures.
4.7.1. Network Density
A “potential connection” is a connection that could exist between two nodes, irrespective of an actual connection. Hence, network density measures the portion of the potential connections in a network that are actual connections. The network density for an undirected graphs is,
and for directed graphs is,
where n is the number of nodes and m is the number of edges in graph G.
Network density is recognised as one of the prominent factors in personal networks [48]. A network with high network density means a large number of connections, therefore, has an increased possibility of being interconnected [17,71]. Since a high network density indicates high interconnectedness, it allows natural information diffusion in the network. As illustrated in Figure 10, removal of reciprocal links affects the network density more critically than the non-reciprocal links. The network density falls at a higher rate with the removal of reciprocal links as compared to non-reciprocal links.
The network density shows a similar trend with Epinions and Google+ reaching the threshold values at f = 0.24 and 0.27, whereas LiveJournal depicts straight lines. It shows identical network disorientation on the removal of reciprocal links and decreasing reciprocity’s effect on degree centrality and network density.
4.7.2. Degree Centrality
The centrality measures of a node can determine the degree of importance of the same node (see Section 2.1.1). In Figure 11, we observe that the average degree centrality of the network falls drastically on the removal of reciprocal links as compared to the removal of non-reciprocal links. This severe fall of degree centrality on the removal of reciprocal links relates to the fall of interactiveness amongst the nodes, therefore, justifies the superiority of the reciprocal links over non-reciprocal links.
Herein, we observe that there is a rapid fall on removal of reciprocal links. Epinions and Google+ tend to reach threshold towards the end at f = 0.22 and f = 0.28, respectively, while LiveJournal exhibits straight lines with an increasing downfall.
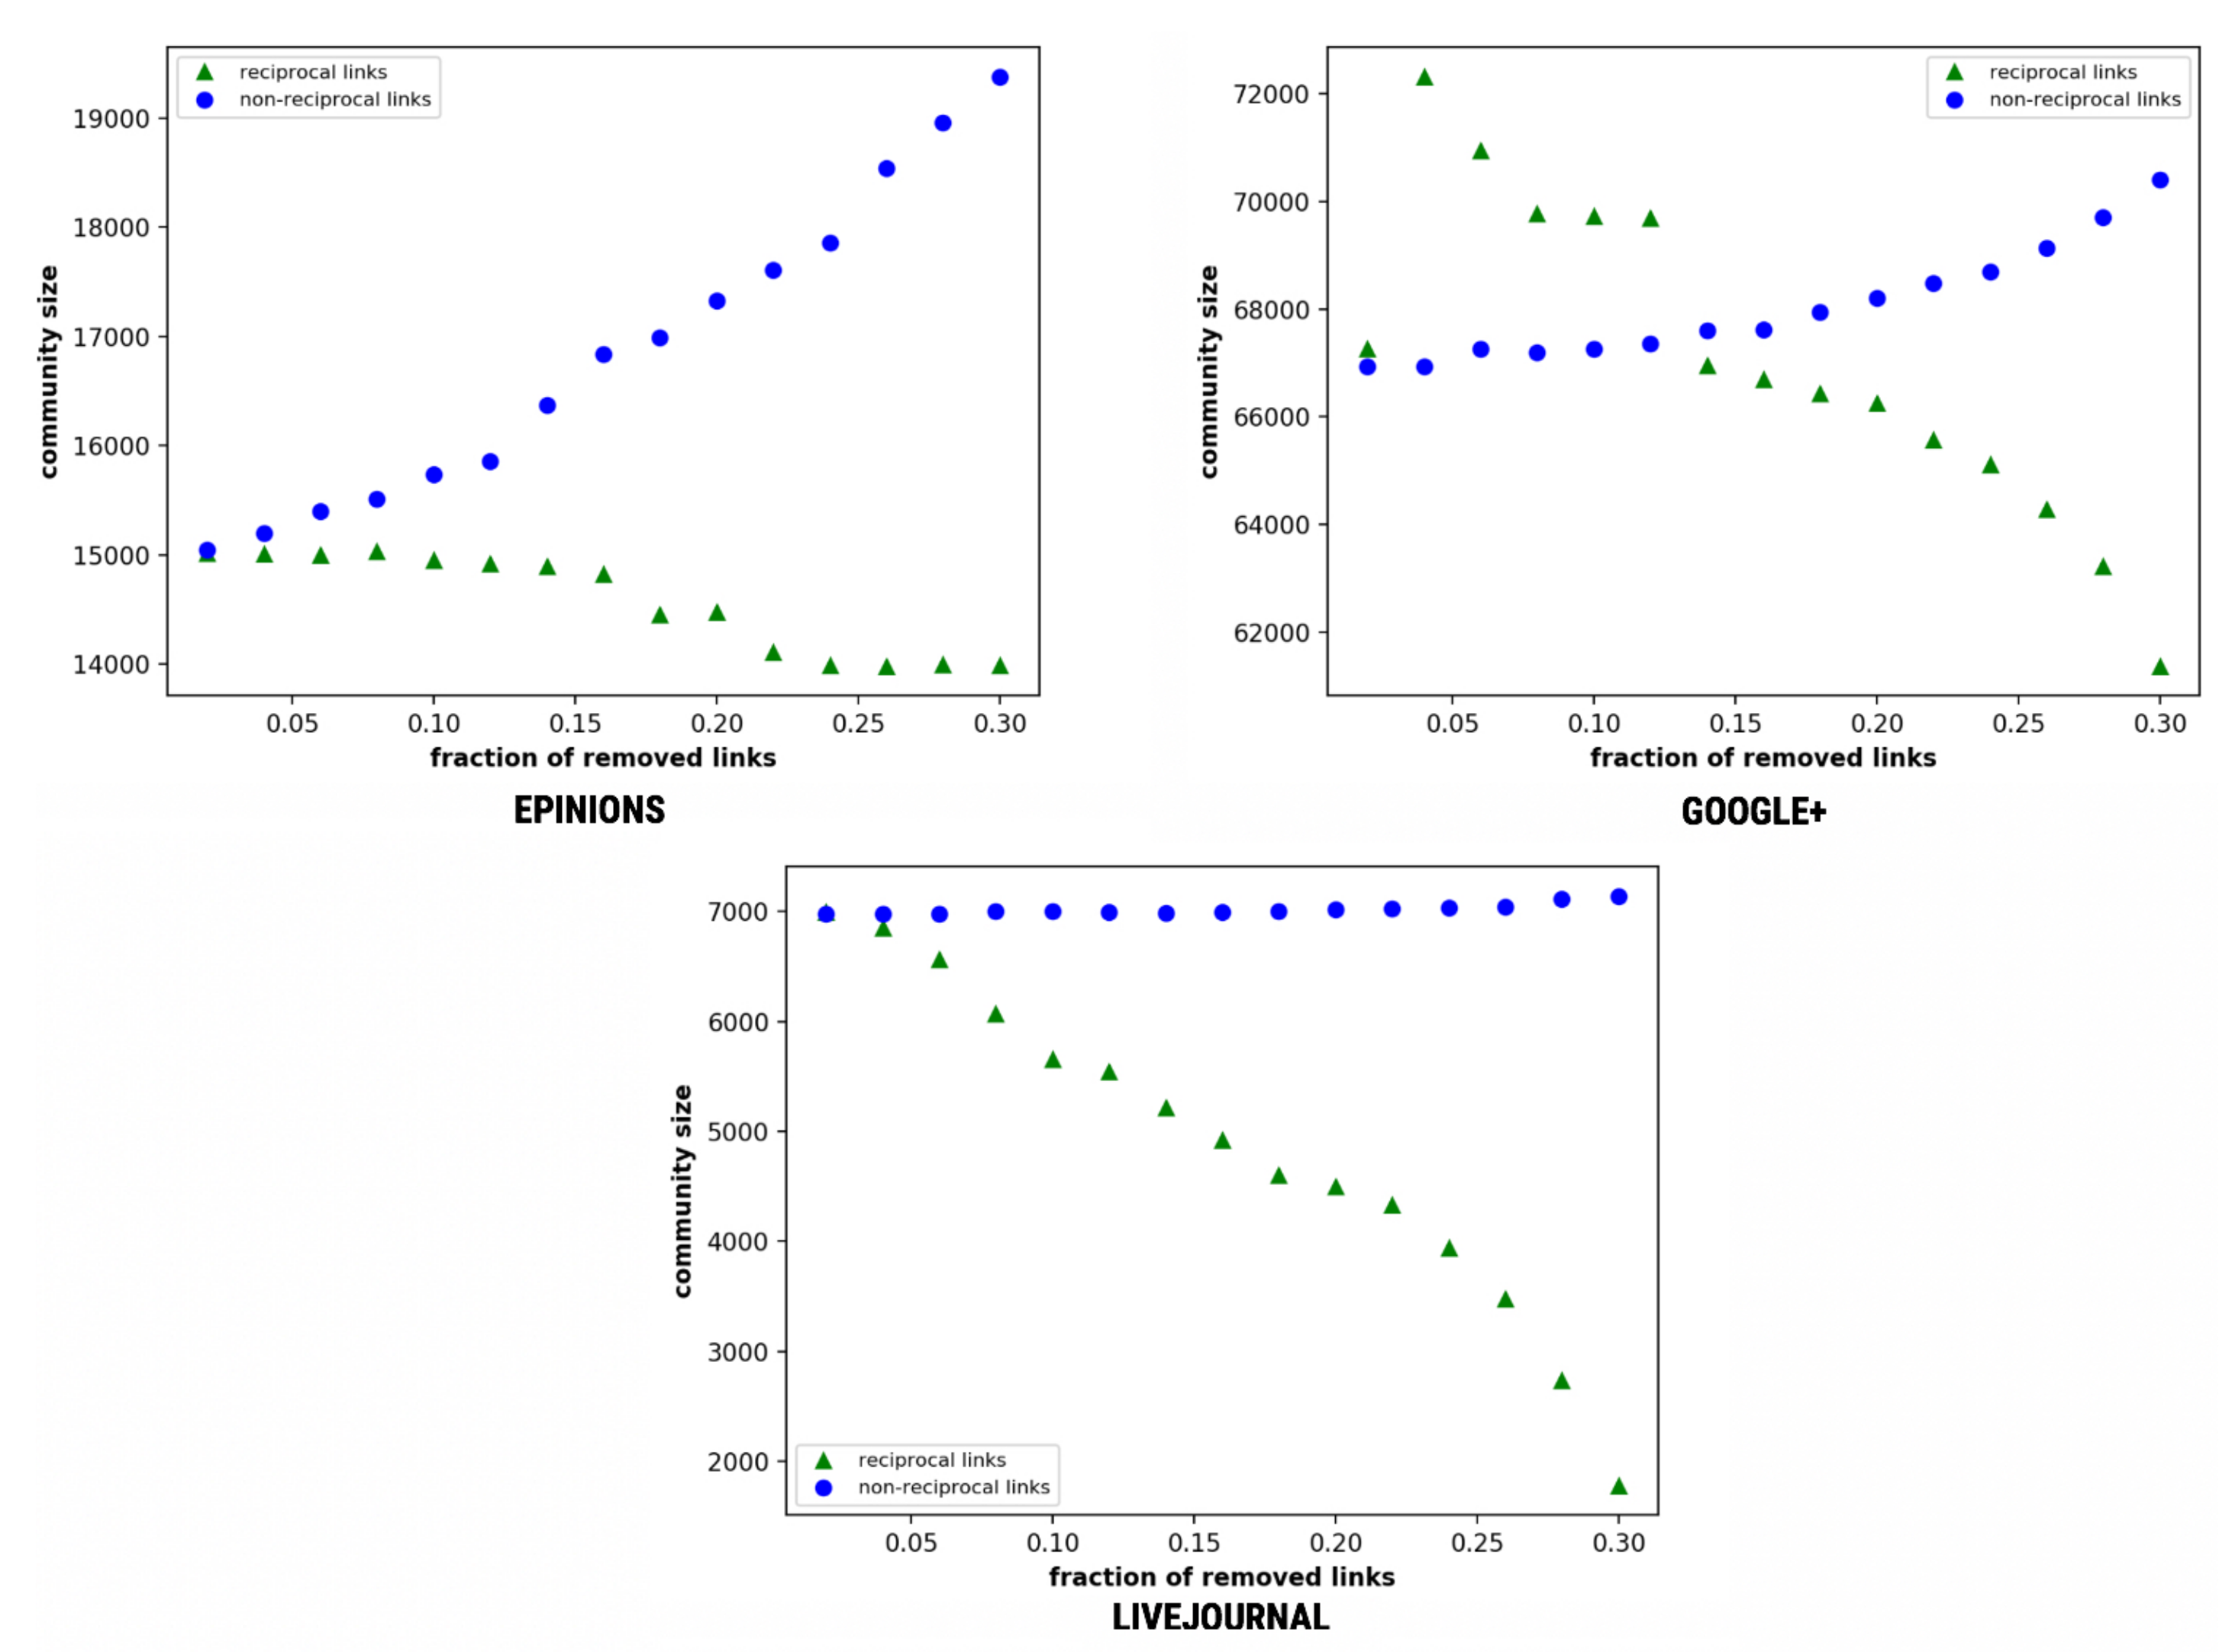
4.7.3. Community Size in a Network
A community structure is a set of internally connected nodes in a tightly knit groups [72]. Further, assuming that there are two different types of links, i.e., strong links and weak links. A strong link is an edge between two nodes in the same community, whereas a weak link is an edge connecting two different communities [73]. While strong and weak links play different roles in the network community, we observed that on removing reciprocal and non-reciprocal links the communities of separate datasets varied differently. However, in each pair of results (Figure 12), the value of the size of communities detected on the removal of reciprocal links was found to be smaller as compared to non-reciprocal. We calculated the community size using the Mapping Flow model given by Rosvall and Bergstrom [74]. The authors retained the information about the directions and the weights of the links by mapping the system-wide flow induced by local interactions between nodes. The modularity for a given partitioning of the network (community structure) into m modules is,
where is the total weight of links starting and ending in module i, and are the total in- and out-weight of links in module i, and w is the total weight of all links in the network. To estimate the community structure in a network, the above equation is maximised over all possible assignments of nodes into any number m of modules.
We analysed the collapsing relationships’ effect on an individual community. Epinions shows smaller communities with steeply increasing size by removing non-reciprocal links. Google+ shows a clear distinction when the fraction of removed links tends to 0.14. LiveJournal showed the maximum downfall with community’s size falling from 6993 to 1781 (refer to Equation (8) and Figure 12) on the removal of reciprocal links with an increment on the removal of non-reciprocal links. Since one reciprocal link is equivalent to two non-reciprocal links, on removal of reciprocal links, the community experiences an initial outbreak, meaning that breaking the few links connect the infected community to the rest of the network [75].
4.7.4. Giant Component Size
A giant component is the size of a connected component (strongly connected component for a directed network) in a large network. Let be the size of a connected component C in a network of size N ; then, C is a giant component if
GCC characterizes the largest (giant) community of nodes in which all nodes are reachable from one another while following the direction of the edges [76].
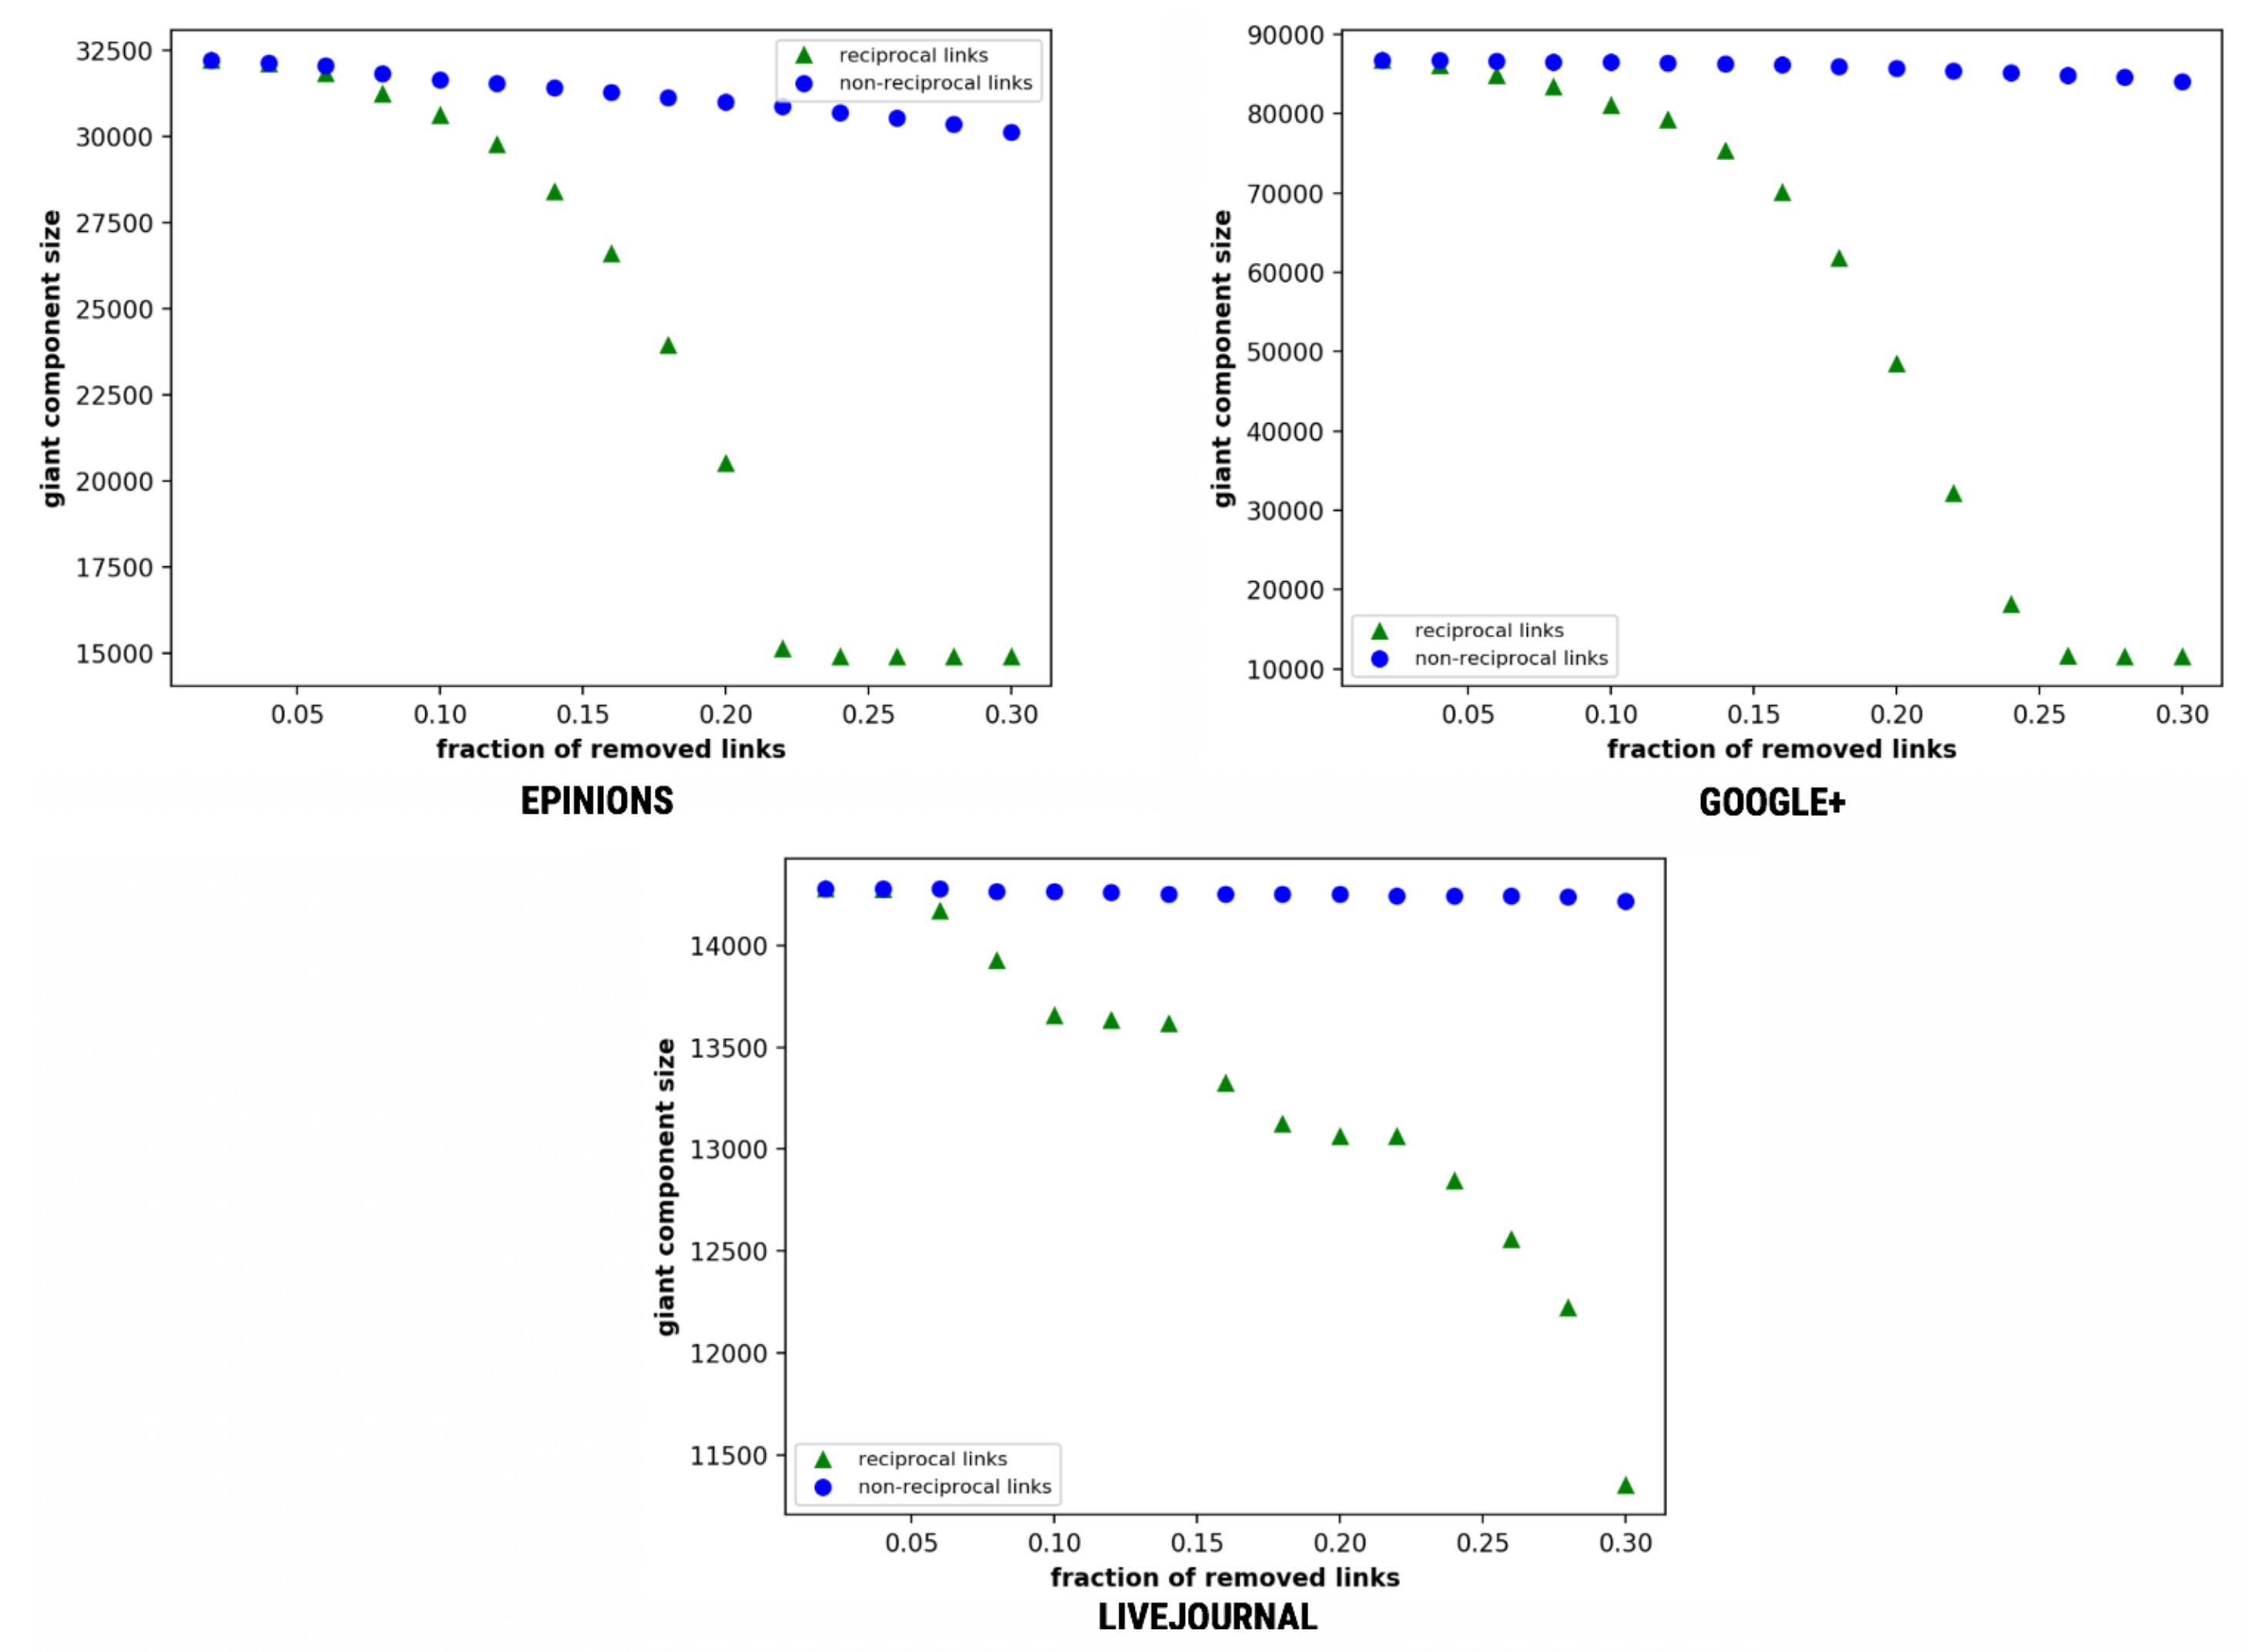
Figure 13 depicts that, on the removal of a certain fraction of edges, there is a decline in the GCC value if the network disintegrates. Further, we observe that the GCC value declines at a higher rate for reciprocal links as compared to that for non-reciprocal links, thereby endorsing the result of the prior study by Zhu et al. [18]. The plots herein show a size declination of giant component size with all the datasets following a similar trend. The collapsing of the giant component is observed in Epinions, Google+ and LiveJournal at 0.22, 0.26, and 0.3, respectively, on removal of reciprocal links. The reciprocity thus plays a major role in identifying clusters as visible with low rate of disintegration.
5. Conclusions
Various social networks have emerged over recent years for people to stay connected with others conveniently. Examining information spreading in online social networks is an intricate task because it depends on the users, content, structure of the network and the diffusion process itself. Because of the qualitative similarities between information diffusion and the spread of information, previous studies have also used the epidemic models in the spread of ideas. We, however, consider six variations of standard the Susceptible–Infected (SI) epidemic spreading model to analyse three different directed networks, i.e., Epinions, Google+ and LiveJournal, using various network topology metrics. Since the leaders must initiate the information spreading, we use closeness centrality measures to identify the most influential node. In these algorithms, we extend the epidemic models with social network characteristics consorting the individual’s characteristics and relationships, and message’s popularity and declining interests. The Simple diffusion defines the epidemic spreading. Multiple diffusion employs the Susceptible–Infected–Susceptible (SIS) epidemic model, in which a user who has already received a message but chose not to broadcast it in the earlier case can further choose to re-broadcast it if he intends to. Dynamic diffusion accommodates increasing transmission probability each time a node receives the message accounting to its dynamics. Edge diffusion relates to the innovation diffusion model (cascade model) with an edge as the key spreader accounting the relationship between nodes. Weighted diffusion acknowledges the strength of each user with all its neighbours. Decay diffusion identifies the falling common interests of closer individuals. We conduct an extensive analysis of the model parameters with diffusion algorithms to unveil the underlying importance of reciprocity in the diffusion process. The results derived from this empirical study validate the claims laid in previous studies that reciprocal link plays a more critical role in affecting the interconnectedness of the network, with superiority of Dynamic diffusion over other algorithms in the dissemination of message among the maximum number of user nodes and Decay diffusion being the least. Experimentation with different parameters affecting information diffusion using different SI model variations while also incorporating the error in perception has been left as the future work of this study. Furthermore, different metrics such as degree centrality, betweenness, and radial centrality can also be used to identify opinion leaders.
Author Contributions
All authors contributed equally to this work.
Acknowledgments
The authors would like to convey their appreciation and gratitude to the anonymous reviewers. Their remarks and suggestions were extremely insightful and enabled us to improve the quality of manuscript.
Conflicts of Interest
The authors declare no conflict of interest.
References
- Bakshy, E.; Rosenn, I.; Marlow, C.; Adamic, L. The role of social networks in information diffusion. In Proceedings of the 21st International Conference on World Wide Web, Lyon, France, 16–20 April 2012; ACM: New York, NY, USA, 2012; pp. 519–528. [Google Scholar]
- Claros, I.; Cobos, R.; Collazos, C.A. An Approach Based on Social Network Analysis Applied to a Collaborative Learning Experience. IEEE Trans. Learn. Technol. 2016, 9, 190–195. [Google Scholar] [CrossRef]
- Knoke, D.; Yang, S. Social Network Analysis; Sage: Newcastle upon Tyne, UK, 2008; Volume 154. [Google Scholar]
- Mitchell, J.C. Networks, algorithms, and analysis. In Perspectives on Social Network Research; Elsevier: New York, NY, USA, 1979; pp. 425–451. [Google Scholar]
- Newman, M.E.; Forrest, S.; Balthrop, J. Email networks and the spread of computer viruses. Phys. Rev. E 2002, 66, 035101. [Google Scholar] [CrossRef] [PubMed]
- Arenas, A.; Danon, L.; Díaz-Guilera, A.; Gleiser, P.M.; Guimerá, R. Community analysis in social networks. Eur. Phys. J. B 2004, 38, 373–380. [Google Scholar] [CrossRef] [Green Version]
- Backstrom, L.; Huttenlocher, D.; Kleinberg, J.; Lan, X. Group formation in large social networks: membership, growth, and evolution. In Proceedings of the 12th ACM SIGKDD International Conference on Knowledge Discovery and Data Mining, Philadelphia, PA, USA, 20–23 August 2006; ACM: New York, NY, USA, 2006; pp. 44–54. [Google Scholar]
- Squartini, T.; Picciolo, F.; Ruzzenenti, F.; Garlaschelli, D. Reciprocity of weighted networks. Sci. Rep. 2013, 3, 2729. [Google Scholar] [CrossRef] [PubMed] [Green Version]
- Newman, M.E. A measure of betweenness centrality based on random walks. Soc. Netw. 2005, 27, 39–54. [Google Scholar] [CrossRef] [Green Version]
- Ratkiewicz, J.; Fortunato, S.; Flammini, A.; Menczer, F.; Vespignani, A. Characterizing and modeling the dynamics of online popularity. Phys. Rev. Lett. 2010, 105, 158701. [Google Scholar] [CrossRef] [PubMed]
- Fortunato, S. Community detection in graphs. Phys. Rep. 2010, 486, 75–174. [Google Scholar] [CrossRef] [Green Version]
- Iribarren, J.L.; Moro, E. Impact of human activity patterns on the dynamics of information diffusion. Phys. Rev. Lett. 2009, 103, 038702. [Google Scholar] [CrossRef] [PubMed]
- Miritello, G.; Moro, E.; Lara, R. Dynamical strength of social ties in information spreading. Phys. Rev. E 2011, 83, 045102. [Google Scholar] [CrossRef] [PubMed]
- Haythornthwaite, C. Social network analysis: An approach and technique for the study of information exchange. Libr. Inf. Sci. Res. 1996, 18, 323–342. [Google Scholar] [CrossRef]
- Li, M.; Wang, X.; Gao, K.; Zhang, S. A Survey on Information Diffusion in Online Social Networks: Models and Methods. Information 2017, 8, 118. [Google Scholar]
- Khan, N.S.; Ata, M.; Rajput, Q. Identification of opinion leaders in social network. In Proceedings of the International Conference on Information and Communication Technologies (ICICT), Karachi, Pakistan, 12–13 December 2015; pp. 1–6. [Google Scholar]
- Scott, J. Social Network Analysis; Sage: Newcastle upon Tyne, UK, 2017. [Google Scholar]
- Zhu, Y.X.; Zhang, X.G.; Sun, G.Q.; Tang, M.; Zhou, T.; Zhang, Z.K. Influence of reciprocal links in social networks. PLoS ONE 2014, 9, e103007. [Google Scholar] [CrossRef] [PubMed]
- Wang, C.; Yang, X.Y.; Xu, K.; Ma, J.F. SEIR-Based model for the information spreading over SNS. Acta Electron. Sin. 2014, 11, 31. [Google Scholar]
- Xu, R.; Li, H.; Xing, C. Research on information dissemination model for social networking services. Int. J. Comput. Sci. Appl. 2013, 2, 1–6. [Google Scholar]
- Ding, X. Research on propagation model of public opinion topics based on SCIR in microblogging. Comput. Eng. Appl. 2015, 51, 20–26. [Google Scholar]
- Cannarella, J.; Spechler, J.A. Epidemiological modeling of online social network dynamics. arXiv, 2014; arXiv:1401.4208. [Google Scholar]
- Feng, L.; Hu, Y.; Li, B.; Stanley, H.E.; Havlin, S.; Braunstein, L.A. Competing for attention in social media under information overload conditions. PLoS ONE 2015, 10, e0126090. [Google Scholar] [CrossRef] [PubMed]
- Wang, Q.; Lin, Z.; Jin, Y.; Cheng, S.; Yang, T. ESIS: Emotion-based spreader–ignorant–stifler model for information diffusion. Knowl.-Based Syst. 2015, 81, 46–55. [Google Scholar] [CrossRef]
- Woo, J.; Chen, H. Epidemic model for information diffusion in web forums: Experiments in marketing exchange and political dialog. SpringerPlus 2016, 5, 66. [Google Scholar] [CrossRef] [PubMed]
- Torche, F.; Valenzuela, E. Trust and reciprocity: A theoretical distinction of the sources of social capital. Eur. J. Soc. Theory 2011, 14, 181–198. [Google Scholar] [CrossRef]
- Liu, C.; Zhang, Z.K. Information spreading on dynamic social networks. Commun. Nonlinear Sci. Numer. Simul. 2014, 19, 896–904. [Google Scholar] [CrossRef]
- Wu, F.; Huberman, B.A. Novelty and collective attention. Proc. Natl. Acad. Sci. USA 2007, 104, 17599–17601. [Google Scholar] [CrossRef] [PubMed] [Green Version]
- Crane, R.; Sornette, D. Robust dynamic classes revealed by measuring the response function of a social system. Proc. Natl. Acad. Sci. USA 2008, 105, 15649–15653. [Google Scholar] [CrossRef] [PubMed] [Green Version]
- Lü, L.; Chen, D.B.; Zhou, T. The small world yields the most effective information spreading. New J. Phys. 2011, 13, 123005. [Google Scholar] [CrossRef] [Green Version]
- Dodds, P.S.; Watts, D.J. Universal behavior in a generalized model of contagion. Phys. Rev. Lett. 2004, 92, 218701. [Google Scholar] [CrossRef] [PubMed]
- Medo, M.; Zhang, Y.C.; Zhou, T. Adaptive model for recommendation of news. EPL (Europhys. Lett.) 2009, 88, 38005. [Google Scholar] [CrossRef] [Green Version]
- Cimini, G.; Medo, M.; Zhou, T.; Wei, D.; Zhang, Y.C. Heterogeneity, quality, and reputation in an adaptive recommendation model. Eur. Phys. J. B 2011, 80, 201–208. [Google Scholar] [CrossRef] [Green Version]
- Jalili, M.; Perc, M. Information cascades in complex networks. J. Complex Netw. 2017, 5, 665–693. [Google Scholar] [CrossRef]
- Piraveenan, M.; Prokopenko, M.; Hossain, L. Percolation centrality: Quantifying graph-theoretic impact of nodes during percolation in networks. PLoS ONE 2013, 8, e53095. [Google Scholar] [CrossRef] [PubMed] [Green Version]
- Aghdam, S.M.; Navimipour, N.J. Opinion leaders selection in the social networks based on trust relationships propagation. Karbala Int. J. Mod. Sci. 2016, 2, 88–97. [Google Scholar] [CrossRef]
- Barabási, A.L.; Albert, R. Emergence of scaling in random networks. Science 1999, 286, 509–512. [Google Scholar] [PubMed]
- Watts, D.J.; Strogatz, S.H. Collective dynamics of ‘small-world’ networks. Nature 1998, 393, 440. [Google Scholar] [CrossRef] [PubMed]
- Watts, D.J. A simple model of global cascades on random networks. Proc. Natl. Acad. Sci. USA 2002, 99, 5766–5771. [Google Scholar] [CrossRef] [PubMed] [Green Version]
- Pacheco, J.M.; Traulsen, A.; Nowak, M.A. Active linking in evolutionary games. J. Theor. Biol. 2006, 243, 437–443. [Google Scholar] [CrossRef] [PubMed] [Green Version]
- Santos, F.; Rodrigues, J.; Pacheco, J. Graph topology plays a determinant role in the evolution of cooperation. Proc. R. Soc. Lond. B Biolog. Sci. 2006, 273, 51–55. [Google Scholar] [CrossRef] [PubMed] [Green Version]
- Pastor-Satorras, R.; Vespignani, A. Epidemic spreading in scale-free networks. Phys. Rev. Lett. 2001, 86, 3200. [Google Scholar] [CrossRef] [PubMed]
- Bettencourt, L.M.; Cintrón-Arias, A.; Kaiser, D.I.; Castillo-Chávez, C. The power of a good idea: Quantitative modeling of the spread of ideas from epidemiological models. Phys. A Stat. Mech. Appl. 2006, 364, 513–536. [Google Scholar] [CrossRef] [Green Version]
- Wu, A.; DiMicco, J.M.; Millen, D.R. Detecting professional versus personal closeness using an enterprise social network site. In Proceedings of the SIGCHI Conference on Human Factors in Computing Systems, Atlanta, GA, USA, 10–15 April 2010; ACM: New York, NY, USA, 2010; pp. 1955–1964. [Google Scholar]
- Yoganarasimhan, H. Impact of social network structure on content propagation: A study using YouTube data. Quant. Mark. Econ. 2012, 10, 111–150. [Google Scholar] [CrossRef]
- Hinz, O.; Skiera, B.; Barrot, C.; Becker, J.U. Seeding strategies for viral marketing: An empirical comparison. J. Mark. 2011, 75, 55–71. [Google Scholar] [CrossRef]
- Hill, S.; Provost, F.; Volinsky, C. Network-based marketing: Identifying likely adopters via consumer networks. Stat. Sci. 2006, 21, 256–276. [Google Scholar] [CrossRef]
- Katona, Z.; Zubcsek, P.P.; Sarvary, M. Network effects and personal influences: The diffusion of an online social network. J. Mark. Res. 2011, 48, 425–443. [Google Scholar] [CrossRef]
- Kermack, W.O.; McKendrick, A.G. Contributions to the mathematical theory of epidemics. II.—The problem of endemicity. Proc. R. Soc. Lond. A. R. Soc. 1932, 138, 55–83. [Google Scholar] [CrossRef]
- Wan, H.; Cui, J.A. An SEIS epidemic model with transport-related infection. J. Theor. Biol. 2007, 247, 507–524. [Google Scholar] [CrossRef] [PubMed]
- Yang, R.; Zhou, T.; Xie, Y.B.; Lai, Y.C.; Wang, B.H. Optimal contact process on complex networks. Phys. Rev. E 2008, 78, 066109. [Google Scholar] [CrossRef] [PubMed]
- Freeman, L.C. Centrality in social networks conceptual clarification. Soc. Netw. 1978, 1, 215–239. [Google Scholar] [CrossRef] [Green Version]
- Kimura, M.; Saito, K. Tractable models for information diffusion in social networks. In Proceedings of the European Conference on Principles of Data Mining and Knowledge Discovery, Berlin, Germany, 18–22 September 2006; Springer: Berlin, Germany, 2006; pp. 259–271. [Google Scholar]
- Kitsak, M.; Gallos, L.K.; Havlin, S.; Liljeros, F.; Muchnik, L.; Stanley, H.E.; Makse, H.A. Identification of influential spreaders in complex networks. Nat. Phys. 2010, 6, 888. [Google Scholar] [CrossRef]
- Pei, S.; Makse, H.A. Spreading dynamics in complex networks. J. Stat. Mech. Theory Exp. 2013, 2013, P12002. [Google Scholar] [CrossRef]
- Pei, S.; Muchnik, L.; Andrade, J.S., Jr.; Zheng, Z.; Makse, H.A. Searching for superspreaders of information in real-world social media. Sci. Rep. 2014, 4, 5547. [Google Scholar] [CrossRef] [PubMed]
- Giatsidis, C.; Thilikos, D.M.; Vazirgiannis, M. D-cores: Measuring collaboration of directed graphs based on degeneracy. Knowl. Inf. Syst. 2013, 35, 311–343. [Google Scholar] [CrossRef] [Green Version]
- Sabidussi, G. The centrality index of a graph. Psychometrika 1966, 31, 581–603. [Google Scholar] [CrossRef] [PubMed]
- Newman, M.E. The structure of scientific collaboration networks. Proc. Natl. Acad. Sci. USA 2001, 98, 404–409. [Google Scholar] [CrossRef] [PubMed] [Green Version]
- Beauchamp, M.A. An improved index of centrality. Syst. Res. Behav. Sci. 1965, 10, 161–163. [Google Scholar] [CrossRef]
- Leskovec, J.; Mcauley, J.J. Learning to discover social circles in ego networks. In Advances in Neural Information Processing Systems; Neural Information Processing Systems Foundation, Inc.: La Jolla, CA, USA, 2012; pp. 539–547. [Google Scholar]
- Fire, M.; Tenenboim-Chekina, L.; Puzis, R.; Lesser, O.; Rokach, L.; Elovici, Y. Computationally efficient link prediction in a variety of social networks. ACM Trans. Intell. Syst. Technol. (TIST) 2013, 5, 10. [Google Scholar] [CrossRef]
- Rossi, R.A.; Ahmed, N.K. The Network Data Repository with Interactive Graph Analytics and Visualization. In Proceedings of the Twenty-Ninth AAAI Conference on Artificial Intelligence, Austin, TX, USA, 25–30 January 2015. [Google Scholar]
- Leskovec, J.; Lang, K.J.; Dasgupta, A.; Mahoney, M.W. Community structure in large networks: Natural cluster sizes and the absence of large well-defined clusters. Internet Math. 2009, 6, 29–123. [Google Scholar] [CrossRef]
- Leskovec, J.; Krevl, A. SNAP Datasets: Stanford Large Network Dataset Collection. 2014. Available online: http://snap.stanford.edu/data (accessed on 21 March 2018).
- Wasserman, S.; Faust, K. Social Network Analysis: Methods and Applications; Cambridge University Press: Cambridge, UK, 1994; Volume 8. [Google Scholar]
- Frank, D.; Huang, Z.; Chyan, A. Sampling A Large Network: How Small Can My Sample Be? 2012. Available online: http://snap.stanford.edu/class/cs224w-2012/projects/cs224w-036-final.pdf (accessed on 20 May 2018).
- Leskovec, J.; Faloutsos, C. Sampling from large graphs. In Proceedings of the 12th ACM SIGKDD International Conference on Knowledge Discovery and Data Mining, Philadelphia, PA, USA, 20–23 August 2006; ACM: New York, NY, USA, 2006; pp. 631–636. [Google Scholar]
- Kamp, C.; Moslonka-Lefebvre, M.; Alizon, S. Epidemic spread on weighted networks. PLoS Comput. Biol. 2013, 9, e1003352. [Google Scholar] [CrossRef] [PubMed]
- Wu, F.; Huberman, B.A.; Adamic, L.A.; Tyler, J.R. Information flow in social groups. Phys. A Stat. Mech. Appl. 2004, 337, 327–335. [Google Scholar] [CrossRef] [Green Version]
- Centola, D. The spread of behavior in an online social network experiment. Science 2010, 329, 1194–1197. [Google Scholar] [CrossRef] [PubMed]
- Girvan, M.; Newman, M.E. Community structure in social and biological networks. Proc. Natl. Acad. Sci. USA 2002, 99, 7821–7826. [Google Scholar] [CrossRef] [PubMed] [Green Version]
- Zhao, Z.; Wang, X.; Zhang, W.; Zhu, Z. A community-based approach to identifying influential spreaders. Entropy 2015, 17, 2228–2252. [Google Scholar] [CrossRef]
- Rosvall, M.; Bergstrom, C.T. Maps of random walks on complex networks reveal community structure. Proc. Natl. Acad. Sci. USA 2008, 105, 1118–1123. [Google Scholar] [CrossRef] [PubMed] [Green Version]
- Enns, E.A.; Brandeau, M.L. Link removal for the control of stochastically evolving epidemics over networks: A comparison of approaches. J. Theor. Biol. 2015, 371, 154–165. [Google Scholar] [CrossRef] [PubMed] [Green Version]
- Zhao, J.; Wu, J.; Xu, K. Weak ties: Subtle role of information diffusion in online social networks. Phys. Rev. E 2010, 82, 016105. [Google Scholar] [CrossRef] [PubMed]
Figure 1.
Illustration of user’s behaviour towards the incoming messages in a network.

Figure 2.
An overview of the methodology used in the empirical analysis.
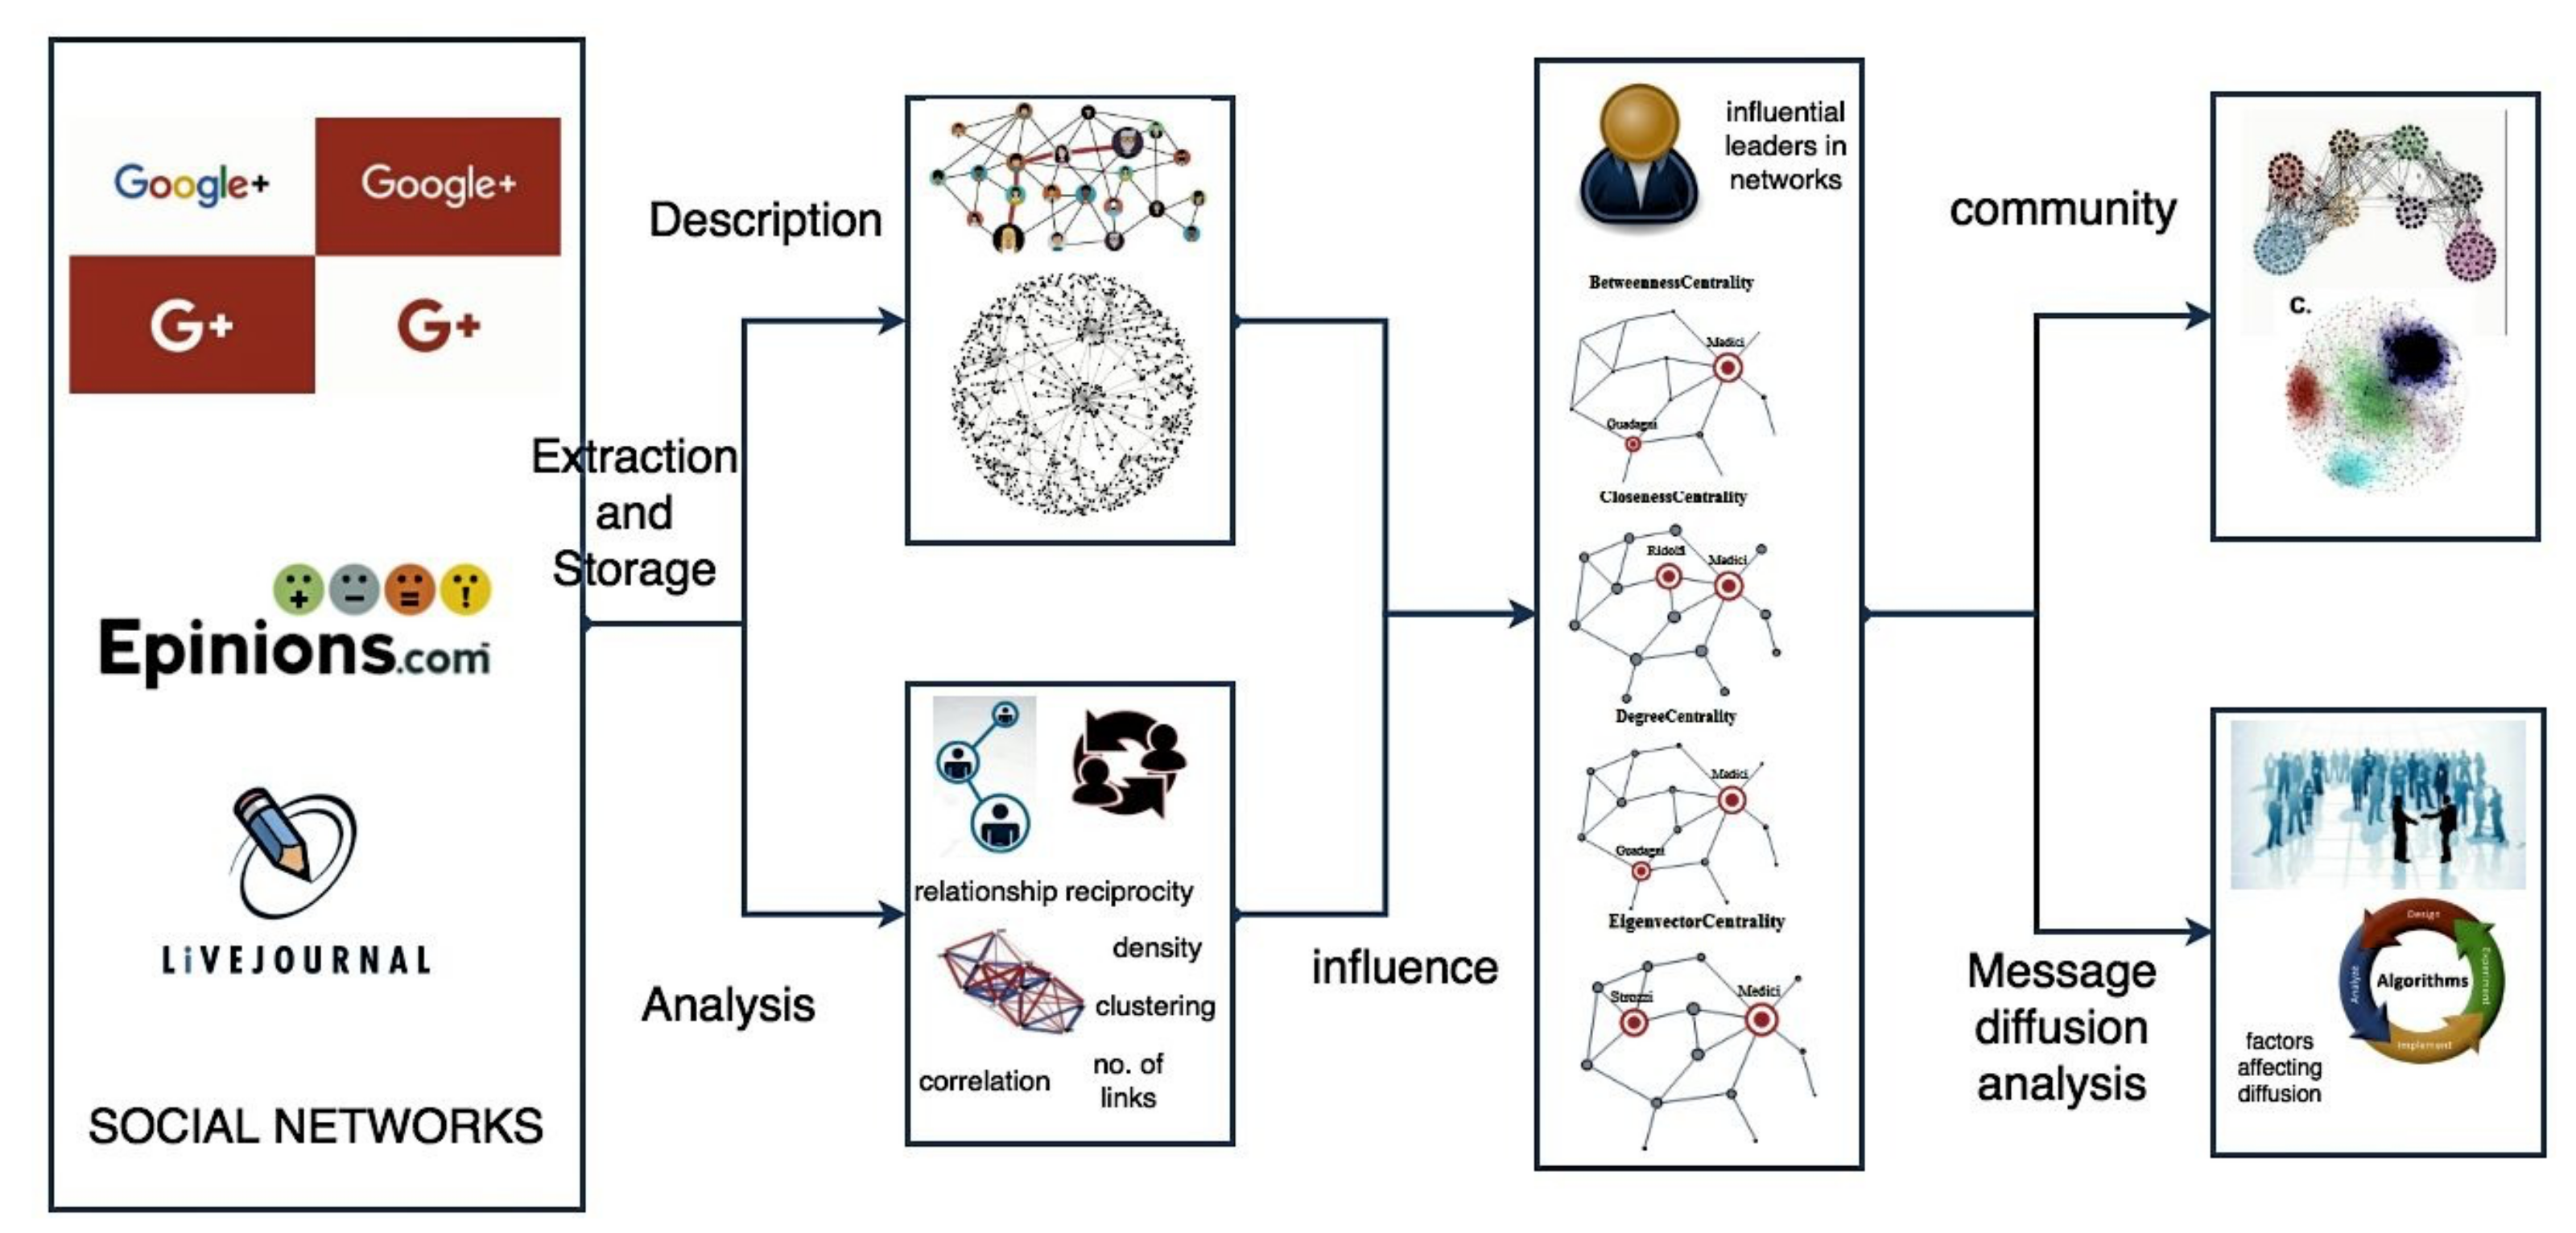
Figure 3.
Simple diffusion—fraction of affected nodes as a function of the fraction of removed links.
Figure 3.
Simple diffusion—fraction of affected nodes as a function of the fraction of removed links.

Figure 4.
Multiple diffusion—fraction of affected nodes as a function of the fraction of removed links.
Figure 4.
Multiple diffusion—fraction of affected nodes as a function of the fraction of removed links.

Figure 5.
Dynamic diffusion—fraction of affected nodes as a function of the fraction of removed links.
Figure 5.
Dynamic diffusion—fraction of affected nodes as a function of the fraction of removed links.

Figure 6.
Edge diffusion—fraction of affected nodes as a function of the fraction of removed links.
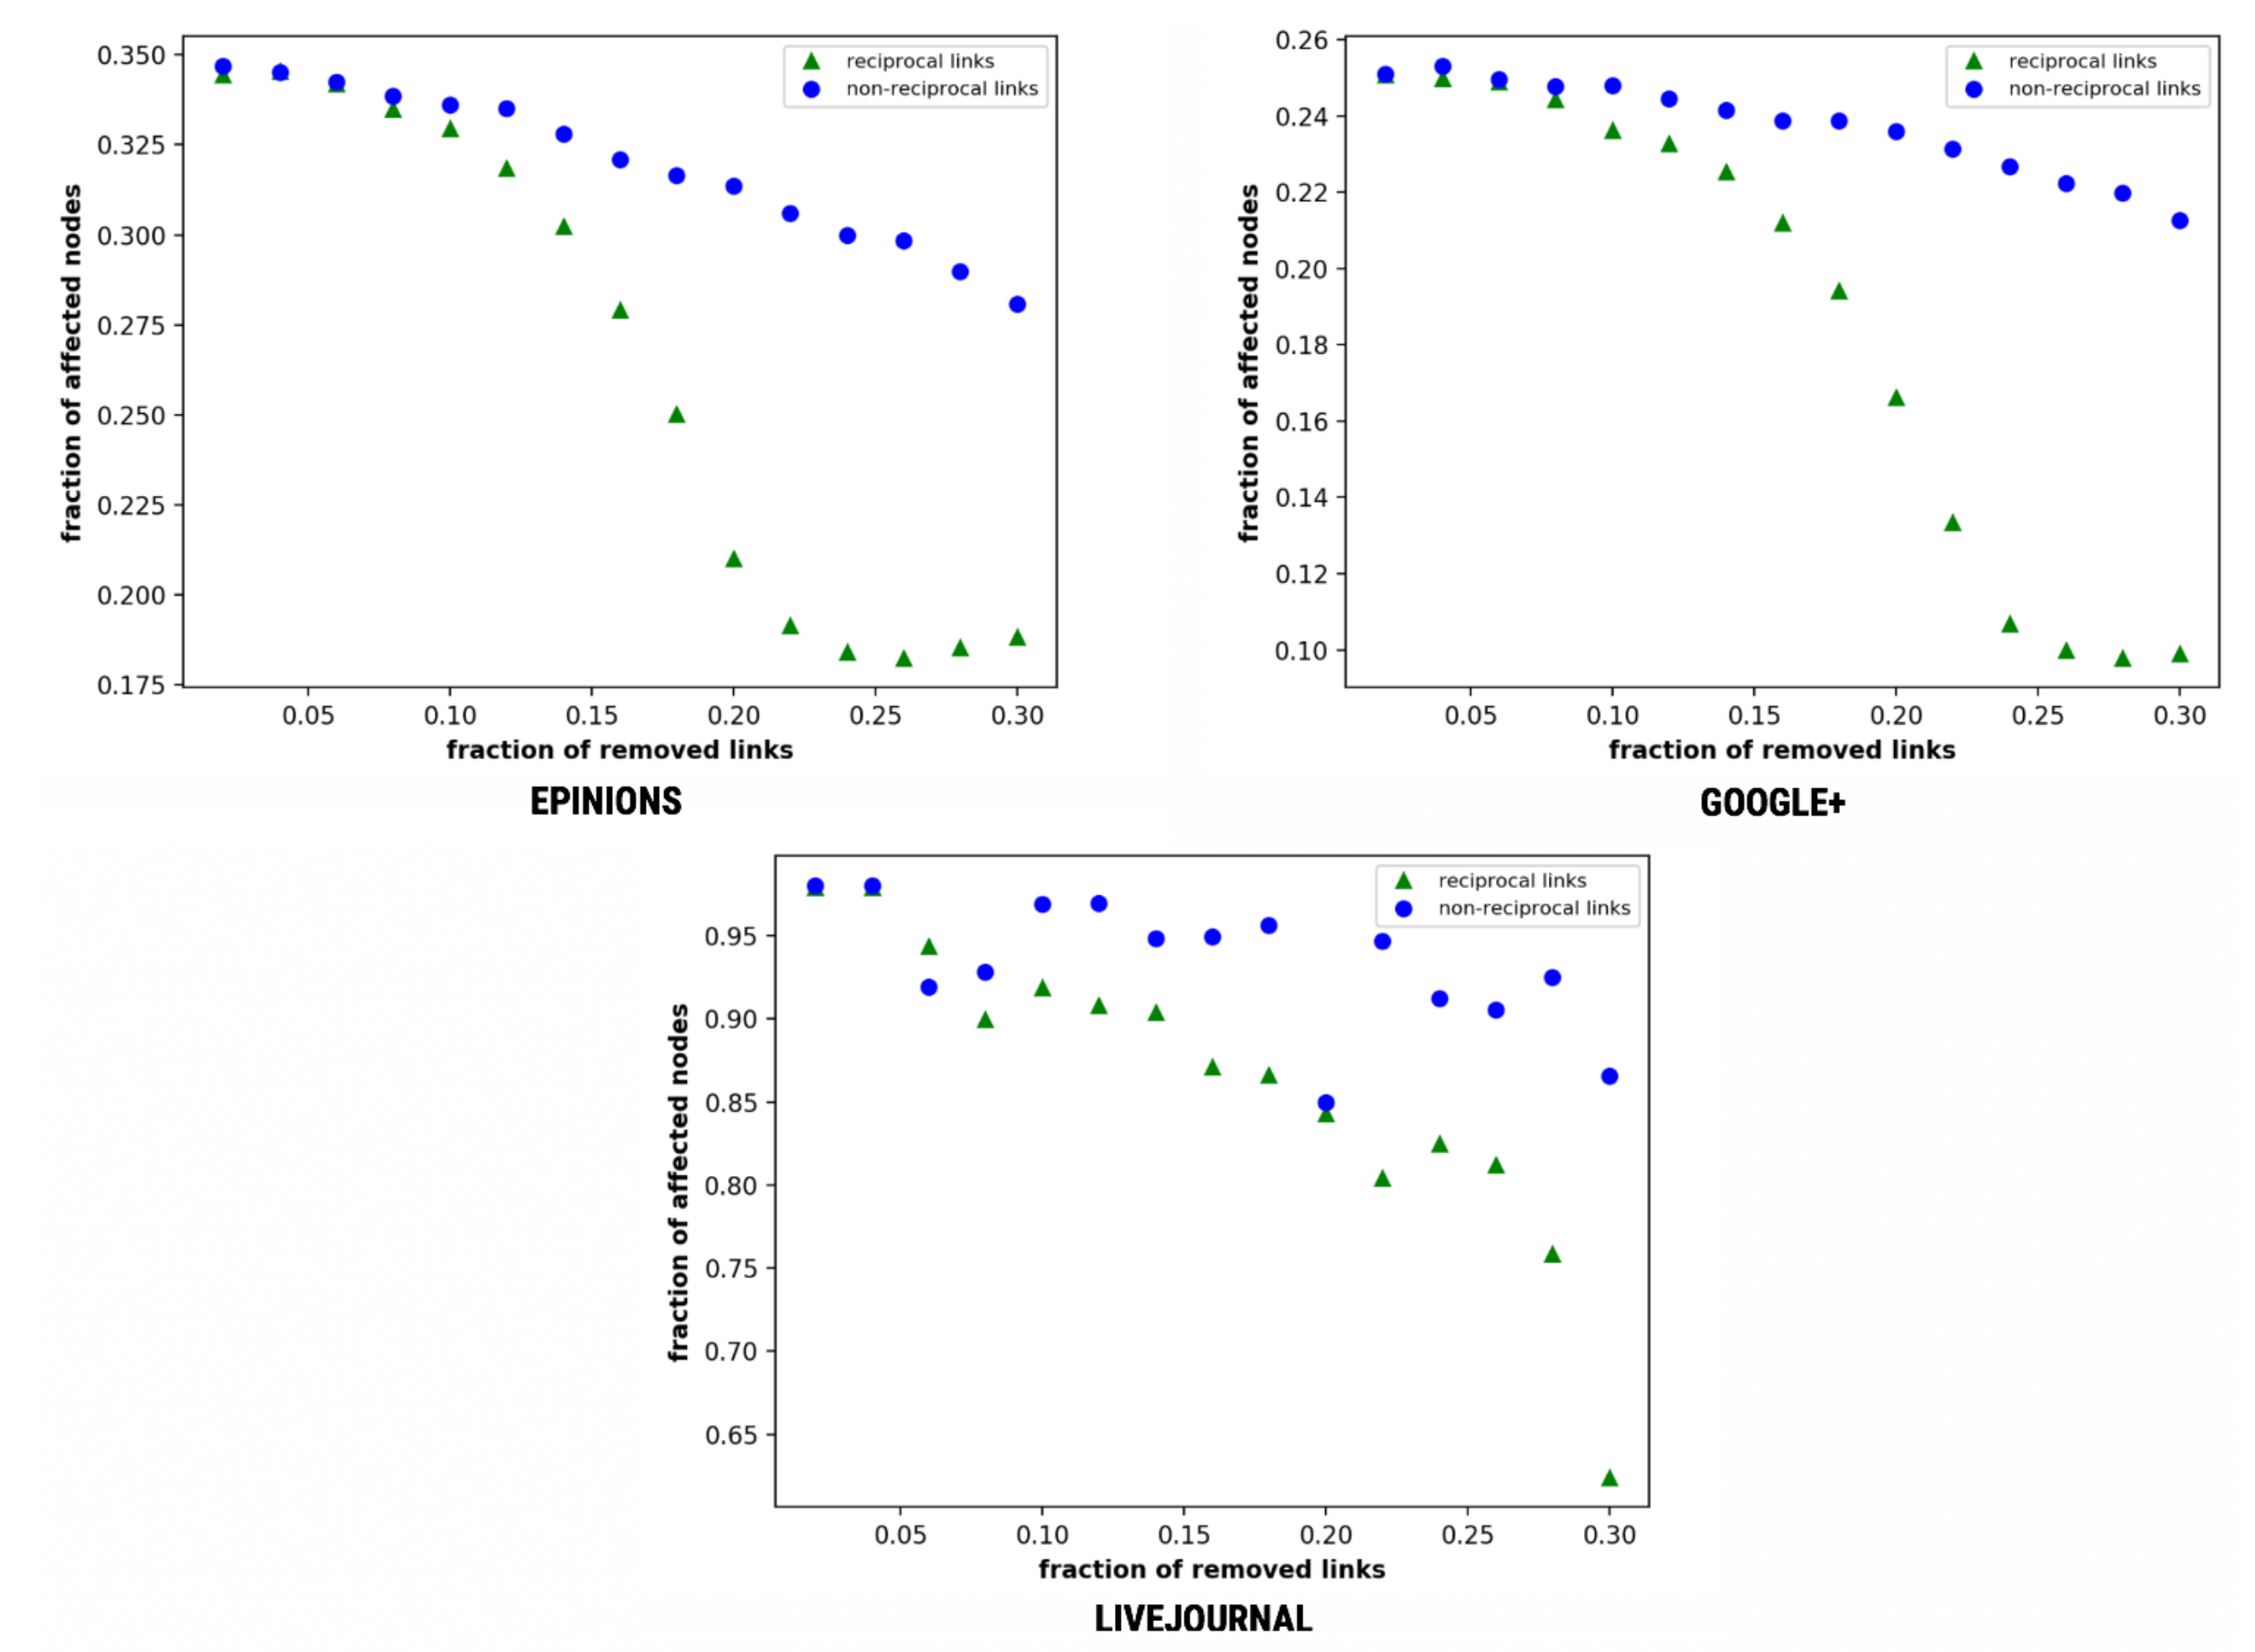
Figure 7.
Weighted diffusion—fraction of affected nodes as a function of the fraction of removed links.
Figure 7.
Weighted diffusion—fraction of affected nodes as a function of the fraction of removed links.

Figure 8.
Decay diffusion—fraction of affected nodes as a function of the fraction of removed links.
Figure 8.
Decay diffusion—fraction of affected nodes as a function of the fraction of removed links.

Figure 9.
A comparison of the performances of six diffusion algorithms for all the three datasets: (a) Epinions; (b) Google+; and (c) LiveJournal.
Figure 9.
A comparison of the performances of six diffusion algorithms for all the three datasets: (a) Epinions; (b) Google+; and (c) LiveJournal.
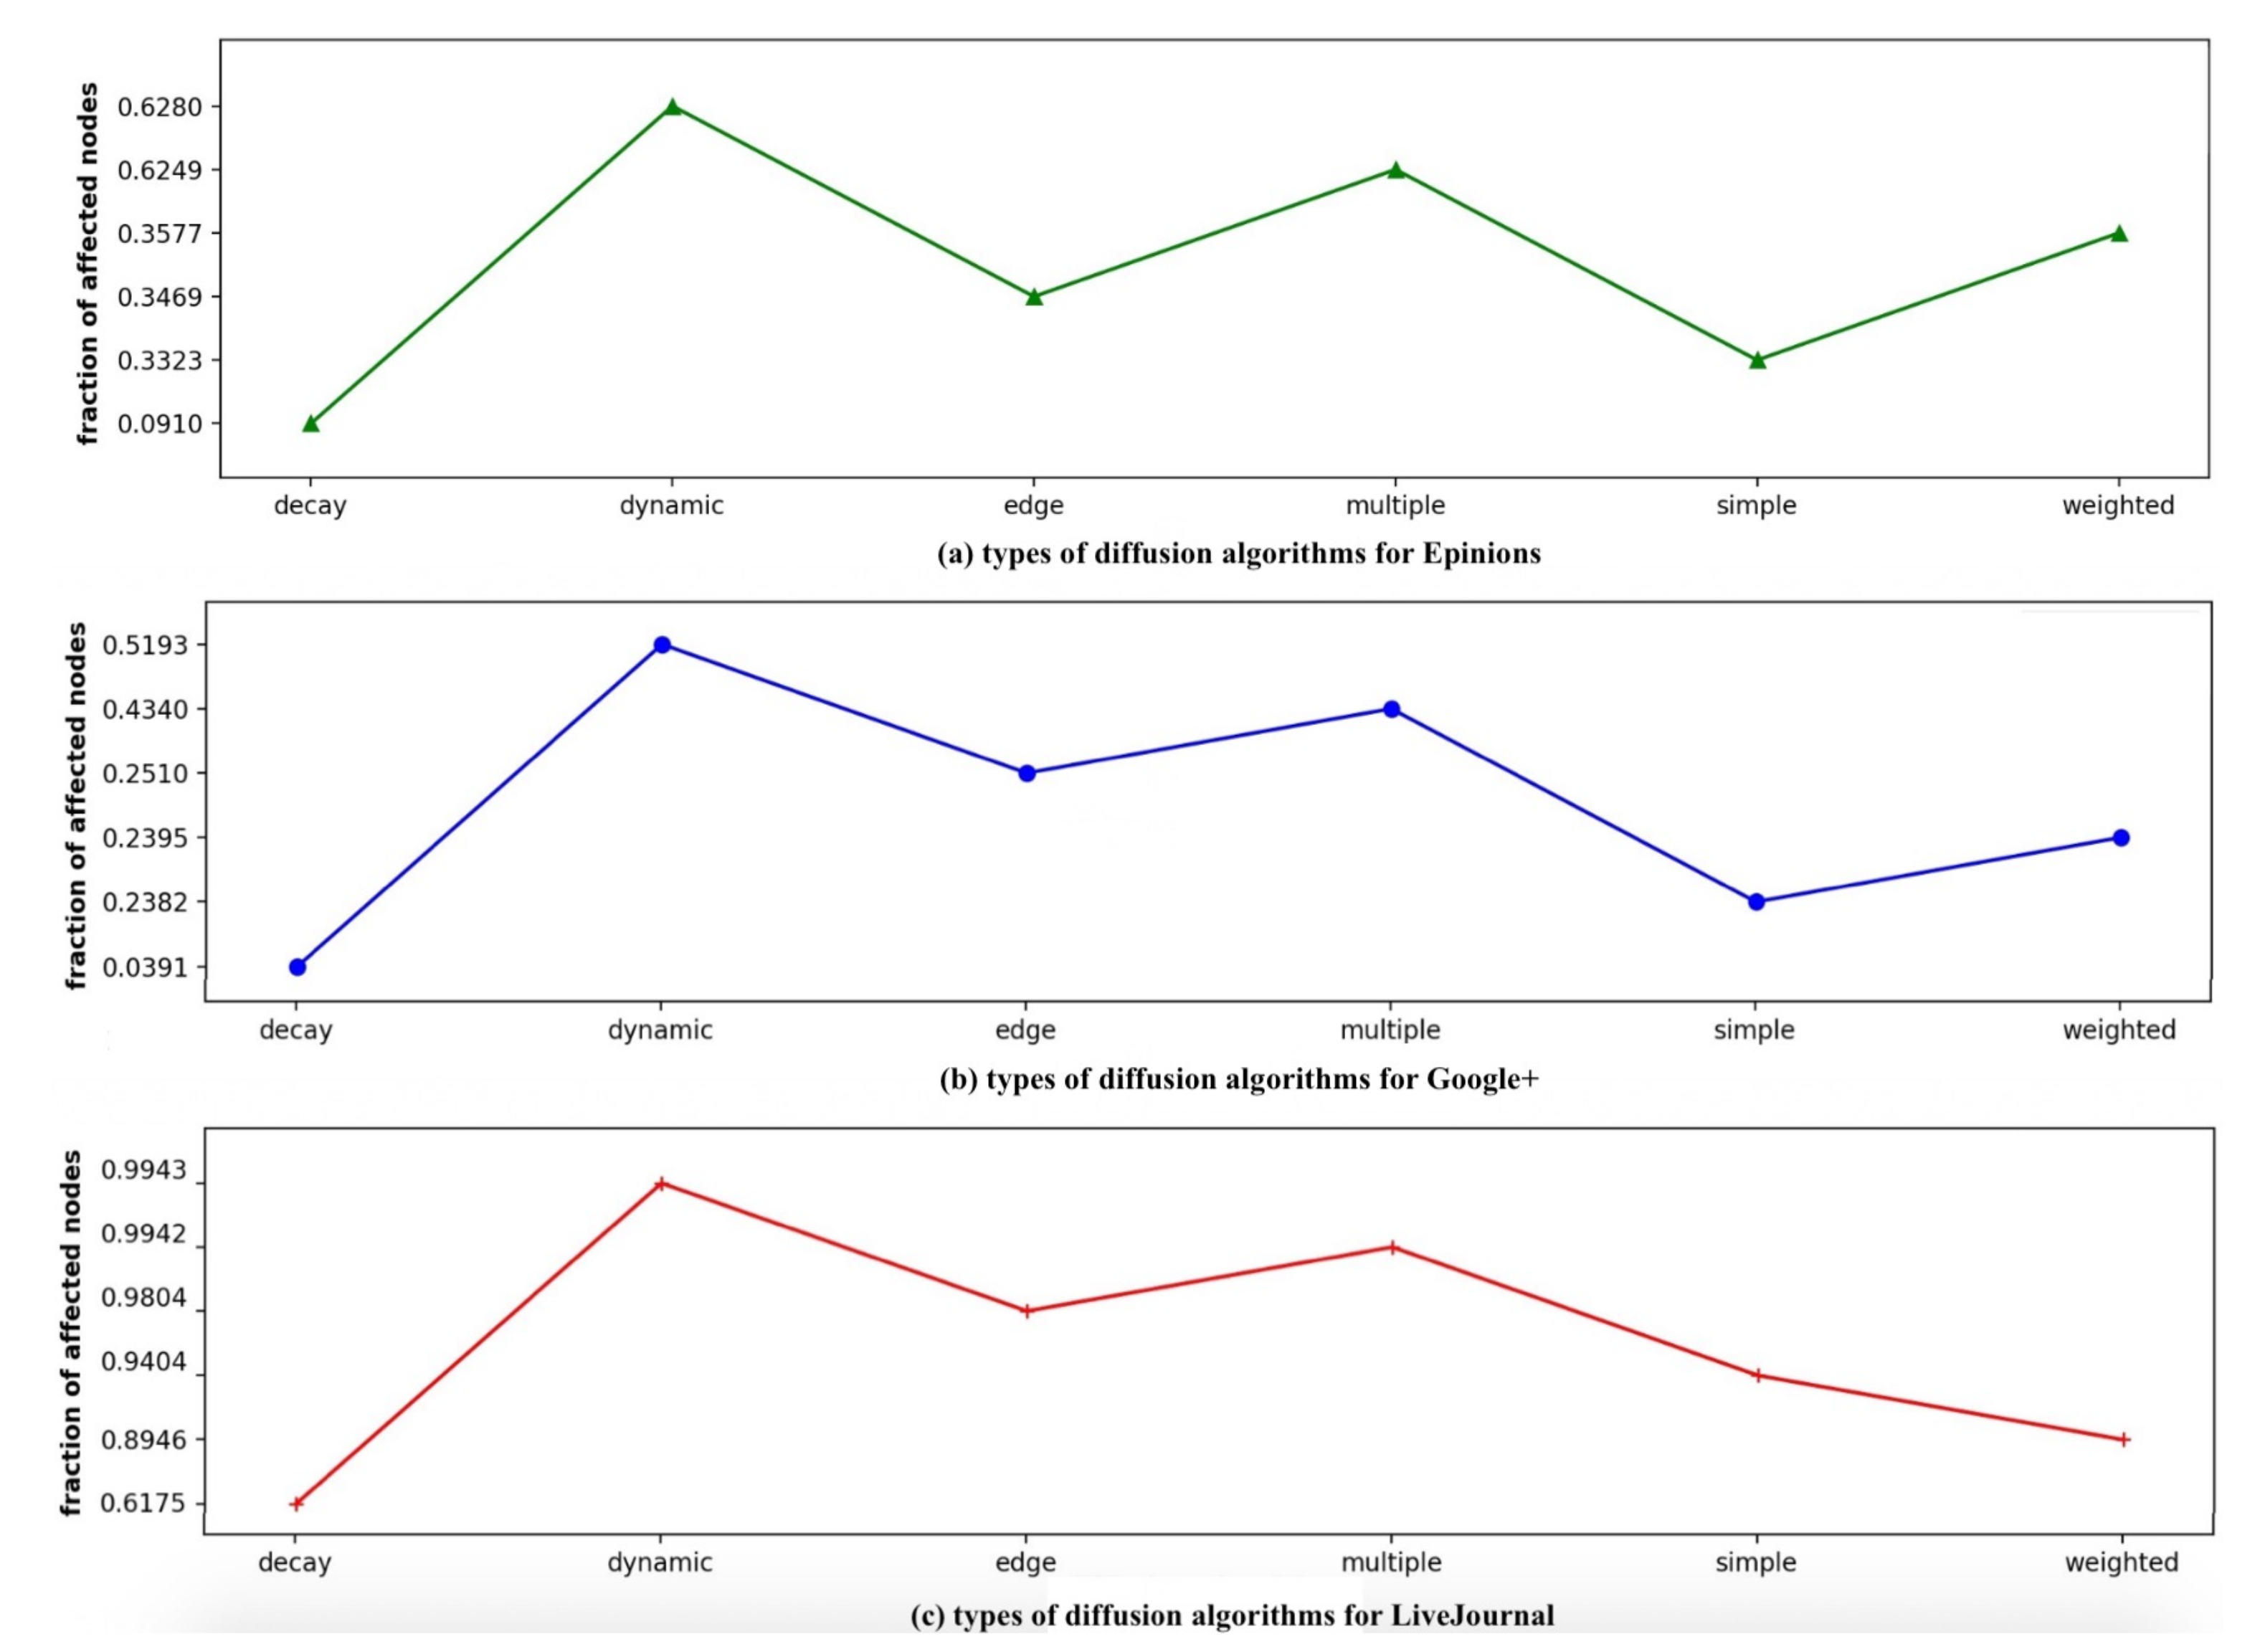
Figure 10.
Affected network density as a function of the fraction of removed links.
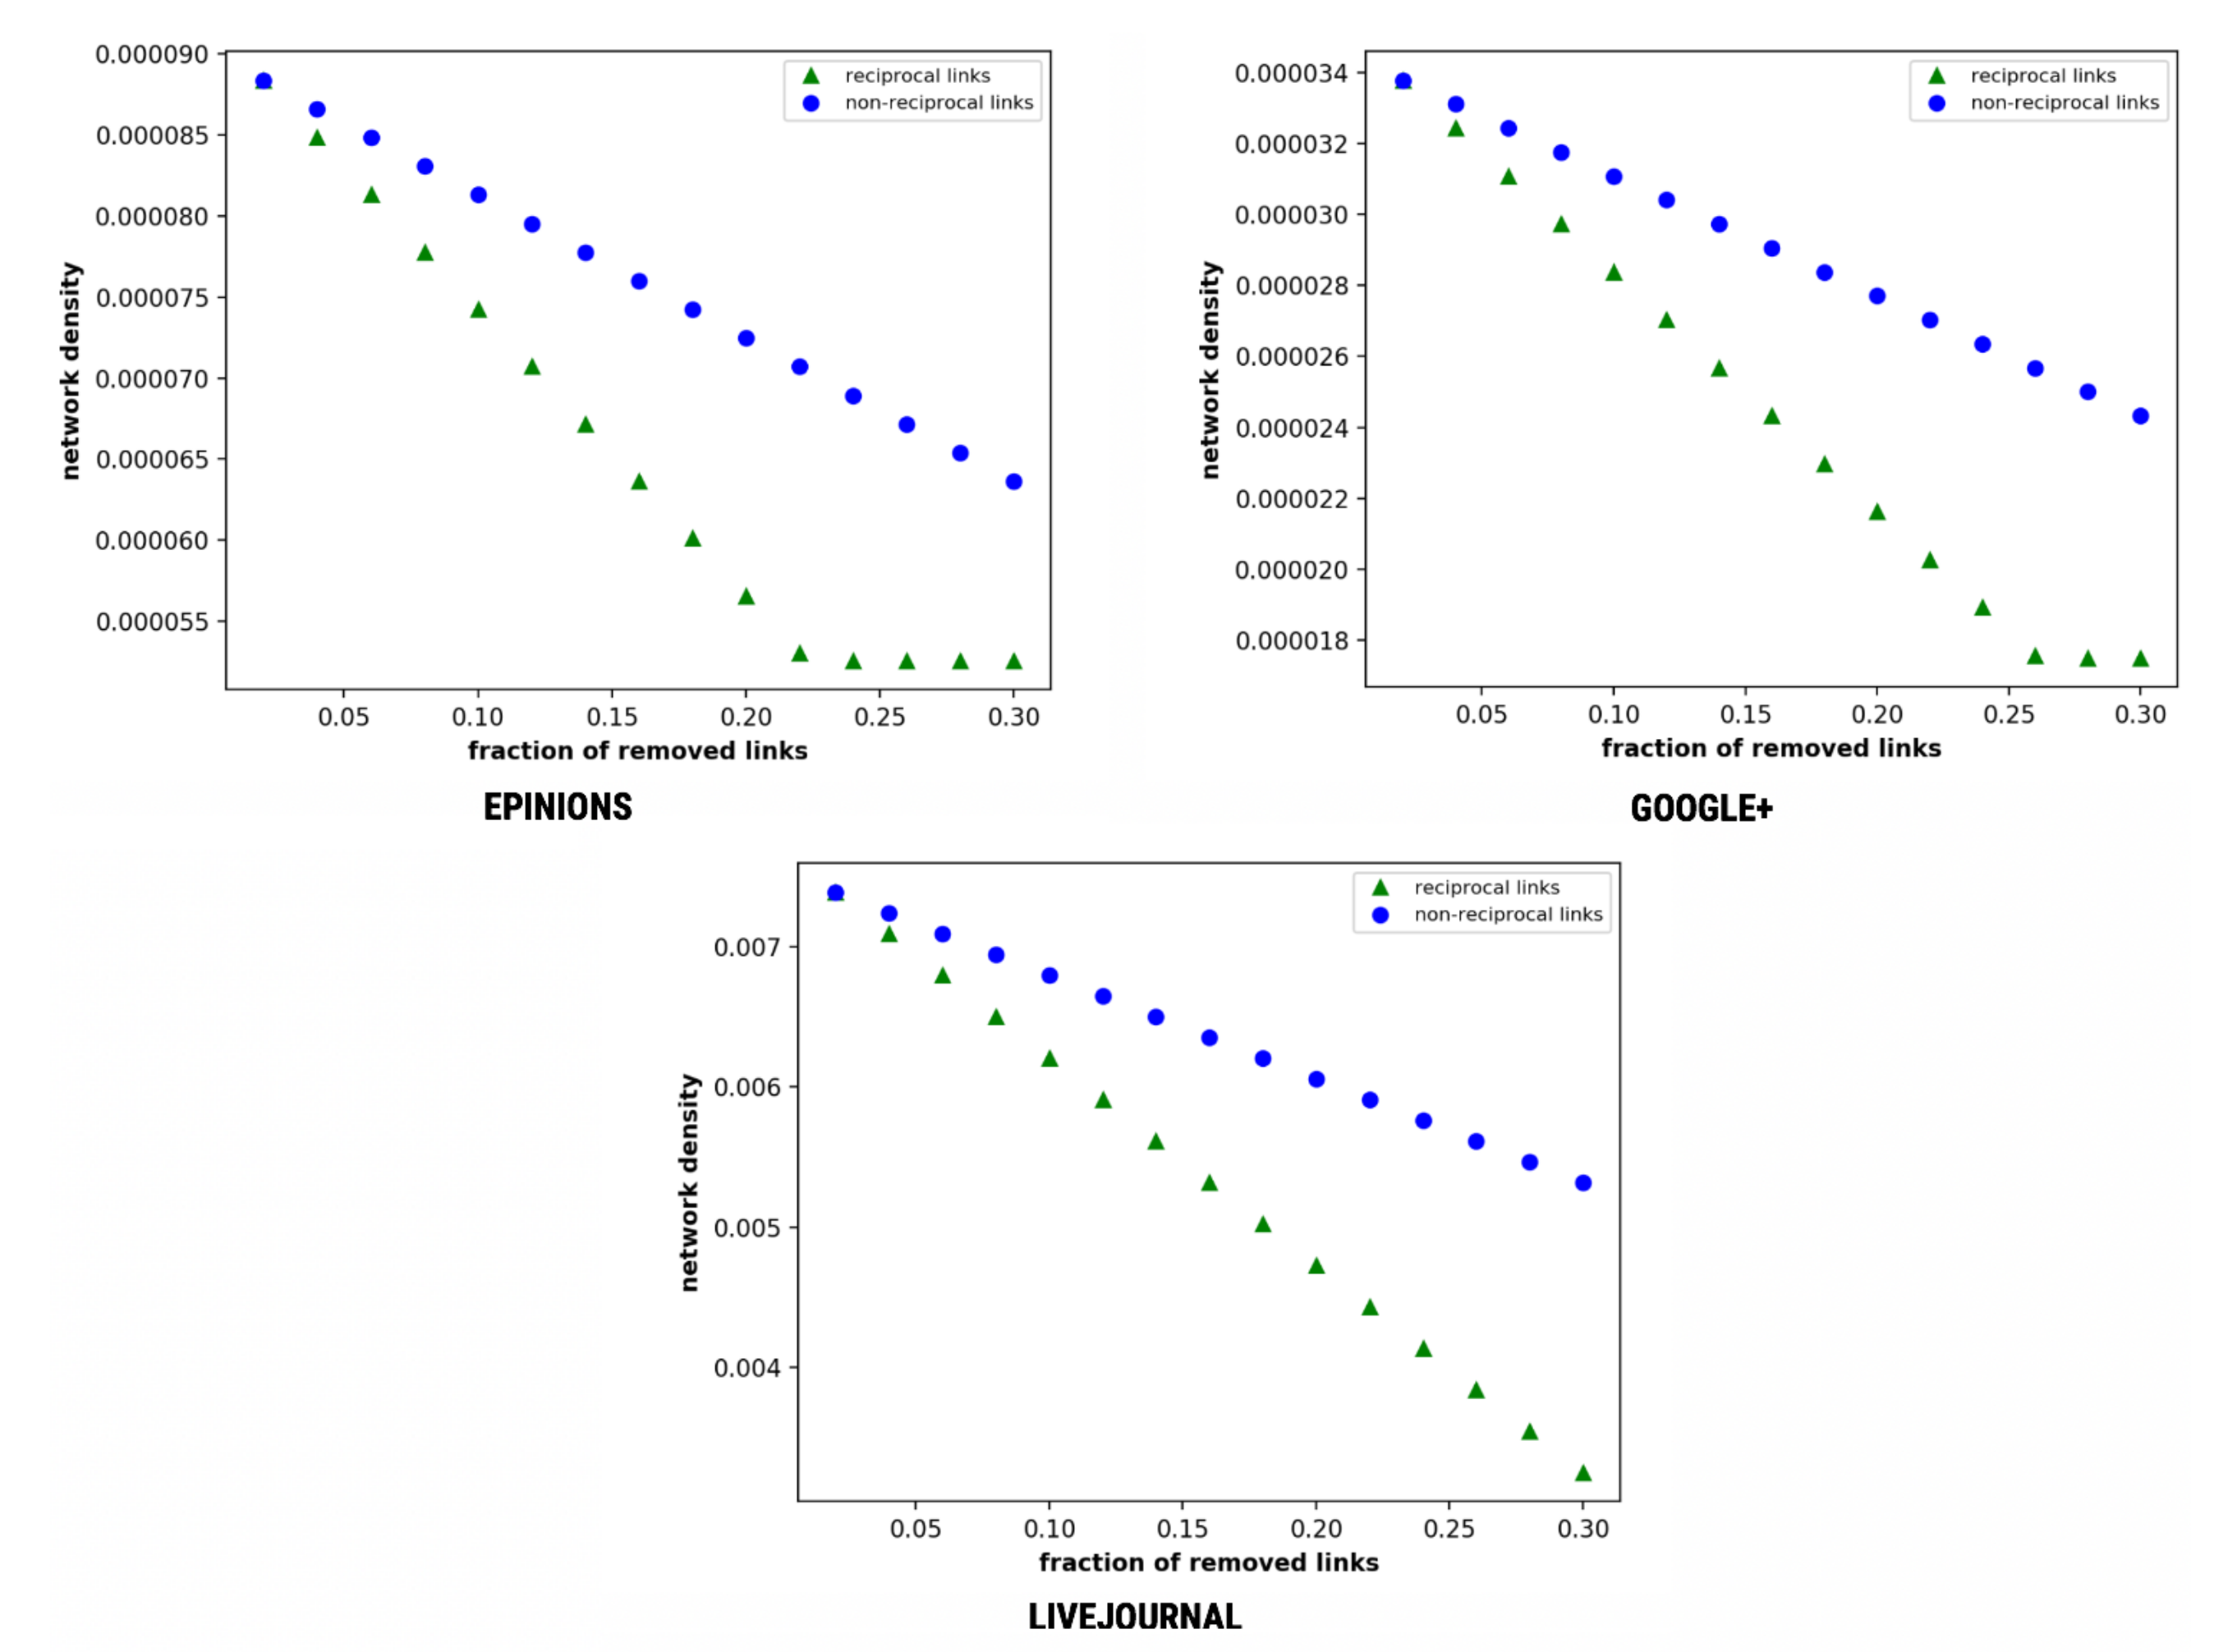
Figure 11.
Affected degree centrality as a function of the fraction of removed links.
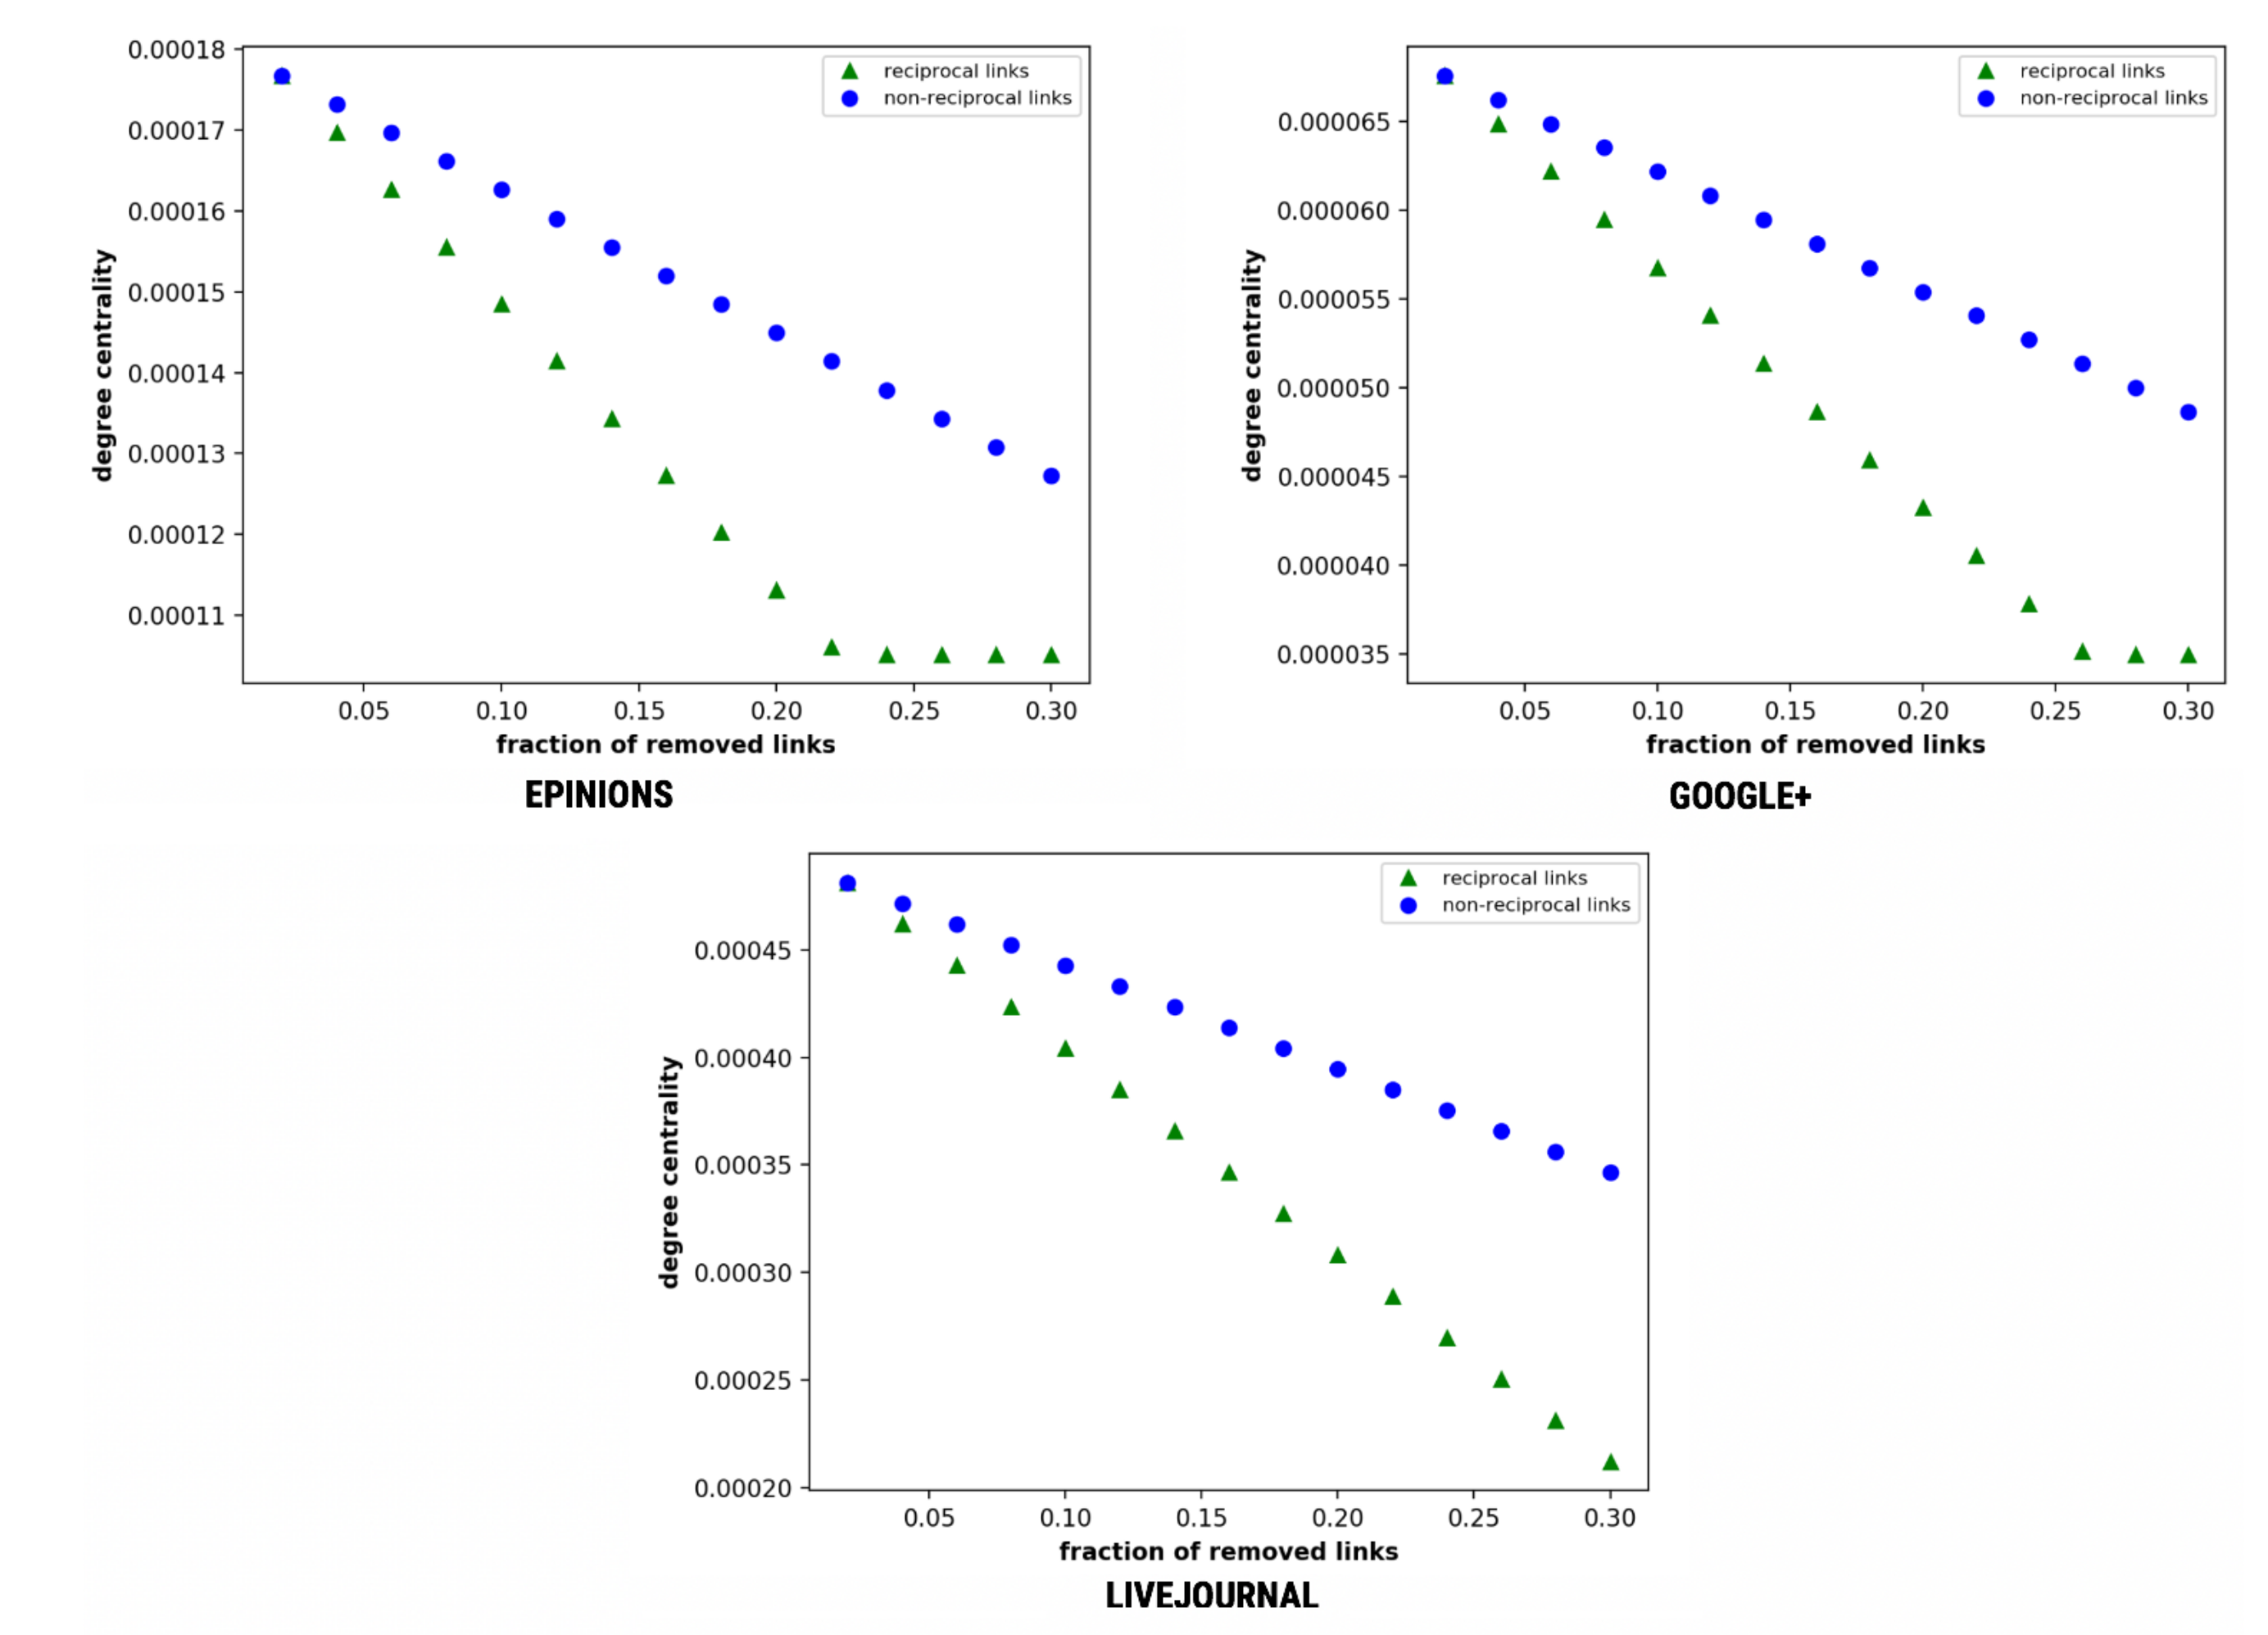
Figure 12.
Affected community size as a function of the fraction of removed links.

Figure 13.
Affected giant component size as a function of the fraction of removed links.

Table 1.
Comparison of different variants of epidemic model.
| Model | Researcher | Definition |
|---|---|---|
| SIR | Kermack and McKendrick [49] | The SIR model deals with the modeling of diseases with long-lasting immunity to immunising infections. Thus, it is partitioned into three disjoint groups: S, I and R. Susceptible (S) represents node susceptible to a disease, “Infected” (I) states node infected by a disease, “Recovered” (R) represents the people who are infected and immune to the infection. |
| SIS | Pastor-Satorras [42] | The SIS compartmental model segregates compartments through non-immune infections, such infections do not give immunisation upon recovery from infection, and individuals become susceptible again. Thus it segregates into two compartments: Susceptible (S) and Infected (I). In the spreading process, infected individuals infect their susceptible neighbours with a certain probability () and return to S state with a certain probability (). |
| SEIR | Wang et al. [19] | SEIR model has an additional compartment which consists of exposed individuals in the latent period. The individual is in an exposed compartment “E” (exposed) when he is infected but not yet infectious . These models make the following assumptions: (1) susceptible individuals can get infected from infected individuals via contacts; and (2) an infected individual becomes immune after recovering from the disease. |
| SEIS | Wan and Cui [50] | SEIS compartmental model considers the exposed or latent period of the disease, thus introducing an additional compartment E. The infection does not leave any immunity, therefore individuals that have recovered return to being susceptible. |
| SIRL | Yang et al. [51] | SIRL model is a modified SIR model, in which each node is assigned with an identical capability of active contacts, L. It stands for the spreading with limited contacting ability. At each step, the infected individuals will generate L contacts. Multiple contacts with one neighbour are allowed, and contacts that are not between susceptible and infected ones are also counted just like the standard SIR model. |
Table 2.
Characteristics of the social networks used in the empirical analysis.
| Dataset | Total | Total | Reciprocal | Non Reciprocal | Recipro | Clustering | Opinion Leader |
|---|---|---|---|---|---|---|---|
| Nodes | Edges | Links | Links | -City | Coefficient | Node ID | |
| Epinions | 12,209 | 508,837 | 206,194 | 302,643 | 0.399 | 0.137 | 645 |
| Google+ | 211,187 | 1,506,896 | 726,970 | 779,926 | 0.479 | 0.145 | 197,967 |
| Live Journal | 10,608 | 1,656,116 | 1,166,146 | 489,970 | 0.697 | 0.327 | 4 |
1 calculated using closeness centrality measure.
© 2018 by the authors. Licensee MDPI, Basel, Switzerland. This article is an open access article distributed under the terms and conditions of the Creative Commons Attribution (CC BY) license (http://creativecommons.org/licenses/by/4.0/).
Share and Cite
MDPI and ACS Style
Narang, R.; Sarin, S.; Singh, P.; Goyal, R. Impact of Reciprocity in Information Spreading Using Epidemic Model Variants. Information 2018, 9, 136. https://doi.org/10.3390/info9060136
AMA Style
Narang R, Sarin S, Singh P, Goyal R. Impact of Reciprocity in Information Spreading Using Epidemic Model Variants. Information. 2018; 9(6):136. https://doi.org/10.3390/info9060136
Chicago/Turabian StyleNarang, Rishabh, Simran Sarin, Prajjwal Singh, and Rinkaj Goyal. 2018. "Impact of Reciprocity in Information Spreading Using Epidemic Model Variants" Information 9, no. 6: 136. https://doi.org/10.3390/info9060136
Note that from the first issue of 2016, this journal uses article numbers instead of page numbers. See further details here.