Article

External Technology Acquisition and External Technology Exploitation: The Difference of Open Innovation Effects

by
Farzana Parveen Tajudeen
1,*,
Noor Ismawati Jaafar
1 and
Ainin Sulaiman
2
1
Department of Operation and Management Information System, University of Malaya, Kuala Lumpur 50603, Malaysia
2
Social Advancement and Happiness Research Cluster, University of Malaya, Kuala Lumpur 50603, Malaysia
*
Author to whom correspondence should be addressed.
J. Open Innov. Technol. Mark. Complex. 2019, 5(4), 97; https://doi.org/10.3390/joitmc5040097
Submission received: 7 November 2019 / Revised: 3 December 2019 / Accepted: 4 December 2019 / Published: 6 December 2019

Abstract

:
To sustain in today’s ever-changing and competitive landscape, firms must work within and outside of their organizations’ boundaries. Open innovation (OI) strategies such as external technology acquisition (ETA), and external technology exploitation (ETE), can effectively improve the innovation performance of the organizations. Technologies like social media can help organizations to scout for appropriate technology, and source for ideas and knowledge from external sources to support their innovations. Moreover, digitalization can hasten business operations and enhance the innovation process of the firm. Focusing on open innovation (OI), this study takes an integrated approach towards investigating the impact of OI strategies, technology scouting through social media, and digitalization vision on innovation and firm performance. Data were drawn from 153 organizations in Malaysia, and the partial least squares (PLS) method was used to analyze data. The findings revealed that ETE, technology scouting through social media, and digitalization vision have a significant relationship with innovation performance. This, in turn, shows a positive relationship with firm performance. However, ETA does not have a significant relationship with innovation performance in the Malaysia context. This study extends the current literature on OI through the use of specific technology variables, such as technology scouting through social media and digitalization vision to support organizations’ innovation.

1. Introduction

Innovation is crucial for the development of a country’s economy, as each nation strives to be globally competitive, and this includes developing countries like Malaysia. Plans have been made to support this effort where the Eleventh Malaysia Plan [1] actually addressed this issue. It emphasized that productivity and innovation are the two most important pillars for the country to stimulate growth, thereby propelling the country’s economy towards higher progress. In this regard, businesses, firms, and organizations were encouraged to adopt the open innovation model as a strategy to develop open innovation (OI). It was assumed that using this model can lead organizations towards creating more investment opportunities; thus, it was seen as an important tool to be used for stimulating economic growth [2].
Open innovation (OI) is the process of systematically encouraging and exploiting a wide range of internal and external knowledge sources for the purpose of accelerating innovation [3,4]. Prior literature [3,5,6,7] has placed this process into two systems—external technology acquisition (ETA—inbound open innovation), and external technology exploitation (ETE—outbound open innovation). The ETA also refers to those innovative ideas and technological knowledge that flow into the firm’s innovation system such that the firm can access external innovative knowledge and internal ideas so as to complement its business model. Based on this, firms can create value for customers and be more competitive in the market by offering better or newer products or services. In comparison, the ETE refers to the ideas or technological knowledge flowing out of the firm’s innovation system because of the firm’s purposive intention to pursue commercialization. In other words, it is the outward transfer of the organization’s technological knowledge to external firms for the purpose of obtaining monetary or non-monetary benefits. ETE includes selling Intellectual Properties (IPs) or multiplying technology through channeling ideas or knowledge to the external environment within the technology market [3,8,9,10].
Apart from the traditional OI strategies, such as the ETA and ETE, this study takes a new approach and investigates the impact of social media and digitalization on innovation performance of the organization. In order to sustain in the competitive landscape, it is important for an organization to systematically assess and observe technology trends, which can help them to detect opportunities, and to resolve any threatening encounters in a timely manner. This scanning function of assessing and observing technology trends is known as technology scouting [11,12,13,14].
The use of social media for technology scouting can help organizations to gain more awareness about the current technologies that they can use to improve their innovation process. Undoubtedly, one of the major advantages of social media is its broad audience and participants. People from different walks of life, age groups, and geographical locations are already immersed in this expertise; therefore, by latching onto this accessibility, organizations have the resources to search for the most excellent expertise to collaborate or work with, so as to fulfil their respective organizational goals. By working with these diverse experts together, organizations can also access the most current of trends, have knowledge about the latest or the newest technology, and garner enough audience support to provide the relevant feedback, thereby creating a knowledge pool that can be used to update themselves on a regular basis. Doing so would enable these organizations to perform well in their innovations. A previous study [15] has investigated the impact of technology scouting on innovation performance, but not technology scouting on social media and its impact on innovation performance. This literature gap will thus be addressed by the current study.
Today’s digitalized world has caused an overabundance of information [16] in the market. Without doubt, digital technologies have also caused a change in communication, customer relations, and business relationships, hence there is a shift in the way businesses use the information systems [17]. This means that businesses that do not keep at par with these developments will suffer. In other words, to survive in this digital world, and to improve the organizations’ innovation performance, it is important for these organizations to ”embrace” digitalization strategically. Doing so allows these organizations an opportunity to compete with others in the market so as to achieve a competitive advantage. Hence, it is imperative that organizations develop the vision to incorporate digitalization as part of their business strategy [18]. In this regard, the current study also examines the impact of digitalization vision on innovation performance.
A previous study [19] has investigated the impact of OI on firm performance, but this study takes an integrated approach and investigates the impact of OI strategies (ETA and ETE), technology scouting through social media, and digitalization vision on innovation performance and its subsequent impact on firm performance. The integrative approach will add value and knowledge to the literature on open innovation. Moreover, since enhancing innovation is one of the main focuses of the Malaysian government, the findings of the current study could be used to create awareness among Malaysian firms on whether focusing on OI strategy, especially social media for technology scouting and digitalization strategy, could help them to improve their innovation and firm performance.

2. Model and Hypotheses

2.1. Open Innovation Strategies

Open innovation is viewed differently depending on studies [20,21,22] but in general, it is viewed as the antithesis of closed innovation. This means using a vertically integrated model for the distribution of internally developed products by firms [23]. According to Chesbrough and Bogers [24] (p. 17), OI is defined as “a distributed innovation process, based on purposively managed knowledge flow across organizational boundaries, using pecuniary and non-pecuniary mechanisms, in line with the organization’s business model”. With OI, firms tend to use internal and external paths to market their products as they advance their technologies [3]. This involves the purposive use of inflows and outflows of knowledge so as to accelerate the innovation and to expand markets for it [24].
To understand the importance of OI, the concept of OI has to be viewed from the various ways it has been applied by various studies. West and Bogers [25], for instance, investigated inbound OI through a three-phase model of obtaining, integrating, and commercializing external innovations. In another study, a framework comprising inbound and outbound knowledge, and monetized vs. non-monetized knowledge flow, was developed by Dahlander and Gann [20]. In their study, Chesbrough and Bogers [26] reviewed the growth, scope, and impact of OI research as noted by West and Bogers [25]. In contrast, Lichtenthaler [6] (p. 148) referred to the OI approach as “systematically relying on a firm’s dynamic capabilities of internally and externally carrying out the major technology management tasks, i.e., technology acquisition and technology exploitation, along the innovation process”. All these diverse concepts derived from studies indicate that it is a loosely defined concept, which is dependent on approach or method.
The ETA is a concept used in OI, and it is also known as inbound open innovation. As an inbound open innovation, the ETA is related to the internal use of external knowledge. Various practices, such as acquiring a technology on market basis, engaging in crowd sourcing, innovation contest, forming a joint venture, engaging in research and development alliances, licensing technology from a university, and participating in broad networks to coordinate innovative activity, all fall by definition under the category of inbound open innovation [25,27,28]. The ETA strategy enables organizations to benefit from the new technologies through integration with stakeholders and external sources that could improve the organizations’ innovativeness.
Previous studies, such as Spithoven et al. [7], Tsai et al. [29], Inauen and Schenker-Wicki [30], Ardito et al. [31], and Wang et al. [32], have investigated OI strategies by focusing on the inbound OI strategies. It appears that inbound OI was seen as one of the key drivers for organizations’ innovation, which can allow organizations to access a variety of knowledge, technologies, and ideas from external parties [32]. Acquiring knowledge from external sources, such as research entities, customers, and suppliers, can support internal knowledge creation and improve the innovation performance of the firm. Considering the benefits, previous studies have specifically investigated the inbound open innovation strategies, such as broad external knowledge search benefits and their impact on innovation performance (e.g., [33]). Some other studies investigated the impact of specific knowledge sources, such as customers and universities on firms’ innovation capabilities [34,35]. However, in an organizational context, the inbound open innovation strategy, such as external technology acquisition (ETA), is often viewed as double-edged sword [36]. This is because when organizations possess limited resources, spending for acquiring external technology may affect the firms’ internal research and development budgets, which might slow down the innovation and negatively affect the firms’ competitive advantage in a long run [37,38]. Therefore, these divergent views on ETA build the motivation for this study. In order to get better understanding on the role of ETA on firms’ innovation, this study investigates the impact of ETA on innovation performance.
Another OI strategy is the ETE, also known as outbound open innovation, which is a firm’s purposeful exploiting of technological knowledge outside of its boundary [10]. The ETE allows organizations to co-exploit or to commercialize technological knowledge with external parties or other independent organizations [39,40] so as to gain profits from making their technological assets available to outside parties. In addition, it may enable organizations to develop valuable technologies along with external partners [24,39]. Exploiting technology with the external parties can provide organizations with both financial and strategic benefits [6,10,24,30]. From the financial perspective, firms can enjoy monetary benefits through annual licensing of the internal technologies to other firms [3], and subsequently the licensing income can be used to support the internal research and development and improve the innovation performance of the firm. For strategic benefits, firms who sell their underused technologies to other firms can now focus on developing their core capabilities that could help them to perform well and improve their innovation [10]. This shows ETE can impact the innovation performance of the firm in a positive way. However, not many studies have investigated the impact of ETE on innovation performance. Therefore, this study intends to investigate this relationship.
Furthermore, most past studies [7,29,32] tend to focus on ETA (i.e., inbound OI) while research on ETE (i.e., outbound OI) has received scant attention [10,14,41,42]. In addition, not many studies have investigated the OI processes, such as the impact of the ETA and ETE on the performance of firms’ innovations in the context of Malaysia. Therefore, it would be interesting to investigate this relationship among Malaysian organizations. Hence, the following hypotheses were formulated:
Hypothesis 1 (H1).
ETA has significant relationship with innovation performance.
Hypothesis 2 (H2).
ETE has significant relationship with innovation performance.

2.2. Technology Scouting through Social Media

Market demand and technological advancements are two important elements that determine the success of any innovation [43,44]. Therefore, it is important for organizations to observe current technological trends so as to be able to identify the new technologies that could facilitate the organizations’ innovations. This can be achieved through technology scouting, which is part of the OI process. Technology scouting is an internal search or scanning function that is related to the systematic assessing and observing of technology trends so as to detect opportunities and to address threats in a timely manner [11,15]. Technology scouting characterizes an innovation process whereby external actors are involved as sources for ideas, new and crucial knowledge, technical solutions and acquisitions, or even discovery opportunities [32]. Firms engaged in inbound open innovation actively use platforms such as social media or Web 2.0 technologies to search for an external knowledge pool that is available outside the firm [25]. Social media can help to promote interactions, knowledge sharing, collaborations, and connections outside the organization with partners, suppliers, and customers. International firms such as Nike and Adobe have successfully used social media for various new product development projects. Social media has helped them to gather knowledge on market trends, new product features, technical know-how, and breakthrough concepts, which supported the firms’ product innovation [45].
Technology scouting through social media is based on the knowledge-based view (KBV), which builds and extends on the resource-based view (RBV) theory that emphasizes the optimization of knowledge and organizational learning that can efficiently develop innovation [44,46]. The KBV advocates the implementation of best practices and continuous improvements [47]. This implies that the management of knowledge provides the most strategically important resource that is at the firm’s disposal [48,49] for enhancing firm innovation performance [50]. This study focuses on technology knowledge, which is business-relevant knowledge that a new venture possesses with regards to its products, technologies, and processes [51]. Technology knowledge is a critical resource for firm performance [52] because any lack of technology knowledge can negatively affect the organization’s performance level [44,53]. The lack of technology knowledge also impacts on the organization’s growth [53], and this means that knowledge acquisition has critical implications for organizations’ achievements in performance and innovation [54]. Therefore, in order to gather technology knowledge, social media can play a major role in searching for technical know-how and solution knowledge [45]. Today’s social media has the potential of generating a huge amount of knowledge, which can be utilized by organizations to support their innovation process. Social media can help organizations to scout for appropriate technologies, ideas, and knowledge from external sources, which could support the organization’s innovations. Yet, despite the tremendous benefits of social media on organizational processes, not many researches have been conducted to examine the social media’s impact on innovation [55]. Furthermore, research investigating organizations’ use of social media for technology scouting under the open innovation perspective is also very limited. [56,57]. Therefore, in order to fill up these gaps, this research intends to investigate the impact of technology scouting through social media on innovation performance of the firm. Thus, the following hypothesis is formulated:
Hypothesis 3 (H3).
Technology scouting through social media has significant relationship with innovation performance.

2.3. Digitalization Vision

Digital transformation is inevitable, so organizations must understand how this works and what its trends are like so as to be able to respond to this transition in a timely manner. Doing so allows organizations to stay competitive in the digital world, thereby sustaining themselves. Digital technologies are increasing so rapidly that we see business transactions and human communications shifting from one form to another in a short period of time. This means that digital technology is the way to do business today [17]. Digital technology improves organizations’ innovativeness, besides enhancing customer service. Appropriate use of technology and business model strategy can improve the market growth of the firm [58]. Digital technology develops new business models and enables businesses and customers to move to a higher level of business transactions using online platforms [16,18].
For organizations to digitalize their business operations including the innovation process, it is important that organizations set a clear vision on the role of digitalization. Creating a vision on digitalization and its impact and benefits should be the forefront aim of organizations, and this must be communicated to the employees so as to get them prepared and motivated into accepting digitalization as a process. Doing so ensures the excellent execution and success of the digitalization strategy, which in turn impacts firm productivity, firm innovation, and firm performance.
Organizations can develop visions for themselves and then use the world of digitalization to be the catalyst in moving them closer towards their visions. This means that organizations must formulate their own strategies and guidance [18]. Nonetheless, digitalization may not be welcomed by the older generation of employees, or even old-school customers who are themselves less savvy with technology at the initial stage [59]. In this regard, organizations may need to push harder for the vision to be shared. With a clear vision on digitalization, organizations can get employees to support the vision on a gradual basis, and in no time, the support would be able to help them to implement digitalization, thereby helping them to alleviate the challenges whilst increasing their achievements. This means that organizations and their visions must not only be clear and achievable, they must also be shared with employees, and strategies need to be developed to help these visions be accomplished successfully. A clear vision on digitalization would “smoothen” the introduction, integration, and acceptance rate of new digital tools internally. When employees are better able to understand the importance of switching towards digital services, they are more likely to cooperate and innovate together with the external parties. As such, this would strategically reduce the amount of internal conflict [18,60,61]. Digitalization acceptance among employees would definitely improve productivity as digital technologies ease the knowledge sharing process. It also facilitates teamwork internally among employees and externally with suppliers and customers. Business digitalization can speed up business operations and the innovation process of the organization, such as getting continuous feedback from external parties like suppliers, partners, and customers. This will improve the innovation performance in an effective way. Previous literature proposes that setting clear digitalization vision can improve firms’ innovation [18]; however, this relationship has not been empirically tested. Therefore, this study intends to investigate this relationship by formulating the following hypothesis:
Hypothesis 4 (H4).
Digitalization vision has significant relationship with innovation performance of the organization.

2.4. Innovation and Firm Performance

In order to achieve a competitive advantage, and to improve firm performance, innovation is an important factor [62]. Being innovative means introducing new products and services because of market demands. Moreover, new products and services also appeal to the market, since conventional products can be boring and stifle growth. Innovations are important for business growth and to establish new market opportunities for firms. Today, customers’ expectation on innovative products and services are high; therefore, continuous innovation is the key for firms’ survival and long-term success. Innovation performance is the outcome of the product and the process innovation, which has a relationship with the firm’s economic performance [63,64].
The OI strategies when implemented properly can provide greater benefits to an organization. Previous studies have investigated the effect of OI on organizations; however, the impact of OI on firm performance is not linear but dynamic. For instance, Christensen et al. [65] investigated the dynamics of open innovation from a technology entrepreneur’s perspective and examined the effect of changes in their open innovation strategies as the technology reaches a mature stage. Yun et al. [66] studied the dynamics of social open innovation and developed a dynamic model of social innovation and tested the multidimensional aspects of social enterprises and their values in relationship with different sizes of business and government. Yun et al. [67] further studied the dynamics of open innovation in terms of low, medium, and high balance of three sub-economies, such as market open innovation by Small and Medium Enterprises (SMEs) and start-ups, closed open innovation by big business, and social open innovation. From micro and macro perspective, Yun and Lin [68] developed a micro–macro dynamics open innovation with a quadruple-helix model, which can be useful in the context of the Fourth Industrial Revolution to achieve sustainability of the economy, society, and environment.
Furthermore, considering the importance of innovation performance, previous literature [36,69] had discussed the connection between the innovation performance and the business performance, with several theories explaining this link. Ardito et al. [70] empirically tested the relationship between innovations within three crucial business processes (i.e., production, IT, and logistics) and ambidexterity performance and found significant results. Moreover, the market theory describes the importance of innovation to firm performance. Innovations that are active and rapid enable organizations to achieve greater market shares, which will eventually improve organizational income and profits. However, strategic theories seem to suggest that the greater the amount of knowledge possessed by the innovative organization, the better they can win over competitors, hence enjoying greater improvements in performance [71]. Open innovation strategies support the innovation process and enable firms to frequently release new and innovative products. Being proactive in research and development and improved innovation performance will help the firms to gain the competitive advantage and improve the overall performance. Based on these arguments, the relationship between innovation performance and firm performance is investigated in this study in the context of open innovation. As a result, the following hypothesis was formulated:
Hypothesis 5 (H5).
Innovation performance has significant relationship with firm performance.
Figure 1 shows the research model of this study.

3. Research Methods

The initial list of the Malaysian business firms was retrieved from the Kuala Lumpur Stock Exchange (list of public-listed organizations), and the MSC Malaysian list (list of Multimedia Super Corridor status companies). All these firms were either government-based or government-supported institutions, hence they were more credible, and data tended to be accurate. Firms with reachable contact details were then shortlisted. These firms were then contacted through the telephone. The background of the study was explained and their cooperation to participate in the survey was sought. Consent was then provided by 580 firms, and the same number of questionnaires were then distributed through emails or post. The respective research and development managers or the senior managers of the firms were then requested to complete the questionnaire because they were deemed to be more knowledgeable about their firm’s strategic choices and performance measurements. After two reminders, only 153 completed questionnaires were retrieved, showing a response rate of 26%.

Measures

The questionnaire and the 24 items listed were developed based on several studies [10,18,36,69,72]. A detailed description of the questionnaire items is presented in Appendix A. The questionnaire consists of 10 items for the open innovation strategies (ETA and ETE), adapted from Hung and Chow [10]. The technology scouting mechanism of the social media variable consists of three items. The measures were adapted from Van De Vrande et al. [72]. The component on digitalization vision consists of five items. The innovation performance variable consists of six items. These were adapted from Jiménez-Jiménez and Sanz-Valle [36], while the firm performance variable consists of five items, which were adapted from Niemand et al. [18] and Rangus and Slavac [69]. The measures for all the variables were evaluated using a five-point Likert scale. Two additional variables were added—organization size, which was measured in terms of the number of employees, and industry, which was measured in terms of different types of industries. Both were used as the control variable for this study.

4. Data Analysis and Results

The 153 firms involved in this study comprised small, medium, and large companies. About 45.6% of responses were from small and medium size organizations with less than 200 employees. Responses from organizations employing 200 to 300 employees were only 8.1%, whereas organizations with 300 to 400 employees were 4.7%. Responses from organizations with 400 to 500 employees were 6.0%. Nearly 35.6% of the responses were from organizations with more than 500 employees.
Most of the firms involved in the survey had been established for a long period of time. About 51.0% of the organizations had been in operation for more than 20 years, 17.2% had been in operation from 5 to 10 years, 15.2% had been in operation from 10 to 15 years, and 8.6% had been in operation from 15 to 20 years. Furthermore, the result also showed that the majority or 83% of the organizations that participated in this study were from the service industry, and 17% were from the manufacturing sector.
Additionally, the number of years of experience of the managers representing those organizations was also measured. Slightly more than a quarter or 27.5% had more than 15 years of working experience with their current organizations, 25.5% reported 5 to 10 years of experience, 20.9% reported 10 to 15 years of experience, 22.2% reported 1 to 5 years of experience, and 3.0% reported having less than a year’s working experience with their organizations. The result shows most of the respondents had been working with the organization for a longer period and were in a managerial position. Therefore, they were able to provide valuable responses to the study. This study used the PLS-SEM technique to test the hypothesis. The PLS is considered more appropriate and accurate when non-convergent or improper results were likely to occur [73]. The Smartpls 3.0 software, which was based on the PLS, was also used to assess the measurement and the structural model of this study.
Analysis for this study was performed in two stages. In stage 1, the measurement model was assessed, and in stage 2, the structural model was assessed, where the hypothesis was tested. For the assessment of the measurement model, the convergent validity and discriminant validity were tested. Convergent validity was assessed by examining the outer loadings, composite reliability, and average variance extracted. If all the items’ outer loadings were above 0.708 [74], then the items were deemed reliable. The results of this assessment showed the outer loadings of most of the items were above the threshold value (Table 1) except for three items. First, the ETA item (OI5), “We tend to build greater ties with external parties and rely on their innovation”, was observed to carry a low loading of 0.044, hence it was removed. Second, the ETE item (OI10), “We seldom co-exploit technology with external organization”, was observed to carry a low factor loading of 0.361, hence it was also removed. The third was one of the firm performance items (FP2) which was observed to carry a loading of 0.454. Instead of being removed, this item was retained in the study because removing this item would not increase the Average Variance Extracted (AVE), or the composite reliability of the variable. Investigation of the composite reliability showed that all the variables were reliable, with values greater than 0.8. There, the AVE value was also greater than 0.5 (see Table 1).
The heterotrait–monotrait ratio (HTMT) criteria was used to measure the discriminant validity, where the reading should be smaller than the monotrait correlations. This means that the HTMT ratio should be below 1.0 [75]. Following this, the discriminant validity between a given pair of reflective constructs was also established. Table 2 shows all the correlations between the variables in the study were below 1.0. Garson [75] stated that at a minimum, no indicator variable should have higher correlations with another latent variable unless it is its own latent variable. Appendix B highlights that all the indicators (as shown in bold) have higher loadings with their own latent variable. Therefore, discriminant validity was achieved.
One of the criteria used for assessing the structural model was based on the R2 of the endogenous latent values. In this study, the result showed that the R2 value of firm performance was 0.72; this is considered as substantial. The R2 value for innovation performance was 0.47; this is considered as moderate. Next, the path coefficient values were examined to evaluate the relationship between the variables. The values close to +1 represent a strong positive relationship, and the values close to −1 represent a strong negative relationship. Figure 2 shows the R2, path coefficients, and t-values.
The results further showed that the path coefficient between innovation performance and firm performance (0.846) had a strong relationship. The path coefficients between the independent variables and innovation performance were noted as follows: Digitalization Vision (0.297), Technology Scouting through social media (0.242), ETA (0.005), and ETE (0.197). Among the path coefficient values, the ETA (0.005) seemed to have a low value and a weak relationship with innovation performance. In order to check the significance of the relationships, the t-values were examined using the bootstrapping technique. The results showed that digitalization vision, technology scouting through social media, and the ETE had a significant relationship with innovation performance; the t-value was greater than 1.96. Innovation performance also had a significant relationship with firm performance; the t-value was greater than 2.58. However, the relationship between the ETA and innovation performance was not significant; the t-value was less than 1.96. Table 3 illustrates the results of the hypotheses testing.

Control Variables

The responses for this study were retrieved from 153 firms operating under various industries, but mainly the service and manufacturing industry. The firms were also of different sizes and different numbers of years of operation. Based on this, it was thus important to investigate the variation that may exist in the research output while controlling for the variables, such as industry and organization size. Three models, namely a full model (model including the control variable), a theoretical model (original model excluding the control variable), and the control model (only the control variables), were examined and compared so as to investigate the power of the theoretical model in explaining the variance of the dependent variable (firm performance). The comparative analysis is shown in Table 4. It highlights the differences between the full model and the control model. It also shows that the full model was able to explain the substantive incremental variance of (72.1% − 5.6%) = 66.5%. In comparison, the difference between the full model and the theoretical model was in the variance of (72.1% − 71.6%) = 0.5%. This showed that the difference was very small. Based on this, it can be concluded that the theoretical model of this study was substantive in explaining the variance in the dependent variable.
Table 4 also shows the path coefficient values for the variables in the three models: The full, the theoretical, and the control model. The R2 value for the dependent variable (firm performance) was given in all the three cases. The results of the path coefficients for the independent variables (ETA, ETE, TSS, DV, and IP) were similar. This implies that there was not much difference between the full and the theoretical model. In this regard, the theoretical model was substantive in explaining the variance of firm performance.

5. Discussion and Conclusions

5.1. The Difference of Role Between ETA and ETE from the Perspective of Open Innovation Dynamics

This study has examined the role of open innovation strategies (ETA and ETE), technology scouting through social media, and digitalization vision on firm innovation and firm performance. The data for the study were collected from 153 Malaysian firms, which were composed of small, medium, and large organizations. In the current study, the investigation of ETA and ETE yielded different results. The result of the ETA with innovation performance showed a non-significant result. It is possible that the following scenario is the cause. In the context of developing countries like Malaysia, most organizations suffer due to poor financial resources. Previous research also found that firms in the Malaysian capital market are, in general, financially constrained [76]. Therefore, this financial constrain might restrict their investment in external technologies to support their innovation activities. Moreover, in Malaysia, nearly 98.5% of the business establishments are SMEs (SME Corporation Malaysia). SMEs are evidently hindered by their financial resources [77]; therefore, they are unable to acquire the technological support from external parties in improving their innovation. Thus, this situation was reflected in our study, showing a non-significant relationship between ETA and innovation performance. To a certain extent, the result is also consistent with the Kang et al. [78] study, where the authors found that heavy reliance on external technology acquisition becomes disadvantageous in terms of technological competences and affects the performance. Although there was no significant relationship between the ETA and innovation performance, the relationship between the ETE and innovation performance was supported. The result on ETE is consisted with the previous studies [10,79]. By sharing the existing technological assets, out-licensing, and collaborating with outside parties, organizations in Malaysia tend to have higher possibilities of gaining monetary benefits, in addition to the ease and tendency of accelerating their innovation performance. This may be the cause of the positive relationship.

5.2. The Role of Social Media and Digitalization on Firms’ Innovation

Apart from the OI strategies uncovered, this study found that technology scouting on social media had a positive impact on innovation performance. This result is consistent with Parida et al. [15]. This outcome showed that firms in Malaysia can use social media to acquire knowledge about new technologies and use in their innovation process, which improves the organizations’ innovation performance.
Previous study [18] investigated the relationship between digitalization vision and firm performance, but they found non-significant results. Thus, Niemand et al. [18] highlighted that the level of digitalization did not affect profitability directly. Instead, they proposed that a clear vision on digitalization developed by firms that can facilitate innovation, keep them ahead of competition, and increase their willingness to take risks. Likewise, this was revealed in the current study where a firm’s digitalization vision was observed to have a positive significant relationship with a firm’s innovation performance. Finally, the results of this study also showed that there was a strong relationship between innovation performance and firm performance and the result is consistent with previous study [80]. This clearly showed that firms’ successful innovation performance could enable the firms to achieve greater market share, which in turn improves firm performance.

5.3. Theoretical Contribution

This study contributes to the existing literature by investigating the impact of the ETA and ETE on innovation performance, which in turn improves firm performance. The integrated model of this study included the strategy aspect, firm innovativeness and firm performance, and the outcome provided an in-depth insight on the effectiveness of open innovation strategies in organizations. Apart from investigating the effect of the OI strategy on firm performance, the main theoretical contribution of this study lies in the inclusion of technology scouting through social media and digitalization vision variable in the study. Social media allows firms to collect the necessary information and knowledge to observe the latest trends about new technologies that meet the organization’s needs, hence supporting firm innovations. Even though social media can be a powerful tool for technology scouting, not many studies have been conducted in the context of open innovation.
Previous studies have also not explored the impact of digitalization vision on firm innovations. From this study, it appears that when firms have a clear vision on digitalization and they communicate this throughout the organization, business operations can be speeded up, thereby improving their innovation performance. Taking into consideration the advancement of today’s technology, it is advisable that firms include these two variables—technology scouting through social media and digitalization vision—in their open innovation strategies to achieve greater results and improved performance levels. In this regard, the current study contributes to the body of the literature on open innovation.

5.4. Practical Contribution

This study has practical contributions in terms of providing guidance and understanding to firm managers with regards to the importance of OI strategies (ETA and ETE) and how these help firms to improve their performance. Since enhancing firms’ innovation is one of the main focuses of the Malaysian government’s Eleventh Malaysia Plan (11MP), the findings of the current study should be able to create awareness among Malaysian firms on whether focusing on OI strategies could help them in improving their innovation and performance. The result of this study also provides useful information for organization leaders on the impact of OI strategies on innovation performance, and their subsequent impact on firm performance. This study also highlights that for a developing country like Malaysia with more SMEs, the ETE can provide greater benefits and play a significant role on innovation performance. In contrast, the ETA does not have a significant impact on innovation performance. Due to the financial constraints faced by Malaysian firms, it would seem that external technology acquisitions would be a challenge. Hence, its impact on innovation performance was not significant. Nonetheless, this study clearly highlights that organizations can make use of less expensive channels, such as social media, for technology scouting activities, which can improve innovation of the business. Similarly, digitalization of business operations can lead to greater innovations. Therefore, firm managers should consider developing a clear digitalization vision so as to improve their innovation performance.

5.5. Limitation and Future Recommendation

Similar to other studies, the current study also carries some limitations, which can be seen as a direction for future studies. First of all, in terms of sampling, data were extracted from firms of different sizes. This means that the OI impact on performance as realized by large organizations may be different when compared to SMEs or small organizations. Nevertheless, the control analysis conducted in this study showed that the results obtained, after controlling for firm size, did not reveal any change in the findings of the study. In this regard, future studies may choose to concentrate on either large organizations or SMEs specifically, so as to study the impact of open innovation strategies on innovation and firm performance in detail. Secondly, this study examined the impact of technology scouting through social media and digitalization vision on innovation performance. Future studies may consider studying the moderating roles of these variables and how these affect the relationship between the ETA, ETE, and innovation performance.

Author Contributions

Conceptualization, A.S.; funding acquisition, F.P.T.; investigation, F.P.T., N.I.J. and A.S.; methodology, N.I.J.; project administration, F.P.T.; writing—original draft, F.P.T.; writing—review & editing, N.I.J. and A.S.

Funding

This research was funded by University of Malaya; grant number BK071-2017.

Acknowledgments

The authors greatly acknowledge the managers of the Malaysian organizations for their support and participation in the study.

Conflicts of Interest

The author declares no conflict of interest.

Appendix A

Table A1. Questionnaire items.
NoVariablesItems
1External Technology Acquisition (ETA)
(1—“strongly disagree” to 5—“strongly agree”)
O1. We often acquire technological knowledge from outside for our use
O2. We regularly search for external ideas that may create value for us
O3. We have a sound system to search for and acquire external technology and intellectual property
O4. We proactively reach out to external parties for better technological knowledge or products
O5 We tend to build greater ties with external parties and rely on their innovation *
2External Technology Exploitation (ETE)
(1—“strongly disagree” to 5—“strongly agree”)
O6. We are proactive in managing outward knowledge flow
O7. We make it a formal practice to sell technological knowledge and intellectual property in the market
O8. We have a dedicated unit to commercialize knowledge assets
O9. We welcome others to purchase and use our technological knowledge or intellectual property
O10. We seldom co-exploit technology with external organizations *
3Technology Scouting on Social Media
(1—“Not at all” to 5—“To a great extent”).
TSS1. Use social media to observe technology trends
TSS2. Use social media to collect deep information about your industry
TSS3. View ideas and knowledge gathered from social media as important
4Digitalization Vision
(1—“Does not fit at all” to 5—“Fit Perfectly”)
My organization
DIGV1. Has a clear vision to stay competitive in the next 5-10 years with respect to digital strategy
DIGV2. Has a clearly defined digital strategy
DIGV3. Has implemented digital strategy in all business units
DIGV4. Has evaluated and adapted digital strategy steadily
DIGV5. Established new business models based on your digital
Technologies
5Innovation Performance
(1—“Much worse than competitors” to 5—“Much better than competitors”)
INNPER1. The number of new products/services launched
INNPER2. Pioneering the introduction of new products/services (you were one of the first to introduce a new product/service)
INNPER3. The effort invested in the development of new products/services, taking into consideration the number of hours, people, teams and trainings
INNPER4. The number of introduced changes in processes
INNPER5. Pioneering newly introduced processes (you’ve been one of the first to introduce new processes)
INNPER6. Responding to new processes introduced by other companies in your field
6Firm Performance
(1—“Much worse than competitors” to 5—“Much better than competitors”)
FP1. Sales growth
FP2. Profit growth
FP3. Increase in the number of new employees
FP4. Increase in Market share
FP5. Improvement in Competing for the position
* indicates items deleted from analysis.

Appendix B

Table A2. Cross loadings.
DIGVETAETEFIRMPINNPERTSS
FP20.2470.0570.0850.4540.3750.136
FP30.4790.3810.3740.8480.7050.401
FP40.5140.2970.3510.9150.7590.444
FP50.5620.3790.3590.8770.7510.544
FP10.5490.2880.3390.9030.7860.483
INNPER10.5710.3690.3300.7370.8300.465
INNPER20.5080.3310.3210.7120.8470.420
INNPER30.5290.3450.3530.7040.8560.437
INNPER40.4970.2700.3510.7030.8480.483
INNPER50.5110.3060.4270.7230.8440.531
INNPER60.5370.2550.3780.6930.8250.505
OI10.2910.8400.4880.3020.2890.219
OI10−0.0340.1740.3610.0560.1190.071
OI20.3210.8130.5350.2770.2860.278
OI30.2980.7660.6150.3030.3050.247
OI40.3460.8040.5120.2850.3160.324
OI60.3340.6270.8440.3940.4470.312
OI70.3330.5200.8750.3420.3730.276
OI80.3500.5920.8580.3270.3340.325
OI90.2660.5290.8090.2420.2610.255
DIGV10.8670.4150.3130.5110.5160.611
DIGV20.9450.3710.3160.5330.5630.560
DIGV30.9040.3050.2960.5010.5400.536
DIGV40.9540.3710.3630.5600.6030.601
DIGV50.9250.3410.3870.6030.6360.606
TSS10.5940.3440.3000.4850.5250.920
TSS20.5330.3130.3360.4660.4820.884
TSS30.5920.2490.2970.4500.5210.912

References

  1. Economic Planning Unit. Eleventh Malaysia Plan (2016–2020); Prime Minister’s Department: Kuala Lumpur, Malaysia, 2015. Available online: http://www.sarawakdga.org.my/wp-content/uploads/2015/09/11th_Malaysian_Plan.pdf (accessed on 7 May 2019).
  2. Nafi, S.N.M.; Yusoff, R.Z.; Sam, T.L.; Saad, R. Open Innovation Among SMEs in Malaysia: The Issue of Trust. Int. Acad. Res. J. Bus. Technol. 2015, 1, 165–174. [Google Scholar]
  3. Chesbrough, H.W. Open Innovation: The New Imperative for Creating and Profiting from Technology; Harvard Business School Press: Boston, MA, USA, 2003. [Google Scholar]
  4. Conboy, K.; Morgan, L. Beyond the customer: Opening the agile systems development process. Inf. Softw. Technol. 2011, 53, 535–542. [Google Scholar] [CrossRef]
  5. Chesbrough, H.; Crowther, A. Beyond high tech: Early adopters of open innovation in other industries. R D Manag. 2006, 36, 229–236. [Google Scholar] [CrossRef]
  6. Lichtenthaler, U. Open Innovation in Practice: An Analysis of Strategic Approaches to Technology Transactions. IEEE Trans. Eng. Manag. 2008, 55, 148–157. [Google Scholar] [CrossRef]
  7. Spithoven, A.; Clarysse, B.; Knockaert, M. Building absorptive capacity to organise inbound open innovation in traditional industries. Technovation 2010, 30, 130–141. [Google Scholar] [CrossRef]
  8. Arora, A.; Fosfuri, A.; Gambardella, A. Markets for Technology and Corporate Strategy. In Economics, Law and Intellectual Property; Springer: Boston, MA, USA, 2003; pp. 77–108. [Google Scholar]
  9. Arora, A.; Fosfuri, A.; Gambardella, A. Markets for Technology: The Economics of Innovation and Corporate Strategy. Acad. Manag. Rev. 2001, 27, 624. [Google Scholar]
  10. Hung, K.; Chou, C. The impact of open innovation on firm performance: The moderating effects of internal R&D and environmental turbulence. Technovation 2013, 33, 368–380. [Google Scholar]
  11. Bianchi, M.; Campodall’Orto, S.; Frattini, F.; Vercesi, P. Enabling open innovation in small-and medium-sized enterprises: How to find alternative applications for your technologies. R D Manag. 2010, 40, 414–431. [Google Scholar] [CrossRef]
  12. Katila, R. New Product Search Over Time: Past Ideas in Their Prime? Acad. Manag. J. 2002, 45, 995–1010. [Google Scholar] [CrossRef]
  13. Laursen, K.; Salter, A. Open for innovation: The role of openness in explaining innovation performance among U.K. manufacturing firms. Strateg. Manag. J. 2006, 27, 131–150. [Google Scholar] [CrossRef]
  14. Lichtenthaler, U. Outbound open innovation and its effect on firm performance: Examining environmental influences. R D Manag. 2009, 39, 317–330. [Google Scholar] [CrossRef]
  15. Parida, V.; Westerberg, M.; Frishammar, J. Inbound Open Innovation Activities in High-Tech SMEs: The Impact on Innovation Performance. J. Small Bus. Manag. 2012, 50, 283–309. [Google Scholar] [CrossRef] [Green Version]
  16. Granados, N.; Gupta, A.J.; Kauffman, R. The Impact of IT on Market Information and Transparency: A Unified Theoretical Framework. J. Assoc. Inf. Syst. 2006, 7, 148–178. [Google Scholar] [CrossRef]
  17. Setia, P.; Venkatesh, V.; Joglekar, S. Leveraging Digital Technologies: How Information Quality Leads to Localized Capabilities and Customer Service Performance. MIS Q. 2013, 37, 565–590. [Google Scholar] [CrossRef] [Green Version]
  18. Niemand, T.; Rigtering, C.; Kallmünzer, A.; Kraus, S.; Matijas, S. Entrepreneurial Orientation and Digitalization in the Financial Service Industry: A Contingency Approach. In Proceedings of the 25th European Conference on Information Systems (ECIS), Guimarães, Portugal, 5–10 June 2017; pp. 1081–1096. [Google Scholar]
  19. Sisodiya, S.; Johnson, J.; Grégoire, Y. Inbound open innovation for enhanced performance: Enablers and opportunities. Ind. Mark. Manag. 2013, 42, 836–849. [Google Scholar] [CrossRef]
  20. Dahlander, L.; Gann, D. How open is innovation? Res. Policy 2010, 39, 699–709. [Google Scholar] [CrossRef]
  21. Huizingh, E. Open innovation: State of the art and future perspectives. Technovation 2011, 31, 2–9. [Google Scholar] [CrossRef]
  22. Schroll, A.; Mild, A. A critical review of empirical research on open innovation adoption. J. für Betr. 2012, 62, 85–118. [Google Scholar] [CrossRef]
  23. Hossain, M. Open innovation: So far and a way forward. World J. Sci. Technol. Sustain. Dev. 2013, 10, 30–41. [Google Scholar] [CrossRef]
  24. Chesbrough, H.; Vanhaverbeke, W.; West, J. Open Innovation: Researching a New Paradigm; Oxford University Press: Oxford, UK, 2006. [Google Scholar]
  25. West, J.; Bogers, M. Leveraging External Sources of Innovation: A Review of Research on Open Innovation. J. Prod. Innov. Manag. 2014, 31, 814–831. [Google Scholar] [CrossRef]
  26. Chesbrough, H.; Bogers, M. Explicating open innovation: Clarifying an emerging paradigm for understanding innovation. In New Frontiers in Open Innovation; Oxford University Press: Oxford, UK, 2014; pp. 3–28. [Google Scholar]
  27. Petroni, G.; Venturini, K.; Verbano, C. Open innovation and new issues in R&D organization and personnel management. Int. J. Hum. Resour. Manag. 2011, 23, 147–173. [Google Scholar]
  28. Saebi, T.; Foss, N. Business models for open innovation: Matching heterogeneous open innovation strategies with business model dimensions. Eur. Manag. J. 2015, 33, 201–213. [Google Scholar] [CrossRef] [Green Version]
  29. Tsai, K.; Hsieh, M.; Hultink, E. External technology acquisition and product innovativeness: The moderating roles of R&D investment and configurational context. J. Eng. Technol. Manag. 2011, 28, 184–200. [Google Scholar]
  30. Inauen, M.; Schenker-Wicki, A. The impact of outside-in open innovation on innovation performance. Eur. J. Innov. Manag. 2011, 14, 496–520. [Google Scholar] [CrossRef]
  31. Ardito, L.; Besson, E.; Petruzzelli, A.; Gregori, G. The influence of production, IT, and logistics process innovations on ambidexterity performance. Bus. Process Manag. J. 2018, 24, 1271–1284. [Google Scholar] [CrossRef]
  32. Wang, C.; Chang, C.; Shen, G. The effect of inbound open innovation on firm performance: Evidence from high-tech industry. Technol. Forecast. Soc. Chang. 2015, 99, 222–230. [Google Scholar] [CrossRef]
  33. Ardito, L.; Messeni Petruzzelli, A. Breadth of external knowledge sourcing and product innovation: The moderating role of strategic human resource practices. Eur. Manag. J. 2017, 35, 261–272. [Google Scholar] [CrossRef]
  34. Abdel Aziz, H.; Rizkallah, A. Effect of organizational factors on employees’ generation of innovative ideas. EuroMed J. Bus. 2015, 10, 134–146. [Google Scholar] [CrossRef]
  35. Cruz-González, J.; López-Sáez, P.; Navas-López, J. Absorbing knowledge from supply-chain, industry and science: The distinct moderating role of formal liaison devices on new product development and novelty. Ind. Mark. Manag. 2015, 47, 75–85. [Google Scholar] [CrossRef]
  36. Jiménez-Jiménez, D.; Sanz-Valle, R. Innovation, organizational learning, and performance. J. Bus. Res. 2011, 64, 408–417. [Google Scholar] [CrossRef]
  37. Quinn, J. The Intelligent Enterprise: A Knowledge and Service Based Paradigm for Industry; Free Press: New York, NY, USA, 1992. [Google Scholar]
  38. Sen, F.; Rubenstein, A. External Technology and In-House R&D’s Facilitative Role. J. Prod. Innov. Manag. 1989, 6, 123–138. [Google Scholar]
  39. Chesbrough, H.; Garman, A. How open innovation can help you cope in lean times. Harv. Bus. Rev. 2009, 87, 68–76. [Google Scholar] [CrossRef] [PubMed]
  40. Mention, A. Co-operation and co-opetition as open innovation practices in the service sector: Which influence on innovation novelty? Technovation 2011, 31, 44–53. [Google Scholar] [CrossRef]
  41. Chiaroni, D.; Chiesa, V.; Frattini, F. The Open Innovation Journey: How firms dynamically implement the emerging innovation management paradigm. Technovation 2011, 31, 34–43. [Google Scholar] [CrossRef]
  42. Lichtenthaler, U. Technology exploitation in the context of open innovation: Finding the right ‘job’ for your technology. Technovation 2010, 30, 429–435. [Google Scholar] [CrossRef]
  43. Cai, S.; Jun, M.; Yang, Z. Implementing supply chain information integration in China: The role of institutional forces and trust⋆. J. Oper. Manag. 2010, 28, 257–268. [Google Scholar] [CrossRef]
  44. Nguyen, B.; Yu, X.; Melewar, T.; Chen, J. Brand innovation and social media: Knowledge acquisition from social media, market orientation, and the moderating role of social media strategic capability. Ind. Mark. Manag. 2015, 51, 11–25. [Google Scholar] [CrossRef] [Green Version]
  45. Du, S.; Yalcinkaya, G.; Bstieler, L. Sustainability, Social Media Driven Open Innovation, and New Product Development Performance*. J. Prod. Innov. Manag. 2016, 33, 55–71. [Google Scholar] [CrossRef]
  46. Duan, L.; Xu, L. Business Intelligence for Enterprise Systems: A Survey. IEEE Trans. Ind. Inform. 2012, 8, 679–687. [Google Scholar] [CrossRef]
  47. Marsh, S.; Stock, G. Creating Dynamic Capability: The Role of Intertemporal Integration, Knowledge Retention, and Interpretation. J. Prod. Innov. Manag. 2006, 23, 422–436. [Google Scholar] [CrossRef]
  48. Berchicci, L. Towards an open R&D system: Internal R&D investment, external knowledge acquisition and innovative performance. Res. Policy 2013, 42, 117–127. [Google Scholar]
  49. Grant, R. Prospering in Dynamically-Competitive Environments: Organizational Capability as Knowledge Integration. Organ. Sci. 1996, 7, 375–387. [Google Scholar] [CrossRef]
  50. Alegre, J.; Sengupta, K.; Lapiedra, R. Knowledge management and innovation performance in a high-tech SMEs industry. Int. Small Bus. J. Res. Entrep. 2013, 31, 454–470. [Google Scholar] [CrossRef]
  51. Burgers, J.; Van Den Bosch, F.; Volberda, H. Why New Business Development Projects Fail: Coping with the Differences of Technological versus Market Knowledge. Long Range Plan. 2008, 41, 55–73. [Google Scholar] [CrossRef] [Green Version]
  52. Conner, K.; Prahalad, C. A Resource-Based Theory of the Firm: Knowledge Versus Opportunism. Organ. Sci. 1996, 7, 477–501. [Google Scholar] [CrossRef]
  53. Li, Y.; Wei, Z.; Liu, Y. Strategic Orientations, Knowledge Acquisition, and Firm Performance: The Perspective of the Vendor in Cross-Border Outsourcing. J. Manag. Stud. 2010, 47, 1457–1482. [Google Scholar] [CrossRef]
  54. Agarwal, R.; Echambadi, R.; Franco, A.; Sarkar, M. Knowledge Transfer Through Inheritance: Spin-Out Generation, Development, and Survival. Acad. Manag. J. 2004, 47, 501–522. [Google Scholar]
  55. Mount, M.; Martinez, M. Social Media: A Tool for Open Innovation. Calif. Manag. Rev. 2014, 56, 124–143. [Google Scholar] [CrossRef]
  56. Michaelides, R.; Morton, S.; Michaelides, Z.; Lyons, A.; Liu, W. Collaboration networks and collaboration tools: A match for SMEs? Int. J. Prod. Res. 2013, 51, 2034–2048. [Google Scholar] [CrossRef]
  57. Mikalef, P.; Pateli, A. Information technology-enabled dynamic capabilities and their indirect effect on competitive performance: Findings from PLS-SEM and fsQCA. J. Bus. Res. 2017, 70, 1–16. [Google Scholar] [CrossRef]
  58. Yun, J.J.; Won, D.; Park, K.; Jeong, E.; Zhao, X. The role of a business model in market growth: The difference between the converted industry and the emerging industry. Technol. Forecast. Soc. Chang. 2019, 146, 534–562. [Google Scholar] [CrossRef]
  59. Holzinger, A.; Searle, G.; Nischelwitzer, A. On some aspects of improving mobile applications for the elderly. In International Conference on Universal Access in Human-Computer Interaction; Stephanidis, C., Ed.; Springer: Beijing, China, 2007; Volume 4554, pp. 923–932. [Google Scholar]
  60. Floyd, S.; Lane, P. Strategizing throughout the Organization: Managing Role Conflict in Strategic Renewal. Acad. Manag. Rev. 2000, 25, 154–177. [Google Scholar] [CrossRef]
  61. Wernham, R. Obstacles to Strategy Implementation in A Nationalized Industry. J. Manag. Stud. 1985, 22, 632–648. [Google Scholar] [CrossRef]
  62. Mansury, M.; Love, J. Innovation, productivity and growth in US business services: A firm-level analysis. Technovation 2008, 28, 52–62. [Google Scholar] [CrossRef] [Green Version]
  63. Archibugi, D.; Planta, M. Measuring technological change through patents and innovation surveys. Technovation 1996, 16, 451–519. [Google Scholar] [CrossRef]
  64. Damanpour, F. Organizational Innovation: A Meta-Analysis of Effects of Determinants and Moderators. Acad. Manag. J. 1991, 34, 555–590. [Google Scholar]
  65. Christensen, J.F.; Olesen, M.H.; Kjær, J.S. The industrial dynamics of Open Innovation—Evidence from the transformation of consumer electronics. Res. Policy 2005, 34, 1533–1549. [Google Scholar] [CrossRef]
  66. Yun, J.J.; Park, K.; Im, C.; Shin, C.; Zhao, X. Dynamics of social enterprises—Shift from social innovation to open innovation. Sci. Technol. Soc. 2017, 22, 425–439. [Google Scholar] [CrossRef]
  67. Yun, J.J.; Won, D.; Park, K. Entrepreneurial cyclical dynamics of open innovation. J. Evol. Econ. 2018, 28, 1151–1174. [Google Scholar] [CrossRef]
  68. Yun, J.J.; Liu, Z. Micro-and Macro-Dynamics of Open Innovation with a Quadruple-Helix Model. Sustainability 2019, 11, 3301. [Google Scholar] [CrossRef] [Green Version]
  69. Rangus, K.; Slavec, A. The interplay of decentralization, employee involvement and absorptive capacity on firms’ innovation and business performance. Technol. Forecast. Soc. Chang. 2017, 120, 195–203. [Google Scholar] [CrossRef]
  70. Ardito, L.; Messeni Petruzzelli, A.; Dezi, L.; Castellano, S. The influence of inbound open innovation on ambidexterity performance: Does it pay to source knowledge from supply chain stakeholders? J. Bus. Res. 2018. in Press. [Google Scholar] [CrossRef]
  71. García-Morales, V.; Jiménez-Barrionuevo, M.; Gutiérrez-Gutiérrez, L. Transformational leadership influence on organizational performance through organizational learning and innovation. J. Bus. Res. 2012, 65, 1040–1050. [Google Scholar] [CrossRef]
  72. Van de Vrande, V.; Lemmens, C.; Vanhaverbeke, W. Choosing governance modes for external technology sourcing. R D Manag. 2006, 36, 347–363. [Google Scholar] [CrossRef]
  73. Krijnen, W.; Dijkstra, T.; Gill, R. Conditions for factor (in) determinacy in factor analysis. Psychometrika 1998, 63, 359–367. [Google Scholar] [CrossRef] [Green Version]
  74. Hair, J.; Ringle, C.; Sarstedt, M. Partial Least Squares Structural Equation Modeling: Rigorous Applications, Better Results and Higher Acceptance. Long Range Plan. 2013, 46, 1–12. [Google Scholar] [CrossRef]
  75. Garson, G. Partial Least Squares: Regression and Structural Equation Models; Statistical Associates Publishers, Associates Blue Book Series; North Carolina State University: Raleigh, NC, USA, 2016. [Google Scholar]
  76. Ismail, M.A.; Ibrahim, M.H.; Yusoff, M.; Zainal, M.P. Financial constraints and firm investment in Malaysia: An investigation of investment-cash flow relationship. Int. J. Econ. Manag. 2010, 41, 29–44. [Google Scholar]
  77. Gunto, M.; Alias, M. SMEs development in Malaysia: Lessons for Libya. Pros. Perkem 2013, 8, 1521–1530. [Google Scholar]
  78. Kang, K.; Jo, G.; Kang, J. External technology acquisition: A double-edged sword. Asian J. Technol. Innov. 2015, 23, 35–52. [Google Scholar] [CrossRef] [Green Version]
  79. Lichtenthaler, U. Absorptive Capacity, Environmental Turbulence, and the Complementarity of Organizational Learning Processes. Acad. Manag. J. 2009, 52, 822–846. [Google Scholar] [CrossRef]
  80. Cui, T.; Ye, H.; Teo, H.; Li, J. Information technology and open innovation: A strategic alignment perspective. Inf. Manag. 2015, 52, 348–358. [Google Scholar] [CrossRef] [Green Version]
Figure 1. Research model.
Joitmc 05 00097 g001
Figure 2. Research model with results.
Joitmc 05 00097 g002
Table 1. Convergent validity.
VariableItemsLoadingsComposite ReliabilityAverage Variance Extracted (AVE)
External Technology Acquisition (ETA)O10.8400.8750.650
O20.813
O30.766
O40.804
External Technology Exploitation (ETE)O60.8440.9060.600
O70.875
O80.858
O90.809
Technology Scouting on Social MediaTSS10.9200.9320.820
TSS20.884
TSS30.912
Digitalization VisionDIGV10.8670.9650.845
DIGV20.945
DIGV30.904
DIGV40.954
DIGV50.925
Innovation PerformanceINNPER10.8300.9360.709
INNPER20.847
INNPER30.856
INNPER40.848
INNPER50.844
INNPER60.825
Firm PerformanceFP10.9030.9060.669
FP20.454
FP30.848
FP40.915
FP50.877
Table 2. Heterotrait–monotrait ratio (HTMT).
DIGVETAETEFPIPTSS
DIGV
ETA0.442
ETE0.3910.778
FP0.6420.4180.410
IP0.6640.4270.4620.943
TSS0.6870.3880.3860.5700.621
Table 3. Results summary.
HypothesisBetaT Statistics (|O/STDEV|)Result
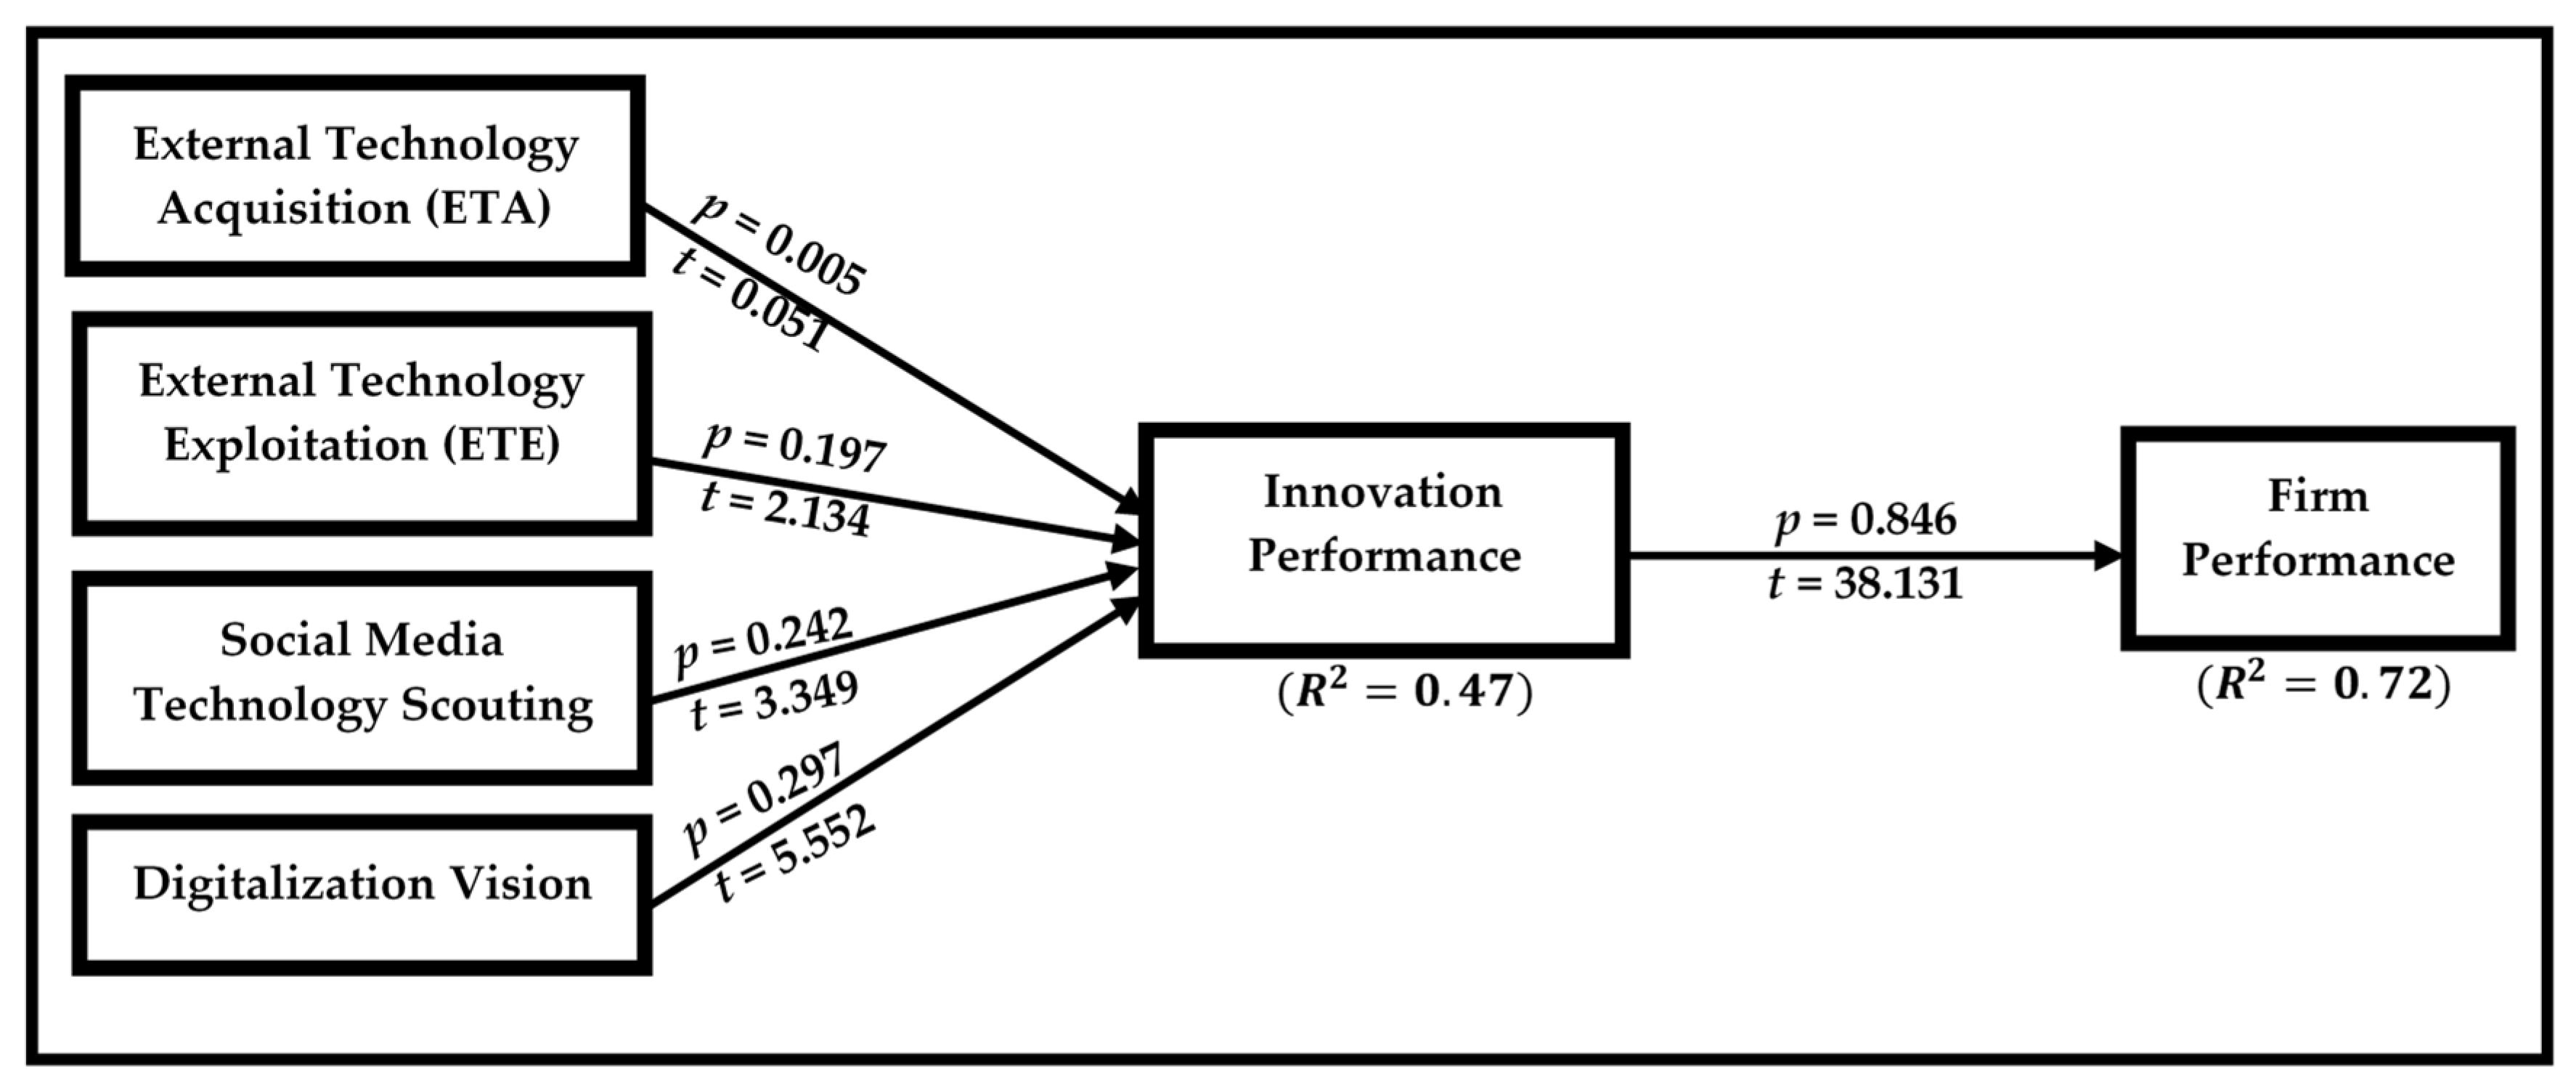
H1: ETA has significant relationship with innovation performance0.0050.051Not Supported
H2: ETE has significant relationship with innovation performance0.1972.134 **Supported
H3: Technology scouting through social media has significant relationship with innovation performance0.2423.349 ***Supported
H4: Digitalization vision has significant relationship with innovation performance of the organization.0.2975.552 ***Supported
H5: Innovation performance has significant relationship with firm performance0.84638.131 ***Supported
*** p < 0.01 (>2.58), ** p < 0.05 (>1.96).
Table 4. Comparisons between full, theoretical, and control model.
VariablesFull ModelTheoretical ModelControl Model
ETA0.0050.005
ETE0.197 **0.197 **
TSS0.242 ***0.242 ***
DV0.397 ***0.397 ***
IP0.842 ***0.842 ***
Industry0.064 0.099
Organization Size0.029 0.222
FP-R272.1%71.6%5.6%
*** p < 0.01 (>2.58), ** p < 0.05 (>1.96).

