Spectral-Kinetic Coupling and Effect of Microfield Rotation on Stark Broadening in Plasmas


Abstract
:
1. Introduction
2. Spectral-Kinetic Coupling

 is the operator of density matrix,
  is the operator of dipole moment,
  is the operator of resolvent,
  is the operator of the linear Stark shift between sublevels of the upper n and lower level n’ in the line space (the direct product of subspaces of the upper and lower energy levels with the principal quantum numbers n and n’),
  is the electron broadening operator, indexes αβ and α’β’ designate quantum states of the upper and lower levels in the bra and ket vectors of the line space, respectively.
3. Ion Dynamics in Statistical and Spectral Characteristics of Stark Profiles
 ,
,  ,
,  ) of the ion electric microfield strength vector and its first and second time derivatives [5,6,7,8,9,12,21,23,24,25,48,67]. The basic idea of Markov construction of these joint distributions is that , and are stochastic independent variables, formed by summation of electric fields or its derivatives over all individual ions of the medium [1,5,6]. So, these probability distribution functions are the many body objects [5,6,7,8,9,12,21,23,24,25,48,67]. However, those joint distributions possess nonzero constraint moments over, for example, microfield time derivatives, the value and direction of electric ion microfield strength vector being fixed [5,6,7,8,9,12,21,23,24,25,48,67]. So, each value of the ion microfield corresponds, for example, in fact to a nonzero “mean” value of the square of its derivative. In other words, it means that by fixing one of the initially independent stochastic variables, the mean values of the other ones become nonzero and functionally dependent on the value of the fixed variable [5,6]. So, the direct correlations between fixed stochastic variables with the moments over the other ones under this condition are evident. Another kind of correlations appears if one considers large values of ion microfields, which are produced by the nearest particle (so called “nearest neighbor approximation”) [5,6,7,8,9,12,21,23,24,25,48,67]. In this case there is a direct proportionality between the value of the ion electric field and its time derivative, where the stochasticity is involved due to another stochastic variable—particle velocity. Indeed, the mean square value of particle velocities is a necessary factor in the second moments over the microfield time derivatives [5,6,7,8,9,12,21,23,24,25,48,67].

 in the case of a Coulomb electric field of point charges is

 designates the mean of the radiator velocity square. The complex ionization composition is accounted for in Equation (4) (note the generalization of the F0 definition). The definitions of the mean values for composition of various ion species “s” with the charges Zs and thermal velocity vi,s are given by the following relations:

 is
is


 and characterize the statistical properties of plasma microfield and play a key role within the idea of thermal corrections to Stark profiles [7,8,9,12,24,25]. The terms proportional to the mean of radiator velocity square in Equations (4) and (6), in square brackets, describe the fluctuations of microfield, induced by the relative thermal motion of the radiator atoms. The other terms, proportional to the mean of radiator velocity square in Equations (4) and (6) besides the factor p are due to the effects of ion-dynamics friction on the radiator motion. As one can see, the latter terms could not be made proportional to the reduced mass of the ion-radiator pair. However, the cases when the influence of the effects of ion-dynamics friction on Stark profiles is significant have not been revealed up to now, since the corresponding deviations of profiles turn out to be small. And indeed, the full scale Molecular Dynamics (MD) simulations confirmed that the effects of ion dynamics could be well described by a so-called “reduced mass” model (RM), where the motion of radiator is neglected for moderately coupled plasma with the ion couplingparameter Γi ≤ 1 [34,61,75]. This greatly facilitates the study of ion dynamics in simulations, since the consistent consideration of radiator motion effects in MD is quite time-consuming. The expressions for the fluctuation rates, Equation (4) and Equation (6), also show that for plasmas with complex ion composition there could be some deviations from the RM model, caused by peculiar distributions of ion charges. As the main precision experiments have, up to now, been conducted for simple charge distributions, the expressions in Equation (5) and Equation (6) could be greatly simplified and the terms, corresponding to the ion friction, could be omitted. Hence the charge distribution is neglected below. and perpendicular components of the ion microfield fluctuations. The general analysis, performed in different approximations [7,8,9,12,24,25], has shown that the ion dynamical perturbations of Stark profiles are controlled by three main mechanisms. The first mechanism is due to the amplitude modulation, induced by the rotation of the atomic dipole along with the rotating ion microfield [12]. Due to the amplitude modulation, the projections of the atomic dipole on the coordinate axis, being at rest, are changing (or “modulated”), while the atomic dipole rotates together with the rotation of the electric microfield strength vector. The second mechanism exists due to the atomic dipole inertia with respect to the microfield rotation, and results in nonadiabatic transitions between states defined in the frame with the quantization axis along the rotating field direction [12]. The third mechanism (historically considered the first) is the phase modulation related to changes in the microfield magnitude [7,8,9,12,24,25]. Only this mechanism was taken into account in the earlier works (in the 1950s) [7,8,9], where the Stark broadening by ions was analyzed in the adiabatic approximation, i.e., only within the framework of phase modulation or frequency Stark shift [21]. As it was demonstrated in the works [24,25] within the approach of thermal corrections, the amplitude modulation gives the largest contribution to the Stark contour deformation due to ion dynamics in the vicinity of the line center. The general ideas of amplitude modulation, non-adiabatic effects and usage of the electron broadening for extending the theory of thermal corrections to the line center were proposed by Gennadii V. Sholin.


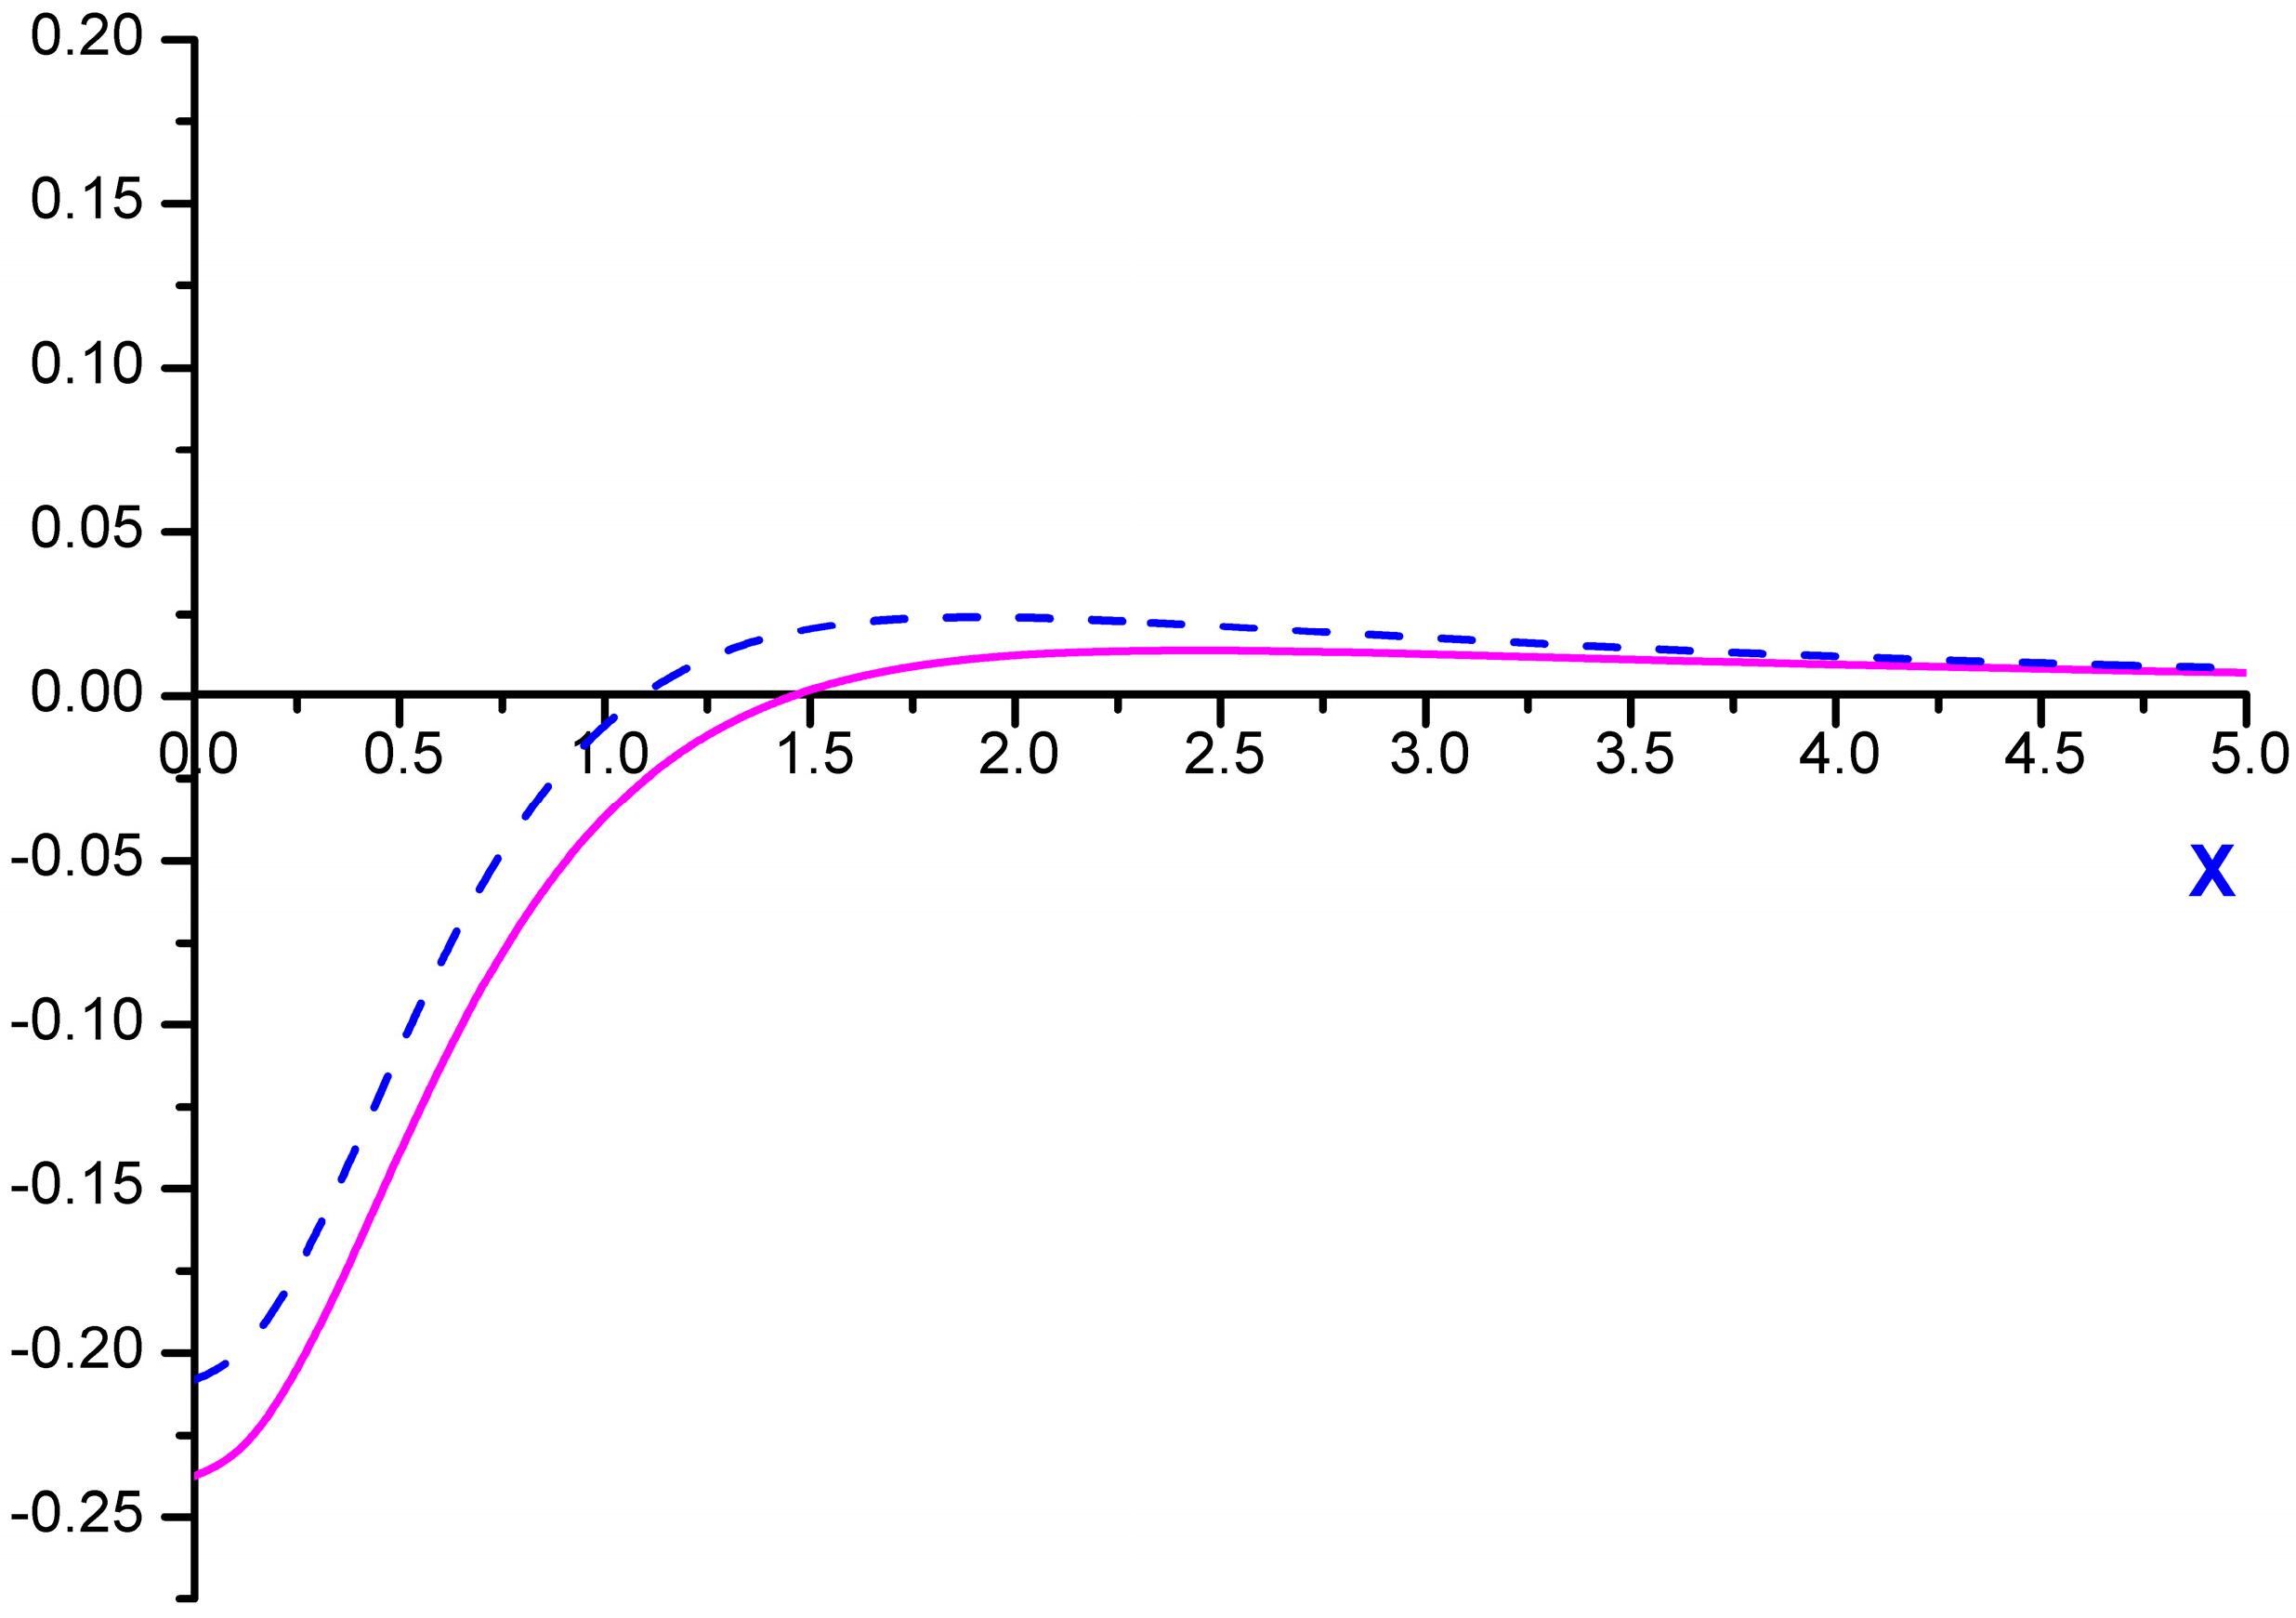
 dimensionless function is introduced (see Figure 1), proportional to the second moment of the microfield time derivative component, perpendicular to the microfield direction according to Equation (4) and defining in fact the mean square of microfield rotation frequency. It is defined in such a way, that M⊥(0) = 1, while the corresponding constant in the limit of β ≪ 1 was included in the definition of the f2−α(x) function. The behavior of f1−α(x) and f2−α(x) is presented in the Figure 2 and Figure 3, respectively. The parameter γ in Equations (9) and (10) is the impact electron width of the central component in the parabolic basis. As it follows from the results of [24,25], the corrections due to the ion dynamics effects are negative in the center of a line with the central components, corresponding to decreasing of the intensity in the line center due to the ion dynamics effects and its increasing in the shoulders (the transient region between approximately the half width and the nearest line wings). As the thermal corrections have perturbative character, functions f1−α(x) and f2−α(x) have zero integrals. So, due to ion dynamics effects, the intensity is redistributed from the line center, increasing the total width of the lines with central Stark components [24,25]. These general features are confirmed below in the next Section 4 using MD simulations (see also [75]), that are believed to be not limited by applicability conditions of the perturbation approach [24,25]. It should be noted that within the approach of [24,25], an exact analytical expression due to the ion-dynamics corrections for Ly-alpha, accounting for the collapse of the lateral Stark components [13,14,15], was also derived [24]. It has a rather complex structure and is not presented here, but the comparison of its functional behavior with the approximation of isolated individual Stark components f2−α(x) is shown in Figure 3.
 , whose value is taken in the pole of resolvent
  , corresponding to the one lateral component. So, remembering that the central component is more intense than the lateral ones, its strong influence on the Ly-alpha Stark shape becomes obvious. Comparing f2−α(x;ε = 0) with f2−α(x;ε = 1) at x = 0, their ratio comes out to be about 1.26 [24]. At first glance, putting ε = 0 in f2−α(x;ε) allows obtaining the limit of isolated Stark components, but it turns out that f2−α(x;ε = 0) ≠ f2−α(x). This means that there is no commutativity in the sequence of performed mathematical operations, since the f2−α(x;ε) function is obtained in the solution of secular problem and inverting the resolvent. It is seen in Figure 3, that the difference between the approximation of isolated components (f2−α(x)) and the exact solution accounting for the collapse effect (f2−α(x;ε = 1)) at x = 0 is noticeably smaller than that between f2−α(0;ε = 1) and f2−α(0;ε = 0), as their ratio f2−α(0;ε = 1)/f2−α(0) is only about ~1.14. Thus this comparison demonstrates an acceptable accuracy of the approximation of isolated individual Stark components [18,19] for calculations of the thermal corrections to the Ly-alpha Stark profile.


 standing beside the terms, obtained due to residue in the various poles, and equate them in fact to the common constant due to the smallness of argument. Then summation of terms due to perturbation expansion leads to more simple formulas, which are expressed as the functions f, and finalized by introduction of some general scales for the Stark constants C and impact widths w. Moreover, the significant simplification of the result also is due to the constant output of the M⊥(z) function in the region near the line center, where its argument is small. Then all the derivatives of M⊥(z) turn out to be zero (or could be considered as higher order terms of expansion), thus one is left only with the derivatives of the dispersion functions in perturbation series (see [24,25]). However, from the principal point of view, it is important that functional behavior of M⊥(z) is proportional to the fluctuation of microfield component perpendicular to the microfield direction in Equations (4) and (10). It could be kept in the final result which would then look more cumbersome in this case than expressions (11) and (12). Indeed, the result would contain the sum of contributions of each Stark component, determined by its values of the electron impact widths and Stark constants, being multiplied by M⊥(z) from the different arguments, as explained just above (see explicit formulas for perturbation expansion, presented in [24,25]).


4. Ion Dynamics Modeling and Statistical-Dynamical Coupling
(t), formed by the ions, were stored, to be used as an input when numerically solving the time-dependent Schrödinger equation of the hydrogen atom.


5. Discussion
6. Conclusions
Acknowledgments
Author Contributions
Conflicts of Interest
References
- Holtsmark, J. Über die Verbreiterung von Spektrallinien. Ann. Phys. (Leipz.) 1919, 58, 577–630. [Google Scholar] [CrossRef]
- Spitzer, L. Stark-Effect broadening of hydrogen lines. I Single encounters. Phys. Rev. 1939, 55, 699–708. [Google Scholar]
- Spitzer, L. II. Observable profiles. Phys. Rev. 1939, 56, 39–47. [Google Scholar] [CrossRef]
- Spitzer, L. Impact broadening of spectral lines. Phys. Rev. 1940, 58, 348–357. [Google Scholar] [CrossRef]
- Chandrasekhar, S.; von Neumann, J. The statistics of gravitational field arising from random distributions of stars. I. The speed of fluctuations. Astrophys. J. 1942, 95, 489–531. [Google Scholar] [CrossRef]
- Chandrasekhar, S.; von Neumann, J. II. The speed of fluctuations; dynamical friction; spatial correlations. Astrophys. J. 1943, 97, 1–27. [Google Scholar] [CrossRef]
- Kogan, V.I. Broadening of Spectral Lines in Hot Plasma. In Plasma Physics and the Problem of Controlled Thermonuclear Reactions; Leontovich, M.A., Ed.; Academy of Science USSR Press: Moscow, Russia, 1958; Volume IV, pp. 259–304. [Google Scholar]
- Kogan, V.I. Broadening of Spectral Lines in Hot Plasma. In Plasma Physics and the Problem of Controlled Thermonuclear Reactions; Leontovich, M.A., Ed.; Pergamon Press: London, UK, 1960; Volume IV, p. 305. [Google Scholar]
- Wimmel, H.K. Statistical ion broadening in plasmas. J. Quant. Spectrosc. Radiat. Transf. 1960, 1, 1–29. [Google Scholar]
- Wimmel, H.K. Erratum. J. Quant. Spectrosc. Radiat. Transf. 1964, 4, 497–499. [Google Scholar] [CrossRef]
- Ishimura, T. Stark effect of the Lyman alpha line by a rotating electric field. J. Phys. Soc. Jpn. 1967, 23, 422–429. [Google Scholar] [CrossRef]
- Kogan, V.I.; Selidovkin, A.D. On fluctuating microfield in system of charged particles. Beitr. Aus. Plasmaphys. 1969, 9, 199–216. [Google Scholar] [CrossRef]
- Sholin, G.V.; Lisitsa, V.S.; Kogan, V.I. Amplitude modulation and non-adiabaticity in the Stark broadening of hydrogen lines in a plasma. Sov. Phys. JETP 1971, 32, 758–765. [Google Scholar]
- Lisitsa, V.S. Hydrogen Atom in Rotating Electric Field. Opt. Spectrosc. USSR 1971, 31, 468. [Google Scholar]
- Frisch, U.; Brissaud, A. Theory of Stark broadening—I. Soluble scalar model as a test. J. Quant. Spectrosc. Radiat. Transf. 1971, 11, 1753–1766. [Google Scholar] [CrossRef]
- Brissaud, A.; Frisch, U. —Exact line profile with model microfield. J. Quant. Spectrosc. Radiat. Transf. 1971, 11, 1767–1783. [Google Scholar] [CrossRef]
- Strekalov, M.L.; Burshtein, A.I. Collapse of shock-broadened multiplets. JETP 1972, 34, 53–58. [Google Scholar]
- Sholin, G.V.; Demura, A.V.; Lisitsa, V.S. Theory of Stark broadening of hydrogen lines in plasma. Sov. Phys. J. Exp. Theor. Phys. 1973, 37, 1057–1065. [Google Scholar]
- Sholin, G.V.; Demura, A.V.; Lisitsa, V.S. Electron. Impact Broadening of Stark Sublevels of Hydrogen Atom in Plasmas; Preprint IAE-2332, Kurchatov Institute of Atomic Energy: Moscow, Russia, 1972; pp. 1–21. [Google Scholar]
- Vidal, C.R.; Cooper, J.; Smith, E.W. Hydrogen Stark-broadening tables. Astrophys. J. Suppl. Ser. 1973, 25, 37–136. [Google Scholar] [CrossRef]
- Kelleher, D.E.; Wiese, W.L. Observation of ion motion in hydrogen Stark profiles. Phys. Rev. Lett. 1973, 31, 1431–1434. [Google Scholar] [CrossRef]
- Griem, H.R. Spectral Line Broadening by Plasmas; Academic Press: New York, NY, USA, 1974. [Google Scholar]
- Wiese, W.L.; Kelleher, D.E.; Helbig, V. Variation in Balmer-line Stark profiles with atom-ion reduced mass. Phys. Rev. A 1975, 11, 1854–1864. [Google Scholar] [CrossRef]
- Demura, A.V.; Lisitsa, V.S.; Sholin, G.V. On the ion motion effect in Stark profiles of hydrogen lines in a plasma. In Proceedings of the XIIth ICPIG, Eindhoven, The Netherlands, 1975; p. 37.
- Demura, A.V.; Lisitsa, V.S.; Sholin, G.V. Theory of Thermal Corrections to Stark Profiles of Hydrogen Spectral Lines; Preprint IAE-2672; Kurchatov Institute of Atomic Energy: Moscow, Russia, 1976; pp. 1–47. [Google Scholar]
- Demura, A.V.; Lisitsa, V.S.; Sholin, G.V. Effect of reduced mass in Stark broadening of hydrogen lines. Sov. Phys. J. Exp. Theor. Phys. 1977, 46, 209–215. [Google Scholar]
- Gruntzmacher, K.; Wende, B. Discrepancies between the Stark broadening theories for hydrogen and measurements of Ly-α Stark profiles in a dense equilibrium plasma. Phys. Rev. A 1977, 16, 243–246. [Google Scholar] [CrossRef]
- Seidel, J. Hydrogen Stark broadening by model electronic microfields. Z. Naturforschung. 1977, 32, 1195–1206. [Google Scholar]
- Seidel, J. Effects of ion motion on hydrogen Stark profiles. Z. Naturforschung. 1977, 32, 1207–1214. [Google Scholar]
- Voslamber, D. Effect of emitter-ion dynamics on the line core of Lyman-α. Phys. Lett. A 1977, 61, 27–29. [Google Scholar] [CrossRef]
- Gruntzmacher, K.; Wende, B. Stark broadening of the hydrogen resonance line Lβ in a dense equilibrium plasma. Phys. Rev. A 1978, 18, 2140–2149. [Google Scholar] [CrossRef]
- Stamm, R.; Voslamber, D. On the role of ion dynamics in the Stark broadening of hydrogen lines. J. Quant. Spectrosc. Radiat. Transf. 1979, 22, 599–609. [Google Scholar] [CrossRef]
- Voslamber, D.; Stamm, R. Influence of different ion dynamical effects on Lyman lines. In Spectral Line Shapes Volume 1; Wende, B., Ed.; Walter de Gruyter & Co.: Berlin, Germany, 1981; pp. 63–72. [Google Scholar]
- Seidel, J.; Stamm, R. Effects of radiator motion on plasma-broadened hydrogen Lyman-β. J. Quant. Spectrosc. Radiat. Transf. 1982, 27, 499–503. [Google Scholar] [CrossRef]
- Stamm, R.; Talin, B.; Pollock, E.L.; Iglesias, C.A. Ion-dynamics effects on the line shapes of hydrogenic emitters in plasmas. Phys. Rev. A 1986, 34, 4144–4152. [Google Scholar] [CrossRef]
- Calisti, A.; Stamm, R.; Talin, B. Effect of the ion microfield fluctuations on the Lyman-α fine-structure doublet of hydrogenic ions in dense plasmas. Europhys. Lett. 1987, 4, 1003–1008. [Google Scholar] [CrossRef]
- Boercker, D.B.; Dufty, J.W.; Iglesias, C.A. Radiative and transport properties of ions in strongly coupled plasmas. Phys. Rev. A 1987, 36, 2254. [Google Scholar] [CrossRef]
- Demura, A.V. Theory of Joint Distribution Functions of Ion. Microfield and Its Space and Time Derivatives in Plasma with Complex. Ionization Composition; Preprint IAE-4632/6; Kurchatov Institute of Atomic Energy: Moscow, Russia, 1988; pp. 1–17. [Google Scholar]
- Calisti, A.; Stamm, R.; Talin, B. Simulation calculation of the ion-dynamic effect on overlapping neutral helium lines. Phys. Rev. A 1988, 38, 4883–4886. [Google Scholar] [CrossRef]
- Demura, A.V. Microfield Fluctuations in Plasma with Low Frequency Oscillations. In XIXth ICPIG Contributed Papers; Labat, J.M., Ed.; Faculty of Physics, University of Belgrade: Belgrade, 1990; Volume 2, pp. 352–353. [Google Scholar]
- Calisti, A.; Khelfaoui, F.; Stamm, R.; Talin, B.; Lee, R.W. Model for the line shapes of complex ions in hot and dense plasmas. Phys. Rev. A 1990, 42, 5433–5440. [Google Scholar] [CrossRef]
- Rautian, S.G.; Shalagin, A.M. Kinetic Problems of Nonlinear Spectroscopy; North Holland: New York, NY, USA, 1991. [Google Scholar]
- Anufrienko, A.V.; Godunov, A.L.; Demura, A.V.; Zemtsov, Y.K.; Lisitsa, V.S.; Starostin, A.N.; Taran, M.D.; Shchipakov, V.A. Nonlinear interference effects in Stark broadening of ion lines in a dense plasma. Sov. Phys. J. Exp. Theor. Phys 1990, 71, 728–741. [Google Scholar]
- Anufrienko, A.V.; Bulyshev, A.E.; Godunov, A.L.; Demura, A.V.; Zemtsov, Y.K.; Lisitsa, V.S.; Starostin, A.N. Nonlinear interference effects and ion dynamics in the kinetic theory of Stark broadening of the spectral lines of multicharged ions in a dense plasma. JETP 1993, 76, 219–228. [Google Scholar]
- Sobelman, I.I.; Vainstein, L.A.; Yukov, E.A. Excitation of Atoms and Broadening of Spectral Lines; Springer: Heidelberg, Germany; New York, NY, USA, 1995. [Google Scholar]
- Talin, B.; Calisti, A.; Godbert, L.; Stamm, R.; Lee, R.W.; Klein, L. Frequency-fluctuation model for line-shape calculations in plasma spectroscopy. Phys. Rev. A 1995, 51, 1918–1928. [Google Scholar] [CrossRef]
- Gigosos, M.A.; Cardenoso, V. New plasma diagnosis tables of hydrogen Stark broadening including ion dynamics. J. Phys. B 1996, 29, 4795–4838. [Google Scholar] [CrossRef]
- Demura, A.V. Instantaneous joint distribution of ion microfield and its time derivatives and effects of dynamical friction in plasmas. J. Exp. Theor. Phys. 1996, 83, 60–72. [Google Scholar]
- Alexiou, S.; Calisti, A.; Gautier, P.; Klein, L.; Leboucher-Dalimier, E.; Lee, R.W.; Stamm, R.; Talin, B. Aspects of plasma spectroscopy: Recent advances. J. Quant. Spectrosc. Radiat. Transf. 1997, 58, 399–413. [Google Scholar] [CrossRef]
- Kosarev, I.N.; Stehle, C.; Feautrier, N.; Demura, A.V.; Lisitsa, V.S. Interference of radiating states and ion dynamics in spectral line broadening. J. Phys. B 1997, 30, 215–236. [Google Scholar] [CrossRef]
- Griem, H. Principles of Plasma Spectroscopy; Cambridge University Press: Cambridge, UK, 1997. [Google Scholar]
- Stehle, C.; Hutcheon, R. Extensive tabulation of Stark broadened hydrogen line profiles. Astron. Astrophys. Suppl. Ser. 1999, 140, 93–97. [Google Scholar] [CrossRef]
- Barbes, A.; Gigosos, M.A.; Gonzalez, M.A. Analysis of the coupling between impact and quasistatic field mechanisms in Stark broadening. J. Quant. Spectrosc. Radiat. Transf. 2001, 68, 679–688. [Google Scholar] [CrossRef]
- Gigosos, M.A.; Gonzalez, M.A.; Cardenoso, V. Computer simulated Balmer-alpha, -beta and -gamma Stark line profiles for non-equilibrium plasma diagnostics. Spectrochim. Acta B 2003, 58, 1489–1504. [Google Scholar] [CrossRef]
- Demura, A.V.; Rosmej, F.B.; Stamm, R. Density Matrix Approach to Description of Doubly Excited States in Dense Plasmas. In Spectral Line Shapes; (18th International Conference on Spectral Line Shapes, Auburn, Alabama 4-9 June 2006); Oks, E., Pindzola, M., Eds.; AIP Conference Proceedings vol. 874; AIP: Melville, NY, USA, 2006; pp. 112–126. [Google Scholar]
- Calisti, A.; Ferri, S.; Mosse, C.; Talin, B. Modélisation des profils de raie dans les plasmas: PPP—Nouvelle version. J. Phys. IV Fr. 2006, 138, 95–103. [Google Scholar] [CrossRef]
- Stambulchik, E.; Maron, Y. A study of ion-dynamics and correlation effects for spectral line broadening in plasma: K-shell lines. J. Quant. Spectrosc. Radiat. Transf. 2006, 99, 730–749. [Google Scholar] [CrossRef]
- Oks, E.A. Stark Broadening of Hydrogen and Hydrogenlike. Spectral Lines in Plasmas. The Physical Insight; Alpha Science International Ltd.: Oxford, UK, 2006. [Google Scholar]
- Calisti, A.; Ferri, S.; Mosse, C.; Talin, B.; Lisitsa, V.; Bureyeva, L.; Gigosos, M.A.; Gonzalez, M.A.; del Rio Gaztelurrutia, T.; Dufty, J.W. Slow and fast micro-field components in warm and dense hydrogen plasmas. ArXiv e-prints 2007. [arXiv:physics.plasm-ph/0710.2091]. [Google Scholar]
- Calisti, A.; del Rio Gaztelurrutia, T.; Talin, B. Classical molecular dynamics model for coupled two component plasma. High Energy Density Phys. 2007, 3, 52–56. [Google Scholar] [CrossRef]
- Ferri, S.; Calisti, A.; Mosse, C.; Talin, B.; Gigosos, M.A.; Gonzalez, M.A. Line shape modeling in warm and dense hydrogen plasma. High Energy Density Phys. 2007, 3, 81–85. [Google Scholar] [CrossRef]
- Stambulchik, E.; Alexiou, S.; Griem, H.; Kepple, P.C. Stark broadening of high principal quantum number hydrogen Balmer lines in low-density laboratory plasmas. Phys. Rev. A 2007, 75, 016401. [Google Scholar]
- Calisti, A.; Ferri, S.; Talin, B. Classical molecular dynamics model for coupled two component plasma. High Energy Density Phys. 2009, 5, 307–311. [Google Scholar] [CrossRef]
- Godbert-Mouret, L.; Rosato, J.; Capes, H.; Marandet, Y.; Ferri, S.; Koubiti, M.; Stamm, R.; Gonzalez, M.A.; Gigosos, M.A. Zeeman-Stark line shape codes including ion dynamics. High Energy Density Phys. 2009, 5, 162–165. [Google Scholar] [CrossRef]
- Stambulchik, E.; Maron, Y. Plasma line broadening and computer simulations: A mini-review. High Energy Density Phys. 2010, 6, 9–14. [Google Scholar] [CrossRef]
- Calisti, A.; Mosse, C.; Ferri, S.; Talin, B.; Rosmej, F.; Bureyeva, L.A.; Lisitsa, V.S. Dynamic Stark broadening as the Dicke narrowing effect. Phys. Rev. E 2010, 81, 016406. [Google Scholar] [CrossRef]
- Demura, A.V. Physical Models of Plasma Microfield. Int. J. Spectrosc. 2010, 671073:1–671073:42. [Google Scholar]
- Calisti, A.; Talin, B. Classical Molecular Dynamics Model for Coupled Two-Component Plasmas—Ionization Balance and Time Considerations. Contrib. Plasma Phys. 2011, 51, 524–528. [Google Scholar] [CrossRef]
- Calisti, A.; Ferri, S.; Mosse, C.; Talin, B.; Gigosos, M.A.; Gonzalez, M.A. Microfields in hot dense hydrogen plasmas. High Energy Density Phys. 2011, 7, 197–202. [Google Scholar] [CrossRef]
- Ferri, S.; Calisti, A.; Mosse, C.; Mouret, L.; Talin, B.; Gigosos, M.A.; Gonzalez, M.A.; Lisitsa, V. Frequency-fluctuation model applied to Stark-Zeeman spectral line shapes in plasmas. Phys. Rev. E 2011, 84, 026407. [Google Scholar] [CrossRef]
- Mancini, R.C.; Iglesias, C.A.; Calisti, A.; Ferri, S.; Florido, R. The effect of improved satellite line shapes on the argon Heβ spectral feature. High Energy Density Phys. 2013, 9, 731–736. [Google Scholar] [CrossRef]
- Iglesias, C.A. Efficient algorithms for stochastic Stark-profile calculations. High Energy Density Phys. 2013, 9, 209–221. [Google Scholar] [CrossRef]
- Iglesias, C.A. Efficient algorithms for Stark-Zeeman spectral line shape calculations. High Energy Density Phys. 2013, 9, 737–744. [Google Scholar] [CrossRef]
- Stambulchik, E. Review of the 1st Spectral Line Shapes in Plasmas code comparison workshop. High Energy Density Phys. 2013, 9, 528–534. [Google Scholar] [CrossRef]
- Calisti, A.; Demura, A.; Gigosos, M.; Gonzalez-Herrero, D.; Iglesias, C.; Lisitsa, V.; Stambulchik, E. Influence of micro-field directionality on line shapes. Atoms 2014, 2, 259–276. [Google Scholar] [CrossRef]
- Ferri, S.; Calisti, A.; Mossé, C.; Rosato, J.; Talin, B.; Alexiou, S.; Gigosos, M.A.; González, M.A.; González-Herrero, D.; Lara, N.; Gomez, T.; Iglesias, C.; Lorenzen, S.; Mancini, R.C.; Stambulchik, E. Ion Dynamics Effect on Stark-Broadened Line Shapes: A Cross-Comparison of Various Models. Atoms 2014, 2, 299–318. [Google Scholar] [CrossRef]
- Alexiou, S.; Dimitrijevic, M.; Sahal-Brechot, S.; Stambulchik, E.; Duan, B.; Gonzalez-Herrero, D.; Gigosos, M.A. The second woorkshop on lineshape comparison: Isolated lines. Atoms 2014, 2, 157–177. [Google Scholar] [CrossRef]
- Briggs, J.S.; Rost, J.M. Time dependence in quantum mechanics. Eur. Phys. J. D 2000, 10, 311–318. [Google Scholar] [CrossRef]
© 2014 by the authors; licensee MDPI, Basel, Switzerland. This article is an open access article distributed under the terms and conditions of the Creative Commons Attribution license (http://creativecommons.org/licenses/by/3.0/).
Share and Cite
Demura, A.V.; Stambulchik, E. Spectral-Kinetic Coupling and Effect of Microfield Rotation on Stark Broadening in Plasmas. Atoms 2014, 2, 334-356. https://doi.org/10.3390/atoms2030334
Demura AV, Stambulchik E. Spectral-Kinetic Coupling and Effect of Microfield Rotation on Stark Broadening in Plasmas. Atoms. 2014; 2(3):334-356. https://doi.org/10.3390/atoms2030334
Chicago/Turabian StyleDemura, Alexander V., and Evgeny Stambulchik. 2014. "Spectral-Kinetic Coupling and Effect of Microfield Rotation on Stark Broadening in Plasmas" Atoms 2, no. 3: 334-356. https://doi.org/10.3390/atoms2030334
APA StyleDemura, A. V., & Stambulchik, E. (2014). Spectral-Kinetic Coupling and Effect of Microfield Rotation on Stark Broadening in Plasmas. Atoms, 2(3), 334-356. https://doi.org/10.3390/atoms2030334