2. Energy Levels
Calculations for energy levels are generally the easiest to perform, and for this reason, the literature is full of data for many ions of interest. The availability of measurements for some levels, as stated above, considerably helps in determining the theoretical energies and/or in improving the calculations, because various methodologies (such as optimising orbitals on a particular state/level or the use of non-orthogonal or pseudo orbitals) can be applied. However, the problem becomes more difficult when no measurements (and even prior theoretical results) are available for comparisons, as recently experienced for three Cr-like ions: Kr XIII, Tc XX and Xe XXXI [
3]. For many ions, ‘configuration interaction’ (CI) among a few hundred levels (or configuration state functions, i.e., CSF) is sufficient to generate reasonably accurate energies (within a few percent), but for some, much larger calculations (∼10
or more CSFs) are necessary, such as for Cr-like ions [
3,
4,
5].
Usually, discrepancies between theory and measurements (or among various calculations) are understandable and can be resolved by different methodologies as stated above. For example, Turkington et al. [
6] reported two sets of theoretical energies for the levels of Na-like W LXIV, for which they used two different atomic structure codes, namely CIV3 and GRASP. Their CIV3 energies differ from those of NIST by up to 4 Ryd for a few levels, because the code does not include two-body relativistic operators and quantum electro-dynamic effects (QED), which are very important for this heavy ion. However, their GRASP energies are comparatively much closer to the measurements, within ∼1 Ryd. These calculations have been performed with a different purpose in mind, mainly to compare the subsequent scattering data, and therefore, the reasons for the differences are understandable. However, in a few instances, it may not be straightforward. For example, Singh et al. [
7] reported energy levels for five Br-like ions with 38 ≤ Z ≤ 42, for which they adopted the GRASP code with limited CI. However, in a subsequent calculation [
8] with the same code and CI, it was noted that the calculations of Singh et al. cannot be reproduced for any of the ions considered by them. Although the differences noted were only up to 0.15 Ryd (∼5%), this undermines the confidence in a calculation; see also
Section 3 for much larger discrepancies noted for other parameters.
In any large calculation, particularly when the mixing among levels of the same and/or different configuration(s) is strong, it is very difficult to assign unambiguous designations for all levels; see for example the levels of Cl-like Fe IX [
9]. This is a general atomic structure problem irrespective of the code adopted, and the best one can do is to provide the mixing coefficients so that the users can assign the designation according to their own preferences. It also helps to make comparisons with other calculations. However, in general, there are no discrepancies for the
J values. Similarly, in fully-relativistic calculations, quantum labels for the targeted states are obtained in jj-coupling and have a different mixing than in the semi-relativistic
work. Therefore, it often becomes difficult to match a correspondence between the two different labelling schemes, although the GRASP0 code of P. H. Norrington and I. P. Grant (
http://amdpp.phys.strath.ac.uk/UK_APAP/codes.html) has this facility. Furthermore, recently, a method has been developed by Gaigalas et al. [
10] to transform the representation from jj to an approximate LSJ-coupling and to assign a unique label to all energy levels.
It is not always possible to verify (or determine) the accuracy of energy levels by performing two (or more) independent calculations with different methods/codes. However, it is always beneficial to have some measurements with which to compare and to improve the accuracy of theoretical results; see for example the levels of Si II [
11] for which the use of non-orthogonal orbitals has been helpful. Another example for which the availability of measurements for a few levels has been very helpful is the case of Cr-like ions [
4,
5]. As may be seen in Table A of [
4], differences between the theoretical and experimental energies for the levels of Co IV are up to 35%, and the orderings are also different. This is in spite of using very large CI (with up to 76 138 CSFs) and two different codes, namely GRASP and FAC. For this ion (and other similar ions), it became necessary to consider over 1000 configurations, for both the even and odd levels, which generated more than a billion CSFs. However, in any atomic structure calculation (code), it becomes difficult to handle such a large number of CSFs, and therefore, we adopted the quasi-relativistic Hartree–Fock (QRHF) code of Bogdanovich and Rancova [
12,
13], in which a reduction process was applied to scan and select the most important ones, based on their weights. This process reduced the number of CSFs to under a million for both the even and odd levels, but brought the discrepancies between theory and measurements below 3% for the levels of the 3d
configuration and below 1% for the higher ones, i.e., (3d
) 4s and 4p.
Another code that has been successfully applied with very large CI is the revised version of GRASP known as GRASP2K [
14,
15]; see the work of Jönsson et al. [
16] for B-like ions, of Froese Fischer [
17] for W XL and the recent work of Gustafson et al. [
18] for Mg-like iron. In all such cases, the theoretical results are very close to the available measurements. This reinforces our earlier conclusions [
1] that all codes are not useful for all applications, that significant discrepancies between theory and measurements should not be ignored and that the choice of a code is very important and should be based on: (i) the ion concerned, (ii) the accuracy desired and (iii) the application in mind. Furthermore, what configurations to include in a calculation is equally important and should be based on a fair balance of even and odd CSFs as deliberated by Froese Fischer [
17] and their energy ranges as emphasised by us [
19,
20].
3. Radiative Rates and Lifetimes
Unlike energy levels, it is comparatively more difficult to assess the accuracy of radiative rates (A-values), or the related parameters such as oscillator (f-values) and line (S-values) strengths; see Equations (1)–(5) of [
21]. This is because experimental results for A-values are very limited and are mostly determined through the measured lifetimes by combining the branching fractions; see for example the work of Bäckström et al. [
22]. Therefore, one has to (mostly) rely on theoretical results. Nevertheless, in principle, all methods/codes should produce comparable results within a reasonable accuracy (say ∼20%), provided the same level of CI is adopted. Unfortunately, that is not the case in some instances.
As stated earlier in
Section 2, Singh et al. [
7] reported A-values for transitions in five Br-like ions with 38 ≤ Z ≤ 42, adopting the GRASP code. However, their results could not be reproduced with the same version of the GRASP code and with the same configurations adopted by them, and their results differed from our work [
8] by up to five orders of magnitude, and for all ions. The calculations are simple, as only limited CI was used. The easiest way to understand such large discrepancies is to compare the input data between theirs and our calculations, but we were not able to obtain the data from the authors. Similarly, discrepancies in the reported A-values for W XL and W LVIII by S. Aggarwal et al. [
23] and Mohan et al. [
24], respectively, are up to four orders of magnitude for several transitions, as demonstrated by us [
19,
20]. Furthermore, discrepancies of up to three orders of magnitude in A-values have been observed for several transitions of Li-like ions; see Aggarwal and Keenan [
25]. Therefore, it is always useful to have more than one calculation for any ion in order to have confidence in the applied data.
Some discrepancies in A-values are unavoidable, particularly for weaker transitions (f < 0.01) and when different codes and/or CI are used, and this has been discussed and demonstrated by various workers; see for example
Figure 1 of [
26] for Be-like ions,
Figure 2 of [
27] for Mg V and, more recently,
Figure 1 of [
28] for Mg V. This is because weaker transitions are more sensitive to the additive or cancellation effects of mixing coefficients from different sets of CSFs and/or their energies (
). Similarly, the ratio (R) of the length and velocity forms of A-values may also differ substantially as shown in
Figure 1 of [
27]. However, the A-values (or f-values) of comparatively stronger transitions are (generally) more stable, and their values of R do not deviate much from unity, which is an indication of accuracy; see also [
29]. Nevertheless, this is only a desirable criterion and not a necessary one because even for very strong transitions, different calculations may yield R close to unity, but strikingly different f-values, as demonstrated in our work on Mg-like ions [
30] and on Ne-like Ni XIX [
31]. Most of these differences are normally understandable and often do not exceed over an order of magnitude.
As already stated above, direct measurements of A-values are very limited in the literature. However, lifetimes (
= 1.0/
, s) for several levels of many ions have been measured by different techniques and, hence, provide an indirect comparison (and thus, assessment of accuracy) of the A-values. Generally, A-values for electric dipole (E1) transitions are dominant and, hence, the most important. However, similar data are also required for electric quadrupole (E2), magnetic dipole (M1) and magnetic quadrupole (M2) transitions. A-values for all types of transitions improve the accuracy of the plasma model. Additionally, if the A-value for any (type of) transition dominates in the determination of
for any level, then one gets the ‘experimental’ A-value. Often, as among various calculations, significant differences (of over an order of magnitude) are also noted among experimental results; see for example Table 5 of [
32] for the levels of C III and Table 5 of [
33] for N IV. If several measurements over a period of time and by different techniques are available, as in the case of the above two ions, then differences with theory can be ironed out. However, a problem arises when a single set of measurements is available, as for the levels of Si II [
34]. For the 3s3p
P
levels of Si II, Calamai et al. [
35] have measured
, which are lower than our theoretical results [
34] by an order of magnitude. The dominant contributing E1 transitions for these levels are invariably weak as their f-values are ∼10
, and hence, large variations among different calculations are not uncommon as discussed above and also seen in Table 3 and Figure 3 of [
36].
Unfortunately, Si II is a difficult ion because even with various options of CI, orbitals, methodology, etc., differences between theoretical and experimental energy levels remain significant; see for example, Table 2 of [
36] and Table 1 of [
37]. Since measurements of
for a few levels of Si II are available, as stated above, it is general practice in any theoretical work to match the calculations with them, and this is possible by adopting different combinations of CSFs and/or the use of non-orthogonal orbitals. As a result, the A-values for the concerned transitions agree closely among some theoretical works (for example [
37]) and the measurements of [
35]. However, the adoption of this data in the analysis of observations from astrophysical plasmas led to very large discrepancies and prompted Baldwin et al. [
38] to pronounce it as a “Si II disaster ...”. On the other hand, adoption of our (simple) A-values [
34] resulted in a much better match between theory and observations and resolved some of the discrepancies, as discussed in detail by Laha et al. [
39,
40]. Therefore, the measurements of Calamai et al. [
35] may or may not be accurate, and another set of experimental results of
for the levels of Si II will be highly useful for both: (i) the assessment of the accuracy of theoretical results and (ii) further analysis of astrophysical observations. Similarly, a much larger (ab initio) calculation for Si II will be highly useful to settle these discrepancies.
The discrepancies in
noted above for the levels of a few ions, either between theory and measurements or among various theoretical results, are comparatively minor and mostly understandable. However, there are other examples for which discrepancies in
are much larger and are not understandable. For example, for the levels of Br-like W XL, the discrepancies between the A-values of [
23] and our work [
19] were only up to two orders of magnitude, but much larger (up to four orders of magnitude) for
. Similar discrepancies and of the same orders of magnitude have also been noted for the levels of W LVIII; see [
20,
24]. On the other hand, there are no discrepancies between the A-values of [
41] and our work [
42], but the
results differ by up to 14 orders of magnitude for over 90% of the levels of W LXII. This was due to random selection of A-values by [
41] in the determination of
as explained by us [
42]. Finally, similar discrepancies and for the same randomness reason have been noted for the levels of W LXVI; see [
43,
44]. In conclusion, such situations create unnecessary problems for the users and/or assessors of atomic data as without performing an independent calculation, results cannot be taken at face value. Therefore, as for the energy levels, multiple calculations for A-values and preferably by differing methodologies are always useful to resolve large discrepancies and to have confidence in the applied data. This point has also been emphasised by Chung et al. [
2] and has most successfully been implemented by Wang et al. [
45,
46,
47] and Si et al. [
48] for a series of ions. They have performed systematic calculations with the MCDF and MBPT methods to determine the energy levels and A-values to spectroscopic accuracy. However, for this kind of work, very large calculations need to be performed for which Jönsson et al. [
49] have suggested further modifications to the GRASP2K code. Similarly, Safronova et al. [
50,
51] have performed very accurate (and large) calculations for a series of ions, using the CI + MBPT codes, and with single, double and triple excitations of electrons.
4. Collision Strengths and Effective Collision Strengths
The collision strength (
) is a dimensionless parameter and is very simply related to the scattering cross-section (
); see Equation (4) of [
1]. Measurements of
are restricted to only a couple of transitions, in a limited energy range, and for only some ions. Whenever measurements for
are available, generally there is a good agreement with the corresponding theoretical work(s); see for example Figures 2 and 3 of [
52], Figure 4 of [
53] and Figure 1 of [
54] for the 3s
S–3s3p
P
o transitions of Si III. Such agreements between theory and measurements are helpful for assessing the validity and accuracy of theory, but are not very useful for applications for which a much larger range of data is required. Hence, a vast amount of data available in the literature for
are theoretical, obtained with a variety of scattering codes (mostly distorted-wave (DW) and
R-matrix). Furthermore, such data cover a much wider range of energy (up to several times the thresholds) and transitions, involving up to ∼500 levels, or even more.
As for A-values, often differences among several calculations for
are also large, and this is in spite of adopting the same level of complexity, or even methodology. Several examples of (and reasons for) large discrepancies for some ions were discussed in our earlier paper [
1] and, hence, are not repeated here. Furthermore, it is the effective collision strength (
) for which data are useful for applications, rather than for
. This is because often, plasmas have an electron energy distribution, and therefore, the values of
need to be averaged over a suitable distribution, most often Maxwellian, to obtain results for
; see Equation (5) of [
1]. Therefore, we focus our attention mostly on the data for
. Additionally, even large discrepancies in
values, at some energies, may not necessarily lead to corresponding differences in the
values, because the averaging of the former is performed over a wide energy range, and the values of the latter are highly dependent on the temperature and/or the (type of) transition. As an example, see Table D of [
55] for a comparison of
s and Table E for
s, for transitions of Si III. Finally, we also note here that the values of
vary smoothly at energies above the thresholds and, below that, show highly dense and numerous (closed channel or Feshbach) resonances; see for example,
Figure 3 of [
56] for three transitions of Mg V.
Differences of up to a factor of two or so in the values of between any two calculations are not uncommon, and this is particularly true at low(er) temperatures for which a slight variation in the position and/or magnitude of resonances can have large consequences for the values of . For (particularly strong) allowed transitions, the contribution of resonances, if any, is not significant, and therefore, it is much easier to understand differences in between any two calculations, as the results simply follow the f-values, particularly towards the high(er) end of the temperature range. On the other hand, forbidden transitions are full of resonances and, hence, the large variations noted in their values. Nevertheless, problems arise for the users and modellers of data when large discrepancies, of orders of magnitude, are noted for between any two independent calculations, and that too with the same (or similar) method and complexity. Below, we discuss such discrepancies in detail.
The calculations of
(and subsequently,
) performed with the DW code(s) do not (generally) include the contribution of resonances, and therefore, their
values are expectedly underestimated, particularly for the forbidden transitions. A widely-used and highly successful method that explicitly includes the contribution of resonances is the
R-matrix, of which several versions with some variations are available, as noted and referenced in [
1]. For most ions for astrophysical applications (Z ≤ 28), the non-relativistic version is generally sufficient to achieve a reasonable accuracy, although a fully-relativistic version (Dirac atomic R-matrix code (DARC)) is preferable. This is because it includes fine structure in the definition of channel coupling, and therefore, resonances arising in between the degenerate levels of a state can also be included. Similarly, for some ions, such as He II [
57], the
states are non-degenerate in energies, but the levels split with the inclusion of QED. However, precisely for the same reason, the size of the Hamiltonian (H) matrix increases substantially, and therefore, the calculations become more time and resource consuming, without giving any overall significant advantage. Nevertheless, the results of
for several ions are available in the literature from both DARC and the non-relativistic version. However, calculations with the latter are primarily in the
(Russell–Saunders or spin-orbit) coupling, and the subsequent results for
(and
) for fine-structure transitions are calculated through the ICFT (intermediate coupling frame transformation) approach, as described in [
58]. Unfortunately, large discrepancies between the DARC and ICFT results for
have been noted for a wide range of ions, and on several occasions. We elaborate on this below.
Discrepancies in the
results, obtained with the DARC and ICFT codes, until 2012 have mostly been discussed in our earlier paper [
1], and therefore, these are not repeated here. However, just to recapitulate, large discrepancies had been noted (and highlighted) for H-like, He-like, Li-like and some Mg-like ions; see [
1] for problems and specific references. Here, we mostly focus on transitions in Be-like (and some other specific) ions, which have been under discussion in the recent literature. To be specific, in the recent past, we have reported results with DARC for seven Be-like ions, namely C III, N IV, Al X, Cl XIV, K XVI, Ti XIX, and Ge XXIX [
21,
32,
33,
59,
60], and similar data for a wide range of Be-like ions with Z ≤ 36 have been reported in [
26]. Although most of the discrepancies, of orders of magnitude, have already been highlighted and discussed in some of our papers (see [
32,
33,
61]), we elaborate below on the (possible) reasons for these.
If any two (or more) calculations are performed with the same method and are of comparable complexity, then the results for
(and other related parameters) should be similar for most of the transitions (i.e., the differences should not be very large), and particularly at temperatures towards the higher end at which the contributions of resonances, if any, are expected to be insignificant. However, that is not the case for Be-like ions, as stated above. One of the reasons for large discrepancies could be a significant difference in the level of complexity of the calculations. For example, our calculations for Al X, Cl XIV, K XVI, Ti XIX, and Ge XXIX [
21,
59,
60] included only 98 levels of the 2
ℓ2
, 2
ℓ3
ℓ and 2
ℓ4
ℓ configurations, whereas those of [
26] were larger with 238 levels, the additional 140 belonging to 2
ℓ5
ℓ, 2s6s/p/d, 2p6s/p/d, 2s7s/p/d, and 2p7s/p/d. Therefore, the discrepancies of over an order of magnitude in the
results, observed for about 50% of the transitions and at all temperatures, may be because of the larger model adopted by [
26]. Since in a majority of cases,
were greater than
(in particular, see
Figure 2 of [
61]), it appears to be a sound reason, as discussed and demonstrated in a series of papers by Badnell and co-workers [
62,
63,
64]. Below, we elaborate more on the differences between the DARC and ICFT calculations.
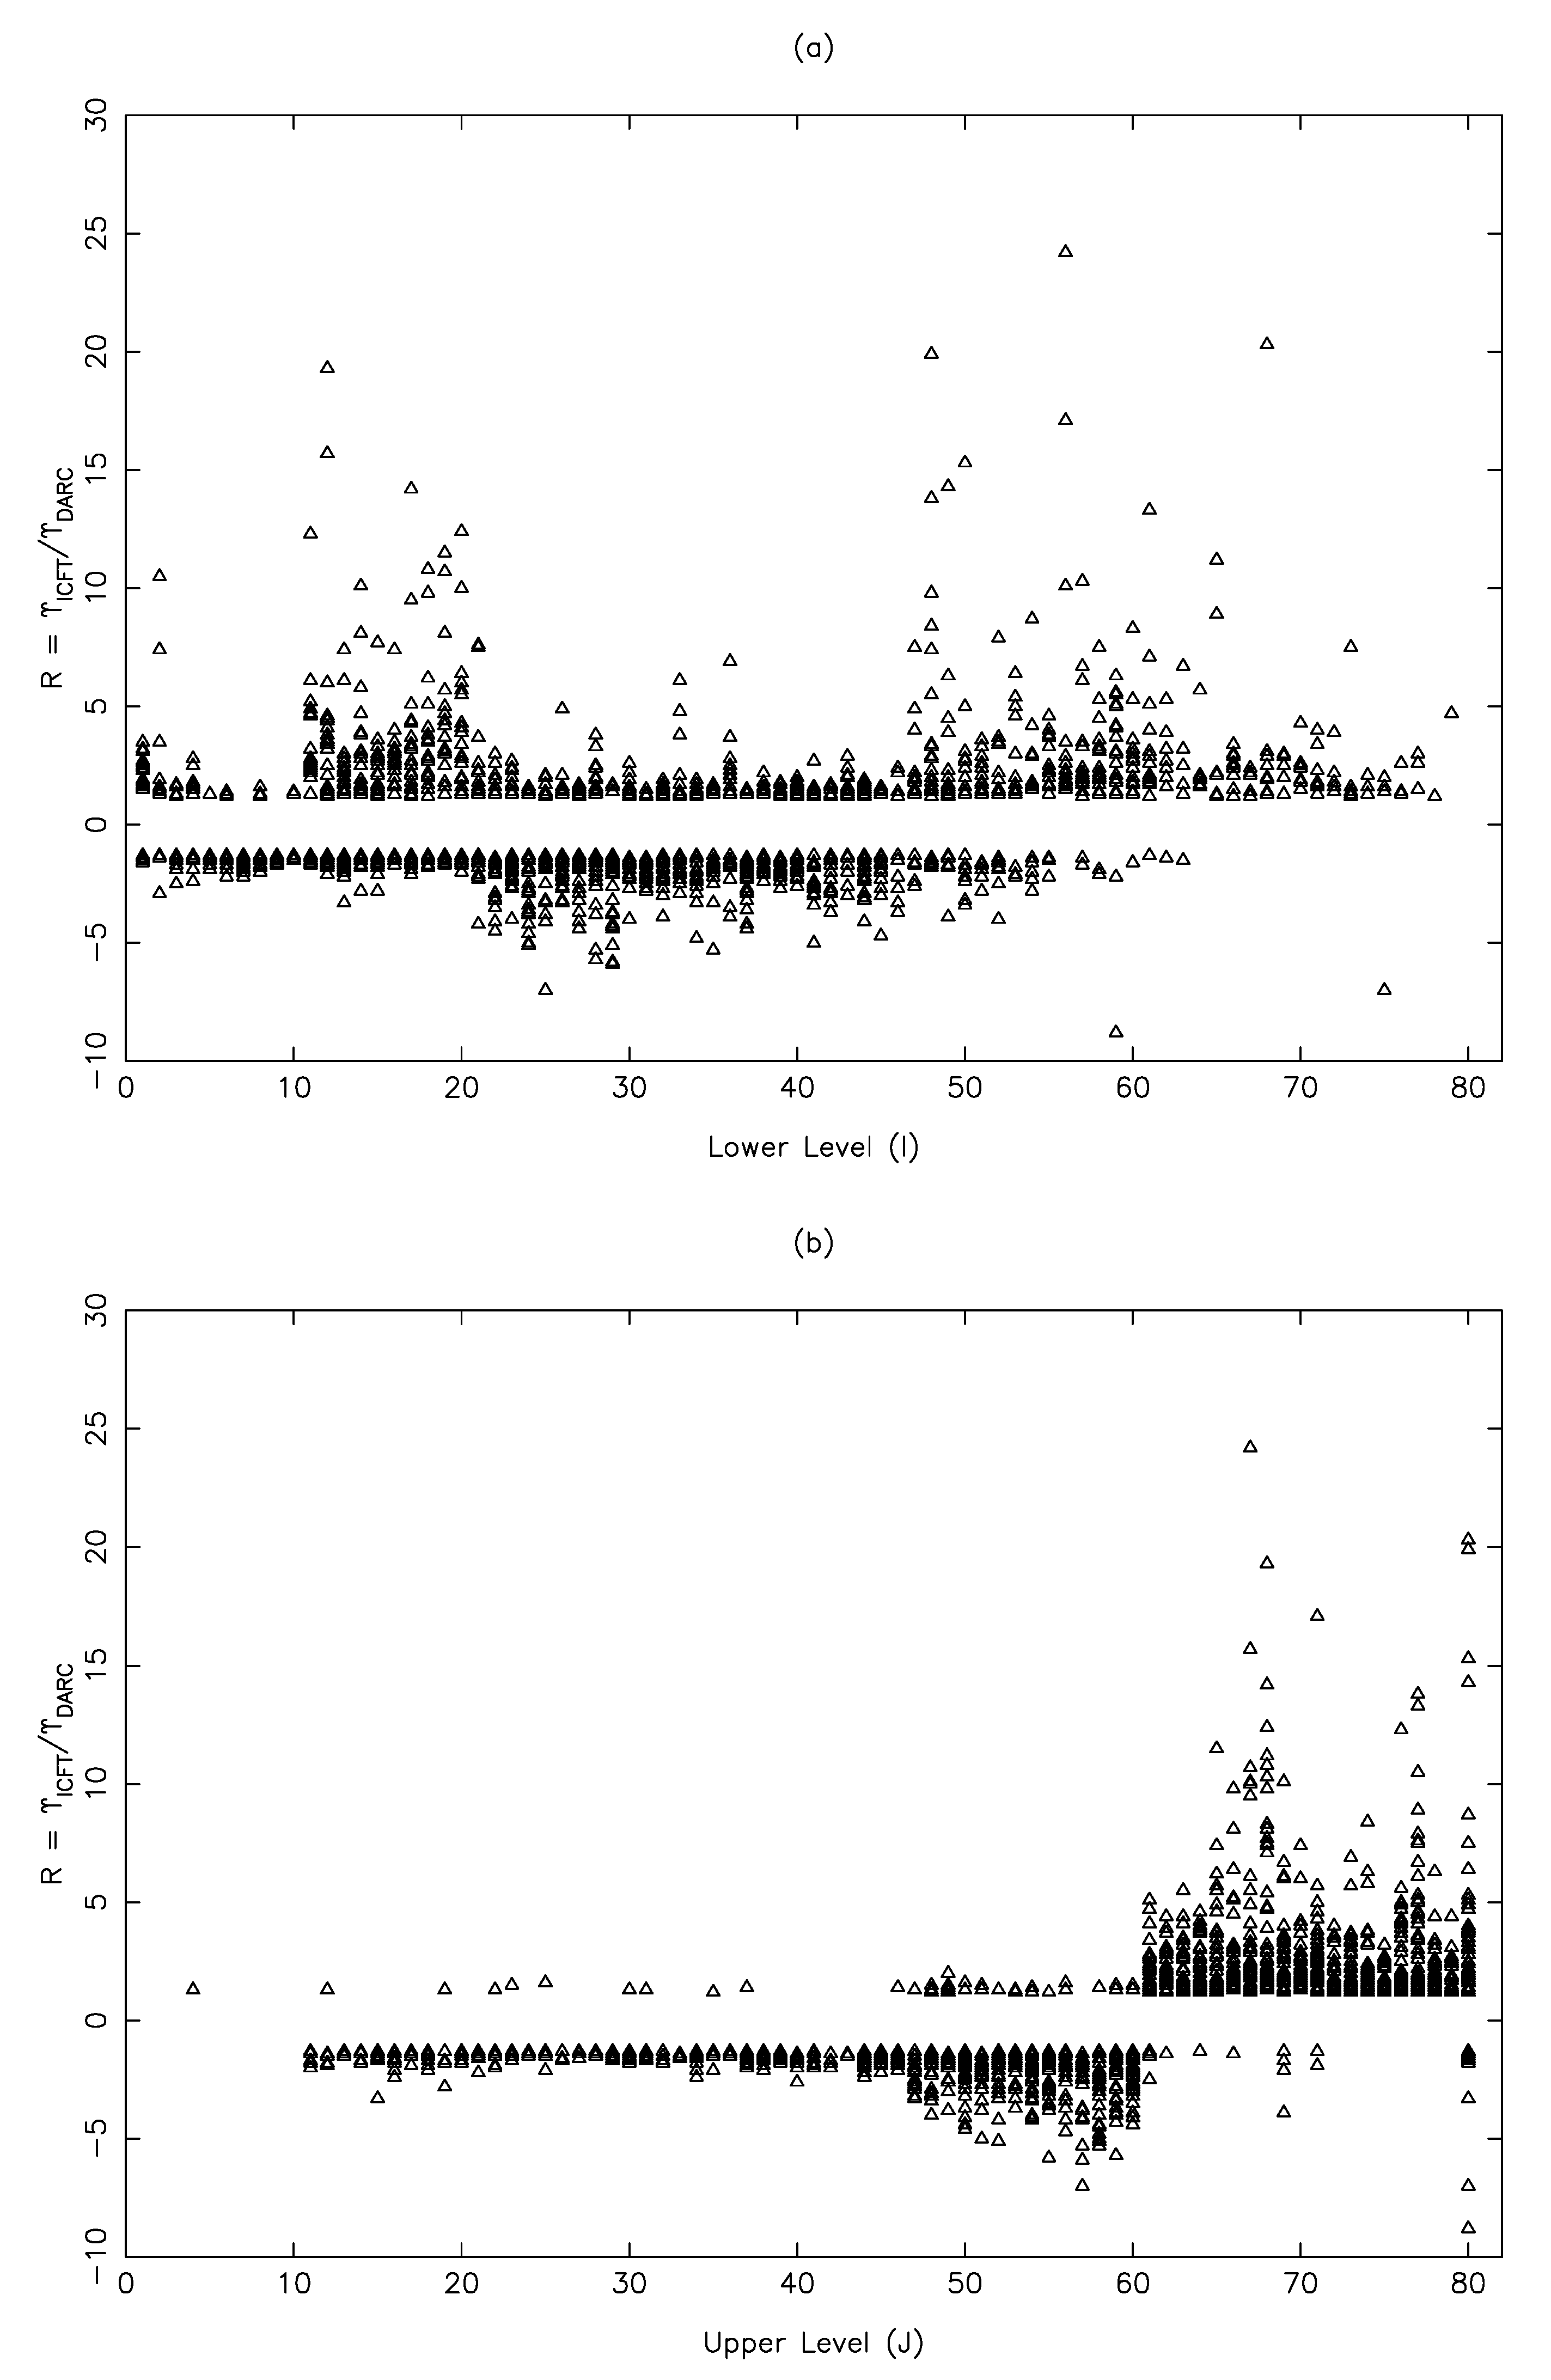
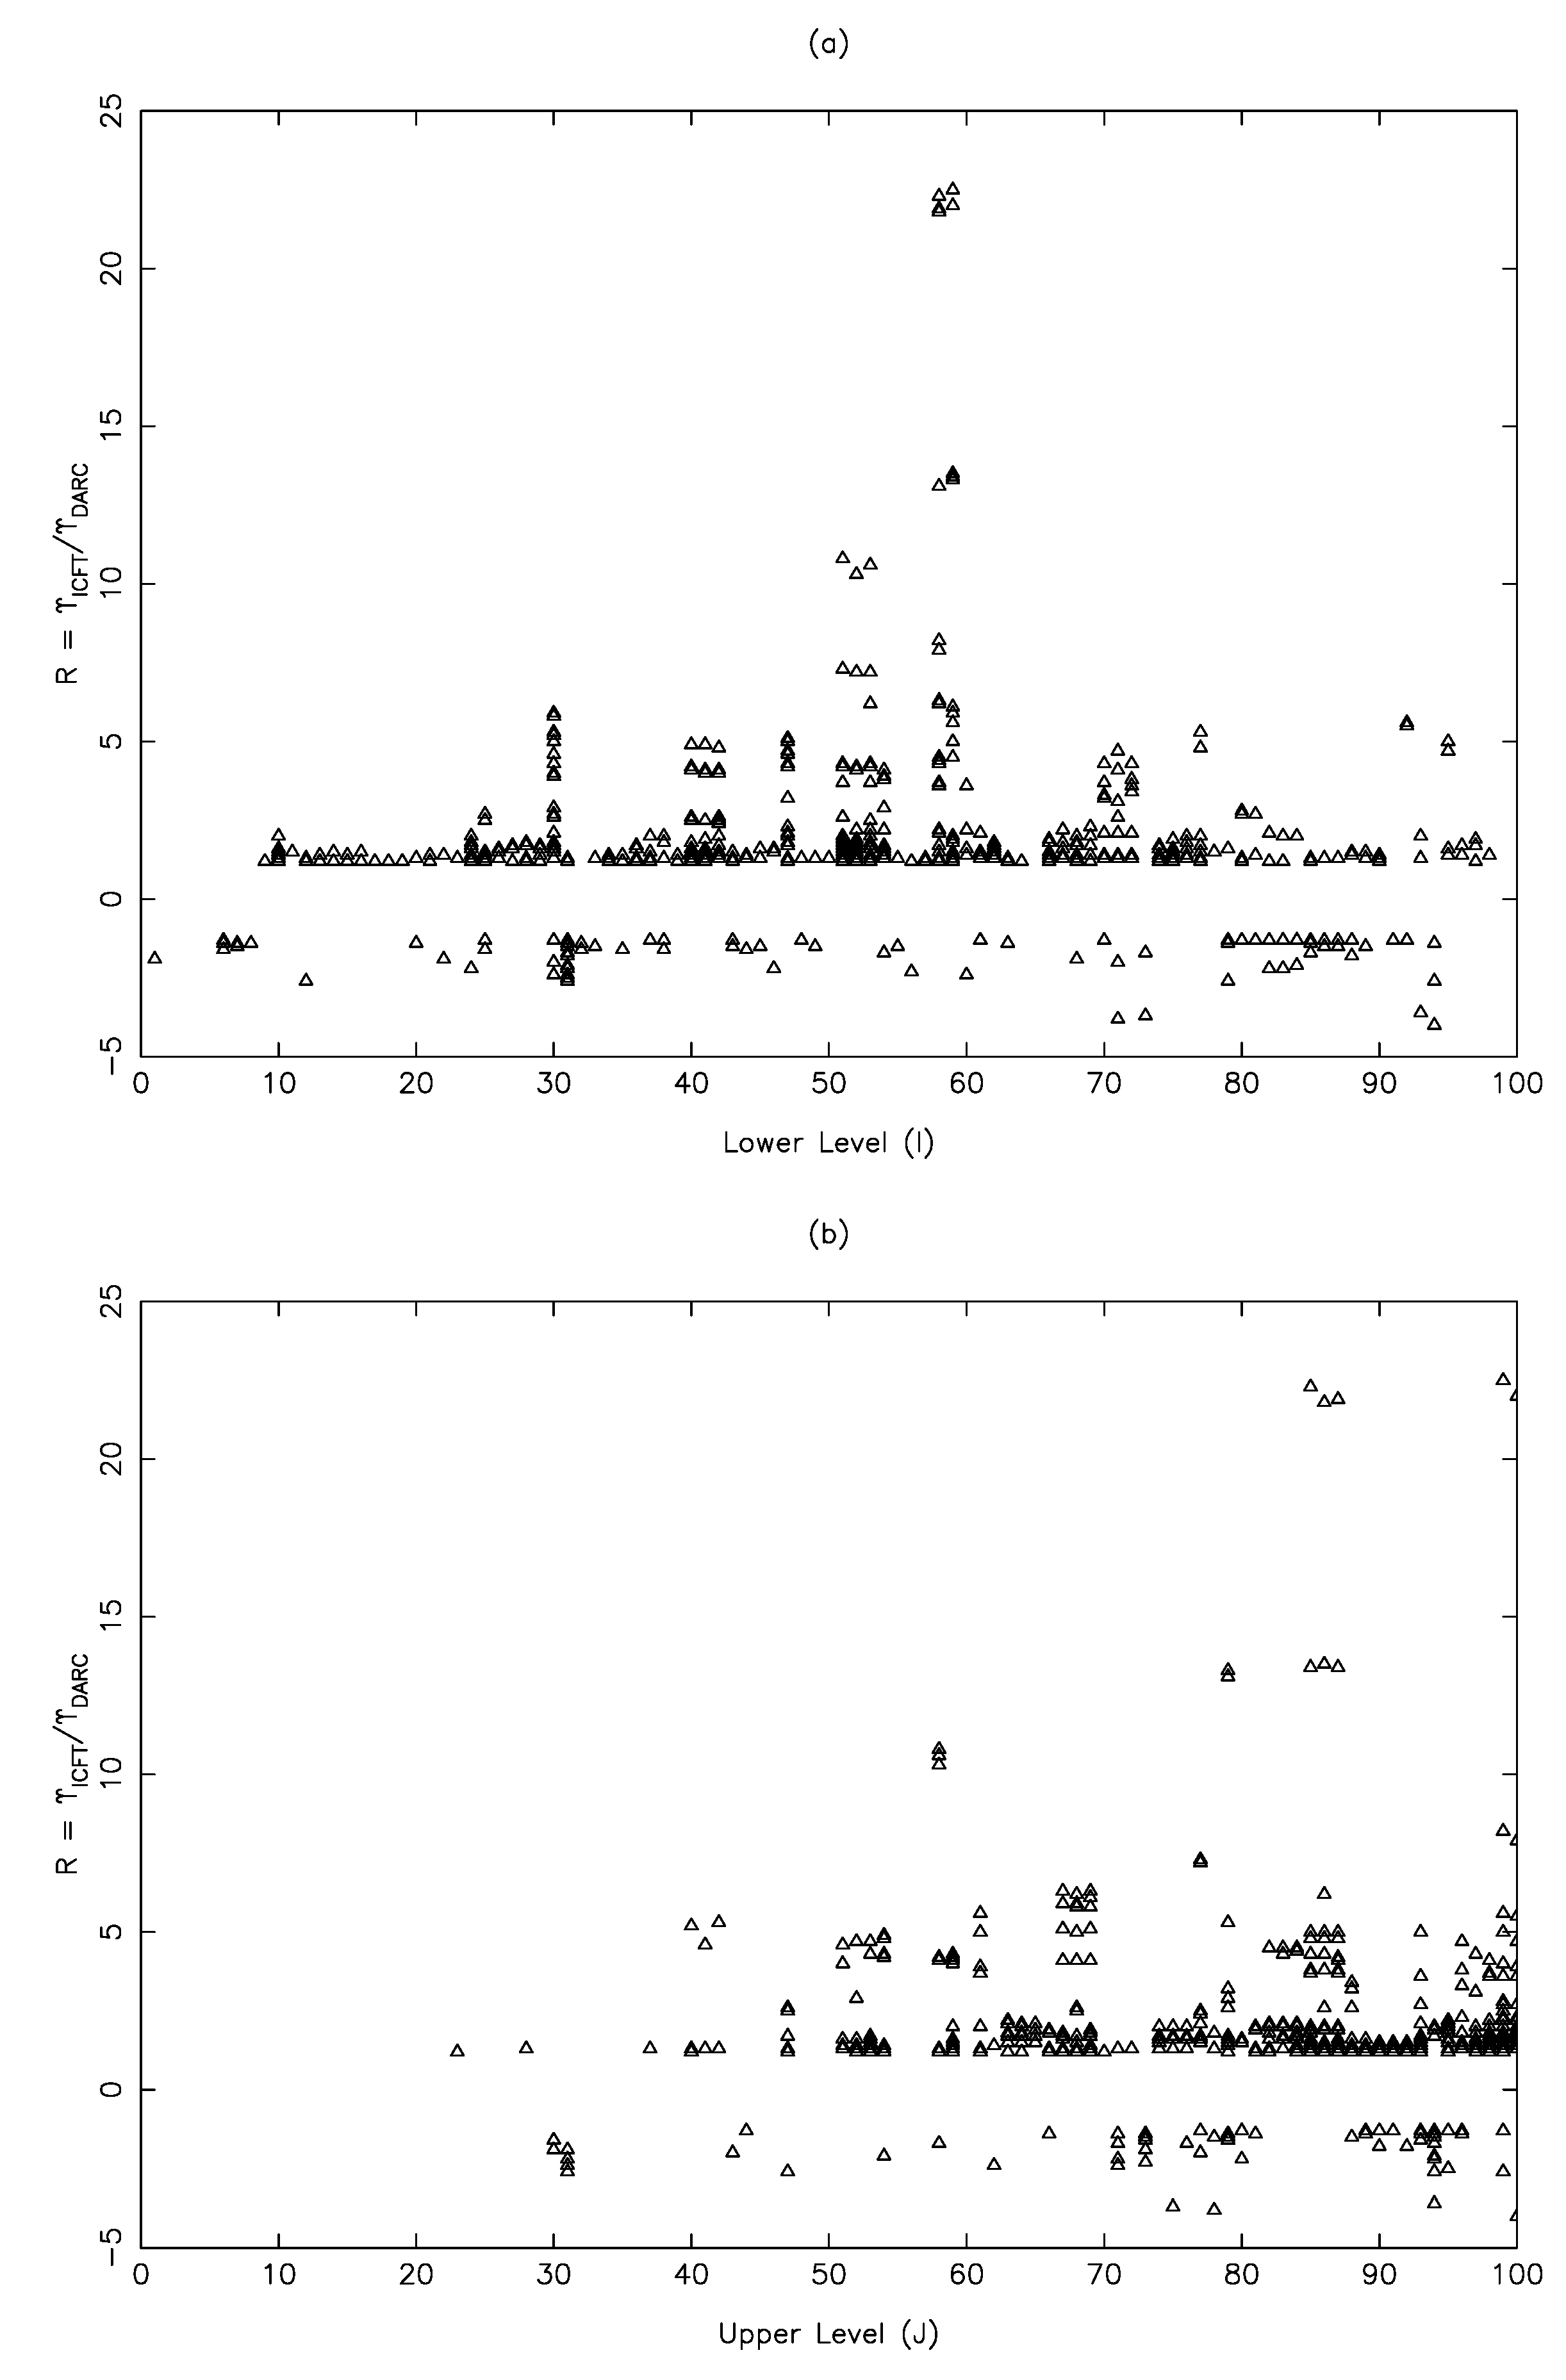
In
Figure 1,
Figure 2 and
Figure 3, we show the differences between
and
in the form of a ratio (R) for transitions in Al X, C III and N IV, at a single temperature of 1.0×10
, 9.0×10
and 1.6×10
K, respectively. These temperatures are the most relevant (and common between the two calculations) for these respective ions. Additionally, progressively larger calculations with DARC have been performed for these ions, i.e., Al X (98 levels [
21]), C III (166 levels [
32]) and N IV (238 levels [
33]), whereas the ICFT results [
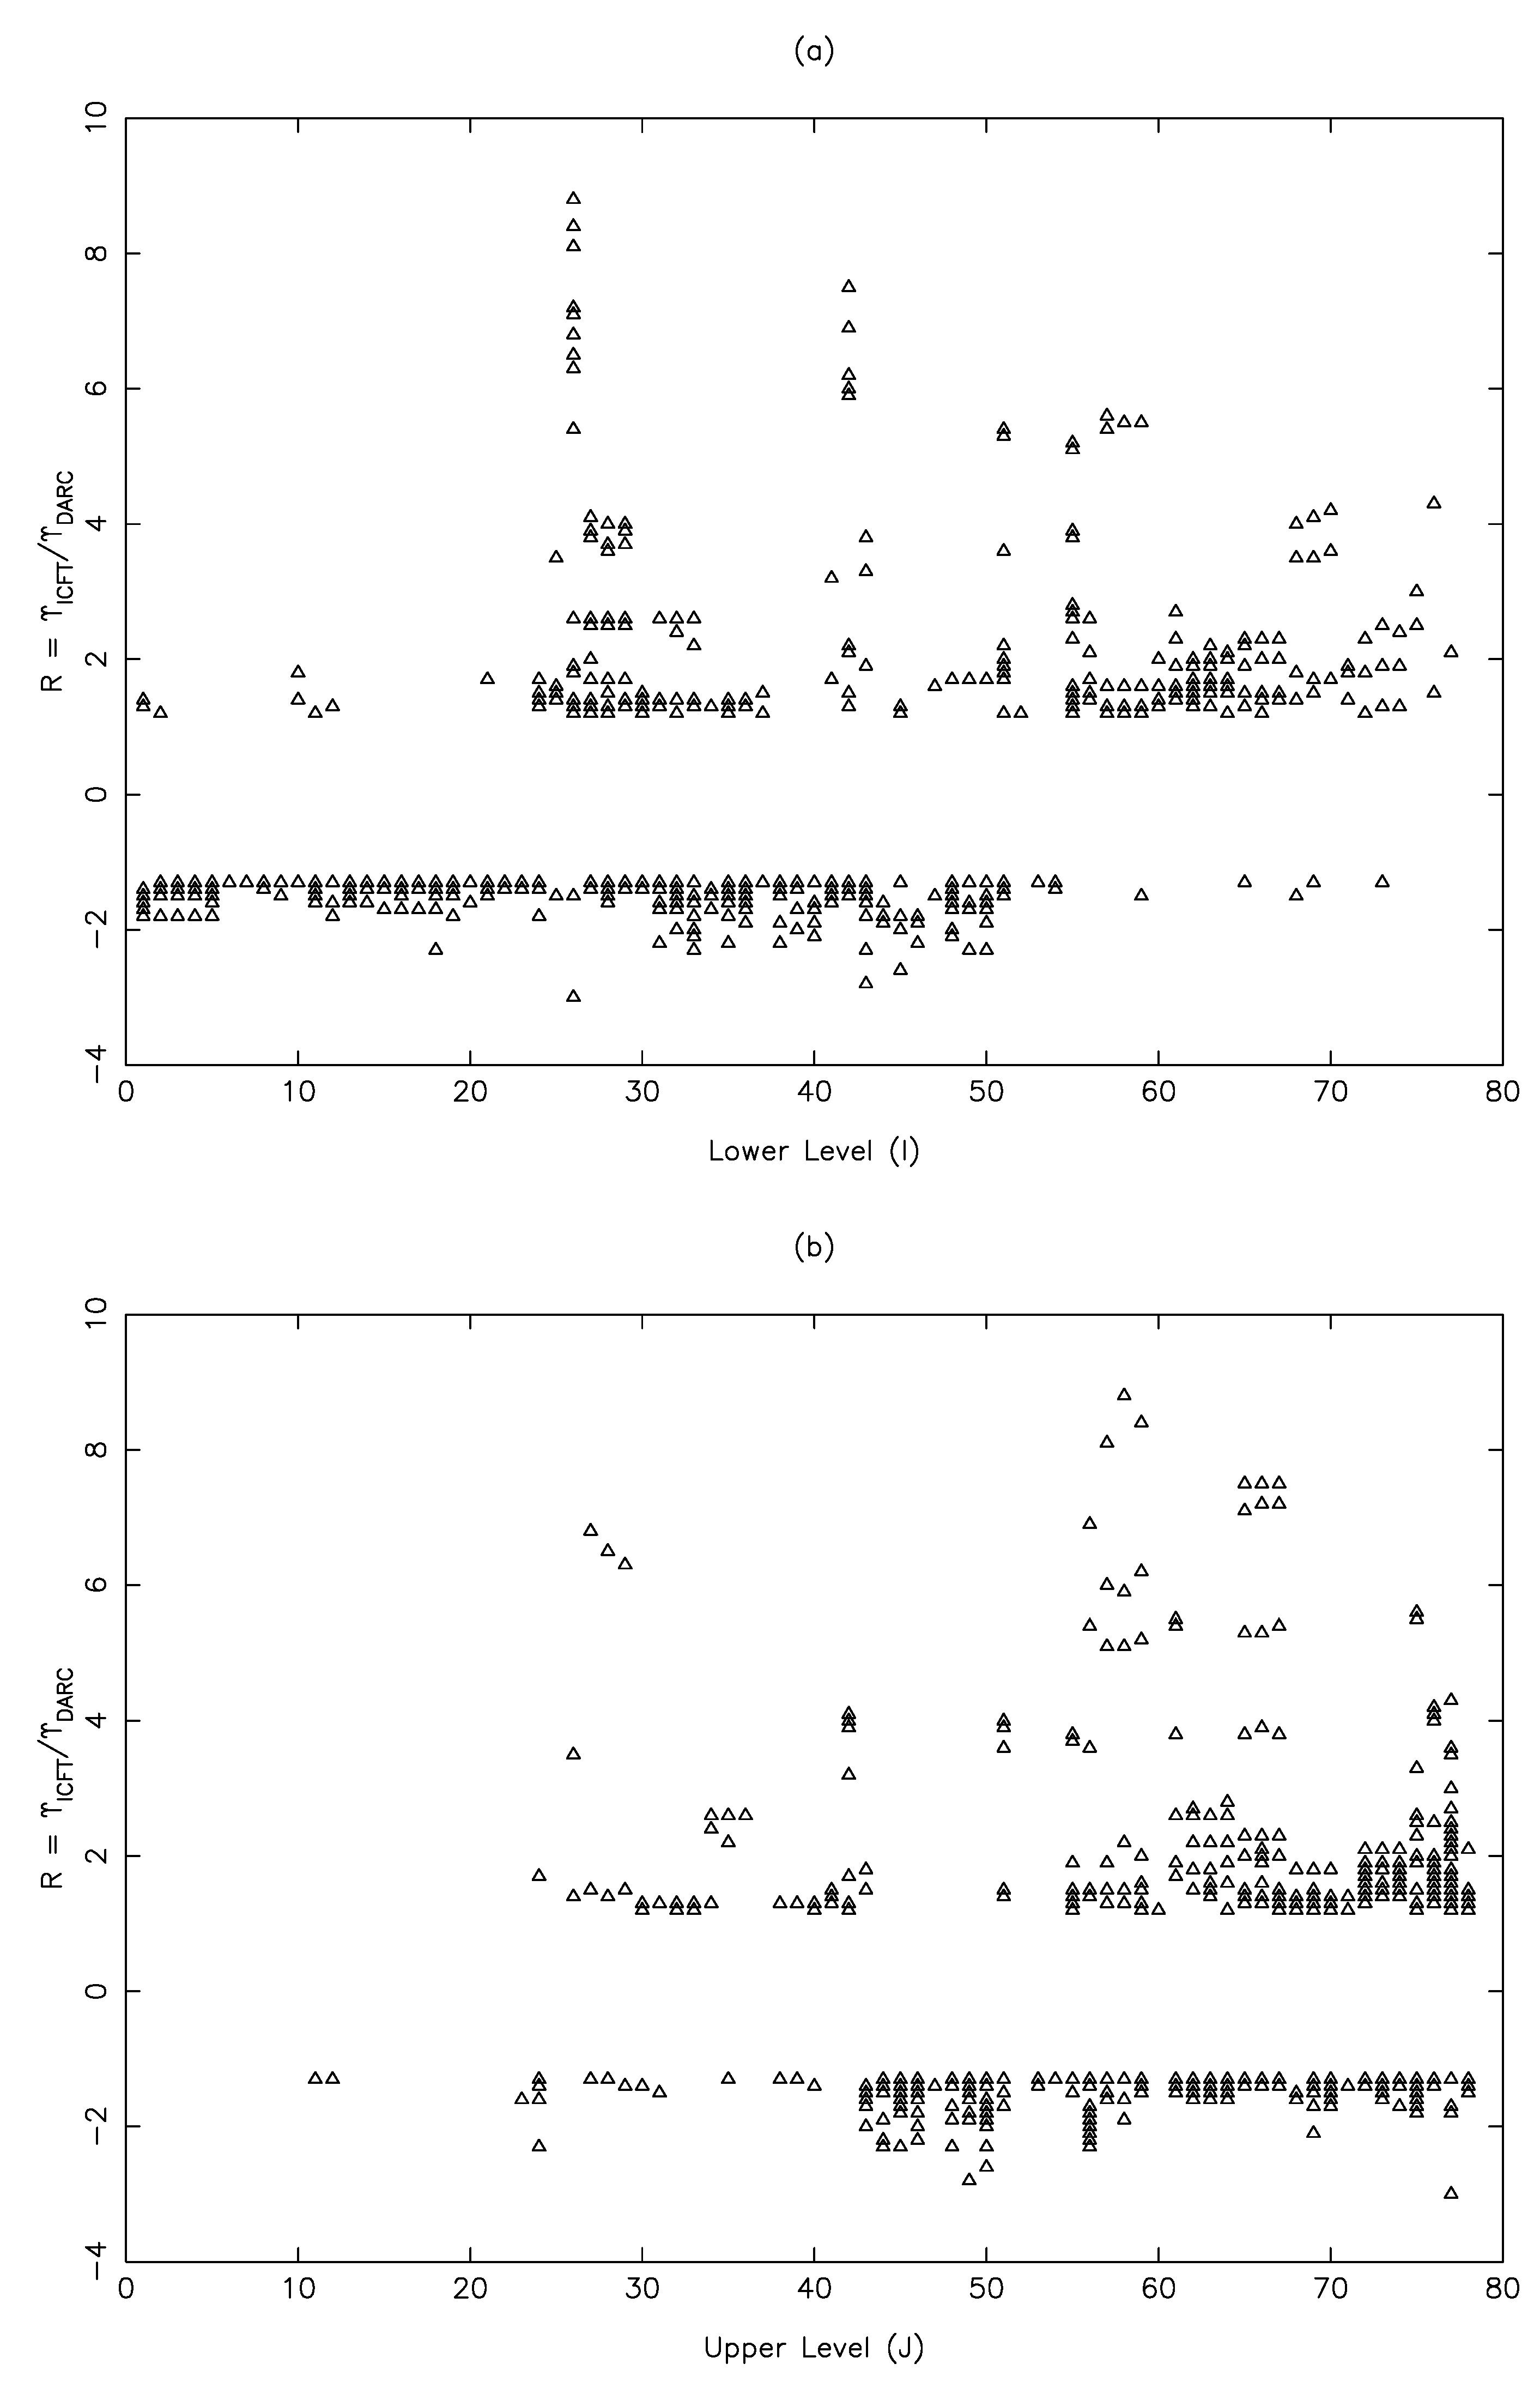
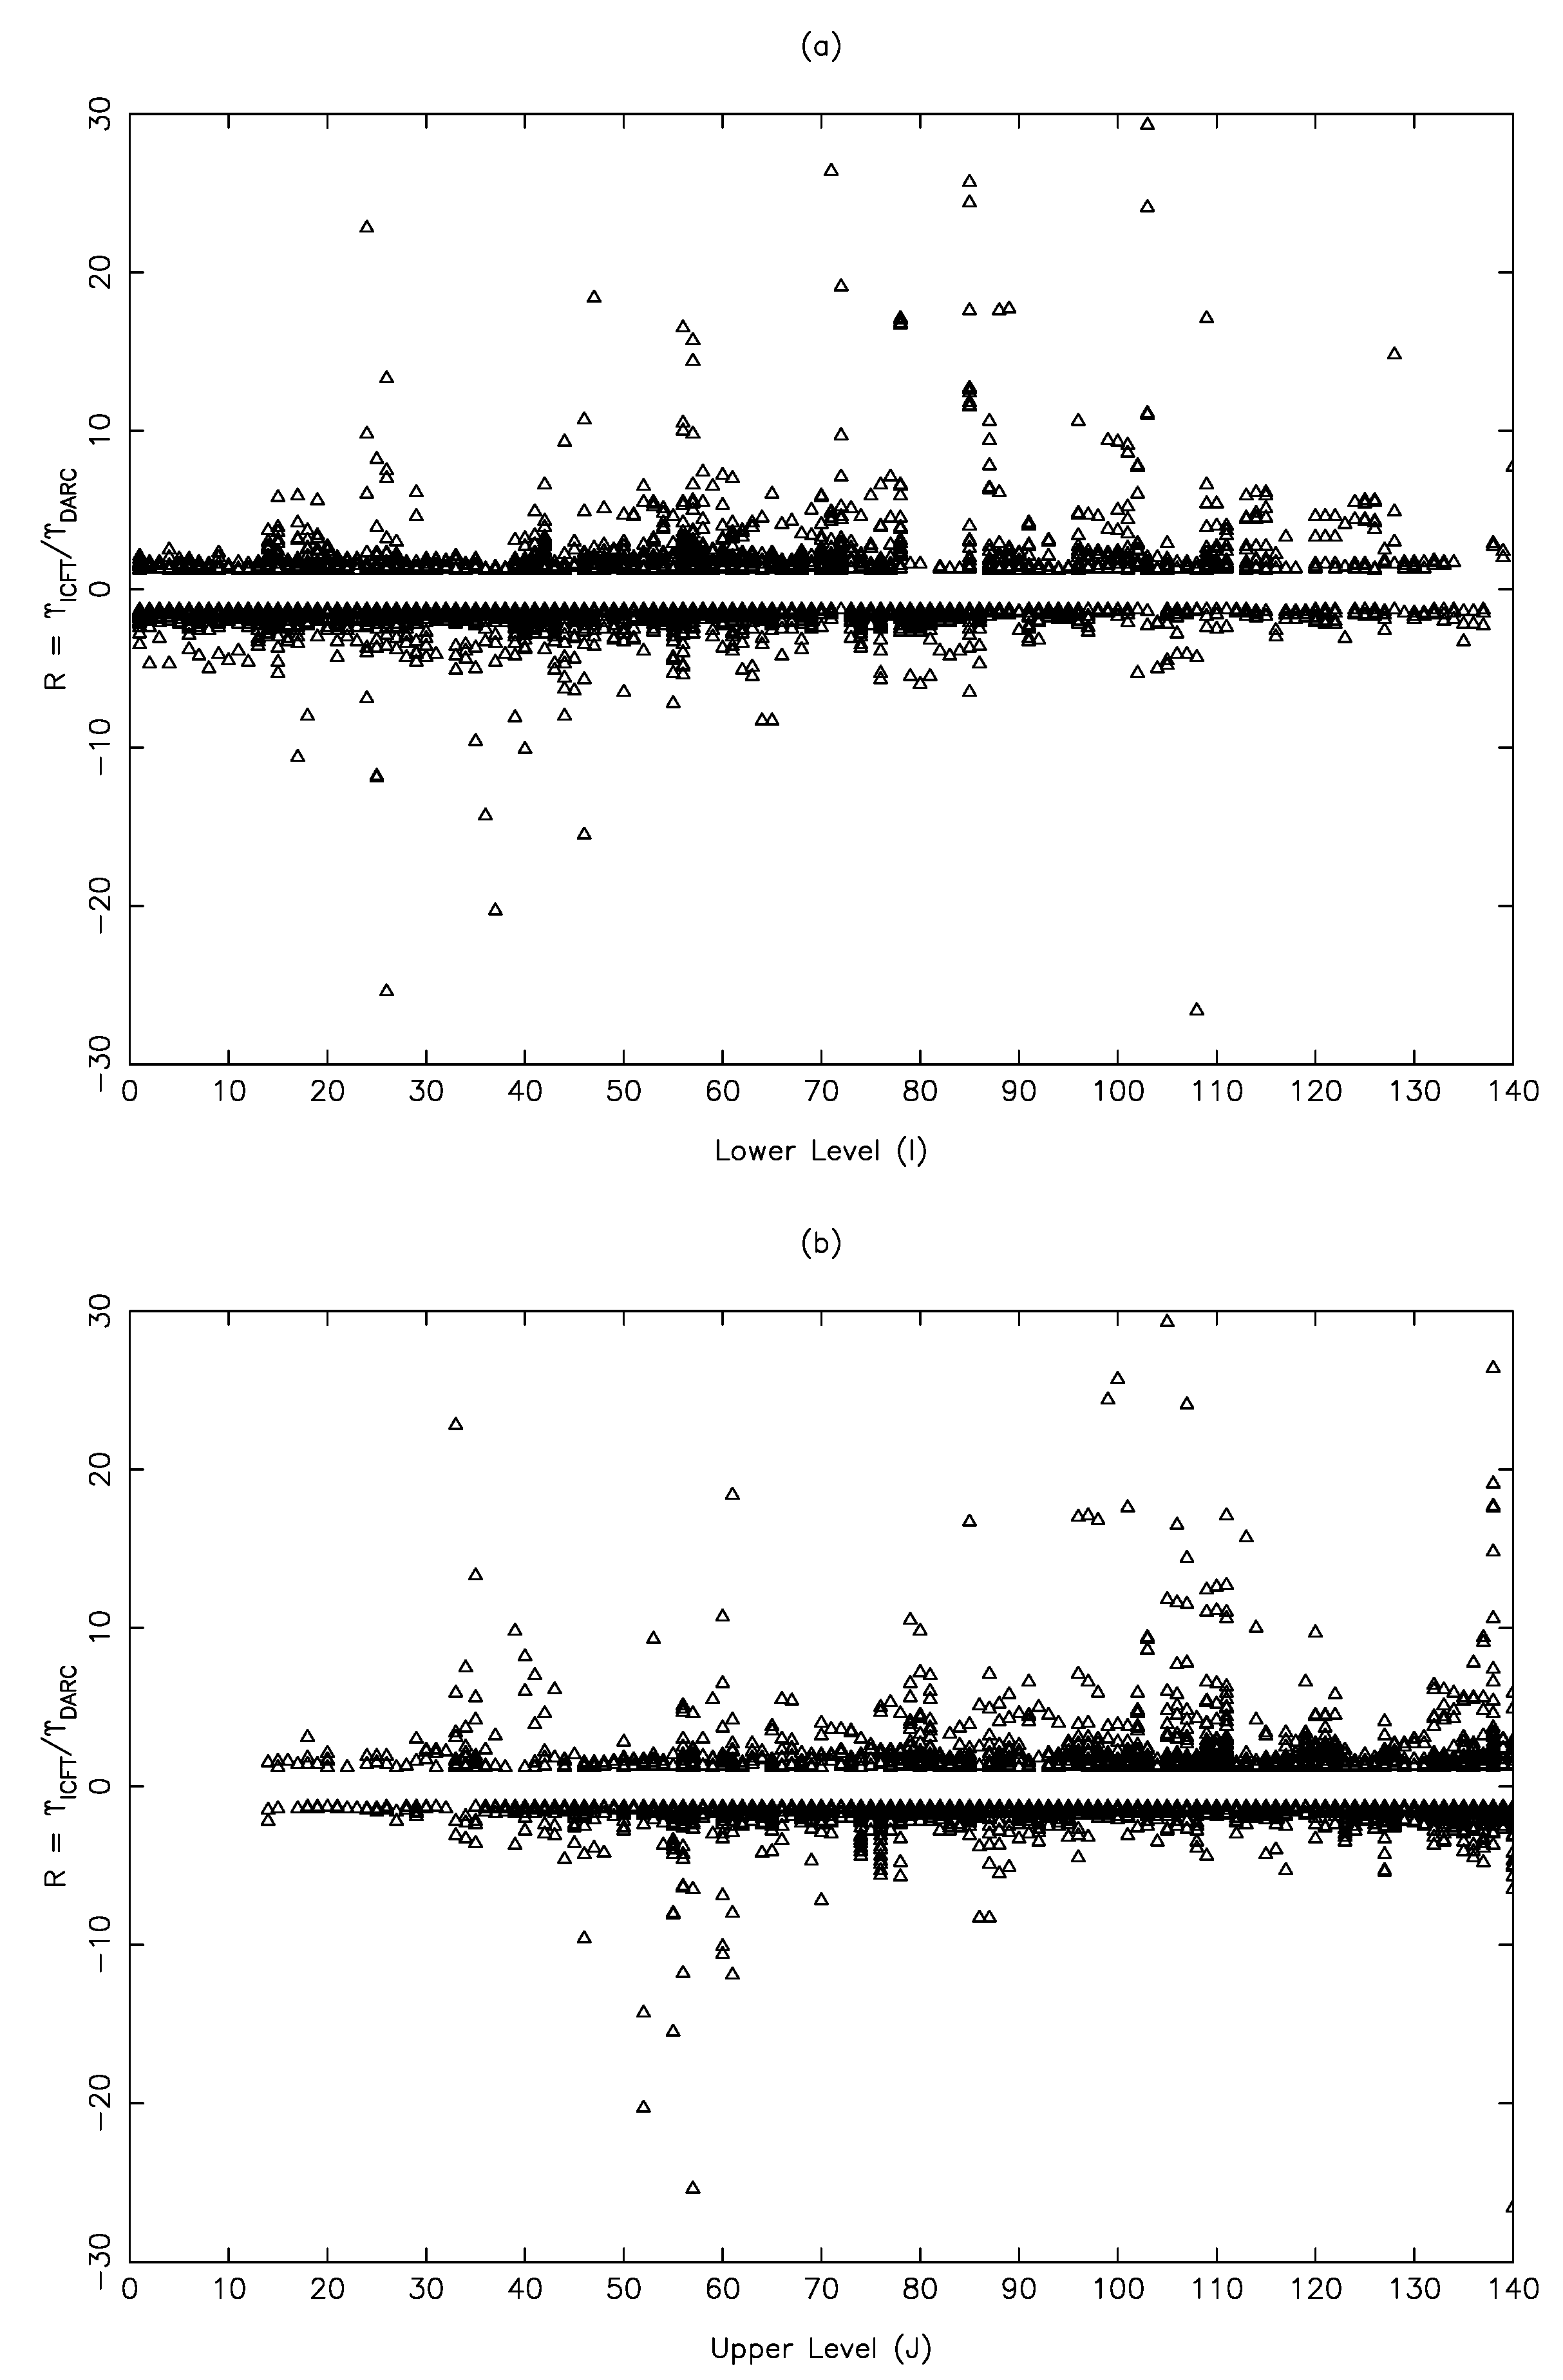
26] for all ions include 238 levels of the above listed 39 configurations. Additionally, for each ion, two panels are shown, one (a) for transitions from the lower (I) and the other (b) to upper levels (J). This is because sometimes, they reveal different (i.e., more specific) conclusions. Finally, for brevity and clarity, only those transitions are shown that differ by over 20%.
For Al X, comparisons in
Figure 1 are shown only among the lowest 78 levels because beyond that, those from higher configurations (included in ICFT, but not in DARC) intermix. It is clear from this figure that for a majority of transitions,
>
, and a reasonable agreement between the two independent calculations is only for transitions among the lowest ∼60 levels, as clearly seen in
Figure 1b. For this ion, the reasoning of a larger model given by [
62] and shown in their Figure 2 appears to be plausible. However, even for the transitions in C III for which our calculations [
32] included a considerably larger number of levels (166), the discrepancies are large, as shown in
Figure 2. In fact, for transitions only among the lowest 20 levels, there is a satisfactory agreement between the two calculations; see
Figure 2b. Therefore, the differences seen here do not appear to be because of a larger model included by [
26]. This is further confirmed by
Figure 3 for the transitions of N IV for which both calculations include exactly the same number of levels (and from the same configurations), but the satisfactory agreement is only for transitions among the lowest ∼30 levels. Furthermore, these differences (discrepancies) increase with increasing temperature as discussed and demonstrated in our earlier papers [
32,
33,
61]. Similarly, the discrepancies shown here in
Figure 1,
Figure 2 and
Figure 3 are only for a limited number of transitions. Considering all transitions, these are much larger. For example, at
K, discrepancies of over 20% are up to four orders of magnitude for about 40% of the transitions of N IV [
33], and in the majority of cases,
>
. We also note here that another calculation with DARC was performed for N IV with the same 166 levels as for C III. However, differences between the two sets of
were (expectedly) insignificant at all temperatures, thus further confirming that a larger model does not necessarily improve the calculated results. We discuss the reasons below for large discrepancies noted between the DARC and ICFT results.
Apart from the included number of levels (discussed above), there can be several other reasons for the large discrepancies in
, such as (i) the (non-)convergence of
w.r.t. partial waves, (ii) an insufficient range of energy included for the determination of
, (iii) the energy resolution of resonances, (iv) the presence of pseudo and/or spurious resonances, and (v) differences in the CSFs. However, none of these factors is responsible for the large discrepancies noted above and already discussed in detail [
33,
61]. The likely reason is that the ICFT calculations for
are mostly performed up to a very limited energy range, whereas the results for
are determined up to a very high temperature. In order to do that, the range of
is extended to a high (infinite) energy through the formulations suggested by Burgess and Tully [
65], whereas the DARC calculations for
are performed up to a reasonably high energy to determine
up to a limited range of T
, but sufficient for application to a wide range of plasmas. For example, for N IV Fernández-Menchero et al. [
26] calculated values of
up to an energy of 17 Ryd (or only 11 Ryd above the thresholds), but reported
results up to
K, equivalent to ∼200 Ryd. Therefore, they have extrapolated their
results over a very (very) high energy range, and that is the likely cause of the large discrepancies noted between the DARC and ICFT calculations. For the same reason, the behaviour of their
results for several transitions is abnormal. For example, for the forbidden transitions, their
values increase with increasing T
, whereas the opposite is expected; see [
33,
61] for detailed comparisons and a discussion. We also stress here that the problem is not with the ICFT methodology, but its implementation. If the calculations are performed with reasonable compromises, then there should be no large discrepancies between any two calculations, and this has been discussed and demonstrated on several earlier occasions (such as [
66]) and most recently by Turkington et al. [
6] for the transitions of W LXIV; note particularly the differences of up to 3 Ryd in energy levels (as discussed in
Section 2), but the similarity of the results for
and
, as shown in their Table III and Figures 1–5.
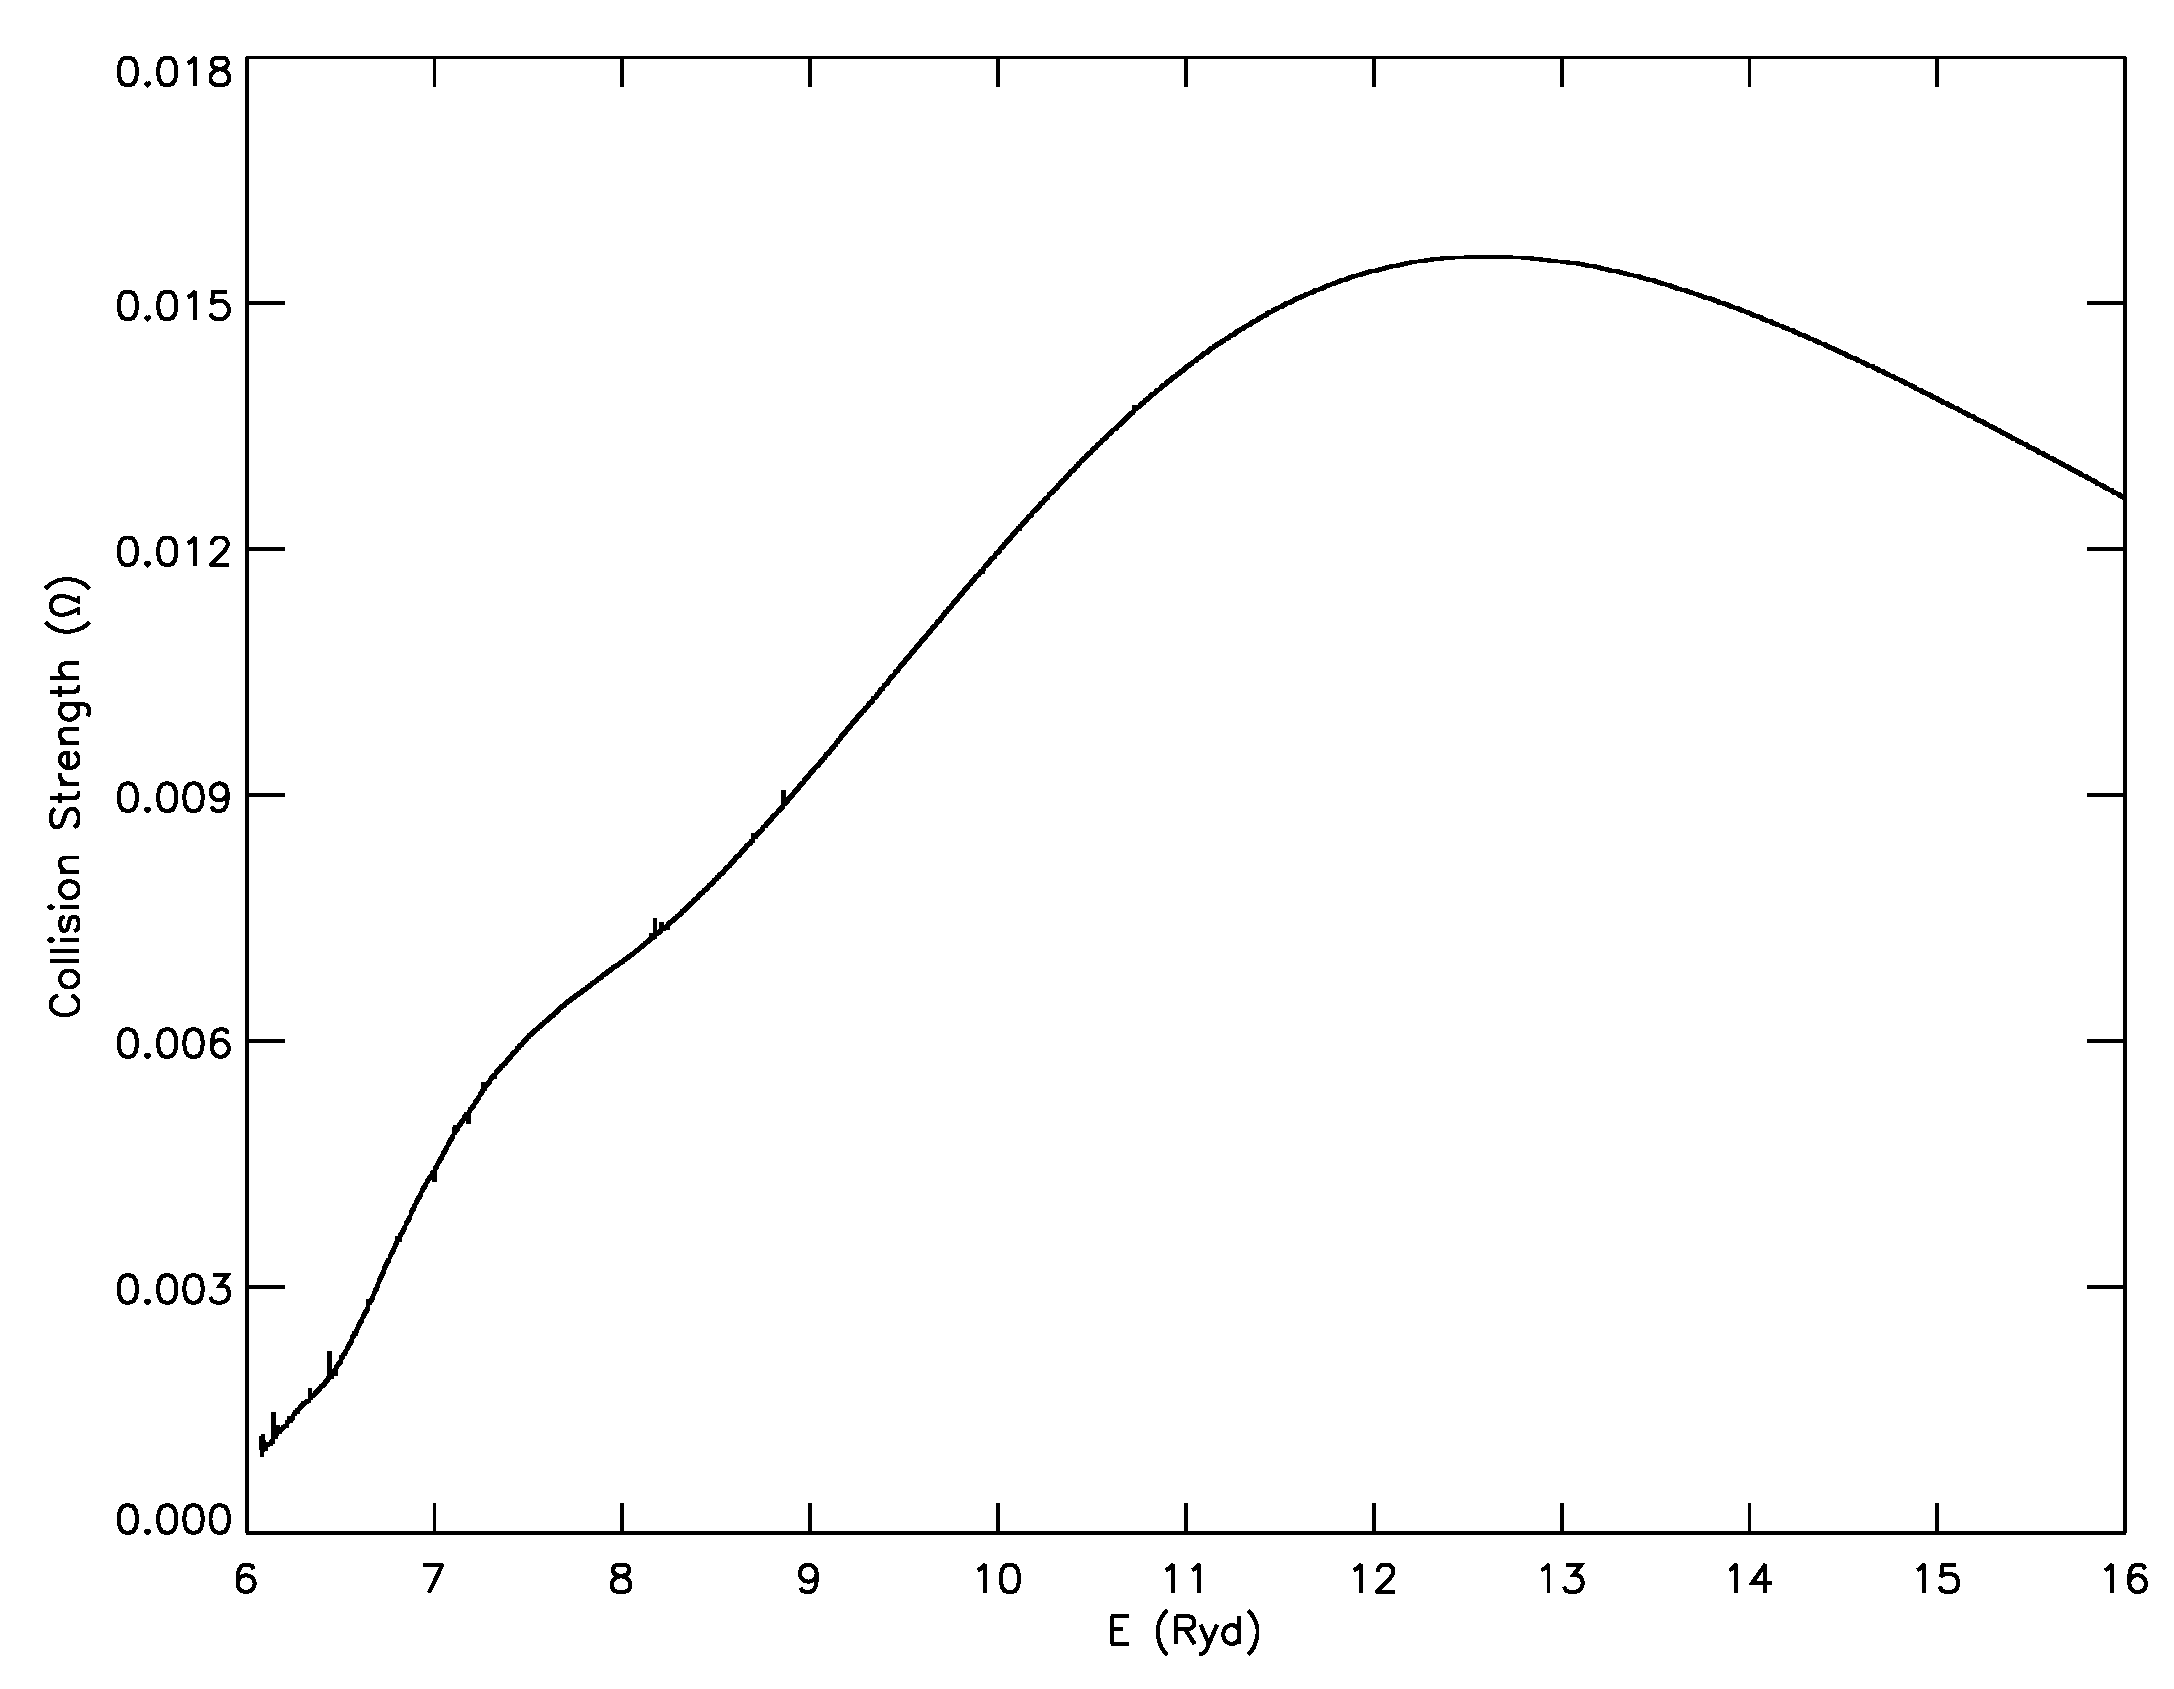
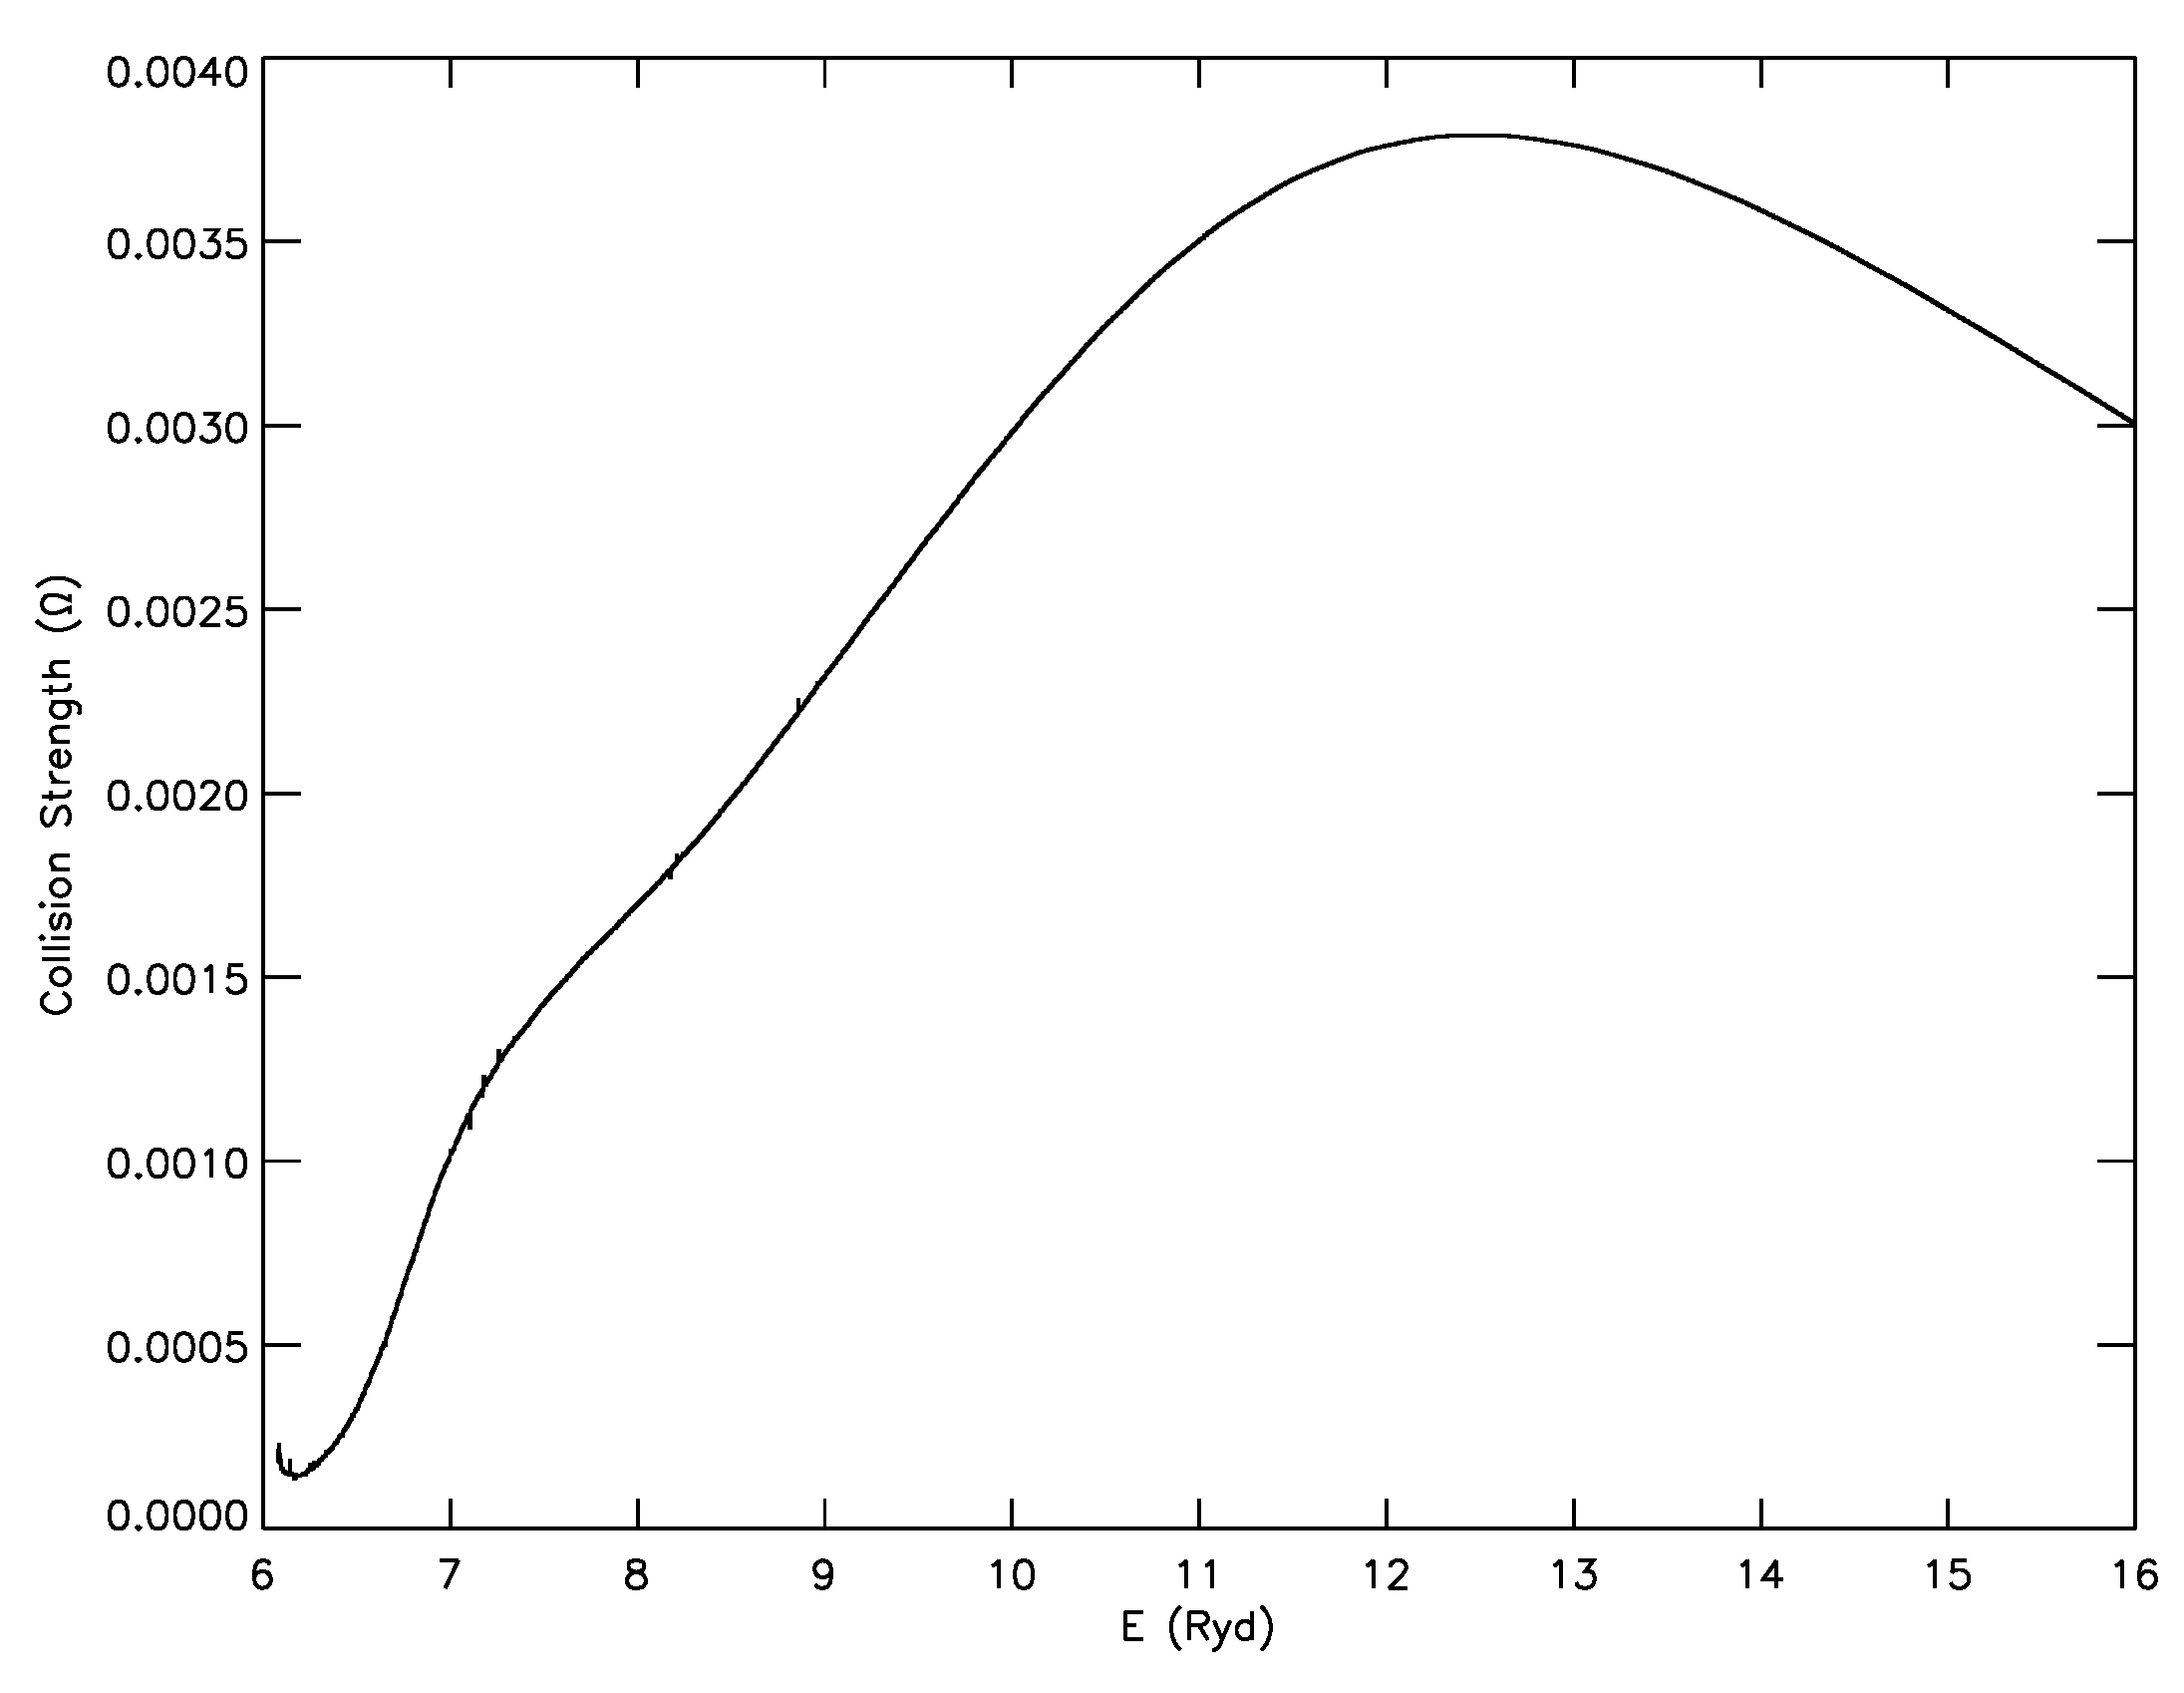
Most of the discrepancies noted in
values for any transition between any two independent calculations are (often) a direct consequence of the corresponding differences in the
values. Unfortunately, a majority of authors do not report the
results, and hence, it becomes difficult to identify the real reason for the large discrepancies. However, the lead author of [
26], i.e., Luis Fernández-Menchero, has very kindly supplied us the
data for a few transitions of N IV, particularly those for which the discrepancies between the DARC and ICFT
are the greatest. In
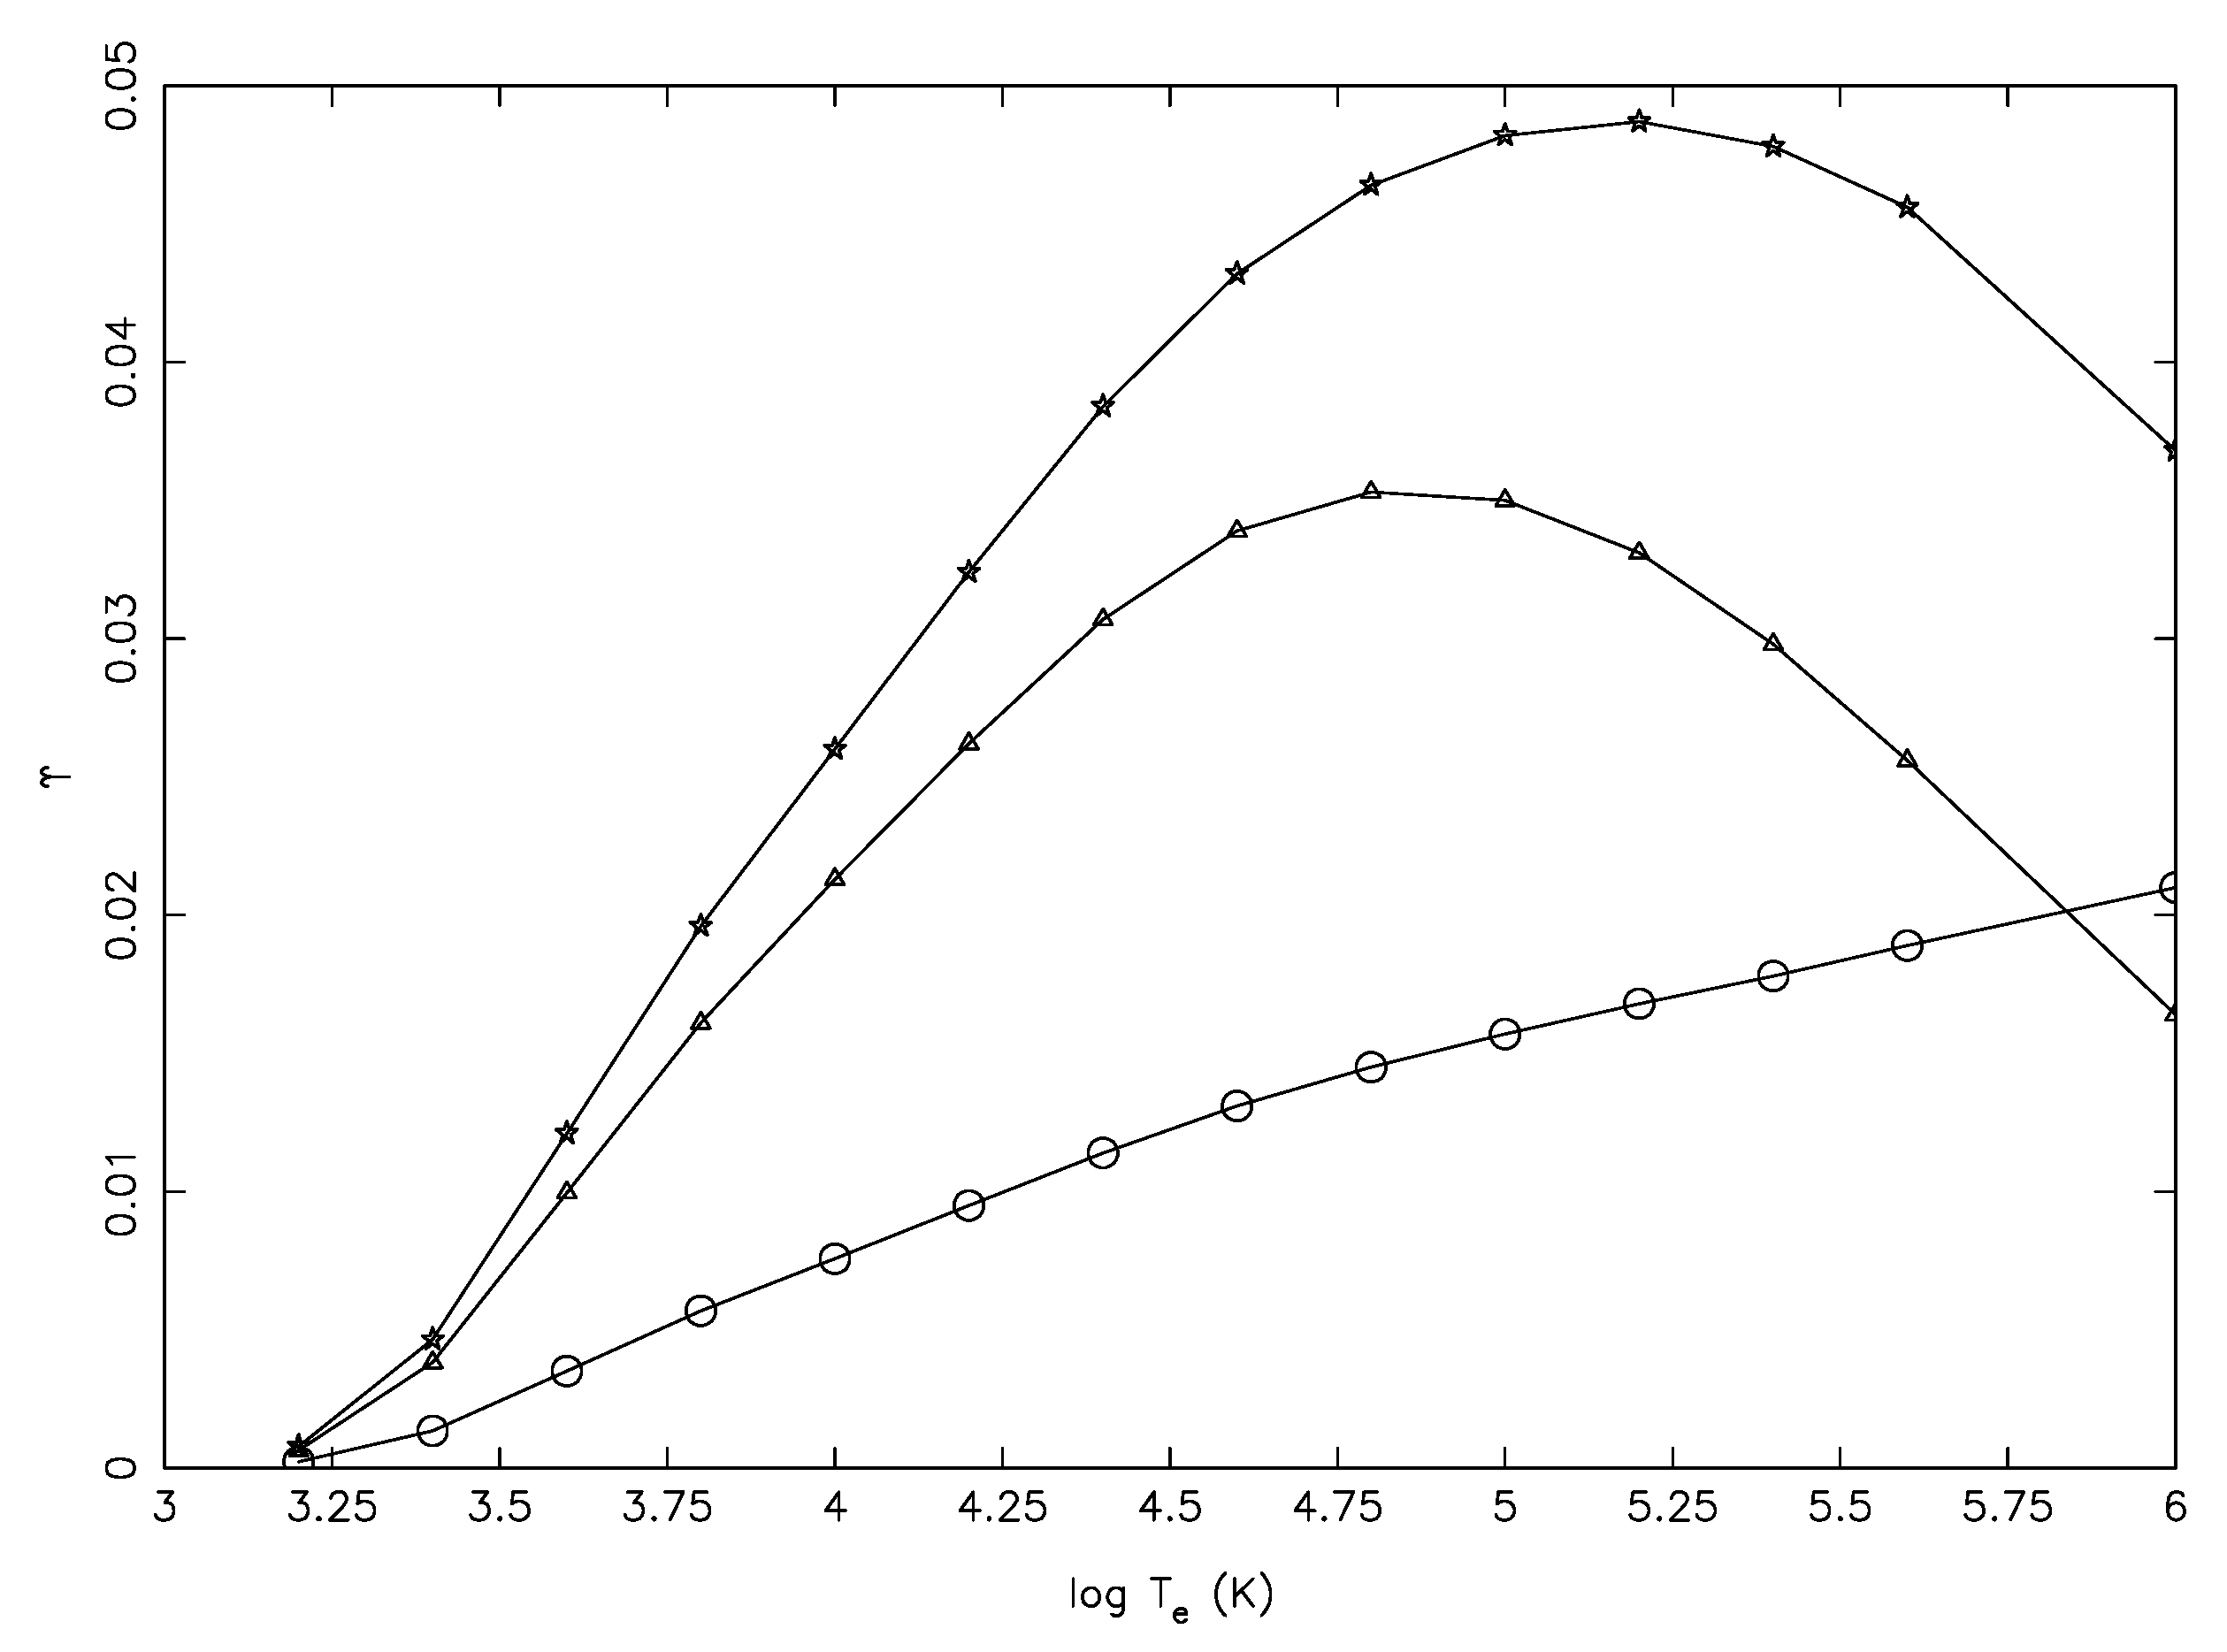
Figure 4 and
Figure 5, we show their
in the 6–16 Ryd energy range for only two transitions, namely 30–232 (2s4s
S
–2p7d
D
) and 30–235 (2s4s
S
–2p7d
P
); see Table 1 of [
33] for the definition of all energy levels. Both of these transitions are forbidden, but their upper levels are very close to the highest level 238 (2p7d
S
) considered in both calculations. This means that the energy range for resonances (if any) is very narrow (<0.02 Ryd) and insignificant, and hence, the variation of
should closely follow that for their
values. It is clear from these two figures (which have been shared with Luis Fernández-Menchero) that the behaviour of their
results is not correct, as these should considerably decrease with increasing energy (as is the case in our calculations, although not shown here for brevity). Similar discrepancies and abnormal behaviour of
were noted earlier for transitions in Fe XV (see Figures 1–6 of [
67]), but were later rectified by Berrington et al. [
66].
The overestimation of
values through the ICFT approach has not been restricted to the Be-like ions alone, but to others, as well; see [
1] for H-like, He-like and Li-like ions. More recently, similar discrepancies (and overestimations of
) have also been noted for Al-like Fe XIV [
68] (although later defended by Del Zanna et al. [
63]) and Ar-like Fe IX [
69]. Finally, we briefly discuss transitions in Si III, which is an important Mg-like ion for astrophysical applications. For Mg-like ions, including Si III, Fernández-Menchero et al. [
70] have performed ICFT calculations with 283 levels belonging to the 3
, 3
ℓ4
ℓ and 3
ℓ5
ℓ configurations. On the other hand, our calculations with DARC [
55] include only 141 levels of the 3
and 3
ℓ4
ℓ configurations, but discrepancies between the two sets of
are over 20% and up to two orders of magnitude for about half the transitions, and at all temperatures; in particular see Figure 5 of [
55] for the anomalous behaviour of
by [
70]. These discrepancies have already been discussed in our recent paper [
55], but in
Figure 6a,b, we show the comparisons of the transitions for Si III at T
= 1.8×10
K, as in
Figure 1,
Figure 2 and
Figure 3 for Be-like ions. Unfortunately, the only transitions for which there is satisfactory agreement between the two calculations are those within the lowest 29 levels alone. It may be worth noting here that the additional 142 levels included in [
70] are not above the 141 considered in [
55], but are closely intermixed. In some instances, the levels of a higher configuration are distinctly above those of the lower ones and, hence, clearly influence the calculations for
, particularly for transitions among the lower levels; see for example the case of Mo XXXIV [
71] or neutral helium [
72].
Most of the discrepancies discussed above are between the DARC and ICFT calculations for
. However, there are other examples also, apart from those discussed earlier in [
1]. For the transitions of Mg V, Hudson et al. [
73] reported results among the lowest 37 levels of the 2s
2p
, 2s2p
, 2p
, 2s
2p
3s, and 2s
2p
3p configurations, for which they adopted the standard non-relativistic
R-matrix code. Recently, Tayal and Sossah [
27] extended these calculations, apart from making other improvements, to 86 levels of the 2s
2p
, 2s2p
, 2p
, and 2s
2p
3
ℓ configurations. Based on comparisons for only a few transitions, they concluded a good agreement for ‘most’ transitions between their results of
and those of [
73]. Unfortunately, this was not found to be true as discussed in our work [
56]. In fact, the discrepancies between the two calculations are up to three orders of magnitude for over 80% of the transitions, and in most cases, the
of [
73] are higher; see Figure 1 of [
56]. Furthermore, the discrepancies increase with increasing temperature, because [
73] calculated
only up to an energy of 28 Ryd, but determined
up to T
= 10
K, i.e., ∼63 Ryd, without any extrapolation of the
data.
Unfortunately, the
of [
27] are also not correct for many transitions of Mg V, and at almost all temperatures because of a variety of reasons, discussed and explained in [
56]. Particularly, at higher temperatures, their
values increase with increasing temperature, irrespective of the (type of) transitions: allowed, inter-combination or forbidden. As an example, in
Figure 7, we show the variation of their
with T
for three forbidden transitions of Mg V, namely 19–86 (2p
3s
D
–2p
(
P)3d
P
), 24–86 (2p
3s
P
–2p
(
P)3d
P
) and 51–86 (2p
(
S)3d
D
–2p
(
P)3d
P
); see [
56] for level indices. For these (and many more) transitions, their
values increase over a large range of T
, whereas they should decrease as shown in Table 3 of [
56]. Since level 86 (2p
(
P)3d
P
) is the highest threshold in their (or our) calculations, there should be no resonances related to this level, but the increasing behaviour of their
indicates the presence of pseudo resonances.
This point has recently been contested by Wang et al. [
28]. Our speculation was based on the behaviour of
(as discussed in detail in [
56]), because the corresponding data for
were neither published, nor made available to us even after requests to the first author. However, Wang et al. [
28] had access to the
data of [
27], and therefore, they could diagnose the problem of using a (very) coarse energy mesh close to the highest threshold (86) of Mg V, which affected the results shown in Table 3 of [
56]. As a result, not only transitions related to this threshold were affected, but also others; see for example 19–78/81/82/84/85. Moreover, Wang et al. [
28] have speculated that both Hudson et al. [
73] and our results [
56] of
(and subsequently,
) have pseudo resonances, which is not the case. The reason for the higher values of
reported by [
73] has been fully explained in our work [
56] and is because of the limited energy range adopted by them. Similarly, we can confirm that there are no pseudo resonances in our
or
data. Therefore, as was advised in [
1], it is preferable if authors can publish (at least) some data for
, so that differences in the
results can be diagnosed. Alternatively, they should either make it available on a website or should provide the data upon request.
5. Conclusions and Suggestions
Numerous examples have been shown here for the large discrepancies noted for almost all atomic parameters of interest, mainly energy levels, A-values and . In a majority of cases, it is difficult to assess the accuracy of the published data without performing independent calculations, either with the same (or similar) or a different method. Unfortunately, this is not always possible because enough computational resources or expertise may not be available. More importantly, calculations for are particularly very computationally intensive for which large resources and months (if not years) of (computational) time are required. Since more and more levels are now being included in the scattering calculations, it is almost impossible to reproduce and verify the reported data with another similar work. Therefore, it is necessary for the producers of atomic data not to make mistakes in the first place and to make as many comparisons as possible. A limited comparison (as discussed for the transitions of Mg V) may lead to the wrong conclusions, and subsequently to incorrect results.
It is generally believed (and is mostly true) that if the wavefunctions (read energy levels) are more accurate, then so are the subsequent parameters, such as
and
. Similarly, a larger model should lead to more accurate results for
, because of the inclusion of additional resonances. However, neither of these are (strictly) true, as shown in this work; also see the very detailed work by Feldman [
74] on a series of ions. More importantly, in all scattering calculations, some compromises are made, because the number of CSFs, which are often included in the calculations of energy levels and A-values, are drastically reduced for computational reasons. Therefore, the accuracy achieved for these parameters is generally higher than for
and
. Nevertheless, most of the compromises made in reducing the CSFs are reasonable and do not lead to large discrepancies (of orders of magnitude) in the determination of
and
.
Most of the advice for avoiding large discrepancies in the calculations of atomic data has already been enumerated in our earlier paper [
1] and, hence, is not repeated again, because practically, these remain the same. However, large discrepancies and over a long period of time still remain for a series of ions between the DARC and ICFT results of
. This is in spite of the best efforts made by various workers, including those who generate data from these codes. As was emphasized earlier [
1], almost all working codes are under a continuous process of development and improvement, and the errors (as and when detected) are corrected. Similarly, there is always scope for improvement over any calculation, either by improving the accuracy of the wavefunctions and/or enlarging the size by inclusion of additional levels, and this has recently been demonstrated by Si et al. [
75,
76] for He-like ions and by Benda and Houfek [
77] for atomic hydrogen.
We hope the noted discrepancies between the DARC and ICFT results will also be soon resolved for the benefit of the users. Irrespective of the code adopted for a calculation, it is more important how it is implemented. All the compromises (and some are inevitable) made in performing a calculation should be reasonable and up to a limit. For example, up to what value of partial waves the calculations for
should be performed strongly depends on the energy, otherwise the results may be under-/over-estimated, as discussed in [
56,
78,
79]. Similarly, up to what energy the calculations for
should be performed strongly depends on the temperature up to which the values of
are required. If the results for
are extrapolated over an enormously large energy range (as often is the case with ICFT calculations) then the subsequent results for
may be inaccurate. Finally, very large calculations (involving hundreds of levels) for any ion should only be performed when absolutely necessary. This is because the chances of errors in such calculations are more, and these cannot be easily reproduced for verification and/or assessment.
It is encouraging to note that some efforts have already been made to resolve discrepancies in the
data. For example, very recently, Fernández-Menchero et al. [
80] performed yet another calculation for N IV by adopting the BSR (B-spline R-matrix) method. They have also highlighted a few reasons for the (possible) inaccuracies in the ICFT calculations, particularly for the weak spin changing transitions. Another point that we have repeatedly emphasised is the limited range of energy often adopted in the ICFT calculations, but extrapolated to a very large extent in order to calculate
up to very high temperatures. This exercise leads to the incorrect behaviour of
at higher energies, at least for some transitions, as shown in
Figure 4 and
Figure 5. Like our calculations with DARC, Fernández-Menchero et al. [
80] have also adopted a large energy range to avoid this possible source of inaccuracy. We hope if a similarly large energy range is adopted in the ICFT calculations, then the discrepancies in the
results may not be as striking as noted and demonstrated in this paper.


