
Regional Economic Convergence in Turkey: Does the Government Really Matter for? †

Faculty of Social Sciences and Humanities, Necmettin Erbakan University, Selçuklu 42060, Turkey
*
Author to whom correspondence should be addressed.
†
Authors’ Note: This paper is an extended and modified version of an earlier study titled “Regional Economic Convergence and Role of Government: A Case Study on NUTS 2 Regions in Turkey” which was presented in WEI 2016 Academic Conference held in Rome, Italy.
Economies 2017, 5(3), 27; https://doi.org/10.3390/economies5030027
Submission received: 21 March 2017
/
Revised: 6 July 2017
/
Accepted: 18 July 2017
/
Published: 24 July 2017
Abstract
:Solow (1956) has made an essential contribution to the Neo-classical growth approach through the economic convergence hypothesis. It assumes that poorer countries’ or regions’ per capita incomes tend to grow at faster rates than the richer ones. Convergence could occur either among a group of economies with the same steady states or within regions in which their fundamental dynamics differ, and thus they exhibit multiple steady states. This study aims to investigate convergence with respect to GDP per capita across NUTS 2 regions in Turkey for the time period 2004–2014. In the convergence process, we also inquire into role of government in terms of regional government investments and fixed investment incentives. All the empirical results confirm the validity of the convergence hypothesis at a regional level. Also, in the context of the convergence process, it is possible to conclude that the role of government is likely to be decisive in solving regional economic disparities.
Keywords:
regional economic convergence; regional incentives; government investments; regional economic disparities; panel data analysisJEL Classification:
R11; R50; C231. Introduction
In regard to Neo-classical growth theory, Solow (1956) asserts that poorer countries’ or regions’ per capita incomes tend to grow at faster rates than richer ones. Therefore, all countries or regions should converge in terms of per capita income eventually. In recent years, such a catch-up effect has been often discussed in many of the growth studies. Sala-i-Martin (1996a) states that the growing attention to the convergence concept has been attributed to a number of reasons. Firstly, the convergence approach allows testing validity of the modern growth theories and provides information about the share of capital in production. Secondly, along with emerging datasets covering a large number of countries, evolution of the convergence process has begun to be re-examined. In this regard, most researchers have focused on the question of whether per capita income tends to converge over time across countries or regions (Barro and Sala-i-Martin 1991, 1992; Mankiw et al. 1992; Sala-i-Martin 1996b; Lall and Yilmaz 2000; Michelis et al. 2004; Varblane and Vahter 2005; Lopez-Rodriguez 2008; Bonnefond 2014).
Regional disparities are one of the most important phenomena that can be encountered in almost every economy, especially in underdeveloped and developing countries where industrial activities are relatively low and infrastructure investments are lacking (Chaudhuri 2001). In the context of regional disparities, the convergence concept has also dealt widely with different aspects. At a regional level, convergence can be mentioned only if growth takes place via reducing inter-regional income disparities. Otherwise, an increase in income could cause a ‘divergence’ effect across regions. In the latter case, the role of both investments and incentives to relatively less developed regions provided by the public sector is assumed to be important to the effort to close the gap. Myrdal (1957) and Hirschman (1958) state that government affects both national and regional economies positively in terms of infrastructure, education, and health investments. Thus, government investments can be considered as external shocks to stimulate lagging regions and give rise to convergence across regions (Button 1998). Moreover, governments often design some measures including financial and non-financial support and incentives in order to ensure more rapid development in certain regions or economic activities. In this respect, investment incentives could influence investment decisions or give rise to increases in profits at a regional level (Ginevičius and Šimelytė 2011). According to the Republic of Turkey Ministry of Economy (2014), investment incentives basically aim to reduce regional development disparities, steer savings into high value added investments, boost production and employment, increase foreign direct investments, and promote investments for clustering and environmental protection. In this respect, governments may use some instruments such as value added tax (VAT) exemption, customs duty exemption, tax deduction, income tax withholding support, and land allocation to further accelerate investment decisions.
Regional economic disparities reveal many economic, social, and political problems. First of all, the fact that there are so many serious differences between the regions is a symptom which induces inefficient economic structure. Especially since the 1960s, regional development has always been a main part of the development policies which have been implemented in Turkey. In recent years, differences between regions stand as an important controversial issue within both planned development efforts and the process for joining the European Union. However, despite all the policy proposals, debates and struggles, regional disparities in Turkey are still quite problematic (Filiztekin 2009). In empirical literature, it can be said that various studies which mainly focused on regional disparities and the process of convergence revealed different results for Turkey. Thus, a group of studies conclude a significant convergence between regions (e.g., Tansel and Gungor 1998; Sağbaş 2002; Erlat 2005; Yildirim et al. 2009; Ersungur and Polat 2010; Önder et al. 2010; Zeren and Yilanci 2011; Aslan and Kula 2011; Karaalp and Erdal 2012; Gerni et al. 2015; Özgül and Karadağ 2015), while others indicate that there is no tendency to converge across regions in Turkey (e.g., Filiztekin 1999; Berber et al. 2000; Erk et al. 2000; Gezici and Hewings 2004).
This study aims to investigate the existence and degree of convergence among 26 NUTS1 2 Regions in Turkey for the time period between the years 2004 and 2014. We also examine the role of government in terms of regional investments and fixed investment incentives in the convergence process. The dataset used in this analysis is obtained from the Turkish Statistical Institute (TurkStat), the Republic of Turkey Ministry of Development, and the Ministry of Economy databases. In this respect, the originality of this paper is said to be two-fold. First, the study discusses the midterm regional reflections of the economic reforms which have been put into effect in 2001 in Turkey. In this context, the Investment Incentive Program which is first introduced by Incentive Law No. 5084 in 2004 provides a number of advantages to the priority provinces and regions in development2. Some of the objectives of the program are to reduce regional development disparities, increase foreign direct investments, and encourage regional and large scale strategic investments. Accordingly, regional incentive applications include: (i) customs tax exemption; (ii) VAT exception; (iii) tax reduction; (iv) insurance premium support for employers; (v) investment grants; (vi) interest support; (vii) support for income tax withholding; and (viii) insurance premium support (Republic of Turkey Official Gazette 2012). Secondly, as a primary indicator of the convergence process, we use an up-to-date data of per capita GDP which has just been released at a regional level, instead of proxy variables. Thus, we might well take into account income convergence in both the cross-sectional and panel data of the regions.
The rest of the paper is organized as follows. Section 2 presents the theoretical background of convergence hypothesis. Empirical literature is reviewed in Section 3. Dataset and methodology used in analysis is given in Section 4. Section 5 presents results from econometric investigation of convergence process in NUTS 2 Regions and the last section discusses the results and concludes the paper.
2. Theoretical Background of Convergence Approach
In recent years, there has been much concern about convergence analysis in growth studies investigating the spillover effect of growth components across countries or regions over time. In this regard, the phenomenon of the convergence process is referred to as beta (β) and sigma (σ) (convergence in the literature. In the context of β-convergence, a pioneering study by Sala-i-Martin (1996b), which extends the empirical evidence on regional growth and convergence across the United States, Japan, and five European countries, indicates that regions similarly tend to converge at a speed of approximately 2% annually. Another type of convergence is σ-convergence which emerges only if there are declines in the dispersion of real per capita income across economic units over time (Sala-i-Martin 1996b, p. 1327). In other words, σ-convergence is concerned with the behavior of the cross-sectional standard deviation, or of the coefficient of variation of per capita output over time.
As a seminal paper, Baumol (1986) conducts a long-run convergence analysis within sixteen industrialized countries and introduces a basic method for testing the convergence in the context of the Neo-classical growth model in a cross-sectional regression. A modified and expanded version of this approach by Barro and Sala-i-Martin (1991, 1992) assumes that there is an inverse relation between the growth rate of an economy and the distance from its steady state only if all the economies share same steady state. Hence, convergence to same steady state is also called as ‘absolute’ or ‘unconditional’ β-convergence. However, if the economies have different steady states in terms of their technological level or saving rates, then such an inverse relation will no longer be in question (Magrini 2004). If ignorance of such cross-sectional differences is reasonable, convergence occurs as ‘conditional’ β-convergence. Thus, each economy conditionally approaches its own unique equilibrium. In this case, some specific explanatory variables which may potentially affect the convergence process and represent proxies for the different steady states get involved in analysis. Furthermore, it can be said that the convergence analysis evolves with panel data techniques in recent studies (e.g., Islam 1995; Lee et al. 1998; Gaulier et al. 1999; Michelis and Neaime 2004; Piras and Arbia 2007; Ranjpour and Karimi Takanlou 2008; Shen et al. 2008; Cuaresma et al. 2011; Bonnefond 2014).
In the context of convergence analysis, σ and β-convergence have been subject to debate in some of the initial studies. Friedman (1992) and Quah (1996) argue that β-convergence in a cross-section regression only demonstrates the average behavior of the units and so it is irrelevant and uninformative for a distribution's dynamics. Also, regression fallacies arising from the tendency of a unit of variable such as income to move toward the mean over time are addressed to β-convergence analysis. Thus, they state that σ-convergence should be of primary interest in examining whether the distribution of income across economies is becoming more equitable (Friedman 1992; Quah 1996). However, Sala-i-Martin (1996b) suggests that these two concepts deal with the convergence process in different ways. Accordingly, σ-convergence discusses how the distribution of income evolves over time, while β-convergence focuses on the mobility of income within the same distribution (Sala-i-Martin 1996b, p. 1328). Moreover, Temple (1999) discusses potential problems such as endogeneity, the correlation in error terms, and measurement errors in estimating and interpreting growth regressions. In the case of β-convergence, Baumol (1986) asserts that conditional convergence takes place between a group of countries which are identical in initial conditions and some other factors. So, there are actually more than one ‘convergence club’, which belongs to industrial countries, middle income countries, and the poorer, less developed countries respectively (Baumol 1986, p. 1080). In respect to the convergence process, Romer (1996) concludes that countries are headed towards their balanced growth paths and differences in paths are due to differences in their initial capital endowments. Also, less developed countries with lower capital intensity have higher marginal capital efficiency; this causes the flow of capital from the developed countries to the underdeveloped countries (Romer 1996, p. 28).
3. Convergence Studies in Turkey
In the empirical literature, there is a vast amount of studies investigating economic convergence at regional and provincial levels in Turkey. In this context, it is possible to evaluate these studies in chronological order, as given in Table 1. As one of the preliminary studies that emerged in the related period, Tansel and Gungor (1998) examine convergence in productivity measures across 67 Turkish provinces between the years 1975 and 1995. Results of the analysis show the presence of σ-convergence for the 1980–1995 period and absolute β-convergence in productivity measure for the whole period across the provinces. In the conditional analysis, they conclude that both saving rates and human capital increase the convergence rate among the provinces. Findings also imply a faster rate of convergence between homogenous groups of poorer and richer provinces in comparison with the total set of provinces. Notwithstanding, using provincial-level data on GDP and GDP per capita for the 1975–1995 period, Filiztekin (1999) is concerned with the same period considering single cross-sectional analysis. The results provide evidence that provinces diverge in an absolute sense in all periods except 1990–1995, though the rate of divergence is low. However, he finds evidence of conditional convergence of about 1.7% per year when region-specific dummies and the share of agriculture in total provincial output are included in the analysis.
In another study, Berber et al. (2000) test the convergence hypothesis in seven geographical regions in 1975–1997 period. In this study, it is concluded that the regions do not converge in terms of per capita income and also diverge from each other. This result also partially overlaps with the research findings of Erk et al. (2000) which show no evidence for σ and absolute β-convergence across the 67 provinces in the 1979–1997 period. Sağbaş (2002) claims that the growth takes place in a path and it reduces the income disparities between the provinces in the 1986–1997 period. In context of conditional convergence, Sağbaş (2002) also examines the effects of public expenditures on the convergence process. However, he does not find any significant relationship between the public expenditures and the growth rates of the provinces in the second part of analysis. On the other hand, Gezici and Hewings (2004) empirically examine convergence across provinces and 16 functional regions in Turkey for the period 1980–1997. It is concluded that convergence between regions or provinces has not been observed in the related period. Within the 1975–2001 period, Erlat (2005) also does not find a clear evidence of convergence across provinces or regions. Another study by Yildirim et al. (2009) attempts to explore the causes of regional income inequalities and the convergence process across NUTS 1 regions for the 1987–2001 period. The results support the β-convergence hypothesis in terms of the higher speed of convergence in the relatively poorer Eastern and Southeastern regions. In the context of conditional convergence, they also find that the impact of real per capita government expenditures is relatively more outstanding in developed Western regions. Also, these results were partially confirmed in another study conducted by Ersungur and Polat (2010) for the same period. In another study dealing with control variables in the convergence process, Önder et al. (2010) examine the relationship between public capital, transportation capital stocks, and output per capita at NUTS 2 level. The findings of the conditional model based on the panel dataset for the 1980–2001 period indicate that per capita public capital stock has a positive and significant effect on output per capita and somewhat on regional convergence. Contrary to this, the effect of the transportation component of public capital stock on regional convergence is found as negative in all the models employed.
26 NUTS 2 regions
In the context of convergence analysis, Aslan and Kula (2011) consider structural breaks and thus a stochastic convergence process for the 67 provinces in Turkey. Using data on per capita income over the period 1975–2001, their analysis offers strong evidence for convergence except for the provinces of Bitlis and Erzurum. However, panel data techniques are also used for convergence analysis in some of the studies. For instance, Zeren and Yilanci (2011) empirically investigate regional convergence among NUTS 2 regions for the 1991–2000 period. Their analysis, which is based on the panel data with the random effects estimator, points out the validity of both absolute and conditional convergence across NUT 2 regions. At a region-specific level, they also conclude the validity of absolute convergence for 17 regions and conditional convergence for 25 regions. The results indicate that deposits have a positive impact on per capita income. In another study, Karaalp and Erdal (2012) examine the effects of agglomeration economies and the growth of neighboring cities on the convergence process at a provincial level. In the context of analysis, agglomeration coefficients in the Turkish manufacturing industry are calculated using the Herfindahl Index, the Gini Coefficient, and the Location Quotient for the period between 1993 and 2001. Results from the panel data estimation of β-convergence model indicate that income differences between provinces decrease over time. In another empirical study, Gerni et al. (2015) examine convergence at both the provincial and regional levels in Turkey over the 2004–2012 period. The results from the analysis indicate that per capita income increases lead to an absolute convergence between regions. Lastly, a recent study by Özgül and Karadağ (2015) consider welfare measures and socio-economic indicators to investigate convergence across NUTS 2 regions in Turkey for the 1990–2001 period. In this context, the cross-sectional analysis of convergence reveals some evidence of unconditional convergence in Turkey. The results also show that socio-economic indicators have no effect on regional growth in the convergence process.
4. Data and Model
In this study, we analyze income convergence along with a dataset which includes both cross-sectional and time series data for 26 NUTS 2 regions3 for the time period between 2004 and 2014. We prefer real GDP per capita in order to measure income as the dependent variable. Also, concerning the purpose of investigating the role of government in the convergence process, we employ regional per capita government investments and per capita fixed investment incentives as control variables in this analysis. In generating per capita values of control variables, we use regional population estimations for the 2004–2006 period and the Address-Based Population Registration System (ABPRS) for the 2007–2014 period. The dataset is obtained from TurkStat (2017a, 2017b), Republic of Turkey Ministry of Development (2015), and the Republic of Turkey Ministry of Economy (2016). Also, all the data are expressed in Turkish Lira (TL) and in real prices. For this purpose, we use the consumer price index at a national level.
As already mentioned in Section 2, σ-convergence occurs when income differentiation between economies decreases over time. In this respect, it is possible to say that dispersion of income levels can be measured by standard deviation of income per capita among economies. Also, the coefficient of variation (CV) can be used instead of standard deviation. In the analysis process, we use the coefficient of variation of GDP per capita which is formulated in Equation (1).
Additionally, we conduct a regression of trend line of CV for GDP per capita to verify decreases in dispersion over time. In Equation (2), the dependent variable is the coefficient of variation of GDP per capita levels across regions while the independent variable is the time variable () for the period between 2004 and 2014.
For the purpose of investigating absolute or unconditional β-convergence, we regress a logarithmic equation based on cross-sectional data. In Equation (3) the left-hand-side of the equation form represents the average growth rate of region in the time period (). Also, is initial year of period and is a constant.
Additionally, we prefer a modified version of Equation (3) in order to test conditional β-convergence considering the specific characteristics of each region. In Equation (4) the and represent per capita regional government investments and fixed investment incentives, respectively.
In panel data models, the choice of the estimation model is often discussed due to several reasons such as controlling for individual heterogeneity, informativeness, variability, and multicollinearity (Baltagi 2005, pp. 4–7). In general, one can choose between pooled ordinary least squares (OLS), fixed effects (FE), and random effects (RE) in estimation, considering different assumptions. In this respect, a pooled OLS approach assumes that the error term is independent of the cross-sectional units and individually and identically distributed (I.I.D.). So, it does not take time-invariant specific effects into account. Instead, the FE or RE consider object-specific time-invariant effects (Wooldridge 2010). Also, the FE model is often applied when the differences between regions can be viewed as parametric shifts of the regression (Greene 2003, p. 293). We estimate the regression form given in Equation (5), which is based on panel data, in order to investigate convergence hypothesis.
In Equation (11), where represents GDP per capita in region i while and are regional government investments and investment incentives, respectively. Also, following Barro and Sala-i-Martin (2004), we calculate the speed of convergence4 as given in Equation (6).
According to the equation, if convergence occurs () then higher initial income levels have a negative effect on final growth. Thus, β measures the annual convergence rate of an economy towards its steady state income level.
5. Empirical Findings
In this section, we conduct an analysis based on the CV of regions, cross-sectional OLS, and panel data in order to investigate and verify σ and β convergence approaches for 26 NUTS 2 Regions in Turkey. The models that we employed are estimated for different specifications, including pooled OLS and FE estimators, that is, depending on different assumptions about the error term. The results from the analysis are presented in the sub-sections.
5.1. σ-Convergence of NUTS 2 Regions
Table 2 reports the results obtained from the analysis of σ-convergence for NUTS 2 Regions. The results indicate that coefficients of variation and standard deviation tend to decrease when real GDP per capita decreases across regions. In other words, during the process of growth, real GDP per capita levels of the regions become more equal and the variation between their real GDP per capita levels decreases. Thus, one might say that -convergence exists across NUTS 2 regions in Turkey for the time period 2004–2014.
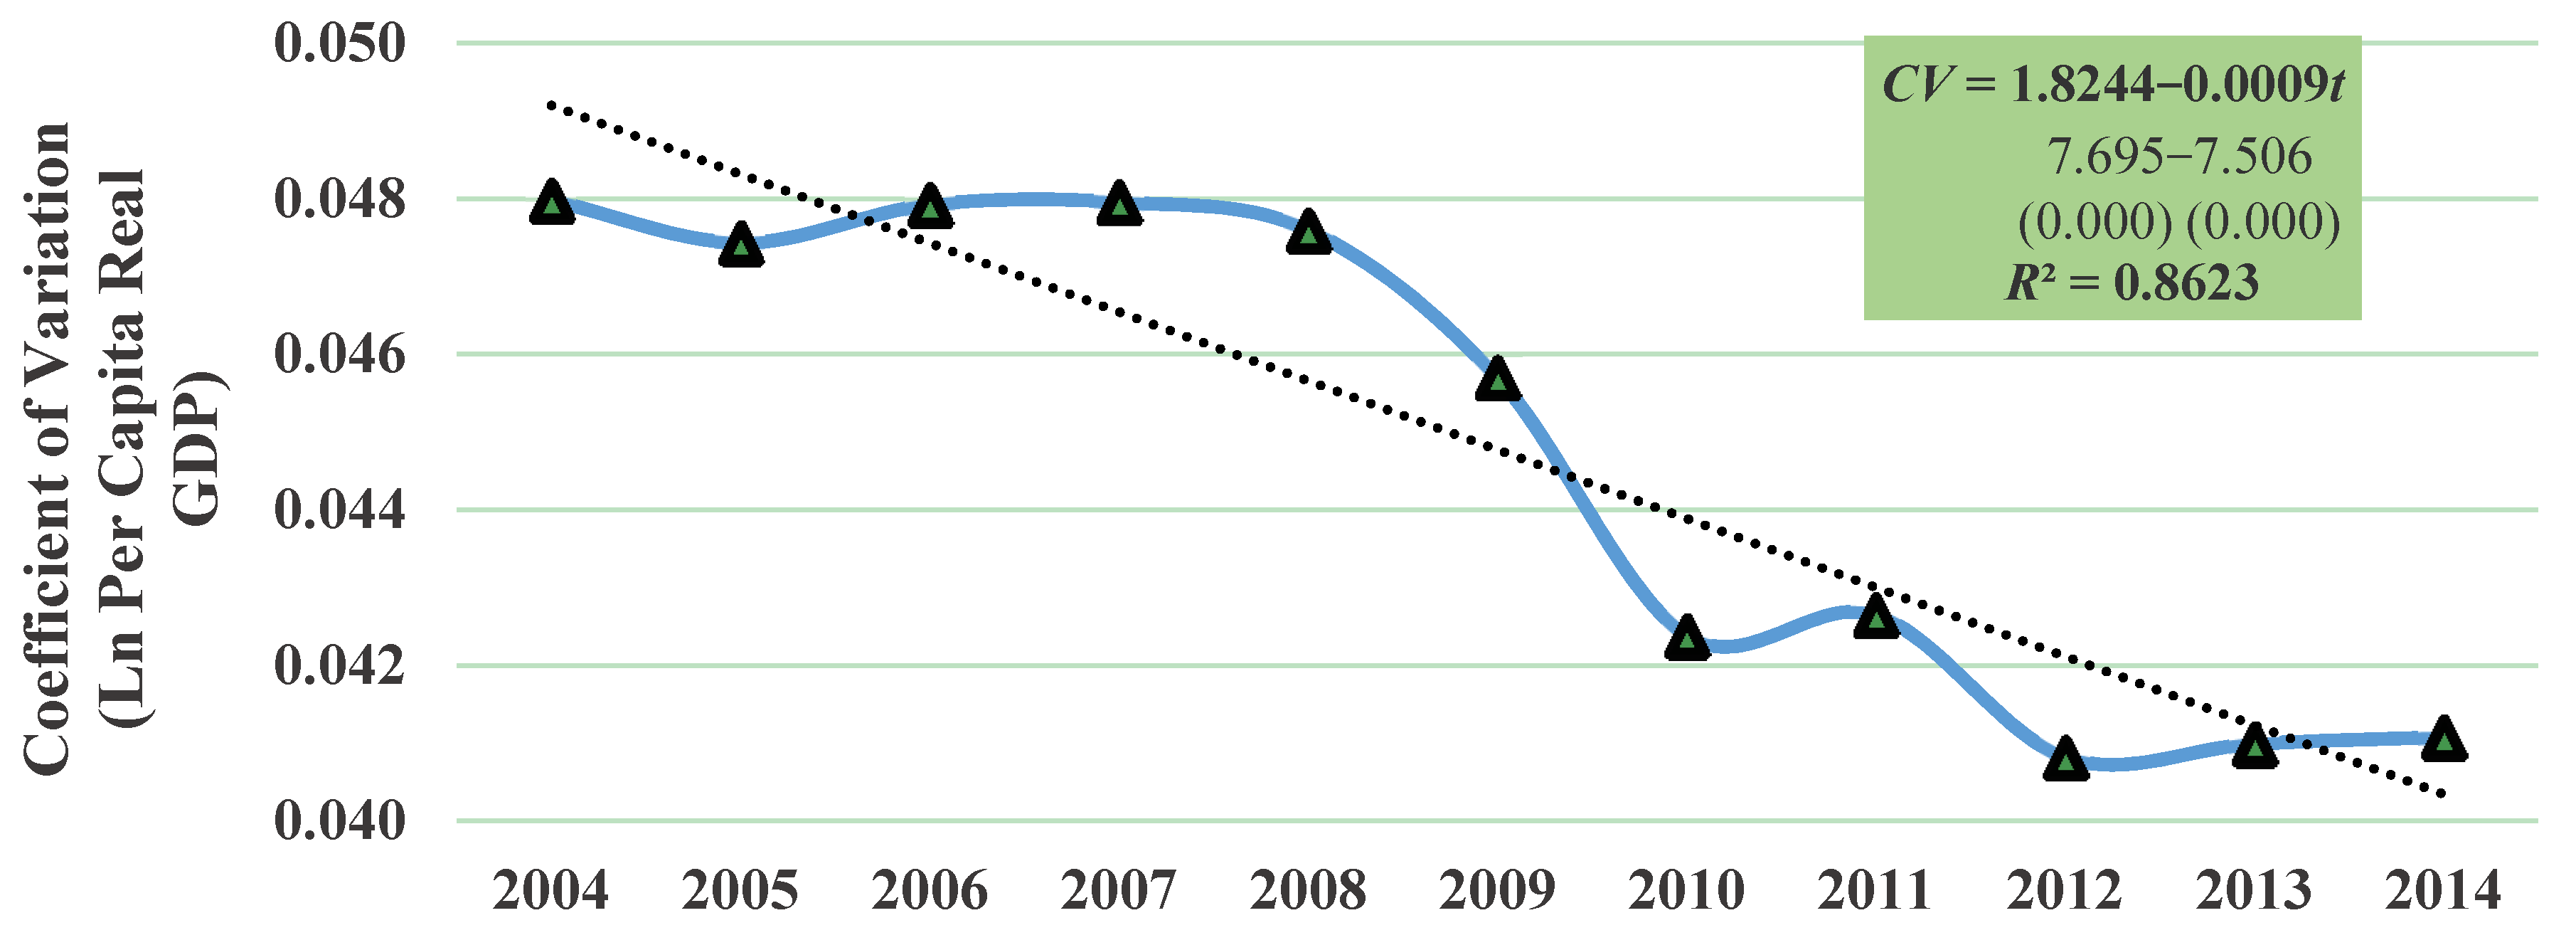
In Table 2, data show that the standard deviation of the per capita real GDP of the regions is 0.4148 in 2004 (it decreases to 0.3647 in 2012). However, the NUTS 2 regions tend to diverge relatively in the last two years and differentiation increases up to 0.3704 among regions in 2014, as well as a slight increase in the year 2006 and 2011. Thus, it causes a divergence effect across regions, as can be seen in Figure 1. However, during 2004–2014, it is possible to conclude that sustainable growth rates in per capita GDP enable lower income dispersion at a regional level.
Figure 1 shows the coefficients of variation of NUTS 2 regions along with the trend line for the whole period. Thus, it can be said that the NUTS 2 regions reveal s-convergence during 2004–2014. The CV of the regions decreases over the period except in the year 2006. In 2004, the CV of the regions is 0.0473, and it decreases to 0.0373 in 2014. In this period, average GDP per capita of the NUTS 2 regions increases about 13%. Also, Figure 1 reports the trend line regression of the regions where the dependent variable is the coefficient of variation of real GDP per capita levels across regions and the independent variable is the time variable () in order to verify analysis. Accordingly, the result of the significant and negative t-value of time variable () indicates the presence of σ-convergence.
5.2. Absolute and Conditional β-Convergence of NUTS 2 Regions
In the context of absolute (unconditional) convergence, Table 3 shows the results of β-convergence of NUTS 2 Regions. The model is estimated for cross-sectional OLS where explained and explanatory variables are associated with one period or a point in time. So the variables are considered to be associated with a sequence of points in time. As the table shows, the parameter of the initial year GDP per capita is significantly negative. Therefore, it can be said that there is clear evidence of the presence of unconditional β-convergence across regions by means of this estimation method.
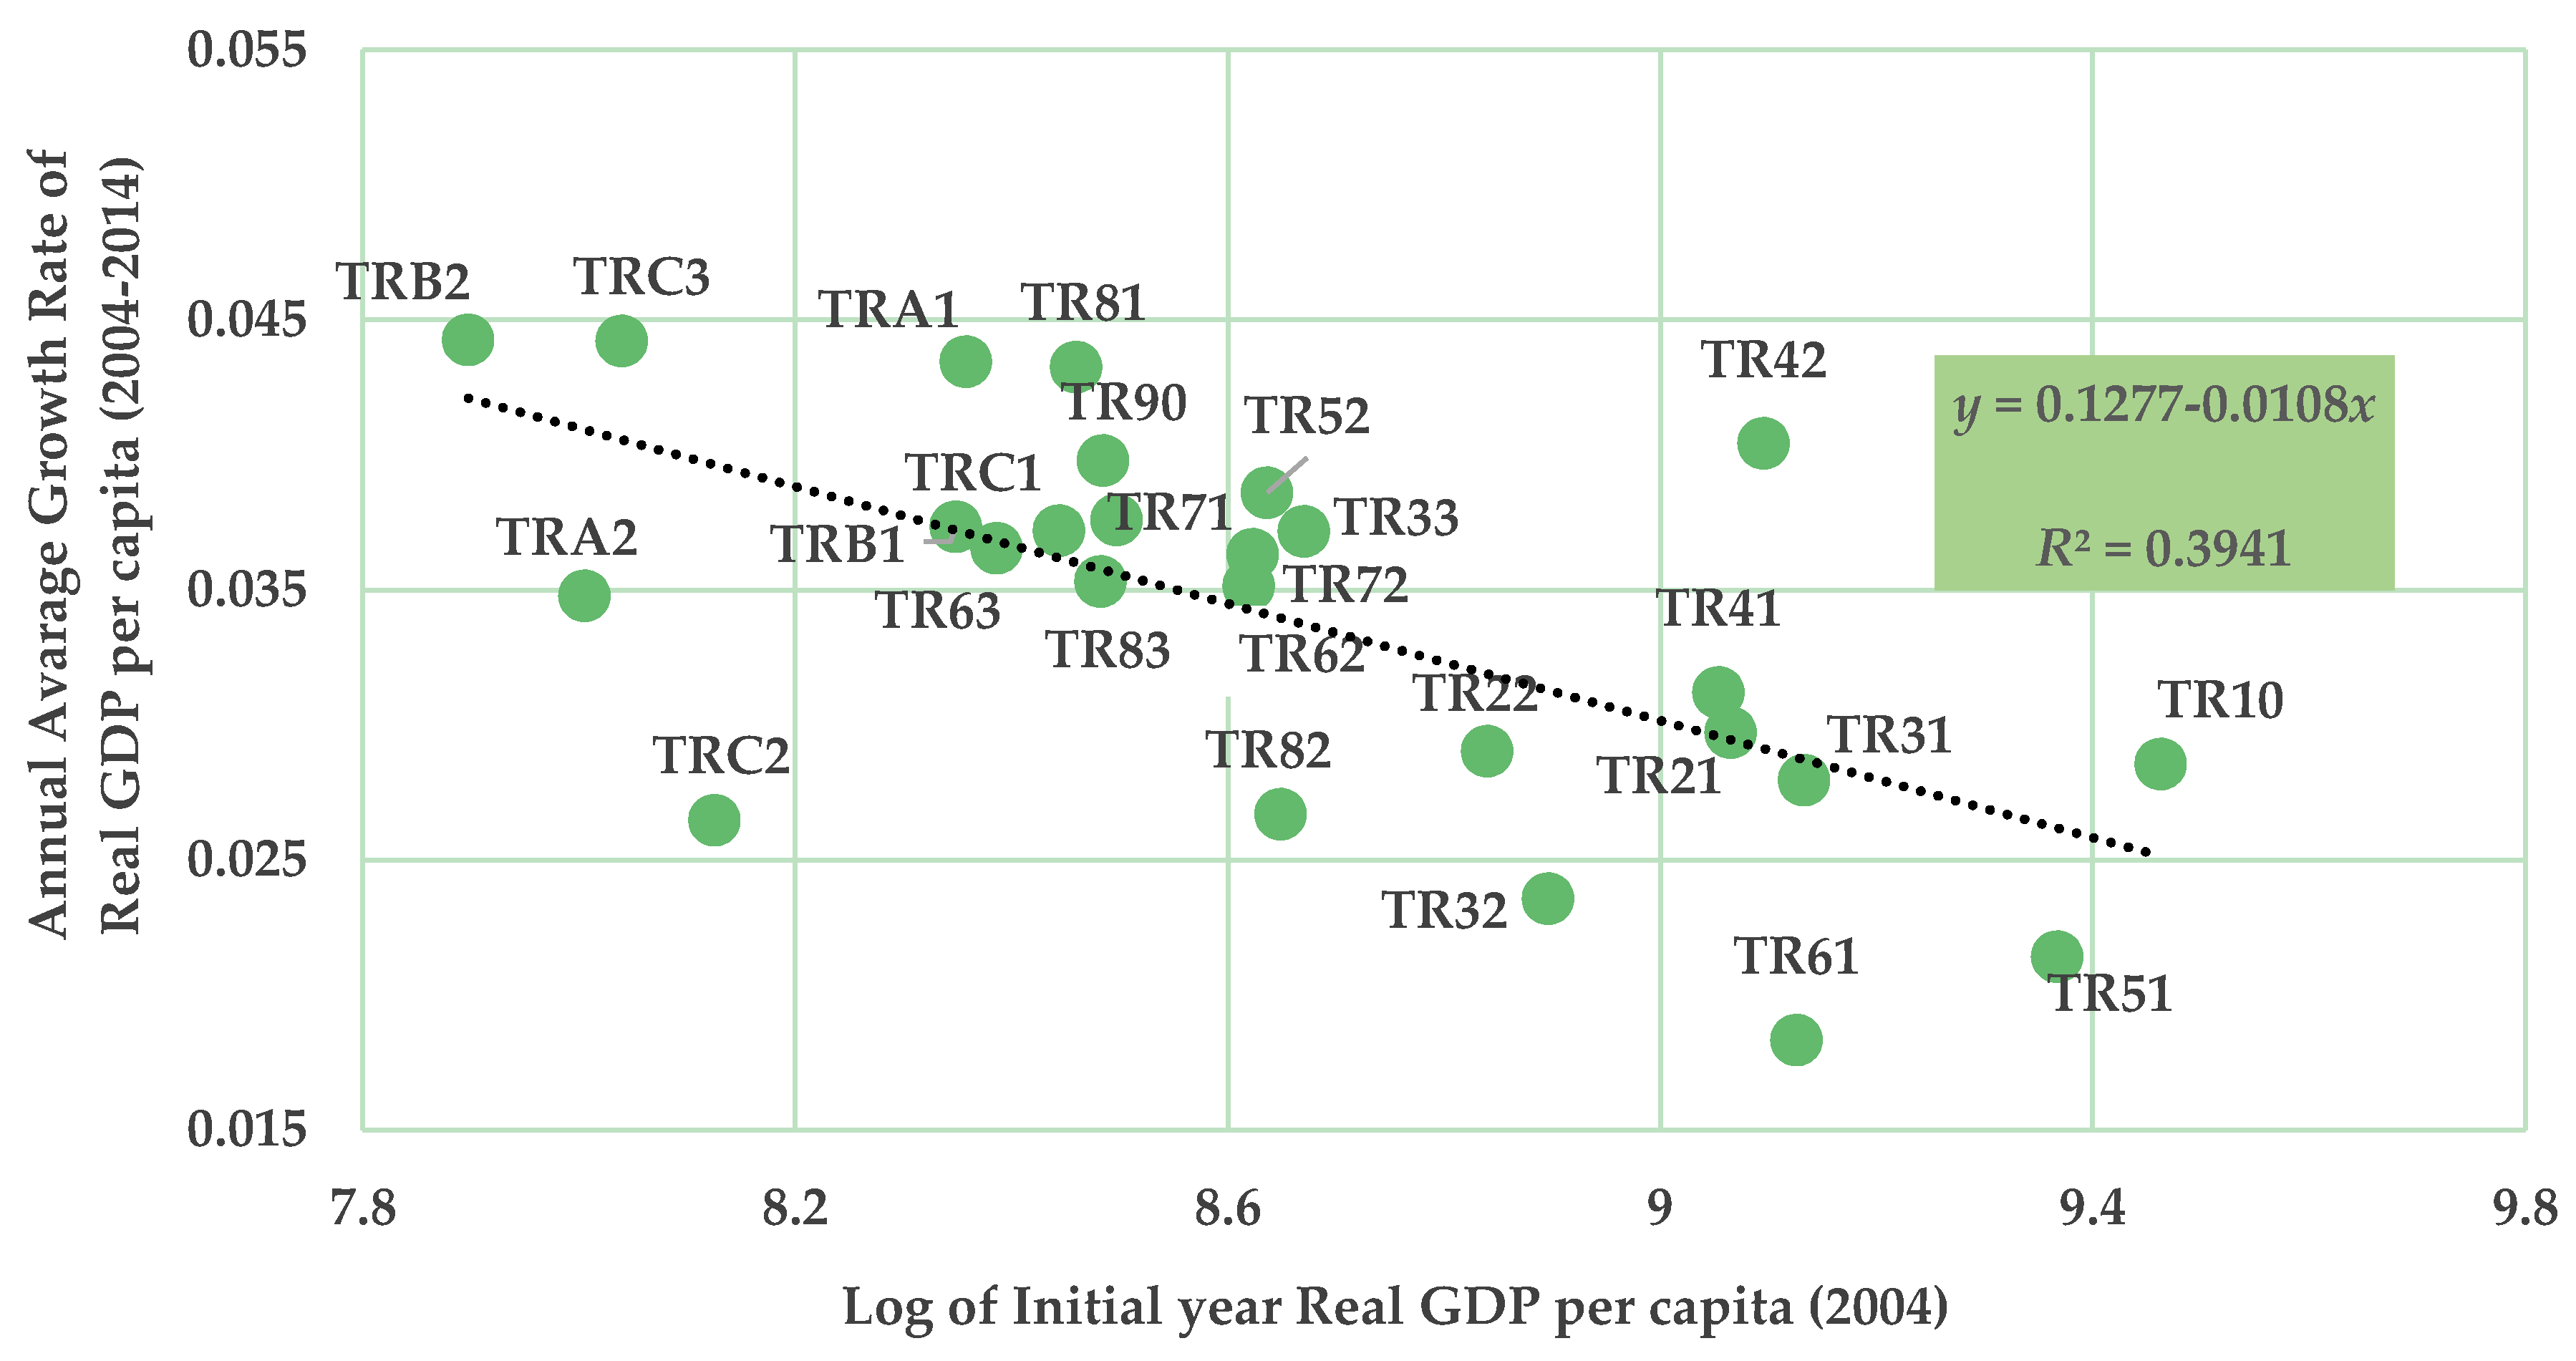
In Table 3, the sign of coefficient of the initial year real GDP per capita variable is (−0.0108), as we expect. The explanatory power of the model is 39.4%5, and the overall significance of the model (F test) is fitted. Besides, the speed of convergence (β) calculated by the slope of the regression line implies that the NUTS 2 regions reduce the distance towards the common steady state by 1.15% annually. Thus, it is a relatively low speed of convergence value compared with those observed worldwide by Sala-i-Martin (1996b). In this regard, it can be mentioned that regions experience a relatively slow catching-up process for this period. The results are also reported in Figure 2.
The results of absolute β-convergence of NUTS2 regions are depicted in Figure 2 where the x axis is the annual growth rate of real GDP per capita over the period 2004–2014, and the y axis is log of the GDP per capita in 2004. The p-value of the regression in Figure 2 is 0.000. The figure also allows the comparison of the regions regarding β-convergence hypothesis. Following Barro and Sala-i-Martin (1992), it assumes that pure differences in the level of technology do not affect β (in case the underlying parameters of technology and preferences are likely to be similar but are different in other respects). So the assumption that the steady state value is the same for all economies and technological progress does not differ across regions implies that poorer economies tend to grow unconditionally faster than rich ones (Barro and Sala-i-Martin 1992, p. 227). In the 2004–2014 period, regions with lower initial GDP per capita (e.g., TRB2, TRA2, TRC3) experienced relatively higher average growth rates. Conversely, richer regions such as TR10 (Istanbul province), TR51 (Ankara province), and TR31 (Izmir province) recorded a relatively slow growth.
Table 4 reports the estimation results of conditional β-convergence based on cross-sectional data for the period 2004–2014. Accordingly, the coefficient of initial year real GDP per capita has a significantly negative sign (−0.0175), implying the existence of conditional convergence in NUTS 2 regions. The fixed investment incentives variable has a significantly positive coefficient value at %0.5 significance level. This result shows that the fixed investment incentives provided by government are one of the determinants in regional growth.
Among the other control variables in Table 4, the sign of the coefficient of total regional government investments is estimated as positive but statistically insignificant. The coefficient of determination (R-square) is 50.9% and it is quite high vis-a-vis the absolute convergence model. Lastly, the estimated speed of convergence is 1.94% and it is a much higher value compared with the absolute convergence model. Thus, it is possible to say that government investments and fixed investment incentives enhance the rate of convergence across regions in the related period.
5.3. Panel Data Analysis of the Convergence Approach
In addition to the cross-sectional analysis of convergence, we test the convergence mechanism within the panel data approach. Generally, panel data may include individual-specific or time-specific effects. If any of these effect is the case, then a fixed or random effects estimation could be employed. The fixed effects model incorporates region-specific effects into regression that are not included explicitly. Thus, the model amounts to including a dummy variable for each region. Alternatively, a pooled OLS can also be preferred if there are no unique attributes of units and no well-accepted effects across time within the data set. However, overleaping any of the effects would lead to biased and inconsistent estimation results (Greene 2003; Wooldridge 2010).
Table 5 shows the panel data results of β-convergence of NUTS 2 Regions. In the estimation process, we employ two control variables ((i) per capita government investments; and (ii) per capita fixed investment incentives) and four models involving different combinations of the independent variables. The models are estimated for pooled least squares and FE estimators in order to compare results. In Table 5, model I includes all the control variables. Model II and III are derived from Model I by eliminating the control variables one by one and model IV also does not include any of the control variables. In this respect, model IV aims to test absolute β-convergence using the panel data approach. Lastly, Hausman test statistics, with which we check the relationship between explanatory variables and error terms in order to choose between FE and RE estimators, are given at the bottom of the table.
Firstly, we report that the coefficients of log of initial year real GDP per capita in all the estimated models are significant and negative. Thus, we reach a conclusion of conditional β-convergence for NUTS 2 Regions in Turkey between 2004 and 2014. In addition, the estimated coefficient of Log of real GDP per capita in Model IV confirms the presence of absolute β-convergence of the regions on panel data for the same period.
In Table 5, coefficients of control variables are positive in all the models but they differ by a significant level in pooled OLS and FE estimations. In the context of pooled and FE estimations, positive coefficients of per capita investment incentives (model I and II) are found statistically significant at 1% and 5%, respectively. Thus, it can be argued that this result differs from earlier evidence obtained by Gerni et al. (2015). Also, in model III, the government investments variable had significant coefficients in both pooled and FE estimations despite the fact that it has insignificant coefficient in the FE estimation of model I. Lastly, considering the explanatory power of the models, FE estimators exhibit quite high goodness of fit in all the models comparing the pooled OLS approach.
However, it can be said that there is a vast debate on the literature regarding the estimation problem of speed of convergence when using panel data models, including pooled OLS and FE estimators (Barro and Sala-i-Martin 1995; Canova and Marcet 1995; Durlauf and Quah 1999; Arbia and Piras 2005; Piras and Arbia 2007). Barro and Sala-i-Martin (2004) state that one potential problem with the FE approach is related to working on many time series observations which are obtained by shortening the time periods, e.g., yearly, within growth rates. Thus, such short time spans might capture only short-term adjustments around the trend and cause an upward bias in the estimating speed of convergence (Barro and Sala-i-Martin 2004, p. 496). An earlier study by Islam (1995) which used the FE estimator to control for individual specific-time invariant effects produced extremely high convergence rates among economies. Arbia and Piras (2005) conclude that one should include a long time series in the panel data in order to overcome such a problem. Nevertheless, this is yet another issue in the panel data, considering the difficulties of obtaining the long time series at a regional level. Due to the reasons mentioned above, we do not calculate the speed of convergence in the panel data analysis.
6. Conclusions
This study aims to empirically investigate convergence across NUTS 2 regions in Turkey for time period between 2004 and 2014. In this respect, we conducted an analysis based on the CV, cross-sectional OLS, and panel data in the context of the σ and β convergence approaches. The econometric models are estimated for different specifications depending on different assumptions about the error term. Results of σ-convergence across the regions show that CV tends to decrease when per capita real GDP decreases across regions, despite slightly diverging after 2012. Thus, we conclude that σ-convergence exists across NUTS 2 regions in Turkey for the time period 2004–2014.
In the second part of the analysis, we test both the absolute and conditional β-convergence hypothesis based on a cross-sectional regression for the NUTS 2 regions. In this respect, we firstly reach the result that the parameter of the initial year real GDP per capita is significantly negative in the unconditional model. Therefore, it can be said that there is clear evidence for the presence of the unconditional β-convergence across regions between 2004 and 2014. Also, the slope of the regression line shows that the estimated β coefficient for the whole period equals 1.15%. Compared with the earlier results observed worldwide, it can be concluded that the regions experienced a relatively slow catching-up process for this period. Secondly, we explore conditional convergence, and thus the role of government, in the growth process by means of control variables. Accordingly, the significantly negative sign of initial year real GDP per capita in the model with control variables reveals the existence of conditional β-convergence across the regions. Also, the positive and significant sign of the per capita fixed investment incentives variable shows that the regional incentives provided by government are one of the determinants in regional growth. Unlike investment incentives, the coefficient of regional government investments is estimated as positive but statistically insignificant. Lastly, the convergence rate obtained from the conditional model is much higher (1.94%) than the absolute one.
In addition to the cross-sectional analysis of the convergence approach, we employ a panel data estimation in a range of models, including control variables. The models estimated for both pooled OLS and FE show that coefficients of log of initial year real GDP per capita are significant and negative. Thus, we reach the presence of both absolute and conditional β-convergence of NUTS 2 Regions in Turkey between 2004 and 2014 using the panel data approach. Besides, the coefficients of control variables are positive in all the models but they differ by significant levels in the pooled OLS and FE estimations. Among the control variables, positive coefficients of per capita investment incentives are found statistically significant by both pooled and fixed effects estimators. Also, the government investments variable has significant and positive coefficients in Model 3. Considering the explanatory power of the models, the FE estimators exhibit quite high goodness of fit in all the models compared with the pooled OLS approach.
Consequently, in the context of current conjuncture, where the global economy changes very rapidly and the uncertainties in the markets increase, the incentives to be given to the industrial sector are at the forefront. Particularly, it can be said that government incentives are vital for the establishment, preservation, and preparation of the core industries in emerging economies. In our analysis, we show that an incentive system that takes into account both regional characteristics and the size and nature of investments is likely to be contributive to the provision of income equality, the fight against poverty, and the reduction of regional development disparities. Also, a successful attainment of the incentive system might depend on the country's management capabilities and institutional infrastructure, as well as the extraction of bureaucratic transactions to the optimal level in the investment field. In the convergence process, it is possible to conclude that government investments are also decisive to meeting regional economic disparities. Despite the fact that there were difficulties in obtaining data at a regional level in Turkey, some critics could be addressed to the study due to the absence of the long time series in the analysis. Moreover, further research might be expanded by including different variables such as government intervention, and the human and physical capital accumulation or foreign investments that could be effective in the convergence process. The present paper may be considered as a point of departure for future studies on regional convergence.
Author Contributions
All authors contributed equally to this work.
Conflicts of Interest
The authors declare no conflict of interest.
Appendix A

Table A1.
Classification of Statistical Regional Units, NUTS 2 Regions in Turkey.
| NUTS Code | Provinces | NUTS Code | Provinces |
|---|---|---|---|
| TR10 | İstanbul | TR71 | Kırıkkale, Aksaray, Niğde, Nevşehir, Kırşehir |
| TR21 | Tekirdağ, Edirne, Kırklareli | TR72 | Kayseri, Sivas, Yozgat |
| TR22 | Balıkesir, Çanakkale | TR81 | Zonguldak, Karabük, Bartın |
| TR31 | İzmir | TR82 | Kastamonu, Çankırı, Sinop |
| TR32 | Aydın, Denizli Muğla | TR83 | Samsun, Tokat, Çorum, Amasya |
| TR33 | Manisa, Afyonkarahisar, Kütahya, Uşak | TR90 | Trabzon, Ordu, Giresun, Rize, Artvin, Gümüşhane |
| TR41 | Bursa, Eskişehir, Bilecik | TRA1 | Erzurum, Erzincan, Bayburt |
| TR42 | Kocaeli, Sakarya, Düzce, Bolu, Yalova | TRA2 | Ağrı, Kars, Iğdır, Ardahan |
| TR51 | Ankara | TRB1 | Malatya, Elazığ, Bingöl, Tunceli |
| TR52 | Konya, Karaman | TRB2 | Van, Muş, Bitlis, Hakkari |
| TR61 | Antalya, Isparta, Burdur | TRC1 | Gaziantep, Adıyaman, Kilis |
| TR62 | Adana, Mersin | TRC2 | Şanlıurfa, Diyarbakır |
| TR63 | Hatay, Kahramanmaraş, Osmaniye | TRC3 | Mardin, Batman, Şırnak, Siirt |
Source: (TurkStat 2017a).
References
- Arbia, Giuseppe, and Gianfranco Piras. 2005. Convergence in Per-capita GDP across European Regions Using Panel Data Models Extended to Spatial Autocorrelation Effects. Available online: https://ssrn.com/abstract=936327 (accessed on 11 January 2017).
- Aslan, Alper, and Ferit Kula. 2011. Is there Really Divergence across Turkish Provinces? Evidence from the Lagrange Multiplier Unit Root Tests. European Planning Studies 19: 539–49. [Google Scholar] [CrossRef]
- Baltagi, Badi. 2005. Econometric Analysis of Panel Data, 3rd ed. Chichester: John Wiley & Sons Ltd. [Google Scholar]
- Barro, Robert J., and Xavier X. Sala-i-Martin. 1991. Convergence across states and regions. Brookings Papers on Economic Activity 1: 107–58. [Google Scholar] [CrossRef]
- Barro, Robert J., and Xavier X. Sala-i-Martin. 1992. Convergence. Journal of Political Economy 100: 223–51. [Google Scholar] [CrossRef] [Green Version]
- Barro, Robert J., and Xavier X. Sala-i-Martin. 1995. Economic Growth. New York: McGraw-Hill. [Google Scholar]
- Barro, Robert J., and Xavier X. Sala-i-Martin. 2004. Economic Growth, 2nd ed. Cambridge: The MIT Press. [Google Scholar]
- Baumol, William J. 1986. Productivity growth, convergence, and welfare: What the long-run data show. American Economic Review 76: 1072–85. [Google Scholar]
- Berber, Metin, Rahmi Yamak, and Seyfettin Artan. 2000. Türkiye’de Yakınlaşma Hipotezinin Bölgeler Bazında Geçerliligi Üzerine bir Çalışma: 1975–1997. 9. Ulusal Bölge Bilimi/Bölge Planlama Kongresi Bildirileri. Paper presented at 9. Ulusal Bölge Bilimi ve Bölge Planlama Kongresi, Trabzon, 5–6 October 2000. [Google Scholar]
- Bonnefond, Céline. 2014. Growth Dynamics and Conditional Convergence among Chinese Provinces: A Panel Data Investigation Using System GMM Estimator. Journal of Economic Development 39: 1–25. [Google Scholar]
- Button, Kenneth. 1998. Infrastructure investment, endogenous growth, and economic convergence. Annals of Regional Science 32: 145–62. [Google Scholar] [CrossRef]
- Canova, Fabio, and Albert Marcet. 1995. The Poor Stay Poor: Non-Convergence across Countries and Regions. Available online: https://ssrn.com/abstract=289497 (accessed on 13 February 2017).
- Chaudhuri, Jayasri Ray. 2001. An Introduction to Development and Regional Planning: With Special Reference to India. New Delhi: Orient BlackSwan. [Google Scholar]
- Cuaresma, Jesus Crespo, Doris Ritzberger-Grünwald, and Maria Antoinette Silgoner. 2008. Growth, convergence and EU membership. Applied Economics 40: 643–56. [Google Scholar] [CrossRef]
- Durlauf, Steven, and Danny T. Quah. 1999. The new Empirics of Economic Growth. In Handbooks of Macroeconomics. Edited by John B. Taylor and Michael Woodford. Cornwall: North-Holland, vol. 1A, pp. 235–308. [Google Scholar]
- Erk, Nejat, Sanli Ateş, and Tuba Direkçi. 2000. Convergence and growth within GAP region (South Eastern Anatolia Project) and overall Turkey’s regions. In Proceedings of the METU International Conference in Economics IV, Ankara, Turkey, 13–16 September 2000. [Google Scholar]
- Erlat, Haluk. 2005. Türkiye’de Bölgesel Yakınsama Sorununa Zaman Dizisi Yaklaşımı. In Bölgesel Gelişme Stratejileri ve Akdeniz Ekonomisi. Edited by Haluk Erlat. Ankara: Türkiye Ekonomi Kurumu, pp. 251–76. [Google Scholar]
- Ersungur, Ş. Mustafa, and Özgür Polat. 2010. Türkiye’de Bölgeler Arasında Yakınsama Analizi. Atatürk Üniversitesi Sosyal Bilimler Enstitüsü Dergisi 8: 335–43. [Google Scholar]
- Filiztekin, Alpay. 1999. Convergence across Turkish Provinces and Sectoral Dynamics. Available online: http://myweb.sabanciuniv.edu/alpayf/files/2010/04/provconv.pdf (accessed on 13 February 2017).
- Filiztekin, Alpay. 2009. Türkiye’de Bölgesel Farklar. Available online: http://research.sabanciuniv.edu/11643/1/BolgeselFarklar_YKY.pdf (accessed on 13 February 2017).
- Friedman, Milton. 1992. Do Old Fallacies Ever Die? Journal of Economic Literature 30: 2129–32. [Google Scholar]
- Gaulier, Guillaume, Christophe Hurlin, and Philippe Jean-Pierre. 1999. Testing Convergence: A Panel Data Approach. Annales d’Économie et de Statistique 55/56: 411–27. [Google Scholar] [CrossRef]
- Gerni, Cevat, Selahattin Sarı, Haktan Sevinç, and Ömer Selçuk Emsen. 2015. Bölgesel Dengesizliklerin Giderilmesinde Yatırım Teşviklerinin Rolü ve Başarı Kriteri Olarak Yakınsama Analizleri: Türkiye Örneği. In Proceedings of the International Conference on Eurasian Economies, Kazan, Russia, 9–11 September 2015. [Google Scholar]
- Gezici, Ferhan, and Geoffrey J. D. Hewings. 2004. Regional Convergence and Economic Performance of Peripheral Areas in Turkey. Review of Urban and Regional Development Studies 16: 113–32. [Google Scholar] [CrossRef]
- Ginevičius, Romualdas, and Agnė Šimelytė. 2011. Government incentives directed towards foreign direct investment: A case of central and eastern Europe. Journal of Business Economics and Management 12: 435–50. [Google Scholar] [CrossRef]
- Greene, William H. 2003. Econometric Analysis, 5th ed. New Jersey: Prentice Hall. [Google Scholar]
- Hirschman, Albert O. 1958. The Strategy of Economic Development. New Haven: Yale University. [Google Scholar]
- Islam, Nazrul. 1995. Growth empirics: A panel data approach. Quarterly Journal of Economics, 110: 1127–70. [Google Scholar] [CrossRef]
- Karaalp, Hacer Simay, and Fuat Erdal. 2012. Sanayileşmenin Bölgesel Yığılması ve Komşu İllerin Büyümesi Gelir Farklılıklarını Artırır mı? Türkiye için Bir Beta Yakınsama Analizi. Ege Akademik Bakış 12: 475–86. [Google Scholar]
- Lall, Somik, and Serdar Yilmaz. 2000. Regional Economic Convergence: Do Policy Instruments Make a Difference? Available online: http://siteresources.worldbank.org/WBI/Resources/wbi37161.pdf (accessed on 10 January 2017).
- Lee, Michael, Ritchard Longmire, Laszlo Matyas, and Mark Harris. 1998. Growth convergence: Some panel data evidence. Applied Economics 30: 907–12. [Google Scholar] [CrossRef]
- Lopez-Rodriguez, Jesus. 2008. Regional Convergence in the European Union: Results from a Panel Data Model. Economics Bulletin 18: 1–7. [Google Scholar]
- Magrini, Stefano. 2004. Regional (di)convergence. In Handbook of Regional and Urban Economics. Edited by J. Vernon Henderson and Jacques-François Thisse. Amsterdam: Elsevier B. V., vol. 4, pp. 2741–96. [Google Scholar]
- Mankiw, N. Gregory, David Romer, and David N. Weil. 1992. A Contribution to the Empirics of Economic Growth. The Quarterly Journal of Economics 107: 407–37. [Google Scholar] [CrossRef]
- Michelis, Leo, and Simon Neaime. 2004. Income Convergence in the Asia-Pacific Region. Journal of Economic Integration 19: 470–98. [Google Scholar] [CrossRef]
- Michelis, Leo, Athanasios P. Papadopoulos, and Gregory T. Papanikos. 2004. Regional convergence in Greece in the 1980s: an econometric investigation. Applied Economics 36: 881–88. [Google Scholar] [CrossRef]
- Myrdal, Gunnar. 1957. Economic Theory and Underdeveloped Regions. London: University Paperbacks, Methuen & Co Ltd. [Google Scholar]
- Önder, A. Özlem, Ertuğrul Deliktaş, and Metin Karadağ. 2010. The Impact of Public Capital Stock on Regional Convergence in Turkey. European Planning Studies 18: 1041–55. [Google Scholar] [CrossRef]
- Özgül, Seda, and Metin Karadağ. 2015. Regional Convergence in Turkey Regarding Welfare Indicators. Sosyoekonomi 23: 38–50. [Google Scholar]
- Piras, Gianfranco, and Giuseppe Arbia. 2007. Convergence in per-capita GDP across EU-NUTS 2 regions using panel data models extended to spatial Autocorrelations Effects. Statistica 67: 157–72. [Google Scholar]
- Quah, Danny T. 1996. Empirics for economic growth and convergence. European Economic Review 40: 1353–75. [Google Scholar] [CrossRef]
- Ranjpour, Reza, and Zahra Karimi Takanlou. 2008. Evaluation of the income convergence hypothesis in ten new members of the European union: A panel unit root approach. Panoeconomicus 55: 157–66. [Google Scholar] [CrossRef]
- Republic of Turkey Ministry of Development. 2015. Available online: http://www2.kalkinma.gov.tr/kamuyat/il.html?2015_0 (accessed on 20 December 2016).
- Republic of Turkey Ministry of Economy. 2014. Investment Incentives. Available online: http://www.economy.gov.tr/portal/faces/home/invest-incent/invest-incentives? (accessed on 17 February 2017).
- Republic of Turkey Ministry of Economy. 2016. İstatistikler ve Yayınlar. Available online: http://www.ekonomi.gov.tr/portal/content/conn/UCM/uuid/dDocName:EK-229074 (accessed on 10 October 2016).
- Republic of Turkey Official Gazette. 2012. Yatirimlarda Devlet Yardimi Hakkinda Karar. Available online: http://www.resmigazete.gov.tr/main.aspx?home=http://www.resmigazete.gov.tr/eskiler/2012/06/20120619.htm&main=http://www.resmigazete.gov.tr/eskiler/2012/06/20120619.htm (accessed on 9 January 2017).
- Romer, David. 1996. Advanced Macroeconomics. New York: McGraw-Hill. [Google Scholar]
- Sağbaş, İsa. 2002. Türkiye’de Kamu Harcamalarının Yakınsama Üzerindeki Etkisi. Afyon Kocatepe Üniversitesi İ.İ.B.F. Dergisi 4: 137–48. [Google Scholar]
- Sala-i-Martin, Xavier X. 1996a. The Classical Approach to Convergence Analysis. The Economic Journal 106: 1019–36. [Google Scholar] [CrossRef]
- Sala-i-Martin, Xavier X. 1996b. Regional Cohesion: Evidence and Theories of Regional Growth and Convergence. European Economic Review 40: 1325–52. [Google Scholar] [CrossRef]
- Shen, Daqing, Ruiqiang Wang, and Nan Yi. 2008. Analysis of the Convergence of Regional Economic Growth in Beijing. International Journal of Business and Management 3: 52–58. [Google Scholar] [CrossRef]
- Solow, Robert M. 1956. A contribution to the theory of economic growth. Quarterly Journal of Economics 70: 65–94. [Google Scholar] [CrossRef]
- Studenmund, A. H. 1992. Using Eonometrics: A Practical Guide, 2nd ed. New York: Harper Collins Publishers. [Google Scholar]
- Tansel, Aysit, and Nil Demet Gungor. 1998. Economic growth and convergence: An application to the provinces of Turkey, 1975–1995. Available online: https://www.academia.edu/7142026/Economic_Growth_and_Convergence_An_Application_to_the_Provinces_of_Turkey_1975-1995 (accessed on 10 January 2017).
- Temple, Jonathan. 1999. The New Growth Evidence. Journal of Economic Literature 37: 112–56. [Google Scholar] [CrossRef]
- Turkish Statistical Institute. 2017a. Regional Statistics. Available online: https://biruni.tuik.gov.tr/bolgeselistatistik/anaSayfa.do?dil=en (accessed on 12 February 2017).
- Turkish Statistical Institute. 2017b. Population Estimates, 2000–2006, Address Based Population Registration System (ABPRS), 2007–2016. Available online: www.tuik.gov.tr/PreIstatistikTablo.do?istab_id=1590 (accessed on 20 February 2017).
- Varblane, Urmas, and Priit Vahter. 2005. An Analysis of the Economic Convergence Process in the Transition Countries. Available online: https://ssrn.com/abstract=757204 (accessed on 21 December 2016).
- Wallace, T. Dudley, and J. Lew Silver. 1988. Econometrics: An Introduction. Reading: Addison-Wesley Publishing Company. [Google Scholar]
- Wooldridge, Jeffrey M. 2010. Econometric Analysis of Cross Section and Panel Data, 2nd ed. Cambridge: MIT Press. [Google Scholar]
- Yildirim, Julide, Nadir Öcal, and Süheyla Özyildirim. 2009. Income Inequality and Economic Convergence in Turkey: A Spatial Effect Analysis. International Regional Science Review 32: 221–54. [Google Scholar] [CrossRef]
- Zeren, Fatma, and Veli Yilanci. 2011. Türkiye’de Bölgeler Arası Gelir Yakınsaması: Rassal Katsayılı Panel Veri Analizi Uygulaması. Business and Economics Research Journal 2: 143–51. [Google Scholar]
| 1 | The NUTS classification (Nomenclature of territorial units for statistics) is a hierarchical system for dividing up the economic territory of the EU. |
| 2 | The implementation period of the Incentive Law No. 5084 was finalized on 31.12.2009. However, the period of benefiting from the incentives was extended until 2012 with the Law No. 5568 and the amendment made in Article 7 of Law No. 5084. Finally, the last investment incentive program, which put into effect in June 2012, is still ongoing (Republic of Turkey Ministry of Economy 2014). |
| 3 | Also see the Appendix for regional context and region codes. |
| 4 | Barro and Sala-i-Martin (2004, pp. 466–67) estimate the speed of convergence for the U.S. states by an univariate regression model, , where and are final and initial year per capita GDP, is a constant, is the length of the period, and is the coefficient of convergence speed. In this equation, the coefficient of initial income, , also equals to in Equations (4) and (5), and then . In order to obtain equation, we take the log of both sides of this equation . Thus, we reach the coefficient as given in Equation (6). |
| 5 | According to Wallace and Silver (1988, p. 123), when studying on cross-sectional data, it is often seen that the value of R-square is 0.3 or less than this value. Also, Studenmund (1992, p. 47) argues that an R-square value of around 0.50 in a cross-sectional analysis is adequate for goodness of fit. |
Figure 1.
σ-Convergence of GDP Per Capita in NUTS 2 Regions.

Figure 2.
Absolute β-Convergence of the NUTS 2 Regions.

Table 1.
Summary of Convergence Studies in Turkey.
| Author/s | Period/Sample | Dependent Variable | Method 1 | Some of the Findings |
|---|---|---|---|---|
| Tansel and Gungor (1998) | 1975–1995 | Labor productivity level and productivity growth | NLS, OLS and panel FE |
|
| 67 provinces | ||||
| Filiztekin (1999) | 1975–1995 | GDP and GDP per capita | NLS and panel FE |
|
| 65 provinces | ||||
| Berber et al. (2000) | 1975–1997 | GDP per capita | OLS |
|
| 7 geographical regions | ||||
| Erk et al. (2000) | 1979–1997 | Real GDP per capita | OLS and NLS |
|
| 67 provinces | ||||
| Sağbaş (2002) | 1986–1997 | Real GDP per capita | OLS |
|
| 67 provinces | ||||
| Gezici and Hewings (2004) | 1980–1997 | GDP per capita | OLS |
|
| 16 functional regions and 67 provinces | ||||
| Erlat (2005) | 1975–2001 | Real GDP per capita | IPS, ADF and CADF panel unit root tests |
|
| 7 geographical regions and 65 provinces | ||||
| Yildirim et al. (2009) | 1987–2001 | Real GDP per capita | OLS, SEM, SAR, and GWR |
|
| 67 provinces | ||||
| Önder et al. (2010) | 1980–2001 | Real GDP per capita | Pooled panel, FE, GMM-DIF, GMM-SYS |
|
| 26 NUTS 2 regions | ||||
| Ersungur and Polat (2010) | 1987–2000 | GDP per capita | OLS |
|
| 12 NUTS 1 regions | ||||
| Aslan and Kula (2011) | 1975–2001 | GDP per capita | Univariate and panel LM |
|
| 67 provinces | ||||
| Zeren and Yilanci (2011) | 1991–2000 | GDP per capita | Panel FE and RE |
|
| 26 NUTS 2 regions | ||||
| Karaalp and Erdal (2012) | 1993–2001 | GDP per capita | Panel FE and GMM |
|
| 73 provinces | ||||
| Gerni et al. (2015) | 2004–2012 | Regional tax revenue per capita | OLS |
|
| 81 provinces | ||||
| 26 NUTS 2 regions | ||||
| Özgül and Karadağ (2015) | 1990–2001 | GDP per capita and per person employed | OLS |
|
1 ADF: augmented Dickey-Fuller test; CADF: cross-sectionally augmented DF test; GMM-DIF: generalized method of moments estimator in difference; GMM-SYS: system GMM estimator; NLS: non-linear least squares; GWR: geographically weighted regression; IPS: Im, Pesaran and Shin unit root test; LM: Lagrange multiplier unit root test; OLS: ordinary least squares; SAR: spatial autoregressive model; SEM: spatial error model.
Table 2.
Per Capita Real GDP, Standard Deviation, and the Coefficient of Variation of NUTS 2 Regions.
Table 2.
Per Capita Real GDP, Standard Deviation, and the Coefficient of Variation of NUTS 2 Regions.
| Year | Ln Per Capita Real GDP | Standard Deviation | Coefficient of Variation |
|---|---|---|---|
| 2004 | 8.6448 | 0.4148 | 0.0480 |
| 2005 | 8.7124 | 0.4132 | 0.0474 |
| 2006 | 8.7571 | 0.4197 | 0.0479 |
| 2007 | 8.7703 | 0.4206 | 0.0480 |
| 2008 | 8.7857 | 0.4182 | 0.0476 |
| 2009 | 8.7273 | 0.3988 | 0.0457 |
| 2010 | 8.8198 | 0.3738 | 0.0424 |
| 2011 | 8.8857 | 0.3789 | 0.0426 |
| 2012 | 8.9355 | 0.3647 | 0.0408 |
| 2013 | 8.9877 | 0.3684 | 0.0410 |
| 2014 | 9.0189 | 0.3704 | 0.0411 |
Table 3.
Cross-Section Estimation of Absolute β-Convergence in NUTS 2 Regions.
| Method: OLS | |||
|---|---|---|---|
| Included Observations: 26 | |||
| Coefficient | Std. Error | Prob. | |
| Constant | 0.1277 | 0.0237 | 0.000 *** |
| Log of Initial Year Real GDP per capita | −0.0108 | 0.0027 | 0.001 *** |
| R-square | 0.3941 | ||
| F-statistic | 15.6101 | ||
| Prob. (F-statistic) | 0.001 | ||
| Speed of Convergence (β) | 1.15 % | ||
Notes: *** denotes 1% significance level. Source: Calculated by EViews 9.
Table 4.
Cross-Sectional Estimation of Conditional β-Convergence in NUTS 2 Regions.
| Method: OLS | |||
|---|---|---|---|
| Included observations: 26 | |||
| Coefficient | Std. Error | Prob. | |
| Constant | 0.1663 | 0.0287 | 0.000 *** |
| Log of Initial Year Real GDP per capita | −0.0175 | 0.0040 | 0.000 *** |
| Log of per capita Government Investments | 0.0014 | 0.0025 | 0.579 |
| Log of per capita Fixed Investment Incentives | 0.0028 | 0.0012 | 0.033 ** |
| R-square | 0.5091 | ||
| F-statistic | 7.6054 | ||
| Prob. (F-statistic) | 0.001 | ||
| Speed of Convergence (β) | 1.94 % | ||
Notes: *** and ** denote 1 and 5% significance levels, respectively.
Table 5.
Panel Data Estimation of Convergence in NUTS 2 Regions.
| MODEL I | MODEL II | MODEL III | MODEL IV | |||||
|---|---|---|---|---|---|---|---|---|
| Pooled | FE Two-Way | Pooled | FE Two-Way | Pooled | FE Two-Way | Pooled | FE Two-Way | |
| Constant | 0.212 | 2.331 | 0.275 | 2.303 | 0.086 | 2.230 | 0.166 | 2.189 |
| [2.876] | [6.043] | [4.285] | [5.960] | [1.202] | [5.765] | [2.633] | [5.645] | |
| (0.004) | (0.000) | (0.000) | (0.000) | (0.230) | (0.000) | (0.009) | (0.000) | |
| Ln per capita real GDP (t−1) | −0.035 | −0.269 | −0.036 | −0.261 | −0.015 | −0.255 | −0.015 | −0.244 |
| [−4.348] | [−6.071] | [−4.475] | [−5.919] | [−2.062] | [−5.754] | [−2.040] | [−5.548] | |
| (0.000) | (0.000) | (0.000) | (0.000) | (0.040) | (0.000) | (0.042) | (0.000) | |
| Ln Per capita Investment Incentives | 0.015 | 0.006 | 0.016 | 0.006 | ||||
| [4.686] | [2.296] | [4.965] | [2.454] | |||||
| (0.000) | (0.022) | (0.000) | (0.015) | |||||
| Ln Per Capita Government Investments | 0.012 | 0.008 | 0.016 | 0.010 | ||||
| [1.722] | [1.490] | [2.325] | [1.717] | |||||
| (0.086) | (0.137) | (0.021) | (0.087) | |||||
| F-statistics (p-value) | 10.793 | 21.444 | 14.596 | 21.858 | 4.819 | 21.482 | 4.162 | 21.821 |
| (0.000) | (0.000) | (0.000) | (0.000) | (0.001) | (0.000) | (0.042) | (0.000) | |
| Number of obs. | 260 | 260 | 260 | 260 | 260 | 260 | 260 | 260 |
| Number of period | 10 | 10 | 10 | 10 | 10 | 10 | 10 | 10 |
| Number of cross. | 26 | 26 | 26 | 26 | 26 | 26 | 26 | 26 |
| R-square | 0.112 | 0.781 | 0.102 | 0.779 | 0.036 | 0.776 | 0.016 | 0.773 |
| Hausman Test * (p-value) | χ2 (3): | χ2 (2): | χ2 (2): | χ2 (1): | ||||
| 33.346 | 30.867 | 30.248 | 27.806 | |||||
| (0.000) | (0.000) | (0.000) | (0.000) | |||||
Source: Calculated by EViews 9. Dependent variable: the growth rate of real GDP per capita. [] means t-statistic; and () indicates prob. values.* Hausman tests for cross-section and period random effects.
© 2017 by the authors. Licensee MDPI, Basel, Switzerland. This article is an open access article distributed under the terms and conditions of the Creative Commons Attribution (CC BY) license (http://creativecommons.org/licenses/by/4.0/).
Share and Cite
MDPI and ACS Style
Gömleksiz, M.; Şahbaz, A.; Mercan, B. Regional Economic Convergence in Turkey: Does the Government Really Matter for? Economies 2017, 5, 27. https://doi.org/10.3390/economies5030027
AMA Style
Gömleksiz M, Şahbaz A, Mercan B. Regional Economic Convergence in Turkey: Does the Government Really Matter for? Economies. 2017; 5(3):27. https://doi.org/10.3390/economies5030027
Chicago/Turabian StyleGömleksiz, Mustafa, Ahmet Şahbaz, and Birol Mercan. 2017. "Regional Economic Convergence in Turkey: Does the Government Really Matter for?" Economies 5, no. 3: 27. https://doi.org/10.3390/economies5030027
Note that from the first issue of 2016, this journal uses article numbers instead of page numbers. See further details here.