Low-Carbon Competitiveness in Asia

1
Vivid Economics, London EC1N 6TD, UK
2
Grantham Research Institute, London School of Economics, London WC2A 2AE, UK
*
Author to whom correspondence should be addressed.
Economies 2018, 6(1), 5; https://doi.org/10.3390/economies6010005
Submission received: 31 October 2017
/
Revised: 3 December 2017
/
Accepted: 20 December 2017
/
Published: 23 January 2018
(This article belongs to the Special Issue Selected Papers from the International Conference on Sustainable Development 2017, September 18-20, 2017 New York, USA)
Abstract
:Environmental degradation and the risks from climate change have strengthened the need for cleaner forms of economic growth. Using patent, trade and output data, we measure the current size of Asia’s low-carbon economy and assess its competitiveness across key sectors. We look at three success factors for low-carbon competitiveness at the sector level: the ability to convert to low-carbon products and processes (measured by a specialization in low-carbon innovation), the ability to gain and maintain market share (measured by existing comparative advantages) and a favorable starting point (measured by current output and scale). Using this framework, we identify the ‘climate change mitigation technologies’ that Asian countries specialize in and can potentially scale up. The analysis shows that Asia’s top low-carbon economies are Japan, South Korea and China. The sectors in which Asia is particularly well placed to be globally competitive include efficient lighting, photovoltaics and energy storage. Overall, Asia is a specialist in innovating and exporting climate change mitigation technologies but there are significant regional disparities.
JEL Classification:
Q42; Q43; Q54; Q561. Introduction
Environmental degradation and the impacts of climate change are compelling countries around the world to switch to cleaner forms of growth. The old model of growth, which relied on carbon-intensive assets, is unlikely to succeed in today’s world, where environmental costs are rising and the negative health effects of pollution are palpable (New Climate Economy 2014). The transition to low-carbon growth will not be automatic. Greenhouse gas (GHG) emissions will have to be priced, fossil fuel subsidies will have to be phased out, labor and capital will need to transition away from carbon-intensive sectors, and the regulatory environment will have to adapt to enable the shift. However, the transition holds the promise of ‘better growth’, that is, growth which is cleaner, sustainable and welfare-maximizing (New Climate Economy 2014). It can also be profitable. Countries can emerge as leaders in the ‘low-carbon economy’: they can position themselves to accrue value from the design, export and production of low-carbon goods and services, which are poised to appreciate in value as the world embraces climate-compatible growth.
Our paper assesses Asia’s potential to profit from the low-carbon transition. It explores whether Asia is well placed to be competitive in the global low-carbon market and details its sectoral strengths and weaknesses. Current research on low-carbon competitiveness includes work by Fankhauser et al. (2013), who conduct a global analysis of who will win the ‘green race’. They use patent, trade and output data to construct competitiveness metrics and evaluate countries’ low-carbon potential. Our paper adopts a methodology similar to what is used in Fankhauser et al. (2013) and applies it to Asia using granular, country-specific data. This gives deeper insights into Asia’s position in the low-carbon market in terms of its innovation and export potential. Studies such as ADB (2015) and Yoshida and Mori (2015) provide an overview of Asia’s low-carbon economy from a policy perspective but they do not systematically assess its size or market competitiveness using quantitative methods as this paper does.
The results show that Asia is competitive in the global low-carbon economy. Asia enjoys scale in the production, export and patenting of low-carbon goods and services. It has an innovation specialization and comparative advantage in ‘climate change mitigation technologies’ (CCMTs), which are technologies that help in reducing the flow of GHG emissions. Asia’s specialization means that the proportion of CCMTs in its patent mix and export basket exceeds the world average. However, there are stark regional disparities. Asia’s top low-carbon economies are Japan, South Korea and China. These East Asian economies enjoy phenomenal scale: Japan accounts for one-fourth of the world’s high-value CCMT patents, China accounts for a fifth of the world’s CCMT exports and South Korea makes up a tenth of high-value CCMT patents. By contrast, other countries in Asia exhibit significantly lower levels of patenting and export activity in CCMTs. These economies in Asia can take steps to strategically build competitiveness, capitalize on existing strengths and learn from East Asian neighbors to build scale.
2. Methodology
2.1. Data Sources
To assess Asia’s low-carbon competitiveness, we use trade, patent and output data to construct competitiveness metrics. We combine three different datasets for this analysis. The patent data comes from the European Patent Office (EPO) database, PATSTAT version 2015b.1 PATSTAT is the largest international patent database available to the research community. It classifies products as CCMTs, which is the group of products on which we base our analysis of low-carbon competitiveness (for a full list of the CCMTs included in this analysis, refer to Table A1 in the Appendix).
CCMTs are technologies that help reduce net emissions when producing or consuming energy. Examples of CCMTs include renewable energy technologies, carbon capture and storage, and electric vehicles which directly reduce emissions, and complementary technologies such as batteries. However, the EPO’s list of CCMTs is not exhaustive. Several technologies which have the potential for abatement are not amenable to patenting and, hence, not represented in such databases. For example, agricultural and forestry technologies such as soil restoration, reforestation, rice or grassland management are not present in patent data (Glachant et al. 2013). Despite this limitation, the EPO database includes CCMTs from major emissions-intensive sectors such as transportation, energy and buildings, and these technologies together represent 65% of the world’s abatement potential until 2030 (Glachant et al. 2013).
The trade data is from UN Comtrade,2 which has granular six-digit commodity classifications. This makes it possible to match the trade data to the EPO’s CCMT classification. The output data is from the UK Government’s database on Low-Carbon Environmental Goods and Services (LCEGS).3 The LCEGS database defines a set of ‘environmental sectors’ (see Table A2 in the Appendix) whose activities cut across conventional sectors. For example, ‘air pollution’ is a sector whose activities cut across agriculture, manufacturing and services. Compared to PATSTAT and Comtrade, the LCEGS database covers a larger set of environmental sectors, giving a more accurate measurement of the overall size of the low-carbon economy. Additionally, the database uses ‘sales’ rather than ‘value-added’ which allows us to capture more of the low-carbon economy since a significant proportion of activity, such as pollution control, happens in the operational stages.
2.2. Method
The first step in the methodology is to check if Asia has scale in producing, trading and patenting goods and services related to the low-carbon transition. If Asia has scale, in absolute and relative terms, it is more likely to be competitive because of agglomeration benefits and lower unit costs. Moreover, due to path-dependencies, an economy that already features a sizable proportion of low-carbon technologies is more likely to undertake ‘clean’ innovation than one that does not (Aghion et al. 2016). Scale therefore, represents a favorable ‘starting point’ for the ‘green race’ (Fankhauser et al. 2013)
The second step in the methodology is to create a competitiveness metric for low-carbon innovation to check whether Asia can accrue value from the design of CCMTs. Using patent data, we construct a measure called: the ‘green innovation score’ (GIS), which measures a region’s ‘innovation specialization’ in CCMTs. It is assumed that being a specialist innovator corresponds to greater levels of competitiveness and the ability to convert more quickly to low-carbon products and processes. The formula for the GIS is as follows:
where empty is the number of low-carbon (g) patents in sector s and country i. The GIS is the low-carbon technology’s share of patents in the region normalized by its share of patents in the world. In other words, the GIS is the multiple by which a region’s share of CCMT patents exceeds the world average share. Therefore, a GIS greater than one indicates an innovation specialization. An equivalent way to describe the GIS is as a normalized measure of low-carbon patenting activity (i.e., a region’s share of low-carbon patents over its share of general patents). Normalizing against broader patenting activity corrects for any idiosyncrasies in patenting behavior across particular sectors or countries (Fankhauser et al. 2013).
In constructing the GIS, we consider the stock of patents over the last five years of our dataset (2008–2012 inclusive) to ensure that the metric more robustly correlates to competitiveness. Basing the GIS only on the latest year’s patent data exposes it to the risk of capturing one-off shocks. For example, it is possible that in year t, there was a delay in patent filings which resulted in a surge in patents in the subsequent year. Basing the metric only on year t+1’s data would create biased results.
In our analysis, we also only consider ‘high-value’ patents to better reflect competitiveness. To proxy value, we only include patents that have been filed in two geographies. Since it is costly to file a patent, filing it in a second region may indicate that the invention can gain return in more than one market. While this is an imperfect proxy for value, it is one that is commonly used across patent literature (Dechezlepretre and Martin 2010). One of the drawbacks of using patent data is that it only captures ‘frontier’ innovation and may exclude a host of innovation activity that is not patented because of its incremental or commonplace nature. Despite this limitation, patent data does correspond to revenue from design and is a useful measure when thinking about how countries can ‘profit’ from the low-carbon transition.
The third step in the methodology is to construct a measure for export potential to check if Asian economies can accrue value from the export of CCMTs. We do this by using a standard Balassa score of ‘revealed comparative advantage’ (RCA). The Balassa score employs trade data to assess whether economies have an export specialization in low-carbon technologies (Balassa 1965). On the assumption that comparative advantages develop slowly, sectors with a competitive edge today are likely to be internationally competitive in the future and able to capture global market share (Hidalgo et al. 2007; Hausmann and Hidalgo 2010). RCA is calculated as follows:
where empty is the value of CCMT (g) exports from sector s in country i. The RCA is the technology’s share of exports in the region normalized by its share of exports in the world. Much like the GIS, it is a normalized measure of low-carbon export activity. A value greater than one indicates an export specialization. A higher RCA is likely to correspond to lower opportunity costs of production and greater levels of competitiveness, but this is not a given since government intervention can also boost exports from certain sectors and opportunity costs are not observed directly.
In constructing RCA, we consider the stock of trade over the last five years in our dataset (2008–2013 inclusive). Despite their limitations, the GIS and RCA meet the conditions of competitiveness metrics by being based on internationally comparable data and covering sectors that are traded/tradeable (Durand and Giorno 1987).
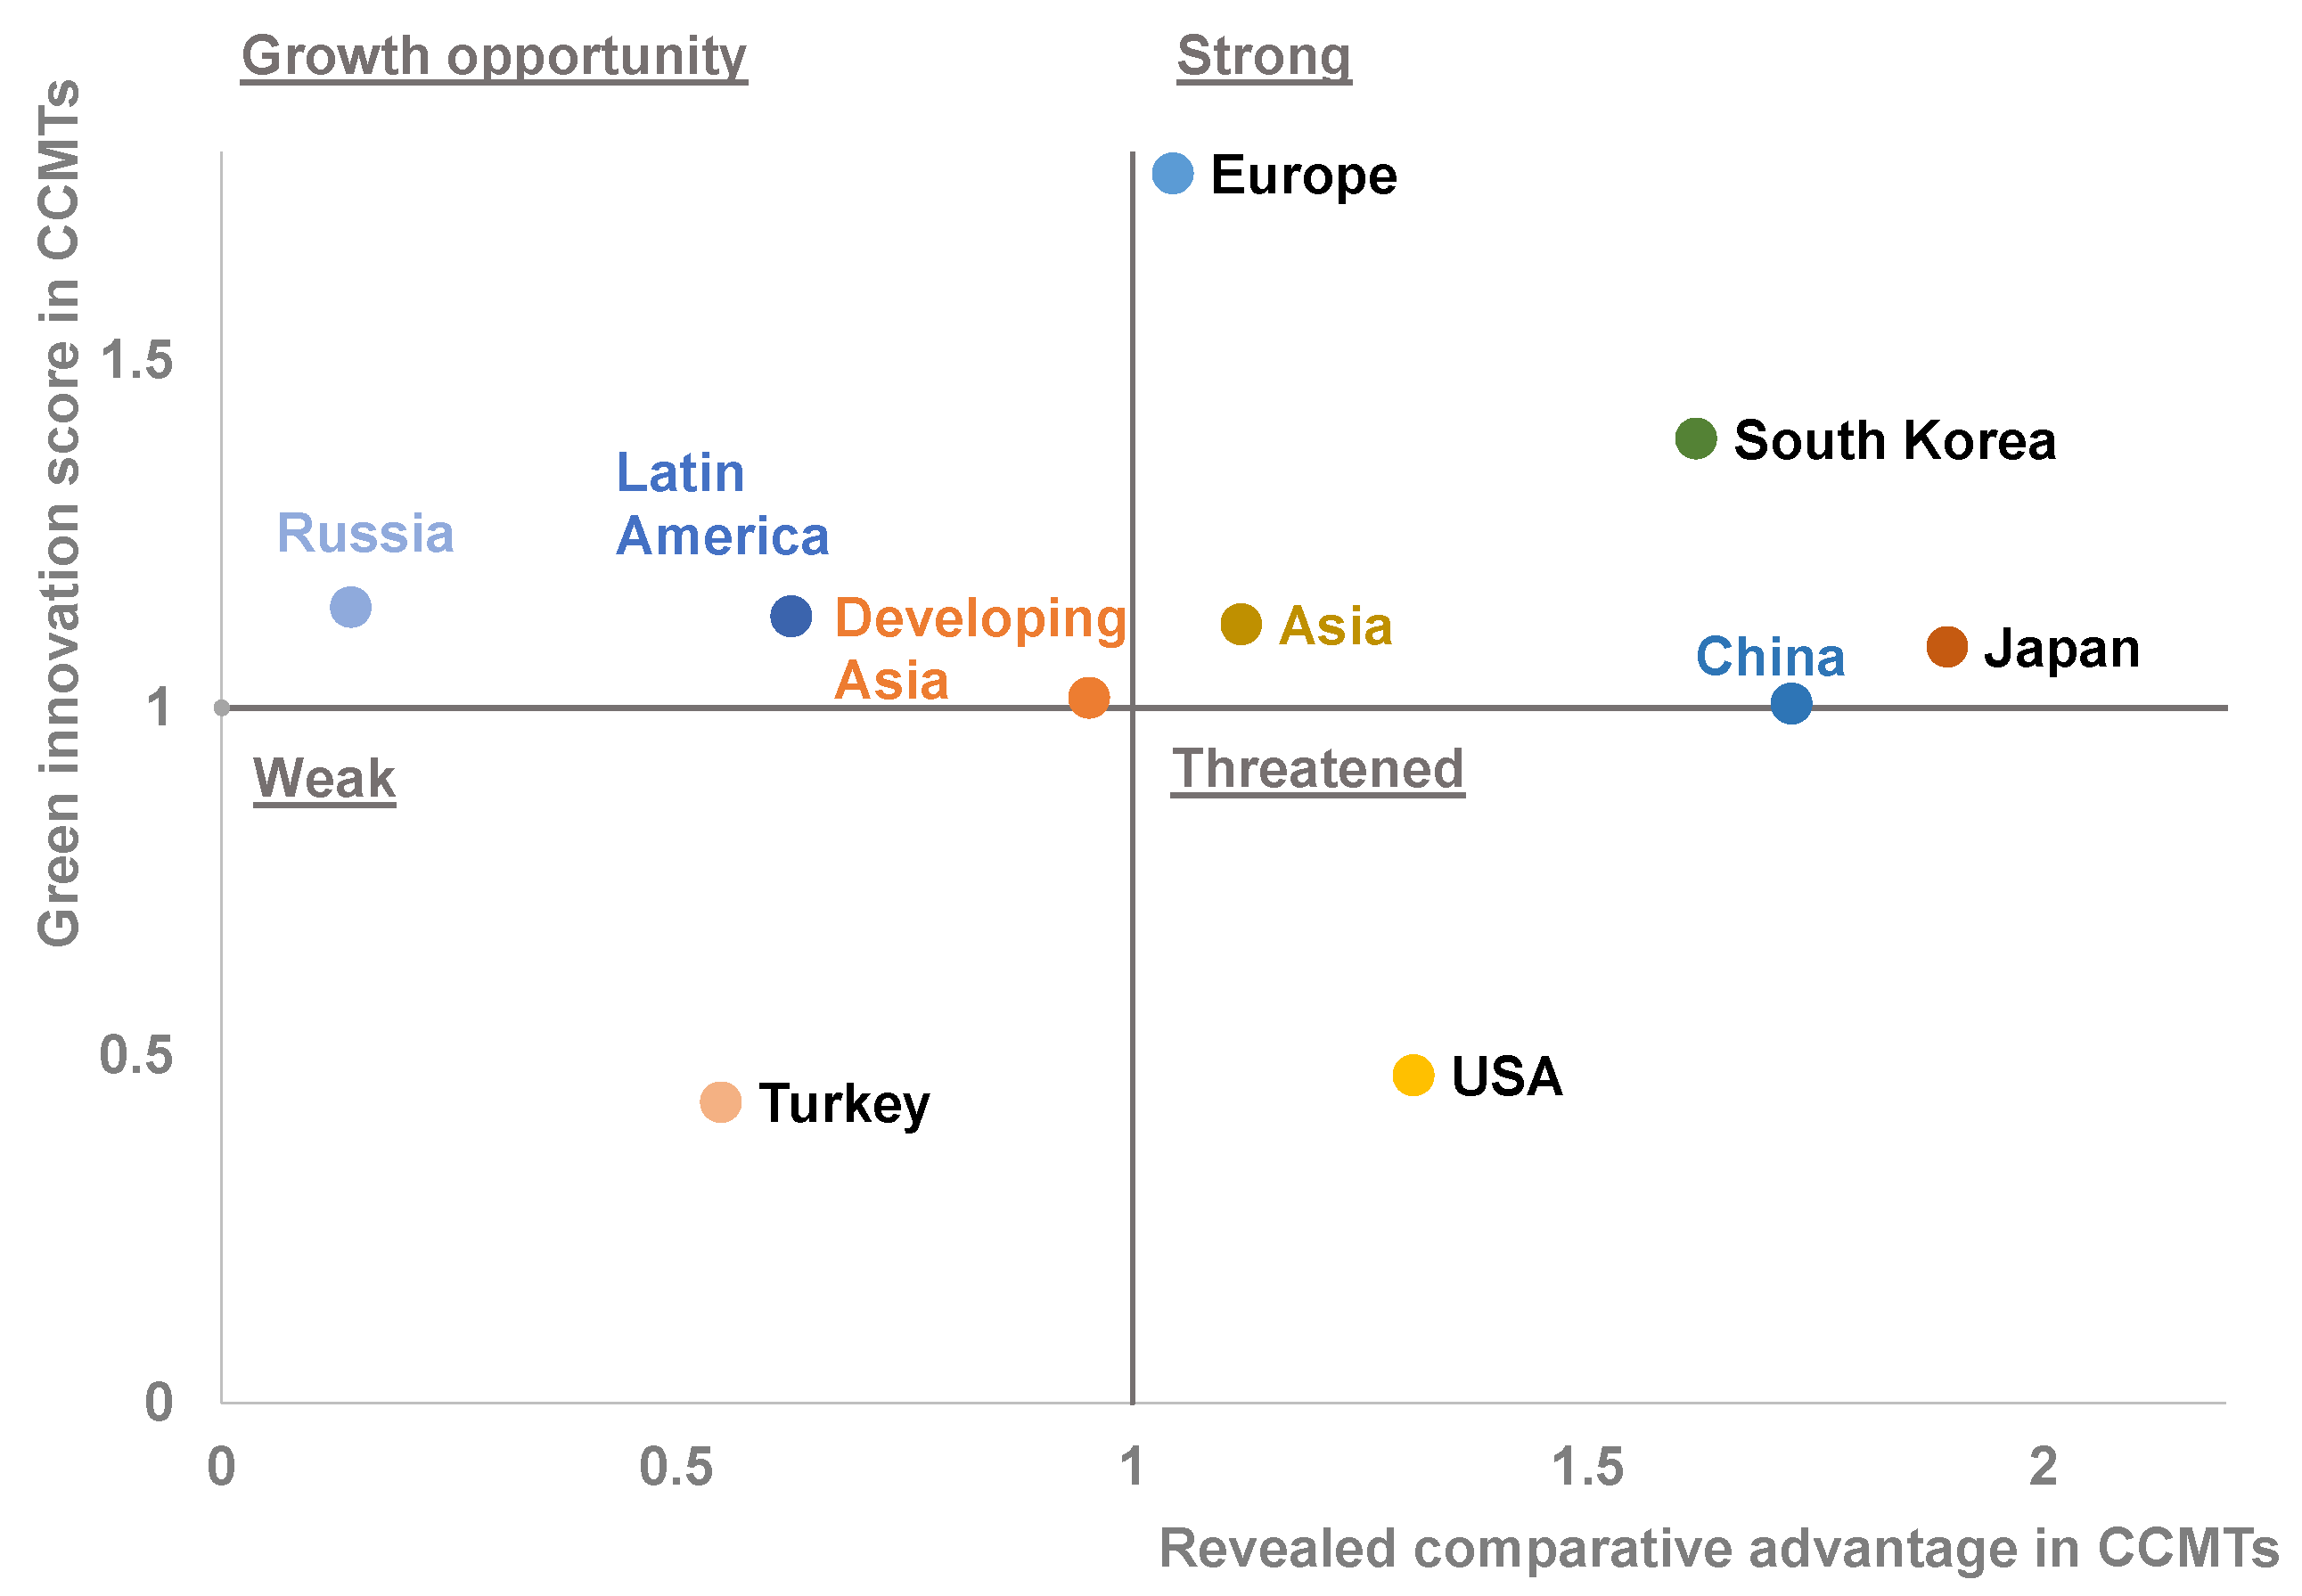
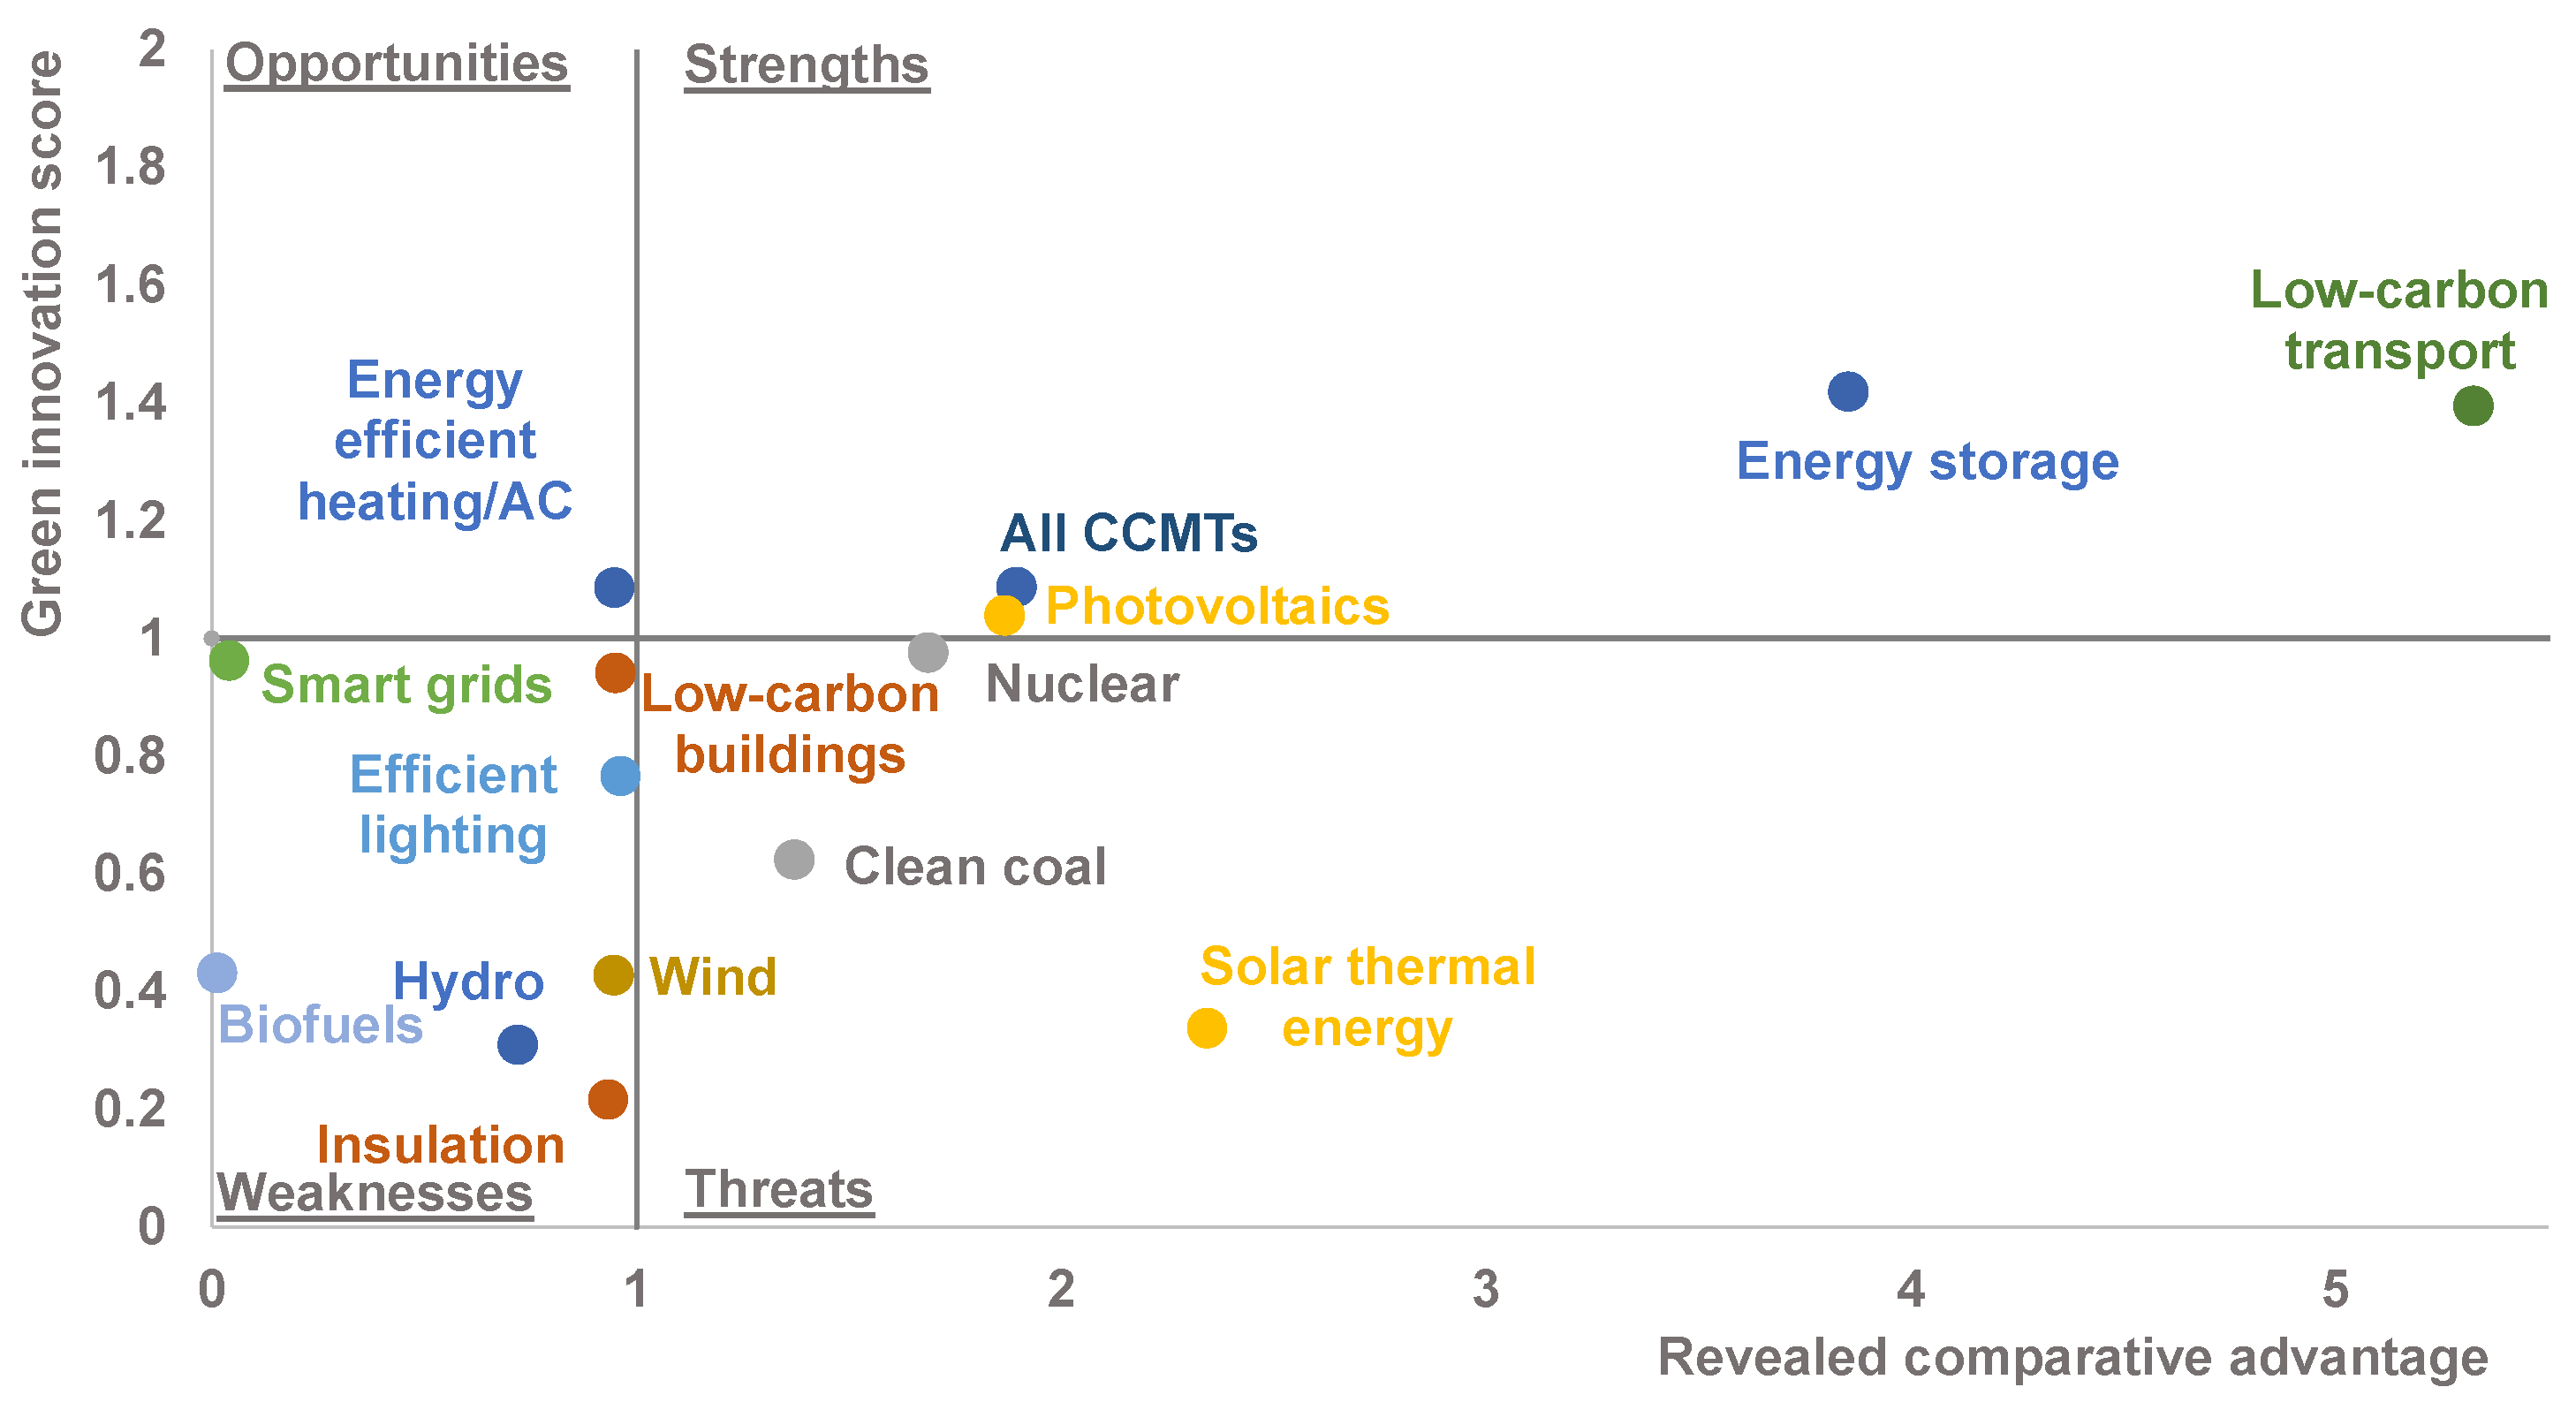
Placing the GIS and RCA on the y and x axes of a plane, respectively, provides the basis for a SWOT (strengths, weaknesses, opportunities and threats) analysis (see Figure 1): The top right quadrant corresponds to strengths: the country is a specialist innovator and exporter in the CCMT and is likely to be well placed to capture global market share in the low-carbon economy. The bottom left quadrant corresponds to weaknesses: the country is neither a specialist innovator nor specialist exporter in the CCMT and is poorly placed to capture global market share. The top left quadrant corresponds to opportunities: the country is a specialist innovator in the CCMT but does not have an export specialization. This is an opportunity because the country can exploit its position as a strong innovator to build its export industry. The bottom right quadrant corresponds to threats: the country is a specialist exporter in the CCMT but does not have enough innovation. This is a threat because it is possible that once the technology paradigm changes, that country’s export market becomes outdated and it loses market share.4 This SWOT framework is based on Fankhauser et al. (2013).
It is important to note that although innovation and export activity in CCMTs are important metrics, they are only two dimensions of a multidimensional set of low-carbon competitiveness indicators. Some important dimensions that are missing from this analysis are technology adoption (as opposed to innovation) and the scale of domestic production by technology. The implication of this is that there can be cases where our analysis does not reflect competitiveness in a particular technology where one exists. We will point out instances where we feel this may be the case.
3. Results
3.1. Descriptive Statistics: Asia’s Scale in the Low-Carbon Economy
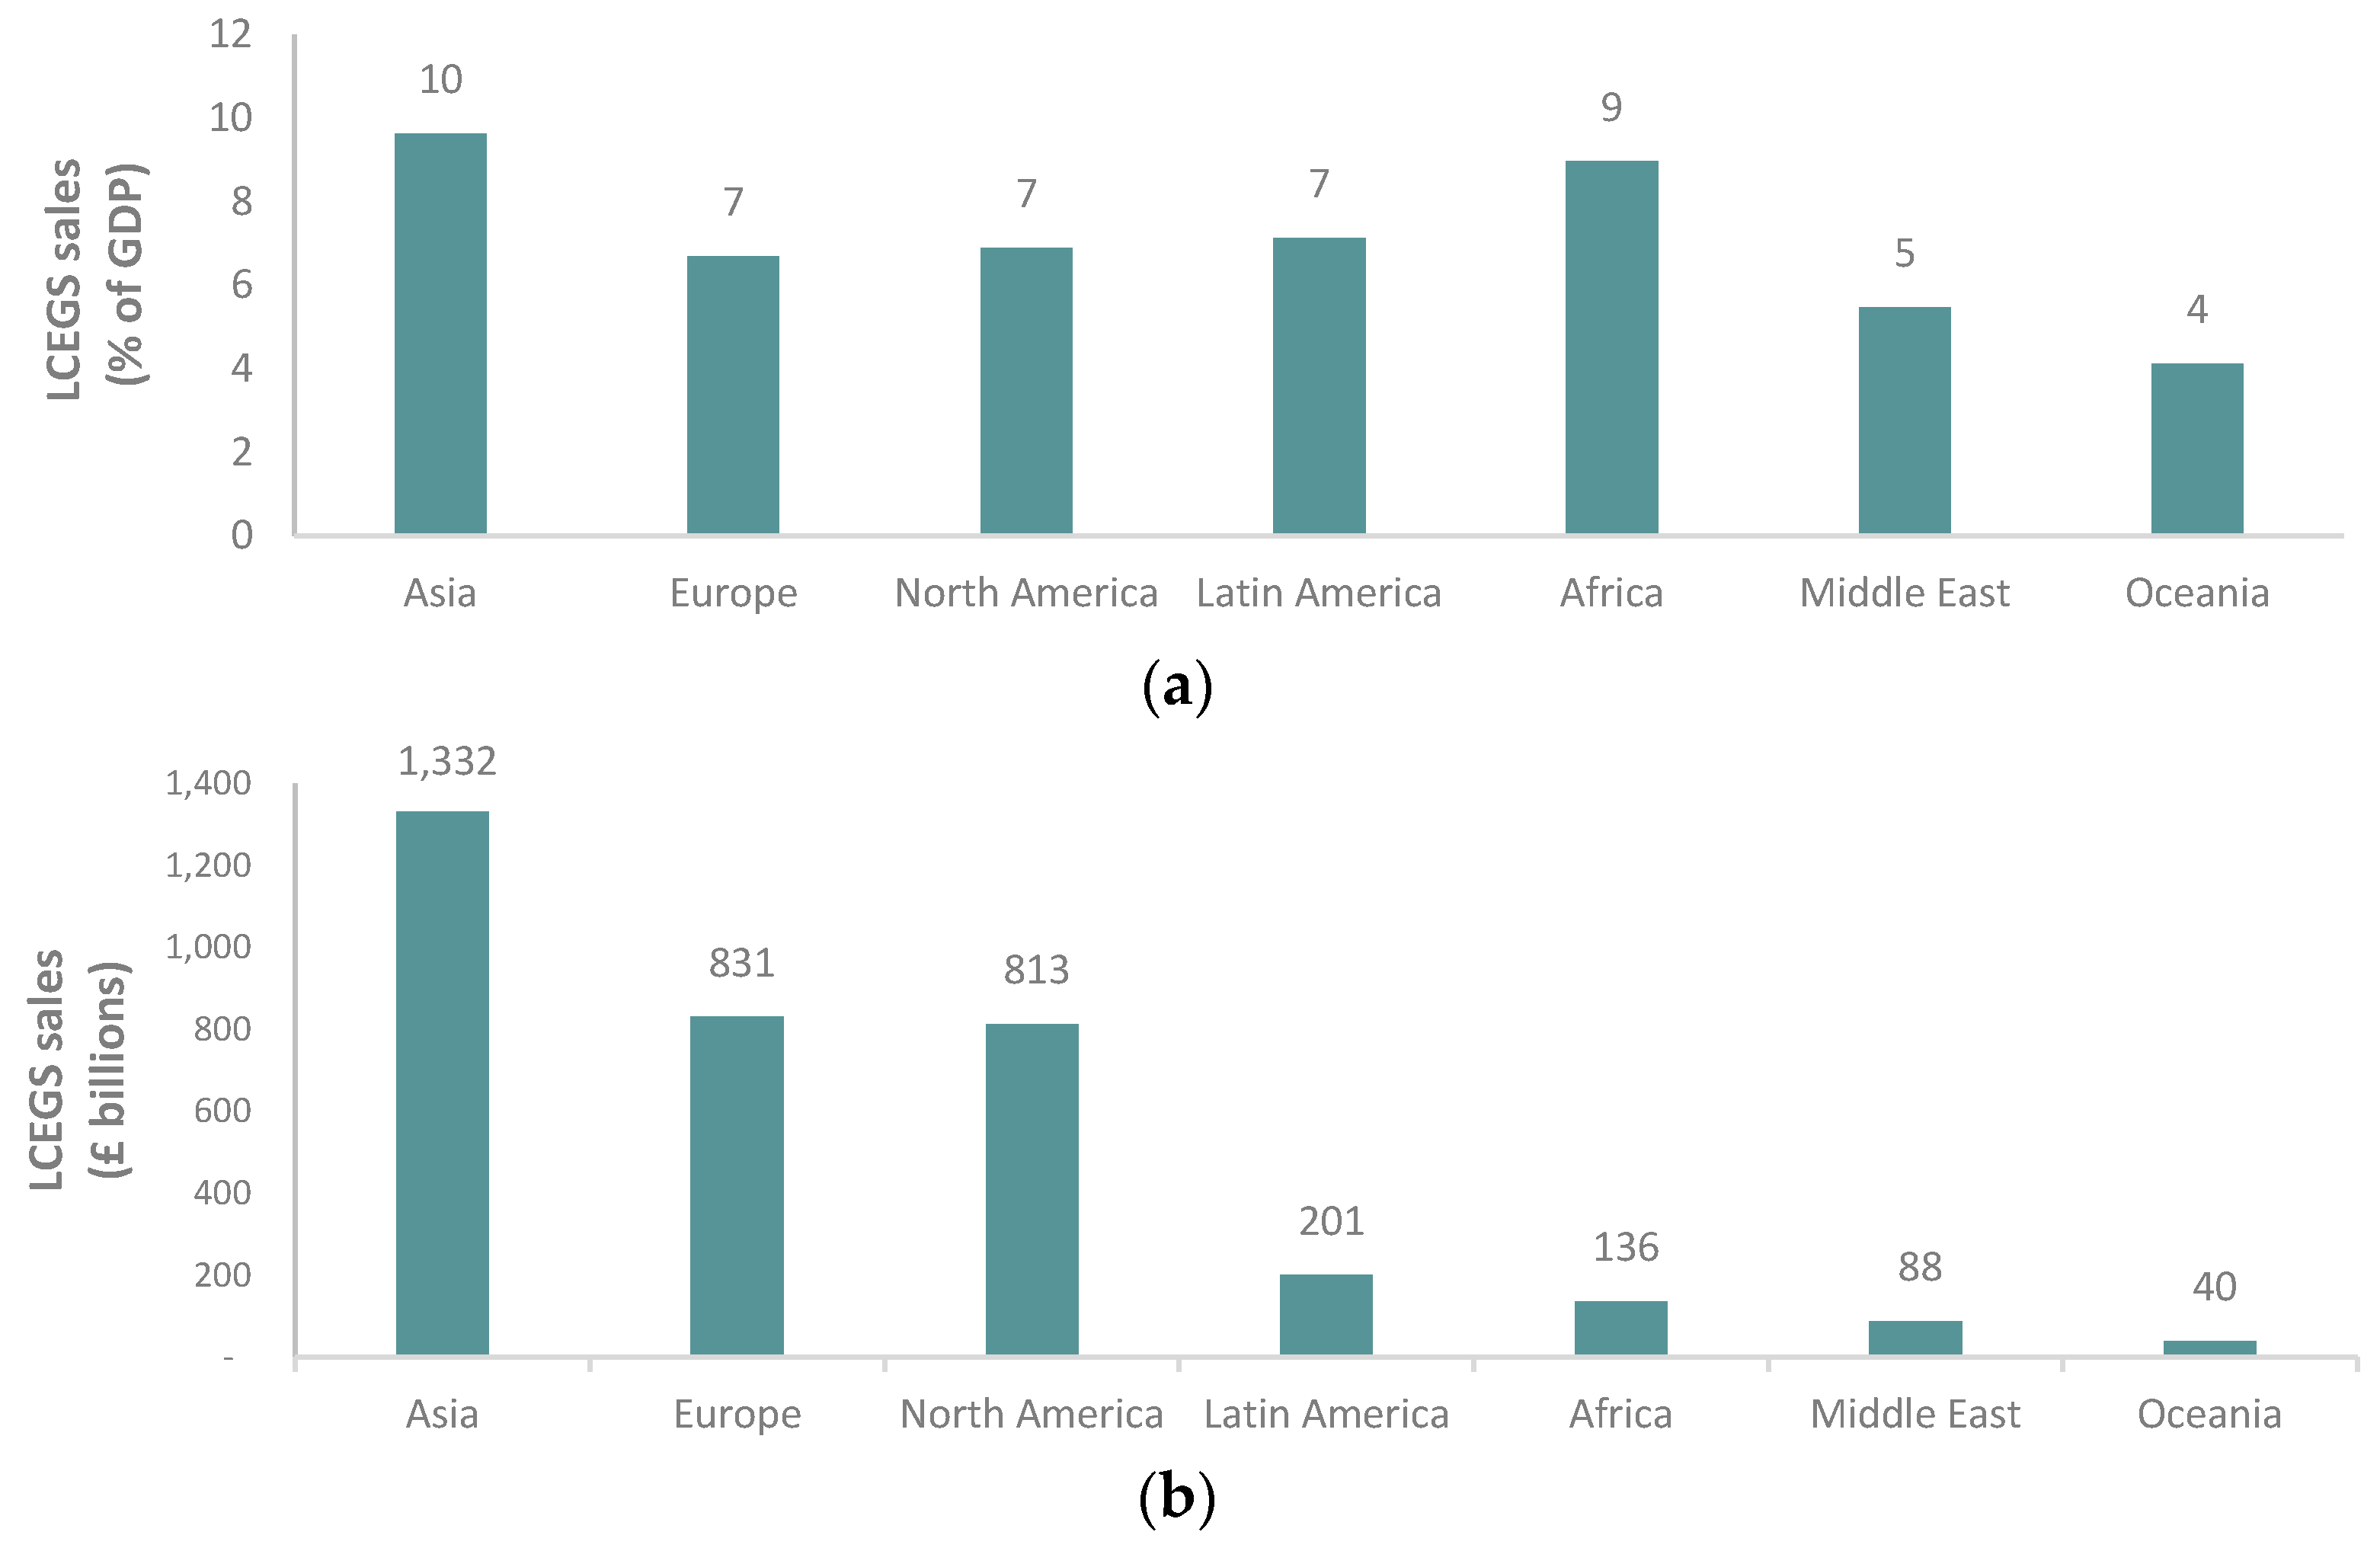
Asia has substantial scale in the low-carbon economy which bodes well for future competitiveness. Using the low-carbon environmental goods and services (LCEGS) database, developed by the UK Government (UK BIS 2011), we compare the current size of Asia’s low-carbon economy to that of other regions. We see that relative to other continents, Asia had the largest value of LCEGS sales in absolute and relative terms in 2011 (Figure 2).
Within Asia, China has the largest value of LCEGS sales (Figure 3), which is expected given the size of its economy. However, relative to GDP, the Philippines, followed by India, have the highest value of LCEGS sales.
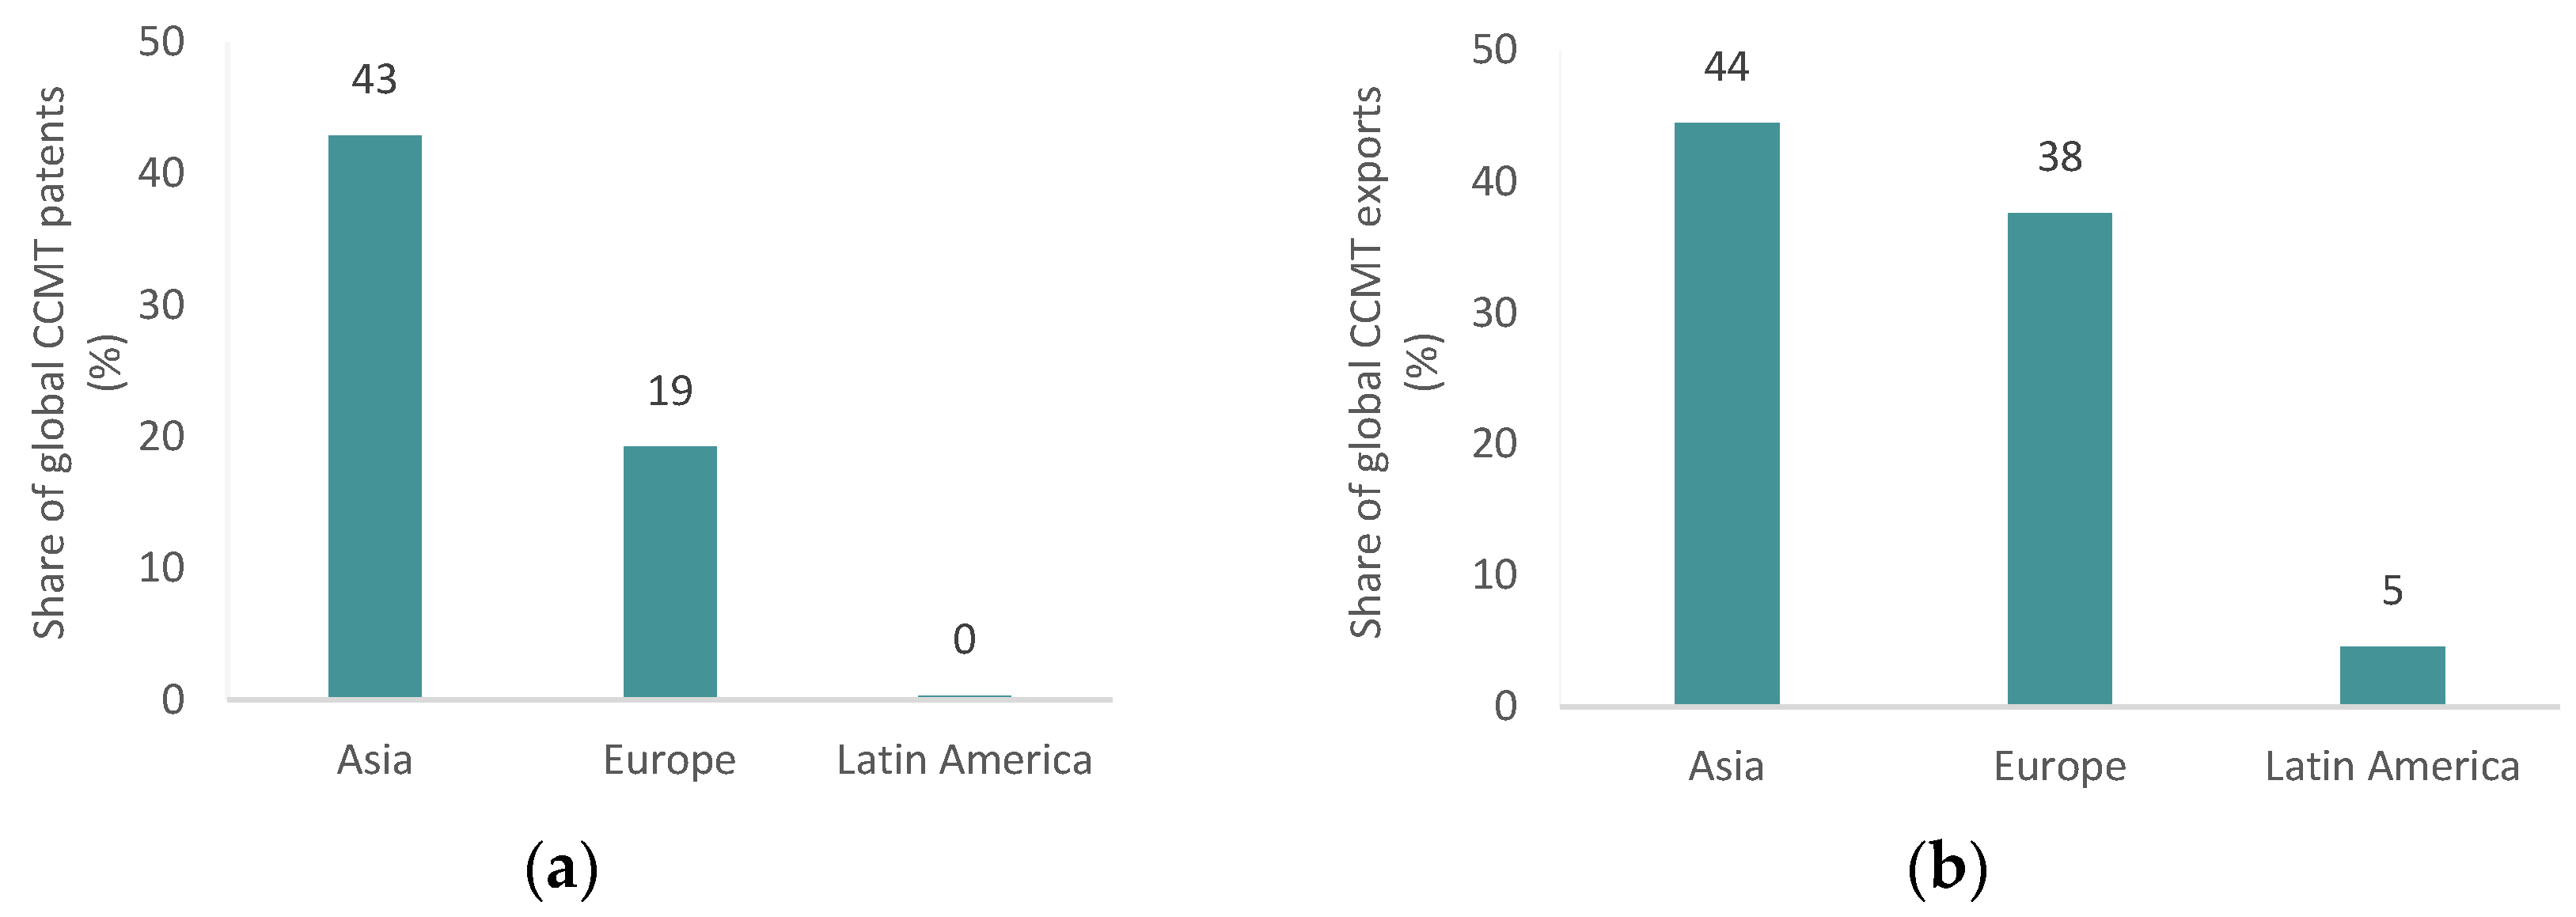
In terms of low-carbon innovation and trade, Asia accounts for 44% of global CCMT exports and 43% of high-value CCMT patents (Figure 4). Over the last decade, Asia’s share of global CCMT exports grew at an average rate of 3% per year and its share of high-value CCMT patents grew at 1%, much of this growth was driven by Developing Asia, which excludes South Korea, Japan and Taipei (see Figure A1 in the Appendix).
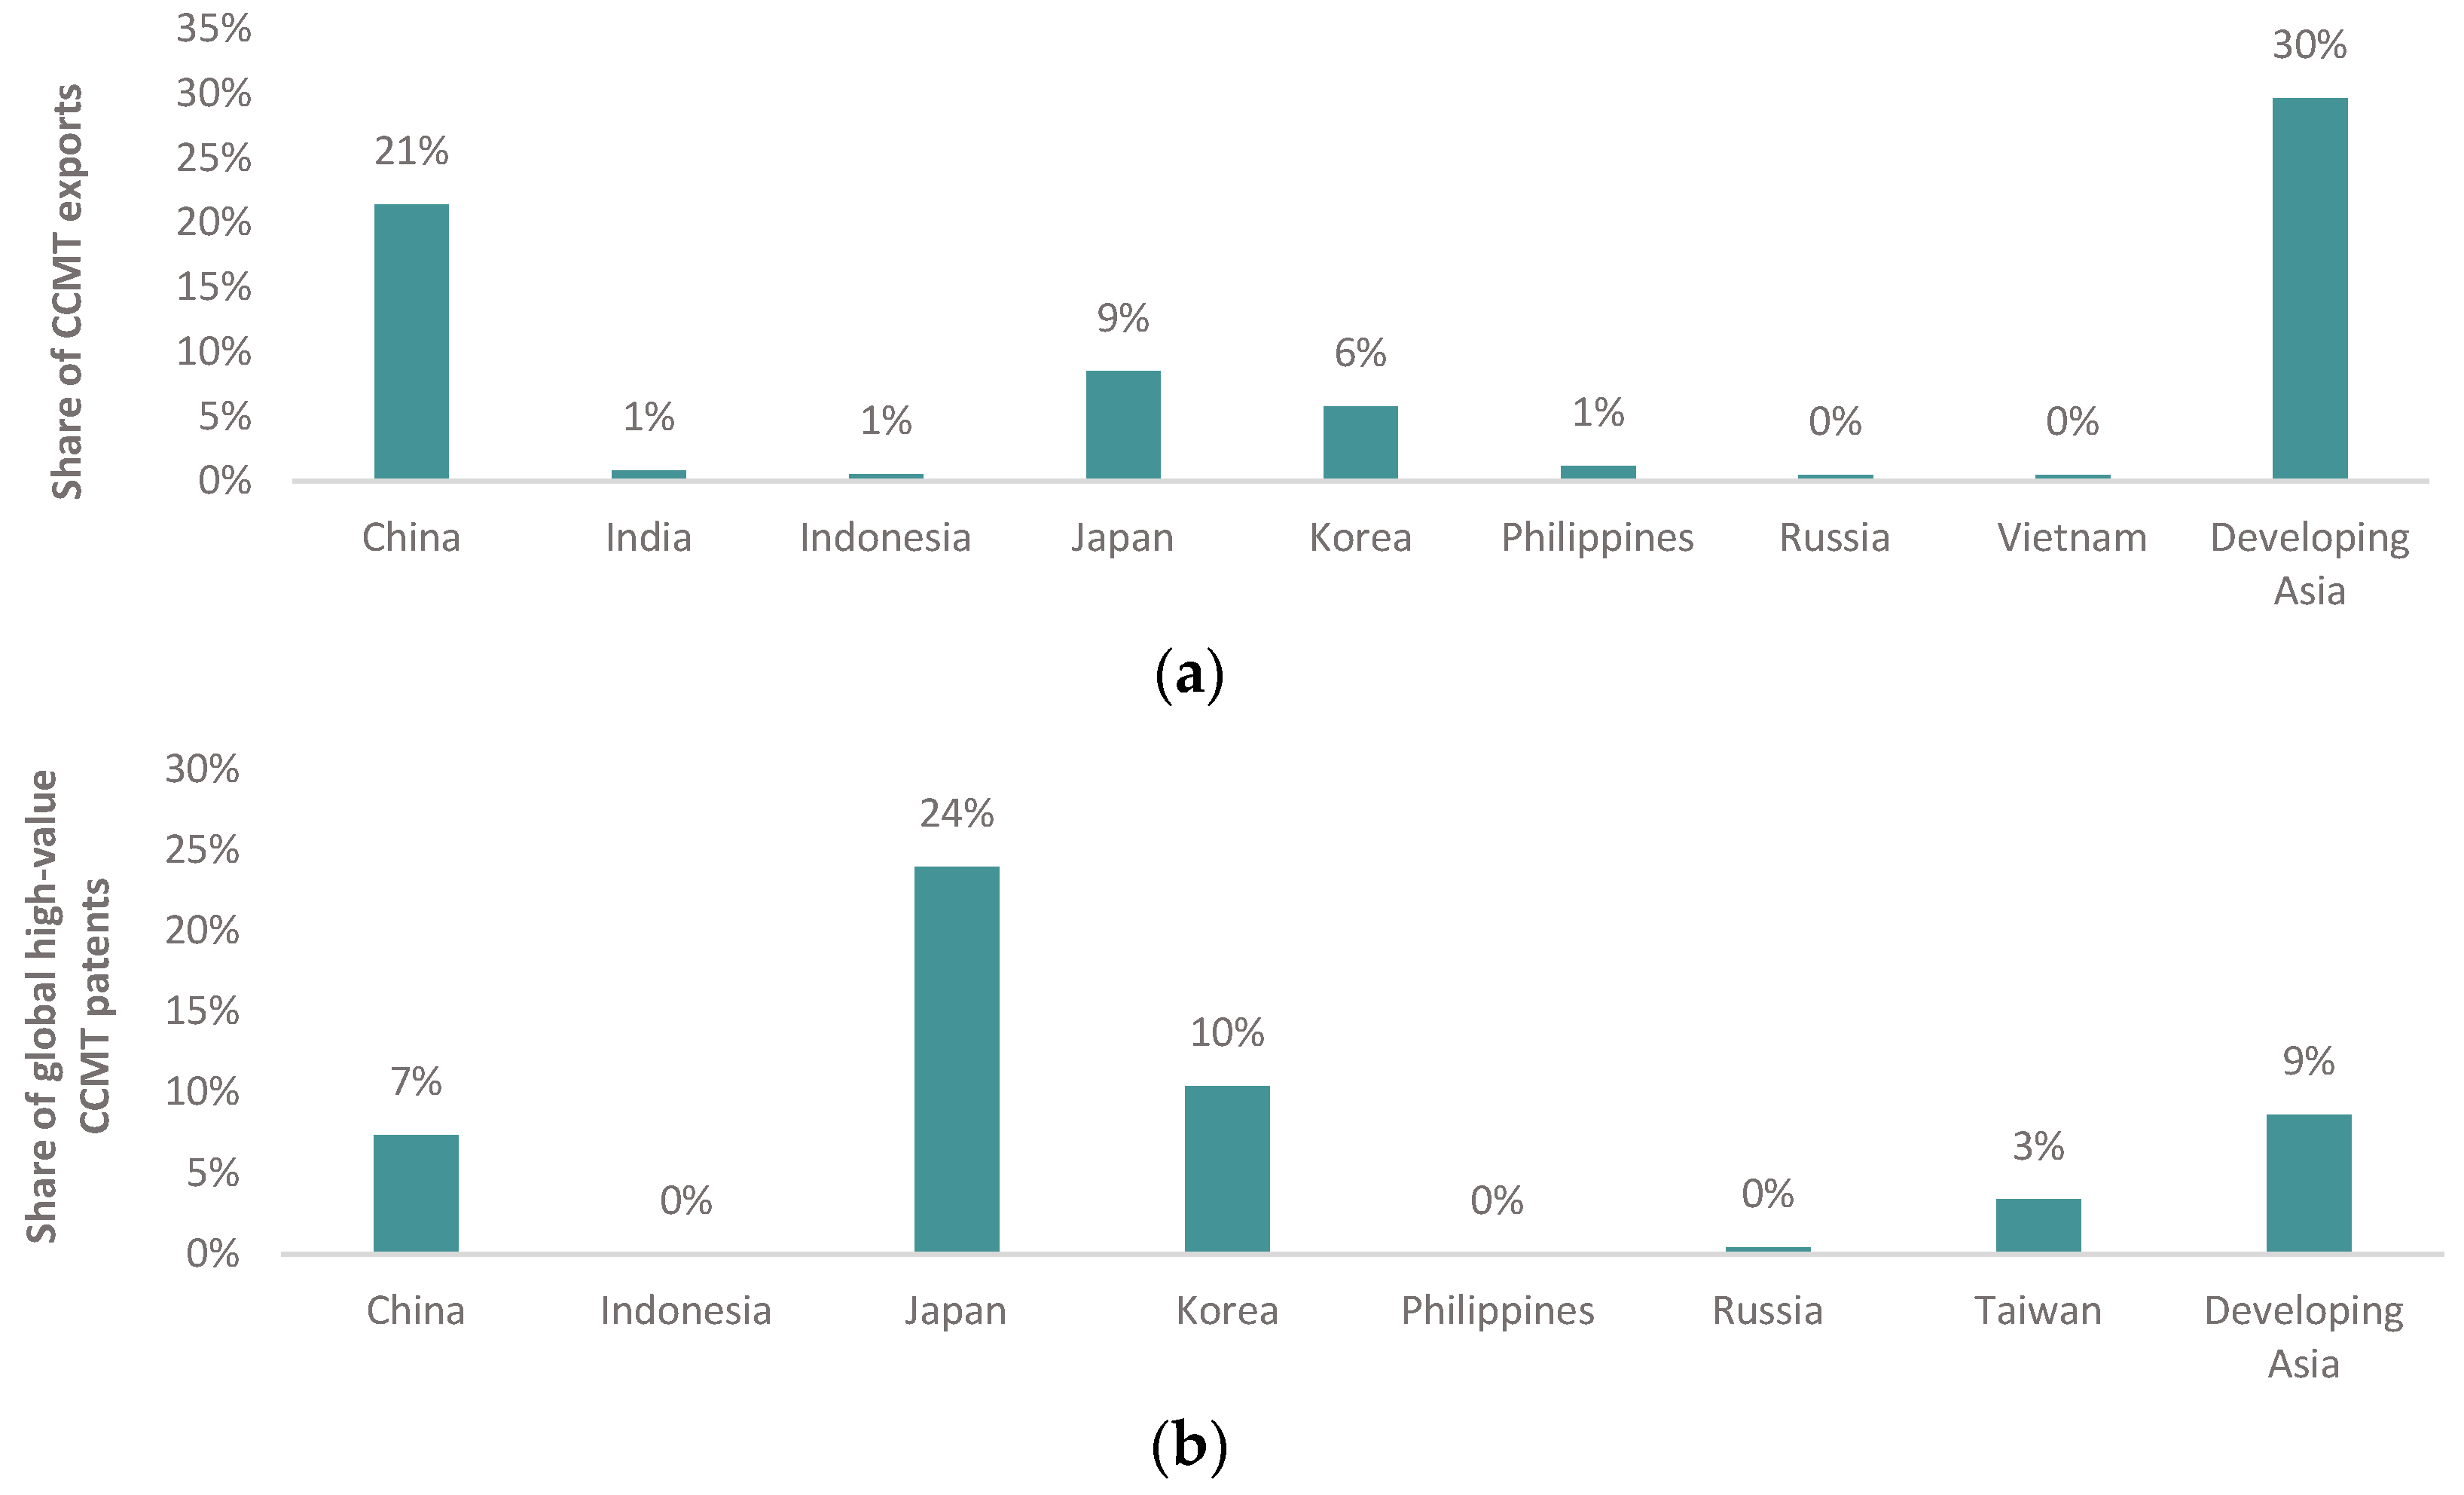
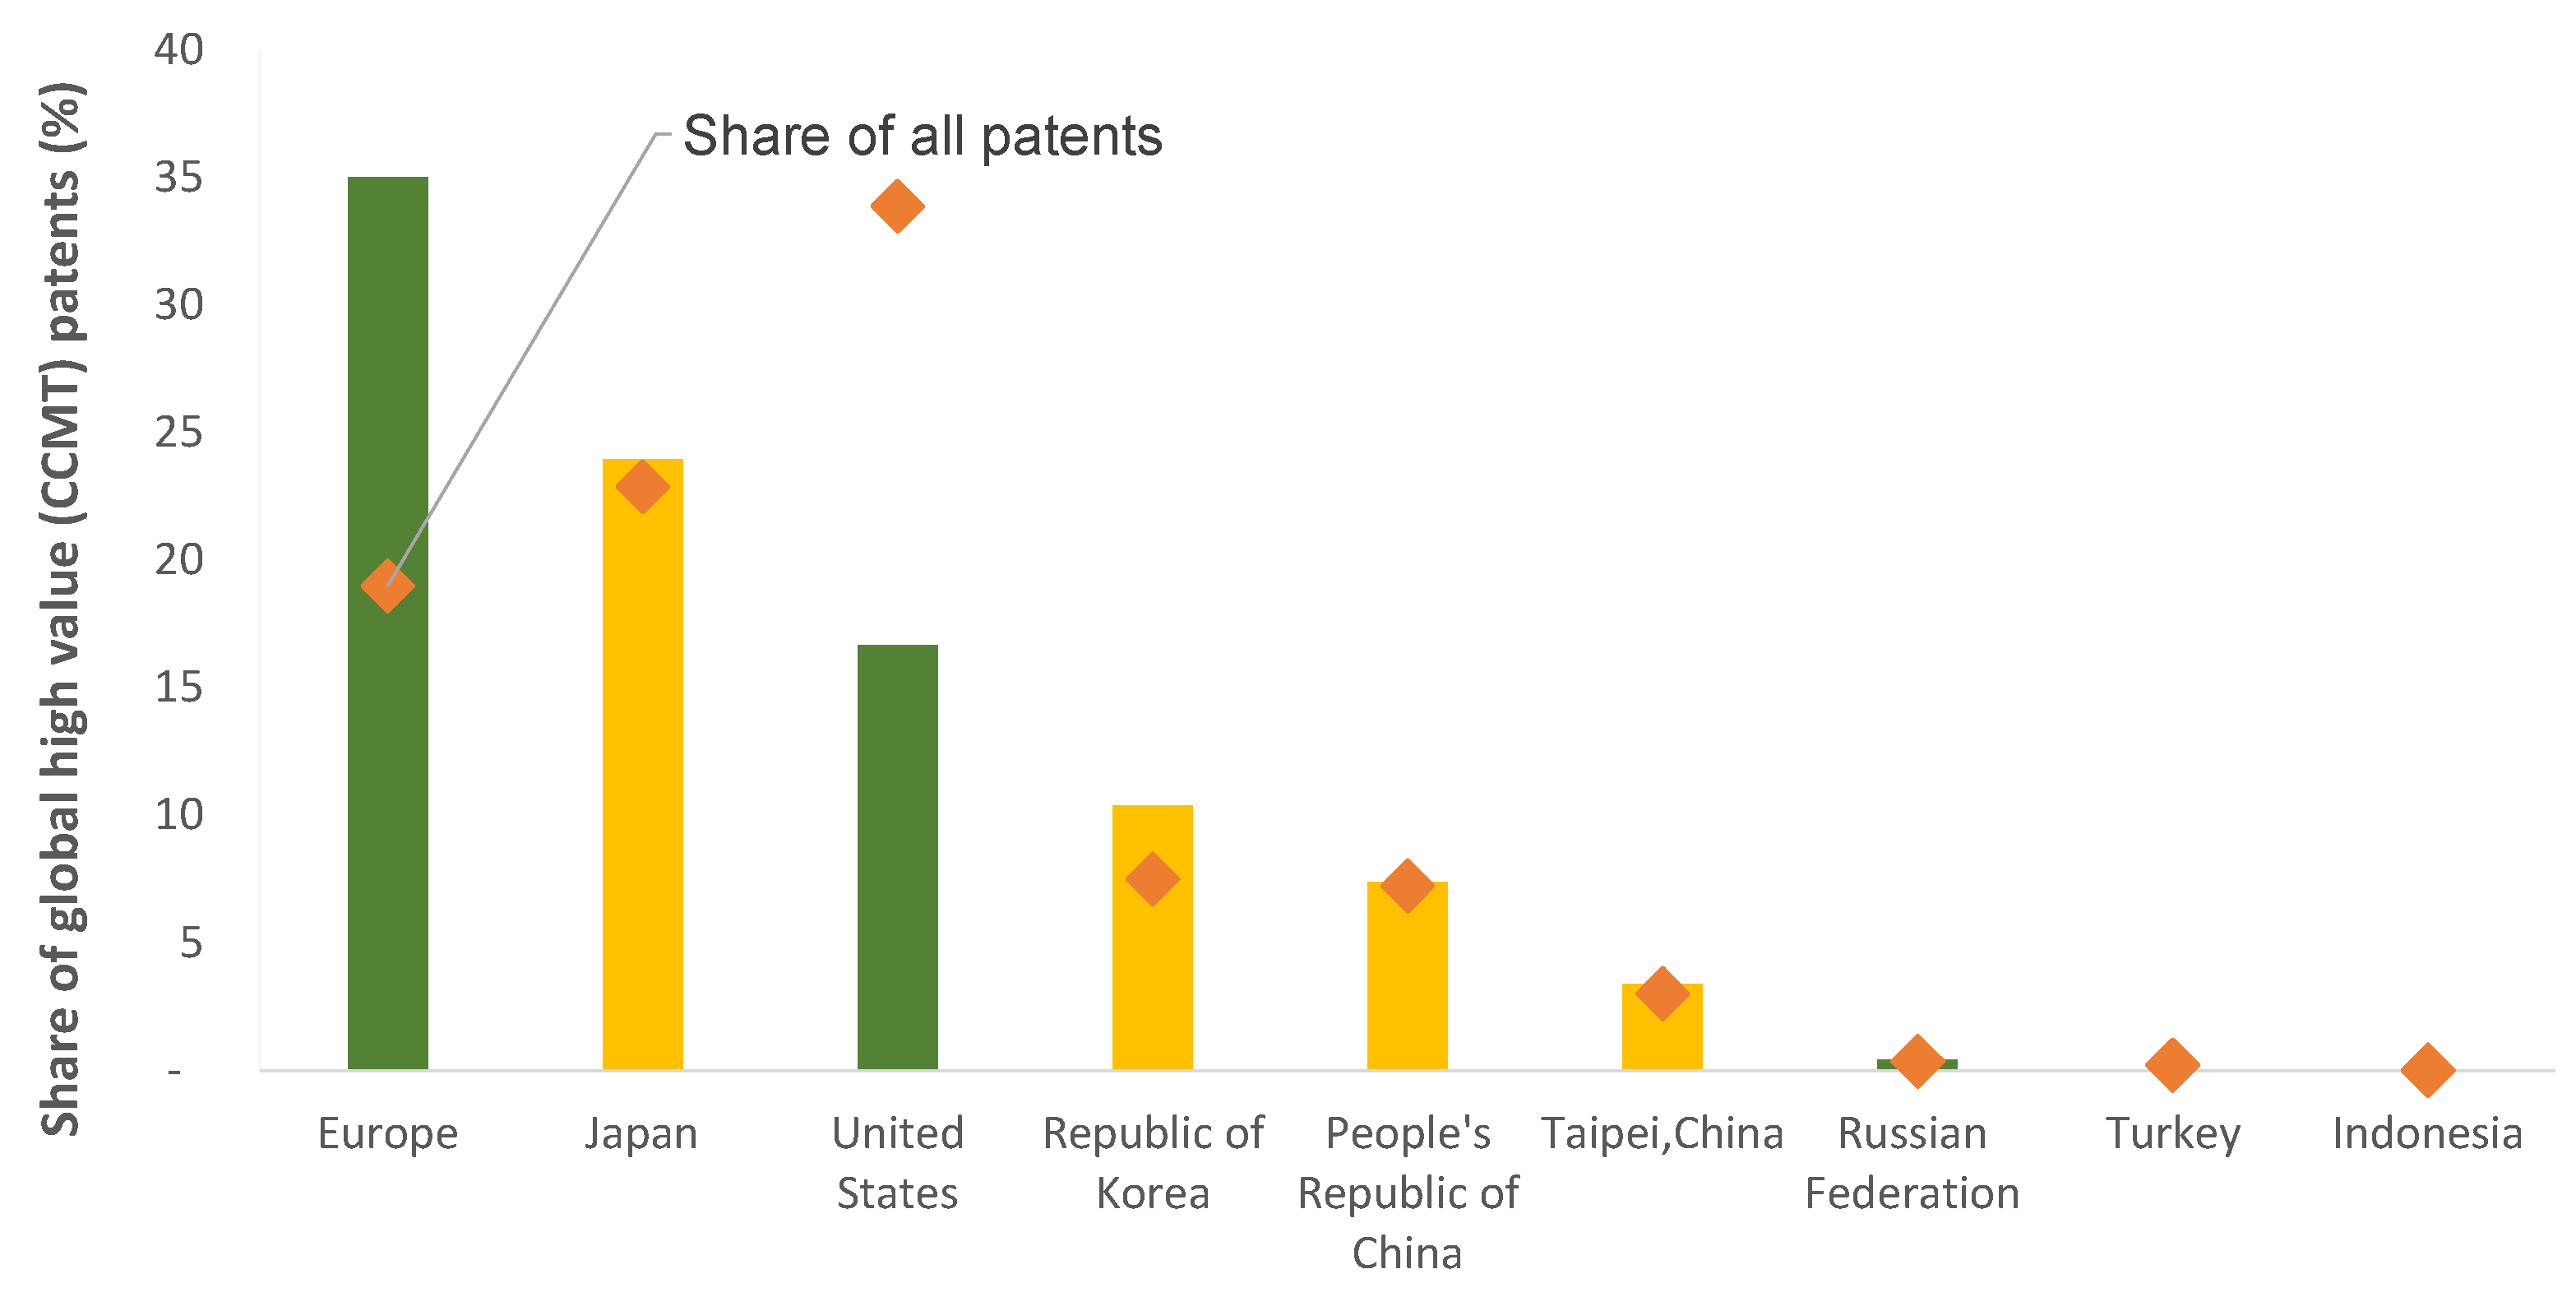
Japan is Asia’s leading innovator and accounts for nearly a quarter of global high-value CCMT patents (Figure 5). China is the largest exporter accounting for one-fifth of global CCMT exports. Asia’s stark regional disparities are illustrated by the fact that when one excludes Developed Asian economies (Japan, South Korea and Taiwan), Developing Asia only accounts for 9% of global high-value CCMT patents. However, it accounts for 30% of global CCMT exports, although a significant proportion of this comes from China alone. Other Asian countries such as Indonesia, Vietnam and the Philippines have negligible levels of patenting activity in CCMTs. This is because these economies do not file many patents in general. Patent data on other economies, such as India and Bangladesh, are poor but anecdotal evidence suggests that these nations engage in process-related innovation which is not typically captured in patent data.
These statistics shows that, collectively, Asia has favorable scale in the low-carbon economy, although there are regional disparities. The continent accounts for nearly half of the world’s exports and high-value patents in CCMTs. The proportion of low-carbon environmental goods and services is also the largest in Asia relative to other continents.
According to Fankhauser et al. (2013), one of the indicators of future success in the low-carbon economy is current scale. If a region already has sizable low-carbon sectors, it can take advantage of economies of scale, scientific clusters, demand externalities and path dependencies to further grow its low-carbon economy, all other things being equal.
3.2. Asia’s Competitiveness in the Low-Carbon Economy
This section presents the results of the competitiveness analysis for Asia and then focuses on the continent’s strongest sub-region: East Asia.
The analysis shows that, overall, Asia is a specialist innovator and exporter in CCMTs. Asia’s position in the upper right quadrant of Figure 6 suggests that it is a competitive low-carbon economy. Combined with the fact that Asia already has scale in the production of LCEGS and has witnessed consistent growth in CCMT sectors, the continent is well placed to capture value from the design and export of CCMTs. Within Asia, South Korea and Japan have particularly strong positions as specialist innovators and exporters in the low-carbon economy, as indicated by their high GIS and RCA values. China is also in a relatively strong position due to its strong comparative advantage in CCMTs and large domestic scale, even though its share of CCMT patents is in line with the global average. When we exclude South Korea and Japan from the sample, and consider Developing Asia, we see a GIS of 1.0 and a RCA of 0.9, indicating that the region is at the cusp of being competitive and has room for development by further building an innovation specialization and comparative advantage in CCMTs.5
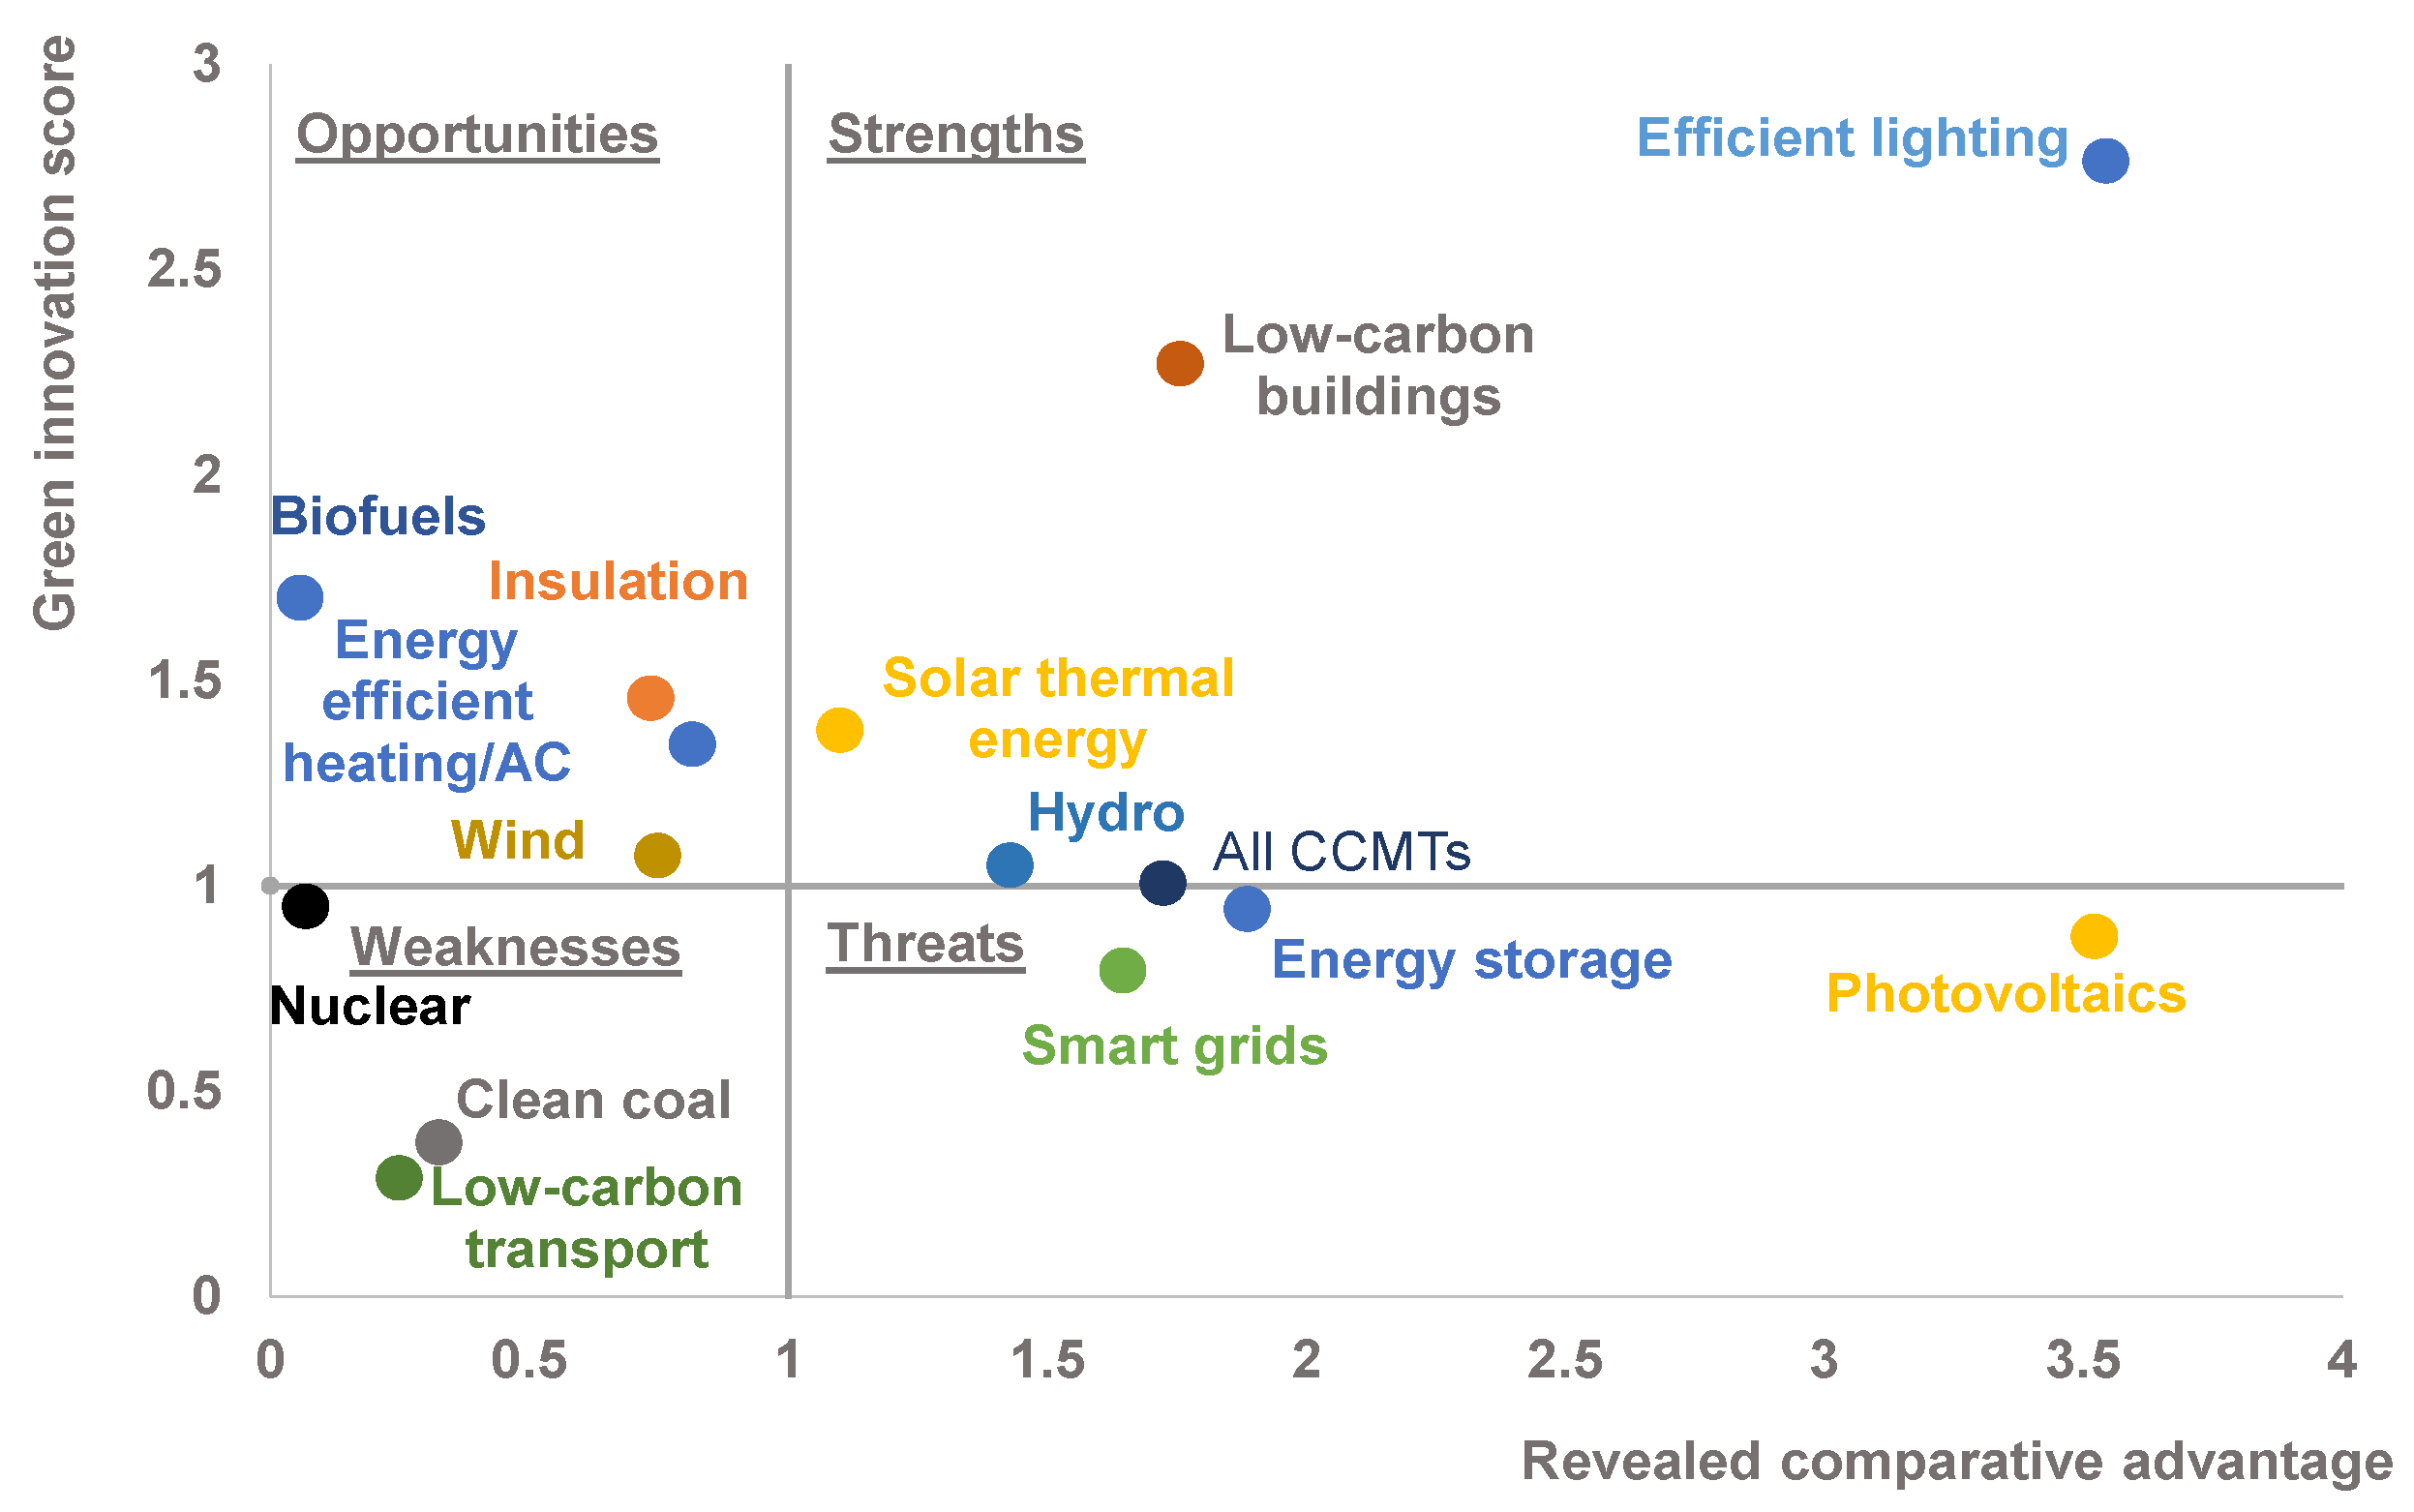
Across CCMTs, Asia’s strengths include efficient lighting, energy storage and photovoltaics (PV) (Figure 7). In these technologies, Asia’s share of patenting and exporting activity exceeds the global average, indicating a strong innovation specialization and comparative advantage. Asia accounts for over half of the world’s high-value CCMT patents and exports in these technologies (Figure A2, Appendix).
Asia has growth opportunities in low-carbon buildings, nuclear and energy-efficient heating/AC where it can strategically use its innovation specialization to boost export activity. While nuclear has seen a backlash in some Asian countries, in others it has experienced increasing rates of innovation. Overall, high-value nuclear patents in Asia have grown at a rate of 9% per year over the last decade. Asia now accounts for 45% of the world’s nuclear patents (Figure A2, Appendix). It is at the cusp of being a specialist innovator in smart grids and low-carbon transport.
Weaknesses, where Asia has neither an export nor innovation specialization, include biofuels, clean coal, hydroelectric power, solar thermal energy and wind. In these technologies, Asia is currently not well placed to capture value from design or trade. Some of these weaknesses, however, must be interpreted with caution. One such example is wind power: although Asia is not a specialist in wind, it has phenomenal scale in the technology. Specifically, China has the largest installed capacity in the world and has seen rapid growth in the domestic wind generation sector. Domestic scale can lower unit costs and increase competitiveness, which may bode well for future wind exports.
3.3. The Low-Carbon Economy in East Asia
East Asia has promising prospects in the low-carbon economy. Japan accounts for a quarter of global high-value CCMT patents while South Korea, China and Taipei collectively account for one-fifth (Figure 8). Over the last decade, CCMT patenting activity has increased in East Asia (Figure A3, Appendix). In these regions, the level of innovation in CCMTs either equals or exceeds that of general innovation, illustrating the shift towards low-carbon development. In South Korea, the share of low-carbon patents is higher than general patents which may be explained by the fact that it was one of the first economies in Asia to announce a ‘green growth’ strategy, back in 2008.
East Asia seems well placed as an exporter of low-carbon technology (Figure 9). China accounts for one-fifth of global CCMT exports, while South Korea and Japan together account for 15%. The share of CCMT exports exceeds the share of general exports for all three East Asian economies.
Japan and South Korea are specialist exporters and innovators in CCMTs as shown in Figure 6, while China has a strong comparative advantage and large domestic scale. This is a strong indicator of East Asia’s potential, as more innovative and export-focused economies are better placed to capture value from the global low-carbon transition. The subsequent sections will look at individual country profiles to identify strengths and weaknesses at a more granular level.
3.3.1. South Korea’s Low-Carbon Economy
In 2008, South Korea was one of the first countries in Asia to announce a green growth plan. The Government of Korea launched its National Strategy for Green Growth (2009–2050) where it stated that green growth is a strategic priority. Consequently, research and development expenditure related to green growth and share of green overseas development assistance grew rapidly. Since 2000, South Korea’s environmental and resource productivity, including CO2 emissions productivity, energy productivity, and domestic material consumption, have improved (Statistics Korea 2012).
South Korea has a strong RCA and GIS in several low-carbon technologies. Our analysis shows that it is well placed to take advantage of the low-carbon transition across PV, efficient lighting, low-carbon buildings, energy-efficient heating/air conditioning, and energy storage technologies (Figure 9). It has a particularly deep specialization in patenting and exporting PV and energy storage technologies. It accounts for one-fifth of the world’s high-value PV and energy storage patents (Figure A4, Appendix). In the last decade, South Korea’s share of global high-value PV patents grew at 16% per year and its share of high-value energy storage patents grew at 11% per year. South Korea is now poised to have one of the world’s largest energy storage systems. Compared to other countries, the data suggests that South Korea innovates in areas where it has an existing export advantage (or vice versa), thus playing to its strengths. Opportunities for South Korea include nuclear, insulation, hydroelectric power and smart grids.
South Korea has several policies to support CCMT sectors (Figure 10). In the period of our study, government R&D expenditure of importance to green growth increased from 7% in 2002 to 18% in 2010, which may offer some explanation for the rapid increase in CCMT patent filings (Statistics Korea 2012). South Korea also has incentives to promote energy storage technologies: producers get additional points on the assessment of their renewable energy certificates if the energy produced comes with storage units (Pothecary 2016). It is likely that subsidies for renewable energy and the target to achieve 20% of generation from renewable sources by 2030 have helped CCMT sectors. While targets for improving energy efficiency by 2.5% per year till 2030 have likely supported energy-efficient technologies.
3.3.2. Japan’s Low-Carbon Economy
Japan’s 2009 growth strategy placed a strong emphasis on innovation and low-carbon growth. Key priorities were renewable energy, low-carbon innovation, and zero emission residential and commercial buildings (Capozza 2011). Japan’s overarching green economy objective for 2020 is to generate market value of over half a trillion USD and 1.4 million jobs in environment-related sectors. It also aims to reduce global GHG emissions by promoting Japanese technology worldwide.
Japan files the largest number of high-value CCMT patents in Asia and is one of the top 3 low-carbon innovators in the world. Based on an assessment of Japan’s GIS and RCA across CCMTs (Figure 11), the country is well positioned to capture value from the design and export of low-carbon transport, energy storage and PV. Japan’s share of exports in low-carbon transport is over five times higher than the world average, indicating a strong and highly entrenched comparative advantage (Figure 11). This is not surprising since Japan is one of the world’s top markets for transportation. Similarly, for energy storage, its share of exports is four times larger than the world average. In 2012, Japan accounted for roughly one-third of the world’s low-carbon transport and energy storage patents and 24% of PV patents (Figure A5, Appendix).
Japan has the opportunity to develop its energy-efficient heating/AC sector where it has an innovation specialization but lacks comparative advantage. Its core weaknesses include biofuels and hydroelectric power, where it has no innovation or export specialization. In several other technologies Japan is also relatively weak but its share of exports is almost in line with the world average (these include low-carbon buildings, efficient lighting, wind and insulation). In other technologies, Japan is ‘threatened’ because it has a comparative advantage but no innovation specialization (nuclear, clean coal and solar thermal energy).
Overall, Japan is in a strong competitive position for key CCMT technologies. Low-carbon transport, energy storage and PV markets are poised to grow in the future and Japan enjoys a competitive advantage in these areas. Japan is weaker in low-carbon buildings and smart grids where it could potentially ramp up efforts to build global competitiveness, given the growth potential of these sectors. In some established CCMTs, such as hydroelectric power and nuclear, Japan is not strong, but it may be the case that these are not strategic priorities due to public opinion and/or limited growth prospects.
3.3.3. China’s Low-Carbon Economy
Economic growth has severely compromised the quality of the environment in China. In 2014, the Ministry of Environmental Protection announced that 44% of China’s groundwater was deemed to be of poor quality, 20% of farmland was contaminated, and that only three out of 74 monitored cities met official air quality standards. Underpinning these trends is the fact in 2006 China became the world’s largest CO2 emitter (Ho and Wang 2014).
Acknowledging these realities, the government has made heroic efforts to control pollution. China’s 2011–2015 Five Year Plan set out a new growth path via resource conservation and developing new capabilities in green technologies (Green Alliance 2013). The nation’s low-carbon push is particularly visible in the renewable energy sector. It has achieved the world’s largest wind power capacity, has plans to triple solar power, and multiply nuclear capacity six-fold by 2020 (Ho and Wang 2014). Officials have committed to ensuring renewables account for 20% of the energy mix by 2030 and aim to reduce carbon intensity by 17% (Albert and Xu 2016).
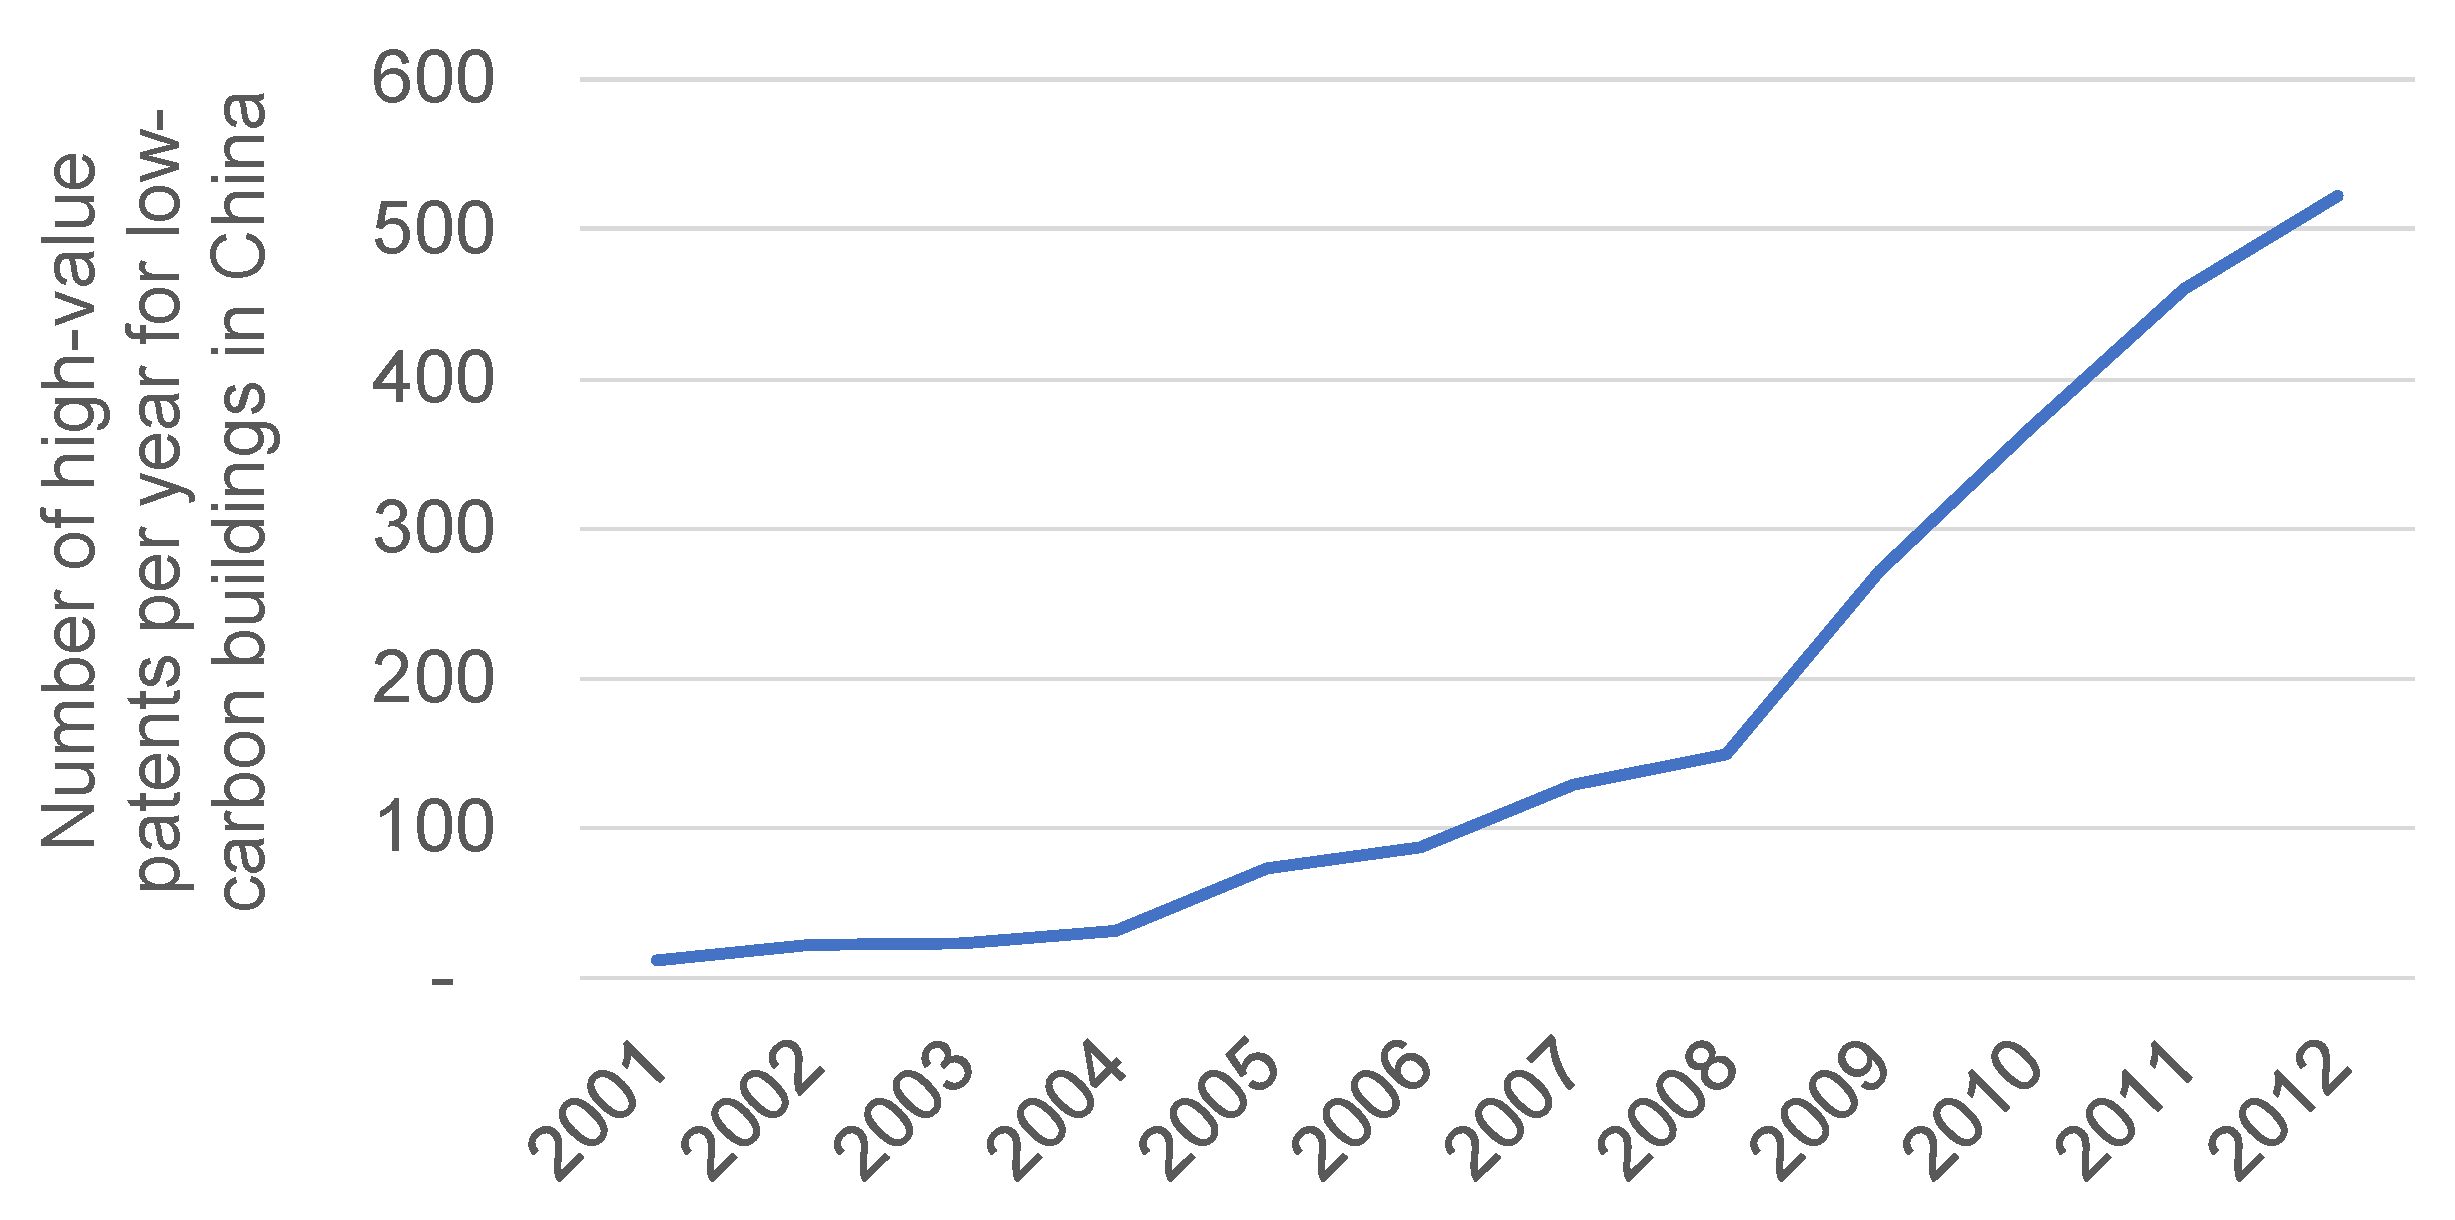
Analysis of the China’s GIS and RCA scores shows that it is globally competitive in efficient lighting, low-carbon buildings, solar thermal energy and hydroelectric power (Figure 12). Out of these technologies, its most competitive areas are efficient lighting and low-carbon buildings where it has an entrenched comparative advantage and a strong innovation specialization. The number of high-value patents related to efficient lighting grew at 9% per year over the last decade and China now makes up one-fifth of the world’s high-value patents in this technology. Similarly, in the last decade China went from accounting for only 1% of global, low-carbon building patents to 17% in 2012 (Figure A6 in the Appendix shows China’s surge in innovation for low-carbon buildings). Opportunities for China include insulation, biofuels, wind and energy-efficient heating/AC.
Markets in which China has a strong comparative advantage but lacks an innovation specialization are: PV, energy storage and smart grids. China’s share of PV exports is three-and-a-half times higher than the world average, indicating a strong and highly entrenched comparative advantage. Its share of smart grid and energy storage exports is also almost double that of the global average. However, in all of these technologies, despite being a specialist exporter, it is not a specialist innovator. For certain technologies, this is a risk because once the technology paradigm changes, China’s market will become outdated and it will lose export share. However, the magnitude of this risk is uncertain because China may have the ability to quickly adapt to the new technology paradigm thereby making its market relatively resilient or, alternatively, the technology may not experience further significant changes.
Policies that have supported China’s CCMT sectors from 2001 to 2013 included state subsidies for energy-efficient buildings (up to US$13 per square meter to retrofit existing buildings and one-off grants for new-builds) and subsidies for renewable energy (Green Alliance 2013).
In China’s case, it is especially important to note that the GIS and RCA are only two dimensions of competitiveness in the low-carbon economy. Domestic scale is an important third dimension which is not represented in this SWOT analysis. For example, for some technologies, such as wind, our data may not give a clear picture of competitiveness as it does not account for domestic scale. There are agglomeration benefits associated with domestic scale that are likely to be significant for China.
4. Discussion
The world is undergoing a low-carbon transition. Countries have committed to the terms of the Paris Agreement, which has sent signals to the markets to transition to low-carbon products. The effects of pollution and the threats of climate change have galvanized consumers to increasingly demand climate-friendly alternatives such as electric vehicles, efficient lighting and cleaner forms of energy. Foreseeing this change, Asian countries have played a critical role in the low-carbon economy. Many have tried to strategically place themselves as leaders by being early adopters of a low-carbon growth strategy. For Asia, climate policy has also been industrial policy, as evidenced by China’s five-year plans which identify specific low-carbon sectors for increased investment (Stern 2010).
This paper explores the extent to which Asia has built its low-carbon competitiveness. It shows that Asia is a specialist innovator and exporter in climate change mitigation technologies. Its top low-carbon economies are Japan and South Korea, which are also all individually specialist innovators and exporters in low-carbon goods. Another strong economy is China, which has incredible scale in the CCMT sector and a strong export specialization. Asia’s most competitive climate change mitigation technologies are efficient lighting, energy storage and PV. The implications of these results are that Asia is well placed to capture value from the design and export of low-carbon goods.
However, there are stark regional disparities within Asia. Once South Korea and Japan are removed from the sample, ‘Developing Asia’ is no longer a specialist innovator or exporter in climate change mitigation technologies. Developing Asia’s level of export and patenting activity in low-carbon technologies is roughly equal to the world average, which puts it neither in a position of weakness nor strength according to our framework. However, it can easily use this neutral position to build specializations by implementing policies to further incentivize a switch to low-carbon technologies.
It is important to think about what Developing Asia can do to build its low carbon competitiveness. Research has shown that carbon pricing can provide strong incentives to build low-carbon competitiveness. Calel and Dechezlepetre (2016) find that the European emissions trading scheme resulted in a 10% increase in low-carbon patenting activity among regulated firms without crowding out other types of patenting. Similarly, Popp (2002) and Aghion et al. (2016) find that environmental taxes encourage the development of clean technologies. The effect of this can be significant as one estimate shows that a 10% increase in fuel price is associated with a 10% rise in clean patents (Aghion et al. 2016). Several Asian countries, such as China, South Korea and Japan, have recently introduced some form of carbon pricing which could help in increasing low-carbon competitiveness (World Bank; Vivid Economics; and Ecofys 2017).
Another way to build domestic low-carbon competitiveness is through technology transfer and learning. Dechezlepretre et al. (2015) show that countries who adopt a regulatory regime which supports low-carbon sectors attract patent filings from other countries with low-carbon regulatory regimes. The contrary is also true: countries that have a regulatory set-up that favors emissions-intensive sectors attract patent filings from other countries that favor such sectors. Herein lies another opportunity: Developing Asian countries can align their regulatory regimes with those of Europe, South Korea and other low-carbon leaders to attract investments and technology transfers from these regions. Successful instances of this include China, whose efforts to move towards a low-carbon regulatory regime have spurred clean technology inflows (Dechezlepetre et al. 2011).
Finally, literature suggests that regions benefit from getting a head start due to strong path dependencies (Aghion et al. 2016). A region’s propensity to innovate in clean technologies in the future is a function of its existing exposure to clean technologies. Therefore, it is beneficial to start early. It is important to note that while this is what global literature says, Asia-specific analysis is needed to determine the most effective policy measures to enhance low-carbon competitiveness for Asian countries.
At this stage, it is also important to emphasize the limitations of the analysis. While Developing Asian countries are not specialist innovators or exporters of the CCMTs covered in this analysis, they may excel in other low-carbon competitiveness metrics. For example, India performs well at process-innovation which is not captured by patent data and China has large domestic scale and the ability to quickly adopt new technologies, which can increase its level of competitiveness in the global low-carbon economy. Our analysis focuses on frontier innovation and export specialization, which are just two dimensions of low-carbon competitiveness. Nevertheless, they are important dimensions in light of the value that accrues from IP rights and export activity. They also meet the conditions of competitiveness metrics by being based on internationally comparable data and covering sectors that are traded/tradeable (Durand and Giorno 1987).
More research is needed to deepen our understanding and corroborate the initial findings of this paper. Future research can focus on developing a method that not only captures frontier innovation through patent data, as done in this paper, but also process-related innovation. Researchers can also focus on other indicators of low-carbon competitiveness such as investment and the rate of adoption of new technologies. Another avenue for future work is to explore in-depth the implications of this study’s high-level results by studying the role of policy in deepening a region’s export or innovation specialization.
Acknowledgment
The authors would like to acknowledge the support of the Oxford Martin School Programme on the Post Carbon Transition.
Author Contributions
Sugandha Srivastav did the analysis and wrote the paper. The methodological concept was developed by Sam Fankhauser. Alex Kazaglis assisted with edits.
Conflicts of Interest
The authors declare no conflict of interest.
Appendix A
In the PATSTAT 2015b database, the code Y02 corresponds to technologies or applications for the mitigation of climate change. Within the Y02 grouping, there are four sub-groupings: Y02B, Y02C, Y02E and Y02T which relate to buildings, carbon capture & storage, energy and transportation respectively. The PATSTAT database also has a code for patents related to smart grids, Y04S. In the analysis of low-carbon competitiveness, this study considers all patents under the Y02 and Y04S categories. Further details on what is included can be found in Table A1.

Table A1.
PATSTAT’s classification of low-carbon technologies.
| Group | Description | Comment | Sub-Groups |
|---|---|---|---|
| Y02B | Climate change mitigation technologies related to buildings, including housing and appliances or related end-user applications | Integration of renewables in buildings, lighting, HVAC (heating, ventilation and air conditioning), home appliances, elevators and escalators, constructional or architectural elements, Information and Commuication Technologies , power management | Y02B10—renewables integration Y02B20—lighting Y02B30—heating/AC Y02B40—appliances Y02B50—elevators/escalators Y02B60—own energy Y02B70—end-user Y02B80—insulation Y02B90—other buildings |
| Y02C | Capture, storage, sequestration or disposal of greenhouse gases | Carbon dioxide capture and storage, also of other relevant greenhouse gases | - |
| Y02E | Climate change mitigation technologies in energy generation, transmission and distribution | Renewable energy, efficient combustion, nuclear energy, biofuels, efficient transmission and distribution, energy storage, hydrogen technology | Y02E10—renewables Y02E101—geothermal Y02E102—hydro Y02E103—sea Y02E104—thermal Y02E105—PV Y02E106—thermal-PV Y02E107—wind Y02E20—clean coal Y02E30—nuclear Y02E40—transmission Y02E50—biofuel Y02E60_70—storage |
| Y02T | Climate change mitigation technologies related to transportation | E-mobility, hybrid cards, efficient internal combustion engines, efficient technologies in railways and air/waterways transport | Y02T10—road transport Y02T30—rail transport Y02T50—air transport Y02T70—maritime transport Y02T90—other transport |
| Y04S | Smart grid technologies | Power networks operation, end-user applications management, smart metering, electric and hybrid vehicles interoperability, trading and marketing aspects | - |
Table A2.
LCEGS sectors.
| Category | Sectors |
|---|---|
| Low-carbon | Additional Energy Sources |
| Alternative Fuel Vehicle | |
| Alternative Fuels | |
| Nuclear Power | |
| Building Technologies | |
| Carbon Capture & Storage | |
| Carbon Finance | |
| Energy Management | |
| Renewable energy | Biomass |
| Geothermal | |
| Hydro | |
| Photovoltaic | |
| Renewable Consulting | |
| Wave & Tidal | |
| Wind | |
| Environmental | Air Pollution |
| Contaminated Land Reclamation & Remediation | |
| Environmental Consultancy and Related Services | |
| Environmental Monitoring, Instrumentation and Analysis | |
| Marine Pollution Control | |
| Noise & Vibration Control | |
| Recovery and Recycling | |
| Waste Management | |
| Water Supply and Waste Water Treatment |
Figure A1.
Asia’s growing share of global CCMT exports and patents.
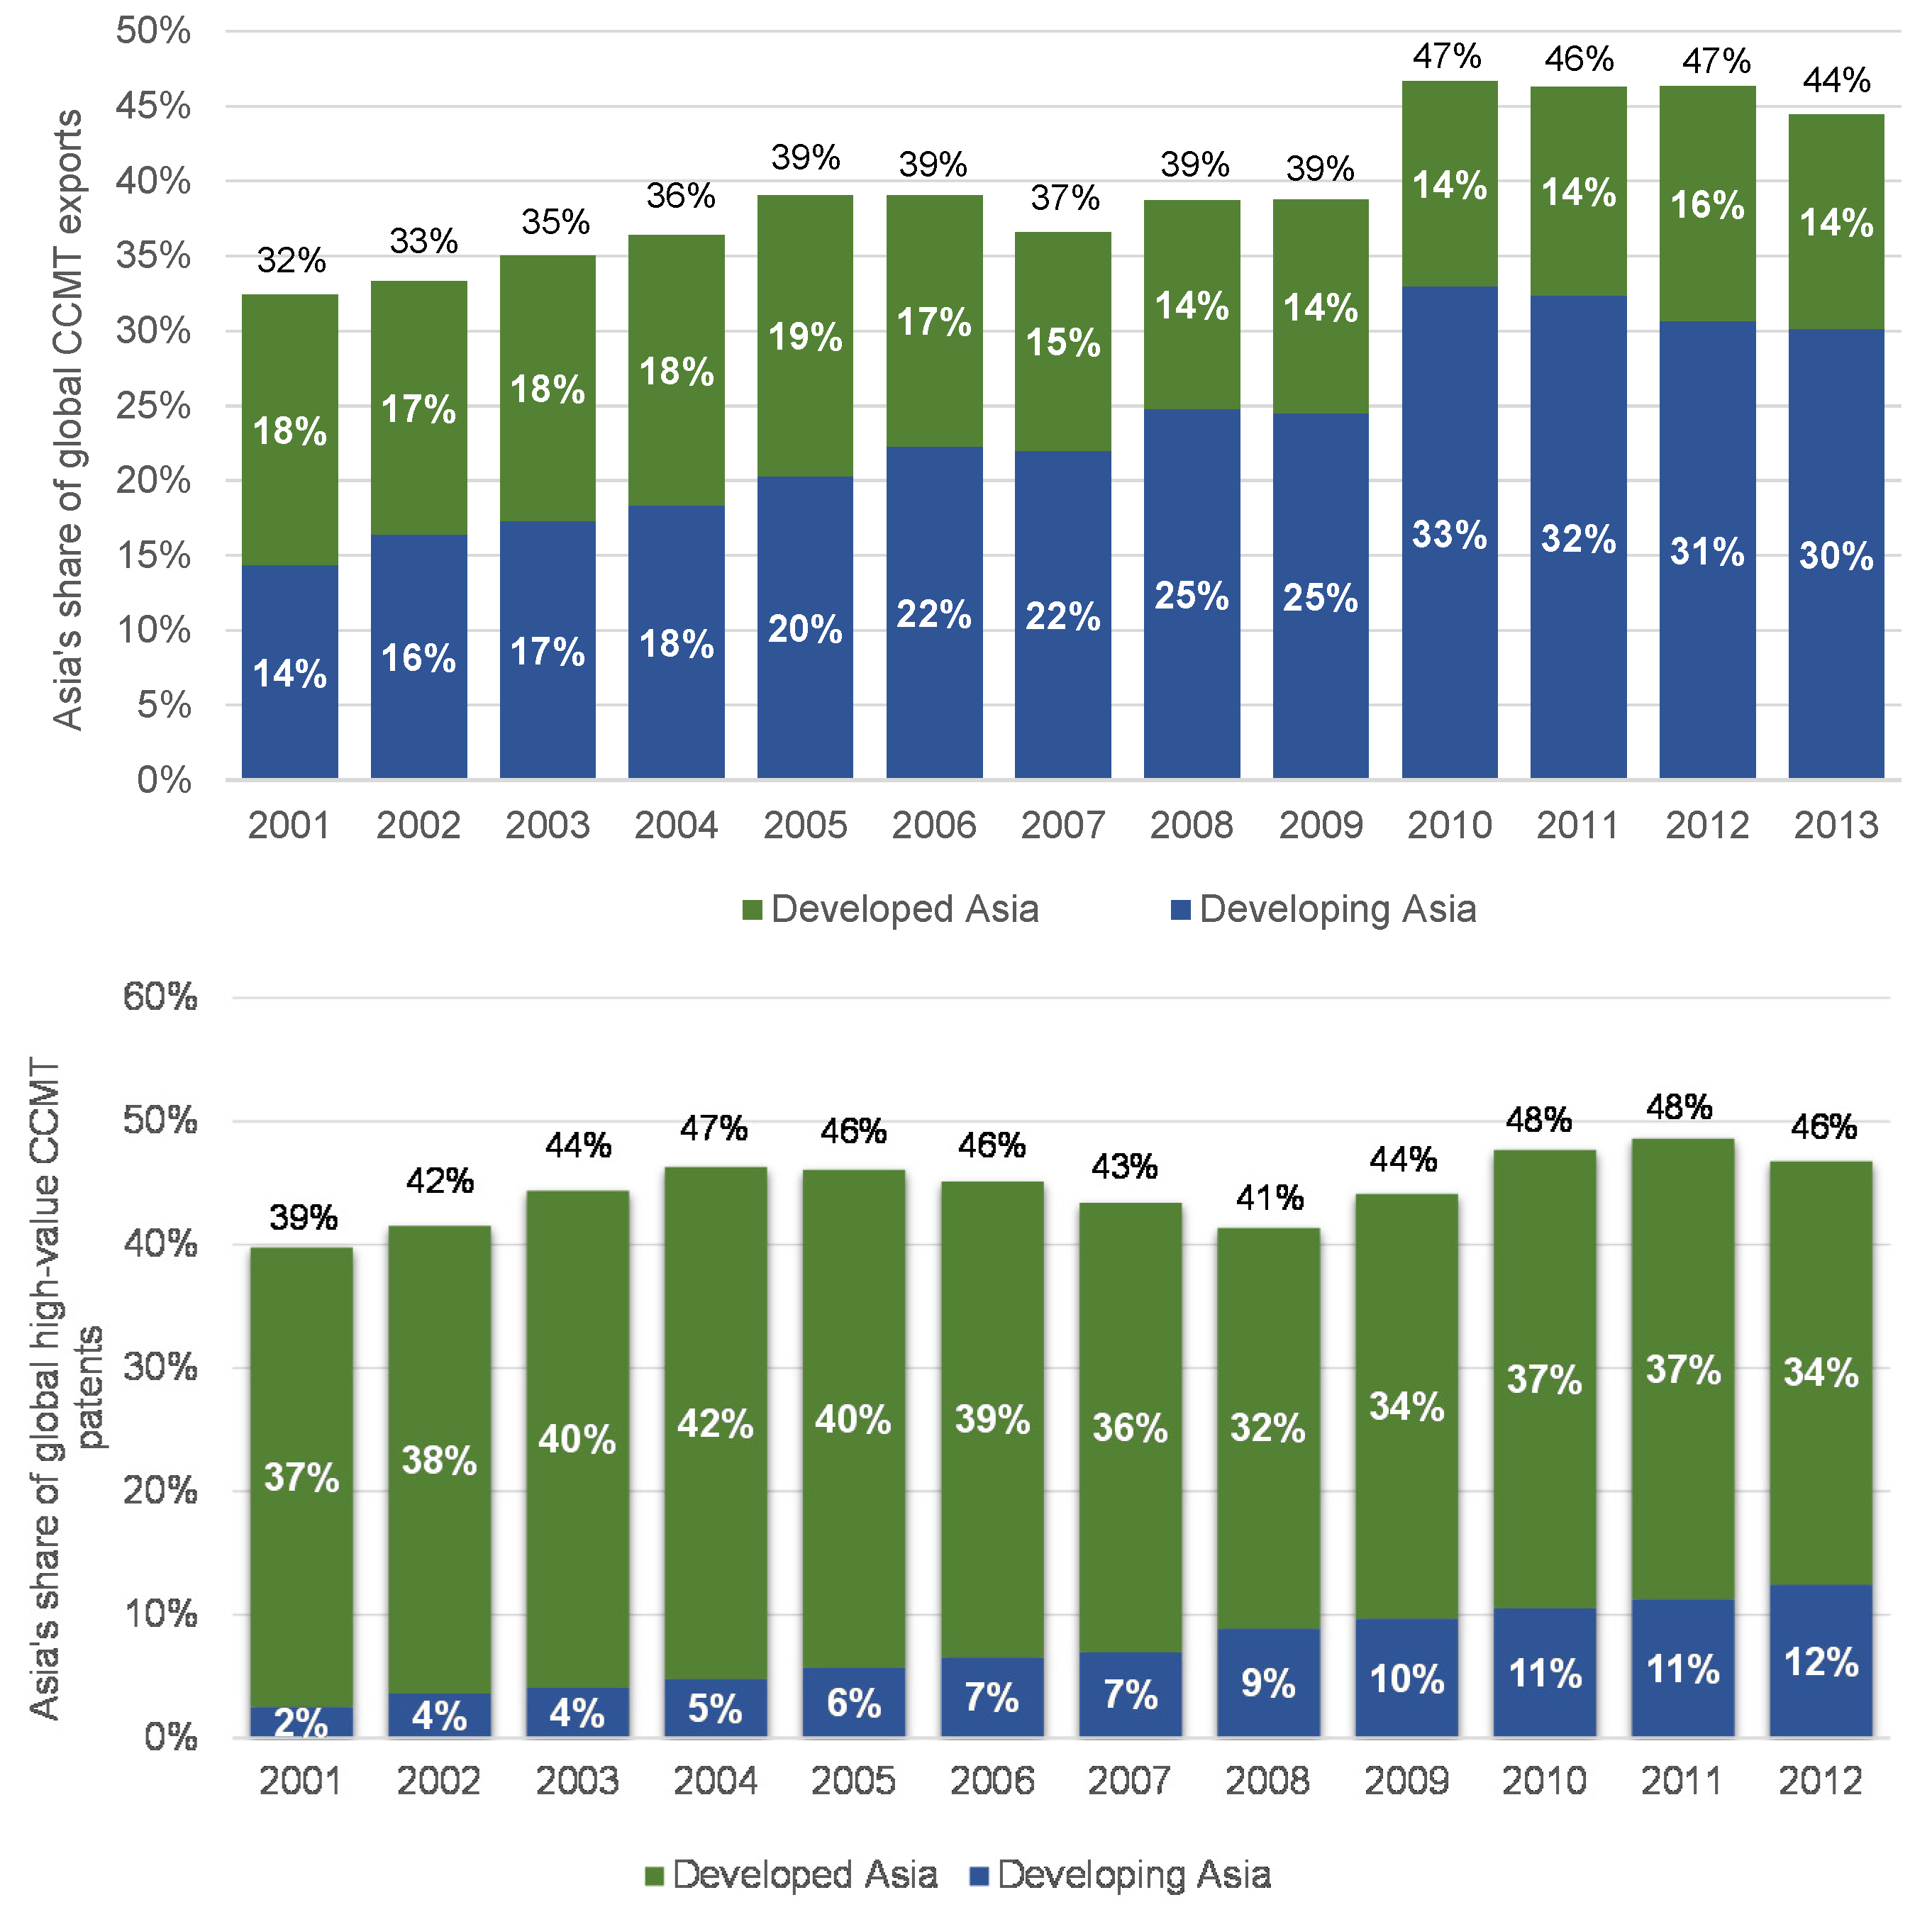
Figure A2.
Asia’s patenting activity across CCMTs.
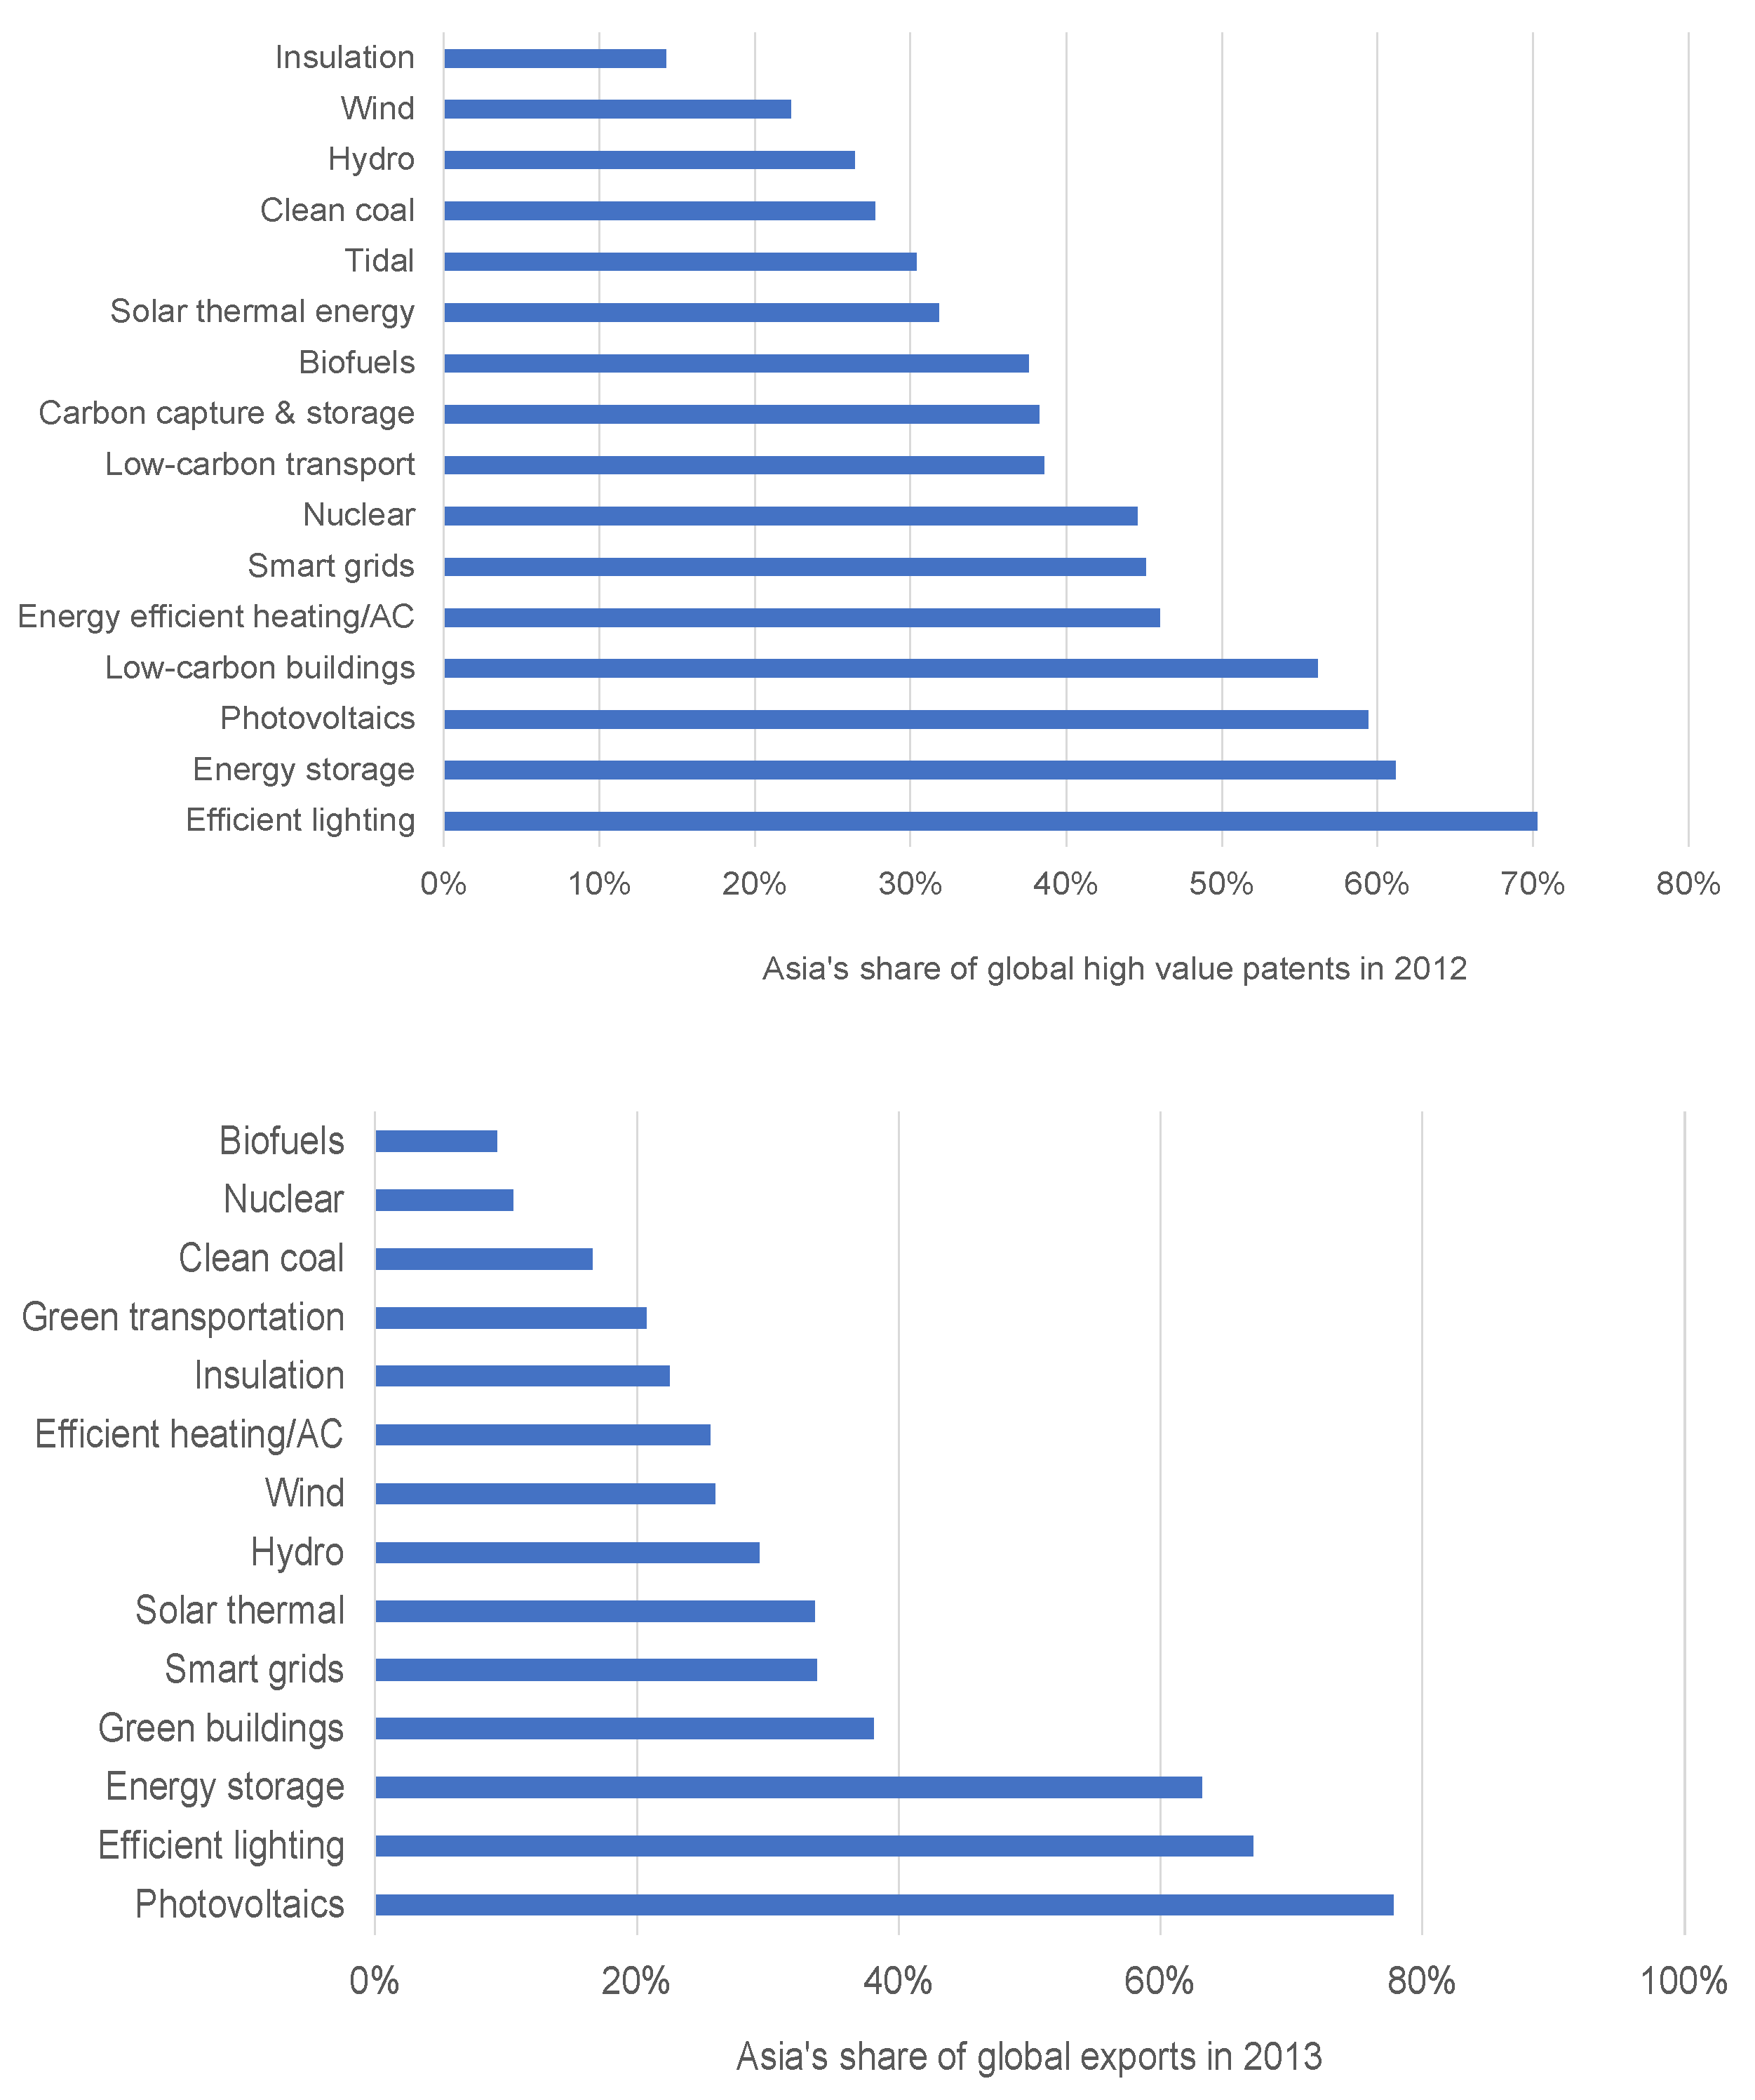
Figure A3.
East Asia’s CCMT patenting activity.
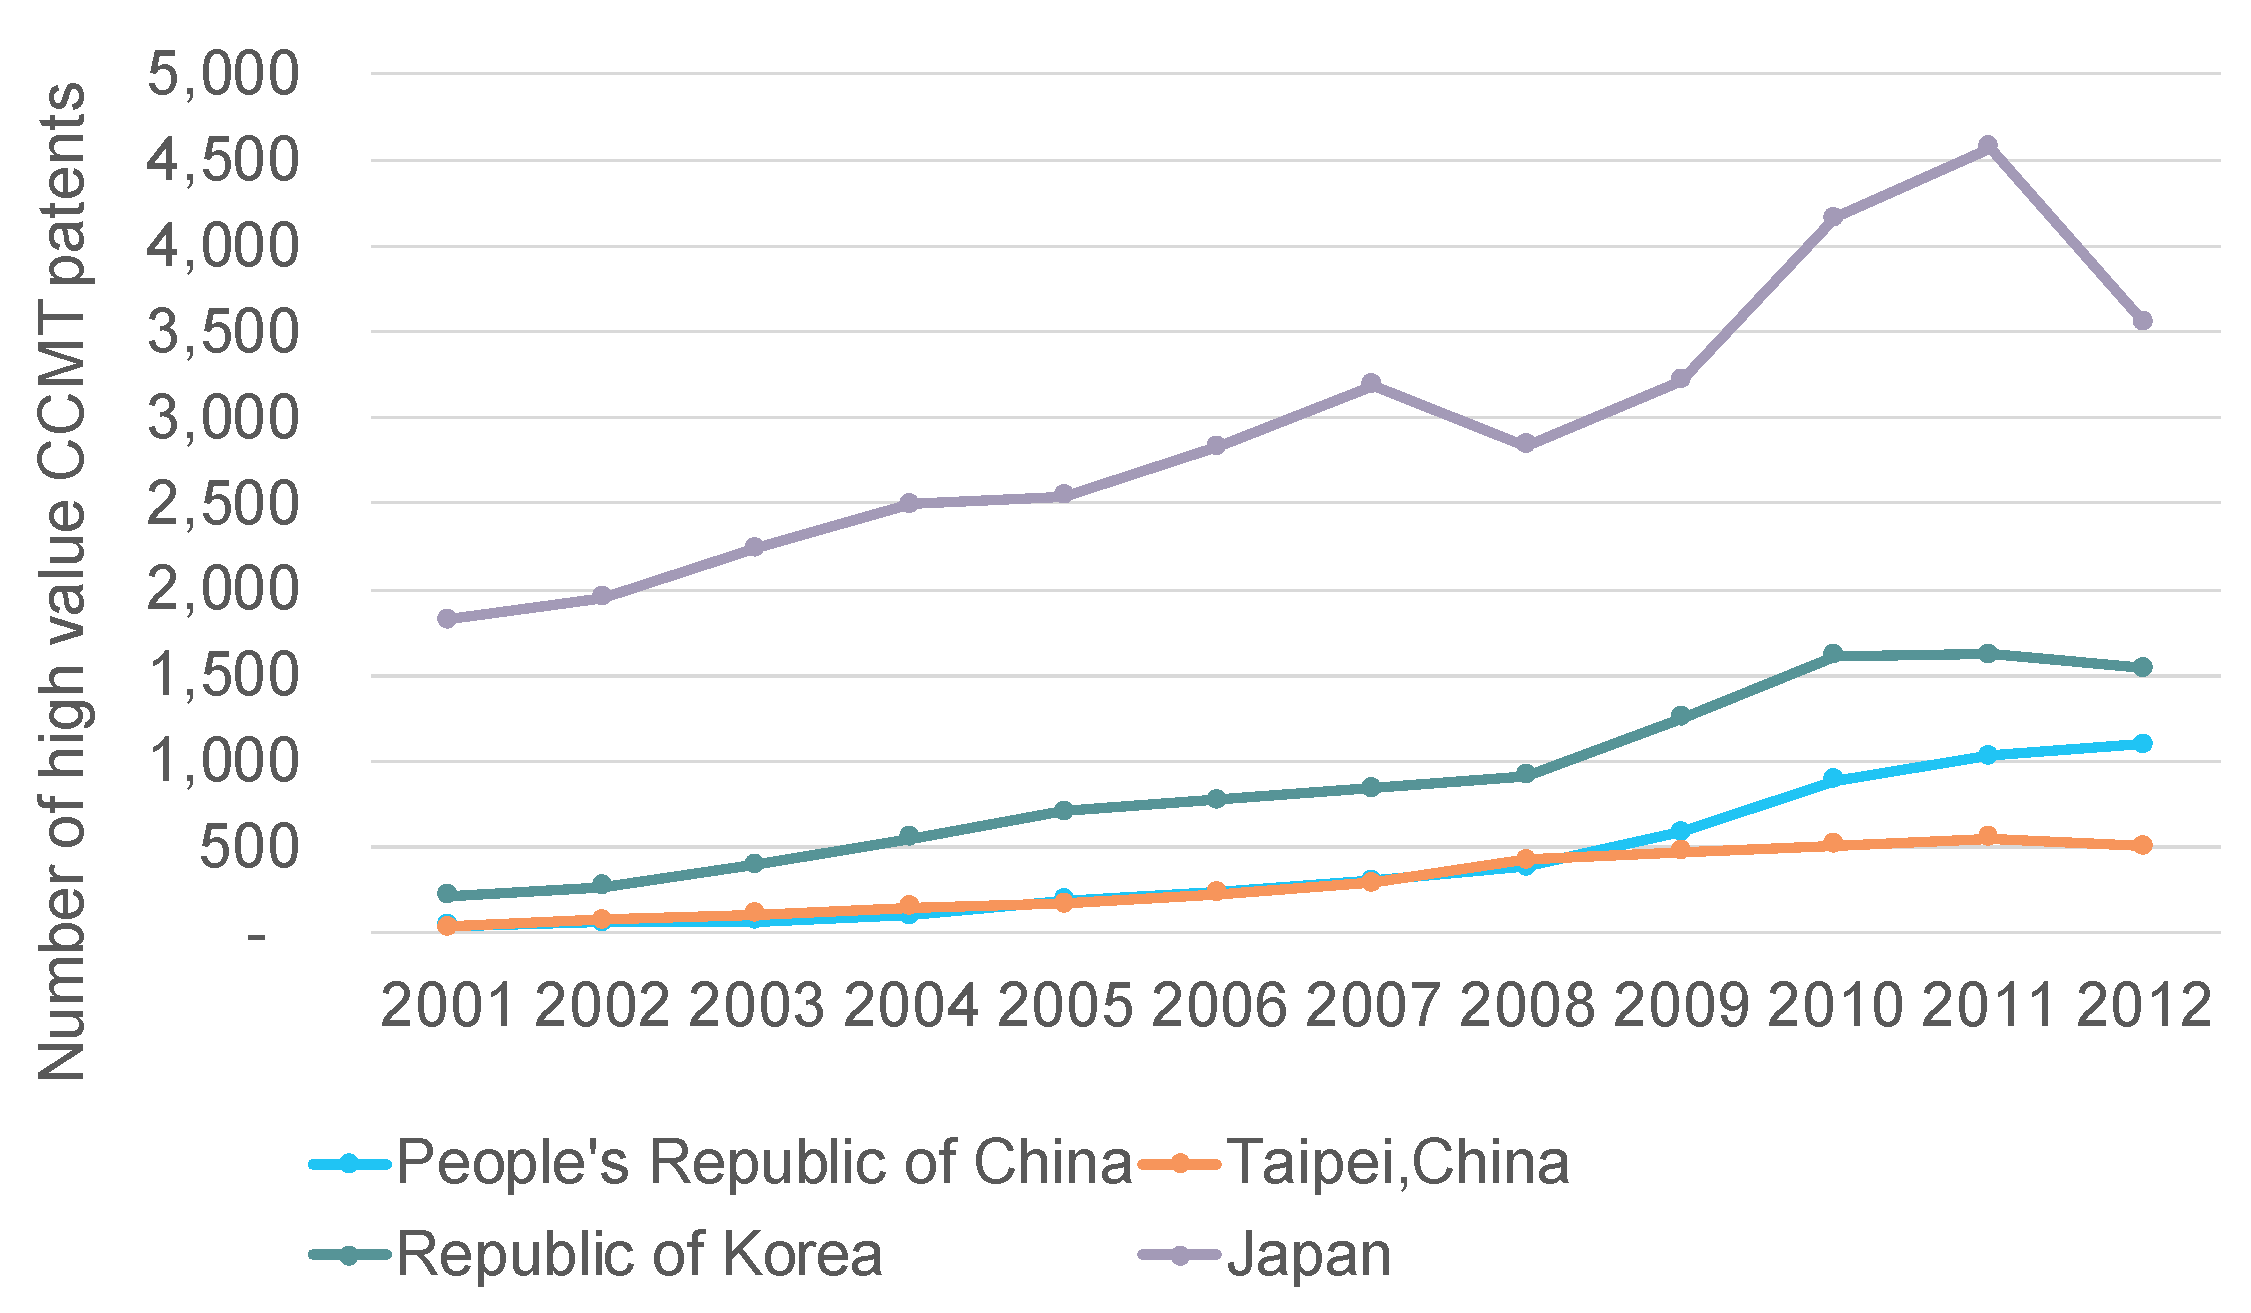
Figure A4.
South Korea’s innovation in PV and energy storage.
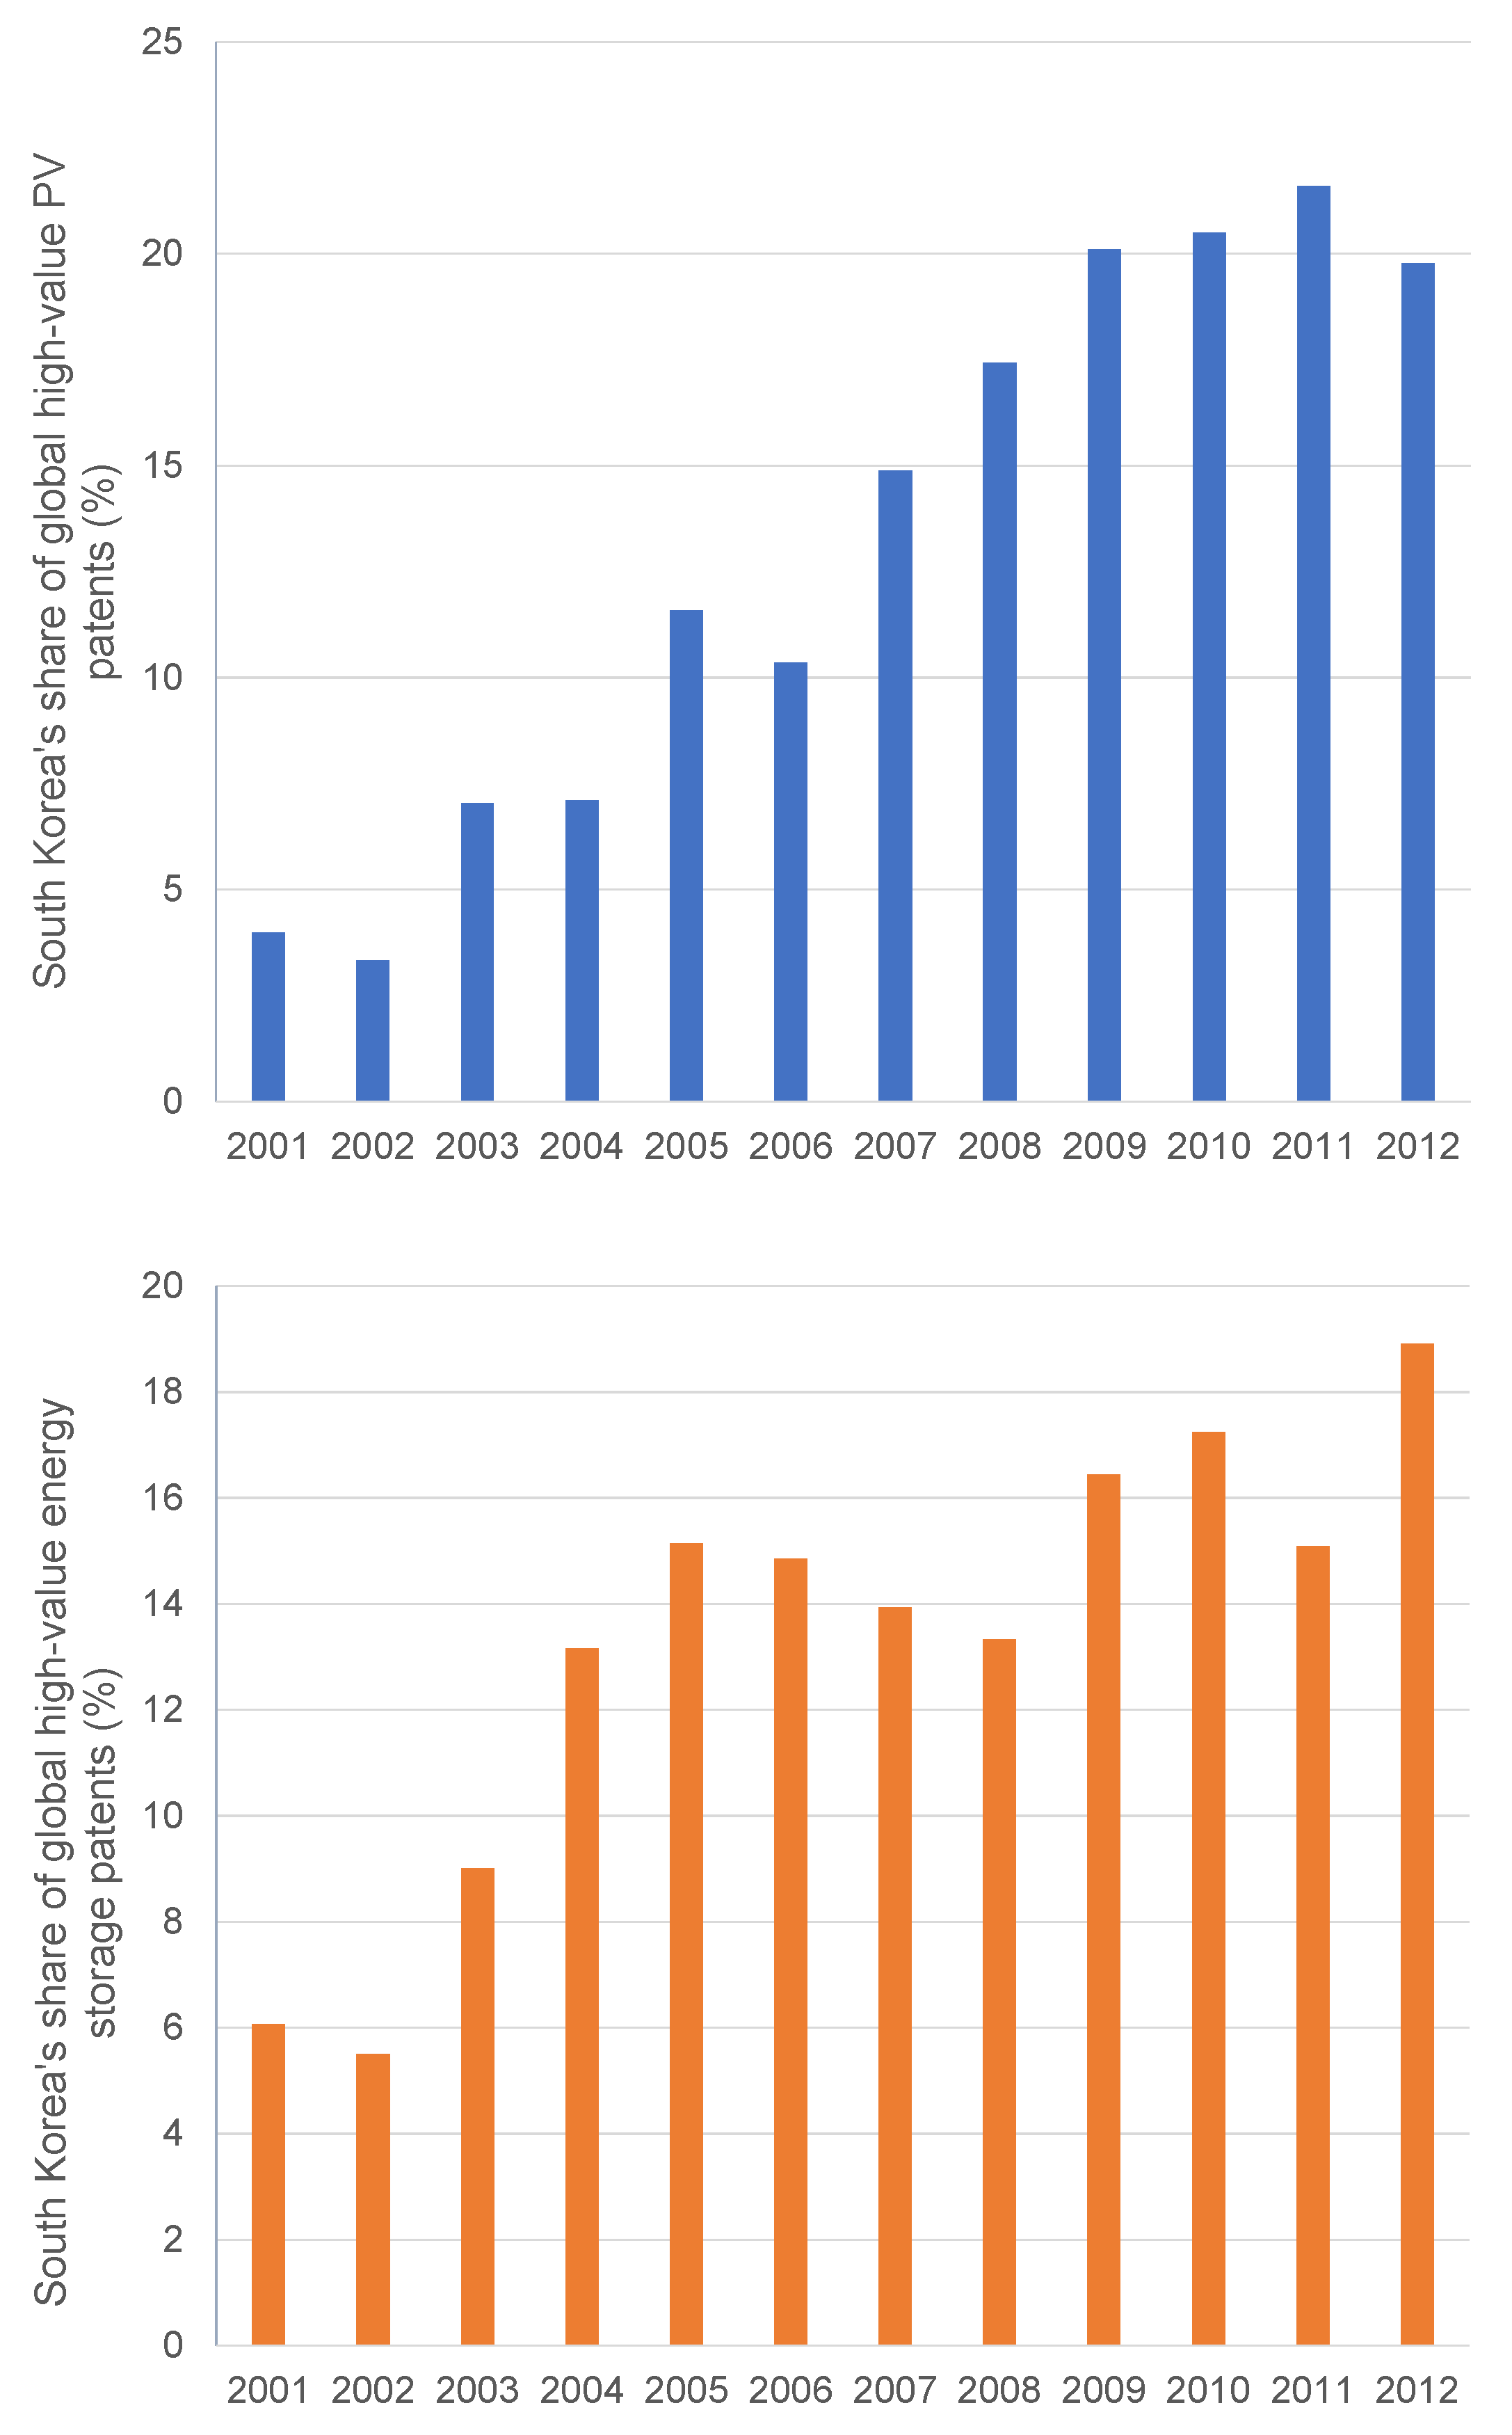
Figure A5.
A break-down of Japanese CCMT patents by type in 2012.
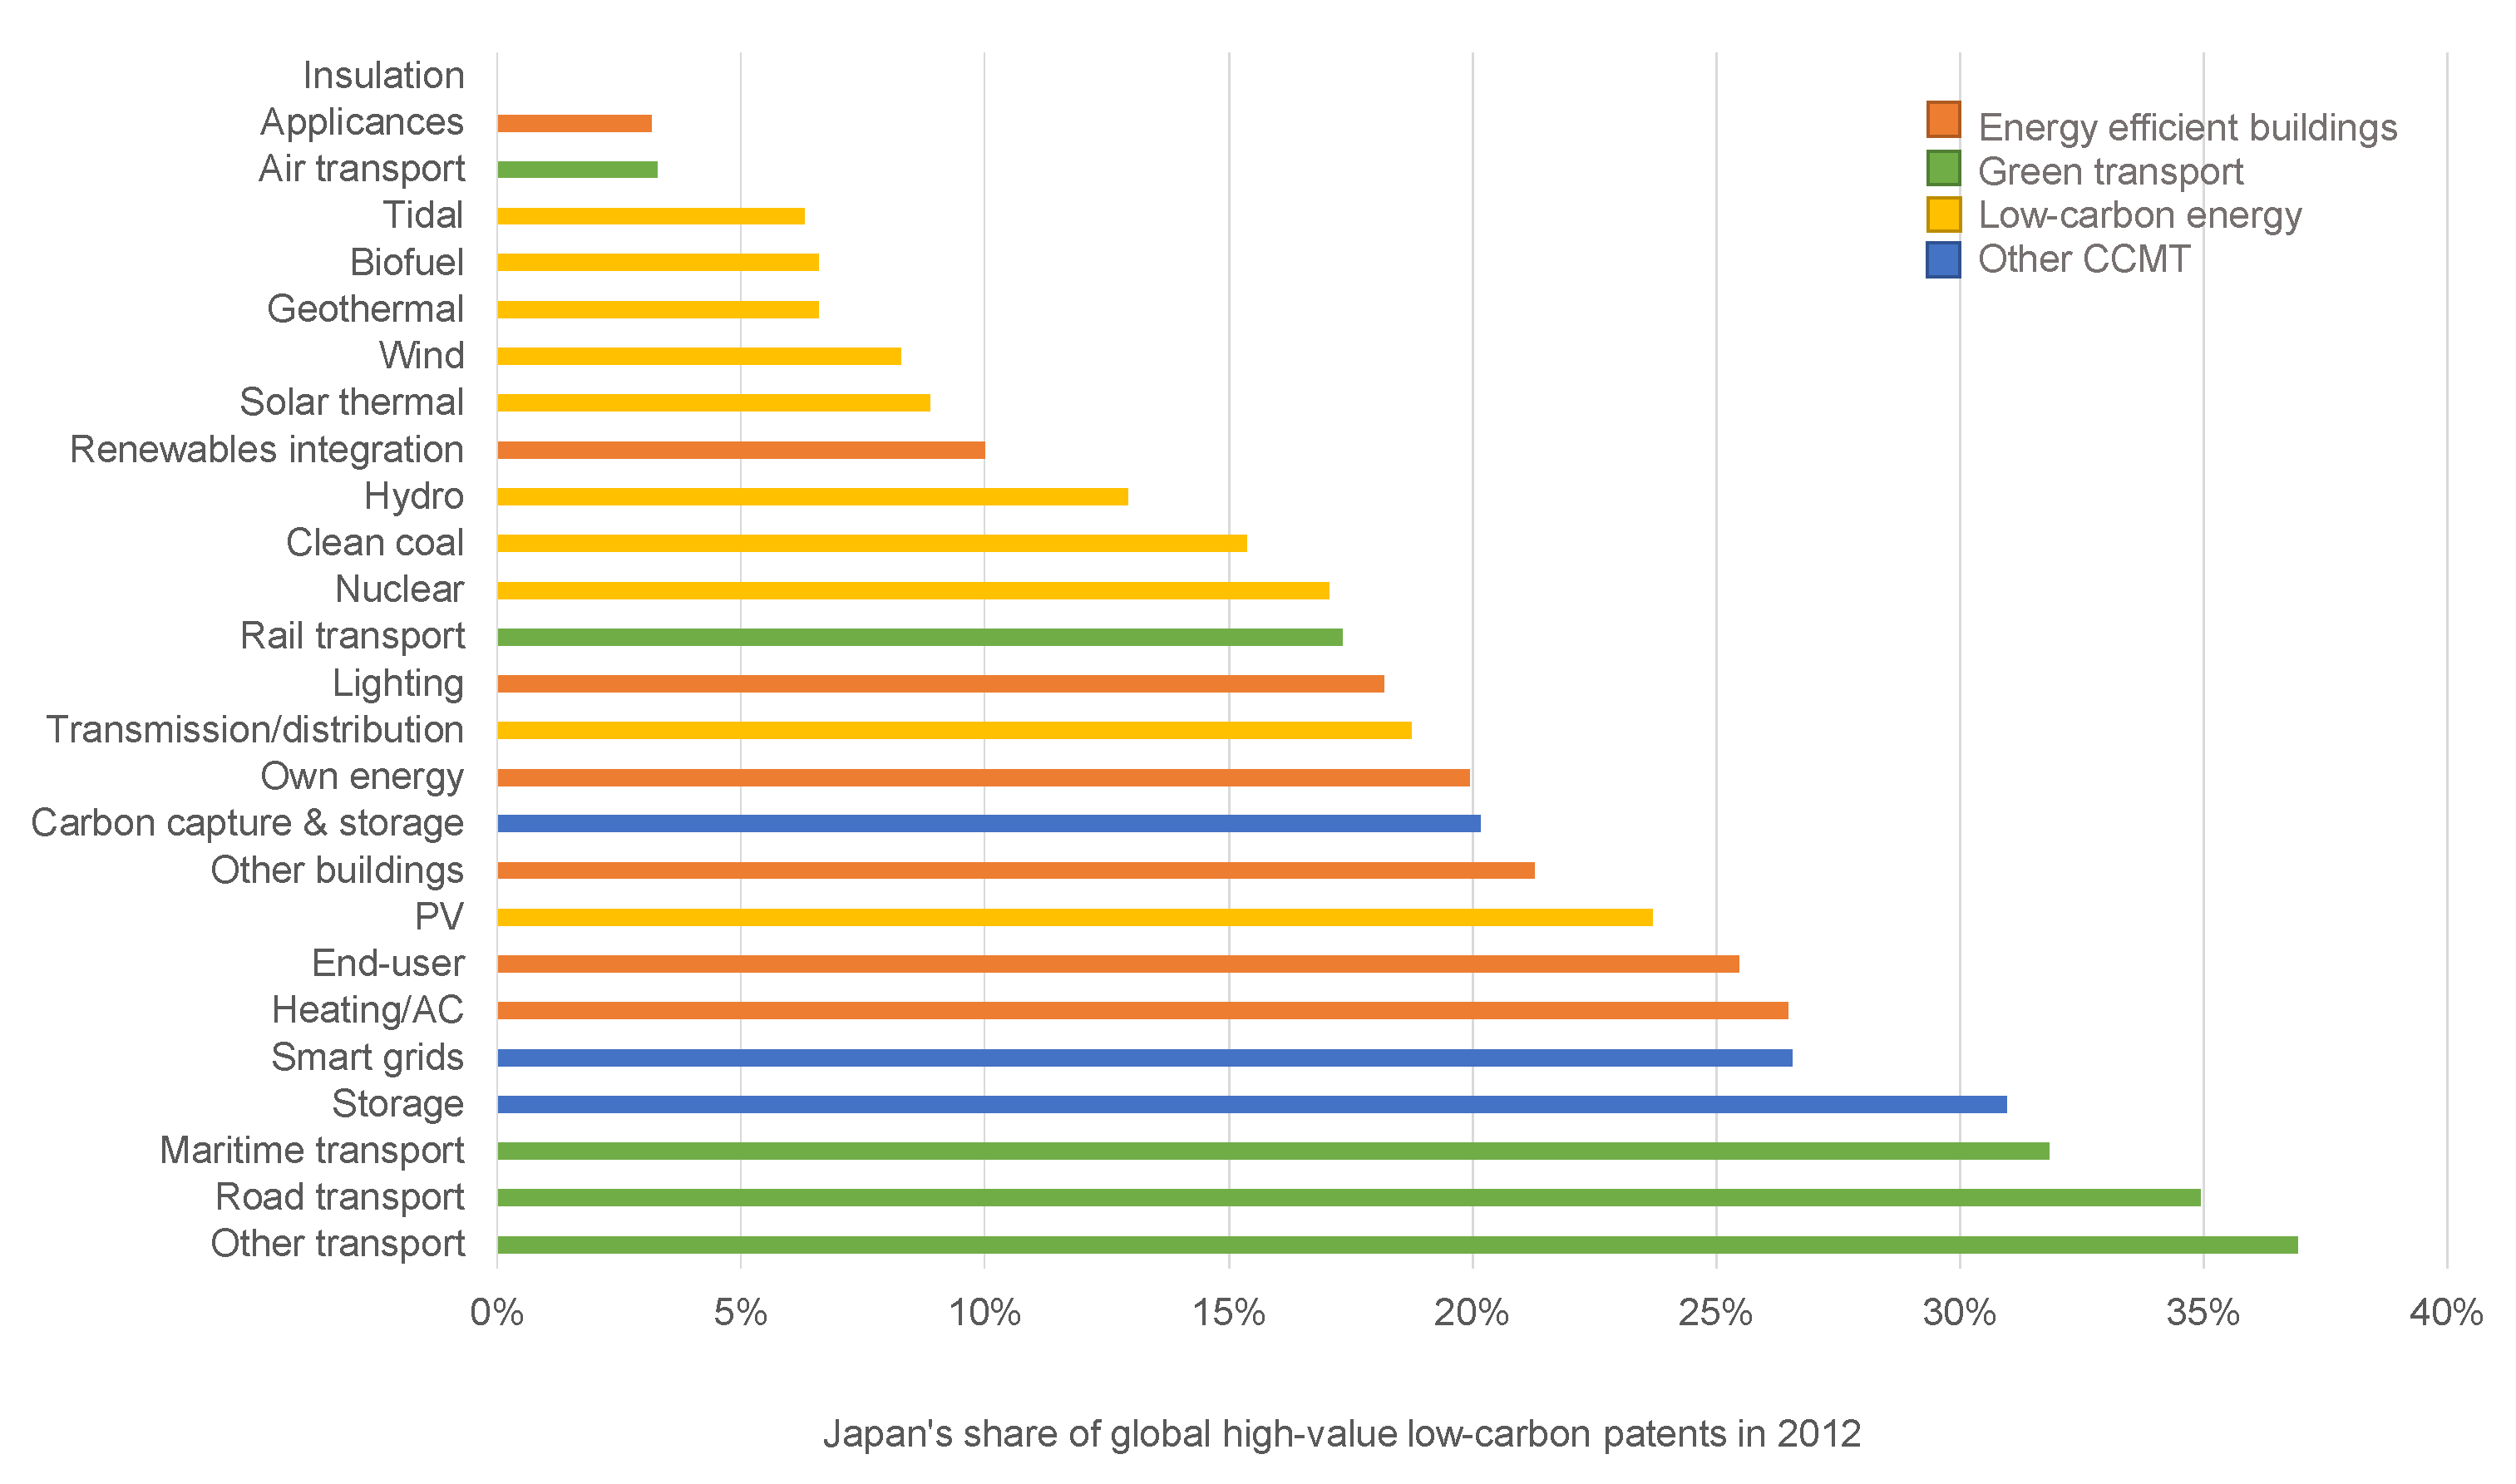
Figure A6.
China’s surge in innovation for low-carbon buildings.
References
- ADB. 2015. Managing the Transition to a Low-Carbon Economy: Perspectives, Policies and Practices from Asia. Tokyo: ADB. [Google Scholar]
- Aghion, Philippe, Antoine Dechezlepretre, David Hemous, Ralf Martin, and John Van Reenan. 2016. Carbon Taxes, Path Dependency, and Directed Technical Change: Evidence from the Auto Industry. Journal of Political Economy 1: 1–51. [Google Scholar]
- Albert, Eleanor, and Beina Xu. 2016. China’s Environmental Crisis. Council on Foreign Relations. Available online: http://www.cfr.org/china/chinas-environmental-crisis/p12608 (accessed on 1 September 2017).
- Balassa, Bela. 1965. Trade liberalisation and revealed comparative advantage. The Manchester School of Economics and Social Studies 33: 99–123. [Google Scholar]
- Calel, Raphael, and Antoine Dechezlepretre. 2016. Environmental Policy and Directed Technological Change: Evidence from the European carbon market. Review of Economics and Statistics 98: 173–91. [Google Scholar]
- Capozza, Ivana. 2011. Greening Growth in Japan. OECD Environment Working Papers. Paris: OECD. [Google Scholar]
- Dechezlepretre, Antoine, and Ralf Martin. 2010. Low Carbon Innovation in the UK: Evidence from Patent Data. Centre for Climate Change Economics and Policy Grantham Research Institute on Climate Change and Environment Policy Paper. London: The Grantham Research Institute on Climate Change and the Environment. [Google Scholar]
- Dechezlepretre, Antoine, Eric Neumayer, and Richard Perkins. 2015. Environmental regulation and the cross-border diffusion of new technology: Evidence from automobile patents. Research Policy 44: 244–57. [Google Scholar]
- Dechezlepretre, Antoine, Matthieu Glachant, Ivan Hascic, Nick Johnstone, and Yann Ménière. 2011. Invention and Transfer of Climate Change Mitigation Technologies: A Global Analysis. Review of Environmental Economics and Policy 5: 109–30. [Google Scholar]
- Dur, Mattine, and Claude Giorno. 1987. Indicators of international competitiveness: conceptual aspects and evaluation. OECD Economics Studies 9: 147–82. [Google Scholar]
- Fankhauser, Sam, Alex Bowen, Raphael Calel, Antoine Dechezlepretre, David Grover, James Rydge, and Misato Sato. 2013. Who will win the green race? In search of environmental competitiveness and innovation. Global Environmental Change 23: 902–13. [Google Scholar]
- Glachant, Matthieu, Damien Dussaux, Yann Ménière, and Antoine Dechezlepretre. 2013. Promoting the International Transfer of Low-Carbon Technologies: Evidence and Policy Challenges. Available online: http://personal.lse.ac.uk/dechezle/Promoting_the_international_transfer_of_low_carbon_techs.pdf (accessed on 1 September 2017).
- Green Alliance. 2013. The Global Green Race: A Business Review of UK Competitiveness in Low Carbon Markets. Available online: https://www.green-alliance.org.uk/resources/The%20global%20green%20race.pdf (accessed on 1 September 2017).
- Hausmann, Ricardo, and César A. Hidalgo. 2010. The building blocks of eocnomic complexity. Proceedings of the National Academy of Sciences 106: 10570–75. [Google Scholar]
- Hidalgo, César A., Bailey Klinger, Albert-László Barabasi, and Ricardo Hausmann. 2007. The Product Space Conditions the Development of Nations. Science 317: 482–87. [Google Scholar]
- Ho, Mun S., and Zhongmin Wang. 2014. Green Growth for China: A Literature Review. Resources for the Future Discussion Paper No. 14–22. Washington, DC: Resources for the Future. [Google Scholar]
- New Climate Economy. 2014. Better Growth, Better Climate: The New Climate Economy Report. Available online: http://static.newclimateeconomy.report/wp-content/uploads/2014/08/NCE-SYNTHESIS-REPORT-web-share.pdf (accessed on 1 September 2017).
- Pothecary, Sam. 2016. South Korea to give incentives for energy storage as part of renewables spending spree. PV Magazine, September 20. [Google Scholar]
- Popp, David. 2002. Induced Innovation and Energy Prices. American Economic Review 92: 160–80. [Google Scholar]
- Statistics Korea. 2012. Korea’s Green Growth: Based on OECD Green Growth Indicators, 56. Available online: http://www.oecd.org/greengrowth/Korea’s GG report with OECD indicators.pdf (accessed on 1 September 2017).
- Stern, N. 2010. China’s Growth, China’s Cities and the New Global Low-Carbon Industrial Revolution. Policy Brief. London: Grantham Research Institute, London School of Economics, November. [Google Scholar]
- UK BIS. 2011. Low Carbon and Environmental Goods and Services Database; London: Department for Business, Innovation & Skills.
- World Bank, Vivid Economics, and Ecofys. 2017. State and Trends of Carbon Pricing 2017. Washington: World Bank. [Google Scholar]
- Yoshida, Fumikazu, and Akihisa Mori. 2015. Green Growth and Low Carbon Development in East Asia. Abingdon: Routledge. [Google Scholar]
| 1 | |
| 2 | |
| 3 | |
| 4 | The categorising of ‘threats’ and ‘opportunities’ rests on the implicit assumption that an ‘innovation specialisation’ is preferable over an ‘export specialisation’, if a country were to only have one. This assumption can be challenged but is based on the fact that the value that is accrued from IP often exceeds that which is accrued from exports. |
| 5 | Other Asian countries could not individually be represented on this chart because they undertake very low levels of high-value CCMT patenting activity for which we could not meaningfully calculate a green innovation score. |
Figure 1.
SWOT framework for assessing low-carbon competitiveness.

Figure 2.
Asia leads on low-carbon environmental goods and services sales. (a) LCEGS sales as a percent of GDP; (b) LCEGS sales in absolute terms.
Figure 2.
Asia leads on low-carbon environmental goods and services sales. (a) LCEGS sales as a percent of GDP; (b) LCEGS sales in absolute terms.

Figure 3.
The value of low-carbon environmental goods and services across Asian nations. (a) LCEGS sales in absolute terms; (b) LCEGS sales as a percent of GDP.
Figure 3.
The value of low-carbon environmental goods and services across Asian nations. (a) LCEGS sales in absolute terms; (b) LCEGS sales as a percent of GDP.
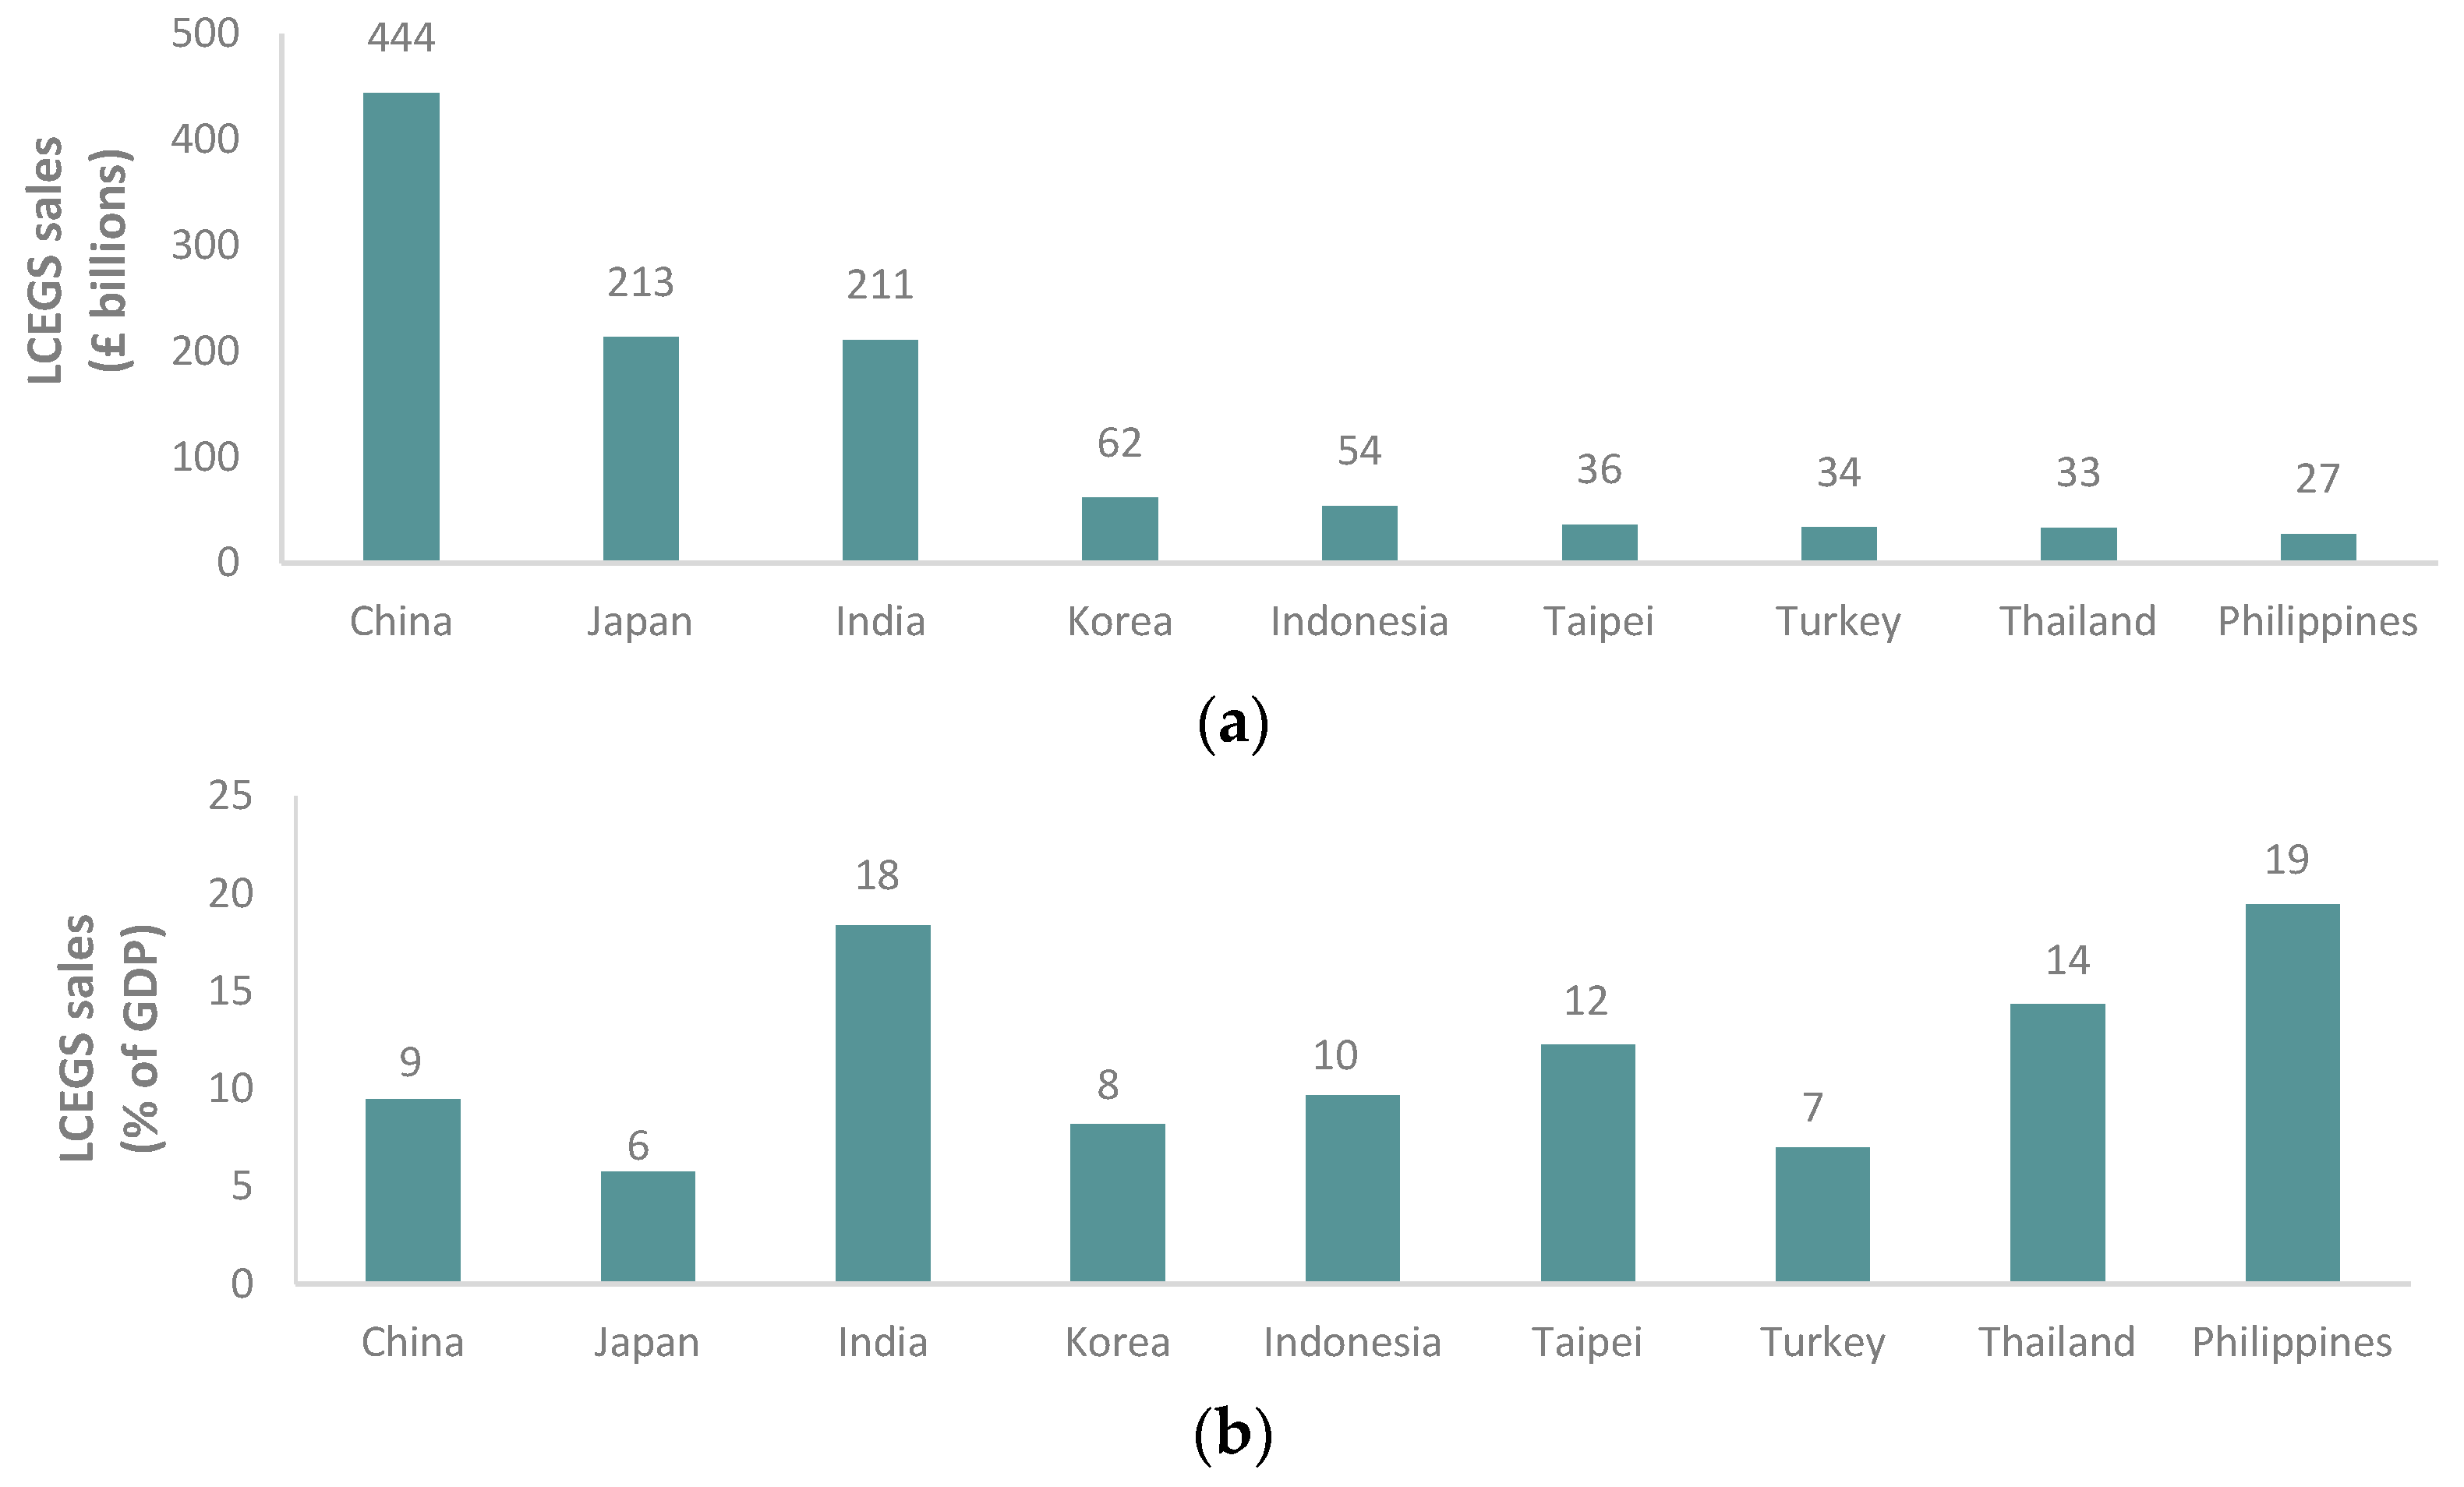
Figure 4.
Asia’s share of CCMT patents and exports in 2012. (a) Asia’s share of CCMT patents; (b) Asia’s share of CCMT exports.
Figure 4.
Asia’s share of CCMT patents and exports in 2012. (a) Asia’s share of CCMT patents; (b) Asia’s share of CCMT exports.

Figure 5.
Asian countries’ share of global CCMT exports and high-value patents in 2012. (a) Share of CCMT exports; (b) Share of CCMT patents.
Figure 5.
Asian countries’ share of global CCMT exports and high-value patents in 2012. (a) Share of CCMT exports; (b) Share of CCMT patents.

Figure 6.
Innovation specialization and revealed comparative advantage in CCMTs.

Figure 7.
Asia’s performance across CCMTs.
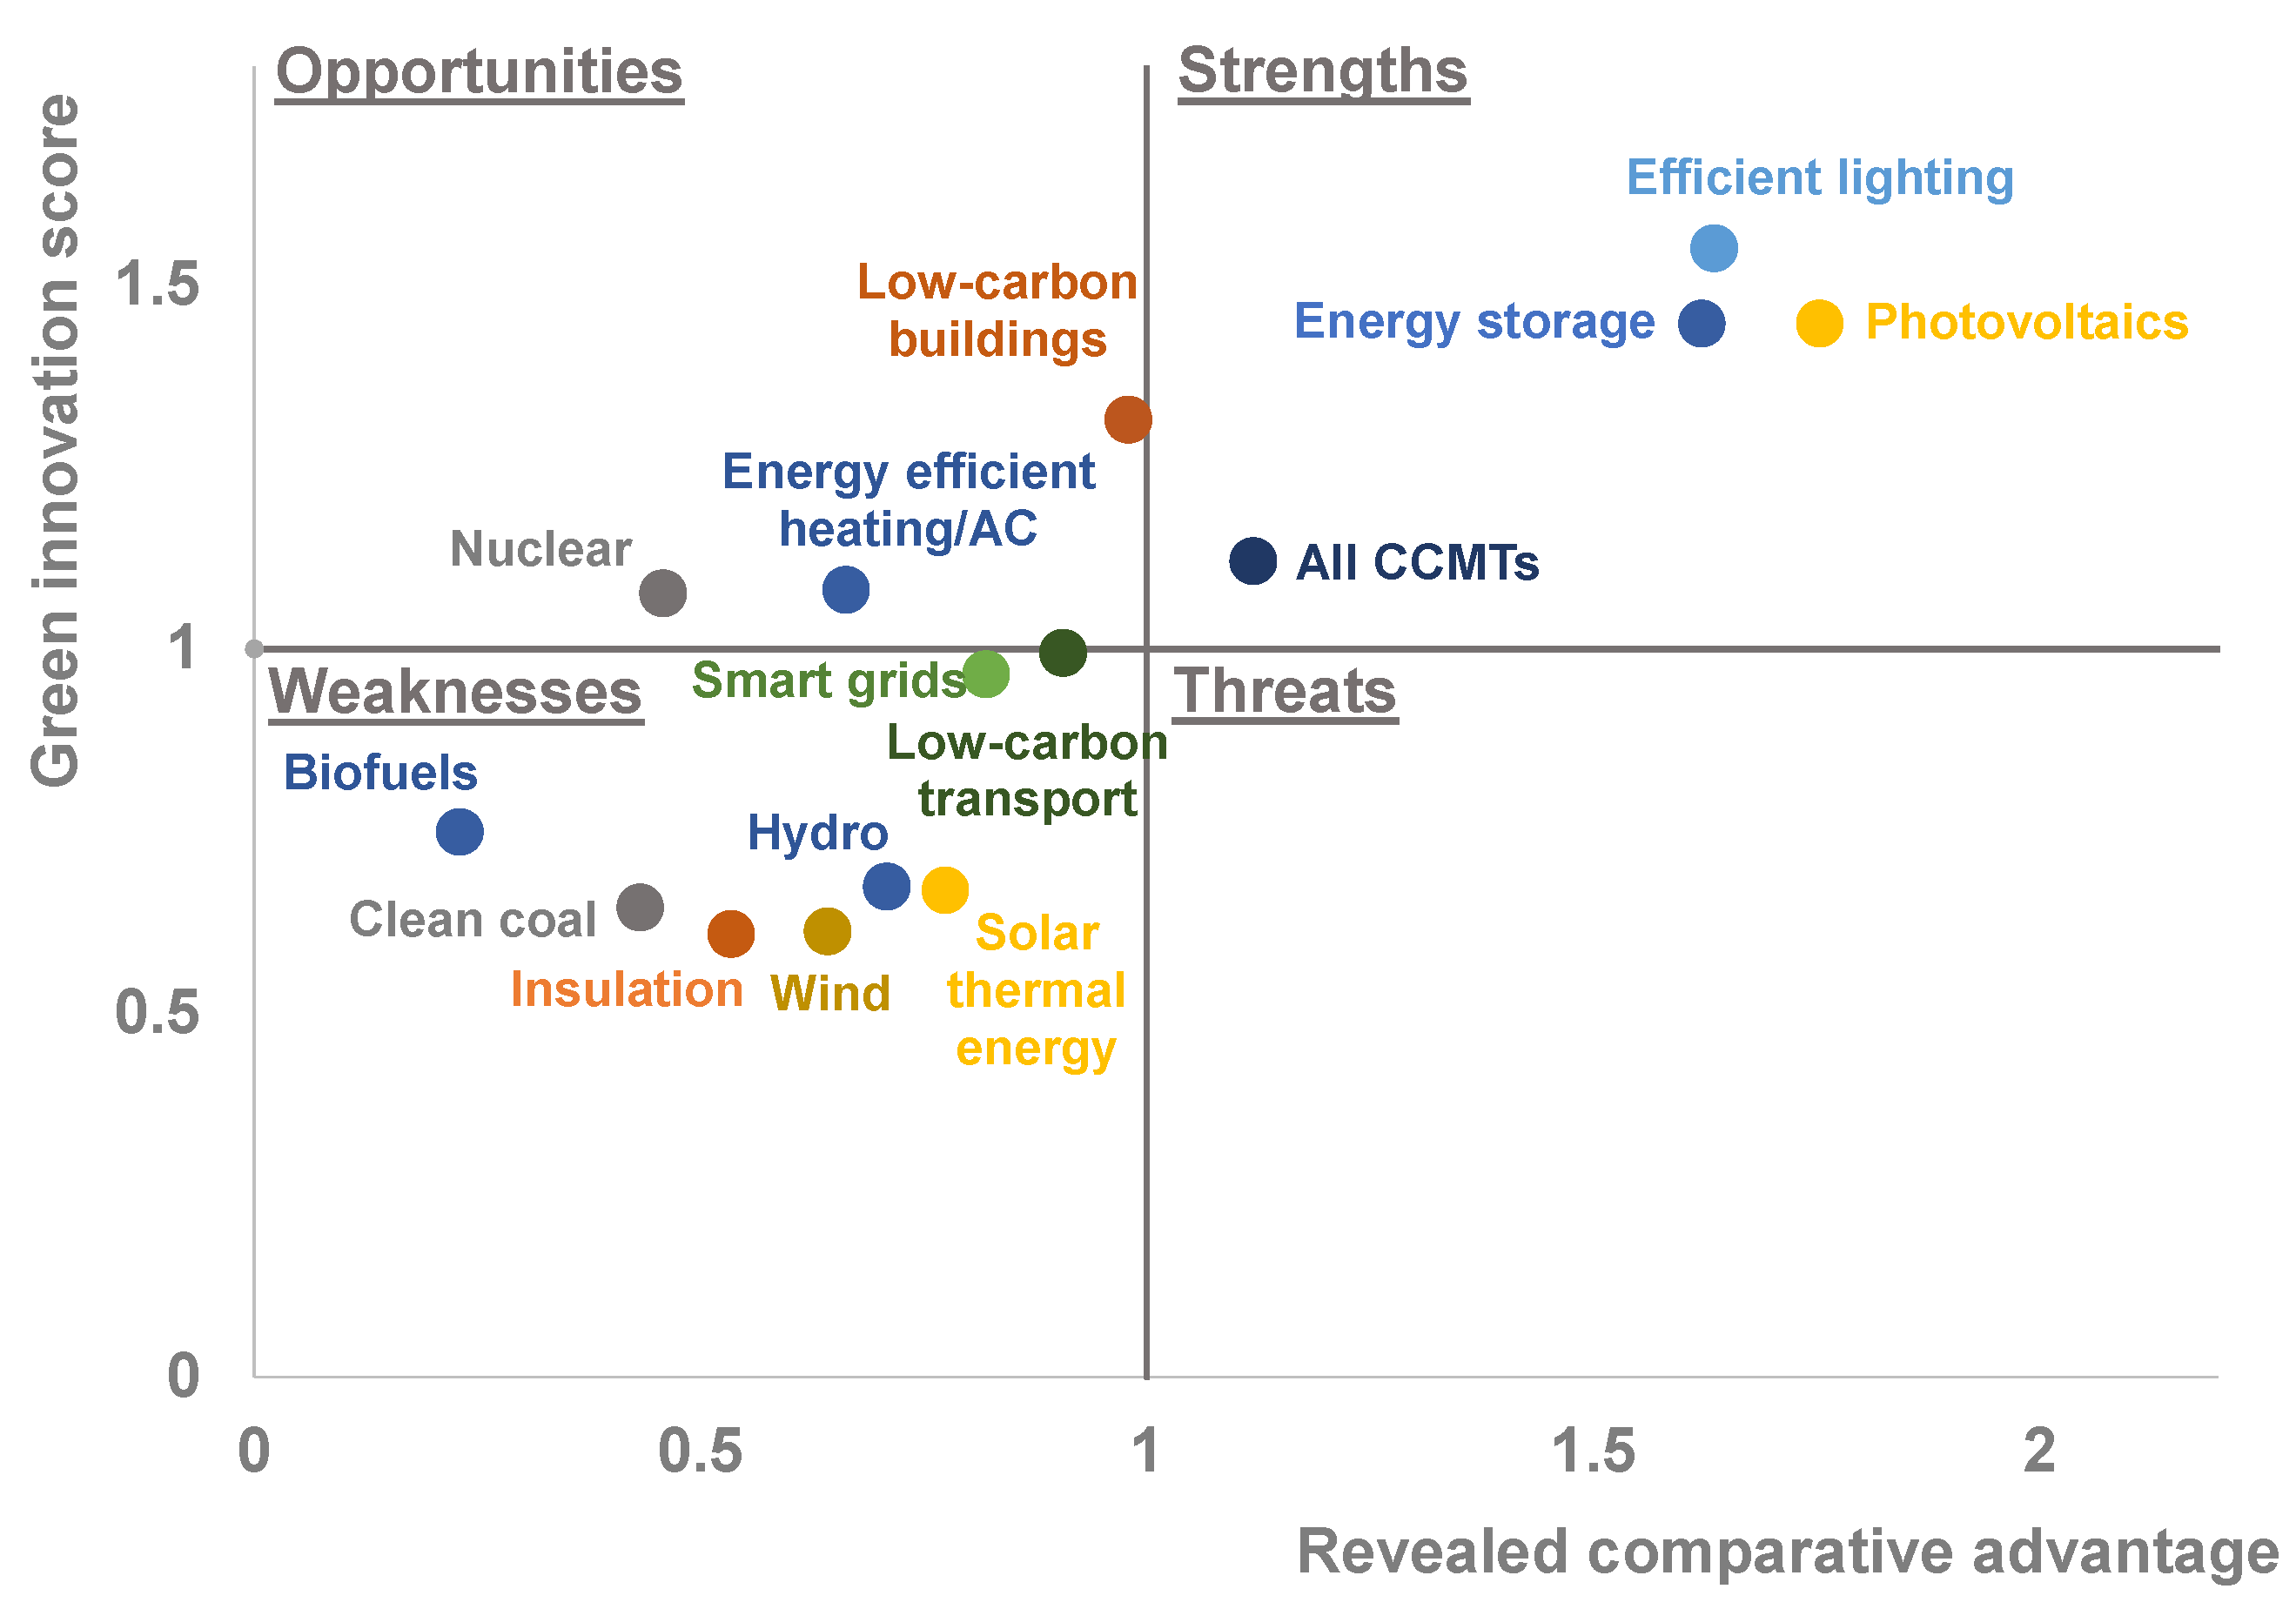
Figure 8.
Comparison of low-carbon patenting activity across regions in 2012.

Figure 9.
Comparison of low-carbon export activity across regions in 2013.
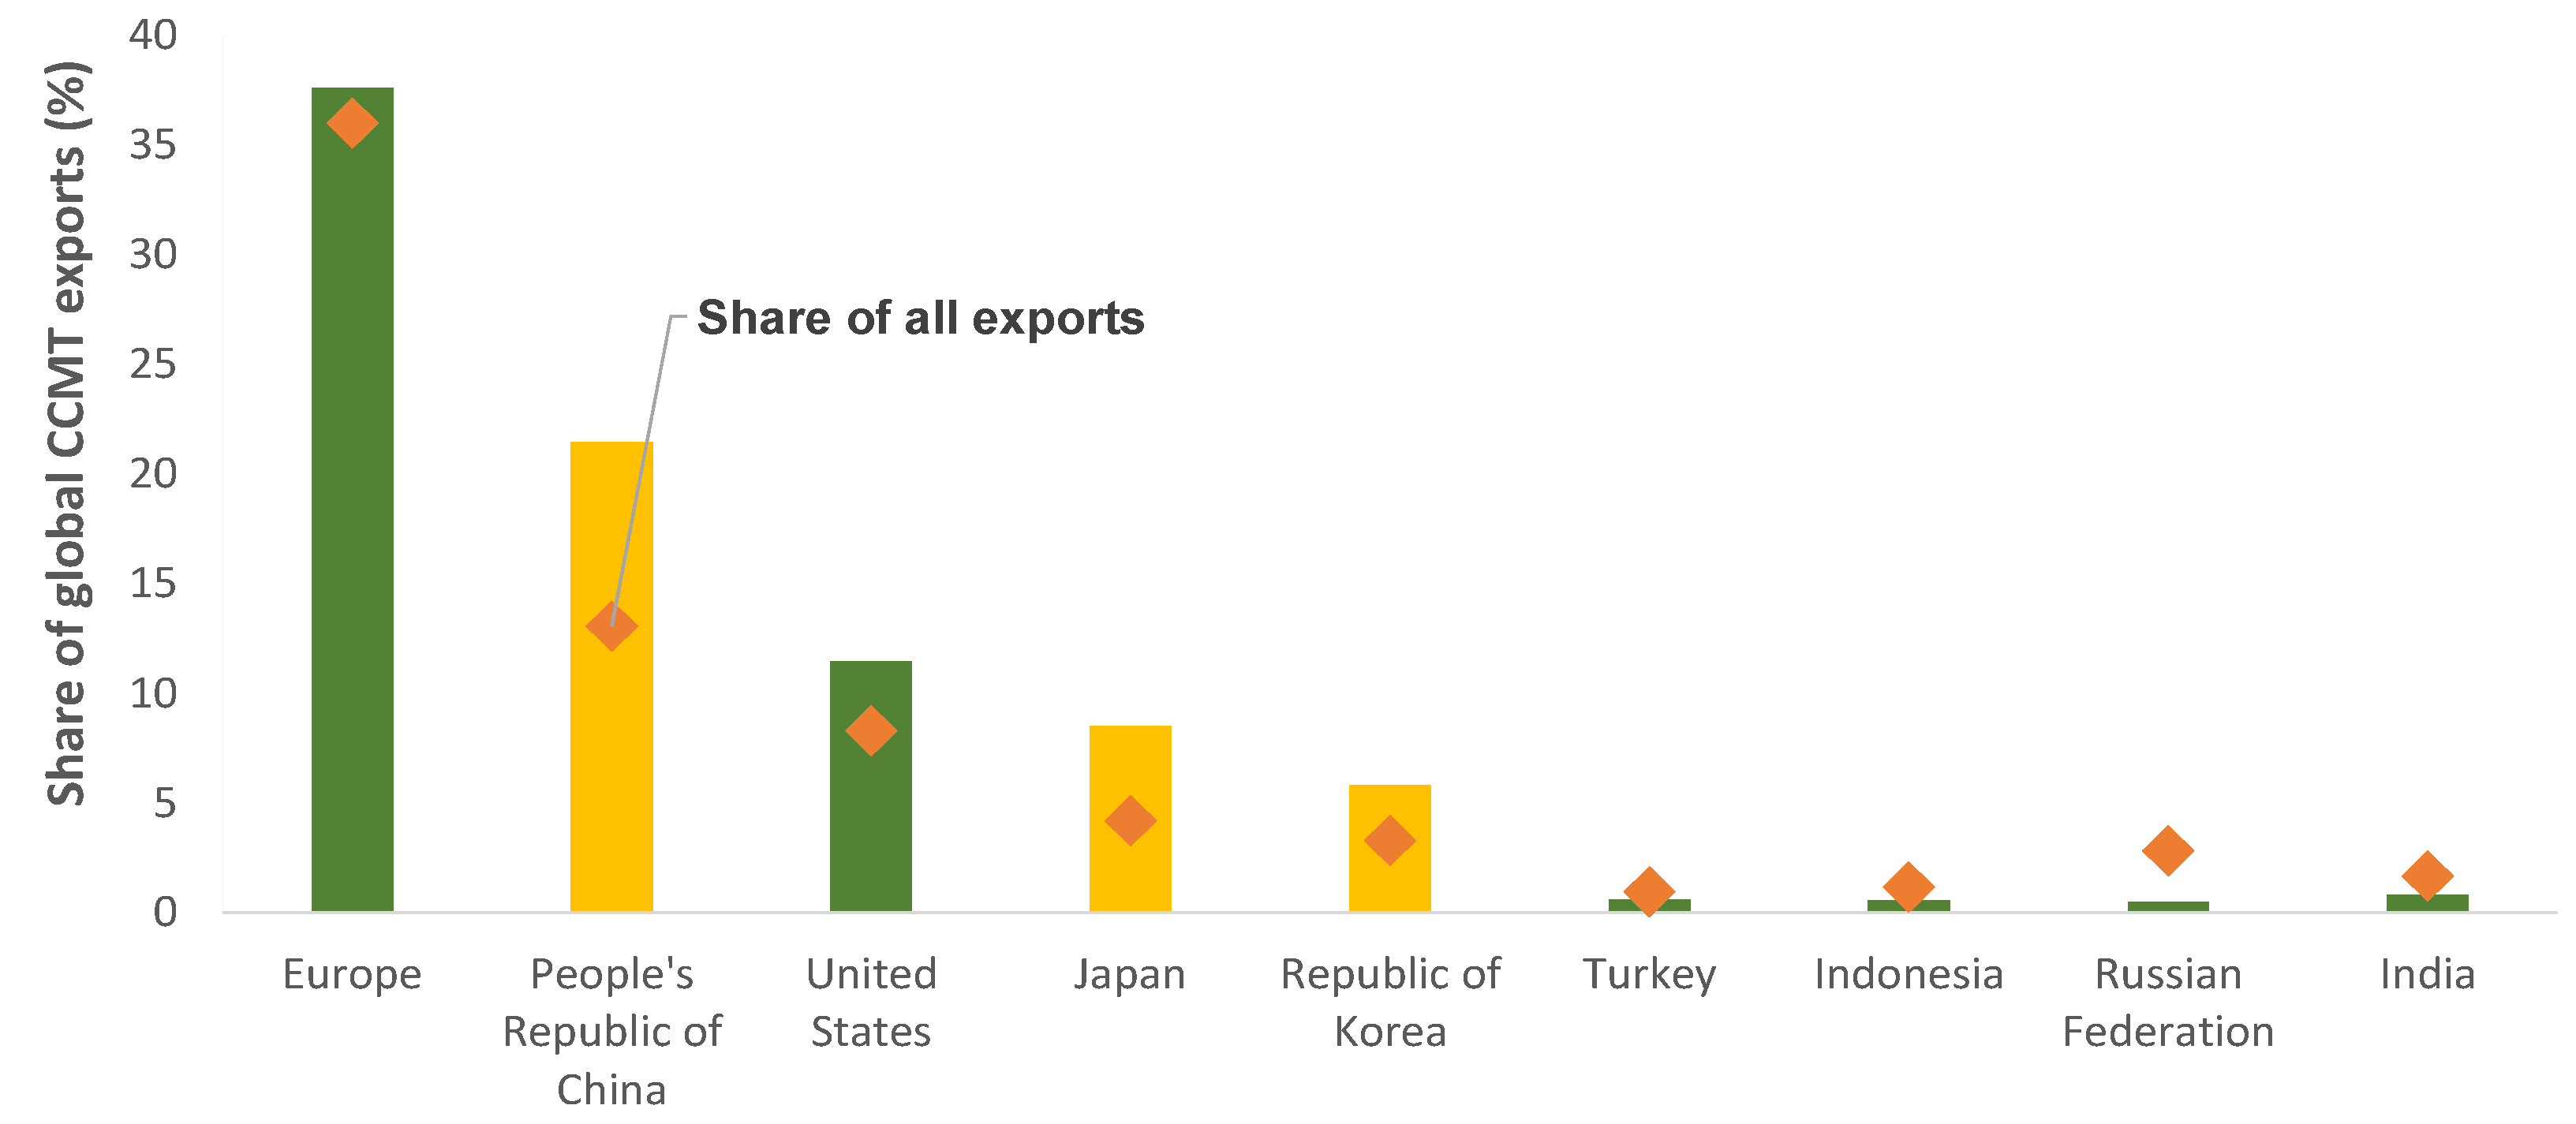
Figure 10.
South Korea’s performance across CCMTs.
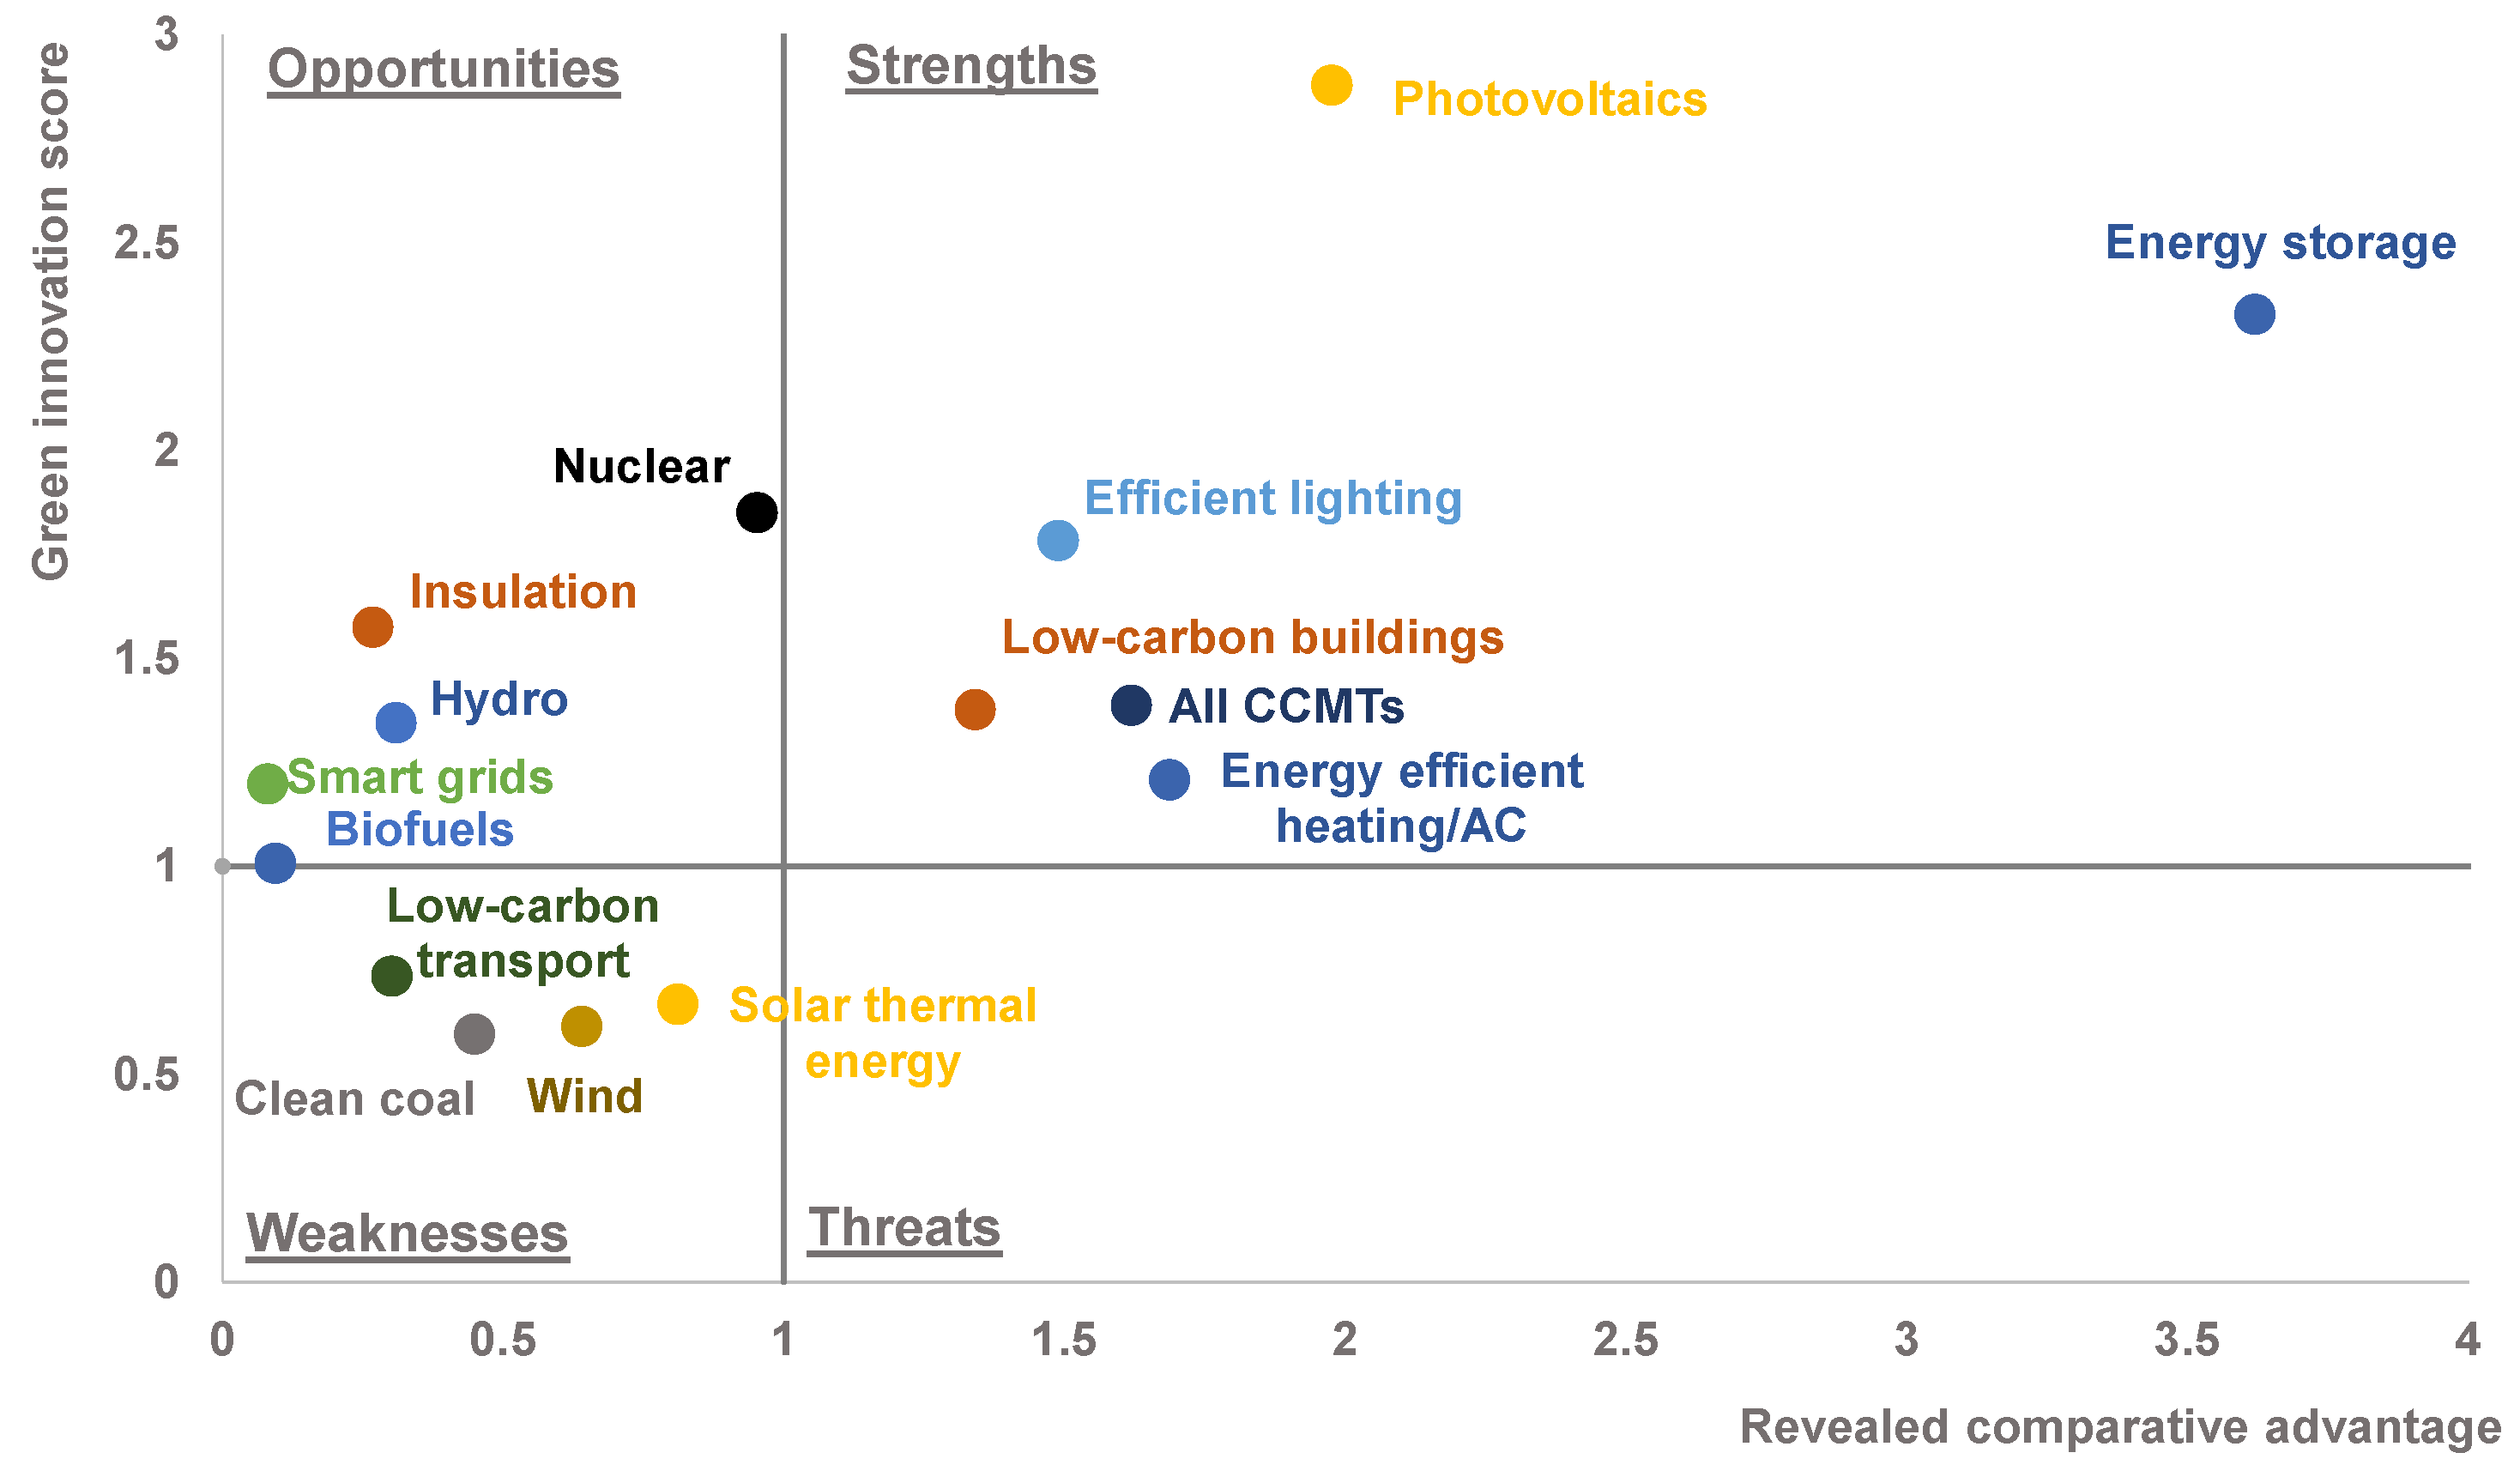
Figure 11.
Japan’s performance across CCMTs.

Figure 12.
China’s performance across CCMTs.
© 2018 by the authors. Licensee MDPI, Basel, Switzerland. This article is an open access article distributed under the terms and conditions of the Creative Commons Attribution (CC BY) license (http://creativecommons.org/licenses/by/4.0/).
Share and Cite
MDPI and ACS Style
Srivastav, S.; Fankhauser, S.; Kazaglis, A. Low-Carbon Competitiveness in Asia. Economies 2018, 6, 5. https://doi.org/10.3390/economies6010005
AMA Style
Srivastav S, Fankhauser S, Kazaglis A. Low-Carbon Competitiveness in Asia. Economies. 2018; 6(1):5. https://doi.org/10.3390/economies6010005
Chicago/Turabian StyleSrivastav, Sugandha, Sam Fankhauser, and Alex Kazaglis. 2018. "Low-Carbon Competitiveness in Asia" Economies 6, no. 1: 5. https://doi.org/10.3390/economies6010005
Note that from the first issue of 2016, this journal uses article numbers instead of page numbers. See further details here.