Private Sector Credit and Inflation Volatility


Economic Research Department, Bank of Uganda, Kampala 7120, Uganda
Economies 2018, 6(2), 28; https://doi.org/10.3390/economies6020028
Submission received: 8 December 2017
/
Revised: 21 March 2018
/
Accepted: 2 April 2018
/
Published: 24 April 2018
(This article belongs to the Special Issue Economic Development in Africa)
Abstract
:This paper investigates the effect of inflation volatility on private sector credit growth. The results indicate that private sector credit growth is positively linked to the one period lagged inflation volatility. Given that past monetary policy actions continue to affect the targeted variables due to the substantial lags in the transmission mechanism, the positive response of private sector credit growth to past inflation volatility suggests a credible monetary policy regime in Uganda, which has led to a reduction in the level of macroeconomic uncertainty and the restoration of favorable economic conditions and prospects, thus increasing the demand for credit. Further, the study finds that the lagged private sector credit growth, nominal exchange rate, and inflation have a statistically significant effect on private sector credit growth while financial innovation, interest rates, and GDP growth appear not to be important determinants of private sector credit growth. The robustness of our findings is confirmed by sensitivity checks.
JEL Classification:
E51; E31; E44; F31; C221. Introduction
In recognition of the importance of a well-functioning financial system for economic growth, many central banks, including Bank of Uganda, focus on promoting price stability and a sound financial system. In a well-functioning financial system, commercial banks facilitate economic transactions, stimulate savings, and channel savings to productive investment activities thus helping to mobilize resources and improve their allocation (Levine 1997). As a source of finance and credit to the private sector, domestic banks play a pivotal role in increasing employment and productivity. Nevertheless, banks’ financial intermediation specialties may be inhibited in unstable macroeconomic environments, making them more than cautious in their lending decisions. The lack of macroeconomic stability may manifest through rapid price level changes. As is well-known, inflation and its volatility are costly to the economy (Moreno 2004). Over time, high inflation volatility increases uncertainty, a deterrent to risk taking and investment, making forecasting, economic planning, and efficient resource allocation difficult, which adversely impacts on economic activity and growth.
Undeniably, Uganda’s rapid economic growth in the past was in part supported by key reforms in the financial sector, including the liberalization of domestic financial markets and removal of quantitative controls on credit. Indeed, Uganda’s prudent macroeconomic management resulted in a consistent record of impressive performance evidenced by average gross domestic product (GDP) growth rates of 7.4%, single digit inflation averaging at 6.5%, and an improved external position with an average current account deficit as a percent of GDP of 4.3% in the period of 2001–2010 (World Bank 2015). However, in the recent past, the country has witnessed more economic volatility and GDP growth slowed to an average of just about 5% (World Bank 2016). Further, going forward, the take off of a huge public investment program and resumption of private sector economic activity in the post-election era is expected to drive growth.
Given the importance of credit to the private sector in driving economic growth outcomes, especially in developing countries, a number of studies have investigated the principal determinants of growth in private sector credit. This notwithstanding, the existing literature is silent on the effects of inflation volatility on private sector credit growth in developing countries, such as Uganda. Against this background, therefore, the main objective of the present study is to examine the effect of inflation volatility on private sector credit. The study provides an insight into the underlying macroeconomic factors driving private sector credit dynamics in Uganda and explores the effects of inflation volatility on credit growth in the private sector. To the best of our knowledge, this is the only study to investigate inflation volatility effects on private sector credit growth. The rest of the study is organized as follows: Section 2 presents a brief overview of the financial sector’s evolution and credit to the private sector in Uganda, Section 3 provides a brief review of the literature and Section 4, the methodology and estimation techniques applied, while Section 5 presents the empirical results and conclusions with recommendations are drawn in Section 6.
2. Overview of the Evolution of the Financial Sector and Credit to the Private Sector in Uganda
The importance of a sound and well-functioning financial system in facilitating economic growth cannot be understated. As such, the maintenance of price stability and a sound financial system remains at the core of Bank of Uganda’s mission (Bank of Uganda 2016a). In line with international best practice, the Bank of Uganda’s regulatory and supervisory framework encourages innovation and efficient competition in financial services based on prudent risk taking and avoidance of reckless bank management. Until the late 1990s, Uganda’s financial sector was predominantly small and fragile due to a combination of misguided financial policies pursued by successive governments along with severe macroeconomic and political instability (Whitworth and Williamson 2010). During this period, the financial sector recorded severe incidences of crisis and distress, including episodes of hyperinflation, which resulted in severe financial disintermediation. In an effort to address these weaknesses, the country undertook extensive reforms in the financial sector in the 1990s, including the liberalization of financial markets, restructuring distressed banks, and strengthening prudential regulation.
Since then, the financial sector in Uganda has experienced rapid change and growth as a result of these reforms, showing resilience and soundness with an infrastructure largely considered safe and efficient. Commercial banks remain the most dominant financial institutions in Uganda and comprise over 80% of the financial system (Mugume 2008). As of March 2016, there were 25 licensed commercial banks operating in the country up from 15 banks in 2004 (Bank of Uganda 2016a). Most of these commercial banks are, however, foreign-owned. The Ugandan banking system has also attained some degree of outreach, investing heavily in physical infrastructure, such as branches and automated teller machines (ATMs). Commercial banks use deposits from customers, deposits from other banks, or other borrowed funds as primary sources of funds that are primarily used to extend loans to customers, invest in securities, or purchase property and equipment.
According to Abuka and Egesa (2007), one of the main advantages of financial reform is the growth of credit expansion to the private sector. Growth in private sector credit (PSC) is a leading indicator of the financial sector’s contribution to economic activity. Nevertheless, despite the increased efficiency and competition in the sector, financial intermediation remains poor as indicated by the stock of private sector credit of 14.6% of GDP as at December 2015 (Bank of Uganda 2016b). Developments in private sector credit are shown in Figure 1. Growth in private sector credit has declined markedly since 2008, in part reflecting the impact of the tight monetary policy stance and subdued domestic demand. As shown in Figure 1, on an annual basis, PSC (Total PSC) grew 8.9% year on year in March 2016 down from 36.1% in March 2008. Over the same period, the growth in Shilling loans (PSC Shs.) declined to 4.6% from 29.9% while growth in the shilling value of foreign denominated loans (PSC fx) also slackened to 14.9% from 54.4%. The slowdown in private sector growth will continue to dent growth in the short-to-medium-term. Macroeconomic stability is highly regarded as a major condition for sectorial credit flow. The creation of an enabling environment through the provision of macroeconomic stability is necessary for the improvement in the extension of credit to the private sector, and as such Bank of Uganda, the country’s central bank, has in recent years focused its policy efforts on controlling inflation at moderate and stable levels.
3. Literature Review
Credit is vital for economic activity, enabling firms to finance investments and households to smooth their consumption. A low rate of credit expansion is not only a symptom of weak economic growth, but can also be one of its causes (Fountas et al. 2006; Bundesbank 2005). This implies that channeling additional resources to strategic areas, such as the private sector, is essential in poverty eradication and promoting economic growth in emerging and developing economies. As a vital engine for economic growth in developing economies, the private sector relies on the financial sector as a source of funds in advancing growth. Nevertheless, banks’ financial intermediation specialties may be inhibited in unstable macroeconomic environments, making them more than cautious in their lending decisions (Quagliariello 2009). Macroeconomic instability is associated with high inflation and greater volatility of relative prices (Azam 2001; Kiley 2007). The general consensus in the literature is that high and volatile inflation is harmful to society’s welfare (Moreno 2004; Aisen and Veiga 2007).
According to Aisen and Veiga (2007), high inflation volatility may be more disruptive to the economy than high inflation levels. Consequently, a number of studies have explicitly investigated the effect of inflation volatility on the macro-economy, examining for instance its effects on economic growth (See for instance Grier and Grier 2006; Mallik and Chowdhury 2011; Wilson 2006; Fountas et al. 2006) and foreign direct investment (Udoh and Egwaikhide 2010). While inflation and inflation volatility may influence private sector credit flow, the empirical literature is silent on the effect of inflation volatility on private sector credit growth. Instead, a number of studies examine the effect of inflation on private sector credit growth without any attempt to disentangle the effects of high inflation levels from those of high inflation volatility (see for instance Backé and Zumer 2005; Egert et al. 2007; Kiss et al. 2006). Backé and Zumer (2005) examined the effect of inflation on private sector credit growth but neglected the effect of inflation volatility while investigating the dynamics behind the high increase in the domestic credit to the private sector in the new member states of the European Union (EU) in recent years. They found that growth in lending to the private sector is affected positively by macroeconomic stabilization, banking sector reforms, financial liberalization and integration, an environment of moderate or low inflation with a buildup of confidence in policy frameworks, decline in interest rates following low inflation, privatization and restructuring of the banking sector, and regulatory reforms of financial markets developing confidence and fostering domestic private sector credits. Backé and Zumer (2005) point out that growth in private sector credit was higher in Baltic countries and Hungary than in the euro area. It was also noted that Baltic countries experienced a high rate of growth in private sector credit in an environment of rather low inflation. The study also argued that the equilibrium level of financial depth itself will increase and promote credit growth as Central and Eastern European economies grow richer.
This consistent with Egert et al. (2007), who investigated the determinants of domestic bank credit to the private sector as a percentage of GDP in 11 CEE countries using three alternative techniques for regression panel estimation and found that bank credit to the public sector, lending rate, inflation, and spread between lending and deposit rates (a proxy for financial liberalization) negatively affect private credit to GDP ratio while GDP per capita was found to have a positive effect on private credit to GDP ratio although the robustness of the results varies within homogeneous country groups. Their study, however, does not explicitly account for the effect of inflation volatility on private sector credit growth. Likewise, Kiss et al. (2006) in their study of the dynamics of growth in credit to the private sector in a number of Central and Eastern European countries fail to explicitly account for the impact of inflation volatility but incorporate inflation as one of the macroeconomic explanatory variables. The study found that the major determinants of credit are purchasing power parity-based GDP per capita (representing the effect of economic development), the real interest rate (measuring the cost of credit), and inflation (capturing the effects of inflation volatility and liquidity constraints). Specifically, GDP per capita was found to increase the credit/GDP ratio while the real interest rate and inflation lower the credit/GDP ratio. In addition, the study concluded that a large part of credit growth in new member states can be explained by the catching-up process and credit/GDP ratios are below the levels consistent with macroeconomic fundamentals.
Further, the literature fails to agree on the drivers of bank lending to the private sector (Akinlo and Oni 2015). The theoretical and empirical literature suggests that the drivers of private sector credit vary depending on country- or region-specific factors, making this an empirical issue. In the theoretical literature, a variety of theoretical models on credit demand and/or supply exist, typically featuring real GDP, price indices or interest rates, and the financial positions of banks as explanatory variables, although there appears to be no standard model (Egert et al. 2007; Backé and Zumer 2005). In addition, although the results are diverse, a number of empirical studies find evidence in support of different credit channels using both macro and micro data. Nevertheless, the empirical work on credit growth is predominantly in the context of high-income industrialized and emerging market economies (Egert et al. 2007; Backé and Zumer 2005). This body of work generally finds that credit demand is explained by output and interest rates, although supply factors, if important, may reduce the reliability of the estimation results due to difficulties in distinguishing demand and supply for credit in econometric estimation (Backé and Zumer 2005).
The empirical literature on credit growth in developing countries is fairly limited. Using panel regression estimation techniques, Iossifov and Khamis (2009) examined credit growth in 43 countries in Sub-Saharan Africa from 1997 to 2007 and found that bank credit to the private sector is mainly driven by GDP per capita and negatively affected by the interest rate. While also using panel regression estimation, Abuka and Egesa (2007) examined credit growth to the private sector in the Eastern African Community countries, including Uganda, for the period 1984 to 2003, and found that a crowding-out effect of government borrowing from banks, per capita GDP, access to land, low urbanisation levels, and poor infrastructure quality were important determinants of credit growth. Other studies in the developing country context include Imran and Nishat (2013), who used the Autoregressive Distributed Lag (ARDL) econometric approach and annual data from the period 1971–2010 to investigate the determinants of private sector credit growth in Pakistan and found that foreign liabilities, domestic deposits, economic growth, exchange rate, and monetary conditions were important determinants whereas inflation and the money market rate seemed to have no effect on private sector credit. Sharma and Gounder (2012) investigated the influence of macroeconomic variables on private sector credit growth across six south pacific island economies over the period 1982–2009 using panel regression estimation and found that private sector credit growth in these economies was largely driven by higher economic growth, deposit rate, and average lending and inflation rates. Albulescu (2010) using ordinary least squares (OLS) evaluated the growth rate of credit granted in domestic and foreign currency, respectively, for Romania and found that credit growth rate in domestic currency was linked positively with economic growth, deposits in domestic currency growth, and unemployment rate, but negatively with net wage growth and interest rates. In the second equation, foreign currency credit dynamics were explained by net wages and foreign currency deposits. In the emerging market context, Guo and Stepanyan (2011) analysed the determinants of bank credit in 38 emerging market economies over the period 2001–2010 with panel regression and found that domestic deposits, GDP growth, liabilities to non-residents, and inflation rate had a positive and significant effect on private sector credit growth, while the deposit rate and the federal fund rate were both negatively related to credit growth. In an alternative equation, they added the exchange rate to pick up the effect of foreign currency credit and showed that depreciation of the exchange rate contributes to credit growth.
This paper contributes to the existing literature in several respects. This study is directed tows bridging the gap in the literature on the effects of inflation volatility on private sector credit growth. First, as mentioned previously, to the best of our knowledge, no study has addressed the issue of the effect of inflation volatility on private sector credit growth, especially in the context of developing countries, such as Uganda, which are susceptible to high inflation and inflation volatility. Second, this paper extends previous work on the determinants of private sector credit, specifically identifying additional factors for Uganda. Previous studies dealt with Uganda within the context of a panel of countries that included Uganda.
4. Methodology
4.1. Data and Estimation Procedure
There is no universal model for the determinants of private sector credit (PSC) growth. The current study adopts a demand-side approach using macroeconomic variables applied in previous studies as explanatory variables to explain private sector credit. In many theoretical and empirical studies, real GDP, prices, and interest rates commonly serve as explanatory variables for the determinants of a private sector credit demand model (Egert et al. 2007; Backé and Zumer 2005). In this study, PSC is modelled as a function of a set of explanatory variables given by PSC = [RGDP, IR, ER, FI, INF and INFV], RGDP, IR, ER, FI, INF, and INFV denote real gross domestic product, nominal interest rate, nominal exchange rate, financial innovation, inflation, and inflation volatility, respectively. The study uses monthly data spanning 1995m1 to 2017m12. The choice of the sample period and data frequency is guided by data availability. Data on the variables of interest, namely PSC, interest rate (TB), exchange rate (ER), financial innovation (FI), and inflation (INF) were obtained from Bank of Uganda’s database. The data on real gross domestic product (RGDP) are compiled from the World Bank Databases and International Financial Statistics (IFS) databases. Inflation is measured as the first difference of the natural log of the consumer price index, where , while GARCH modelling techniques are deployed to estimate measures of inflation volatility (INFV1, INFV2, and INFV3). In the absence of monthly RGDP data, annual RGDP data was transformed to monthly frequency with the aid of interpolation and then used as a measure of overall economic activity in Uganda. In addition, given that financial innovation affects the nature and composition of monetary aggregates, the ratio of M2 to M1 is used to capture the effects of financial innovation. A number of studies use M2/M1 as a proxy of financial innovation (see for instance (Hye 2009; Ansong et al. 2011)). This study applies the ordinary least square (OLS) estimation technique and Eviews version 8.0 statistical package software. The empirical model for analysis is of the form:
where LN denotes natural logarithm and all other variables are as previously described. It is expected that , and . During periods of excessive inflation volatility, proper functioning of financial markets is hindered by increased uncertainty and as such, less credit will typically be extended. Higher inflation and interest rates may depress the demand for bank deposits, causing banks to restrict the supply of credit and thereby inducing declines in spending. Financial innovation is expected to improve financial sector intermediation, allowing it to attract more resources from both the banked and the unbanked populations into the formal financial system, and thus facilitate private sector credit growth. In the wake of a positive output shock, credit demand may go up because the unexpected change in real GDP may trigger increases in consumption and investment demand, subsequently leading to higher credit demand. OLS was used to analyse the relationship between a dependent variable and independent variables. The robustness of the coefficient was used to determine the nature of the relationship and also whether it is statistically significant. The selection of a parsimonious model is based on the Schwarz information criterion and Hannan–Quin (HQ) criterion.
4.2. Measuring Inflation Volatility
In order to identify the effects if any of INFV on PSC growth, it is important to identify an appropriate measure of Inflation volatility for the investigation. The Generalized Auto Regressive Conditional Heteroscedastic (GARCH) modelling techniques are popular because they capture the time-varying nature of volatility processes as dependent on both past volatility and past innovations. The GARCH model was introduced by Bollerslev (1986) in a seminal study of U.S. quarterly inflation. Subsequent studies have improved on the GARCH model. For instance, Nelson (1991) proposed the Exponential Generalized Auto Regressive Conditional Heteroscedastic (EGARCH) model, which unlike its GARCH counterpart does not impose non-negativity constraints on parameters and is able to capture asymmetry in the responsiveness of inflation volatility to shocks to inflation. The Threshold Generalized Auto Regressive Conditional Heteroscedastic (TGARCH) model, another asymmetric model, was independently introduced by Glosten et al. (1993) and Zakoian (1994). Existing evidence suggests that the behavior of inflation volatility in response to shocks is asymmetric (see for instance Kontonikas (2004)). Thus, the study applies measures of inflation volatility derived from symmetric GARCH as well as asymmetric EGARCH and TGARCH models. The general form of the applied GARCH model takes the following form:
where and are constants, is the conditional exchange rate volatility, and all other variables are as previously described. The GARCH (1,1) model requires that α ≥ 0 and β ≥ 0 and α + β < 1 for covariance stationarity. In the EGARCH model, the specification for the conditional covariance is as follows:
where γ is the asymmetric parameter and , α, and β are as defined in Equation (3). The impact is asymmetric if . If is positive, a positive inflationary shock causes more volatility than a negative inflationary shock of equal magnitude. The generalized specification for the TGARCH model is given by:
where if and 0 otherwise, γ is the asymmetric parameter, and, α, and β are as defined in Equation (3). In this model, a positive inflation shock () or bad news and a negative inflation shock or good news have differential effects on the conditional variance; good news has an impact of while bad news has an impact of . If , the impact is asymmetric while a negative coefficient of suggests that negative inflation shocks (good news) lower inflation volatility. The analysis covers the period of 1984M6 to 2017M12.
5. Results and Discussion
5.1. Descriptive Statistics
Table 1 below provides a summary of descriptive statistics for the variables of interest over the period under study. The results indicate high variability in measures of private sector credit, interest rate, inflation, and inflation volatility as evidenced by the large standard deviation statistics.
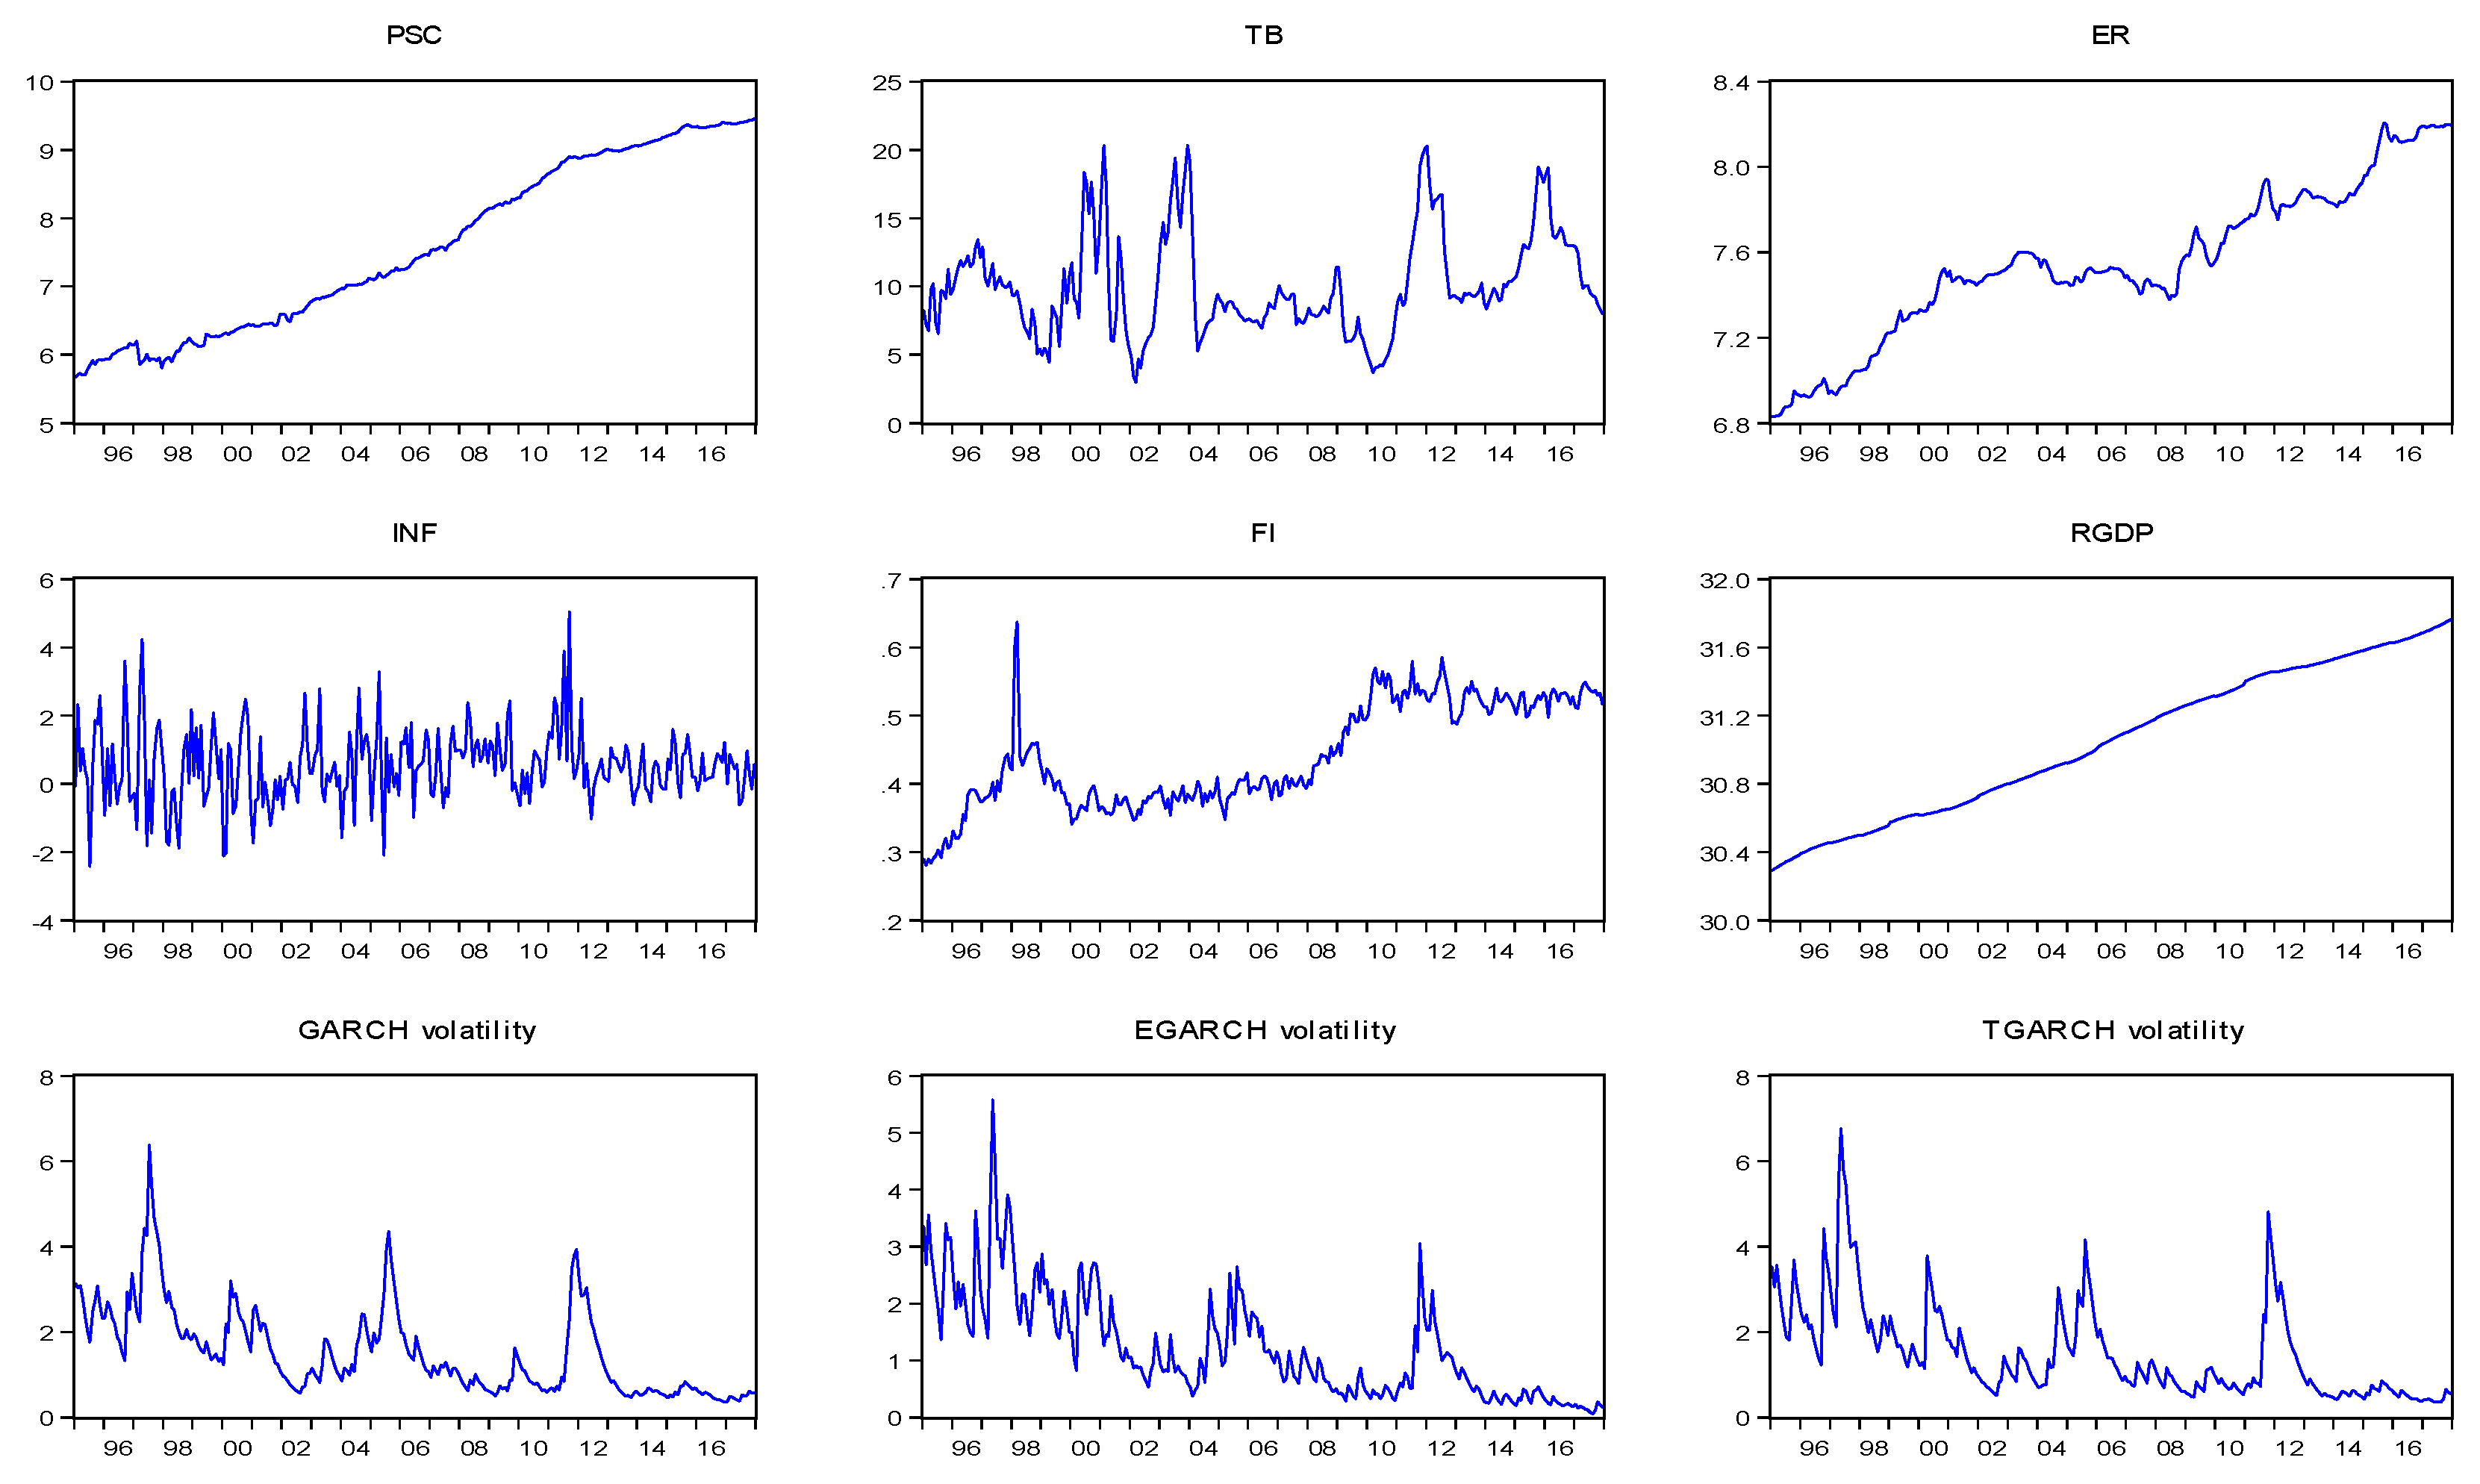
Figure 2 below presents plots total private sector credit and selected macroeconomic variables of interest. As shown in Figure 2, total private sector credit has generally trended upwards despite the variation in the growth rate. In addition, all the plots of inflation volatility show a high level of variability despite the marked decline in 2014.
5.2. Unit Root Test Results
We carry out a unit-root test to inform our specification of the regression model. The results of the Augmented Dickey–Fuller (ADF) (Dickey and Fuller 1979), Phillip–Perron (PP) (Phillips and Perron 1988), and Kwiatkowski–Phillips–Schmidt–Shin (KPSS) (Kwiatkowski et al. 1992) unit-root tests conducted on all the variables employed in the analyses are presented in Table 2 below. The ADF and PP tests conducted on each of the variables are based on the null hypothesis of non-stationarity and failure to reject the null implies the need for appropriate differencing to induce stationarity, while the KPSS test investigates the null hypothesis that an observable series is stationary against a non-stationary alternative. The results show that there is a mixture of I(1) and I(0) variables. All of the I(1) variables require differencing to make them stationary and avoid the spurious regression problem. Thus, the I(1) variables are entered into the OLS model in their differenced form.
5.3. Discussion of Results
Table 3 reports the results of inflation volatility measures based on estimation of GARCH (1,1), EGARCH (1,1), and TGARCH (1,1) models1. In the table, coefficient size and sign are relatively similar for all of the three models.The estimated α and β coefficients are positive and statistically significant. The size of the parameters α and β determine the short-run dynamics of the resulting volatility time series. The large βs across all three models indicate that inflation volatility is persistent in Uganda and shocks to conditional variance take a long time to die out, while small α coefficients suggest that volatility reacts less intensely to movements in the economy. Sharaf (2015) also finds a high degree of inflation volatility persistence in the response to inflationary shocks for Egypt. The covariance stationarity conditions are met in all of the three estimated models as the persistence parameters are all less than unity. The significant asymmetry coefficients in the EGARCH and TGARCH models confirm that negative and positive shocks have different effects on inflation volatility. In the EGARCH model, the positive asymmetry parameter implies that a positive inflationary shock causes more inflation volatility than a negative inflationary shock of equal magnitude. This result is also supported by the results of the TGARCH (1,1) model, where a negative coefficient on the asymmetry term (γ) implies that positive inflationary shocks raise inflation volatility more than negative inflationary shocks lower inflation volatility. In addition, the results of the ARCH LM test presented in Table 3 show that there are no remaining ARCH effects in the variance equations, indicating that the volatility models are adequate and fit the data. The Schwarz criterion and Hannan–Quinn criterion suggest the TGARCH model, which has the lowest value, as the best model.
Table 4 below presents results of the effect of selected macroeconomic variables on demand for credit by the private sector. Specifically, we examine the effects of inflation volatility on private sector credit controlling for identified potential explanatory variables. The estimation was done using the OLS method. As shown in Table 4, lagged private sector credit growth, nominal exchange rate, inflation, and inflation volatility have a statistically significant effect on private sector credit growth, whereas the 91-day T-bill interest rate, financial innovation, and GDP do not significantly affect private sector credit growth. Importantly, the study finds significant effects of inflation volatility on private sector credit growth. The estimated coefficients suggest that a percentage change in the rate of lagged inflation volatility increases private sector credit growth by approximately 0.02% to 0.01% and the effect is statistically significant at the 1% level. The significant positive effect of lagged inflation volatility on private sector credit may reflect the market response in the context of the overall strategy of monetary policy to curb inflation and inflation volatility, since past monetary policy actions continue to affect the targeted variables because of the substantial lags in the transmission mechanism. Thus, a positive response of private sector credit growth to past inflation volatility suggests a credible monetary policy regime in Uganda which has led to a reduction in the level of macroeconomic uncertainty and the restoration of favorable economic conditions and prospects, thus increasing the demand for credit. This is consistent with Reinikka and Svensson (2001), who find that in Uganda, policy credibility was behind the private sector’s confidence that prudent macroeconomic management would continue both in the short term and medium term. Although the study finds support for the hypothesis of a negative relationship between private sector credit and inflation volatility, the effect is not statistically significant at any of the conventional significance levels.
In addition, lagged private sector credit growth negatively influences growth in credit to the private sector and the effect is statistically significant at the 1% level. This suggests that the previous period’s lending activity influences that of the next month’s credit expansion. These results may be on account of the perceived risks associated with credit booms, which may induce banks to tighten their lending standards following a positive shock to private sector credit growth in order to satisfy regulatory obligations, such as capital adequacy requirements imposed on banks by regulators that reduce the quantity of credit or anticipated monetary policy tightening as private sector credit growth is one of the leading indicators of inflation in developing countries such as Uganda.
In line with Guo and Stepanyan (2011), we find a positive and statistically significant effect of the nominal exchange rate on private sector credit growth in the case of Uganda. In response to a 1% increase in the rate of depreciation, private sector credit grows by about 0.3% to 0.4%. This explanatory variable appears to have the highest influence on the private sector credit growth. This suggests the existence of strong valuation effects of foreign currency credit in domestic currency terms which may be driving private sector credit growth. This effect may be explained by the fact that Uganda is a net import country and thus domestic firms with foreign-sourced intermediate inputs may require more credit to finance their investment needs following depreciation of the domestic currency. Consistent with the theoretical and empirical literature (see Kiss et al. 2006; Egert et al. 2007), inflation produces the expected negative sign and the effect is significant at the 1% level of statistical significance. The result indicates that private sector credit growth declines by about 0.005% to 0.006% following a 1% increase in inflation. Our result contrasts with the empirical findings of Guo and Stepanyan (2011) for emerging market economies and Sharma and Gounder (2012) for six pacific island nations, which show that inflation has a positive and significant effect on private sector credit growth, as well as Imran and Nishat (2013), who found that inflation rates appear to have no effect on private sector credit growth in Pakistan.
Although the coefficients on the 91-day T-bill interest rate, financial innovation, and real GDP carry the expected signs, they are not statistically significant at conventional significance levels. The higher rates of financial innovation and real GDP growth were expected to boost the growth rate of private sector credit, while a higher T-bill interest rate was expected to reduce credit to the private sector. There is a direct and negative relationship between the 91-day T-bill interest rate and private sector credit growth such that when interest rates increase, the cost of private sector credit also increases; therefore, demand for credit by the private sector falls. On the other hand, financial innovation serves to improve financial sector intermediation, allowing it to attract more resources from both the banked and the unbanked populations into the formal financial system and thus facilitate private sector credit growth. Similarly, real GDP has a positive association with growth of bank credit to the private sector. This is because an increase in real GDP boosts economic activity, which leads to higher consumption and domestic investment that requires credit financing.
5.4. Sensitivity and Robustness Analysis
We test the sensitivity of our results by estimating three alternative models using different measures of inflation volatility. It is evident from Table 4 that the results of all of the estimated models are fairly similar, with comparable magnitudes and signs of the coefficients. However, the results of the Schwarz criterion and the Hannan–Quinn criterion also presented in Table 4 show that model 2, which incorporates a measure of inflation volatility derived from the EGARCH model, has the lowest value and thus is the model that best fits the data. The results of the Breush–Godfrey Serial Correlation Test presented in Table 4 fail to reject the null hypothesis of no serial correlation in the residuals for all estimated models based on corresponding p-values of about 0.6 to 0.8, an indication that the estimated OLS standard errors are valid and estimated coefficients unbiased and consistent. The key assumption with regression is that the variance of the error term is homoscedastic across all of the observations. The presence of heteroscedasticity has a serious consequence on ordinary least squares estimators in that they are unbiased and consistent but become inefficient and the standard errors are inconsistent. The results of the ARCH LM heteroscedasticity test also presented in Table 4 fail to reject the null hypothesis of homoscedasticity based on corresponding p-values of about 0.9 for all of the estimated models. This is an indication that the errors are homoscedastic and independent of the regressors. Limited data availability makes extensive analysis difficult.
6. Conclusions and Recommendation
This study provides new empirical evidence on the effect of inflation volatility on private sector credit growth in a developing country in transition, Uganda. In summary, the study finds that private sector credit growth is positively linked to a one-period lag in inflation volatility. The positive response of private sector credit growth to past inflation volatility suggests a credible monetary policy regime in Uganda, which has led to a reduction in the level of macroeconomic uncertainty and the restoration of favorable economic conditions and prospects, thus increasing the demand for credit. Further, the study finds that the lagged private sector credit growth, nominal exchange rate, and inflation have a statistically significant effect on private sector credit growth, while financial innovation, interest rates, and GDP growth appear not to be important determinants of private sector credit growth. The robustness of our findings is confirmed by sensitivity checks.
While Uganda has undergone major policy and institutional reforms, the findings of this study reaffirm the need for further reforms aimed at maintaining monetary policy credibility and promoting macroeconomic stability and financial sector development. Specifically, the finding that macroeconomic variables, such as inflation and exchange rate, affect private sector credit growth reaffirms the importance of prudent macroeconomic management in creating an enabling environment for private sector credit growth. For instance, the finding of an adverse effect of inflation on private sector credit growth suggests that authorities need to continue pursuing policies aimed at maintaining low and stable inflation in order to support private sector credit growth, while the evidence of the positive effect of the exchange rate on private sector credit growth implies that the flexible exchange rate regime has been effective in stabilizing external shocks on the domestic economy. The evidence that economic growth, interest rates, and financial sector innovation have no effect on private sector credit growth suggests the need to appraise the effectiveness of the current financial sector development plan, which aims at improving financial sector intermediation with the aim of improving the competitiveness and depth of the financial sector.
Conflicts of Interest
The author declares no conflicts of interest.
References
- Abuka, Charles A., and Kenneth A. Egesa. 2007. An assessment of private sector credit evolution in the East African Community: The candidates for a region wide reform strategy for the financial sector 1. The Bank of Uganda Staff Papers Journal 1: 107–19. [Google Scholar]
- Aisen, Ari, and Francisco José Veiga. 2007. Does political instability lead to higher and more volatile inflation? A panel data analysis. Panoeconomicus 54: 5–27. [Google Scholar] [CrossRef]
- Akinlo, A. Enisan, and I. Oluwafemi Oni. 2015. Determinants of bank credit growth in Nigeria 1980–2010. European Journal of Sustainable Development 4: 23. [Google Scholar] [CrossRef]
- Albulescu, Claudiu Tiberiu. 2010. Forecasting Credit Growth Rate in Romania: From Credit Boom to Credit Crunch? Romanian Economic Business Review 5: 62–75. [Google Scholar]
- Ansong, Abraham, Edward Marfo-Yiadom, and Emmanuel Ekow-Asmah. 2011. The Effects of Financial Innovation on Financial Savings: Evidence from an Economy in Transition. Journal of African Business 12: 93–113. [Google Scholar] [CrossRef]
- Azam, Jean-Paul. 2001. Inflation and Macroeconomic Instability in Madagascar. African Development Review 13: 175–201. [Google Scholar] [CrossRef]
- Backé, Peter, and Tina Zumer. 2005. Developments in Credit to the Private Sector in Central and Eastern European EU Member States: Emerging from Financial Repression—A Comparative Overview. Focus on European Economic Integration 2: 83–109. [Google Scholar]
- Bank of Uganda. 2016a. About the Bank [WWW Document]. Available online: https://www.bou.or.ug/bou/home.html (accessed on 17 May 2016).
- Bank of Uganda. 2016b. Database. [WWW Document]. Available online: https://www.bou.or.ug/bou/rates_statistics/statistics.html (accessed on 17 May 2016).
- Bollerslev, Tim. 1986. Generalized Autoregressive Conditional Heteroskedasticity. Journal of Econometrics 31: 307–27. [Google Scholar] [CrossRef]
- Bundesbank. 2005. Credit Growth, Bank Capital and Economic Activity. Deutsche Bundesbank Monthly Report. Frankfurt am Main: Deutsche Bundesbank. [Google Scholar]
- Dickey, David A., and Wayne A. Fuller. 1979. Distribution of the estimators for autoregressive time series with a unit root. Journal of the American Statistical Association 74: 427–31. [Google Scholar]
- Egert, Balázs, Peter Backé, and Tina Zumer. 2007. Private-Sector Credit in Central and Eastern Europe: New (Over) Shooting Stars? Comparative Economic Studies 49: 201–31. [Google Scholar] [CrossRef]
- Fountas, Stilianos, Menelaos Karanasos, and Jinki Kim. 2006. Inflation uncertainty, output growth uncertainty and macroeconomic performance. Oxford Bulletin of Economics and Statistics 68: 319–43. [Google Scholar] [CrossRef]
- Glosten, Lawrence R., Ravi Jagannathan, and David E. Runkle. 1993. On the Relation between the Expected Value and the Volatility of the Nominal Excess Return on Stocks. The Journal of Finance 48: 1779–801. [Google Scholar] [CrossRef]
- Grier, Robin, and Kevin B. Grier. 2006. On the real effects of inflation and inflation uncertainty in Mexico. Journal of Development Economics 80: 478–500. [Google Scholar] [CrossRef]
- Guo, Kai, and Vahram Stepanyan. 2011. Determinants of Bank Credit in Emerging Market Economies. IMF Working Paper. Washington, DC: International Monetary Fund. [Google Scholar]
- Hye, Qazi Muhammad Adnan. 2009. Financial innovation and demand for money in Pakistan. The Asian Economic Review 51: 219–28. [Google Scholar]
- Imran, Kashif, and Mohammed Nishat. 2013. Determinants of bank credit in Pakistan: A supply side approach. Economic Modelling 35: 384–90. [Google Scholar] [CrossRef]
- Iossifov, Plamen, and May Y. Khamis. 2009. Credit Growth in Sub-Saharan Africa-Sources, Risks, and Policy Responses. IMF Working Paper. Washington, DC: International Monetary Fund. [Google Scholar]
- Kiley, Michael T. 2007. Is Moderate-to-High Inflation Inherently Unstable? International Journal of Central Banking 3: 173–201. [Google Scholar] [CrossRef]
- Kiss, Gergely, Márton Nagy, and Balázs Vonnák. 2006. Credit Growth in Central and Eastern Europe: Trend, Cycle or Boom. Paper presented at the Conference “Finance and Consumption Workshop: Consumption and Credit in Countries with Developing Credit Markets”, Florence, Italy, June 16–17. [Google Scholar]
- Kontonikas, Alexandros. 2004. Inflation and Inflation Uncertainty in the United Kingdom, Evidence from GARCH Modelling. Economic Modelling 21: 525–43. [Google Scholar] [CrossRef]
- Kwiatkowski, Denis, Peter C. B. Phillips, Peter Schmidt, and Yongcheol Shin. 1992. Testing the Null Hypothesis of Stationarity against the Alternative of a Unit Root: How Sure Are We That Economic Time Series Have a Unit Root? Journal of Econometrics 54: 159–78. [Google Scholar] [CrossRef]
- Levine, Ross. 1997. Financial Development and Economic Growth: Views and Agenda. Journal of Economic Literature 35: 688–726. [Google Scholar]
- Mallik, Girijasankar, and Anis Chowdhury. 2011. Effect of inflation uncertainty, output uncertainty and oil price on inflation and growth in Australia. Journal of Economic Studies 38: 414–29. [Google Scholar] [CrossRef]
- Moreno, Antonio. 2004. Reaching Inflation Stability. Journal of Money, Credit and Banking 36: 801–25. [Google Scholar] [CrossRef]
- Mugume, Adam. 2008. Market Structure and Performance in Uganda’s Banking Industry. Working Paper. Kampala, Uganda: Department of Economic Theory and Analysis, Makerere University. [Google Scholar]
- Nelson, Daniel B. 1991. Conditional Heteroskedasticity in Asset Returns: A New Approach. Econometrica: Journal of the Econometric Society 59: 347–70. [Google Scholar] [CrossRef]
- Phillips, Peter C. B., and Pierre Perron. 1988. Testing for a unit root in time series regression. Biometrika 75: 335–46. [Google Scholar] [CrossRef]
- Quagliariello, Mario. 2009. Macroeconomic Uncertainty and Banks’ Lending Decisions: The Case of Italy. Applied Economics 41: 323–36. [Google Scholar] [CrossRef]
- Reinikka, Ritva, and Jakob Svensson. 2001. Confronting Competition: Investment, Profit, and Risk. In Uganda’s Recovery: The Role of Farms, Firms, and Government. Edited by Ritva Reinikka and Paul Collier. Regional and Sectoral Studies. Washington: World Bank, pp. 207–32. [Google Scholar]
- Sharaf, Mesbah Fathy. 2015. Inflation and Inflation Uncertainty Revisited: Evidence from Egypt. Economies 3: 128–46. [Google Scholar] [CrossRef]
- Sharma, Parmendra, and Neelesh Gounder. 2012. Determinants of Bank Credit in Small Open Economies: The Case of Six Pacific Island Countries. Discussion Papers in Finance. Brisbane: Griffith University. [Google Scholar]
- Udoh, Elijah, and Festus O. Egwaikhide. 2010. Exchange Rate Volatility, Inflation Uncertainty and Foreign Direct Investment in Nigeria. Botswana Journal of Economics 5: 14–31. [Google Scholar] [CrossRef]
- Whitworth, Alan, and Tim Williamson. 2010. Overview of Ugandan economic reform since 1986. In Uganda’s Economic Reforms Insider Accounts. Edited by Florence Kuteesa, Emmanuel Tumusiime-Mutebile, Alan Whitworth and Tim Williamson. New York: Oxford University Press Inc. [Google Scholar]
- Wilson, Bradley Kemp. 2006. The links between inflation, inflation uncertainty and output growth: New time series evidence from Japan. Journal of Macroeconomics 28: 609–20. [Google Scholar] [CrossRef]
- World Bank. 2015. World Development Indicators [WWW Document]. Available online: https://elibrary.worldbank.org/doi/abs/10.1596/978-1-4648-0440-3 (accessed on 29 April 2016).
- World Bank. 2016. Uganda Overview [WWW Document]. Worldbank.org. Available online: http://www.worldbank.org/en/country/uganda/overview (accessed on 29 April 2016).
- Zakoian, Jean-Michel. 1994. Threshold Heteroskedastic Models. Journal of Economic Dynamics and Control 18: 931–55. [Google Scholar] [CrossRef]
| 1 | Preliminary analysis was conducted using the ADF, PP, and KPSS unit-root tests to ascertain the order of intergration of the inflation series and show consistent evidence of stationary at the 5% level of significance. The ARCH LM test conducted using residuals from an OLS regression of the mean equation strongly rejects the null hypothesis of no ARCH effects with a p-value of 0.00. The test assesses the null hypothesis that a series of residuals (rt) exhibits no conditional heteroscedasticity (no ARCH effects) against the alternative that an ARCH type model describes the series. |
Figure 1.
Evolution of Private sector credit (PSC) growth in Uganda. Source: Bank of Uganda.
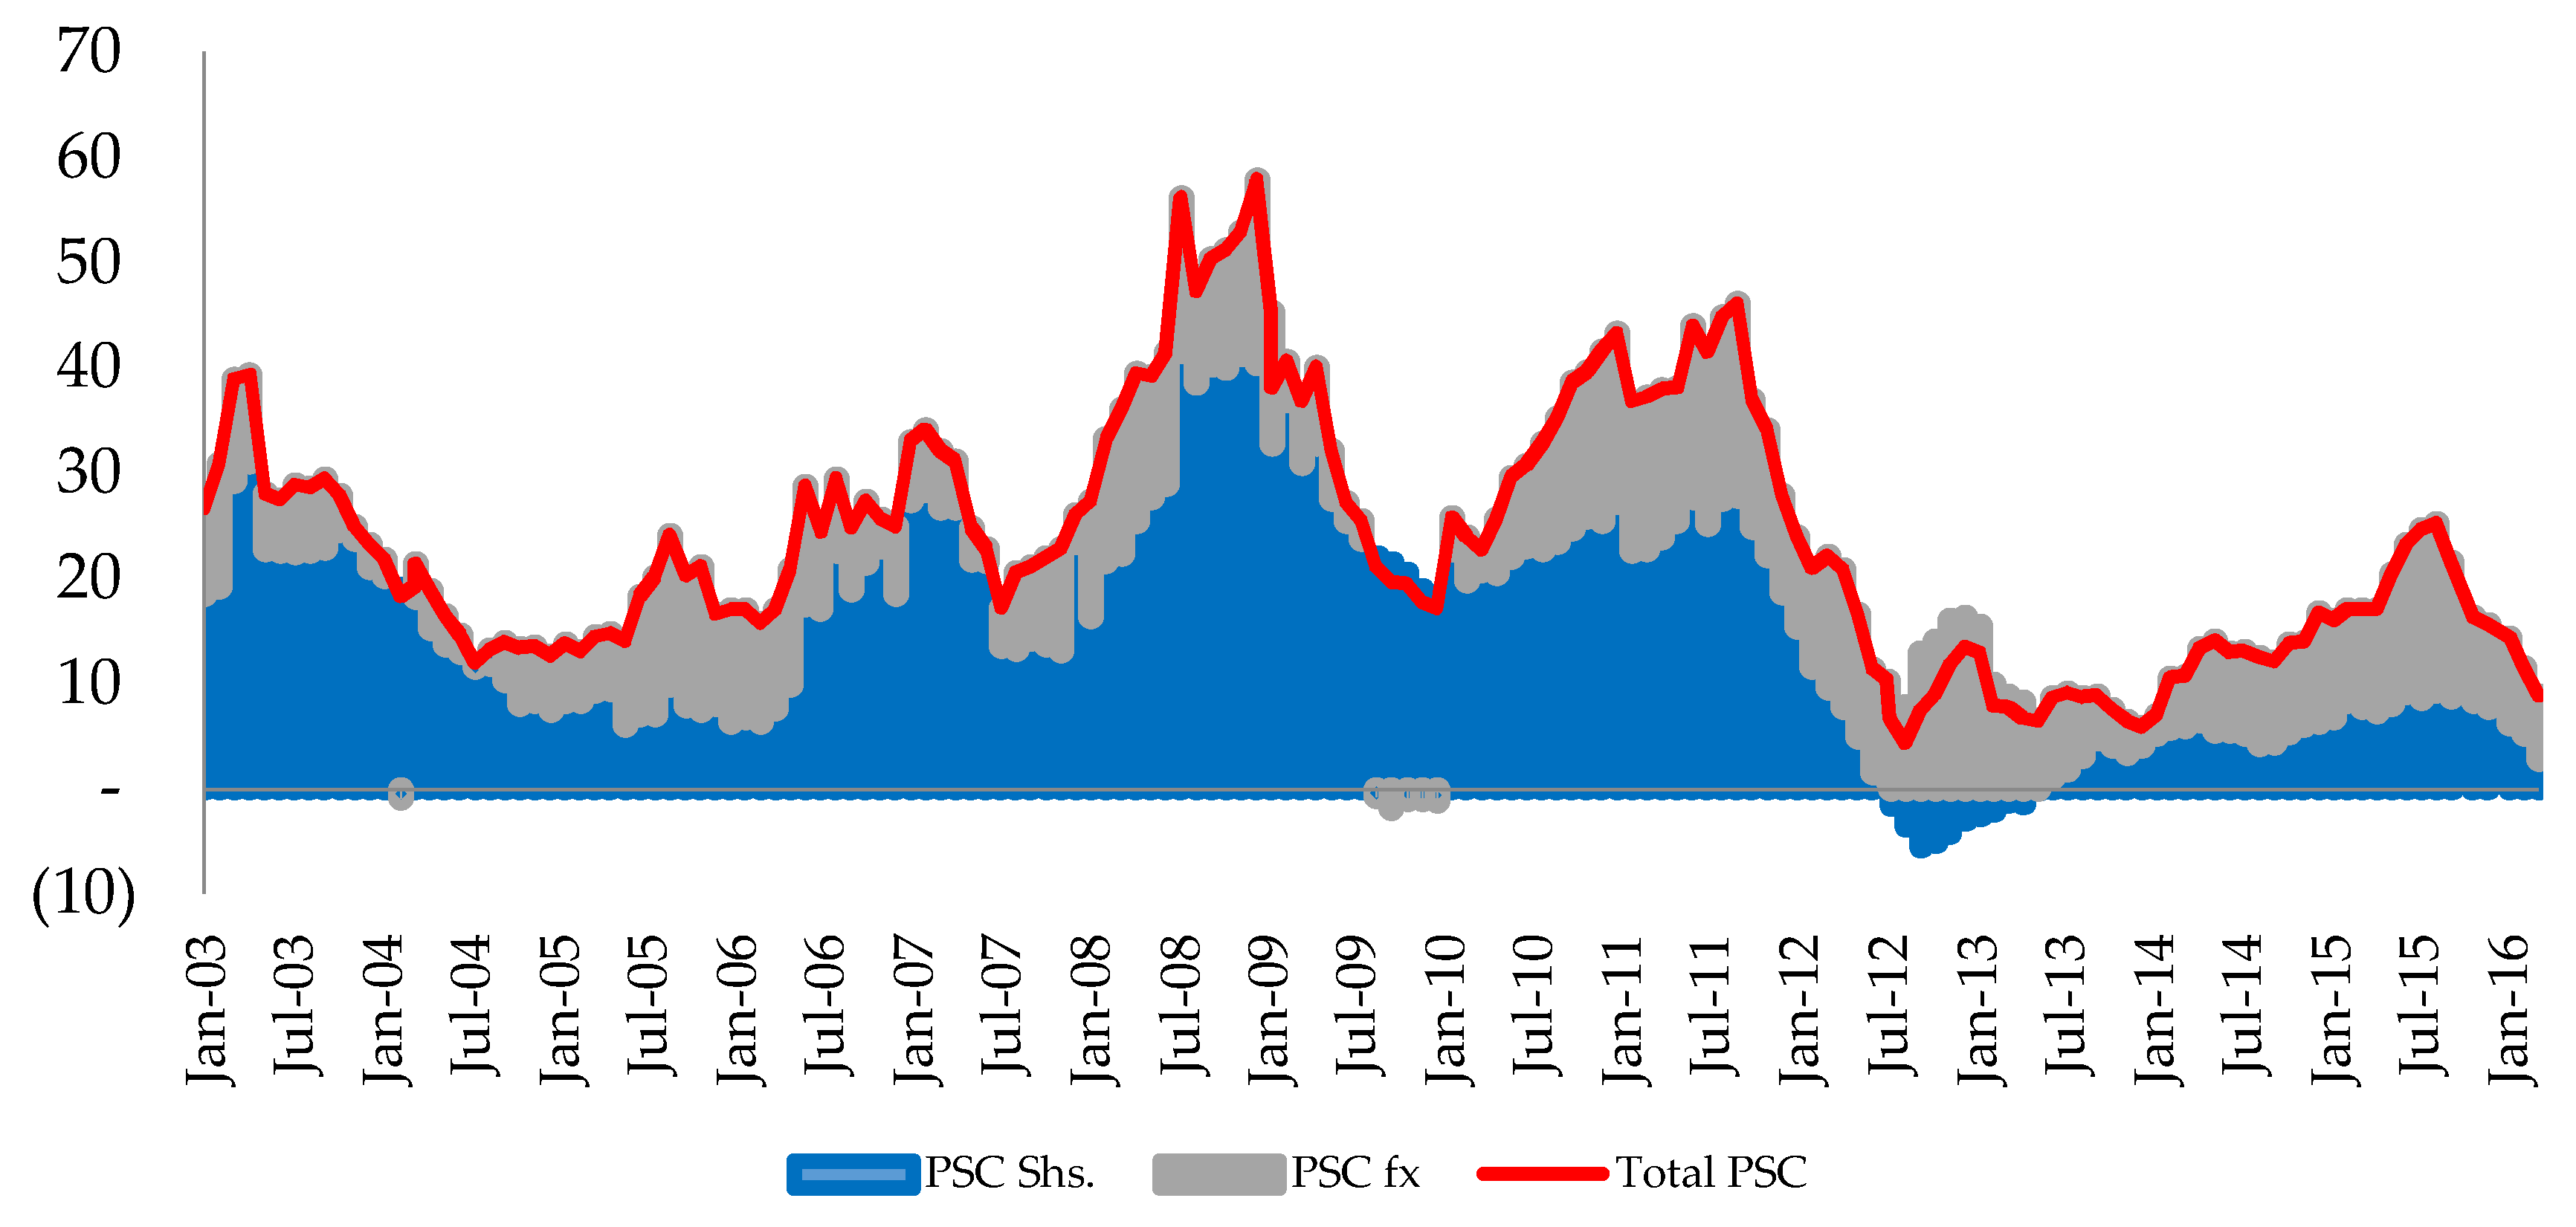
Figure 2.
Plots of private sector credit and selected macroeconomic variables of interest. Source: Bank of Uganda, World Bank Databases, and International Financial Statistics (IFS), Author’s calculations.
Figure 2.
Plots of private sector credit and selected macroeconomic variables of interest. Source: Bank of Uganda, World Bank Databases, and International Financial Statistics (IFS), Author’s calculations.

Table 1.
Descriptive Statistics.
| Variable | Description | Mean | Maximum | Minimum | Std. Dev. |
|---|---|---|---|---|---|
| PSC | Natural log of Total private sector credit | 7.57 | 9.45 | 5.67 | 1.25 |
| TB | 91-day Treasury bill interest rate (%) | 10.07 | 20.35 | 2.97 | 3.75 |
| ER | Natural log of the nominal UGX/USD exchange rate (Average) | 7.55 | 8.21 | 6.83 | 0.36 |
| INF | Inflation (Natural log difference of the domestic consumer price index) | 0.52 | 5.04 | −2.41 | 1.07 |
| FI | Natural log of Financial innovation (M2/M1) | 0.44 | 0.64 | 0.28 | 0.08 |
| INFV1 | GARCH (1,1): Inflation volatility | 1.52 | 6.37 | 0.36 | 1.03 |
| INFV2 | EGARCH (1,1): Inflation volatility | 1.24 | 5.58 | 0.06 | 0.95 |
| INFV3 | TGARCH (1,1): Inflation volatility | 1.50 | 6.77 | 0.35 | 1.11 |
| RGDP | Natural log of Interpolated monthly GDP | 31.05 | 31.76 | 30.29 | 0.43 |
TB: interest rate; ER: exchange rate; INF: inflation; FI: financial innovation; INFV: inflation volatility; RGDP: real gross domestic product.
Table 2.
Results of Unit Root Tests.
| Unit Root Tests | Augmented Dicky–Fuller (ADF) | Phillips–Peron (PP) | Kwiatkowski–Phillips– | Inference | |||
|---|---|---|---|---|---|---|---|
| Schmidt–Shin (KPSS) | |||||||
| Levels | 1st Difference | Levels | 1st Difference | Levels | 1st Difference | ||
| PSC | −0.28 | −18.58 | −0.25 | −18.69 | 1.94 | 0.17 | I(1) |
| TB | −3.72 | −3.82 | 0.16 | I(0) | |||
| ER | −1.06 | −11.72 | −0.91 | −11.50 | 1.72 | 0.13 | I(1) |
| INF | −12.15 | −12.07 | 0.22 | I(0) | |||
| FI | −2.06 | −17.18 | −2.18 | −21.08 | 1.50 | 0.09 | I(1) |
| INFV1 | −2.95 | −3.24 | 1.06 | 0.02 | I(1) | ||
| INFV2 | −1.93 | −12.73 | −4.63 | 1.53 | 0.13 | I(1) | |
| INFV3 | −3.87 | −3.82 | 1.05 | 0.10 | I(1) | ||
| RGDP | −0.16 | −4.05 | −0.90 | −12.31 | 1.95 | 0.16 | I(1) |
Note: The figures in this table are unit-root test statistics. The corresponding critical values for the ADF, PP, and KPSS unit-root tests at the 5% significance level are −2.872, −2.872, and 0.463, respectively.
Table 3.
Results of Inflation volatility models.
| Mean Equation | GARCH (1,1): Inflation Volatility | EGARCH (1,1): Inflation Volatility | TGARCH (1,1): Inflation Volatility |
|---|---|---|---|
| Estimated Coefficients | Estimated Coefficients | Estimated Coefficients | |
| Constant | −0.0078 (−0.13) | 0.1916 (11.19) *** | 0.0695 (1.18) |
| Inflation | −0.3379 (−6.63) *** | −0.3279 (−9.76) *** | −0.3283 (−6.66) *** |
| Variance Equation | |||
| ω (Constant) | 0.0361 (2.09) ** | −0.0973 (−2.44) ** | 0.0388 (2.12) ** |
| α (ARCH) | 0.1417 (4.21) *** | 0.1301 (2.63) *** | 0.2789 (3.89) *** |
| β (GARCH) | 0.8340 (28.95) *** | 0.9858 (368.76) *** | 0.8333 (29.98) *** |
| γ (Asymmetry) | 0.2397 (6.17) *** | −0.2499 (−3.07) *** | |
| Persistence | 0.9757 | 0.9858 | 0.8333 |
| Diagnostic Tests | |||
| ARCH LM Test (F-statistic Probability) | 0.42 | 0.15 | 0.76 |
| Schwarz criterion | 4.15 | 4.20 | 4.14 |
| Hannan–Quinn criterion | 4.12 | 4.16 | 4.11 |
Notes: T-statistics in parentheses. *** and ** indicate statistical significance at the 1% and 5% levels, respectively.
Table 4.
Regression of results.
| Independent Variables | Model 1 | Model 2 | Model 3 |
|---|---|---|---|
| Constant | 0.0198 (2.07) ** | 0.0200 (2.13) ** | 0.0204 (2.17) ** |
| Δ (Natural log of Total private sector credit (−1)) | −0.1587 (−2.64) *** | −0.1677 (−2.77) *** | −0.1658 (−2.73) *** |
| 91-day Treasury bill rate | −0.0008 (−1.27) | −0.0008 (−1.21) | −0.0008 (−1.31) |
| Δ (Natural log of the nominal UGX/USD exchange rate (Average)) | 0.3376 (3.32) *** | 0.3582 (3.49) *** | 0.3581 (3.52) *** |
| Inflation | −0.0052 (−2.40) ** | −0.0061 (−2.73) *** | −0.0056 (−2.56) ** |
| Δ (GARCH (1,1): Inflation volatility) | −0.0036 (−0.55) | ||
| Δ (GARCH (1,1): Inflation volatility (−1)) | 0.0073 (1.10) | ||
| Δ (EGARCH (1,1): Inflation volatility) | −0.0006 (−0.10) | ||
| Δ (EGARCH (1,1): Inflation volatility (−1)) | 0.0161 (3.18) *** | ||
| Δ (TGARCH (1,1): Inflation volatility) | −0.0012 (−0.24) | ||
| Δ (TGARCH (1,1): Inflation volatility (−1)) | 0.0127 (2.76) *** | ||
| Δ (Natural log of Financial innovation (M2/M1)) | 0.1463 (1.41) | 0.1428 (1.41) | 0.1397 (1.37) |
| Δ (Natural log of Interpolated monthly GDP) | 0.9747 (1.08) | 0.9411 (1.06) | 0.9315 (1.05) |
| Model Diagnostics | |||
| Adjusted R-squared | 0.06 | 0.09 | 0.08 |
| p-value for F-statistic | 0.00 | 0.00 | 0.00 |
| p-value for Q statistic | 0.24 | 0.15 | 0.15 |
| Breush–Godfrey Serial Correlation Test | 0.58 | 0.63 | 0.80 |
| ARCH LM Test (F-statistic Probability) | 0.94 | 0.94 | 0.91 |
| Schwarz criterion | −3.60 | −3.63 | −3.62 |
| Hannan–Quinn criter | −3.67 | −3.70 | −3.69 |
Notes: This table presents the ordinary least squares (OLS) regression results with t-statistics in parentheses. The analysis is based on data from January 1995 to December 2017. The natural log of total private sector credit is used as the dependent variable. Q statistic denotes the Ljung–Box test statistic of order 10. *** and ** indicate statistical significance at the 1% and 5% levels, respectively.
© 2018 by the author. Licensee MDPI, Basel, Switzerland. This article is an open access article distributed under the terms and conditions of the Creative Commons Attribution (CC BY) license (http://creativecommons.org/licenses/by/4.0/).
Share and Cite
MDPI and ACS Style
Katusiime, L. Private Sector Credit and Inflation Volatility. Economies 2018, 6, 28. https://doi.org/10.3390/economies6020028
AMA Style
Katusiime L. Private Sector Credit and Inflation Volatility. Economies. 2018; 6(2):28. https://doi.org/10.3390/economies6020028
Chicago/Turabian StyleKatusiime, Lorna. 2018. "Private Sector Credit and Inflation Volatility" Economies 6, no. 2: 28. https://doi.org/10.3390/economies6020028
Note that from the first issue of 2016, this journal uses article numbers instead of page numbers. See further details here.