Dietary Intake Is Related to Multifactor Cardiovascular Risk Score in Obese Boys

 ,
,  ,
, 
 , ,
, ,
Abstract
:
1. Introduction
2. Experimental Section
2.1. Anthropometry and Serum Sampling
2.2. HIKCUPS CVD Risk Score

| Age | 7 Years | 8 Years | 9 Years | 10 Years | 11 Years | ||||||||||
|---|---|---|---|---|---|---|---|---|---|---|---|---|---|---|---|
| Percentile | 90 | 95 | 97.5 | 90 | 95 | 97.5 | 90 | 95 | 97.5 | 90 | 95 | 97.5 | 90 | 95 | 97.5 |
| Boys | |||||||||||||||
| BMI * | 17.7 | 18.8 | 19.5 | 18.3 | 19.7 | 20.9 | 20.4 | 22.3 | 23.1 | 20.1 | 22 | 23.1 | 21.7 | 23 | 25 |
| WC | 61.4 | 63.6 | 65.5 | 63.7 | 66 | 68.1 | 66 | 68.5 | 70.8 | 68.4 | 71.1 | 73.6 | 70.9 | 73.7 | 76.4 |
| Systolic BP | 114 | 118 | 122 | 116 | 120 | 124 | 118 | 123 | 127 | 121 | 125 | 129 | 124 | 128 | 132 |
| Diastolic BP | 70 | 73 | 75 | 71 | 74 | 76 | 71 | 74 | 77 | 72 | 75 | 78 | 73 | 76 | 79 |
| F. glucose | 4.87 | 5 | 5.11 | 4.96 | 5.09 | 5.21 | 5.04 | 5.17 | 5.3 | 5.11 | 5.24 | 5.37 | 5.16 | 5.3 | 5.42 |
| Insulin | 5.99 | 7.05 | 8.09 | 7.16 | 8.45 | 9.73 | 8.47 | 10 | 11.6 | 9.88 | 11.8 | 13.6 | 11.3 | 13.5 | 15.7 |
| Total chol | 5.5 | 5.84 | 6.15 | 5.52 | 5.85 | 6.15 | 5.53 | 5.85 | 6.14 | 5.51 | 5.83 | 6.11 | 5.47 | 5.78 | 6.06 |
| LDL | 3.79 | 4.07 | 4.33 | 3.75 | 4.03 | 4.29 | 3.7 | 3.99 | 4.24 | 3.66 | 3.94 | 4.2 | 3.62 | 3.9 | 4.15 |
| HDL | 1.94 | 2.07 | 2.19 | 1.95 | 2.08 | 2.2 | 1.95 | 2.08 | 2.2 | 1.94 | 2.07 | 2.18 | 1.91 | 2.03 | 2.15 |
| Triglycerides | 0.72 | 0.81 | 0.91 | 0.8 | 0.91 | 1.03 | 0.87 | 1.01 | 1.15 | 0.94 | 1.1 | 1.27 | 1.01 | 1.19 | 1.38 |
| Girls | |||||||||||||||
| BMI | 17.8 | 19.2 | 20 | 18.9 | 19.9 | 21.6 | 20.1 | 22.9 | 24.3 | 21 | 23.2 | 23.8 | 22.4 | 24.7 | 27 |
| WC | 61.2 | 63.6 | 66 | 63.9 | 66.6 | 69.2 | 66.5 | 69.4 | 72.2 | 68.9 | 72 | 75 | 71.1 | 74.4 | 77.6 |
| Systolic BP | 112 | 116 | 120 | 115 | 118 | 122 | 117 | 121 | 124 | 119 | 123 | 127 | 121 | 125 | 129 |
| Diastolic BP | 70 | 73 | 75 | 71 | 74 | 76 | 71 | 74 | 77 | 72 | 75 | 78 | 73 | 76 | 79 |
| F. glucose | 4.81 | 4.97 | 5.11 | 4.88 | 5.04 | 5.18 | 4.96 | 5.11 | 5.24 | 5.03 | 5.17 | 5.3 | 5.08 | 5.22 | 5.34 |
| Insulin | 7.59 | 9.18 | 10.8 | 8.55 | 10.2 | 12 | 9.67 | 11.5 | 13.4 | 11.1 | 13.1 | 15.2 | 13 | 15.3 | 17.7 |
| Total chol. | 5.77 | 6.15 | 6.5 | 5.67 | 6.05 | 6.39 | 5.58 | 5.95 | 6.29 | 5.51 | 5.87 | 6.2 | 5.45 | 5.8 | 6.13 |
| LDL | 4.1 | 4.47 | 4.82 | 3.98 | 4.34 | 4.69 | 3.88 | 4.23 | 4.56 | 3.78 | 4.13 | 4.46 | 3.71 | 4.05 | 4.37 |
| HDL | 1.78 | 1.9 | 2.02 | 1.82 | 1.94 | 2.06 | 1.82 | 1.95 | 2.07 | 1.82 | 1.94 | 2.06 | 1.8 | 1.93 | 2.04 |
| Triglycerides | 0.84 | 0.95 | 1.07 | 0.92 | 1.06 | 1.19 | 1.00 | 1.15 | 1.29 | 1.07 | 1.23 | 1.38 | 1.13 | 1.3 | 1.47 |
| Percentile | 10 | 5 | 2.5 | 10 | 5 | 2.5 | 10 | 5 | 2.5 | 10 | 5 | 2.5 | 10 | 5 | 2.5 |
| Boys | |||||||||||||||
| HDL | 1.23 | 1.15 | 1.09 | 1.23 | 1.16 | 1.09 | 1.23 | 1.16 | 1.09 | 1.23 | 1.15 | 1.09 | 1.21 | 1.13 | 1.07 |
| Girls | |||||||||||||||
| HDL | 1.11 | 1.03 | 0.98 | 1.13 | 1.05 | 1 | 1.13 | 1.06 | 1 | 1.13 | 1.06 | 1 | 1.12 | 1.05 | 0.99 |
2.3. Dietary Intake
2.4. Statistical Analysis
3. Results and Discussion
| Variables | Boys (n = 44) * | Girls (n = 44) * | Total (n = 112) * |
|---|---|---|---|
| Age (years) | 8.89 ± 0.8 | 8.53 ± 0.9 | 8.7 ± 0.84 |
| BMI (kg/m2) | 25.48 ± 3.5 | 25.04 ± 4.0 | 25.20 ± 3.8 |
| WC (cm) | 80.50 ± 9.1 | 76.68 ± 9.4 | 78.18 ± 9.4 |
| Systolic BP (mmHg) | 100.65 ± 9.3 | 99.08 ± 8.6 | 99.65 ± 8.9 |
| Diastolic BP (mmHg) | 57.32 ± 6.0 | 55.92 ± 5.5 | 56.47 ± 5.7 |
| Fasting glucose (mmol/L) | 4.22 ± 0.4 | 4.19 ± 0.5 | 4.2 ± 0.5 |
| Insulin (mIU/L) | 11.63 ± 7.0 | 12.05 ± 8.2 | 11.88 ± 7.7 |
| Total Cholesterol (mmol/L) | 4.25 ± 0.6 | 4.37 ± 0.7 | 4.32 ± 0.7 |
| LDL (mmol/L) | 2.44 ± 0.6 | 2.61 ± 0.6 | 2.54 ± 0.6 |
| HDL (mmol/L) | 1.28 ± 0.3 | 1.25 ± 0.3 | 1.27 ± 0.3 |
| TG (mmol/L) | 1.15 ± 0.6 | 1.11 ± 0.6 | 1.12 ± 0.6 |
| CVD risk factor | Threshold Risk (<90th) | Moderate Risk (90th–95th) | High Risk (95th–97.5th) | Very High Risk (≥97.5th) |
|---|---|---|---|---|
| Boys | ||||
| BMI | 6 (5.0%) | 13 (10.7%) | 13 (10.7%) | 89 (73.6%) |
| Waist circumference | 5 (4.1%) | 8 (6.6%) | 9 (7.4%) | 99 (81.8%) |
| Systolic BP | 117 (96.7%) | 4 (3.3%) | 0 (0.0%) | 0 (0.0%) |
| Diastolic BP | 120 (99.2%) | 0 (0.0%) | 0 (0.0%) | 1 (0.8%) |
| Fasting glucose | 119 (98.3%) | 1 (0.8%) | 0 (0.0%) | 1 (0.8%) |
| Insulin | 54 (44.6%) | 17 (14.0%) | 13 (10.7%) | 37 (30.6%) |
| Total cholesterol | 120 (99.2%) | 1 (0.8%) | 0 (0.0%) | 0 (0.0%) |
| LDL | 117 (96.7%) | 3 (2.5%) | 0 (0.0%) | 1 (0.8%) |
| Triglycerides | 59 (48.8%) | 14 (11.6%) | 9 (7.4%) | 39 (32.2%) |
| 10th–90th | 5th–10th | 2.5th–5th | ≤2.5th | |
| HDL | 70 (57.9%) | 24 (19.8%) | 5 (4.1%) | 19 (15.7%) |
| 90–95th | 95th–97.5th | ≥97.5th | ||
| HDL (protective) | 1 (0.8%) | 2 (1.7%) | 0 (0.0%) | |
| Girls | ||||
| BMI | 9 (5.5%) | 30 (18.3%) | 31 (18.9%) | 94 (57.3%) |
| Waist circumference | 20 (12.2%) | 14 (8.5%) | 22 (13.4%) | 108 (65.9%) |
| Systolic BP | 161 (98.2%) | 2 (1.2%) | 0 (0.0%) | 1 (0.6%) |
| Diastolic BP | 163 (99.4%) | 0 (0.0%) | 1 (0.6%) | 0 (0.0%) |
| Fasting glucose | 158 (96.3%) | 2 (1.2%) | 0 (0.0%) | 4 (2.4%) |
| Insulin | 82 (50.0%) | 24 (14.6%) | 7 (4.3%) | 51 (31.1%) |
| Total cholesterol | 159 (97.0%) | 1 (0.6%) | 1 (0.6%) | 3 (1.8%) |
| LDL | 155 (94.5%) | 4 (2.4%) | 1 (0.6%) | 4 (2.4%) |
| Triglycerides | 86 (52.4%) | 19 (11.6%) | 9 (5.5%) | 50 (30.5%) |
| 10th–90th | 5th–10th | 2.5th–5th | ≤2.5th | |
| HDL | 113 (68.9%) | 17 (10.4%) | 7 (4.3%) | 23 (14.0%) |
| 90th–95th | 95th–97.5th | ≥97.5th | ||
| HDL (protective) | 4 (2.4%) | 0 (0.0%) | 0 (0.0%) | |
| Diet Measure | Low risk (CVD Score < 9) | High risk (CVD Score ≥ 9) | p-value | |||
|---|---|---|---|---|---|---|
| Boys | Girls | Boys | Girls | Boys | Girls | |
| n = 60 (49.9%) | n = 89 (54.3%) | n = 61 (50.1%) | n = 75 (45.7%) | |||
| Median (IQR) | Median (IQR) | |||||
| Sugars (×100 g) | 1.65 (1.3–2.0) | 1.64 (1.3–2.2) | 2.10 (1.6–2.7) | 1.67 (1.4–2.1) | <0.001 | 0.629 |
| Energy (×1000 kJ) | 9.87 (8.5–11.0) | 9.82 (7.5–11.6) | 11.45 (9.2–13.8) | 9.72 (8.0–11.5) | 0.004 | 0.936 |
| Protein (×10 g) | 9.30 (7.8–10.6) | 9.06 (8.0–11.3) | 10.68 (8.1–13.3) | 8.98 (7.1–11.5) | 0.018 | 0.493 |
| Carbohydrate (×100 g) | 3.24 (2.6–3.7) | 2.97 (2.5–3.7) | 3.63 (3.0–4.5) | 3.04 (2.7–3.6) | 0.004 | 0.936 |
| Total Fat (×100 g) | 0.74 (0.6–0.9) | 0.74 (0.5–0.9) | 0.84 (0.6–1.1) | 0.71 (0.5–0.9) | 0.047 | 0.941 |
| Saturated fat (×10 g) | 3.24 (2.5–3.9) | 3.18 (2.2–4.1) | 3.49 (2.8–4.8) | 3.00 (2.3–3.8) | 0.099 | 0.803 |
| Monounsaturated fat (×10 g) | 2.59 (2.2–3.1) | 2.61 (1.9–3.2) | 2.84 (2.3–3.7) | 2.60 (1.9–3.4) | 0.048 | 0.986 |
| Polyunsaturated fat (×1 g) | 8.44 (7.3–11.0) | 8.71 (6.6–11.4) | 10.23 (8.6–12.3) | 8.43 (6.9–11.2) | 0.015 | 0.829 |
| Sodium (×1000 mg) | 2.03 (1.6–2.3) | 1.92 (1.6–2.5) | 2.24 (1.8–2.7) | 1.98 (1.5–2.5) | 0.017 | 0.901 |
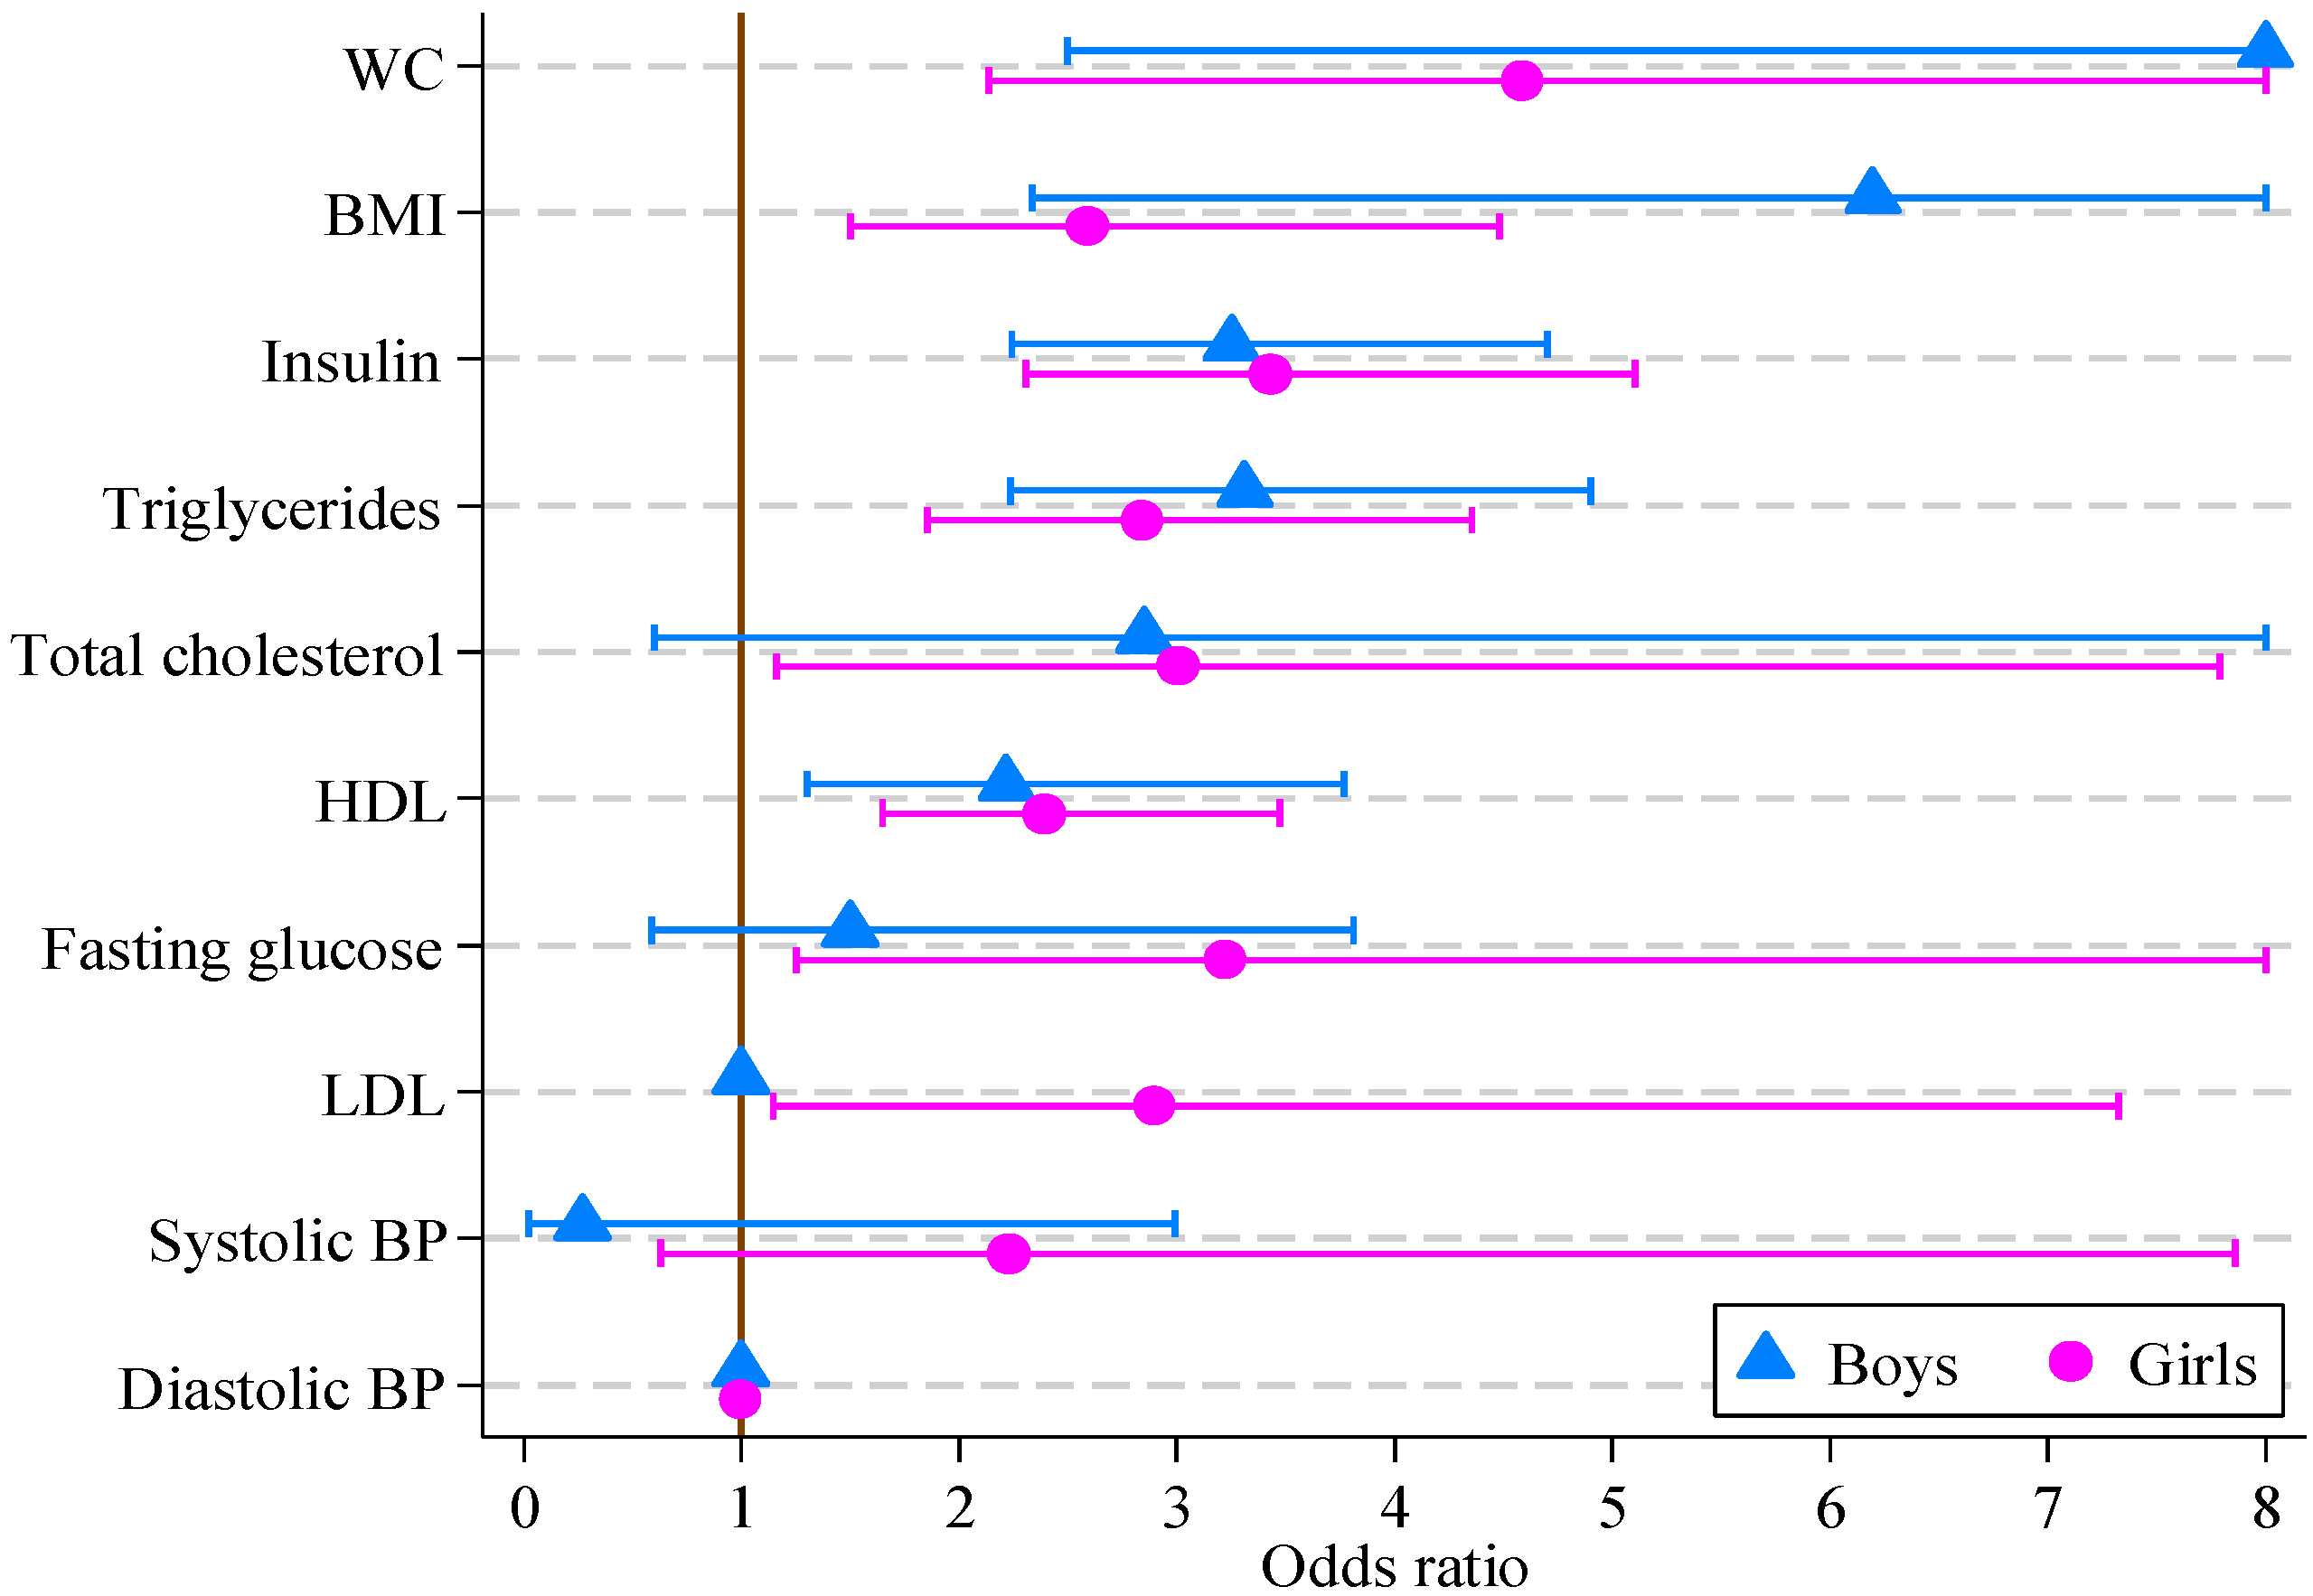
| CVD Risk Score Factor | Boys (n = 121) | Girls (n = 164) | ||||
|---|---|---|---|---|---|---|
| Odds Ratio | 95% CI | p-Value | Odds Ratio | 95% CI | p-Value | |
| BMI (kg/m2) | 6.20 e | 2.33, 16.46 | <0.001 | 2.59 | 1.50, 4.48 | 0.001 |
| Waist circ. (cm) | 14.01 e | 2.50, 78.49 | 0.003 | 4.59 | 2.14, 9.83 | <0.001 |
| Systolic BP (mmHg) | 0.27 e | 0.02, 2.99 | 0.286 | 2.23 | 0.63, 7.86 | 0.213 |
| Diastolic BP (mmHg) | 1.00 | 1.00, 1.00 | 1.000 | 1.00 | 1.00, 1.00 | 1.000 |
| Fasting glucose (mmol/L) | 1.50 e | 0.59, 3.81 | 0.395 | 3.23 | 1.25, 8.30 | 0.015 |
| Insulin (mIU/L) | 3.25 e | 2.25, 4.71 | <0.001 | 3.43 | 2.31, 5.10 | <0.001 |
| Total cholesterol (mmol/L) | 2.85 e | 0.61, 13.40 | 0.185 | 3.01 | 1.16, 7.79 | 0.023 |
| LDL (mmol/L) | 1.00 | 1.00, 1.00 | 1.000 | 2.90 | 1.15, 7.32 | 0.024 |
| HDL (mmol/L) | 2.22 e | 1.30, 3.77 | <0.001 | 2.39 | 1.65, 3.47 | <0.001 |
| Triglycerides (mmol/L) | 3.31 | 2.24, 4.90 | <0.001 | 2.84 | 1.85, 4.35 | <0.001 |

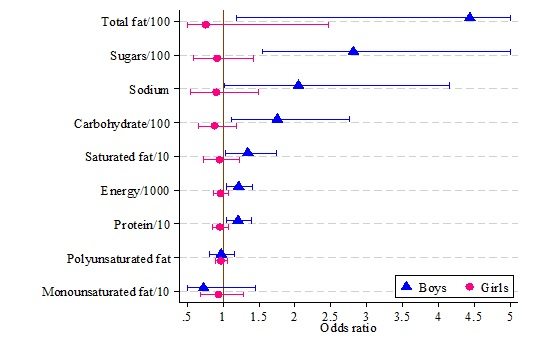
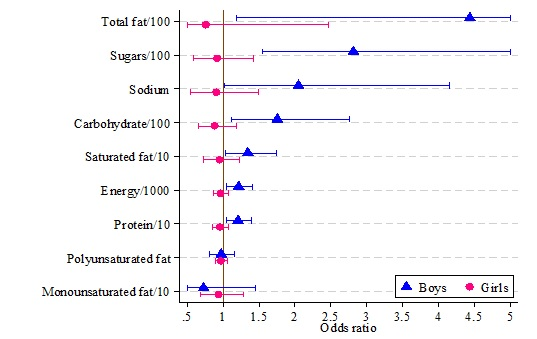
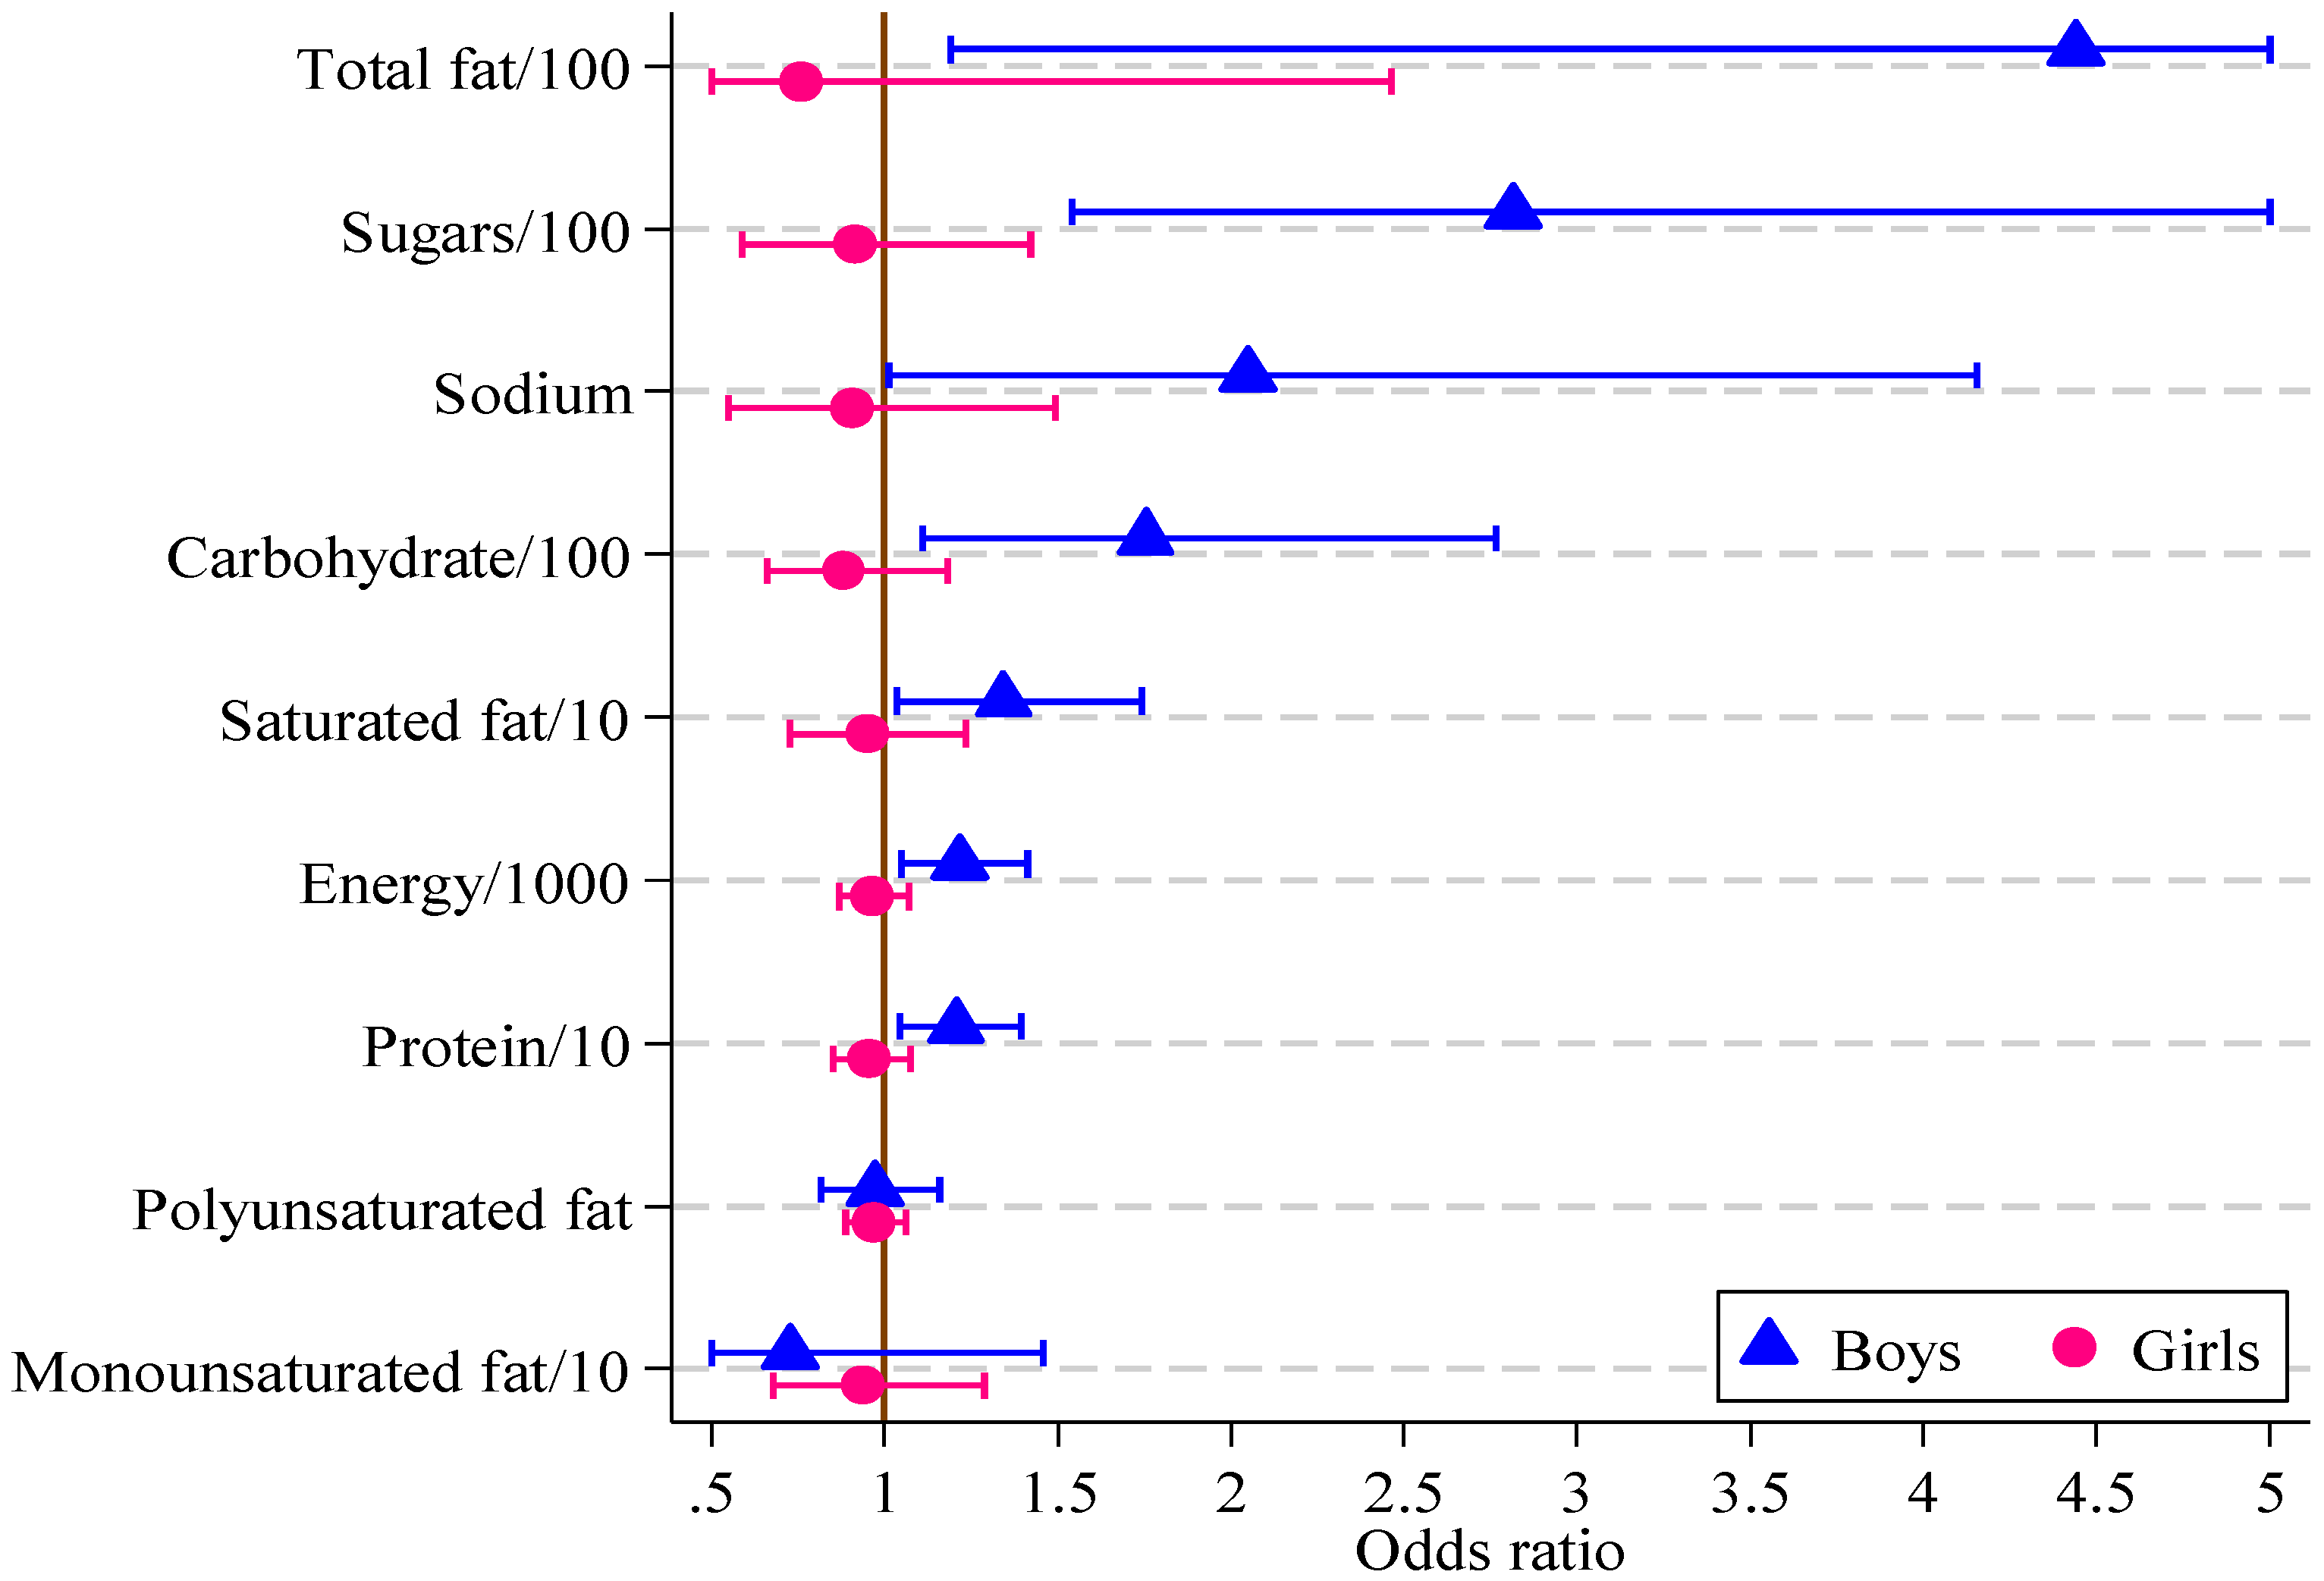
| Diet Measure | Boys (n = 121) | Girls (n = 164) | ||||
|---|---|---|---|---|---|---|
| Odds Ratio | 95% CI | p-Value | Odds Ratio | 95% CI | p-Value | |
| Sugars/100 (g) | 2.82 | 1.54, 5.15 | 0.001 | 0.92 | 0.59, 1.42 | 0.696 |
| Energy/1000 (kJ) | 1.22 | 1.05, 1.41 | 0.010 | 0.96 | 0.87, 1.07 | 0.479 |
| Protein/10 (g) | 1.21 | 1.04, 1.39 | 0.011 | 0.95 | 0.85, 1.07 | 0.435 |
| Carbohydrate/100 (g) | 1.75 | 1.11, 2.77 | 0.016 | 0.88 | 0.66, 1.18 | 0.400 |
| Total Fat/100 (g) | 4.44 | 1.19, 16.60 | 0.027 | 0.76 | 0.23, 2.46 | 0.646 |
| Saturated fat/10 (g) | 1.34 | 1.03, 1.74 | 0.027 | 0.95 | 0.73, 1.23 | 0.690 |
| Monounsaturated fat/10 (g) | 0.73 e | 0.36, 1.46 | 0.366 | 0.93 | 0.68, 1.29 | 0.678 |
| Polyunsaturated fat (g) | 0.76 e | 0.13, 4.34 | 0.761 | 0.73 | 0.30, 1.80 | 0.493 |
| Sodium/1000 (mg) | 2.05 | 1.01, 4.15 | 0.047 | 0.90 | 0.55, 1.49 | 0.694 |
4. Conclusions
Acknowledgments
Author Contributions
Conflicts of Interest
References
- Global Atlas on Cardiovascular Disease Prevention and Control. Available online: http://whqlibdoc.who.int/publications/2011/9789241564373_eng.pdf?ua=1 (accessed on 17 September 2013).
- Francis, A.A.; Pierce, G.N. An integrated approach for the mechanisms responsible for atherosclerotic plaque regression. Exp. Clin. Cardiol. 2011, 16, 77–86. [Google Scholar]
- International Obesity Taskforce Obesity the Global Epidemic. Available online: http://www.iaso.org/iotf/obesity/obesitytheglobalepidemic/ (accessed on 12 September 2013).
- Whitaker, R.C.; Wright, J.A.; Pepe, M.S.; Seidel, K.D.; Dietz, W.H. Predicting obesity in young adulthood from childhood and parental obesity. N. Engl. J. Med. 1997, 337, 869–873. [Google Scholar] [CrossRef]
- Galcheva, S.V.; Iotova, V.M.; Yotov, Y.T.; Bernasconi, S.; Street, M.E. Circulating proinflammatory peptides related to abdominal adiposity and cardiometabolic risk factors in healthy prepubertal children. Eur. J. Endocrinol. 2011, 164, 553–558. [Google Scholar] [CrossRef]
- Von Schnurbein, J.; Klenk, J.; Galm, C.; Berg, S.; Gottmann, P.; Steinacker, J.M.; Kratzer, W.; Brandstetter, S.; Wartha, O.; Peter, R.; et al. Reference values and early determinants of intra-abdominal fat mass in primary school children. Horm. Res. Paediatr. 2011, 75, 412–422. [Google Scholar] [CrossRef]
- Reinehr, T.; Wunsch, R. Relationships between cardiovascular risk profile, ultrasonographic measurement of intra-abdominal adipose tissue, and waist circumference in obese children. Clin. Nutr. 2010, 29, 24–30. [Google Scholar] [CrossRef]
- Juonala, M.; Magnussen, C.G.; Berenson, G.S.; Venn, A.; Burns, T.L.; Sabin, M.A.; Srinivasan, S.R.; Daniels, S.R.; Davis, P.H.; Chen, W.; et al. Childhood adiposity, adult adiposity, and cardiovascular risk factors. N. Engl. J. Med. 2011, 365, 1876–1885. [Google Scholar] [CrossRef]
- Huang, T.T.K.; Ball, G.D.C.; Franks, P.W. Metabolic syndrome in youth: Current issues and challenges. Appl. Physiol. Nutr. Metab. 2007, 32, 13–22. [Google Scholar] [CrossRef]
- Raitakari, O.T.; Porkka, K.V.; Viikari, J.S.; Ronnemaa, T.; Akerblom, H.K. Clustering of risk factors for coronary heart disease in children and adolescents. The cardiovascular risk in young finns study. Acta Paediatr. 1994, 83, 935–940. [Google Scholar] [CrossRef]
- Reinehr, T.; de Sousa, G.; Toschke, A.M.; Andler, W. Long-term follow-up of cardiovascular disease risk factors in children after an obesity intervention. Am. J. Clin. Nutr. 2006, 84, 490–496. [Google Scholar]
- Freedman, D.S.; Serdula, M.K.; Srinivasan, S.R.; Berenson, G.S. Relation of circumferences and skinfold thicknesses to lipid and insulin concentrations in children and adolescents: The bogalusa heart study. Am. J. Clin. Nutr. 1999, 69, 308–317. [Google Scholar]
- I’Allemand, D.; Wiegand, S.; Reinehr, T.; Muller, J.; Wabitsch, M.; Widhalm, K.; Holl, R.; Grp, A.P.V.S. Cardiovascular risk in 26,008 european overweight children as established by a multicenter database. Obesity 2008, 16, 1672–1679. [Google Scholar] [CrossRef]
- Flechtner-Mors, M.; Thamm, M.; Wiegand, S.; Reinehr, T.; Schwab, K.O.; Kiess, W.; Widhalm, K.; Holl, R.W. APV Initiative and the BMBF Competence Network Obesity. Comorbidities related to BMI category in children and adolescents: German/aAustrian/Swiss obesity register apv compared to the German kiggs study. Horm. Res. Paediatr. 2012, 77, 19–26. [Google Scholar] [CrossRef]
- Mosca, L.; Benjamin, E.J.; Berra, K.; Bezanson, J.L.; Dolor, R.J.; Lloyd-Jones, D.M.; Newby, L.K.; Piña, I.L.; Roger, V.L.; Shaw, L.J.; et al. Effectiveness-based guidelines for the prevention of cardiovascular disease in women—2011 update: A guideline from the american heart association. Circulation 2011, 123, 1243–1262. [Google Scholar] [CrossRef]
- National Cholesterol Education Program (NCEP) Expert Panel on Detection, Evaluation, and Treatment of High Blood Cholesterol in Adults (Adult Treatment Panel III). Third report of the national cholesterol education program (ncep) expert panel on detection, evaluation, and treatment of high blood cholesterol in adults (adult treatment panel III) final report. Circulation 2002, 106, 3143–3421. [Google Scholar]
- Cook, S.; Auinger, P.; Huang, T.T.K. Growth curves for cardio-metabolic risk factors in children and adolescents. J. Pediatr. 2009, 155, e15–e26. [Google Scholar]
- Mellerio, H.; Alberti, C.; Druet, C.; Capelier, F.; Mercat, I.; Josserand, E.; Vol, S.; Tichet, J.; Levy-Marchal, C. Novel modeling of reference values of cardiovascular risk factors in children aged 7 to 20 years. Pediatrics 2012, 129, e1020–e1029. [Google Scholar] [CrossRef]
- Framingham Heart Study Cardiovascular disease (30 year risk). Available online: http://www.framinghamheartstudy.org/risk/cardiovascular30.html/ (accessed on 17 September 2013).
- Reed, K.E.; Warburton, D.E.R.; McKay, H.A. Determining cardiovascular disease risk in elementary school children: Developing a healthy heart score. J. Sports Sci. Med. 2007, 6, 142–148. [Google Scholar]
- Okely, A.D.; Collins, C.E.; Morgan, P.J.; Jones, R.A.; Warren, J.M.; Cliff, D.P.; Burrows, T.L.; Colyvas, K.; Steele, J.R.; Baur, L.A. Multi-site randomized controlled trial of a child-centered physical activity program, a parent-centered dietary-modification program, or both in overweight children: The hikcups study. J. Pediatr. 2010, 157, 388–394. [Google Scholar]
- Jones, R.A.; Okely, A.D.; Collins, C.E.; Morgan, P.J.; Steele, J.R.; Warren, J.M.; Baur, L.A.; Cliff, D.P.; Burrows, T.; Cleary, J. The hikcups trial: A multi-site randomized controlled trial of a combined physical activity skill-development and dietary modification program in overweight and obese children. BMC Public Health 2007, 7, 15. [Google Scholar] [CrossRef]
- Collins, C.E.; Okely, A.D.; Morgan, P.J.; Jones, R.A.; Burrows, T.L.; Cliff, D.P.; Colyvas, K.; Warren, J.M.; Steele, J.R.; Baur, L.A. Parent diet modification, child activity, or both in obese children: An rct. Pediatrics 2011, 127, 619–627. [Google Scholar] [CrossRef]
- Burrows, T.; Warren, J.M.; Baur, L.A.; Collins, C.E. Impact of a child obesity intervention on dietary intake and behaviors. Int. J. Obes. (Lond.) 2008, 32, 1481–1488. [Google Scholar] [CrossRef]
- Burrows, T.; Warren, J.M.; Collins, C.E. The impact of a child obesity treatment intervention on parent child-feeding practices. Int. J. Pediatr. Obes. 2010, 5, 43–50. [Google Scholar] [CrossRef]
- Marfell-Jones, M.; Olds, T.; Steward, A.; Carter, L. International Standards for Anthropometric Assessment; International Society for the Advancement of Kinanthropometry: Potchefstroom, South Africa, 2006. [Google Scholar]
- Berenson, G.S.; Srnivasan, S.R.; Bogalusa Heart Study Group. Cardiovascular risk factors in youth with implications for aging: The bogalusa heart study. Neurobiol. Aging 2005, 26, 303–307. [Google Scholar] [CrossRef]
- Nguyen, Q.M.; Srinivasan, S.R.; Xu, J.-H.; Chen, W.; Kieltyka, L.; Berenson, G.S. Utility of childhood glucose homeostasis variables in predicting adult diabetes and related cardiometabolic risk factors: The bogalusa heart study. Diabetes Care 2010, 33, 670–675. [Google Scholar] [CrossRef]
- Mattsson, N.; Ronnemaa, T.; Juonala, M.; Viikari, J.S.A.; Raitakari, O.T. Childhood predictors of the metabolic syndrome in adulthood. The cardiovascular risk in young finns study. Ann. Med. 2008, 40, 542–552. [Google Scholar] [CrossRef]
- The IDF Consensus Definition of the Metabolic Syndrome in Children and Adolescents. International Diabetes Federation: Brussels, Belgium, 2007. Available online: http://www.idf.org/webdata/docs/Mets_definition_children.pdf (accessed on 17 September 2013).
- National Heart, Lung, and Blood Institute. Expert panel on integrated guidelines for cardiovascular health and risk reduction in children and adolescents: Summary report. Pediatrics 2011, 128, S213–S256. [Google Scholar] [CrossRef]
- Bergmann, G.G.; Gaya, A.; Halpern, R.; Bergmann, M.L.A.; Rech, R.R.; Constanzi, C.B.; Alli, L.R. Waist circumference as screening instrument for cardiovascular disease risk factors in schoolchildren. J. Pediatria 2010, 86, 411–416. [Google Scholar] [CrossRef]
- Kuczmarski, R.; Ogden, C.; Guo, S. 2000 cdc Growth Charts for the United States: Methods and Development; National Center for Health Statistics: Washington, DC, USA, 2002; Volume 11. [Google Scholar]
- Watson, J.F.; Collins, C.E.; Sibbritt, D.W.; Dibley, M.J.; Garg, M.L. Reproducibility and comparative validity of a food frequency questionnaire for Australian children and adolescents. Int. J. Behav. Nutr. Phys. Act. 2009, 6, 17. [Google Scholar] [CrossRef]
- Burrows, T.L.; Warren, J.M.; Colyvas, K.; Garg, M.L.; Collins, C.E. Validation of overweight children’s fruit and vegetable intake using plasma carotenoids. Obesity 2009, 17, 162–168. [Google Scholar] [CrossRef]
- Burrows, T.; Berthon, B.; Garg, M.L.; Collins, C.E. A comparative validation of a child food frequency questionnaire using red blood cell membrane fatty acids. Eur. J. Clin. Nutr. 2012, 66, 825–829. [Google Scholar] [CrossRef]
- Burrows, T.; Janet, W.M.; Collins, C.E. Long-term changes in food consumption trends in overweight children in the hikcups intervention. J. Pediatr. Gastroenterol. Nutr. 2011, 53, 543–547. [Google Scholar]
- Foodworks, Xyris Software: Kenmore Hills, QLD, Australia, 2005.
- Stata Statistical Software, Version 12.1; StataCorp: College Station, TX, USA, 2012.
- Burke, V.; Beilin, L.J.; Simmer, K.; Oddy, W.H.; Blake, K.V.; Doherty, D.; Kendall, G.E.; Newnham, J.P.; Landau, L.I.; Stanley, F.J. Predictors of body mass index and associations with cardiovascular risk factors in australian children: A prospective cohort study. Int. J. Obes. (Lond.) 2005, 29, 15–23. [Google Scholar] [CrossRef]
- Freedman, D.S.; Dietz, W.H.; Srinivasan, S.R.; Berenson, G.S. The relation of overweight to cardiovascular risk factors among children and adolescents: The bogalusa heart study. Pediatrics 1999, 103, 1175–1182. [Google Scholar] [CrossRef]
- Barter, P. The role of hdl-cholesterol in preventing atherosclerotic disease. Eur. Heart J. Suppl. 2005, 7, F4–F8. [Google Scholar] [CrossRef]
- Juonala, M.; Magnussen, C.G.; Venn, A.; Dwyer, T.; Burns, T.L.; Davis, P.H.; Chen, W.; Srinivasan, S.R.; Daniels, S.R.; Kähönen, M.; et al. Influence of age on associations between childhood risk factors and carotid intima-media thickness in adulthood: The cardiovascular risk in young finns study, the childhood determinants of adult health study, the bogalusa heart study, and the muscatine study for the international childhood cardiovascular cohort (i3c) consortium. Circulation 2010, 122, 2514–2520. [Google Scholar] [CrossRef]
- Lawlor, D.A.; Benfield, L.; Logue, J.; Tilling, K.; Howe, L.D.; Fraser, A.; Cherry, L.; Watt, P.; Ness, A.R.; Davey Smith, G.; et al. Association between general and central adiposity in childhood, and change in these, with cardiovascular risk factors in adolescence: Prospective cohort study. BMJ 2010, 341, c6224. [Google Scholar] [CrossRef]
- Bel-Serrat, S.; Mouratidou, T.; Börnhorst, C.; Peplies, J.; de Henauw, S.; Marild, S.; Molnár, D.; Siani, A.; Tornaritis, M.; Veidebaum, T.; et al. Food consumption and cardiovascular risk factors in european children: The idefics study. Pediatr. Obes. 2012, 8, 225–236. [Google Scholar]
- Ambrosini, G.L.; Huang, R.C.; Mori, T.A.; Hands, B.P.; O’Sullivan, T.A.; de Klerk, N.H.; Beilin, L.J.; Oddy, W.H. Dietary patterns and markers for the metabolic syndrome in australian adolescents. Nutr. Metab. Cardiovasc. Dis. 2010, 20, 274–283. [Google Scholar] [CrossRef]
- Perichart-Perera, O.; Balas-Nakash, M.; Rodriguez-Cano, A.; Munoz-Manrique, C.; Monge-Urrea, A.; Vadillo-Ortega, F. Correlates of dietary energy sources with cardiovascular disease risk markers in mexican school-age children. J. Am. Diet Assoc. 2010, 110, 253–260. [Google Scholar] [CrossRef]
- Reinehr, T.; Toschke, A.M. Onset of puberty and cardiovascular risk factors in untreated obese children and adolescents: A 1-year follow-up study. Arch. Pediatr. Adolesc. Med. 2009, 163, 709–715. [Google Scholar]
- Reinehr, T. Calculating cardiac risk in obese adolescents before and after onset of lifestyle intervention. Expert Rev. Cardiovasc Ther. 2013, 11, 297–306. [Google Scholar] [CrossRef]
- Kelishadi, R.; Ardalan, G.; Adeli, K.; Motaghian, M.; Majdzadeh, R.; Mahmood-Arabi, M.S.; Delavari, A.; Riazi, M.M.; Namazi, R.; Ramezani, M.A.; et al. Factor analysis of cardiovascular risk clustering in pediatric metabolic syndrome: Caspian study. Ann. Nutr. Metab. 2007, 51, 208–215. [Google Scholar] [CrossRef]
- Berenson, G.S.; Srinivasan, S.R.; Bao, W.; Newman, W.P.; Tracy, R.E.; Wattigney, W.A. Association between multiple cardiovascular risk factors and atherosclerosis in children and young adults. N. Engl. J. Med. 1998, 338, 1650–1656. [Google Scholar] [CrossRef]
- Falkner, B.; Sadowski, X.H. Hypertension in children and adolescents. Am. J. Hypertens. 1995, 8, S106–S110. [Google Scholar] [CrossRef]
- Kelly, A.S.; Steinberger, J.; Jacobs, D.R.; Hong, C.-P.; Moran, A.; Sinaiko, A.R. Predicting cardiovascular risk in young adulthood from the metabolic syndrome, its component risk factors, and a cluster score in childhood. Int. J. Pediatr. Obes. 2011, 6, e283–e289. [Google Scholar] [CrossRef]
- Reaven, G.M. The metabolic syndrome: Requiescat in pace. Clin. Chem. 2005, 51, 931–938. [Google Scholar] [CrossRef]
- Andersen, L.B.; Wedderkopp, N.; Hansen, H.S.; Cooper, A.R.; Froberg, K. Biological cardiovascular risk factors cluster in Danish children and adolescents: The European youth heart study. Prev. Med. 2003, 37, 363–367. [Google Scholar]
- Dixon, D.B.; Kornblum, A.P.; Steffen, L.M.; Zhou, X.; Steinberger, J. Implementation of lipid screening guidelines in children by primary pediatric providers. J. Pediatr. 2014, 164, 572–576. [Google Scholar]
- Johnson, S.T.; Kuk, J.L.; Mackenzie, K.A.; Huang, T.T.K.; Rosychuk, R.J.; Ball, G.D.C. Metabolic risk varies according to waist circumference measurement site in overweight boys and girls. J. Pediatr. 2010, 156, 247–252.e1. [Google Scholar] [CrossRef]
- National High Blood Pressure Education Program Working Group on Hypertension Control in Children and Adolescents. Update on the 1987 task force report on high blood pressure in children and adolescents: A working group report from the national high blood pressure education program. Pediatrics 1996, 98, 649–658. [Google Scholar]
© 2014 by the authors; licensee MDPI, Basel, Switzerland. This article is an open access article distributed under the terms and conditions of the Creative Commons Attribution license (http://creativecommons.org/licenses/by/3.0/).
Share and Cite
Schumacher, T.L.; Burrows, T.L.; Cliff, D.P.; Jones, R.A.; Okely, A.D.; Baur, L.A.; Morgan, P.J.; Callister, R.; Boggess, M.M.; Collins, C.E. Dietary Intake Is Related to Multifactor Cardiovascular Risk Score in Obese Boys. Healthcare 2014, 2, 282-298. https://doi.org/10.3390/healthcare2030282
Schumacher TL, Burrows TL, Cliff DP, Jones RA, Okely AD, Baur LA, Morgan PJ, Callister R, Boggess MM, Collins CE. Dietary Intake Is Related to Multifactor Cardiovascular Risk Score in Obese Boys. Healthcare. 2014; 2(3):282-298. https://doi.org/10.3390/healthcare2030282
Chicago/Turabian StyleSchumacher, Tracy L., Tracy L. Burrows, Dylan P. Cliff, Rachel A. Jones, Anthony D. Okely, Louise A. Baur, Philip J. Morgan, Robin Callister, May M. Boggess, and Clare E. Collins. 2014. "Dietary Intake Is Related to Multifactor Cardiovascular Risk Score in Obese Boys" Healthcare 2, no. 3: 282-298. https://doi.org/10.3390/healthcare2030282
APA StyleSchumacher, T. L., Burrows, T. L., Cliff, D. P., Jones, R. A., Okely, A. D., Baur, L. A., Morgan, P. J., Callister, R., Boggess, M. M., & Collins, C. E. (2014). Dietary Intake Is Related to Multifactor Cardiovascular Risk Score in Obese Boys. Healthcare, 2(3), 282-298. https://doi.org/10.3390/healthcare2030282