Article

Fluorescence Chemosensory Determination of Cu2+ Using a New Rhodamine–Morpholine Conjugate

1
Department of Environmental Science, Faculty of Natural Resources, Tarbiat Modares University, Noor 46414-356, Iran
2
Department of Organic Chemistry, Faculty of Science, Tarbiat Modares University, Tehran 14155-4838, Iran
3
Department of Chemistry, Faculty of Chemistry, University of Mazandaran, Babolsar 47416-95447, Iran
4
Environmental Sciences Research Institute, Shahid Beheshti University, Tehran 1983969411, Iran
5
Fisheries and Aquaculture Department, College of Agriculture and Natural Resources, Persian Gulf University, Bushehr 75169, Iran
*
Author to whom correspondence should be addressed.
Chemosensors 2017, 5(3), 26; https://doi.org/10.3390/chemosensors5030026
Submission received: 29 June 2017 / Revised: 21 August 2017 / Accepted: 23 August 2017 / Published: 19 September 2017

Abstract

:
A new rhodamine-B carbonyl-morpholine derivative (denoted as RECM) was prepared by a two-step synthesis procedure. The employed method allowed a lactam ring development of rhodamine-B and ethylenediamine to demonstrate a facile amide bond formation. The obtained RECM was confirmed by 1H NMR, 13C NMR, and mass spectrometry analysis. RECM was formed to detect copper ion (Cu2+) due to its problematic toxicity features in aquatic ecosystems. It showed a high selectivity toward Cu2+ in comparison with some environmentally relevant alkali, alkaline earth, and transition metal cations at 50 µM in acetonitrile. Moreover, non-fluorescent RECM showed fluorescence intensity and UV-Vis absorbance increases in the presence of Cu2+ with high linear dependent coefficients (R2 = 0.964 and R2 = 0.982 respectively) as well as a color change from colorless to pink owing to the ring opening of the rhodamine spirolactam form. Binding capability experiments presented a clear 1:1 stoichiometry of RECM–Cu2+ complex with the binding constant (Ka) as 2.25 × 10⁴ M−1. The calculation of limits of detection (LOD) was 0.21 µM based on the linear regression method, which is below the maximum contaminant level goal (MCLG) value of Cu2+ (1.3 ppm equals to 20.46 µM) in drinking water. These characteristics make the RECM a promising candidate for the real-time detection of toxic Cu2+ in environmental monitoring applications.

1. Introduction

Potentially toxic elements (PTEs) have attracted a lot of interest from environmental forums due to their adverse effects on ecosystems and human health [1]. Some transition metal ions such as copper play various roles in living systems as a nutrient trace element [2,3]. However, high intake levels of copper lead to neurodegenerative diseases and sclerosis-related disorders for humans [2,3,4]. Toxicity, environmental mobility, and complex chemical forms of copper in addition to its undesirable effects on human health have brought about a great deal of effort to develop various copper ion (Cu2+) detection and removal techniques in the environment.
Traditional and standard methods to detect and analyze PTEs are complicated, mainly due to their time-consuming analysis, sample pretreatment process, costly instruments, and the fact that they are unable to be used in the field [1,5]. There has therefore been a large amount of devoted effort to develop rapid, inexpensive, disposable, and simple sensing strategies for PTEs leading to reach a real-time, on-site, and selective analysis [1,6,7].
A fluorescent or colorimetric sensor detects and measures a physical parameter and converts it into an optical signal, which is subsequently read by an observer or an instrument [8]. Fluorescent chemosensors include two main parts: a receptor which is mainly responsible for perceiving the analyte, and a fluorophore, which converts the perception events into optical signals [9]. Rhodamine dyes have been extensively used as “off-on” chemosensors (fluorescence “off” spirolactam to fluorescence “on” ring-opened amide equilibrium) which create a pink-colored and orange fluorescent response to the presence of a specific metal cation as a result of the spirocycle moiety opening [10]. This is, to the best of our knowledge, first suggested by Xie’s group [11], in that in the Cu2+ promoted ring-opening reaction, the carbonyl O atom and amine N atom in the hydrazide moiety of a spirolactam-based rhodamine derivative are the most electron-rich centers, causing a higher selectivity toward this cation. Recent reports introduced various rhodamine-hydrazide-based moieties which have been applied as Cu2+ chemosensors combined with several different receptors such as N-(2,4-dinitrophenyl) [12], naphthyridine groups [13], a tetraphenylethene (TPE) group [14], an introduced ferrocene unit into a salicylaldehyde rhodamine-hydrazine platform [15], and a 1,8-naphthalimide group [16].
The main drawback of synthesizing Cu2+ optical chemosensors could be complicated synthesis procedures, the high cost of starting materials, and the lack of selectivity towards intervening competitors such as Zn2+ and Ni2+ due to their close chemical behaviors to Cu2+ [17]. Herein, we presented a new rhodamine-B derivative, RECM, which has an “O–N–O” coordination site (two O atoms of carbonyl and one N atoms of methylamide), acts as a Cu2+ selective fluorescent sensor and demonstrates a strong “orange” fluorescence upon binding with Cu2+ in the presence of other metal cations. In fact, the addition of Cu2+ can lead to a visual color change observation. Our major motivation for this study was the fabrication of a highly sensitive and selective Cu2+ optical chemosensor using inexpensive starting materials and a conventional two-step synthesis, which can act as a fluorescent enhanced “turn-on” Cu2+ sensor and “naked-eye” indicator.

2. Materials and Methods

2.1. Reagents and Solutions

High purity rhodamine-B and ethylenediamine (EDA) were purchased from Sigma–Aldrich (USA) and ChemLab (Belgium), respectively. 4-morpholine carbonyl chloride and trimethylamine (Et3N) were purchased from Merck (Germany). Solvents used (including ethanol (EtOH), methylene chloride (MC), and methanol (MeOH)) were of analytical reagent grade and purchased from Merck. Acetonitrile (MeCN) was of analytical reagent grade and purchased from Daejung (Korea). Solutions of Na+, Cd2+, Ca2+, Cu2+, Pb2+, Ni2+, and Zn2+ were prepared from nitrate salts; solutions of K+, Co2+, Hg2+, and Fe3+ were prepared from chloride salts; and solution of Ag+ was prepared from sulfate salt (all the metal ion salts were purchased from NewChem (England), Merck, and Scharlau (China)). Sodium chloride (NaCl) saturated solution and deionized water (DIW) were used throughout the experiments. Thin layer chromatography (TLC) was carried out using silica gel 60G F254 and column chromatography was done using silica gel 60 (both were purchased from Merck). All the reagents were used without further purification.

2.2. Instrumentation and Apparatus

NMR spectra (1H NMR and 13C NMR) were recorded on a Bruker DRX-400 MHz instrument (USA) in chloroform (CDCl3) using tetramethylsilane (TMS) as the internal standard; chemical shifts are recorded in ppm. Mass spectra were recorded on a Shimadzu GC-14A gas chromatograph (Japan). Melting points were determined on an Electrothermal 9100 melting point apparatus (England). UV-Vis absorption spectra were measured on a Unico 4802 UV-Vis double beam spectrophotometer (China) in micromolar concentrations. Steady-state fluorescence spectra were measured on a Cary Eclipse fluorescence spectrophotometer (USA). All measurements were performed at room temperature and repeated three times.

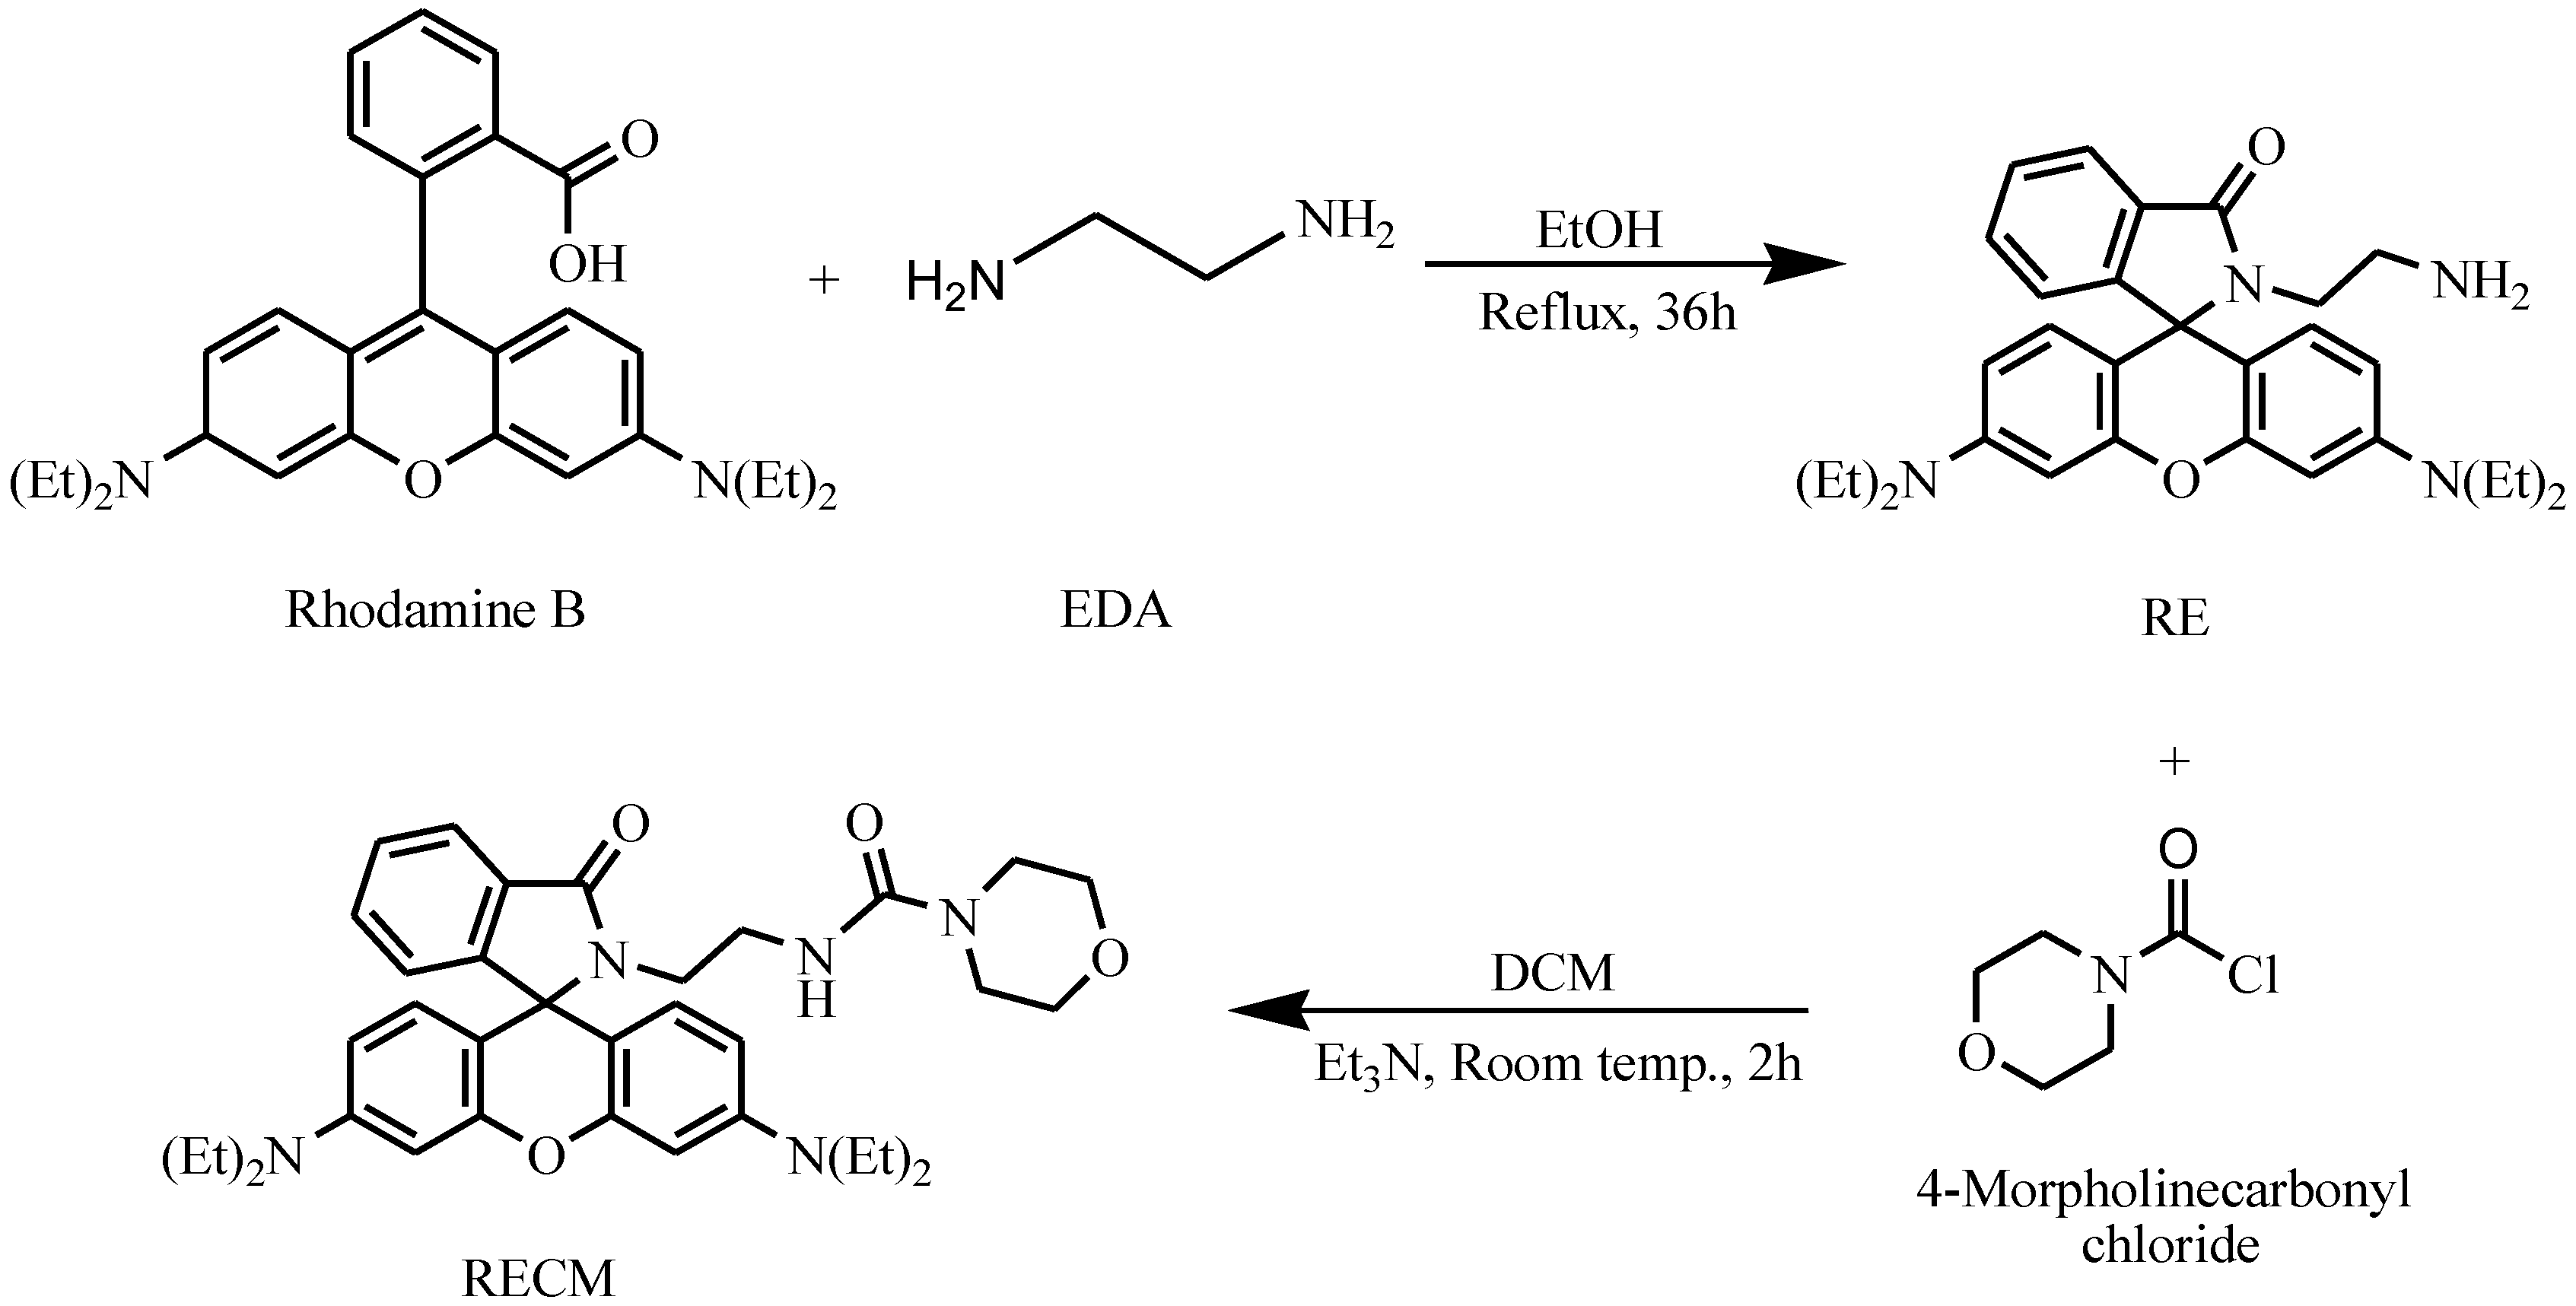
2.3. Synthesis of the Chemosensor RECM

2.3.1. Synthesis of Rhodamine-B-lactam-ethylenediamine (RE)

RE was synthesized according to the literature [10,18,19,20,21]. In a typical synthesis, in a 50 mL round-bottom flask, rhodamine-B (1 g, 2.09 mmol) was dissolved in 30 mL fresh dry EtOH. EDA (2.5 mL, 37.44 mmol) was then added dropwise under vigorous stirring at room temperature. This solution was then refluxed for 36 h until it lost its red color. After the reaction was completed, the solution was cooled down to room temperature and the solvent was evaporated under vacuum. DIW (30 mL) was added to the residue and the resulting mixture was extracted with MC (2 × 30 mL). The collected organic phase was washed two times with DIW and dried with anhydrous Na2SO4. The solvent was evaporated under vacuum to get a pale pink product which was further separated and purified by silica gel column chromatography (MC: MeOH = 97:3, v/v) afforded 0.45 g (44%) of RE as a foamy solid. M.p. 216–221 °C; 1H NMR (400 MHz, CDCl3): δ (ppm) = 7.93–7.91 (m, 1H), 7.49–7.44 (m, 2H), 7.12–7.10 (m, 1H), 6.46 (s, 1H), 6.44 (s, 1H), 6.39 (d, J = 2.8 Hz, 2H), 6.30 (d, J = 2.4 Hz, 1H), 6.28 (d, J = 2.8 Hz, 1H), 3.35 (q, J = 7.2 Hz, 8H), 3.22 (t, J = 6.8 Hz, 2H), 2.46 (t, J = 6.4 Hz, 2H), 1.18 (t, J = 6.8 Hz, 12H); 13C NMR (100 MHz, CDCl3): δ (ppm) = 168.78, 153.49, 153.28, 148.84, 132.47, 131.13, 128.66, 128.07, 123.84, 122.79, 108.17, 105.50, 97.71, 65.06, 44.35, 43.52, 40.80, 12.59; ESI-MS m/z+ (%) calculated for C30H36N4O2: 484.64, found 484.

2.3.2. Synthesis of RE–Carbonyl Morpholine (RECM)

RECM was synthesized according to the literature [22,23]. In a 50 mL round-bottom flask, RE (0.096 g, 0.20 mmol) was dissolved in 20 mL fresh dry MC. Et3N (0.030 g, 0.30 mmol) was then added under stirring at room temperature. After cooling the solution to 0 °C in an ice bath, a solution of 4-morpholine carbonyl chloride (0.045 g, 0.30 mmol) in 5 mL fresh dry MC was added dropwise over 10 min. The solution was then stirred for 2 h at room temperature. After the reaction was completed, the solvent was evaporated under vacuum and the residue dissolved in 25 mL MC. The resulting mixture was extracted with saturated NaCl solution (2 × 25 mL) and the collected organic phase was dried on anhydrous Na2SO4. The solvent was evaporated under vacuum to get a pale yellow product which was further separated and purified by silica gel column chromatography (MC:MeOH = 98:2, v/v) afforded 0.07 g (60%) of RECM as a foamy solid. M.p. 109–111 °C; 1H NMR (400 MHz, CDCl3): δ (ppm) = 7.91–7.89 (m, 1H), 7.49–7.44 (m, 2H), 7.11–7.07 (m, 1H), 6.47 (s, 1H), 6.44 (s, 1H), 6.39 (d, J = 2.4 Hz, 2H), 6.29 (d, J = 2.4 Hz, 1H), 6.27 (d, J = 2.8 Hz, 1H), 3.72–3.69 (m, 4H), 3.38–3.41 (m, 4H), 3.35 (q, J = 7.2 Hz, 8H), 3.04–3.00 (m, 2H), 3.28–3.32 (m, 2H), 1.18 (t, J = 7.2 Hz, 12H). 13C NMR (100 MHz, CDCl3): δ (ppm) = 170.32, 157.99, 153.96, 153.28, 148.93, 132.83, 130.31, 128.38, 128.16, 123.93, 122.74, 108.24, 104.55, 97.77, 66.70, 66.61, 66.09, 47.24, 44.33, 43.88, 42.64, 40.78, 12.61; ESI-MS m/z+ (%) calculated for C35H43N5O4: 597.76, found 597. The synthesis of compounds RE and RECM were conducted as the synthetic steps shown in Figure 1.

2.4. Measurement Procedures

2.4.1. Selectivity Measurements

For the most part, two main approaches could be adopted in order to examine a chemosensor’s selectivity. The first method consists of measuring the sensor’s optical responses to the analyte in the presence of each sole intervening competitor; however, in the second one, the sensor’s optical responses to the analyte are measured in the presence of all of the interfering elements. In this study, we took the first approach to assess the possible interferences precisely. The solutions of different alkali, alkaline earth, and transition metal cations including K+, Ag+, Na+, Cd2+, Ca2+, Co2+, Pb2+, Hg2+, Ni2+, Zn2+, Fe3+, and Cu2+ (1.0 × 10⁻² M) were prepared by dissolving the required amounts of nitrate/chloride/sulfate salts in absolute CH3CN. These solutions were diluted one more time to get the standard stock solutions of metal cations (5.0 × 10⁻⁴ M). In addition, the standard stock solution of RECM (5.0 × 10⁻⁴ M) was prepared by dissolving 0.03 g of the compound in 100 mL CH3CN. Each time in selectivity experiments, 0.5 mL RECM (5.0 × 10⁻⁴ M) was added to a 5 mL volumetric flask followed by adding 0.3 mL different metal cation solutions (5.0 × 10⁻⁴ M) using a micropipette to give 30 µM of metal cations. After adjusting the final volume with CH3CN, the resulting solutions were shaken for 5 s and placed at room temperature for 120 min. A blank solution of RECM was prepared without Cu2+ under the same conditions. Finally, each resulting solution filled a quartz optical cell and measured on the UV-Vis spectrophotometer and fluorescence spectrophotometer (excitation wavelength was performed at 530 nm and emission wavelength collected from 530 to 650 nm; the excitation and emission slits were 2.5 and 5 nm, respectively).

2.4.2. Spectral Measurements

The binding studies of chemosensor RECM were carried out in absolute CH3CN. Each time in titration experiments, 0.5 mL RECM (5.0 × 10⁻⁴ M) was added to a 5-mL volumetric flask followed by adding the required amount of Cu2+ (5.0 × 10⁻⁴ M) gradually using a micropipette to get the considered Cu2+ concentrations. After adjusting the final volume with CH3CN, the blank and resulting solutions were prepared to be measured on the UV-Vis spectrophotometer and fluorescence spectrophotometer as previously.

2.4.3. Job Plot Measurements

The different concentrations of Cu2+ including 15, 20, 25, 30, 35, 40, 45, 50, 55, 60, 65, 70, 75, and 80 µM were prepared by taking the required amounts from the standard stock solution of Cu2+ (5.0 × 10⁻⁴ M) using a micropipette and transferring to a 5-mL volumetric flask. In addition, different concentrations of RECM including 85, 80, 75, 70, 65, 60, 55, 50, 45, 40, 35, 30, 25, and 20 µM were prepared by taking the required amounts from the standard stock solution of RECM (5.0 × 10⁻⁴ M) using a micropipette and adding to the volumetric flasks in the way that the total concentrations of Cu2+ and RECM in each flask, was equivalent to 100 µM. After adjusting the final volume with CH3CN, the resulting solutions were prepared to be measured on a fluorescence spectrophotometer as previously.

3. Results and Discussion
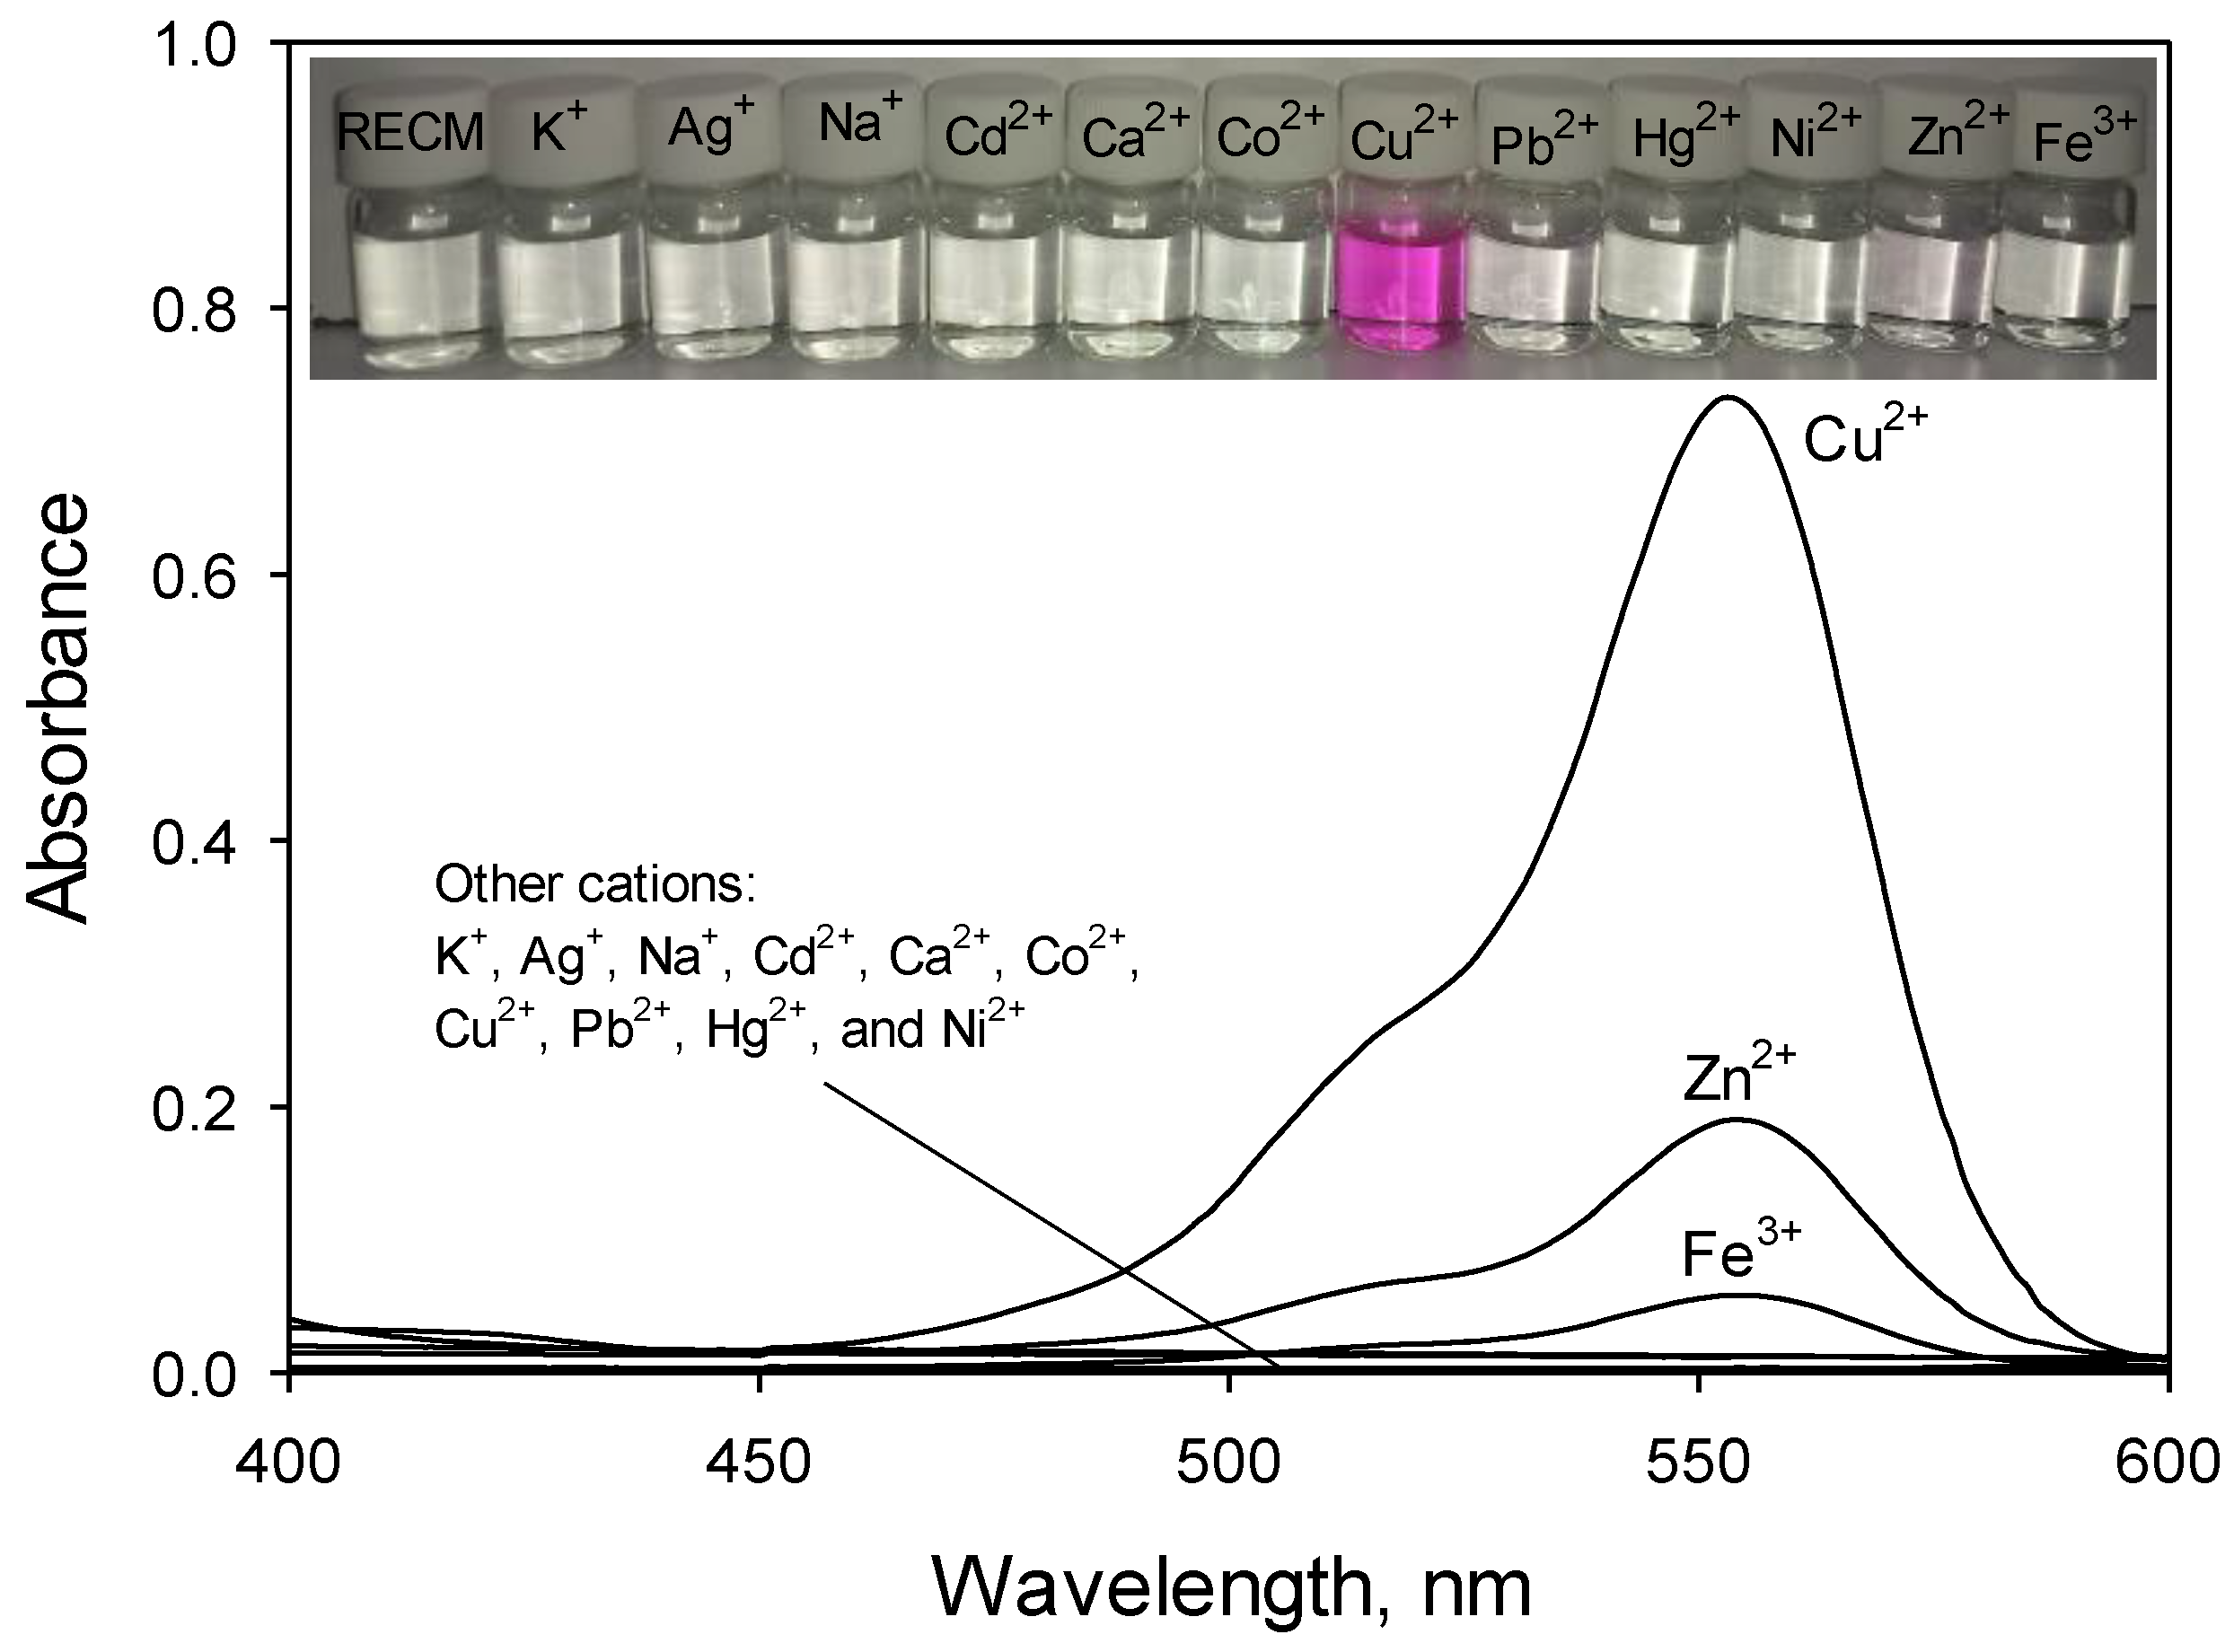
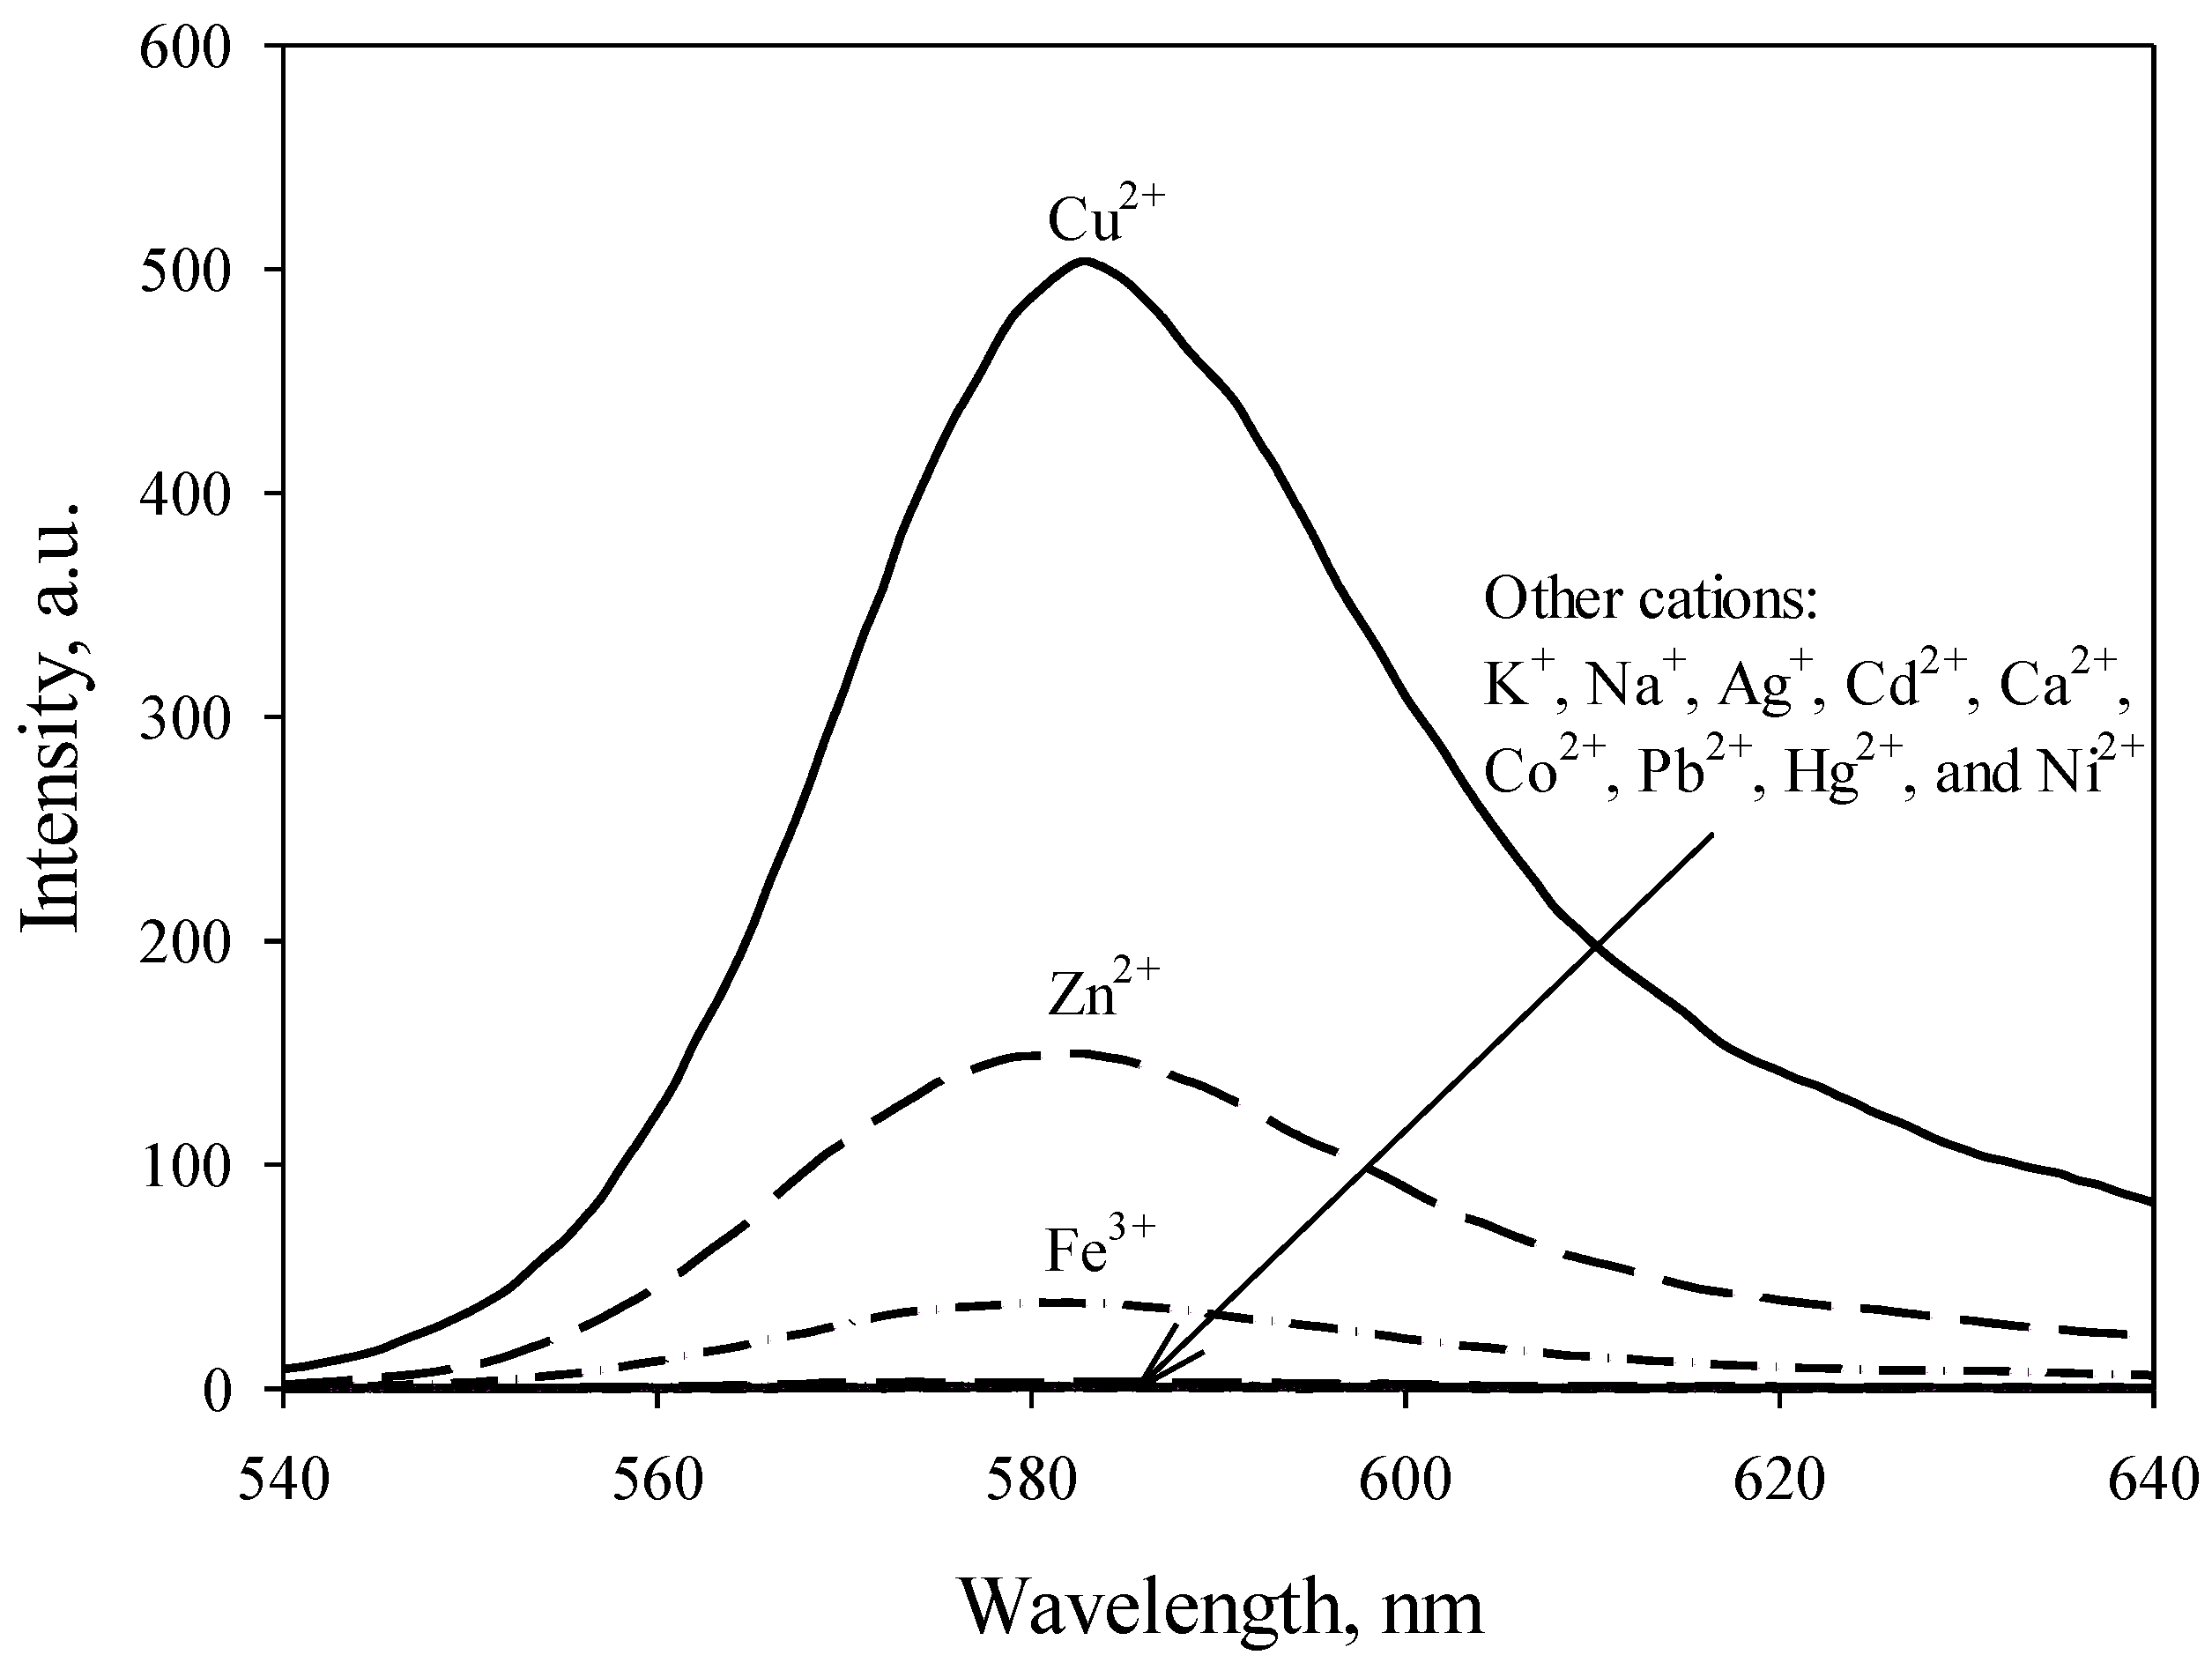
3.1. Selectivity

The new rhodamine-B-based derivative, RECM, was synthesized through a facile two-step synthesis as detailed in Section 2 to obtain a pale yellow solid. Its structure was fully confirmed by 1H NMR, 13C NMR, and mass spectra.
The fluorescence responses of RECM (50 µM in CH3CN) toward the addition of various competitive cations (30 µM in CH3CN) were recorded at 530 nm as the excitation wavelength (Figure 2).
Its fluorescence intensity was slightly influenced by the addition of some common alkali and alkaline earth cations (K+, Na+, and Ca2+), and transition cations (Ag+, Cd2+, Co2+, Pb2+, Hg2+, Ni2+, Zn2+, and Fe3+), respectively. However, a remarkably enhanced orange fluorescence for RECM was observed upon addition of 30 µM Cu2+ in CH3CN to the solution. Figure 3 confirms this, showing UV-Vis responses of RECM (50 µM in CH3CN) upon addition of common mentioned interfering cations at 400–600 nm. Its absorbance spectra clearly shows that much smaller spectral changes (Zn2+ and Fe3+) or no significant spectral changes (K+, Ag+, Na+, Cd2+, Ca2+, Co2+, Pb2+, Hg2+, and Ni2+) can be observed through the addition of cations (30 µM in CH3CN), indicating that RECM exists as a spirolactam-closed form. In contrast, RECM abruptly changed from colorless to pink upon addition of 30 µM Cu2+ in CH3CN to the solution indicating that the equilibrium shifted to a ring-opened amide, which is consistent with that of fluorescence spectra, and indicating RECM can serve as a “naked-eye” chemosensor for Cu2+ in CH3CN media. Also, visual color changes of RECM in the presence of Cu2+ and other competitive cations are shown in Figure 3 (inset).
To date, various Cu2+-rhodamine-based chemosensors were developed which involved some negligible interferences of competitive cations [24,25,26,27]. On the periodic table of elements, the three transition cations Cu2+, Zn2+ and Ni2+ lie in the same period and are next to each other [26]. The differentiation of their photophysical properties is too difficult, due to their similar coordinating ability and the high proximity of their values of ionic radius and charge density [28]. As shown in Figure 2 and Figure 3, among various competitive cations, only Zn2+ and Fe3+ displayed 86 and 21-fold enhancements, respectively, in fluorescence intensity at the same concentration. Importantly, the fluorescent signal of RECM to Cu2+ hardly can be interfered by the other cations with similar concentration. A number of recent studies revealed similar results to this study, owing to reporting Cu2+ chemosensors composed of one or more carbonyl O atoms and amine N atoms in the hydrazide moiety of a spirolactam-based rhodamine derivative [12,14,29]. Thus, it is self-evident that oxygen and nitrogen donor atoms could be introduced into the structure of a Cu2+ chemosensor in order to eliminate interference caused by intervening competitors such as Fe2+, Fe3+, Ni2+, and Zn2+. The presented results of this work demonstrated that only Cu2+ could give a high fluorescence intensity and strong absorbance together with no considerable fluorophore-cation interaction of other mentioned cations, and RECM offered an excellent selectivity toward Cu2+.

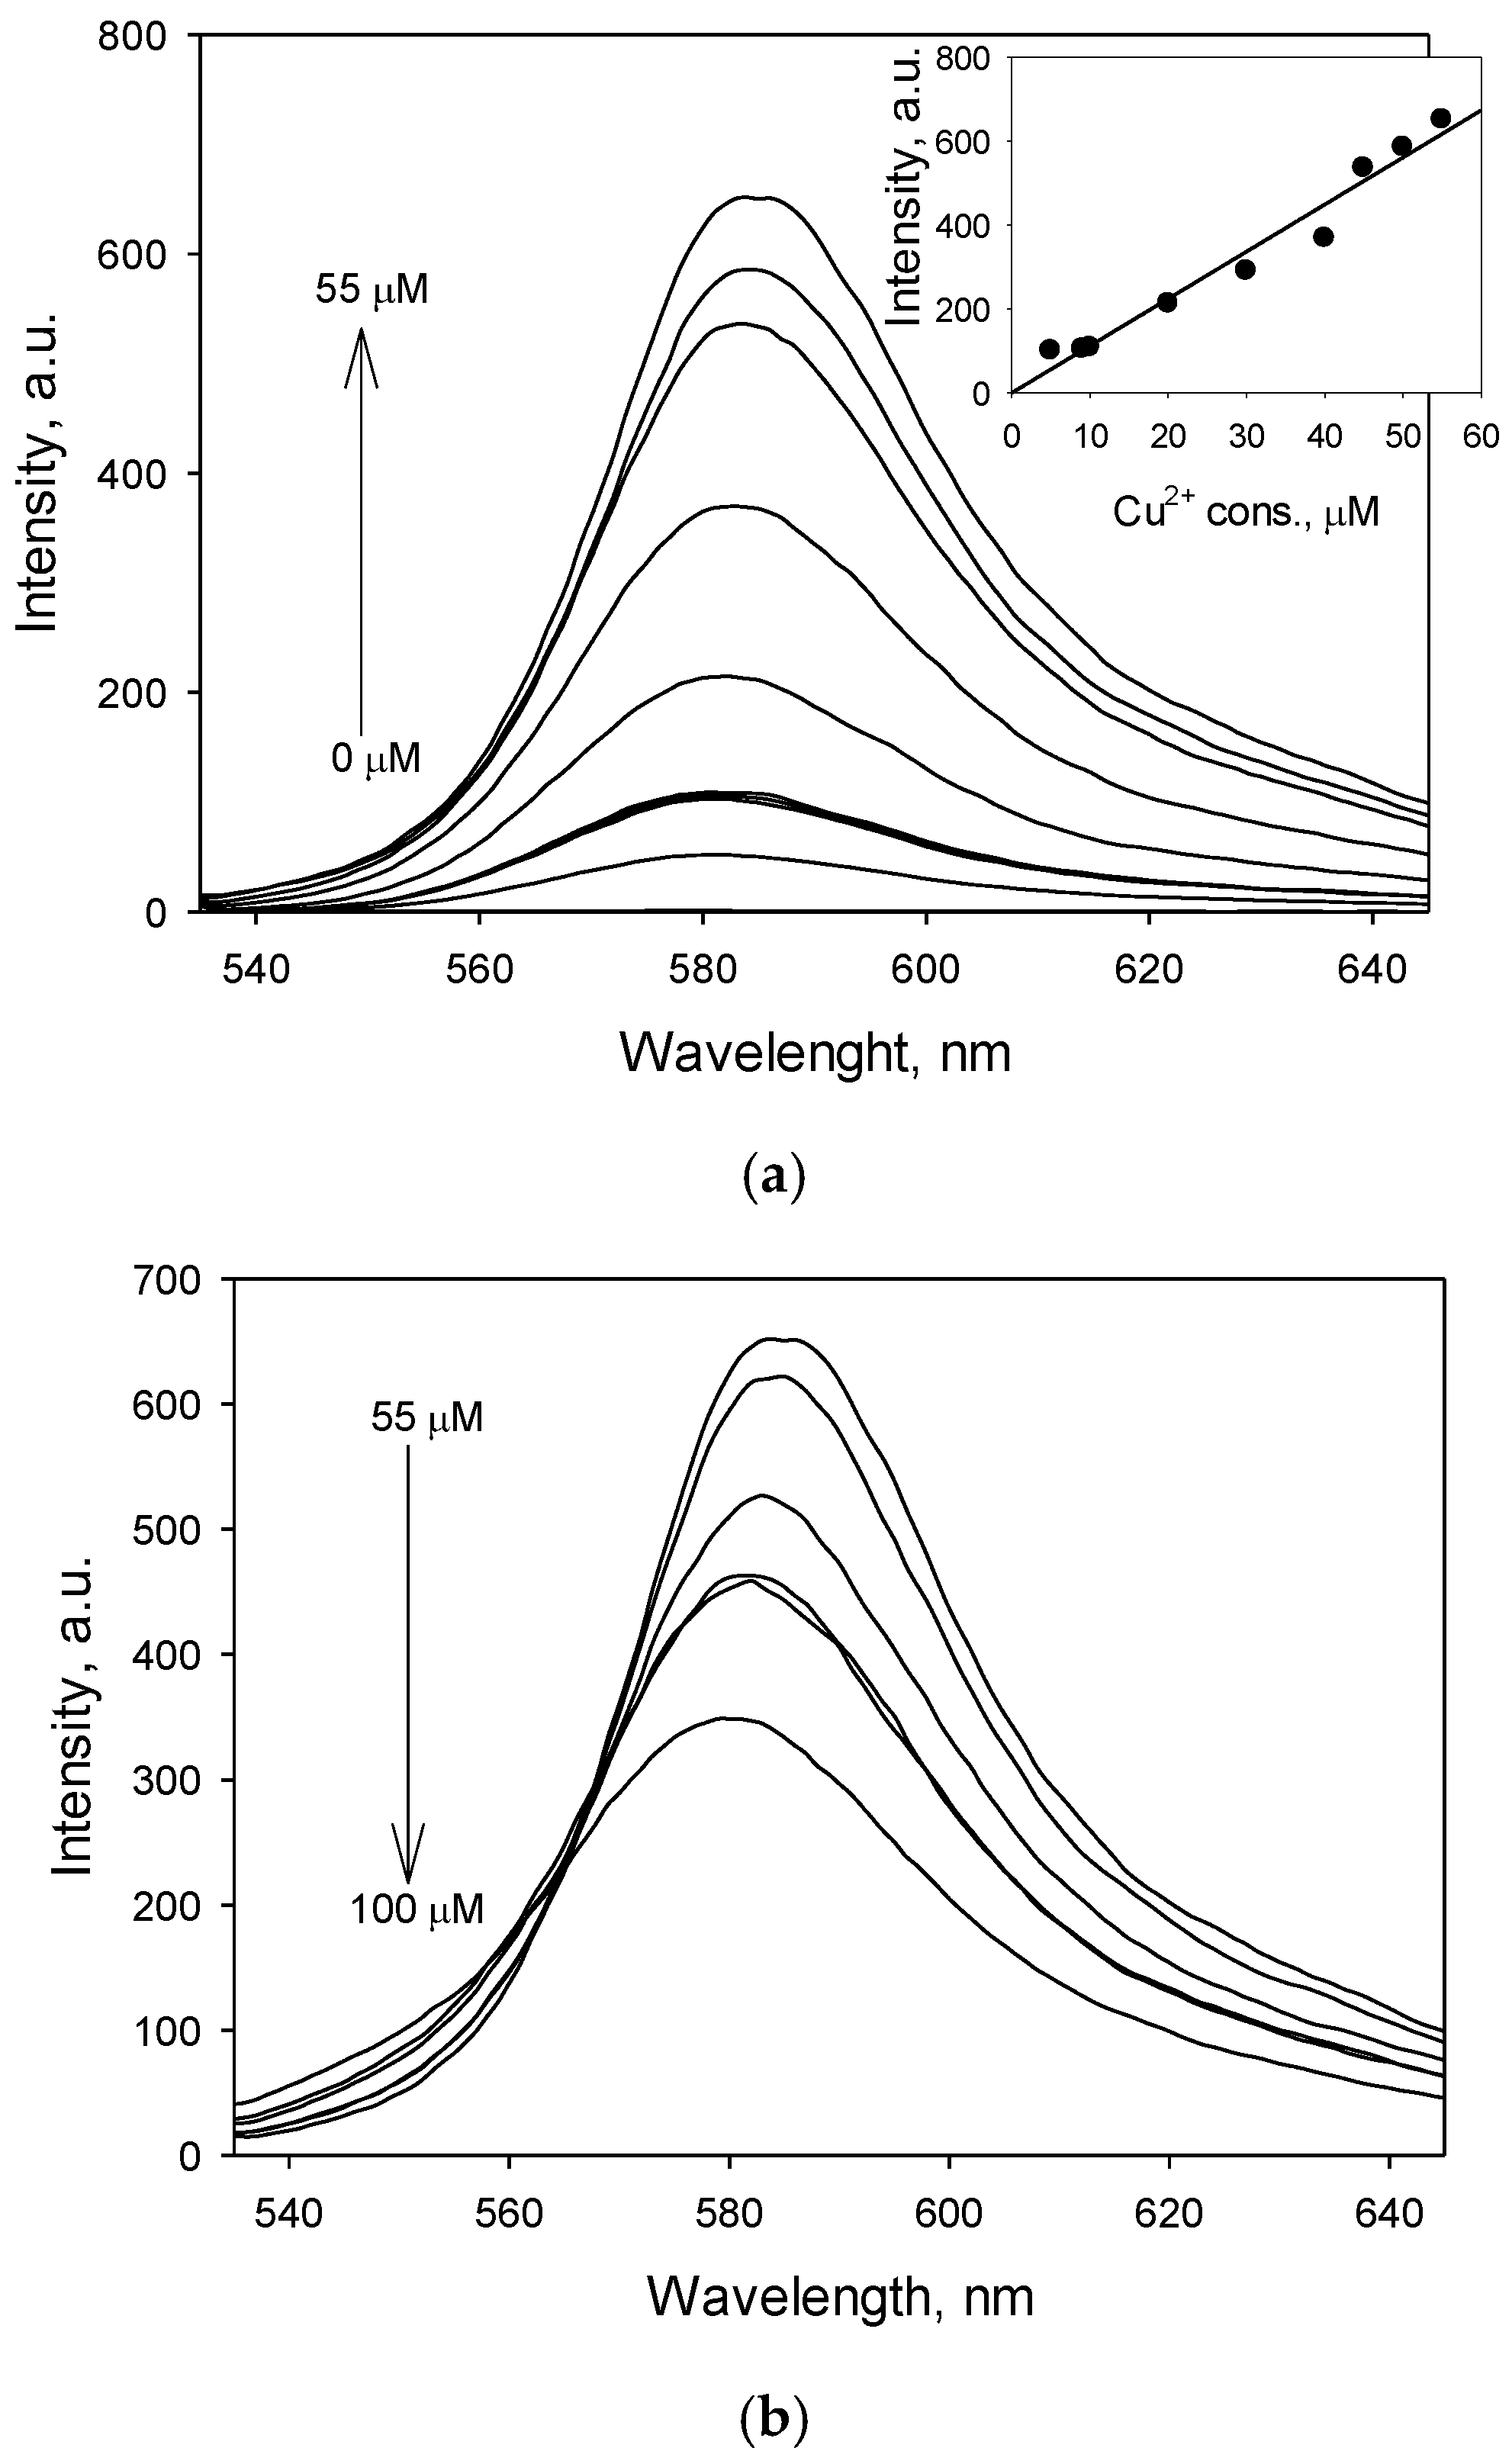
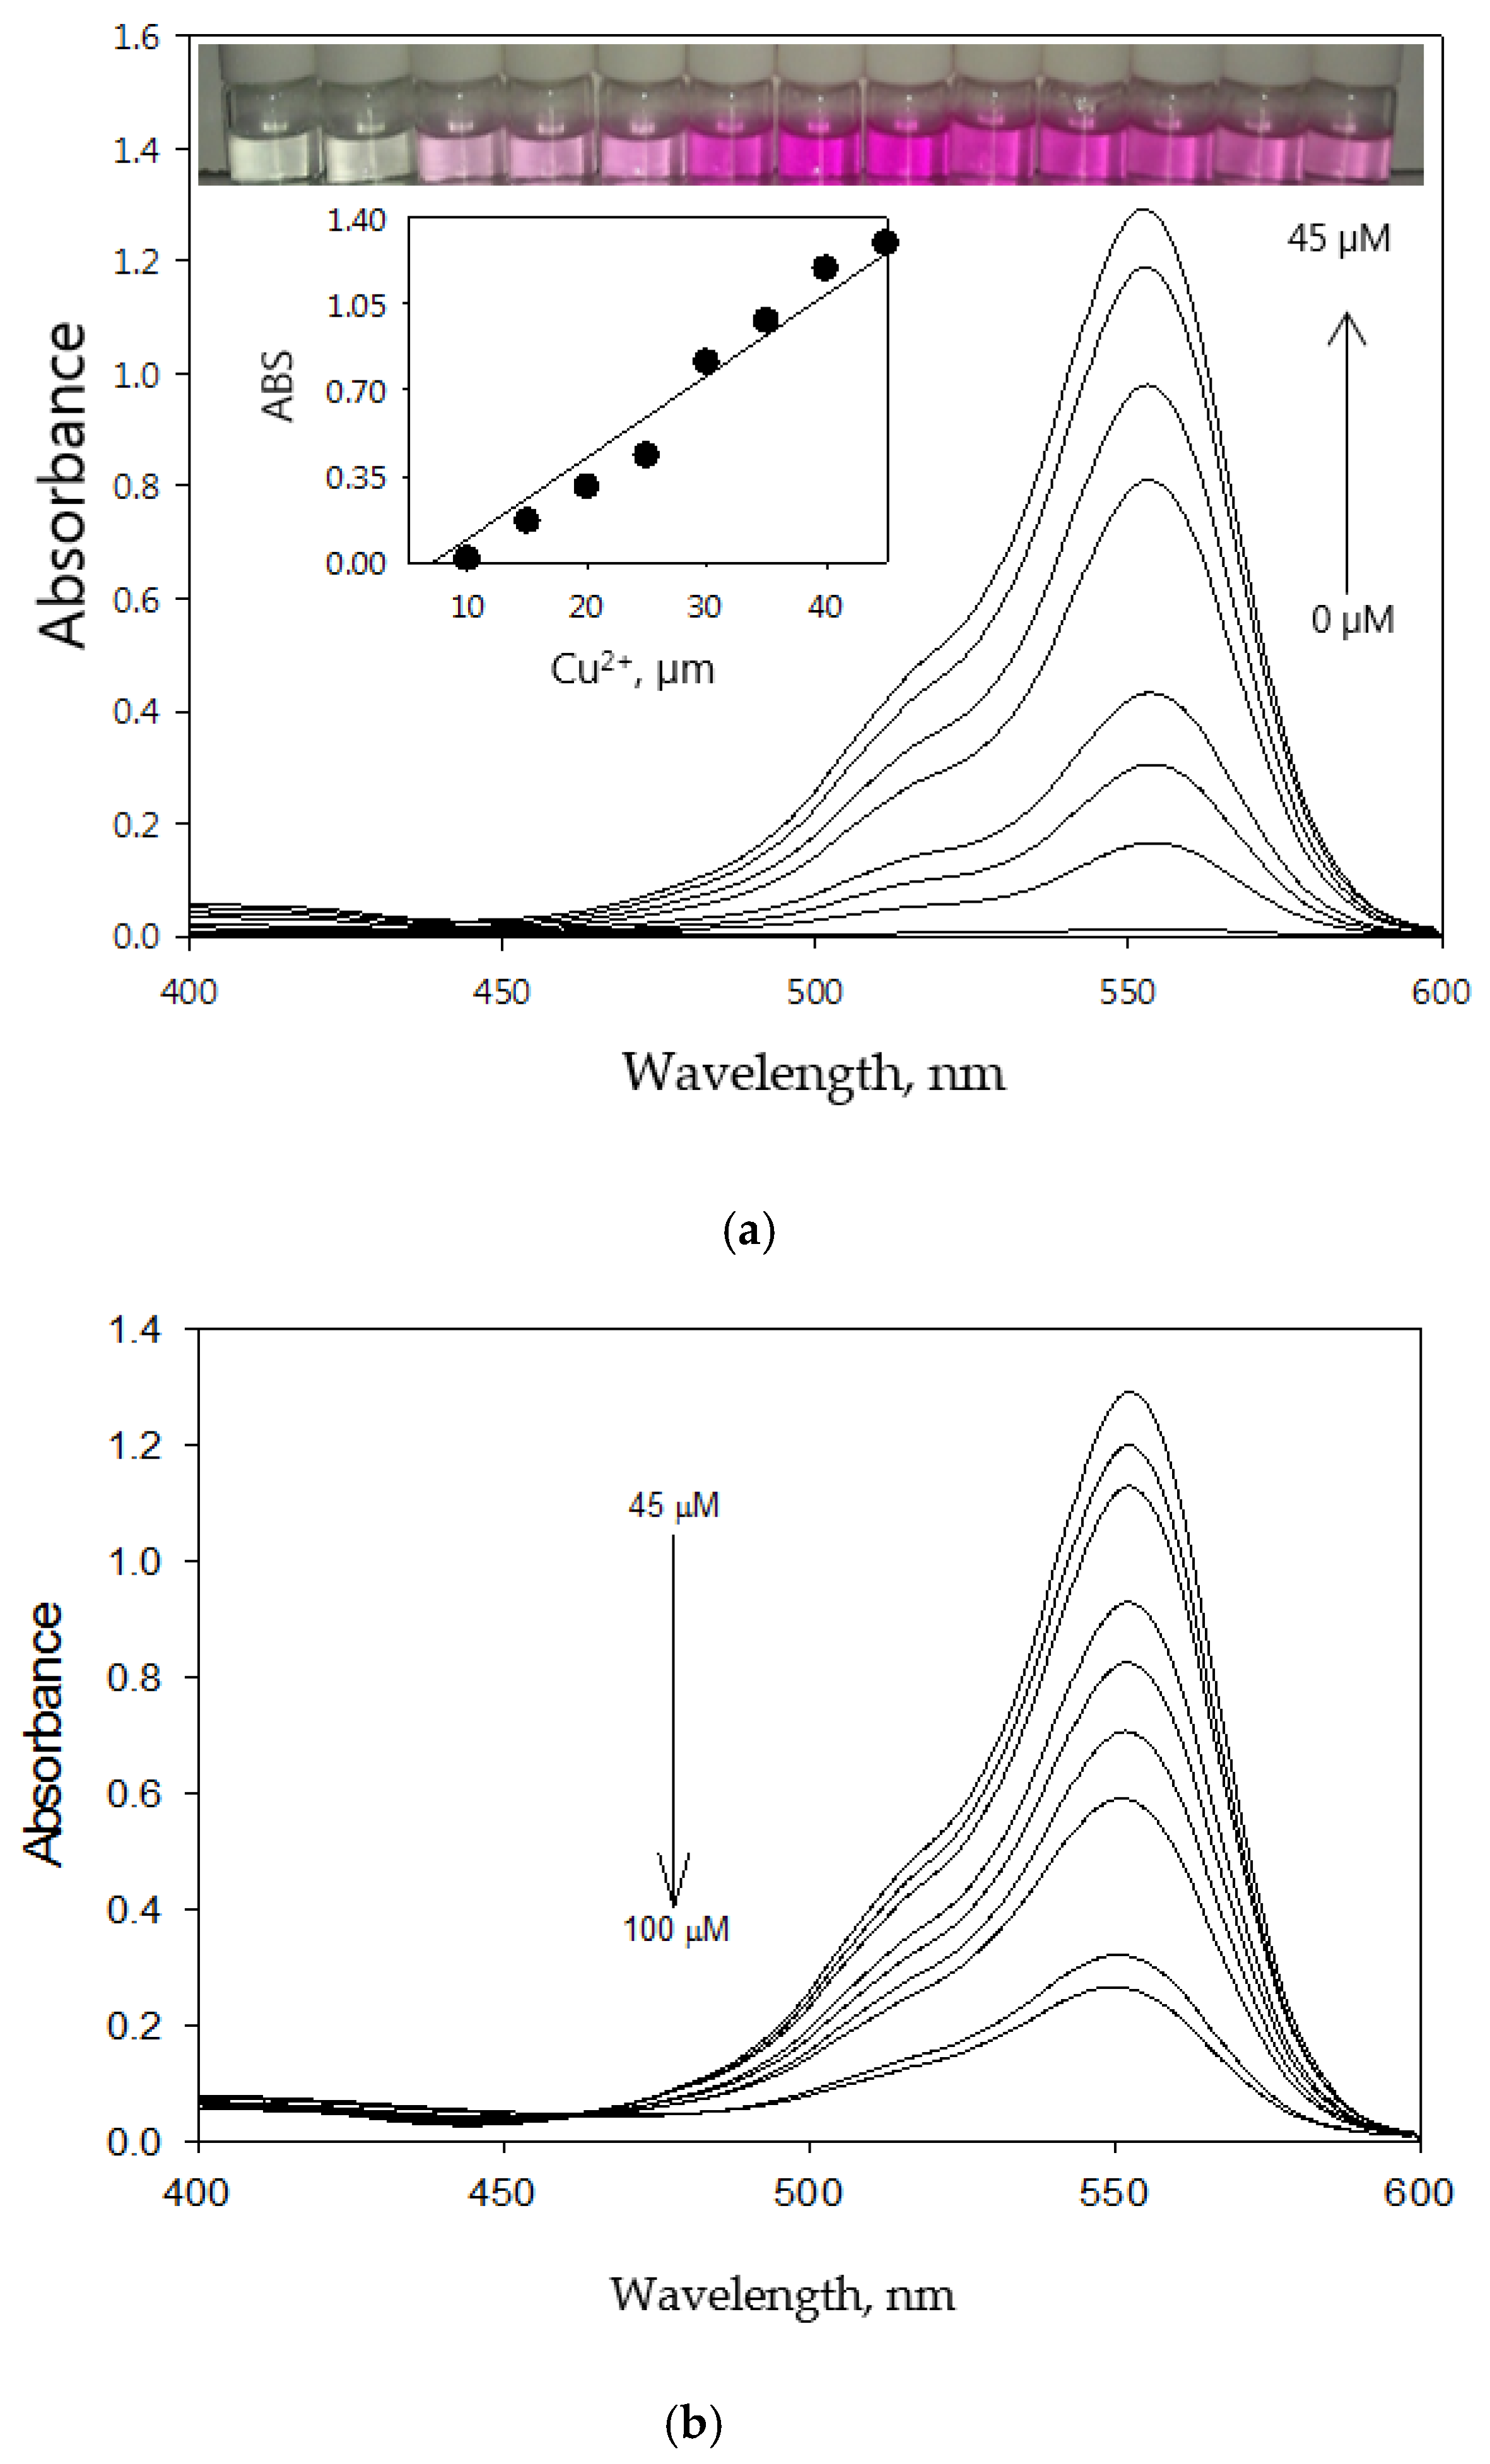
3.2. Optical Sensing Properties
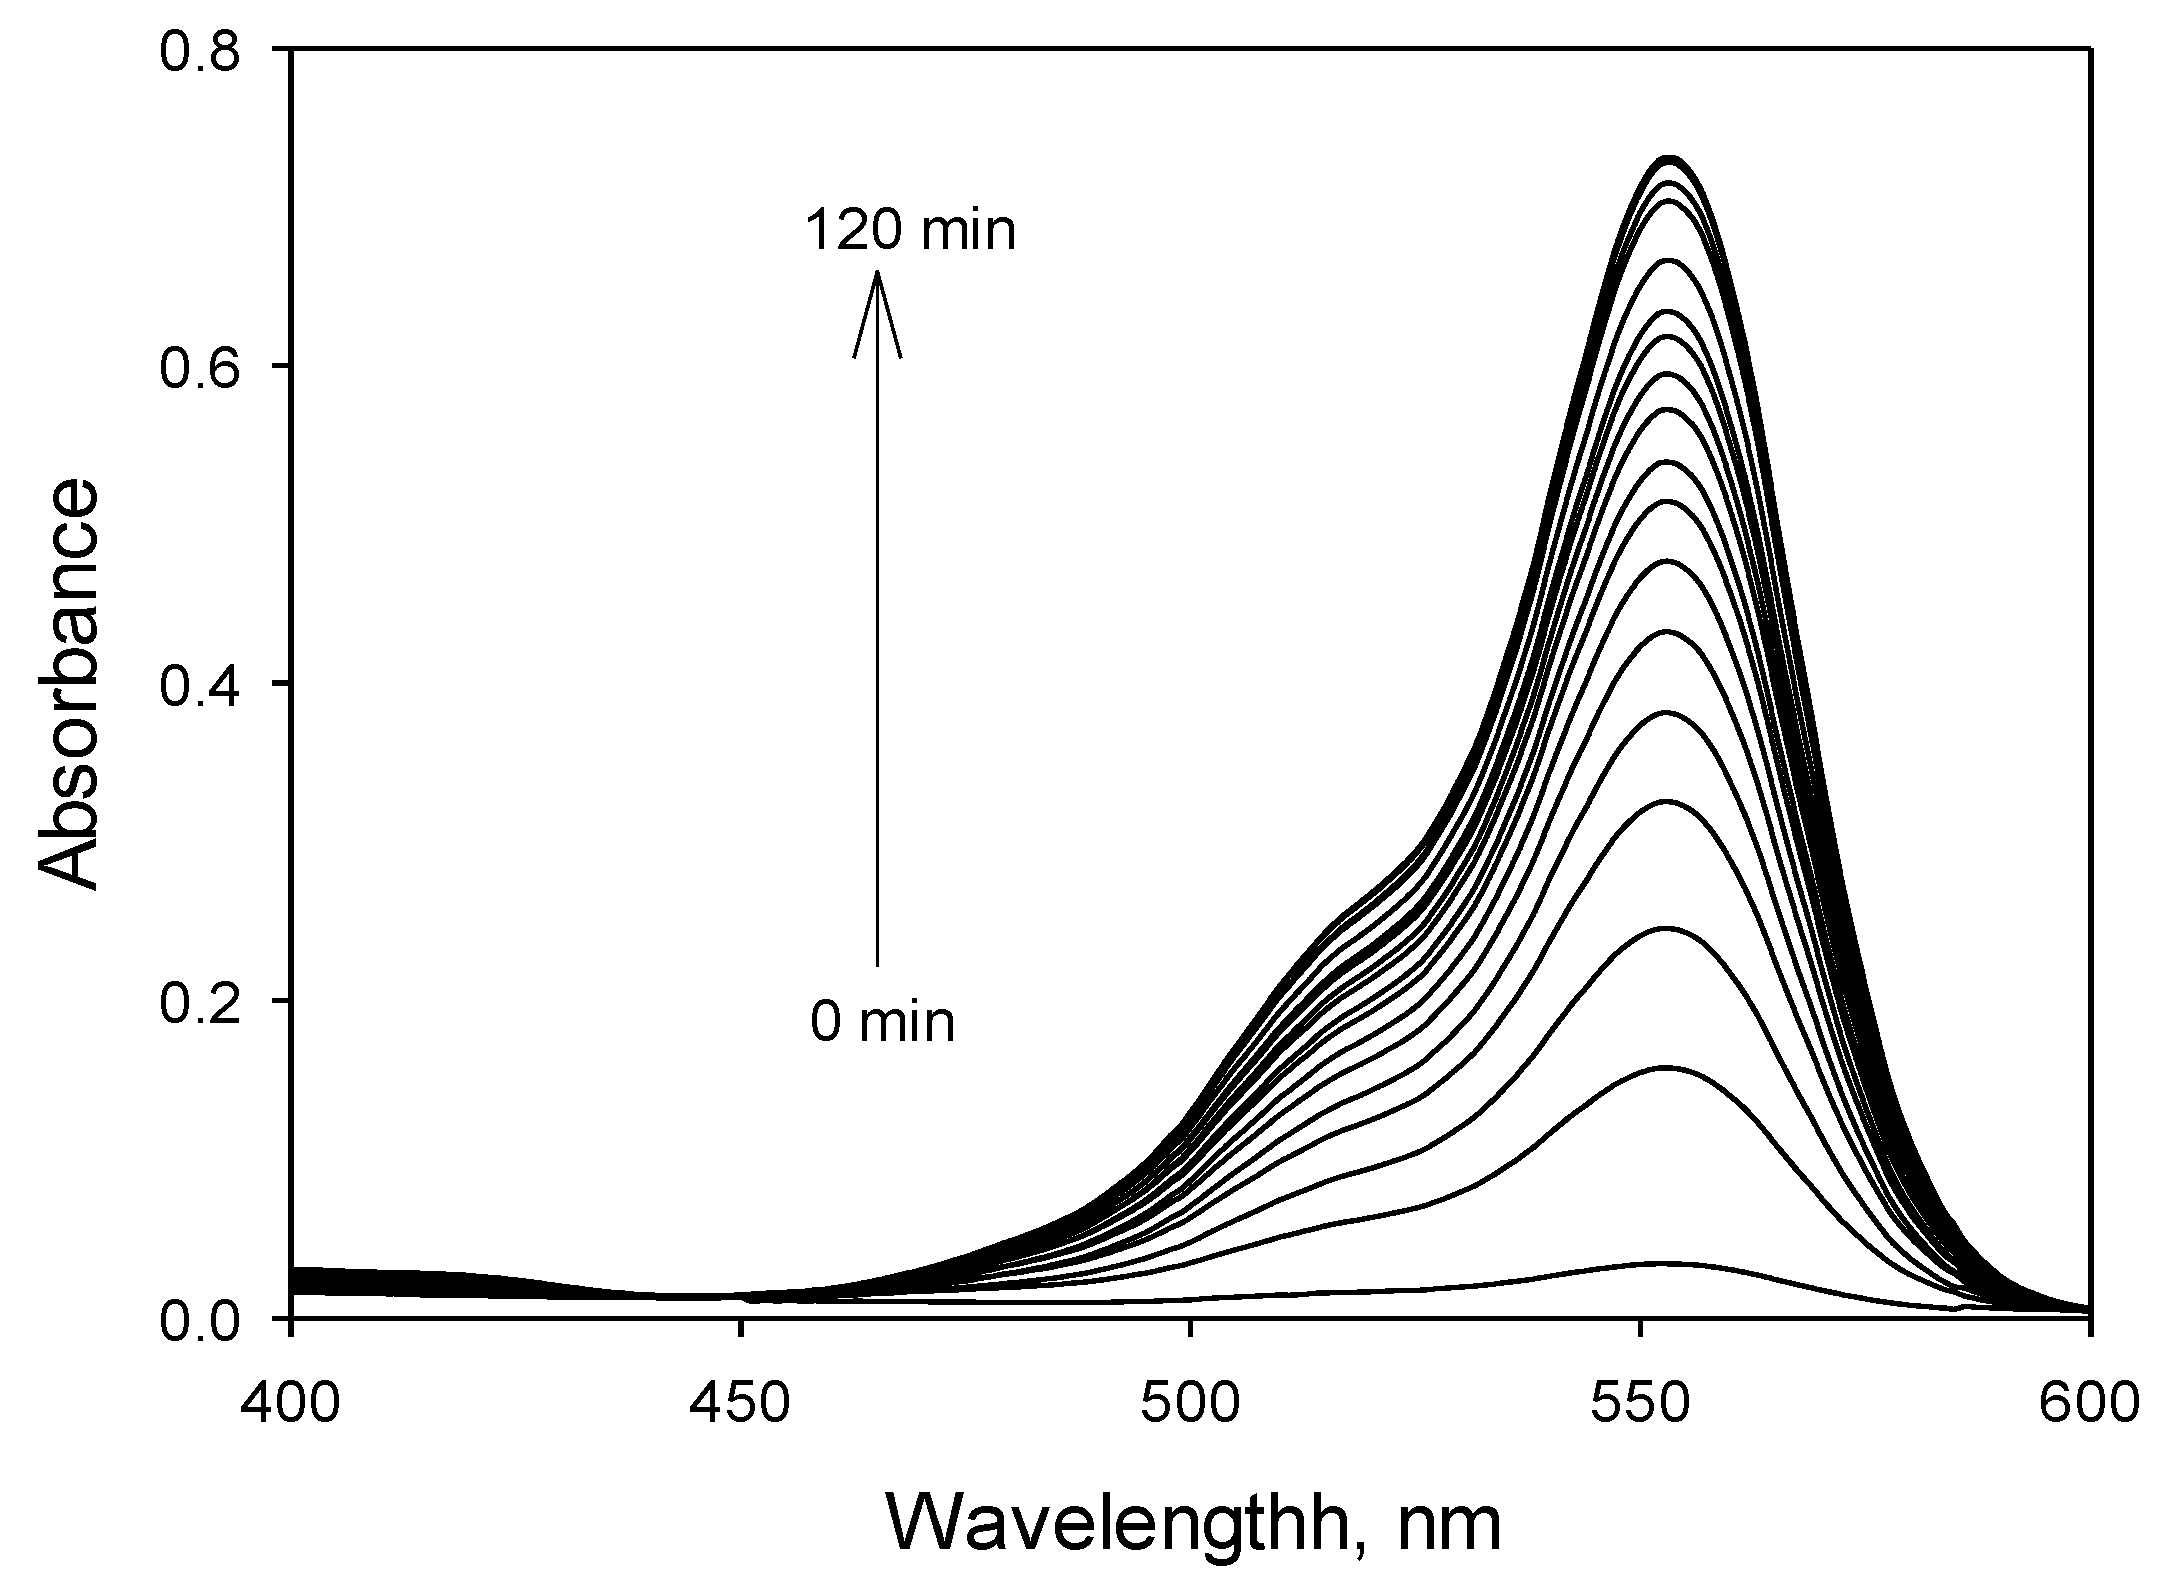
Fluorescence and absorbance changes of RECM upon gradual titration with Cu2+ were examined. The fluorescence titration of RECM (50 µM in CH3CN) was performed with a Cu2+ concentration range of 1–100 µM in CH3CN. As shown in Figure 4a, fluorescence intensity increases upon addition of increasing concentrations of Cu2+ up to 55 µM, and gives a linear response within the range of 1–55 µM (R2 = 0.965) (Figure 4a, inset), but decreases upon addition of more than 55 µM (Figure 4b). The limit of detection (LOD) of RECM was calculated based on the fluorescence titration. To that end, the emission intensity of RECM without Cu2+ was measured by 10 times and the standard deviation of blank measurements was determined. The LOD of RECM was found to be 0.21 µM based on the definition by IUPAC ( L O D = 3 σ b i / m , where σ b i is the standard deviation of blank measurements and m is the slope between intensity versus sample concentration) [30] which is less than the maximum contaminant level goal (MCLG) of Cu2+ (1.3 ppm equals to 20.46 µM) in drinking water recommended by the US Environmental Protection Agency (USEPA) [31]. RECM shows an acceptable efficiency in terms of LOD in comparison with several types of research which have been done into the designation of optical chemosensors to detect and determine Cu2+ in aqueous media over the past decades. Kim et al. [32] designed and synthesized a new simple rhodamine-B derivative equipped with the 4-nitrosalicylaldimine-based receptor (RB-HN) which exhibits selective optical recognition for Cu2+ over commonly-interfering metal cations in DMSO–H2O media. RB-HN demonstrates a color change from yellow to pink upon gradual titration with Cu2+ and a 1:1 RB-HN–Cu2+ complex mode in the binding stoichiometry. The LOD of the RB-HN for Cu2+ was 0.47 µM. Kaur et al. [33] designed a phenothiazine-based optical probe, which exhibits a significant color change from orange to blackish blue in the presence of Cu2+ based on soft-soft metal interactions with the S and N atoms of the probe. Selective and sensitive responses of the probe toward Cu2+ over other interfering metal cations took about 70 s and the LOD was determined to be 0.3 µM. Erdemir et al. [34] demonstrated two novel design of anthracene-based optical sensors (AOC and ATC) for Cu2+ prepared in one step procedures. The LODs of AOC and ATC were found as 1.09 μM and 1.19 μM respectively, and the stoichiometry of their complexes with Cu2+ was determined to be 1:1. However, various optical probes have been developed which allow detecting the presence of Cu2+ with lower LODs and can be successfully applied as selective and sensitive chemosensory towards Cu2+ in aqueous media [26,35].
The absorbance titration of RECM (50 µM in CH3CN) was conducted with a Cu2+ concentration range of 9–100 µM in CH3CN. The absorbance spectra exhibit significant enhancement upon addition of increasing concentrations of Cu2+ up to 45 µM (Figure 5a), which is confirmative suggesting the delocalization xanthene moiety and spirolactam formation of RECM. In addition, the absorbance response increases linearly within the range of 1–45 µM (R2 = 0.958) (Figure 5a, inset). Visual color changes of RECM in the presence of Cu2+ are also shown in Figure 5a (inset). In contrast, absorbance decreases upon addition of more than 45 µM (Figure 5b).
The fluorescence and absorbance decreased upon addition of more than 55 µM and 45 µM Cu2+ respectively, that might be respected to the paramagnetic nature of Cu2+ [27,36,37]. Paramagnetic square-planar or tetragonally distorted metal ions such as Co2+, Cr3+, Cu2+, Fe3+, Ni2+, and Pd2+ are able to quench the fluorescence of optical chemosensors which is presumptively undesirable for analytical purposes [38]. The paramagnetic effect is basically the result of an enhanced electronic states’ mixing (considered as a formally forbidden intersystem crossing) of a ligand by means of the inhomogeneous magnetic field of the paramagnetic ion [39]. For this reason, classical probes for Cu2+ and other strongly paramagnetic metal ions are usually based on the quenching of the fluorescence [40]. Shao’s group [41] designed a highly selective Cu2+ fluorescent sensor has based on a spiropyran derivative, which combines the characteristics of metal binding and signal transduction in cationic recognition. Their study revealed that lower concentrations of the chemosensor in the system resulted in the weak blank fluorescence signal value, while at relatively higher concentrations of the chemosensor, the fluorescent response could not be quenched completely even if a high concentration of Cu2+ was added to the solution. In our study, RECM and Cu2+ binding did open the spirolactam ring. Nevertheless, the fluorescence of the ring-opened amide forming upon increasing Cu2+ concentrations was partially quenched by the cation [24]. A possible answer would be a relative lack of sufficient concentration of the fluorescent sensor to cause the recognition process to be assured of avoiding the paramagnetic effect. From a signal detection viewpoint, the quenching behavior of the probe, however, is not a preferable fluorescence enhancement response [5,24].

3.3. Response Time

To investigate the response time of RECM with Cu2+, absorbance was recorded on RECM (50 µM in CH3CN) reacting with Cu2+ (30 µM in CH3CN) in 0–120 min after mixing together. The absorbance increases immediately and stables within 110 min (Figure 6).
According to this result, all the prepared samples were placed at room temperature for 120 min after shaking for 5 s and before analyzing with the instruments. Su et al. [42] developed a convenient optical sensor towards Cu2+ using polydihydroxyphenylalanine nanoparticles (PDNPs). PDNPs fluorescence-quenching increased and became constant after 10 min. Ghaedi et al. [43] demonstrated the application of a novel optode based on a central composite designation and its efficiency towards Cu2+ in aqueous media. The response time to maintain a constant fluorescence intensity as the result of the complexation of optode and Cu2+ was 6.9 min. Some other recent works reported various Cu2+ optical chemosensors with shorter response times [33,44]. Sensors with faster response times and higher selectivities are preferable in monitoring ultra-trace levels of toxic metal ions [9]. From this point of view, the new synthesized rhodamine-B derivative (RECM) shows a weak efficiency in terms of response time and needs to be optimized in order to possess more rapid optical responses.

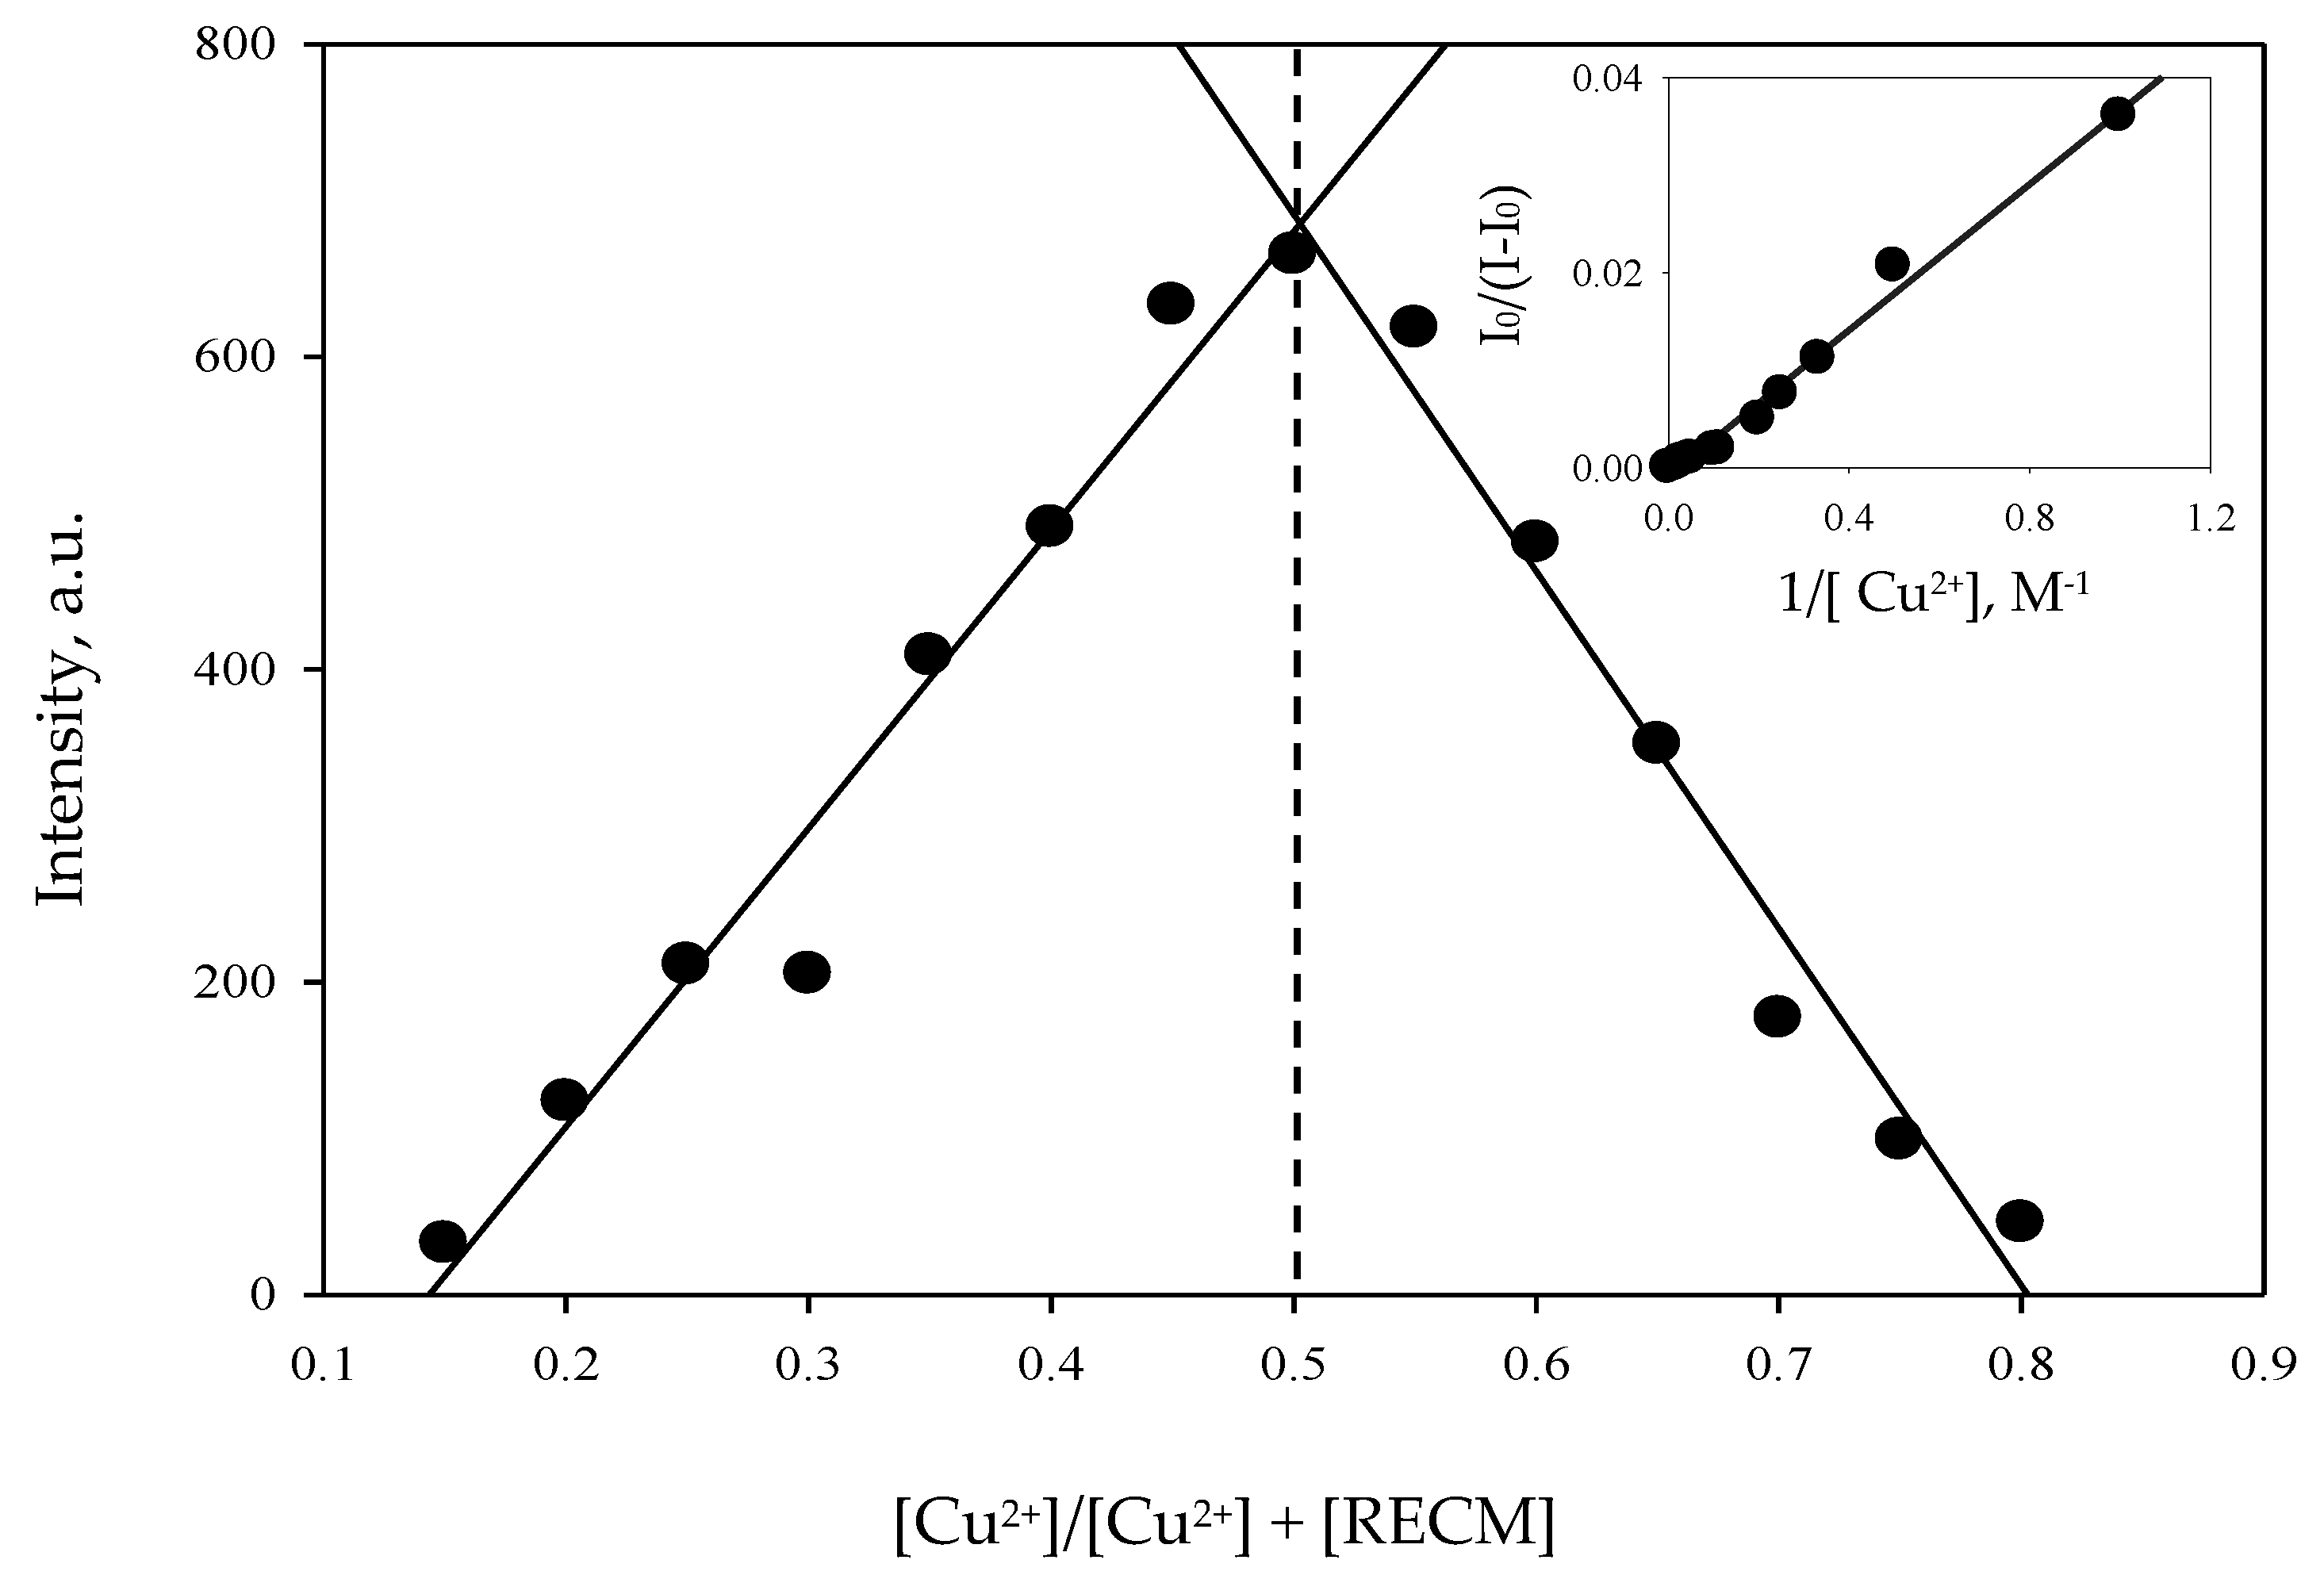
3.4. Binding Capability

To evaluate the binding stoichiometry of the RECM–Cu2+ complex and the binding constant (Ka), the job plot method and Benesi–Hildebrand correlation were used, respectively. In the job plot method, total concentrations were kept at 100 µM and the molar ratio was given by [Cu2+]/([Cu2+] + [RECM]) which measured from 0.18 to 0.80 using the fluorescence spectrophotometer. As shown in Figure 7, the maximum fluorescence intensity of the molar ratio was 0.5 that means a 1:1 RECM–Cu2+ complex mode in the binding stoichiometry.
The 1:1 binding mode of the Benesi–Hildebrand correlation [45] is usually used to estimate the Ka as following:
I F 0 ( I F I F 0 ) = ( 1 f ) [ 1 K a [ M ] + 1 ]
where I F 0 and I F are the fluorescence intensity of RECM at 584 nm in the absence and presence of Cu2+, respectively. ƒ is the fraction of the initial accessible fluorescence to the chemosensor and [M] is the Cu2+ concentration. The inset in Figure 7 shows the results of the Benesi–Hildebrand plot and Ka of RECM–Cu2+ complex in CH3CN was found to be 2.25 × 10⁴ M−1. Ka can also be estimated by the ratio intercept/slope of the Benesi–Hildebrand plot’s linear regression. The obtained Ka strongly supported RECM–Cu2+ 1:1 binding stoichiometry and showed a strong probe in comparison with some recently-reported work on Cu2+ fluorescent and colorimetric probes [5,16,46]. Most of the various Cu2+-rhodamine-based chemosensors have already been developed and involve a coordination mode with 1:1 stoichiometry, which is the most possible binding mode of rhodamine-based chemosensors and Cu2+ [5,24,25,32]. However, there are few types of research demonstrating different molar ratios for newly-developed rhodamine-based derivatives and Cu2+.

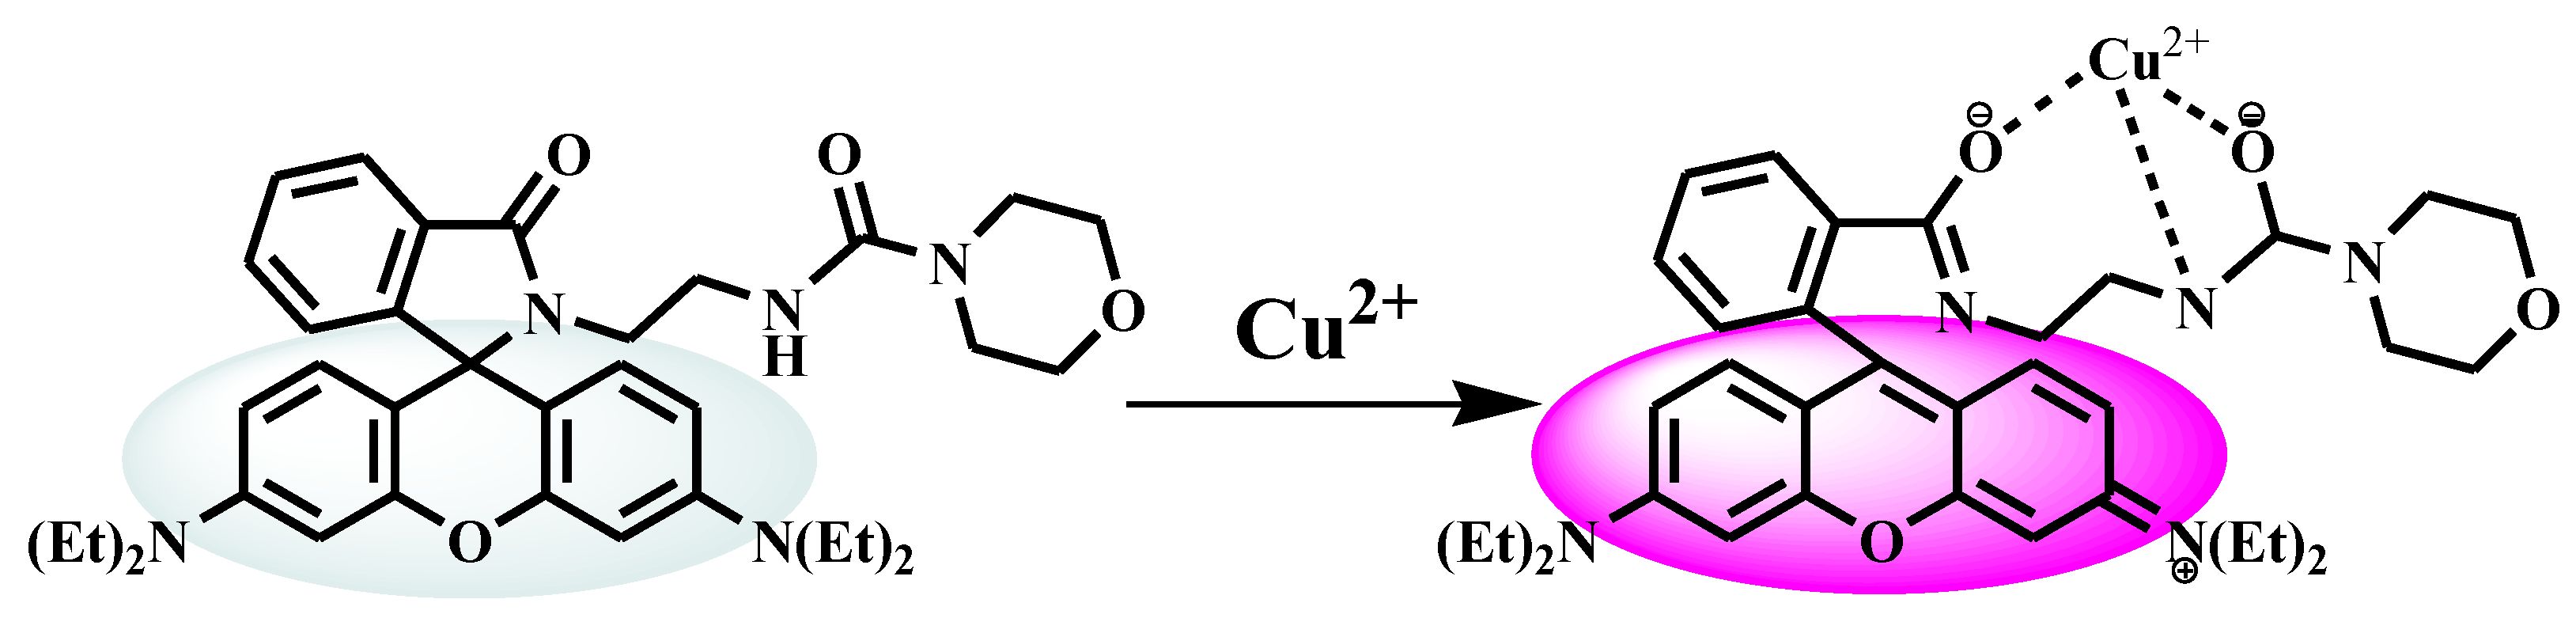
3.5. Structure and Complexation Mechanism

The first idea to consider RECM as a Cu2+ sensitive and selective fluorescent and colorimetric chemosensor was based on the spirocycle opening mechanism, which was the same as reported spirocycle rhodamine-based derivatives [5,10,16,24,25,36]. With this consideration, directly linked chelating agents to rhodamine spirolactam moiety including one methylamide N and two carbonyl O atoms made a possible binding pocket of RECM toward Cu2+ and induced the spirolactam ring opening upon RECM and Cu2+ binding interaction. The strong chelating ability of RECM toward Cu2+ was responsible for both fluorescence and color changes and also led to obtaining the 1:1 binding stoichiometry.
The proposed mechanism of RECM–Cu2+ complexation along with the obvious OFF-ON optical signal is shown in Figure 8.

4. Conclusions

The new rhodamine-B-based derivative RECM was prepared using a conventional two-step pathway, including a lactam ring formation of rhodamine-B and ethylenediamine following by a facile amide bond formation. After it was structurally characterized, the optical responses toward Cu2+ were collected from both fluorescence intensity and absorbance spectra. As we expected, the fluorescence intensity of RECM was obviously enhanced upon addition of Cu2+ up to 55 µM with a high linearly dependent coefficient, confirmed with UV-Vis absorbance spectra. When plotting fluorescence intensity against Cu2+ concentration, we observed a slight decrease in fluorescence intensity at high cation concentrations, which might well be owing to paramagnetic quenching behavior of the analyte. To explore RECM selectivity toward Cu2+, the competition experiments were carried out in the presence of some environmentally relevant alkali, alkaline earth, and transition metal cations at 50 µM. The fluorescence and absorbance spectra displayed no obvious interference in the fluorometric and colorimetric detection for Cu2+. In conclusion, we report that the carbonyl-morpholine-structured rhodamine-B derivative, RECM, can serve as a sensitive and selective “naked-eye” chemosensor toward Cu2+ in acetonitrile in a 1:1 complex mode, and with LOD of 0.21 µM based on the linear regression method, which makes RECM sufficient to detect relevant concentrations of Cu2+ in the environmental monitoring applications.

Acknowledgments

We acknowledge the financial support from the Ministry of Science, Iran, and Natural Resources and Marine Sciences, Tarbiat Modares University (TMU). We also wish to thank Ali Ebrahimi insightful discussions, Haghdoust regarding her experimental and laboratory technical assistance.

Author Contributions

All authors contributed extensively to the work presented in this paper. Z.S., H.Y., M.T, and A.H. conceived and designed the experiments; Z.S. and D.S performed the experiments; M.T. and M.J.C. analyzed the data; A.H. and A.S. contributed reagents and analysis tools; Z.S. wrote the paper.

Conflicts of Interest

The authors declare no conflict of interest.

References

  1. Duarte, K.; Justino, C.I.; Freitas, A.C.; Gomes, A.M.; Duarte, A.C.; Rocha-Santos, T.A. Disposable sensors for environmental monitoring of lead, cadmium and mercury. TrAC Trends Anal. Chem. 2015, 64, 183–190. [Google Scholar]
  2. Gaggelli, E.; Kozlowski, H.; Valensin, D.; Valensin, G. Copper homeostasis and neurodegenerative disorders (Alzheimer’s, Prion, and Parkinson’s diseases and amyotrophic lateral sclerosis). Chem. Rev. 2006, 106, 1995–2044. [Google Scholar] [PubMed]
  3. Mathie, A.; Sutton, G.L.; Clarke, C.E.; Veale, E.L. Zinc and copper: Pharmacological probes and endogenous modulators of neuronal excitability. Pharmacol. Ther. 2006, 111, 567–583. [Google Scholar] [PubMed]
  4. Crichton, R.R.; Dexter, D.T.; Ward, R.J. Metal based neurodegenerative diseases—From molecular mechanisms to therapeutic strategies. Coord. Chem. Rev. 2008, 252, 1189–1199. [Google Scholar]
  5. Puangploy, P.; Smanmoo, S.; Surareungchai, W. A new rhodamine derivative-based chemosensor for highly selective and sensitive determination of Cu2+. Sens. Actuators B Chem. 2014, 193, 679–686. [Google Scholar]
  6. Bachan Upadhyay, L.S.; Verma, N. Enzyme inhibition based biosensors: A review. Anal. Lett. 2012, 46, 225–241. [Google Scholar]
  7. Ke, J.; Li, X.; Shi, Y.; Zhao, Q.; Jiang, X. A facile and highly sensitive probe for Hg(II) based on metal-induced aggregation of ZnSe/ZnS quantum dots. Nanoscale 2012, 4, 4996–5001. [Google Scholar] [PubMed]
  8. Yan, G.; Viraraghavan, T. Heavy metal removal in a biosorption column by immobilized M. rouxii biomass. Bioresour. Technol. 2001, 78, 243–249. [Google Scholar] [PubMed]
  9. El-Safty, S.A.; Shenashen, M.A. Mercury-ion optical sensors. TrAC Trends Anal. Chem. 2012, 38, 98–115. [Google Scholar]
  10. Zhang, X.; Shiraishi, Y.; Hirai, T. Cu(II)-selective green fluorescence of a rhodamine−diacetic acid conjugate. Org. Lett. 2007, 9, 5039–5042. [Google Scholar] [PubMed]
  11. Xie, P.; Guo, F.; Li, D.; Liu, X.; Liu, L. A Cu2+ chemodosimeter based on amplified fluorescence in the red region. J. Lumin. 2011, 131, 104–108. [Google Scholar]
  12. Wang, X.; Tao, J.; Chen, X.; Yang, H. An ultrasensitive and selective “off-on” rhodamine-based colorimetric and fluorescent chemodosimeter for the detection of Cu2+. Sens. Actuators B Chem. 2017, 244, 709–716. [Google Scholar]
  13. Xie, P.; Xiao, Y.; Yao, D.; Jin, Q.; Guo, F. A novel colorimetric and fluorescent “off-on” chemosensor for Cu2+ based on a rhodamine derivative bearing naphthyridine group. J. Fluoresc. 2013, 23, 265–271. [Google Scholar] [PubMed]
  14. Yang, Y.; Gao, C.Y.; Zhang, N.; Dong, D. Tetraphenylethene functionalized rhodamine chemosensor for Fe3+ and Cu2+ ions in aqueous media. Sens. Actuators B Chem. 2016, 222, 741–746. [Google Scholar]
  15. Fang, Y.; Zhou, Y.; Rui, Q.; Yao, C. Rhodamine–ferrocene conjugate chemosensor for selectively sensing copper(II) with multisignals: Chromaticity, fluorescence, and electrochemistry and its application in living cell imaging. Organometallics 2015, 34, 2962–2970. [Google Scholar]
  16. Zhang, J.F.; Zhou, Y.; Yoon, J.; Kim, Y.; Kim, S.J.; Kim, J.S. Naphthalimide modified rhodamine derivative: Ratiometric and selective fluorescent sensor for Cu2+ based on two different approaches. Org. Lett. 2010, 12, 3852–3855. [Google Scholar] [PubMed]
  17. Ganguly, A.; Paul, B.K.; Ghosh, S.; Kar, S.; Guchhait, N. Selective fluorescence sensing of Cu(II) and Zn(II) using a new Schiff base-derived model compound: Naked eye detection and spectral deciphering of the mechanism of sensory action. Analyst 2013, 138, 6532–6541. [Google Scholar] [PubMed]
  18. Soh, J.H.; Swamy, K.M.K.; Kim, S.K.; Kim, S.; Lee, S.H.; Yoon, J. Rhodamine urea derivatives as fluorescent chemosensors for Hg2+. Tetrahedron Lett. 2007, 48, 5966–5969. [Google Scholar]
  19. Kaewtong, C.; Noiseephum, J.; Uppa, Y.; Morakot, N.; Morakot, N.; Wanno, B.; Tuntulani, T.; Pulpoka, B. A reversible Em-FRET rhodamine-based chemosensor for carboxylate anions using a ditopic receptor strategy. New J. Chem. 2010, 34, 1104–1108. [Google Scholar]
  20. Liu, B.; Zeng, F.; Wu, G.; Wu, S. A FRET-based ratiometric sensor for mercury ions in water with multi-layered silica nanoparticles as the scaffold. Chem. Commun. 2011, 47, 8913–8915. [Google Scholar]
  21. Ma, C.; Zeng, F.; Huang, L.; Wu, S. FRET-based ratiometric detection system for mercury ions in water with polymeric particles as scaffolds. J. Phys. Chem. B 2011, 115, 874–882. [Google Scholar] [PubMed]
  22. Montalbetti, C.A.; Falque, V. Amide bond formation and peptide coupling. Tetrahedron 2005, 61, 10827–10852. [Google Scholar]
  23. Yano, K.; Nishi, T. A novel route to highly monodispersed mesoporous silica spheres consisting of nano-sized particles. Microporous Mesoporous Mater. 2012, 158, 257–263. [Google Scholar]
  24. Xiang, Y.; Tong, A.; Jin, P.; Ju, Y. New fluorescent rhodamine hydrazone chemosensor for Cu(II) with high selectivity and sensitivity. Org. Lett. 2006, 8, 2863–2866. [Google Scholar] [PubMed]
  25. Yang, Y.; Gao, C.; Li, B.; Xu, L.; Duan, L. A rhodamine-based colorimetric and reversible fluorescent chemosensor for selectively detection of Cu2+ and Hg2+ ions. Sens. Actuators B Chem. 2014, 199, 121–126. [Google Scholar]
  26. Chen, C.; Men, G.; Bu, W.; Liang, C.; Sun, H.; Jiang, S. A colorimetric and fluorescent probe for multiple transition metal ions (Cu2+, Zn2+ and Ni2+): Fast response and high selectivity. Sens. Actuators B Chem. 2015, 220, 463–471. [Google Scholar]
  27. Kacmaz, S.; Ertekin, K.; Mercan, D.; Oter, O.; Cetinkaya, E.; Celik, E. An ultra sensitive fluorescent nanosensor for detection of ionic copper. Spectrochim. Acta Part A Mol. Biomol. Spectrosc. 2015, 135, 551–559. [Google Scholar]
  28. Basa, P.N.; Sykes, A.G. Differential sensing of Zn(II) and Cu(II) via two independent mechanisms. J. Org. Chem. 2012, 77, 8428–8434. [Google Scholar] [PubMed]
  29. Chatterjee, N.; Mahaling, B.; Sivakumar, S.; Bharadwaj, P.K. A highly selective and sensitive “turn-on” fluorescence chemosensor for the Cu2+ ion in aqueous ethanolic medium and its application in live cell imaging. J. Photochem. Photobiol. A Chem. 2016, 330, 110–116. [Google Scholar]
  30. Sun, Y.; Liu, Y.; Guo, W. Fluorescent and chromogenic probes bearing salicylaldehyde hydrazone functionality for cyanide detection in aqueous solution. Sens. Actuators B Chem. 2009, 143, 171–176. [Google Scholar]
  31. United States Environmental Protection Agency (USEPA). Basic Information about Copper in Drinking Water. Available online: http://water.epa.gov/drink/contaminants/basicinformation/copper.cfm (accessed on 5 January 2017).
  32. Kim, H.S.; Angupillai, S.; Son, Y.A. A dual chemosensor for both Cu2+ and Al3+: A potential Cu2+ and Al3+ switched YES logic function with an INHIBIT logic gate and a novel solid sensor for detection and extraction of Al3+ ions from aqueous solution. Sens. Actuators B Chem. 2016, 222, 447–458. [Google Scholar]
  33. Kaur, M.; Cho, M.J.; Choi, D.H. A phenothiazine-based “naked-eye” fluorescent probe for the dual detection of Hg2+ and Cu2+: Application as a solid state sensor. Dyes Pigments 2016, 125, 1–7. [Google Scholar]
  34. Erdemir, S.; Malkondu, S. Novel “turn on” fluorescent sensors based on anthracene and carbazone units for Cu(II) ion in CH3CN–H2O. J. Lumin. 2015, 158, 86–90. [Google Scholar]
  35. Peralta-Domínguez, D.; Rodriguez, M.; Ramos-Ortiz, G.; Maldonado, J.L.; Luna-Moreno, D.; Ortiz-Gutierrez, M.; Barba, V. A Schiff base derivative used as sensor of copper through colorimetric and surface plasmon resonance techniques. Sens. Actuators B Chem. 2016, 225, 221–227. [Google Scholar]
  36. Lu, D.; Lei, J.; Tian, Z.; Wang, L.; Zhang, J. Cu2+ fluorescent sensor based on mesoporous silica nanosphere. Dyes Pigments 2012, 94, 239–246. [Google Scholar]
  37. Zhou, Z.; Zheng, Y.; Wang, Q. Thiazole derivative based terbium(III) covalent silica nanosphere and its sensing property. Inorg. Chim. Acta 2013, 394, 127–131. [Google Scholar]
  38. Nugent, J.W.; Reibenspies, J.H.; Hancock, R.D. Controlling the fluorescence response of pet sensors via the metal-ion π-contacting ability of the fluorophore: Coumarin, a weaker π contacter. Inorg. Chem. 2015, 54, 9976–9988. [Google Scholar] [PubMed]
  39. Tobita, S.; Arakawa, M.; Tanaka, I. The paramagnetic metal effect on the ligand localized S1 .apprx. .fwdarw. T1 intersystem crossing in the rare-earth-metal complexes with methyl salicylate. J. Phys. Chem. 1985, 89, 5649–5654. [Google Scholar]
  40. Formica, M.; Fusi, V.; Giorgi, L.; Micheloni, M. New fluorescent chemosensors for metal ions in solution. Coord. Chem. Rev. 2012, 256, 170–192. [Google Scholar]
  41. Shao, N.; Zhang, Y.; Cheung, S.; Yang, R.; Chan, W.; Mo, T.; Li, K.A.; Liu, F. Copper ion-selective fluorescent sensor based on the inner filter effect using a spiropyran derivative. Anal. Chem. 2005, 77, 7294–7303. [Google Scholar] [PubMed]
  42. Su, Y.; Shi, B.; Liao, S.; Qin, Y.; Zhang, L.; Huang, M.; Zhao, S. Facile preparation of fluorescent polydihydroxyphenylalanine nanoparticles for label-free detection of copper ions. Sens. Actuators B Chem. 2016, 225, 334–339. [Google Scholar]
  43. Ghaedi, M.; Shahamiri, A.; Mirtamizdoust, B.; Hajati, S.; Taghizadeh, F. A novel polyvinyl chloride-membrane optical sensor for the determination of Cu2+ ion based on synthesized (N′1E,N′2E)-N′1,N′2-bis(pyridine-2-ylmethylene)oxalohydrazide: Experimental design and optimization. Spectrochim. Acta Part A Mol. Biomol. Spectrosc. 2015, 138, 878–884. [Google Scholar]
  44. Kim, S.; Kwak, J.; Lee, S.Y. Optical sensing of copper (II) ions using a biofunctional bolaamphiphile self-assembly: Selective binding of copper (II) ions to tyrosine moieties. Sens. Actuators B Chem. 2014, 203, 483–489. [Google Scholar]
  45. Huang, L.; Wang, X.; Xie, G.; Xi, P.; Li, Z.; Xu, M.; Wu, Y.; Bai, D.; Zeng, Z. A new rhodamine-based chemosensor for Cu2+ and the study of its behaviour in living cells. R. Soc. Chem. Dalton Trans. 2010, 39, 7894–7896. [Google Scholar]
  46. Swamy, K.M.K.; Ko, S.; Kwon, S.K.; Lee, H.N.; Mao, C.; Kim, J.; Lee, K.; Kim, J.; Shin, I.; Yoon, J. Boronic acid-linked fluorescent and colorimetric probes for copper ions. Chem. Commun. 2008, 5915–5917. [Google Scholar] [CrossRef]
Figure 1. Synthesis route of compounds: rhodamine-B-lactam-ethylenediamine (RE) and RE–carbonyl morpholine (RECM).
Chemosensors 05 00026 g001
Figure 2. Fluorescence spectra (λex = 530 nm) of RECM (50 µM) in CH3CN in the presence of various competitive cations (30 µM).
Chemosensors 05 00026 g002
Figure 3. Absorbance spectra of RECM (50 µM) in CH3CN in the presence of various competitive cations (30 µM), Inset: Visual color changes of RECM (50 µM) in CH3CN in the presence of various competitive cations (30 µM).
Chemosensors 05 00026 g003
Figure 4. Fluorescence spectra (λex = 530 nm) of RECM (50 µM) in CH3CN in the presence of (a) 0–55 µM and (b) 55–100 µM of Cu2+, respectively. Inset: Linear fluorescence response of RECM (50 µM) in CH3CN within the Cu2+ concentration range of 1–55 µM.
Chemosensors 05 00026 g004
Figure 5. Absorbance spectra of RECM (50 µM) in CH3CN in the presence of (a) 0–45 µM and (b) 45–100 µM of Cu2+, respectively, Inset: Linear absorbance response of RECM (50 µM) in CH3CN within the Cu2+ concentration range of 1–45 µM.
Chemosensors 05 00026 g005
Figure 6. Absorbance spectra of RECM (50 µM) in CH3CN in the presence of 30 µM of Cu2+ in 0–120 min after mixing together.
Chemosensors 05 00026 g006
Figure 7. The binding stoichiometry of the RECM–Cu2+ complex, according to the job plot method. Inset: the Benesi–Hildebrand plot result to evaluate Ka of the RECM–Cu2+ complex.
Chemosensors 05 00026 g007
Figure 8. Proposed binding mode and Cu2+ sensing mechanism of RECM.
Chemosensors 05 00026 g008

