Illuminating Brain Activities with Fluorescent Protein-Based Biosensors


Abstract
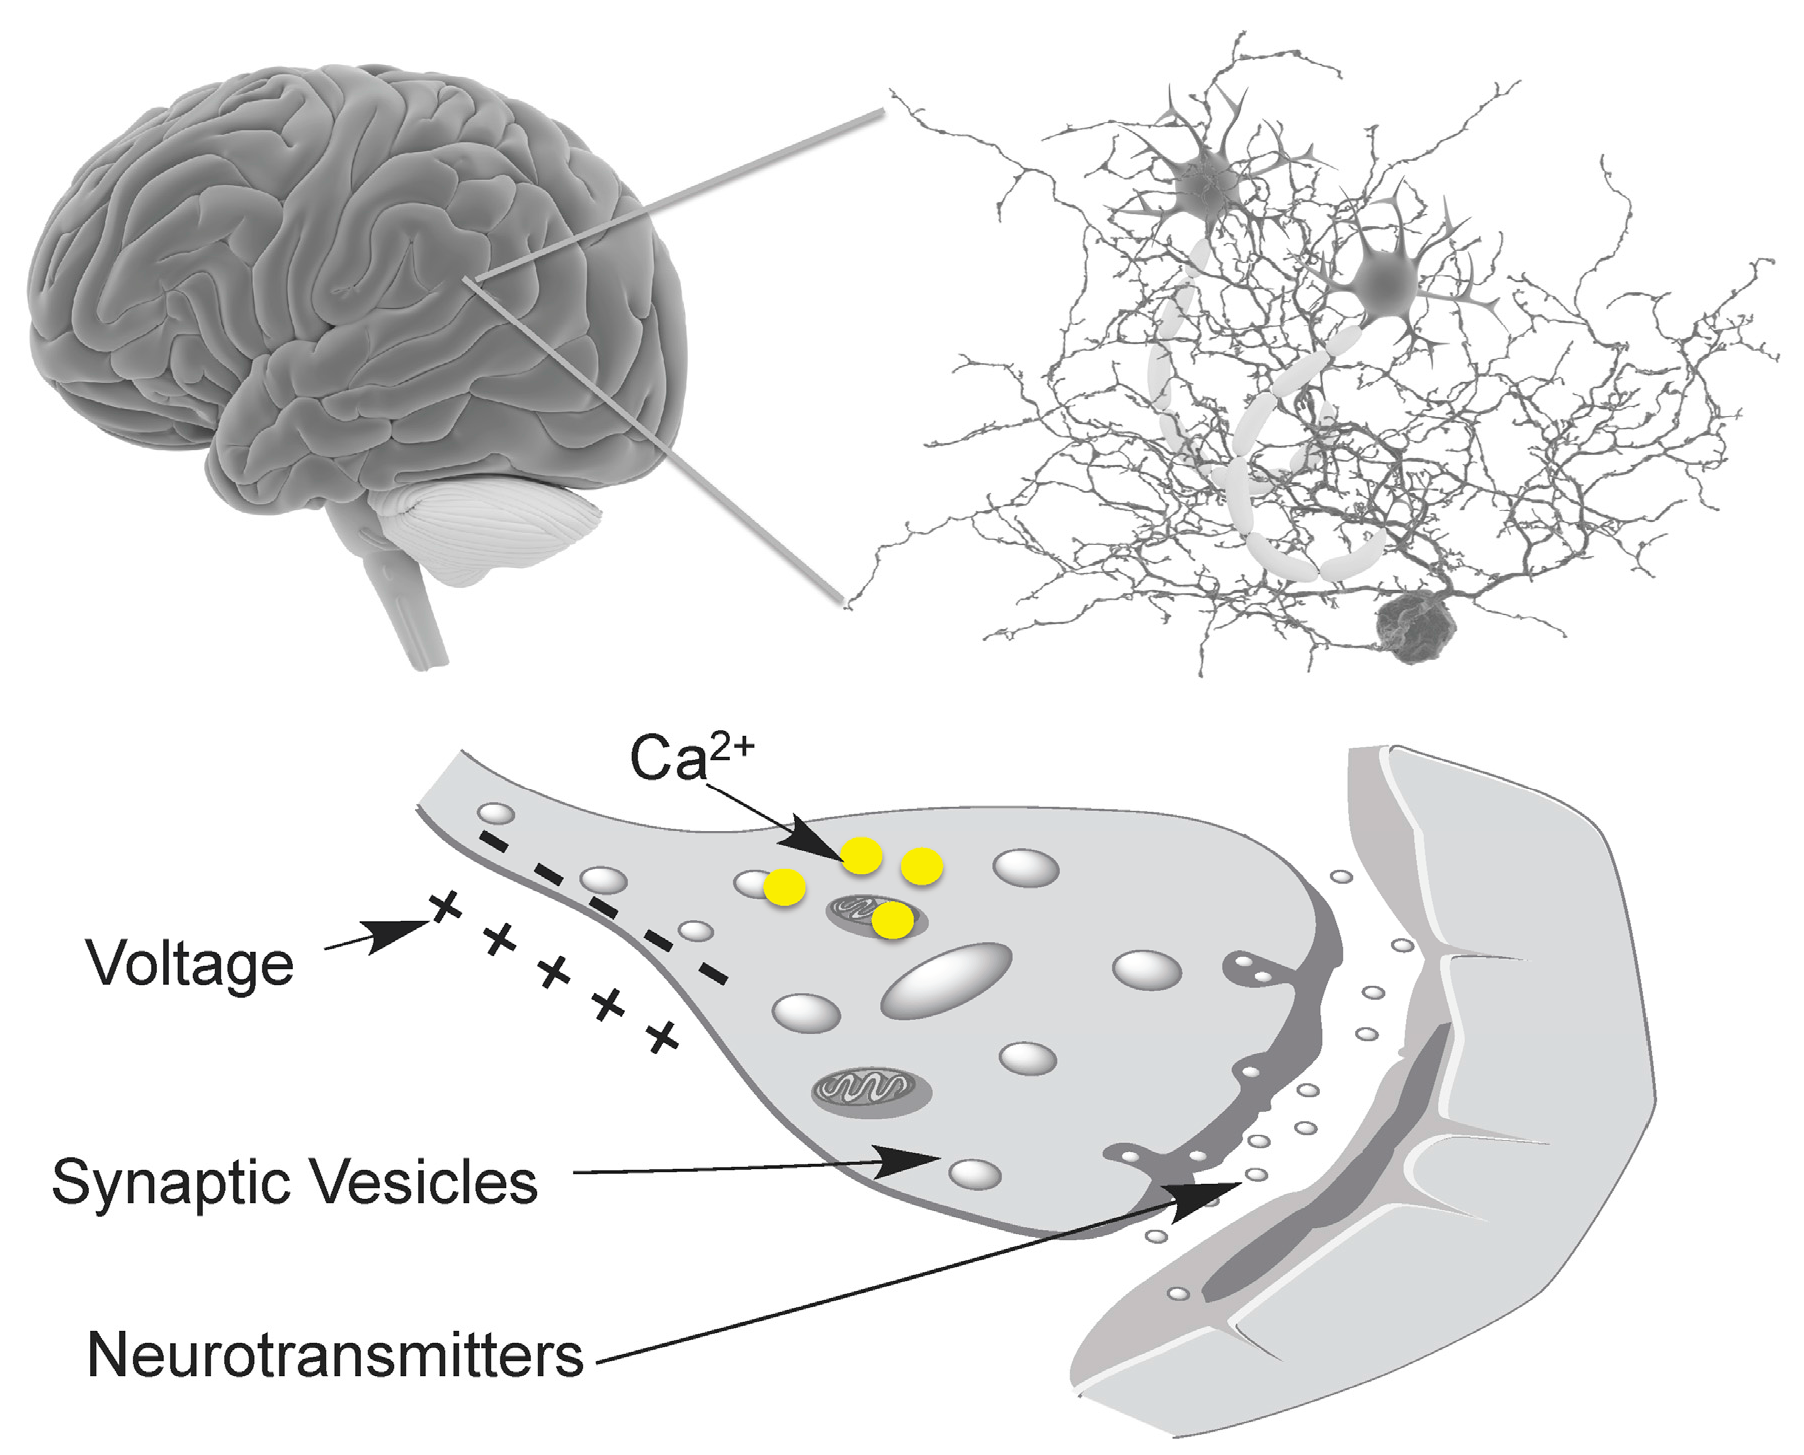
1. Introduction
2. Genetically Encoded Ca2+ Indicators (GECI)
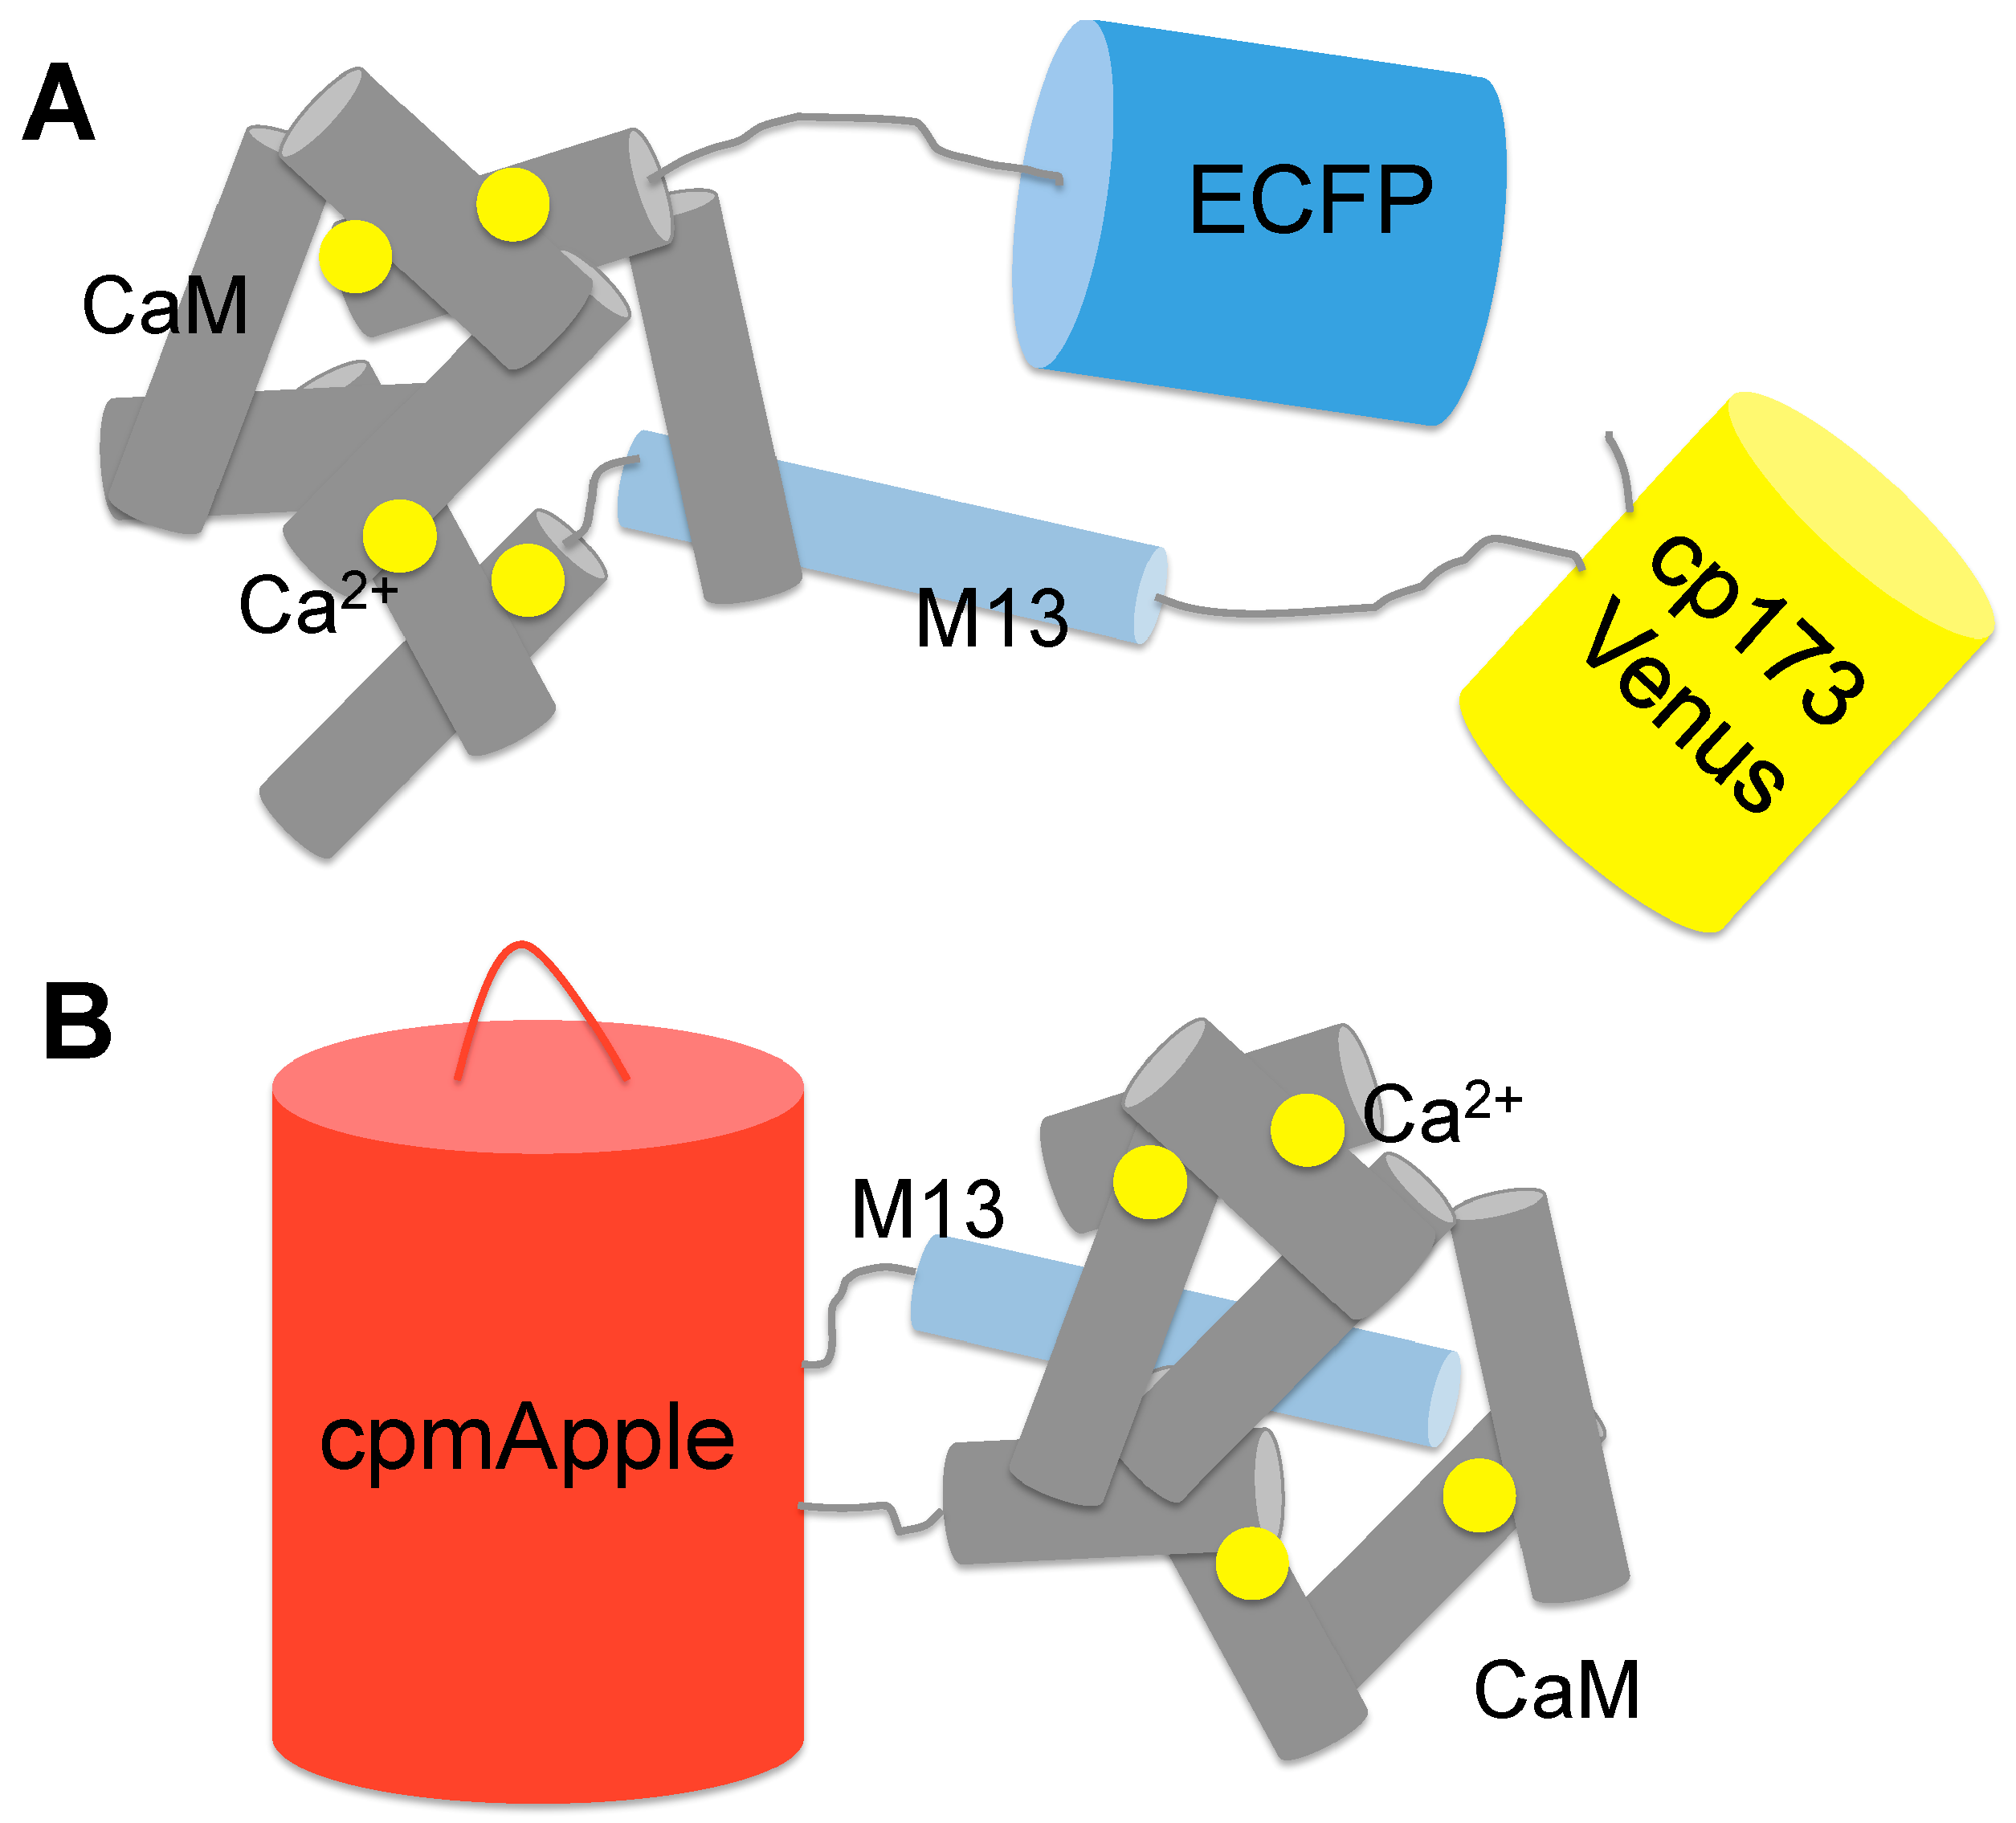
2.1. GECIs Based on FRET
2.2. GECIs Based on BRET
2.3. Single FP-Based GECIs
3. Genetically Encoded Voltage Indicators (GEVIs)
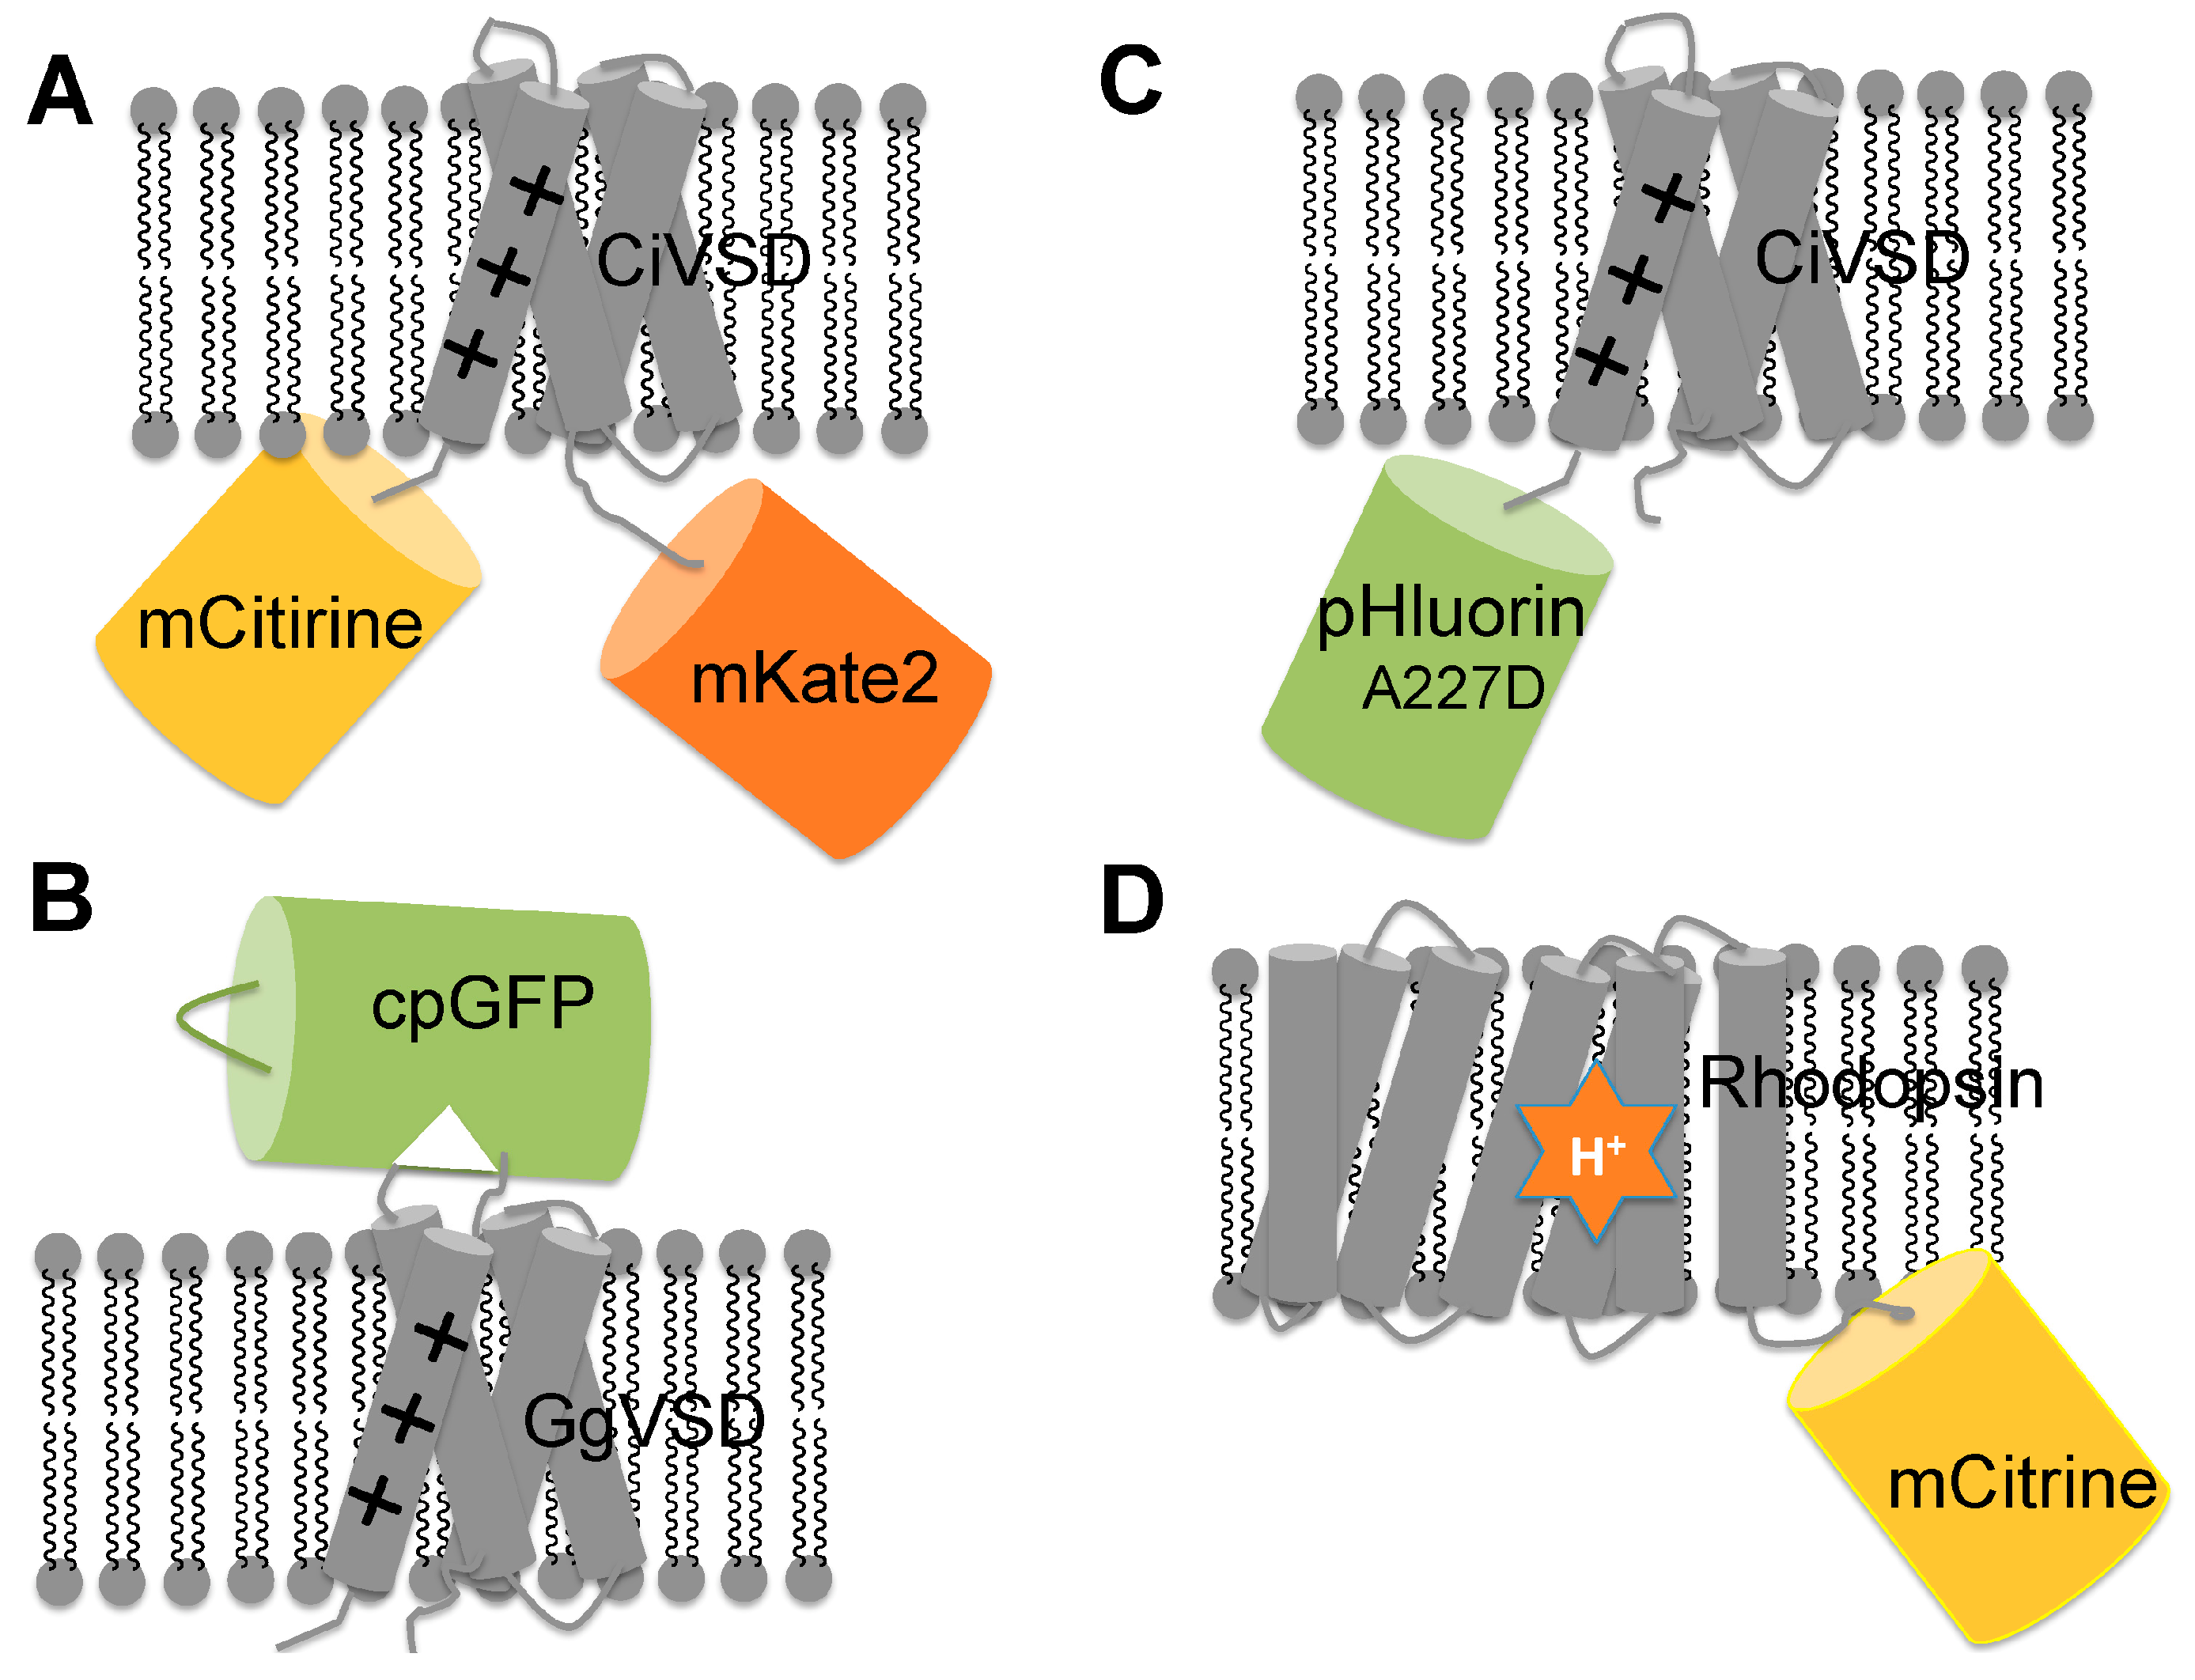
3.1. GEVIs Based on Voltage Sensitive Domains (VSDs)
3.2. GEVIs Based on Microbial Rhodopsins
4. Genetically Encoded Fluorescent Indicators of Synaptic Activity
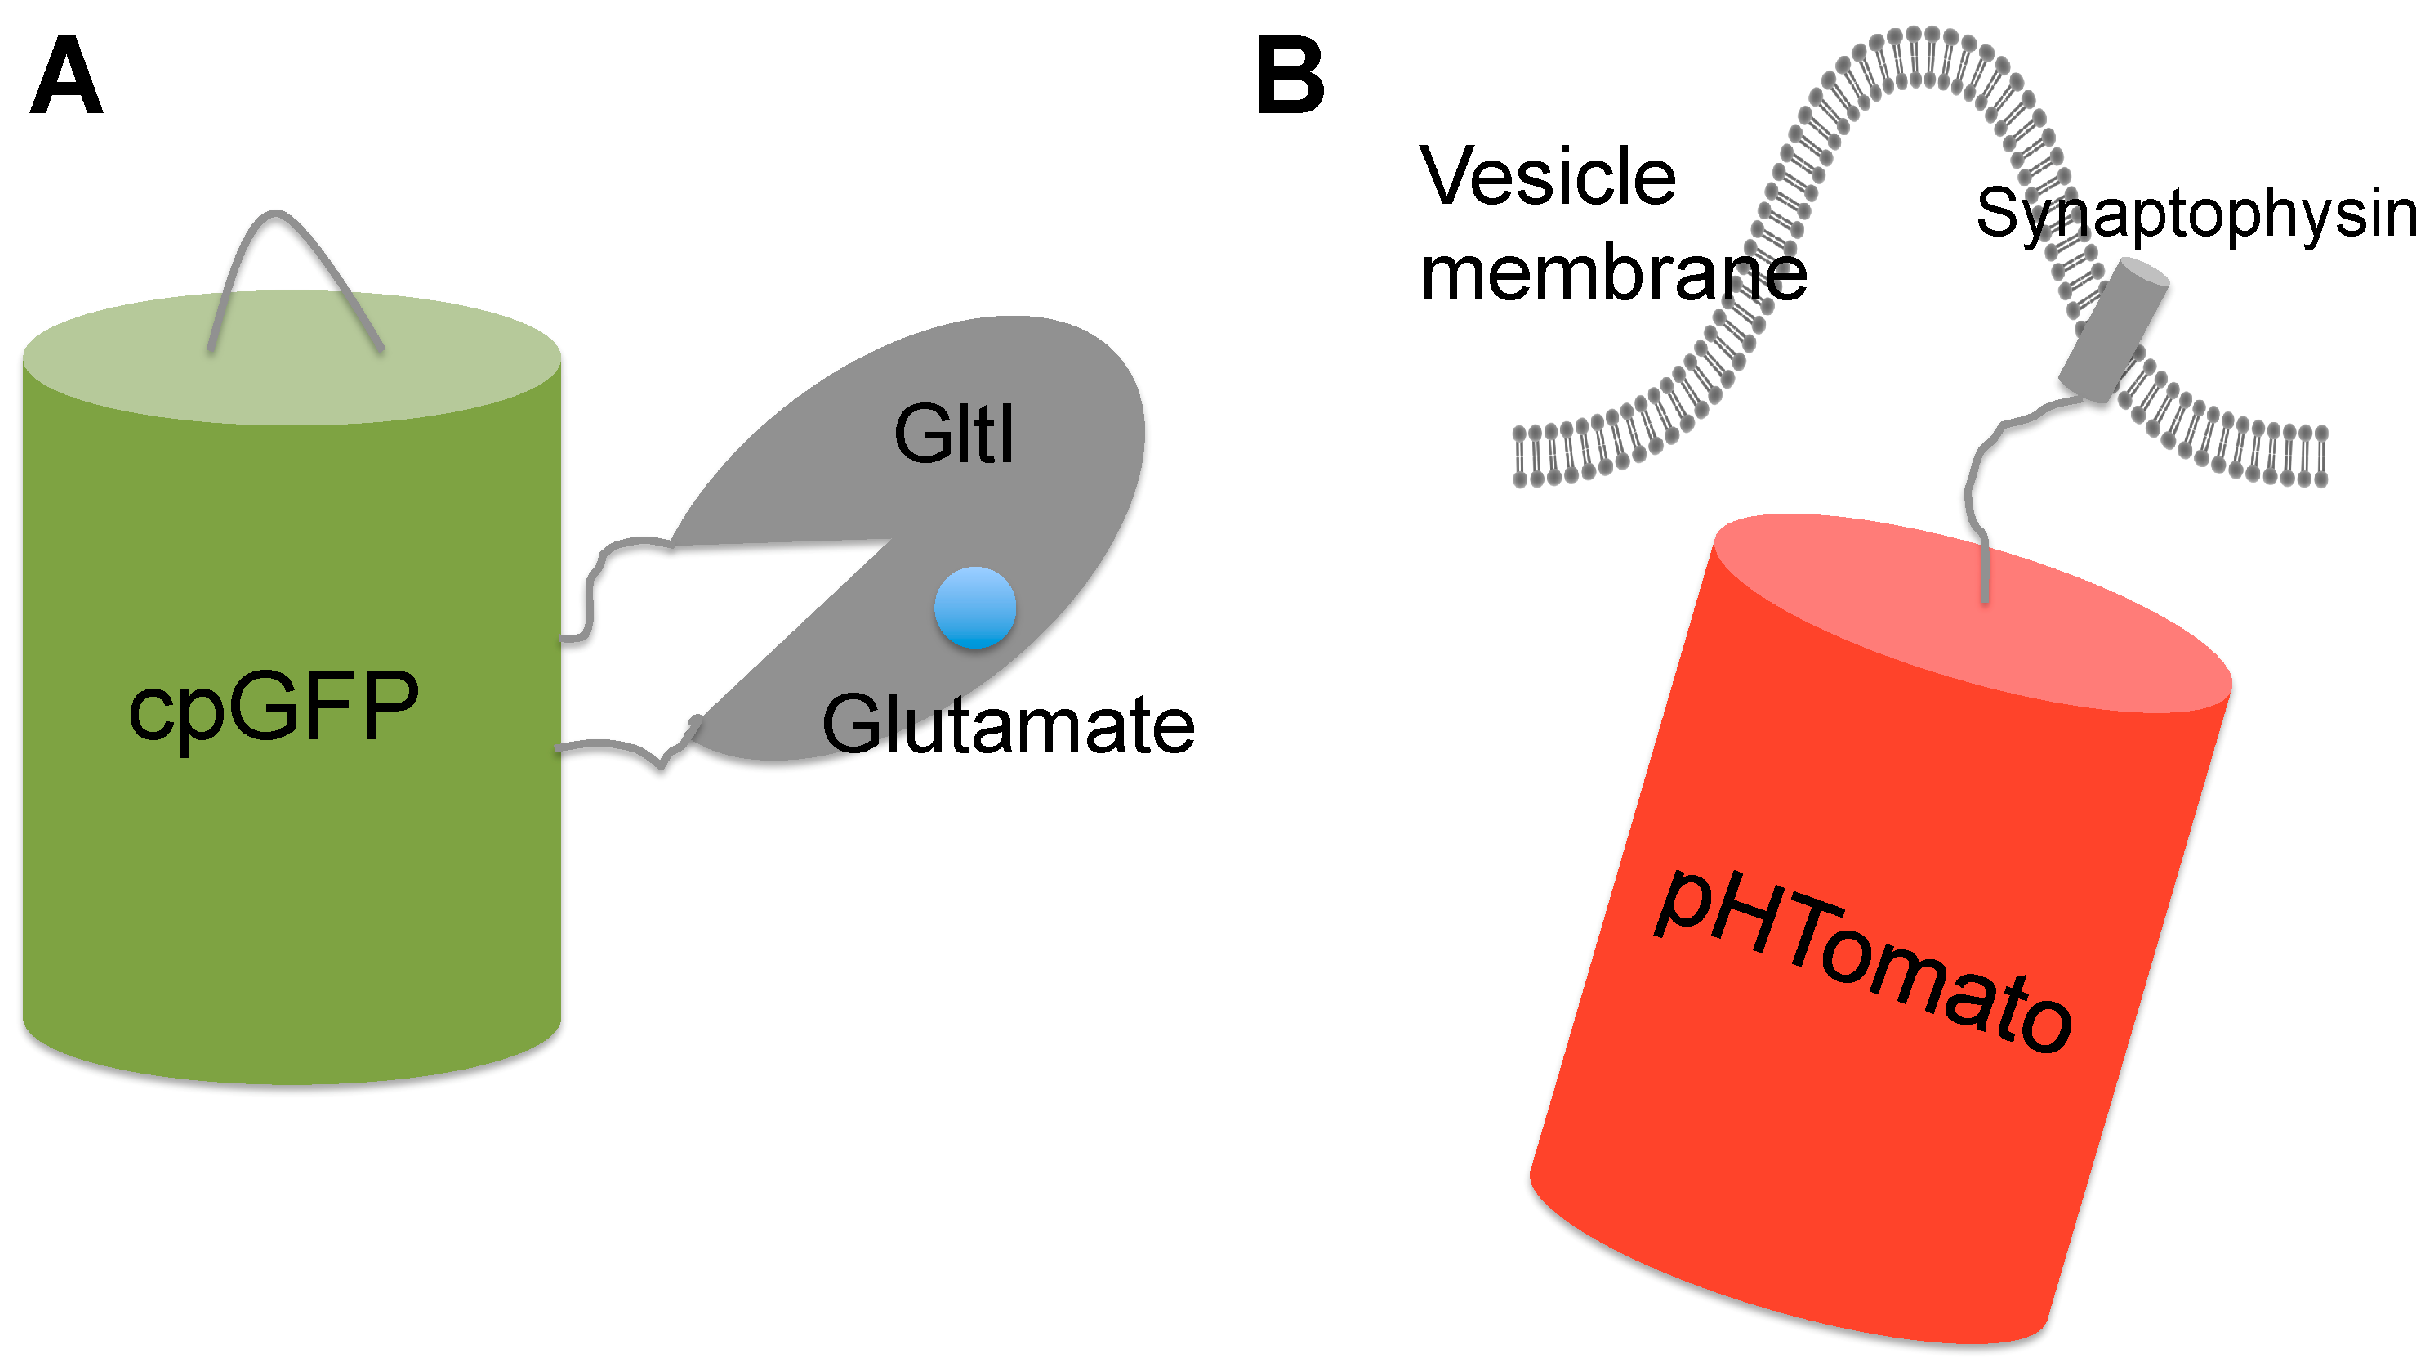
4.1. Genetically Encoded Glutamate Indicators
4.2. Genetically Encoded pH Indicators for Synaptic Vesicle Recycling
5. Future Perspectives
Acknowledgments
Conflicts of Interest
References
- Azevedo, F.A.C.; Carvalho, L.R.B.; Grinberg, L.T.; Farfel, J.M.; Ferretti, R.E.L.; Leite, R.E.P.; Jacob, W.; Lent, R.; Herculano-Houzel, S. Equal Numbers of Neuronal and Nonneuronal Cells Make the Human Brain an Isometrically Scaled-Up Primate Brain. J. Comp. Neurol. 2009, 513, 532–541. [Google Scholar] [CrossRef] [PubMed]
- Chen, J.L.; Andermann, M.L.; Keck, T.; Xu, N.L.; Ziv, Y. Imaging Neuronal Populations in Behaving Rodents: Paradigms for Studying Neural Circuits Underlying Behavior in the Mammalian Cortex. J. Neurosci. 2013, 33, 17631–17640. [Google Scholar] [CrossRef] [PubMed]
- Knopfel, T.; Gallero-Salas, Y.; Song, C.C. Genetically encoded voltage indicators for large scale cortical imaging come of age. Curr. Opin. Chem. Biol. 2015, 27, 75–83. [Google Scholar] [CrossRef] [PubMed]
- Spires, T.L.; Meyer-Luehmann, M.; Stern, E.A.; McLean, P.J.; Skoch, J.; Nguyen, P.T.; Bacskai, B.J.; Hyman, B.T. Dendritic spine abnormalities in amyloid precursor protein transgenic mice demonstrated by gene transfer and intravital multiphoton microscopy. J. Neurosci. 2005, 25, 7278–7287. [Google Scholar] [CrossRef] [PubMed]
- Ayata, C.; Dunn, A.K.; Gursoy, O.Y.; Huang, Z.; Boas, D.A.; Moskowitz, M.A. Laser speckle flowmetry for the study of cerebrovascular physiology in normal and ischemic mouse cortex. J. Cereb. Blood Flow Metab. 2004, 24, 744–755. [Google Scholar] [CrossRef] [PubMed]
- Bahar, S.; Suh, M.; Zhao, M.; Schwartz, T.H. Intrinsic optical signal imaging of neocortical seizures: The ‘epileptic dip’. Neuroreport 2006, 17, 499–503. [Google Scholar] [CrossRef] [PubMed]
- Yang, W.; Yuste, R. In vivo imaging of neural activity. Nat. Methods 2017, 14, 349–359. [Google Scholar] [CrossRef] [PubMed]
- Hillman, E.M.C. Optical brain imaging in vivo: Techniques and applications from animal to man. J. Biomed. Opt. 2007, 12, 051402. [Google Scholar] [CrossRef] [PubMed]
- Matthews, P.M.; Honey, G.D.; Bullmore, E.T. Applications of fMRI in translational medicine and clinical practice. Nat. Rev. Neurosci. 2006, 7, 732–744. [Google Scholar] [CrossRef] [PubMed]
- Politis, M.; Piccini, P. Positron emission tomography imaging in neurological disorders. J. Neurol. 2012, 259, 1769–1780. [Google Scholar] [CrossRef] [PubMed]
- Robb, R.A. X-ray computed tomography: From basic principles to applications. Annu. Rev. Biophys. Bioeng. 1982, 11, 177–201. [Google Scholar] [CrossRef] [PubMed]
- Trzepacz, P.T.; Yu, P.; Sun, J.; Schuh, K.; Case, M.; Witte, M.M.; Hochstetler, H.; Hake, A.; Alzheimer’s Disease Neuroimaging Initiative. Comparison of neuroimaging modalities for the prediction of conversion from mild cognitive impairment to Alzheimer’s dementia. Neurobiol. Aging 2014, 35, 143–151. [Google Scholar] [CrossRef] [PubMed]
- Hamel, E.J.O.; Grewe, B.F.; Parker, J.G.; Schnitzer, M.J. Cellular Level Brain Imaging in Behaving Mammals: An Engineering Approach. Neuron 2015, 86, 140–159. [Google Scholar] [CrossRef] [PubMed]
- Bialek, W.; Rieke, F.; Vansteveninck, R.R.D.; Warland, D. Reading a Neural Code. Science 1991, 252, 1854–1857. [Google Scholar] [CrossRef] [PubMed]
- Buzsaki, G. Large-scale recording of neuronal ensembles. Nat. Neurosci. 2004, 7, 446–451. [Google Scholar] [CrossRef] [PubMed]
- Scanziani, M.; Hausser, M. Electrophysiology in the age of light. Nature 2009, 461, 930–939. [Google Scholar] [CrossRef] [PubMed]
- Wilt, B.A.; Burns, L.D.; Ho, E.T.W.; Ghosh, K.K.; Mukamel, E.A.; Schnitzer, M.J. Advances in Light Microscopy for Neuroscience. Annu. Rev. Neurosci. 2009, 32, 435–506. [Google Scholar] [CrossRef] [PubMed]
- Knopfel, T. Genetically encoded optical indicators for the analysis of neuronal circuits. Nat. Rev. Neurosci. 2012, 13, 687–700. [Google Scholar] [CrossRef] [PubMed]
- Smetters, D.; Majewska, A.; Yuste, R. Detecting action potentials in neuronal populations with calcium imaging. Methods Companion Methods Enzymol. 1999, 18, 215–221. [Google Scholar] [CrossRef] [PubMed]
- Grinvald, A.; Hildesheim, R. VSDI: A new era in functional imaging of cortical dynamics. Nat. Rev. Neurosci. 2004, 5, 874–885. [Google Scholar] [CrossRef] [PubMed]
- Wachowiak, M.; Knopfel, T. Optical Imaging of Brain Activity. In In Vivo Using Genetically Encoded Probes. In Vivo Optical Imaging of Brain Function, 2nd ed.; CRC Press: Boca Raton, FL, USA, 2009. [Google Scholar]
- Broussard, G.J.; Liang, R.; Tian, L. Monitoring activity in neural circuits with genetically encoded indicators. Front. Mol. Neurosci. 2014, 7, 97. [Google Scholar] [CrossRef] [PubMed]
- Tantama, M.; Hung, Y.P.; Yellen, G. Optogenetic reporters: Fluorescent protein-based genetically encoded indicators of signaling and metabolism in the brain. Optogenet. Tools Controll. Monit. Neuronal Act. 2012, 196, 235–263. [Google Scholar]
- Lin, M.Z.; Schnitzer, M.J. Genetically encoded indicators of neuronal activity. Nat. Neurosci. 2016, 19, 1142–1153. [Google Scholar] [CrossRef] [PubMed]
- Berridge, M.J. Neuronal calcium signaling. Neuron 1998, 21, 13–26. [Google Scholar] [CrossRef]
- Berridge, M.J.; Lipp, P.; Bootman, M.D. The versatility and universality of calcium signalling. Nat. Rev. Mol. Cell Biol. 2000, 1, 11–21. [Google Scholar] [CrossRef] [PubMed]
- Tank, D.W.; Sugimori, M.; Connor, J.A.; Llinas, R.R. Spatially resolved calcium dynamics of mammalian Purkinje cells in cerebellar slice. Science 1988, 242, 773–777. [Google Scholar] [CrossRef] [PubMed]
- Tian, L.; Hires, S.A.; Looger, L.L. Imaging neuronal activity with genetically encoded calcium indicators. Cold Spring Harb. Protoc. 2012, 2012, 647–656. [Google Scholar] [CrossRef] [PubMed]
- Garaschuk, O.; Milos, R.I.; Grienberger, C.; Marandi, N.; Adelsberger, H.; Konnerth, A. Optical monitoring of brain function in vivo: From neurons to networks. Pflug. Arch. 2006, 453, 385–396. [Google Scholar] [CrossRef] [PubMed]
- Russell, J.T. Imaging calcium signals in vivo: A powerful tool in physiology and pharmacology. Br. J. Pharmacol. 2011, 163, 1605–1625. [Google Scholar] [CrossRef] [PubMed]
- Miyawaki, A.; Llopis, J.; Heim, R.; McCaffery, J.M.; Adams, J.A.; Ikura, M.; Tsien, R.Y. Fluorescent indicators for Ca2+ based on green fluorescent proteins and calmodulin. Nature 1997, 388, 882–887. [Google Scholar] [CrossRef] [PubMed]
- Miyawaki, A.; Griesbeck, O.; Heim, R.; Tsien, R.Y. Dynamic and quantitative Ca2+ measurements using improved cameleons. Proc. Natl. Acad. Sci. USA 1999, 96, 2135–2140. [Google Scholar] [CrossRef] [PubMed]
- Nagai, T.; Yamada, S.; Tominaga, T.; Ichikawa, M.; Miyawaki, A. Expanded dynamic range of fluorescent indicators for Ca(2+) by circularly permuted yellow fluorescent proteins. Proc. Natl. Acad. Sci. USA 2004, 101, 10554–10559. [Google Scholar] [CrossRef] [PubMed]
- Truong, K.; Sawano, A.; Mizuno, H.; Hama, H.; Tong, K.I.; Mal, T.K.; Miyawaki, A.; Ikura, M. FRET-based in vivo Ca2+ imaging by a new calmodulin-GFP fusion molecule. Nat. Struct. Biol. 2001, 8, 1069–1073. [Google Scholar] [CrossRef] [PubMed]
- Palmer, A.E.; Giacomello, M.; Kortemme, T.; Hires, S.A.; Lev-Ram, V.; Baker, D.; Tsien, R.Y. Ca2+ indicators based on computationally redesigned calmodulin-peptide pairs. Chem. Biol. 2006, 13, 521–530. [Google Scholar] [CrossRef] [PubMed]
- Horikawa, K.; Yamada, Y.; Matsuda, T.; Kobayashi, K.; Hashimoto, M.; Matsu-ura, T.; Miyawaki, A.; Michikawa, T.; Mikoshiba, K.; Nagai, T. Spontaneous network activity visualized by ultrasensitive Ca(2+) indicators, yellow Cameleon-Nano. Nat. Methods 2010, 7, 729–732. [Google Scholar] [CrossRef] [PubMed]
- Heim, N.; Griesbeck, O. Genetically encoded indicators of cellular calcium dynamics based on troponin C and green fluorescent protein. J. Biol. Chem. 2004, 279, 14280–14286. [Google Scholar] [CrossRef] [PubMed]
- Mank, M.; Reiff, D.F.; Heim, N.; Friedrich, M.W.; Borst, A.; Griesbeck, O. A FRET-based calcium biosensor with fast signal kinetics and high fluorescence change. Biophys. J. 2006, 90, 1790–1796. [Google Scholar] [CrossRef] [PubMed]
- Mank, M.; Santos, A.F.; Direnberger, S.; Mrsic-Flogel, T.D.; Hofer, S.B.; Stein, V.; Hendel, T.; Reiff, D.F.; Levelt, C.; Borst, A.; et al. A genetically encoded calcium indicator for chronic in vivo two-photon imaging. Nat. Methods 2008, 5, 805–811. [Google Scholar] [CrossRef] [PubMed]
- Liu, S.; He, J.; Jin, H.; Yang, F.; Lu, J.; Yang, J. Enhanced dynamic range in a genetically encoded Ca2+ sensor. Biochem. Biophys. Res. Commun. 2011, 412, 155–159. [Google Scholar] [CrossRef] [PubMed]
- Thestrup, T.; Litzlbauer, J.; Bartholomaus, I.; Mues, M.; Russo, L.; Dana, H.; Kovalchuk, Y.; Liang, Y.J.; Kalamakis, G.; Laukat, Y.; et al. Optimized ratiometric calcium sensors for functional in vivo imaging of neurons and T lymphocytes. Nat. Methods 2014, 11, 175. [Google Scholar] [CrossRef] [PubMed]
- Saito, K.; Hatsugai, N.; Horikawa, K.; Kobayashi, K.; Matsu-ura, T.; Mikoshiba, K.; Nagai, T. Auto-Luminescent Genetically-Encoded Ratiometric Indicator for Real-Time Ca2+ Imaging at the Single Cell Level. PLoS ONE 2010, 5, e9935. [Google Scholar] [CrossRef] [PubMed]
- Saito, K.; Chang, Y.F.; Horikawa, K.; Hatsugai, N.; Higuchi, Y.; Hashida, M.; Yoshida, Y.; Matsuda, T.; Arai, Y.; Nagai, T. Luminescent proteins for high-speed single-cell and whole-body imaging. Nat. Commun. 2012, 3, 1262. [Google Scholar] [CrossRef] [PubMed]
- Baird, G.S.; Zacharias, D.A.; Tsien, R.Y. Circular permutation and receptor insertion within green fluorescent proteins. Proc. Natl. Acad. Sci. USA 1999, 96, 11241–11246. [Google Scholar] [CrossRef] [PubMed]
- Griesbeck, O.; Baird, G.S.; Campbell, R.E.; Zacharias, D.A.; Tsien, R.Y. Reducing the environmental sensitivity of yellow fluorescent protein—Mechanism and applications. J. Biol. Chem. 2001, 276, 29188–29194. [Google Scholar] [CrossRef] [PubMed]
- Nagai, T.; Sawano, A.; Park, E.S.; Miyawaki, A. Circularly permuted green fluorescent proteins engineered to sense Ca2+. Proc. Natl. Acad. Sci. USA 2001, 98, 3197–3202. [Google Scholar] [CrossRef] [PubMed]
- Nakai, J.; Ohkura, M.; Imoto, K. A high signal-to-noise Ca(2+) probe composed of a single green fluorescent protein. Nat. Biotechnol. 2001, 19, 137–141. [Google Scholar] [CrossRef] [PubMed]
- Reiff, D.F.; Ihring, A.; Guerrero, G.; Isacoff, E.Y.; Joesch, M.; Nakai, J.; Borst, A. In vivo performance of genetically encoded indicators of neural activity in flies. J. Neurosci. 2005, 25, 4766–4778. [Google Scholar] [CrossRef] [PubMed]
- Diez-Garcia, J.; Matsushita, S.; Mutoh, H.; Nakai, J.; Ohkura, M.; Yokoyama, J.; Dimitrov, D.; Knopfel, T. Activation of cerebellar parallel fibers monitored in transgenic mice expressing a fluorescent Ca2+ indicator protein. Eur. J. Neurosci. 2005, 22, 627–635. [Google Scholar] [CrossRef] [PubMed]
- Tian, L.; Hires, S.A.; Mao, T.; Huber, D.; Chiappe, M.E.; Chalasani, S.H.; Petreanu, L.; Akerboom, J.; McKinney, S.A.; Schreiter, E.R.; et al. Imaging neural activity in worms, flies and mice with improved GCaMP calcium indicators. Nat. Methods 2009, 6, 875–881. [Google Scholar] [CrossRef] [PubMed]
- Shindo, A.; Hara, Y.; Yamamoto, T.S.; Ohkura, M.; Nakai, J.; Ueno, N. Tissue-Tissue Interaction-Triggered Calcium Elevation is Required for Cell Polarization during Xenopus Gastrulation. PLoS ONE 2010, 5, e8897. [Google Scholar] [CrossRef] [PubMed]
- Muto, A.; Ohkura, M.; Kotani, T.; Higashijima, S.; Nakai, J.; Kawakami, K. Genetic visualization with an improved GCaMP calcium indicator reveals spatiotemporal activation of the spinal motor neurons in zebrafish. Proc. Natl. Acad. Sci. USA 2011, 108, 5425–5430. [Google Scholar] [CrossRef] [PubMed]
- Akerboom, J.; Chen, T.W.; Wardill, T.J.; Tian, L.; Marvin, J.S.; Mutlu, S.; Calderon, N.C.; Esposti, F.; Borghuis, B.G.; Sun, X.R.; et al. Optimization of a GCaMP calcium indicator for neural activity imaging. J. Neurosci. 2012, 32, 13819–13840. [Google Scholar] [CrossRef] [PubMed]
- Sun, X.N.R.; Badura, A.; Pacheco, D.A.; Lynch, L.A.; Schneider, E.R.; Taylor, M.P.; Hogue, I.B.; Enquist, L.W.; Murthy, M.; Wang, S.S.H. Fast GCaMPs for improved tracking of neuronal activity. Nat. Commun. 2013, 4, 2170. [Google Scholar] [CrossRef] [PubMed]
- Chen, T.W.; Wardill, T.J.; Sun, Y.; Pulver, S.R.; Renninger, S.L.; Baohan, A.; Schreiter, E.R.; Kerr, R.A.; Orger, M.B.; Jayaraman, V.; et al. Ultrasensitive fluorescent proteins for imaging neuronal activity. Nature 2013, 499, 295–300. [Google Scholar] [CrossRef] [PubMed]
- Zhao, Y.; Araki, S.; Wu, J.; Teramoto, T.; Chang, Y.F.; Nakano, M.; Abdelfattah, A.S.; Fujiwara, M.; Ishihara, T.; Nagai, T.; et al. An expanded palette of genetically encoded Ca2+ indicators. Science 2011, 333, 1888–1891. [Google Scholar] [CrossRef] [PubMed]
- Wu, J.H.; Liu, L.; Matsuda, T.; Zhao, Y.X.; Rebane, A.; Drobizhev, M.; Chang, Y.F.; Araki, S.; Arai, Y.; March, K.; et al. Improved Orange and Red Ca2+ Indicators and Photophysical Considerations for Optogenetic Applications. ACS Chem. Neurosci. 2013, 4, 963–972. [Google Scholar] [CrossRef] [PubMed]
- Ohkura, M.; Sasaki, T.; Kobayashi, C.; Ikegaya, Y.; Nakai, J. An Improved Genetically Encoded Red Fluorescent Ca2+ Indicator for Detecting Optically Evoked Action Potentials. PLoS ONE 2012, 7, e39933. [Google Scholar] [CrossRef] [PubMed]
- Zhao, Y.X.; Abdelfattah, A.S.; Zhao, Y.F.; Ruangkittisakul, A.; Ballanyi, K.; Campbell, R.E.; Harrison, D.J. Microfluidic cell sorter-aided directed evolution of a protein-based calcium ion indicator with an inverted fluorescent response. Integr. Biol. 2014, 6, 714–725. [Google Scholar] [CrossRef] [PubMed]
- Wu, J.H.; Abdelfattah, A.S.; Miraucourt, L.S.; Kutsarova, E.; Ruangkittisakul, A.; Zhou, H.; Ballanyi, K.; Wicks, G.; Drobizhev, M.; Rebane, A.; et al. A long Stokes shift red fluorescent Ca2+ indicator protein for two-photon and ratiometric imaging. Nat. Commun. 2014, 5, 5262. [Google Scholar] [CrossRef] [PubMed]
- Hoi, H.; Matsuda, T.; Nagai, T.; Campbell, R.E. Highlightable Ca2+ Indicators for Live Cell Imaging. J. Am. Chem. Soc. 2013, 135, 46–49. [Google Scholar] [CrossRef] [PubMed]
- Wu, J.H.; Prole, D.L.; Shen, Y.; Lin, Z.H.; Gnanasekaran, A.; Liu, Y.J.; Chen, L.D.; Zhou, H.; Cheng, S.R.W.; Usachev, Y.M.; et al. Red fluorescent genetically encoded Ca2+ indicators for use in mitochondria and endoplasmic reticulum. Biochem. J. 2014, 464, 13–22. [Google Scholar] [CrossRef] [PubMed]
- Akerboom, J.; Calderon, N.C.; Tian, L.; Wabnig, S.; Prigge, M.; Tolo, J.; Gordus, A.; Orger, M.B.; Severi, K.E.; Macklin, J.J.; et al. Genetically encoded calcium indicators for multi-color neural activity imaging and combination with optogenetics. Front. Mol. Neurosci. 2013, 6, 2. [Google Scholar] [CrossRef] [PubMed]
- Ding, Y.D.; Li, J.; Enterina, J.R.; Shen, Y.; Zhang, I.; Tewson, P.H.; Mo, G.C.H.; Zhang, J.; Quinn, A.M.; Hughes, T.E.; et al. Ratiometric biosensors based on dimerization-dependent fluorescent protein exchange. Nat. Methods 2015, 12, 195–198. [Google Scholar] [CrossRef] [PubMed]
- Ormo, M.; Cubitt, A.B.; Kallio, K.; Gross, L.A.; Tsien, R.Y.; Remington, S.J. Crystal structure of the Aequorea victoria green fluorescent protein. Science 1996, 273, 1392–1395. [Google Scholar] [CrossRef] [PubMed]
- Burgoyne, R.D. Neuronal calcium sensor proteins: Generating diversity in neuronal Ca2+ signalling. Nat. Rev. Neurosci. 2007, 8, 182–193. [Google Scholar] [CrossRef] [PubMed]
- Meinkoth, J.L.; Alberts, A.S.; Went, W.; Fantozzi, D.; Taylor, S.S.; Hagiwara, M.; Montminy, M.; Feramisco, J.R. Signal-Transduction through the Camp-Dependent Protein-Kinase. Mol. Cell. Biochem. 1993, 128, 179–186. [Google Scholar] [CrossRef]
- Babu, Y.S.; Bugg, C.E.; Cook, W.J. Structure of Calmodulin Refined at 2.2 Å Resolution. J. Mol. Biol. 1988, 204, 191–204. [Google Scholar] [CrossRef]
- Crivici, A.; Ikura, M. Molecular and Structural Basis of Target Recognition by Calmodulin. Annu. Rev. Biophys. Biomol. Struct. 1995, 24, 85–116. [Google Scholar] [CrossRef] [PubMed]
- Bayley, P.M.; Findlay, W.A.; Martin, S.R. Target recognition by calmodulin: Dissecting the kinetics and affinity of interaction using short peptide sequences. Protein Sci. 1996, 5, 1215–1228. [Google Scholar] [CrossRef] [PubMed]
- Ikura, M.; Clore, G.M.; Gronenborn, A.M.; Zhu, G.; Klee, C.B.; Bax, A. Solution structure of a calmodulin-target peptide complex by multidimensional NMR. Science 1992, 256, 632–638. [Google Scholar] [CrossRef] [PubMed]
- Nagai, T.; Ibata, K.; Park, E.S.; Kubota, M.; Mikoshiba, K.; Miyawaki, A. A variant of yellow fluorescent protein with fast and efficient maturation for cell-biological applications. Nat. Biotechnol. 2002, 20, 87–90. [Google Scholar] [CrossRef] [PubMed]
- Osawa, M.; Tokumitsu, H.; Swindells, M.B.; Kurihara, H.; Orita, M.; Shibanuma, T.; Furuya, T.; Ikura, M. A novel target recognition revealed by calmodulin in complex with Ca2+-calmodulin-dependent kinase kinase. Nat. Struct. Biol. 1999, 6, 819–824. [Google Scholar] [PubMed]
- Pologruto, T.A.; Yasuda, R.; Svoboda, K. Monitoring neural activity and [Ca2+] with genetically encoded Ca2+ indicators. J. Neurosci. 2004, 24, 9572–9579. [Google Scholar] [CrossRef] [PubMed]
- Oshima, Y.; Imamura, T.; Shintani, A.; Kajiura-Kobayashi, H.; Hibi, T.; Nagai, T.; Nonaka, S.; Nemoto, T. Ultrasensitive imaging of Ca2+ dynamics in pancreatic acinar cells of yellow cameleon-nano transgenic mice. Int. J. Mol. Sci. 2014, 15, 19971–19986. [Google Scholar] [CrossRef] [PubMed]
- Kanemaru, K.; Sekiya, H.; Xu, M.; Satoh, K.; Kitajima, N.; Yoshida, K.; Okubo, Y.; Sasaki, T.; Moritoh, S.; Hasuwa, H.; et al. In Vivo Visualization of Subtle, Transient, and Local Activity of Astrocytes Using an Ultrasensitive Ca2+ Indicator. Cell Rep. 2014, 8, 311–318. [Google Scholar] [CrossRef] [PubMed]
- Griesbeck, O. Fluorescent proteins as sensors for cellular functions. Curr. Opin. Neurobiol. 2004, 14, 636–641. [Google Scholar] [CrossRef] [PubMed]
- Jurado, L.A.; Chockalingam, P.S.; Jarrett, H.W. Apocalmodulin. Physiol. Rev. 1999, 79, 661–682. [Google Scholar] [PubMed]
- Saimi, Y. and C. Kung, Calmodulin as an ion channel subunit. Annu. Rev. Physiol. 2002, 64, 289–311. [Google Scholar] [CrossRef] [PubMed]
- Kerr, R.; Lev-Ram, V.; Baird, G.; Vincent, P.; Tsien, R.Y.; Schafer, W.R. Optical imaging of calcium transients in neurons and pharyngeal muscle of C. elegans. Neuron 2000, 26, 583–594. [Google Scholar] [CrossRef]
- Reiff, D.F.; Thiel, P.R.; Schuster, C.M. Differential regulation of active zone density during long-term strengthening of Drosophila neuromuscular junctions. J. Neurosci. 2002, 22, 9399–9409. [Google Scholar] [PubMed]
- Fiala, A.; Spall, T.; Diegelmann, S.; Eisermann, B.; Sachse, S.; Devaud, J.M.; Buchner, E.; Galizia, C.G. Genetically expressed cameleon in Drosophila melanogaster is used to visualize olfactory information in projection neurons. Curr. Biol. 2002, 12, 1877–1884. [Google Scholar] [CrossRef]
- Vassylyev, D.G.; Takeda, S.; Wakatsuki, S.; Maeda, K.; Maeda, Y. Crystal structure of troponin C in complex with troponin I fragment at 2.3-angstrom resolution. Proc. Natl. Acad. Sci. USA 1998, 95, 4847–4852. [Google Scholar] [CrossRef] [PubMed]
- Gordon, A.M.; Homsher, E.; Regnier, M. Regulation of contraction in striated muscle. Physiol. Rev. 2000, 80, 853–924. [Google Scholar] [PubMed]
- Mercier, P.; Li, M.X.; Sykes, B.D. Role of the structural domain of troponin C in muscle regulation: NMR studies of Ca2+ binding and subsequent interactions with regions 1–40 and 96–115 of troponin I. Biochemistry 2000, 39, 2902–2911. [Google Scholar] [CrossRef] [PubMed]
- Grienberger, C.; Konnerth, A. Imaging Calcium in Neurons. Neuron 2012, 73, 862–885. [Google Scholar] [CrossRef] [PubMed]
- Knopfel, T.; Diez-Garcia, J.; Akemann, W. Optical probing of neuronal circuit dynamics: Genetically encoded versus classical fluorescent sensors. Trends Neurosci. 2006, 29, 160–166. [Google Scholar] [CrossRef] [PubMed]
- De, A.; Ray, P.; Loening, A.M.; Gambhir, S.S. BRET3: A red-shifted bioluminescence resonance energy transfer (BRET)-based integrated platform for imaging protein-protein interactions from single live cells and living animals. FASEB J. 2009, 23, 2702–2709. [Google Scholar] [CrossRef] [PubMed]
- Loening, A.M.; Fenn, T.D.; Wu, A.M.; Gambhir, S.S. Consensus guided mutagenesis of Renilla luciferase yields enhanced stability and light output. Protein Eng. Des. Sel. 2006, 19, 391–400. [Google Scholar] [CrossRef] [PubMed]
- Nagel, G.; Szellas, T.; Huhn, W.; Kateriya, S.; Adeishvili, N.; Berthold, P.; Ollig, D.; Hegemann, P.; Bamberg, E. Channelrhodopsin-2, a directly light-gated cation-selective membrane channel. Proc. Natl. Acad. Sci. USA 2003, 100, 13940–13945. [Google Scholar] [CrossRef] [PubMed]
- Boyden, E.S.; Zhang, F.; Bamberg, E.; Nagel, G.; Deisseroth, K. Millisecond-timescale, genetically targeted optical control of neural activity. Nat. Neurosci. 2005, 8, 1263–1268. [Google Scholar] [CrossRef] [PubMed]
- Nagel, G.; Brauner, M.; Liewald, J.F.; Adeishvili, N.; Bamberg, E.; Gottschalk, A. Light activation of channelrhodopsin-2 in excitable cells of Caenorhabditis elegans triggers rapid behavioral responses. Curr. Biol. 2005, 15, 2279–2284. [Google Scholar] [CrossRef] [PubMed]
- Hall, M.P.; Unch, J.; Binkowski, B.F.; Valley, M.P.; Butler, B.L.; Wood, M.G.; Otto, P.; Zimmerman, K.; Vidugiris, G.; Machleidt, T.; et al. Engineered Luciferase Reporter from a Deep Sea Shrimp Utilizing a Novel Imidazopyrazinone Substrate. ACS Chem. Biol. 2012, 7, 1848–1857. [Google Scholar] [CrossRef] [PubMed]
- Yang, J.; Cumberbatch, D.; Centanni, S.; Shi, S.Q.; Winder, D.; Webb, D.; Johnson, C.H. Coupling optogenetic stimulation with NanoLuc-based luminescence (BRET) Ca++ sensing. Nat. Commun. 2016, 7, 13268. [Google Scholar] [CrossRef] [PubMed]
- Suzuki, K.; Kimura, T.; Shinoda, H.; Bai, G.; Daniels, M.J.; Arai, Y.; Nakano, M.; Nagai, T. Five colour variants of bright luminescent protein for real-time multicolour bioimaging. Nat. Commun. 2016, 7, 13718. [Google Scholar] [CrossRef] [PubMed]
- Yeh, H.W.; Karmach, O.; Ji, A.; Carter, D.; Martins-Green, M.M.; Ai, H.W. Red-shifted luciferase-luciferin pairs for enhanced bioluminescence imaging. Nat. Methods 2017, 14, 971–974. [Google Scholar] [CrossRef] [PubMed]
- Topell, S.; Hennecke, J.; Glockshuber, R. Circularly permuted variants of the green fluorescent protein. FEBS Lett. 1999, 457, 283–289. [Google Scholar] [CrossRef]
- Pedelacq, J.D.; Cabantous, S.; Tran, T.; Terwilliger, T.C.; Waldo, G.S. Engineering and characterization of a superfolder green fluorescent protein. Nat. Biotechnol. 2006, 24, 79–88. [Google Scholar] [CrossRef] [PubMed]
- Wang, Q.; Shui, B.; Kotlikoff, M.I.; Sondermann, H. Structural basis for calcium sensing by GCaMP2. Structure 2008, 16, 1817–1827. [Google Scholar] [CrossRef] [PubMed]
- O’Connor, D.H.; Peron, S.P.; Huber, D.; Svoboda, K. Neural activity in barrel cortex underlying vibrissa-based object localization in mice. Neuron 2010, 67, 1048–1061. [Google Scholar] [CrossRef] [PubMed]
- Dombeck, D.A.; Harvey, C.D.; Tian, L.; Looger, L.L.; Tank, D.W. Functional imaging of hippocampal place cells at cellular resolution during virtual navigation. Nat. Neurosci. 2010, 13, 1433–1440. [Google Scholar] [CrossRef] [PubMed]
- Huber, D.; Gutnisky, D.A.; Peron, S.; O’Connor, D.H.; Wiegert, J.S.; Tian, L.; Oertner, T.G.; Looger, L.L.; Svoboda, K. Multiple dynamic representations in the motor cortex during sensorimotor learning. Nature 2012, 484, 473–478. [Google Scholar] [CrossRef] [PubMed]
- Del Bene, F.; Wyart, C.; Robles, E.; Tran, A.; Looger, L.; Scott, E.K.; Isacoff, E.Y.; Baier, H. Filtering of visual information in the tectum by an identified neural circuit. Science 2010, 330, 669–673. [Google Scholar] [CrossRef] [PubMed]
- Seelig, J.D.; Chiappe, M.E.; Lott, G.K.; Dutta, A.; Osborne, J.E.; Reiser, M.B.; Jayaraman, V. Two-photon calcium imaging from head-fixed Drosophila during optomotor walking behavior. Nat. Methods 2010, 7, 535–540. [Google Scholar] [CrossRef] [PubMed]
- Borghuis, B.G.; Tian, L.; Xu, Y.; Nikonov, S.S.; Vardi, N.; Zemelman, B.V.; Looger, L.L. Imaging light responses of targeted neuron populations in the rodent retina. J. Neurosci. 2011, 31, 2855–2867. [Google Scholar] [CrossRef] [PubMed]
- Mittmann, W.; Wallace, D.J.; Czubayko, U.; Herb, J.T.; Schaefer, A.T.; Looger, L.L.; Denk, W.; Kerr, J.N. Two-photon calcium imaging of evoked activity from L5 somatosensory neurons in vivo. Nat. Neurosci. 2011, 14, 1089–1093. [Google Scholar] [CrossRef] [PubMed]
- Hendel, T.; Mank, M.; Schnell, B.; Griesbeck, O.; Borst, A.; Reiff, D.F. Fluorescence changes of genetic calcium indicators and OGB-1 correlated with neural activity and calcium in vivo and in vitro. J. Neurosci. 2008, 28, 7399–7411. [Google Scholar] [CrossRef] [PubMed]
- Higley, M.J.; Sabatini, B.L. Calcium signaling in dendrites and spines: Practical and functional considerations. Neuron 2008, 59, 902–913. [Google Scholar] [CrossRef] [PubMed]
- Imamura, H.; Nhat, K.P.; Togawa, H.; Saito, K.; Iino, R.; Kato-Yamada, Y.; Nagai, T.; Noji, H. Visualization of ATP levels inside single living cells with fluorescence resonance energy transfer-based genetically encoded indicators. Proc. Natl. Acad. Sci. USA 2009, 106, 15651–15656. [Google Scholar] [CrossRef] [PubMed]
- Helmchen, F.; Denk, W. Deep tissue two-photon microscopy. Nat. Methods 2005, 2, 932–940. [Google Scholar] [CrossRef] [PubMed]
- Nagai, T.; Horikawa, K.; Saito, K.; Matsuda, T. Genetically encoded Ca2+ indicators; expanded affinity range, color hue and compatibility with optogenetics. Front. Mol. Neurosci. 2014, 7. [Google Scholar] [CrossRef] [PubMed]
- Heim, R.; Prasher, D.C.; Tsien, R.Y. Wavelength Mutations and Posttranslational Autoxidation of Green Fluorescent Protein. Proc. Natl. Acad. Sci. USA 1994, 91, 12501–12504. [Google Scholar] [CrossRef] [PubMed]
- Hein, R.; Tsien, R.Y. Engineering green fluorescent protein for improved brightness, longer wavelengths and fluorescence resonance energy transfer. Curr. Biol. 1996, 6, 178–182. [Google Scholar]
- Kredel, S.; Oswald, F.; Nienhaus, K.; Deuschle, K.; Rocker, C.; Wolff, M.; Heilker, R.; Nienhaus, G.U.; Wiedenmann, J. mRuby, a Bright Monomeric Red Fluorescent Protein for Labeling of Subcellular Structures. PLoS ONE 2009, 4. [Google Scholar] [CrossRef] [PubMed]
- Yizhar, O.; Fenno, L.; Zhang, F.; Hegemann, P.; Diesseroth, K. Microbial opsins: A family of single-component tools for optical control of neural activity. Cold Spring Harb. Protoc. 2011, 2011. [Google Scholar] [CrossRef] [PubMed]
- Stierl, M.; Stumpf, P.; Udwari, D.; Gueta, R.; Hagedorn, R.; Losi, A.; Gartner, W.; Petereit, L.; Efetova, M.; Schwarzel, M.; et al. Light modulation of cellular cAMP by a small bacterial photoactivated adenylyl cyclase, bPAC, of the soil bacterium Beggiatoa. J. Biol. Chem. 2011, 286, 1181–1188. [Google Scholar] [CrossRef] [PubMed]
- Chow, B.Y.; Han, X.; Dobry, A.S.; Qian, X.; Chuong, A.S.; Li, M.; Henninger, M.A.; Belfort, G.M.; Lin, Y.; Monahan, P.E.; et al. High-performance genetically targetable optical neural silencing by light-driven proton pumps. Nature 2010, 463, 98–102. [Google Scholar] [CrossRef] [PubMed]
- Zhang, F.; Wang, L.P.; Brauner, M.; Liewald, J.F.; Kay, K.; Watzke, N.; Wood, P.G.; Bamberg, E.; Nagel, G.; Gottschalk, A.; et al. Multimodal fast optical interrogation of neural circuitry. Nature 2007, 446, 633–639. [Google Scholar] [CrossRef] [PubMed]
- Alford, S.C.; Abdelfattah, A.S.; Ding, Y.D.; Campbell, R.E. A Fluorogenic Red Fluorescent Protein Heterodimer. Chem. Biol. 2012, 19, 353–360. [Google Scholar] [CrossRef] [PubMed]
- Peterka, D.S.; Takahashi, H.; Yuste, R. Imaging voltage in neurons. Neuron 2011, 69, 9–21. [Google Scholar] [CrossRef] [PubMed]
- Bean, B.P. The action potential in mammalian central neurons. Nat. Rev. Neurosci. 2007, 8, 451–465. [Google Scholar] [CrossRef] [PubMed]
- Storace, D.; Sepehri Rad, M.; Kang, B.; Cohen, L.B.; Hughes, T.; Baker, B.J. Toward Better Genetically Encoded Sensors of Membrane Potential. Trends Neurosci. 2016, 39, 277–289. [Google Scholar] [CrossRef] [PubMed]
- St-Pierre, F.; Chavarha, M.; Lin, M.Z. Designs and sensing mechanisms of genetically encoded fluorescent voltage indicators. Curr. Opin. Chem. Biol. 2015, 27, 31–38. [Google Scholar] [CrossRef] [PubMed]
- Inagaki, S.; Nagai, T. Current progress in genetically encoded voltage indicators for neural activity recording. Curr. Opin. Chem. Biol. 2016, 33, 95–100. [Google Scholar] [CrossRef] [PubMed]
- Nakajima, R.; Jung, A.; Yoon, B.J.; Baker, B.J. Optogenetic Monitoring of Synaptic Activity with Genetically Encoded Voltage Indicators. Front. Synaptic Neurosci. 2016, 8, 22. [Google Scholar] [CrossRef] [PubMed]
- Emiliani, V.; Cohen, A.E.; Deisseroth, K.; Hausser, M. All-Optical Interrogation of Neural Circuits. J. Neurosci. 2015, 35, 13917–13926. [Google Scholar] [CrossRef] [PubMed]
- Kulkarni, R.U.; Miller, E.W. Voltage Imaging: Pitfalls and Potential. Biochemistry 2017, 56, 5171–5177. [Google Scholar] [CrossRef] [PubMed]
- Xu, Y.; Zou, P.; Cohen, A.E. Voltage imaging with genetically encoded indicators. Curr. Opin. Chem. Biol. 2017, 39, 1–10. [Google Scholar] [CrossRef] [PubMed]
- Yang, H.H.; St-Pierre, F. Genetically Encoded Voltage Indicators: Opportunities and Challenges. J. Neurosci. 2016, 36, 9977–9989. [Google Scholar] [CrossRef] [PubMed]
- Siegel, M.S.; Isacoff, E.Y. A genetically encoded optical probe of membrane voltage. Neuron 1997, 19, 735–741. [Google Scholar] [CrossRef]
- Ataka, K.; Pieribone, V.A. A genetically targetable fluorescent probe of channel gating with rapid kinetics. Biophys. J. 2002, 82, 509–516. [Google Scholar] [CrossRef]
- Sakai, R.; Repunte-Canonigo, V.; Raj, C.D.; Knopfel, T. Design and characterization of a DNA-encoded, voltage-sensitive fluorescent protein. Eur. J. Neurosci. 2001, 13, 2314–2318. [Google Scholar] [CrossRef] [PubMed]
- Dimitrov, D.; He, Y.; Mutoh, H.; Baker, B.J.; Cohen, L.; Akemann, W.; Knopfel, T. Engineering and Characterization of an Enhanced Fluorescent Protein Voltage Sensor. PLoS ONE 2007, 2. [Google Scholar] [CrossRef] [PubMed]
- Lundby, A.; Mutoh, H.; Dimitrov, D.; Akemann, W.; Knopfel, T. Engineering of a Genetically Encodable Fluorescent Voltage Sensor Exploiting Fast Ci-VSP Voltage-Sensing Movements. PLoS ONE 2008, 3. [Google Scholar] [CrossRef] [PubMed]
- Mutoh, H.; Perron, A.; Dimitrov, D.; Iwamoto, Y.; Akemann, W.; Chudakov, D.M.; Knopfel, T. Spectrally-Resolved Response Properties of the Three Most Advanced FRET Based Fluorescent Protein Voltage Probes. PLoS ONE 2009, 4. [Google Scholar] [CrossRef] [PubMed]
- Mishina, Y.; Mutoh, H.; Knopfel, T. Transfer of Kv3.1 Voltage Sensor Features to the Isolated Ci-VSP Voltage-Sensing Domain. Biophys. J. 2012, 103, 669–676. [Google Scholar] [CrossRef] [PubMed]
- Lam, A.J.; St-Pierre, F.; Gong, Y.Y.; Marshall, J.D.; Cranfill, P.J.; Baird, M.A.; McKeown, M.R.; Wiedenmann, J.; Davidson, M.W.; Schnitzer, M.J.; et al. Improving FRET dynamic range with bright green and red fluorescent proteins. Nat. Methods 2012, 9. [Google Scholar] [CrossRef] [PubMed]
- Perron, A.; Mutoh, H.; Launey, T.; Knopfel, T. Red-Shifted Voltage-Sensitive Fluorescent Proteins. Chem. Biol. 2009, 16, 1268–1277. [Google Scholar] [CrossRef] [PubMed]
- Akemann, W.; Mutoh, H.; Perron, A.; Park, Y.K.; Iwamoto, Y.; Knopfel, T. Imaging neural circuit dynamics with a voltage-sensitive fluorescent protein. J. Neurophysiol. 2012, 108, 2323–2337. [Google Scholar] [CrossRef] [PubMed]
- Mishina, Y.; Mutoh, H.; Song, C.C.; Knopfel, T. Exploration of genetically encoded voltage indicators based on a chimeric voltage sensing domain. Front. Mol. Neurosci. 2014, 7. [Google Scholar] [CrossRef] [PubMed]
- Tsutsui, H.; Karasawa, S.; Okamura, Y.; Miyawaki, A. Improving membrane voltage measurements using FRET with new fluorescent proteins. Nat. Methods 2008, 5, 683–685. [Google Scholar] [CrossRef] [PubMed]
- Tsutsui, H.; Jinno, Y.; Tomita, A.; Niino, Y.; Yamada, Y.; Mikoshiba, K.; Miyawaki, A.; Okamura, Y. Improved detection of electrical activity with a voltage probe based on a voltage-sensing phosphatase. J. Phys.-Lond. 2013, 591, 4427–4437. [Google Scholar] [CrossRef] [PubMed]
- Jin, L.; Han, Z.; Platisa, J.; Wooltorton, J.R.; Cohen, L.B.; Pieribone, V.A. Single action potentials and subthreshold electrical events imaged in neurons with a fluorescent protein voltage probe. Neuron 2012, 75, 779–785. [Google Scholar] [CrossRef] [PubMed]
- Han, Z.; Jin, L.; Platisa, J.; Cohen, L.B.; Baker, B.J.; Pieribone, V.A. Fluorescent Protein Voltage Probes Derived from ArcLight that Respond to Membrane Voltage Changes with Fast Kinetics. PLoS ONE 2013, 8. [Google Scholar] [CrossRef] [PubMed]
- Piao, H.H.; Rajakumar, D.; Kang, B.E.; Kim, E.H.; Baker, B.J. Combinatorial mutagenesis of the voltage-sensing domain enables the optical resolution of action potentials firing at 60 Hz by a genetically encoded fluorescent sensor of membrane potential. J. Neurosci. 2015, 35, 372–385. [Google Scholar] [CrossRef] [PubMed]
- Abdelfattah, A.S.; Farhi, S.L.; Zhao, Y.; Brinks, D.; Zou, P.; Ruangkittisakul, A.; Platisa, J.; Pieribone, V.A.; Ballanyi, K.; Cohen, A.E.; et al. A Bright and Fast Red Fluorescent Protein Voltage Indicator That Reports Neuronal Activity in Organotypic Brain Slices. J. Neurosci. 2016, 36, 2458–2472. [Google Scholar] [CrossRef] [PubMed]
- Platisa, J.; Vasan, G.; Yang, A.; Pieribone, V.A. Directed Evolution of Key Residues in Fluorescent Protein Inverses the Polarity of Voltage Sensitivity in the Genetically Encoded Indicator ArcLight. ACS Chem. Neurosci. 2017, 8, 513–523. [Google Scholar] [CrossRef] [PubMed]
- St-Pierre, F.; Marshall, J.D.; Yang, Y.; Gong, Y.; Schnitzer, M.J.; Lin, M.Z. High-fidelity optical reporting of neuronal electrical activity with an ultrafast fluorescent voltage sensor. Nat. Neurosci. 2014, 17, 884–889. [Google Scholar] [CrossRef] [PubMed]
- Chamberland, S.; Yang, H.H.; Pan, M.M.; Evans, S.W.; Guan, S.; Chavarha, M.; Yang, Y.; Salesse, C.; Wu, H.; Wu, J.C.; et al. Fast two-photon imaging of subcellular voltage dynamics in neuronal tissue with genetically encoded indicators. eLife 2017, 6. [Google Scholar] [CrossRef] [PubMed]
- Yang, H.H.; St-Pierre, F.; Sun, X.; Ding, X.; Lin, M.Z.; Clandinin, T.R. Subcellular Imaging of Voltage and Calcium Signals Reveals Neural Processing In Vivo. Cell 2016, 166, 245–257. [Google Scholar] [CrossRef] [PubMed]
- Kralj, J.M.; Hochbaum, D.R.; Douglass, A.D.; Cohen, A.E. Electrical Spiking in Escherichia coli Probed with a Fluorescent Voltage-Indicating Protein. Science 2011, 333, 345–348. [Google Scholar] [CrossRef] [PubMed]
- Kralj, J.M.; Douglass, A.D.; Hochbaum, D.R.; Maclaurin, D.; Cohen, A.E. Optical recording of action potentials in mammalian neurons using a microbial rhodopsin. Nat. Methods 2012, 9. [Google Scholar] [CrossRef] [PubMed]
- Gong, Y.Y.; Li, J.Z.; Schnitzer, M.J. Enhanced Archaerhodopsin Fluorescent Protein Voltage Indicators. PLoS ONE 2013, 8. [Google Scholar] [CrossRef] [PubMed]
- Zou, P.; Zhao, Y.X.; Douglass, A.D.; Hochbaum, D.R.; Brinks, D.; Werley, C.A.; Harrison, D.J.; Campbell, R.E.; Cohen, A.E. Bright and fast multicoloured voltage reporters via electrochromic FRET. Nat. Commun. 2014, 5. [Google Scholar] [CrossRef] [PubMed]
- Gong, Y.Y.; Wagner, M.J.; Li, J.Z.; Schnitzer, M.J. Imaging neural spiking in brain tissue using FRET-opsin protein voltage sensors. Nat. Commun. 2014, 5. [Google Scholar] [CrossRef] [PubMed]
- Flytzanis, N.C.; Bedbrook, C.N.; Chiu, H.; Engqvist, M.K.M.; Xiao, C.; Chan, K.Y.; Sternberg, P.W.; Arnold, F.H.; Gradinaru, V. Archaerhodopsin variants with enhanced voltage-sensitive fluorescence in mammalian and Caenorhabditis elegans neurons. Nat. Commun. 2014, 5. [Google Scholar] [CrossRef] [PubMed]
- Gong, Y.; Huang, C.; Li, J.Z.; Grewe, B.F.; Zhang, Y.; Eismann, S.; Schnitzer, M.J. High-speed recording of neural spikes in awake mice and flies with a fluorescent voltage sensor. Science 2015, 350, 1361–1366. [Google Scholar] [CrossRef] [PubMed]
- Jensen, M.O.; Jogini, V.; Borhani, D.W.; Leffler, A.E.; Dror, R.O.; Shaw, D.E. Mechanism of Voltage Gating in Potassium Channels. Science 2012, 336, 229–233. [Google Scholar] [CrossRef] [PubMed]
- Li, Q.F.; Wanderling, S.; Paduch, M.; Medovoy, D.; Singharoy, A.; McGreevy, R.; Villalba-Galea, C.A.; Hulse, R.E.; Roux, B.; Schulten, K.; et al. Structural mechanism of voltage-dependent gating in an isolated voltage-sensing domain. Nat. Struct. Mol. Biol. 2014, 21, 244–252. [Google Scholar] [CrossRef] [PubMed]
- Ruta, V.; Chen, J.Y.; MacKinnon, R. Calibrated measurement of gating-charge arginine displacement in the KvAP voltage-dependent K+ channel. Cell 2005, 123, 463–475. [Google Scholar] [CrossRef] [PubMed]
- Guerrero, G.; Siegel, M.S.; Roska, B.; Loots, E.; Isacoff, E.Y. Tuning FlaSh: Redesign of the dynamics, voltage range, and color of the genetically encoded optical sensor of membrane potential. Biophys. J. 2002, 83, 3607–3618. [Google Scholar] [CrossRef]
- Baker, B.J.; Lee, H.; Pieribone, V.A.; Cohen, L.B.; Isacoff, E.Y.; Knopfel, T.; Kosmidis, E.K. Three fluorescent protein voltage sensors exhibit low plasma membrane expression in mammalian cells. J. Neurosci. Methods 2007, 161, 32–38. [Google Scholar] [CrossRef] [PubMed]
- Baker, B.J.; Mutoh, H.; Dimitrov, D.; Akemann, W.; Perron, A.; Iwamoto, Y.; Jin, L.; Cohen, L.B.; Isacoff, E.Y.; Pieribone, V.A.; et al. Genetically encoded fluorescent sensors of membrane potential. Brain Cell Biol. 2008, 36, 53–67. [Google Scholar] [CrossRef] [PubMed]
- Murata, Y.; Iwasaki, H.; Sasaki, M.; Inaba, K.; Okamura, Y. Phosphoinositide phosphatase activity coupled to an intrinsic voltage sensor. Nature 2005, 435, 1239–1243. [Google Scholar] [CrossRef] [PubMed]
- Kohout, S.C.; Ulbrich, M.H.; Bell, S.C.; Isacoff, E.Y. Subunit organization and functional transitions in Ci-VSP. Nat. Struct. Mol. Biol. 2008, 15, 106–108. [Google Scholar] [CrossRef] [PubMed]
- Villalba-Galea, C.A.; Frezza, L.; Sandtner, W.; Bezanilla, F. Sensing charges of the Ciona intestinalis voltage-sensing phosphatase. J. Gen. Physiol. 2013, 142, 543–555. [Google Scholar] [CrossRef] [PubMed]
- Shcherbo, D.; Murphy, C.S.; Ermakova, G.V.; Solovieva, E.A.; Chepurnykh, T.V.; Shcheglov, A.S.; Verkhusha, V.V.; Pletnev, V.Z.; Hazelwood, K.L.; Roche, P.M.; et al. Far-red fluorescent tags for protein imaging in living tissues. Biochem. J. 2009, 418, 567–574. [Google Scholar] [CrossRef] [PubMed]
- Miesenbock, G.; De Angelis, D.A.; Rothman, J.E. Visualizing secretion and synaptic transmission with pH-sensitive green fluorescent proteins. Nature 1998, 394, 192–195. [Google Scholar] [CrossRef] [PubMed]
- Han, Z.; Jin, L.; Chen, F.; Loturco, J.J.; Cohen, L.B.; Bondar, A.; Lazar, J.; Pieribone, V.A. Mechanistic studies of the genetically encoded fluorescent protein voltage probe ArcLight. PLoS ONE 2014, 9, e113873. [Google Scholar] [CrossRef] [PubMed]
- Cao, G.; Platisa, J.; Pieribone, V.A.; Raccuglia, D.; Kunst, M.; Nitabach, M.N. Genetically targeted optical electrophysiology in intact neural circuits. Cell 2013, 154, 904–913. [Google Scholar] [CrossRef] [PubMed]
- Thompson, S.M.; Masukawa, L.M.; Prince, D.A. Temperature dependence of intrinsic membrane properties and synaptic potentials in hippocampal CA1 neurons in vitro. J. Neurosci. 1985, 5, 817–824. [Google Scholar] [PubMed]
- Barnett, L.; Platisa, J.; Popovic, M.; Pieribone, V.A.; Hughes, T. A fluorescent, genetically-encoded voltage probe capable of resolving action potentials. PLoS ONE 2012, 7, e43454. [Google Scholar] [CrossRef] [PubMed]
- Gautam, S.G.; Perron, A.; Mutoh, H.; Knopfel, T. Exploration of fluorescent protein voltage probes based on circularly permuted fluorescent proteins. Front. Neuroeng. 2009, 2, 14. [Google Scholar] [CrossRef] [PubMed]
- Gong, Y.Y. The evolving capabilities of rhodopsin-based genetically encoded voltage indicators. Curr. Opin. Chem. Biol. 2015, 27, 84–89. [Google Scholar] [CrossRef] [PubMed]
- Ernst, O.P.; Lodowski, D.T.; Elstner, M.; Hegemann, P.; Brown, L.S.; Kandori, H. Microbial and Animal Rhodopsins: Structures, Functions, and Molecular Mechanisms. Chem. Rev. 2014, 114, 126–163. [Google Scholar] [CrossRef] [PubMed]
- Kolodner, P.; Lukashev, E.P.; Ching, Y.C.; Rousseau, D.L. Electric-field-induced Schiff-base deprotonation in D85N mutant bacteriorhodopsin. Proc. Natl. Acad. Sci. USA 1996, 93, 11618–11621. [Google Scholar] [CrossRef] [PubMed]
- McIsaac, R.S.; Engqvist, M.K.M.; Wannier, T.; Rosenthal, A.Z.; Herwig, L.; Flytzanis, N.C.; Imasheva, E.S.; Lanyi, J.K.; Balashov, S.P.; Gradinaru, V.; et al. Directed evolution of a far-red fluorescent rhodopsin. Proc. Natl. Acad. Sci. USA 2014, 111, 13034–13039. [Google Scholar] [CrossRef] [PubMed]
- Maclaurin, D.; Venkatachalam, V.; Lee, H.; Cohen, A.E. Mechanism of voltage-sensitive fluorescence in a microbial rhodopsin. Proc. Natl. Acad. Sci. USA 2013, 110, 5939–5944. [Google Scholar] [CrossRef] [PubMed]
- Lynch, M.A. Long-term potentiation and memory. Physiol. Rev. 2004, 84, 87–136. [Google Scholar] [CrossRef] [PubMed]
- Sudhof, T.C. Neurotransmitter release: The last millisecond in the life of a synaptic vesicle. Neuron 2013, 80, 675–690. [Google Scholar] [CrossRef] [PubMed]
- Kavalali, E.T.; Jorgensen, E.M. Visualizing presynaptic function. Nat. Neurosci. 2014, 17, 10–16. [Google Scholar] [CrossRef] [PubMed]
- Okumoto, S.; Looger, L.L.; Micheva, K.D.; Reimer, R.J.; Smith, S.J.; Frommer, W.B. Detection of glutamate release from neurons by genetically encoded surface-displayed FRET nanosensors. Proc. Natl. Acad. Sci. USA 2005, 102, 8740–8745. [Google Scholar] [CrossRef] [PubMed]
- Tsien, R.Y. Building and breeding molecules to spy on cells and tumors. Febs Lett. 2005, 579, 927–932. [Google Scholar] [CrossRef] [PubMed]
- Hires, S.A.; Zhu, Y.L.; Tsien, R.Y. Optical measurement of synaptic glutamate spillover and reuptake by linker optimized glutamate-sensitive fluorescent reporters. Proc. Natl. Acad. Sci. USA 2008, 105, 4411–4416. [Google Scholar] [CrossRef] [PubMed]
- Marvin, J.S.; Borghuis, B.G.; Tian, L.; Cichon, J.; Harnett, M.T.; Akerboom, J.; Gordus, A.; Renninger, S.L.; Chen, T.W.; Bargmann, C.I.; et al. An optimized fluorescent probe for visualizing glutamate neurotransmission. Nat. Methods 2013, 10, 162–170. [Google Scholar] [CrossRef] [PubMed]
- Granseth, B.; Odermatt, B.; Royle, S.J.; Lagnado, L. Clathrin-mediated endocytosis is the dominant mechanism of vesicle retrieval at hippocampal synapses. Neuron 2006, 51, 773–786. [Google Scholar] [CrossRef] [PubMed]
- Balaji, J.; Ryan, T.A. Single-vesicle imaging reveals that synaptic vesicle exocytosis and endocytosis are coupled by a single stochastic mode. Proc. Natl. Acad. Sci. USA 2007, 104, 20576–20581. [Google Scholar] [CrossRef] [PubMed]
- Li, H.Y.; Foss, S.M.; Dobryy, Y.L.; Park, C.K.; Hires, S.A.; Shaner, N.C.; Tsien, R.Y.; Osborne, L.C.; Voglmaier, S.M. Concurrent imaging of synaptic vesicle recycling and calcium dynamics. Front. Mol. Neurosci. 2011, 4. [Google Scholar] [CrossRef] [PubMed]
- Li, Y.L.; Tsien, R.W. pHTomato, a red, genetically encoded indicator that enables multiplex interrogation of synaptic activity. Nat. Neurosci. 2012, 15, 1047–1053. [Google Scholar] [CrossRef] [PubMed]
- Nedergaard, M.; Takano, T.; Hansen, A.J. Beyond the role of glutamate as a neurotransmitter. Nat. Rev. Neurosci. 2002, 3, 748–755. [Google Scholar] [CrossRef] [PubMed]
- Kullmann, D.M.; Asztely, F. Extrasynaptic glutamate spillover in the hippocampus: Evidence and implications. Trends Neurosci. 1998, 21, 8–14. [Google Scholar] [CrossRef]
- Haydon, P.G. Glia: Listening and talking to the synapse. Nat. Rev. Neurosci. 2001, 2, 185–193. [Google Scholar] [CrossRef] [PubMed]
- De Lorimier, R.M.; Smith, J.J.; Dwyer, M.A.; Looger, L.L.; Sali, K.M.; Paavola, C.D.; Rizk, S.S.; Sadigov, S.; Conrad, D.W.; Loew, L.; et al. Construction of a fluorescent biosensor family. Protein Sci. 2002, 11, 2655–2675. [Google Scholar] [CrossRef] [PubMed]
- Sudhof, T.C. The Synaptic Vesicle Cycle—A Cascade of Protein-Protein Interactions. Nature 1995, 375, 645–653. [Google Scholar] [CrossRef] [PubMed]
- Anderson, R.G.W.; Orci, L. A View of Acidic Intracellular Compartments. J. Cell Biol. 1988, 106, 539–543. [Google Scholar] [CrossRef] [PubMed]
- Ng, M.; Roorda, R.D.; Lima, S.Q.; Zemelman, B.V.; Morcillo, P.; Miesenbock, G. Transmission of olfactory information between three populations of neurons in the antennal lobe of the fly. Neuron 2002, 36, 463–474. [Google Scholar] [CrossRef]
- Bozza, T.; McGann, J.P.; Mombaerts, P.; Wachowiak, M. In vivo imaging of neuronal activity—Neurotechnique by targeted expression of a genetically encoded probe in the mouse. Neuron 2004, 42, 9–21. [Google Scholar] [CrossRef]
- Chen, Z.J.; Ai, H.W. Single Fluorescent Protein-Based Indicators for Zinc Ion (Zn2+). Anal. Chem. 2016, 88, 9029–9036. [Google Scholar] [CrossRef] [PubMed]
- Liang, R.Q.; Broussard, G.J.; Tian, L. Imaging Chemical Neurotransmission with Genetically Encoded Fluorescent Sensors. ACS Chem. Neurosci. 2015, 6, 84–93. [Google Scholar] [CrossRef] [PubMed]
- Singer, J.H.; Diamond, J.S. Vesicle depletion and synaptic depression at a mammalian ribbon synapse. J. Neurophysiol. 2006, 95, 3191–3198. [Google Scholar] [CrossRef] [PubMed]
- Marblestone, A.H.; Zamft, B.M.; Maguire, Y.G.; Shapiro, M.G.; Cybulski, T.R.; Glaser, J.I.; Amodei, D.; Stranges, P.B.; Kalhor, R.; Dalrymple, D.A.; et al. Physical principles for scalable neural recording. Front. Comput. Neurosci. 2013, 7. [Google Scholar] [CrossRef] [PubMed]
- Hegemann, P.; Moglich, A. Channelrhodopsin engineering and exploration of new optogenetic tools. Nat. Methods 2011, 8, 39–42. [Google Scholar] [CrossRef] [PubMed]
- Kleinlogel, S.; Feldbauer, K.; Dempski, R.E.; Fotis, H.; Wood, P.G.; Bamann, C.; Bamberg, E. Ultra light-sensitive and fast neuronal activation with the Ca2+-permeable channelrhodopsin CatCh. Nat. Neurosci. 2011, 14. [Google Scholar] [CrossRef] [PubMed]
- Bell, C.J.; Manfredi, G.; Griffiths, E.J.; Rutter, G.A. Luciferase expression for ATP imaging: Application to cardiac myocytes. Methods Cell Biol. 2007, 80, 341–352. [Google Scholar] [PubMed]
- Heffern, M.C.; Park, H.M.; Au-Yeung, H.Y.; Van de Bittner, G.C.; Ackerman, C.M.; Stahl, A.; Changa, C.J. In vivo bioluminescence imaging reveals copper deficiency in a murine model of nonalcoholic fatty liver disease. Proc. Natl. Acad. Sci. USA 2016, 113, 14219–14224. [Google Scholar] [CrossRef] [PubMed]
- Takakura, H.; Kojima, R.; Kamiya, M.; Kobayashi, E.; Komatsu, T.; Ueno, T.; Terai, T.; Hanaoka, K.; Nagano, T.; Urano, Y. New class of bioluminogenic probe based on bioluminescent enzyme-induced electron transfer: BioLeT. J. Am. Chem. Soc. 2015, 137, 4010–4013. [Google Scholar] [CrossRef] [PubMed]
- Kojima, R.; Takakura, H.; Kamiya, M.; Kobayashi, E.; Komatsu, T.; Ueno, T.; Terai, T.; Hanaoka, K.; Nagano, T.; Urano, Y. Development of a Sensitive Bioluminogenic Probe for Imaging Highly Reactive Oxygen Species in Living Rats. Angew. Chem. 2015, 54, 14768–14771. [Google Scholar] [CrossRef] [PubMed]
- Yoshida, T.; Kakizuka, A.; Imamura, H. BTeam, a Novel BRET-based Biosensor for the Accurate Quantification of ATP Concentration within Living Cells. Sci. Rep.-UK 2016, 6. [Google Scholar] [CrossRef] [PubMed]
- Inagaki, S.; Tsutsui, H.; Suzuki, K.; Agetsuma, M.; Arai, Y.; Jinno, Y.; Bai, G.; Daniels, M.J.; Okamura, Y.; Matsuda, T.; et al. Genetically encoded bioluminescent voltage indicator for multi-purpose use in wide range of bioimaging. Sci. Rep.-UK 2017, 7. [Google Scholar] [CrossRef] [PubMed]
- Aper, S.J.A.; Dierickx, P.; Merkx, M. Dual Readout BRET/FRET Sensors for Measuring Intracellular Zinc. ACS Chem. Biol. 2016, 11, 2854–2864. [Google Scholar] [CrossRef] [PubMed]
- So, P.T.C.; Dong, C.Y.; Masters, B.R.; Berland, K.M. Two-photon excitation fluorescence microscopy. Annu. Rev. Biomed. Eng. 2000, 2, 399–429. [Google Scholar] [CrossRef] [PubMed]
- Reddy, G.D.; Kelleher, K.; Fink, R.; Saggau, P. Three-dimensional random access multiphoton microscopy for functional imaging of neuronal activity. Nat. Neurosci. 2008, 11, 713–720. [Google Scholar] [CrossRef] [PubMed]
- Renninger, S.L.; Orger, M.B. Two-photon imaging of neural population activity in zebrafish. Methods 2013, 62, 255–267. [Google Scholar] [CrossRef] [PubMed]
- Keller, P.J.; Schmidt, A.D.; Wittbrodt, J.; Stelzer, E.H.K. Reconstruction of Zebrafish Early Embryonic Development by Scanned Light Sheet Microscopy. Science 2008, 322, 1065–1069. [Google Scholar] [CrossRef] [PubMed]
- Abrahamsson, S.; Chen, J.J.; Hajj, B.; Stallinga, S.; Katsov, A.Y.; Wisniewski, J.; Mizuguchi, G.; Soule, P.; Mueller, F.; Darzacq, C.D.; et al. Fast multicolor 3D imaging using aberration-corrected multifocus microscopy. Nat. Methods 2013, 10. [Google Scholar] [CrossRef] [PubMed]
- Quirin, S.; Peterka, D.S.; Yuste, R. Instantaneous three-dimensional sensing using spatial light modulator illumination with extended depth of field imaging. Opt. Express 2013, 21, 16007–16021. [Google Scholar] [CrossRef] [PubMed]
- Birkner, A.; Tischbirek, C.H.; Konnerth, A. Improved deep two-photon calcium imaging in vivo. Cell Calcium 2017, 64, 29–35. [Google Scholar] [CrossRef] [PubMed]
- Mali, P.; Esvelt, K.M.; Church, G.M. Cas9 as a versatile tool for engineering biology. Nat. Methods 2013, 10, 957–963. [Google Scholar] [CrossRef] [PubMed]


| GECIs | Type a | Sensing Module | Reporting Module | Dynamic Range b | Selected Applications | Ref. |
|---|---|---|---|---|---|---|
| Cameleon-1 | FRET | CaM-M13 | BFP-GFP | 70% | HeLa cells | [31] |
| YC2.1 | FRET | CaM-M13 | ECFP-EYFP | 100% | HeLa cells; hippocampal neuron | [32] |
| YC3.6 | FRET | CaM-M13 | ECFP-cp173Venus | 560% | HeLa cells; transgenic mice | [33] |
| YC6.1 | FRET | CaM, CKKp | CFP-YFP | 200% | HeLa cells; hippocampal neuron | [34] |
| D3cpV | FRET | CaM-M13 | ECFP-cpVenus | 510% | Hippocampal neurons | [35] |
| YC-Nano | FRET | CaM-M13 | ECFP-cp173Venus | 1450% | Layer 2/3 pyramidal neurons; zebrafish embryo | [36] |
| TN-L15 | FRET | csTnC | CFP-Citrine | 140% | HEK293 cells and primary hippocampal neurons | [37] |
| TN-XL | FRET | csTnC | ECFP-Citrine cp174 | 400% | Presynaptic motoneuron terminals of transgenic fruit flies | [38] |
| TN-XXL | FRET | csTnC | ECFP-Citrine Cp174 | 510% | Drosophila motor neuron boutons; mouse visual cortex | [39] |
| 3xCFP–TnC–cpVenus | FRET | csTnC | 3xCFP/cpVenus | 1165% | PC12 Cells | [40] |
| Twitch-2B | FRET | tsTnC | cpVenusCD and mCerulean3 | >1000% | Mouse brain and T lymph nodes | [41] |
| BRAC | BRET | CaM-M13 | Venus, RLuc8 | 60% | HeLa cells and plant leaves | [42] |
| Nano-lantern (Ca2+) | BRET | CaM-M13 | Venus, split RLuc8 | 300% | HeLa cells and hippocampal neurons | [43] |
| Camgaroo-1 | Single-FP | CaM | EYFP | 700% | HeLa cells | [44] |
| Camgaroo-2 | Single-FP | CaM | Citrine | 700% | HeLa cells | [45] |
| Pericam | Single-FP | CaM, M13 | cpEYFP | 800% | HeLa cells | [46] |
| GCaMP1.3 | Single-FP | CaM, M13 | cpEGFP | 450% | HEK-293 cells and mouse myotubes | [47] |
| GCaMP1.6 | Single-FP | CaM, M13 | cpEGFP | 480% | Presynaptic boutons of the Drosophila larval neuromuscular junction | [48] |
| GCaMP2 | Single-FP | CaM, M13 | cpEGFP | 390% | Beams of parallel fibers and granule cells of frontal cerebellar slices from transgenic mice | [49] |
| GCaMP3 | Single-FP | CaM, M13 | cpEGFP | 1230% | Flies, worms and mice | [50] |
| GCaMP4.1 | Single-FP | CaM, M13 | cpEGFP | ND. | Xenopus laevis | [51] |
| GCaMP-HS | Single-FP | CaM, M13 | cpEGFP | 410% | Spinal motor neurons in transgenic zebrafish | [52] |
| GCaMP5 | Single-FP | CaM, M13 | cpEGFP | >940% | Cultured neurons and astrocytes, mouse retina; flies, worms, zebrafish and mice | [53] |
| Fast-GCaMP | Single-FP | CaM, M13 | cpEGFP | >650% | Drosophila auditory neurons; superior cervical ganglion and neocortical pyramidal neurons | [54] |
| GCaMP6 | Single-FP | CaM, M13 | cpEGFP | >3600% | Cultured neurons; zebrafish, flies and mice | [55] |
| G-GECO1 | Single-FP | CaM, M13 | cpEGFP | 2500% | HeLa cells; rat hippocampal neurons | [56] |
| R-GECO1 | Single-FP | CaM, M13 | cpmApple | 1600% | HeLa cells; rat hippocampal neurons | [56] |
| B-GECO1 | Single-FP | CaM, M13 | cpEBFP | 700% | HeLa cells | [56] |
| GEX-GECO1 | Single-FP | CaM, M13 | cpEGFP | 2600% | HeLa cells | [56] |
| GEM-GECO1 | Single-FP | CaM, M13 | cpEGFP | 11,000% | HeLa cells; transgenic C. elegans | [56] |
| CAR-GECO1 | Single-FP | CaM, M13 | cpmPulm | 2700% | HeLa cells; mouse neocortical slice culture | [57] |
| R-GECO1.2 | Single-FP | CaM, M13 | cpmPulm | 3300% | HeLa cells and INS-1 cells | [57] |
| O-GECO1 | Single-FP | CaM, M13 | cpmOrange | 14,600% | HeLa cells | [57] |
| R-CaMP1.07 | Single-FP | CaM, M13 | cpmApple | 2870% | HeLa cells and hippocampal pyramidal neurons | [58] |
| Y-GECO1 | Single-FP | CaM, M13 | cpmPapaya0.4 | 20,000% | HeLa cells and rat hippocampal neurons | [59] |
| REX-GECO1 | Single-FP | CaM, M13 | cpmApple | 10,000% | Organotypic hippocampal slice cultures; albino tadpoles | [60] |
| GR-GECO | Single-FP | CaM, M13 | cpmMapple145 | 450% | HeLa cells and rat hippocampal neurons | [61] |
| LAR-GECO | Single-FP | CaM, M13 | cp146mApple | 1000% | HeLa, HEK293, U2OS cells and rat hippocampal neurons | [62] |
| BCaMP1c | Single-FP | CaM, M13 | cpBFP | 200% | ND | [63] |
| CyCaMP1a | Single-FP | CaM, M13 | cpCFP | 260% | ND | [63] |
| YCaMP1b | Single-FP | CaM, M13 | cpYFP | 920% | HEK293 cells | [63] |
| RCaMP1h | Single-FP | CaM, M13 | cp159mRuby | 1050% | HEK293 cells, neurons; worms, fly larvae, and zebrafish | [63] |
| RA-CaM-B-M13-GA | FPX | CaM, M13 | RA, B, GA | ND | HeLa cells | [64] |
| GEVIs | Sensing Module | Reporter Module | Dynamic Range (%) a | τon, fast (ms) b | τoff, fast (ms) c | Selected Applications | Ref. |
|---|---|---|---|---|---|---|---|
| FlaSh | Shaker K+ channel | GFP | 5.1 | 85 ± 10 | 160 ± 12 | Xenopus laevis oocytes | [130] |
| SPARC | Rat μI skeletal muscle voltage-gated Na+ channel | GFP | 0.5 | <0.8 | N.A. | Xenopus laevis oocytes | [131] |
| VSFP1 | Kv potassium channel | CFP, YFP | 1.8 ± 0.1 | 0.7 | N.A. | HEK cells | [132] |
| VSFP2.1 | CiVSD | Cerulean, Citrine | 8.6 | 15 | 75 | PC12 cells | [133] |
| VSFP2.3 | CiVSD | Cerulean, Citrine | 15.2 ± 0.2 | 3.0 ± 0.4 | 91.6 ± 4.2 | PC12 cells | [134] |
| VSFP2.42 | CiVSD | mCitrine, mKate2 | 12.46 ± 1.0 | N.A. | N.A. | PC12 cells | [135] |
| CiVSD-Kv3.1 chimera (C5) | Ci-VSP-Kv3.1 VSD chimeras | mCerulean, mCitrine | 14.8 ± 0.1 | 2.1 | 13.4 | PC12 cells | [136] |
| VSFP-CR | CiVSD | Clover, mRuby2 | 12.7 | 5.4 | 90 | Hippocampal neurons | [137] |
| VSF3.1 | CiVSD | Cerulean | 1.9 | 1.8 ± 0.3 | N.A. | PC12 cells | [134] |
| VSFP3.1_mOrange2 | CiVSD | mOrange2 | 2.9 | 3.8 ± 0.3 | N.A. | PC12 cells and hippocampal neurons | [138] |
| VSFP-Butterfly1.2 | CiVSD | mCitrine, mKate2 | 15.0 ± 0.7 | 1.0 ± 0.7 | 89.9 ± 5.2 | Cortical neurons, barrel cortex and hippocampal slices | [139] |
| VSFP-Butterfly CY | Ci-VSP-Kv3.1 VSD chimeras | mCerulean, mCitrine | 2.1 ± 0.2 | 14.6 ± 0.5 | 14.7 ± 0.2 | HEK293 and PC12 cells; cortical neurons of living mice | [140] |
| VSFP-Butterfly-YR | Ci-VSP-Kv3.1 VSD chimeras | mCitrine, mKate2 | 2.3 ± 0.2 | 25.1 ± 0.9 | 12.7 ± 0.1 | HEK293 and PC12 cells | [140] |
| Mermaid | CiVSD | mUKG, mKOκ | 40 | 5–20 | 5–20 | Rat cardiomyocytes and cortical neurons | [141] |
| Mermaid2 | CiVSD | CFP, YFP | 48.5 | 0.92 | 10.3 | Hippocampal neurons and living mice | [142] |
| ArcLight Q239 | CiVSD | Super ecliptic pHluorin A227D | 35 | 9 | 17 | HEK293 cells and hippocampal neurons | [143] |
| Chicken ArcLight-A173 | Chicken VSD | Super ecliptic pHluorin A227D | 9 | 4 | 9 | HEK293 cells and cortical neurons | [144] |
| Bongwoori | CiVSD A154D/R217Q/R229I | Super ecliptic pHluorin A227D | ~16 | 8 | 7 | HEK293 cells and hippocampal neurons | [145] |
| FlicR1 | CiVSD | cpmApple | 6.6 | 3.0 | 2.8 | HEK293 cells and hippocampal neurons and brain slices | [146] |
| Marina | ArcLight A389 A390 V442 | 31 d | 29.2 | 15.6 | HEK 293 cells and cortical neuronal cells | [147] | |
| ASAP1 | GgVSD | cpsfGFP-OPT | ~18–29 | 2.1 | 2.0 | HEK293A cells and hippocampal neurons | [148] |
| ASAP2s | ASAP1 R415Q | 38.7 | 5.2 | 24 | HEK293A cells, cardiomyocytes, Drosophila and organotypic slice cultures | [149] | |
| ASAP2f | ASAP1 (A147S ΔA148) | ~14–20 | 2.8 | 2.4 | Drosophila visual system | [150] | |
| PROPS | Proteorhodopsin | 150 | 4.7 | N.A. | Escherichia coli | [151] | |
| Arch D95N | Arch-D95N | 60 | <1 | <1 | Rat hippocampal neurons | [152] | |
| ArchEEQ | Arch-D95Q/D106E | 60 | ~5–15 | N.A. | Rat hippocampal neurons | [153] | |
| ArchEEN | Arch-D95N/D106E | 20 | ~5–15 | N.A. | Rat hippocampal neurons | [153] | |
| QuasAr1 | Arch-P60S/T80S/D95H/D106H/F161V | 32 | 0.05 | 0.07 | Rat hippocampal neurons | [154] | |
| QuasAr2 | Arch-P60S/T80S/D95Q/D106H/F161V | 90 | 1.2 | 1.0 | Rat hippocampal neurons; hiPSC-derived neurons; organotypic brain slice | [154] | |
| QuarsAr2-mOrange | QuarsAr2, mOrange | 10 | 3.9 | 4.3 | HEK293 cells and rat hippocampal neurons | [154] | |
| QuarsAr2-mCitrine | QuarsAr2, mCitrine | 13.1 | 3.1 | 4.8 | HEK293 cells and rat hippocampal neurons | [154] | |
| MacQ-mCitrine | L. maculans rhodopsin (Mac) D139Q, mCitrine | 20 | 2.8 | 5.4 | Cultured neurons; neocortical tissue slices; dendrites of Purkinje neurons in live mice | [155] | |
| Archer1 | Arch-D95E/T99C | 85 | N.A. | N.A. | Rat hippocampal neurons and sensory neurons in behaving C. elegans | [156] | |
| Archer2 | Arch-D95E/T99C/A225M | 60 | N.A. | N.A. | Rat hippocampal neurons | [156] | |
| Ace-mNeon | Acetabularia acetabulum rhodopsinl (Ace), mNeonGreen | 8.5–12 | 0.36–1.1 | 0.42–1.3 | Neurons, awake mice and flies | [157] | |
| Indicators | Type | Sensing Module | Reporting Module | Dynamic Range | Selected Applications | Ref. |
|---|---|---|---|---|---|---|
| FLIPE | FRET | GltI | ECFP, Venus | <5% | Rat hippocampal neurons and PC12 cells | [182] |
| GluSnFR | FRET | GltI | ECFP, Citrine | 7.1% | Hippocampal neurons | [183] |
| SuperGluSnFR | FRET | GltI | ECFP, Citrine | 44% | Hippocampal neurons | [184] |
| iGluSnFR | Single-FP | GltI | cpEGFP | 450% | Cultured neurons; retina, worms, zebrafish and mice | [185] |
| SynaptopHluorin | Single-FP | pHluorin | VAMP2-pHluorin | 8–20% | Hippocampal neurons; RBL-2H3 cells | [168] |
| sypHy | Single-FP | pHluorin | synaptophysin-pHluorin | N.A. | Hippocampal neurons | [186] |
| vGpH | Single-FP | pHluorin | vGlut1-pHluorin | N.A. | Hippocampal boutons | [187] |
| VGLUT1-mOrange2 | Single-FP | mOrange2 | VGLUT1-mOrange2 | 16% | Hippocampal boutons | [188] |
| sypHTomato | Single-FP | pHTomato | Synaptophysin-pHTomato | 5–25% | CA3-CA1 hippocampal neurons | [189] |
© 2017 by the authors. Licensee MDPI, Basel, Switzerland. This article is an open access article distributed under the terms and conditions of the Creative Commons Attribution (CC BY) license (http://creativecommons.org/licenses/by/4.0/).
Share and Cite
Chen, Z.; Truong, T.M.; Ai, H.-w. Illuminating Brain Activities with Fluorescent Protein-Based Biosensors. Chemosensors 2017, 5, 32. https://doi.org/10.3390/chemosensors5040032
Chen Z, Truong TM, Ai H-w. Illuminating Brain Activities with Fluorescent Protein-Based Biosensors. Chemosensors. 2017; 5(4):32. https://doi.org/10.3390/chemosensors5040032
Chicago/Turabian StyleChen, Zhijie, Tan M. Truong, and Hui-wang Ai. 2017. "Illuminating Brain Activities with Fluorescent Protein-Based Biosensors" Chemosensors 5, no. 4: 32. https://doi.org/10.3390/chemosensors5040032
APA StyleChen, Z., Truong, T. M., & Ai, H.-w. (2017). Illuminating Brain Activities with Fluorescent Protein-Based Biosensors. Chemosensors, 5(4), 32. https://doi.org/10.3390/chemosensors5040032