Biochars as Innovative Humidity Sensing Materials
by
 , , and
Daniele Ziegler
1 ,
,
Paola Palmero
1,
Mauro Giorcelli
2 ,
,
Alberto Tagliaferro
2 and
Jean-Marc Tulliani
1,* 1
Politecnico di Torino, Department of Applied Science and Technology, INSTM R.U PoliTO-LINCE Laboratory, Corso Duca degli Abruzzi, 24, 10129 Torino, Italy
2
Politecnico di Torino, Department of Applied Science and Technology, Carbon Group, Corso Duca degli Abruzzi, 24, 10129 Torino, Italy
*
Author to whom correspondence should be addressed.
Chemosensors 2017, 5(4), 35; https://doi.org/10.3390/chemosensors5040035
Submission received: 30 October 2017
/
Revised: 6 December 2017
/
Accepted: 11 December 2017
/
Published: 12 December 2017
(This article belongs to the Special Issue Polymers Based Chemical Sensors)
Abstract
:In this work, biochar-based humidity sensors were prepared by drop-coating technique. Polyvinylpyrrolidone (PVP) was added as an organic binder to improve the adhesion of the sensing material onto ceramic substrates having platinum electrodes. Two biochars obtained from different precursors were used. The sensors were tested toward relative humidity (RH) at room temperature and showed a response starting around 5 RH%, varying the impedance of 2 orders of magnitude after exposure to almost 100% relative humidity. In both cases, biochar materials are behaving as p-type semiconductors under low amounts of humidity. On the contrary, for higher RH values, the impedance decreased due to water molecules adsorption. When PVP is added to SWP700 biochar, n-p heterojunctions are formed between the two semiconductors, leading to a higher sensitivity at low RH values for the sensors SWP700-10% PVP and SWP700-20% PVP with respect to pure SWP700 sensor. Finally, response and recovery times were both reasonably fast (in the order of 1 min).
1. Introduction
Recent advances in science and technology have increased the demand for highly accurate, durable, sustainable, reproducible, and cheap humidity sensors. These sensors find many industrial applications ranging from environmental and meteorological monitoring, soil water content determination in agriculture, air conditioning systems, food quality monitoring, medical equipment, and other fields [1,2]. Humidity sensors can be classified as capacitive, resistive, or thermal conductive ones [3]. Usually, humidity sensors are based on metal oxide semiconductors, conducting polymers, carbon nanotubes, and/or graphene oxides. At room temperature, the adsorption of water vapor/molecules changes the resistance or the capacitance of the sensing film [4,5,6,7,8,9,10,11,12,13,14,15].
Carbon-based humidity sensors have attracted great attention since a couple of decades because of their large sensing area and high chemical inertness [16,17,18,19,20]. Biomass is a qualified carbon source, it is available in high quality and huge amount, and it is considered as an environmental friendly renewable resource [21]. In recent years, biochar applications invested in many fields [22], though the main application of this material remains field amendment in agriculture [22,23]. In addition, different biochars (residues of biomass pyrolysis) are becoming available from pilot plants producing biogas and energy [24,25]. Besides, in the last few years, biochar has been extensively studied as a substitute for more expensive carbon materials like carbon nanotubes, graphene, and others.
In a previous work, pyrolyzed bamboo was proposed as a sensing material with promising results, showing an excellent response toward humidity starting from 10% relative humidity (RH) [26]. However, the adhesion onto alumina substrates was minimal, and these films could be easily damaged when testing, preventing their use in commercial products. Thus, in this research, the room temperature humidity sensing properties of two commercial biochars derived from different precursors [24,25] were investigated. First, the biochars were drop coated onto commercial alumina substrates with platinum interdigitated electrodes. Then, polyvinylpyrrolidone (PVP), acting as an organic binder was added to improve the adhesion onto the ceramic substrates. This polymer is used in many industrial applications, such as adhesives to enhance strength and toughness, paper manufacture for increasing strength and as a coating resin, as well as in synthetic fibers to accentuate dye receptivity. PVP polymers are also widely employed in inks, imaging, lithography, detergents, and soaps, in textile, ceramic, electrical, and metallurgical industries, and as a polymerization additive. Only in few studies was PVP used as humidity sensor in composites [27,28]. The sensing materials and the films were studied by means of Field Emission-Scanning Electron Microscopy (FESEM), X-Ray diffraction (XRD), Raman spectroscopy, X-ray photoelectron spectroscopy (XPS), and laser-granulometry measurements. The sensors were tested toward relative humidity at room temperature.
2. Materials and Methods
2.1. Materials
Two types of certified biochar were purchased from the UK Biochar Research Centre (BRC) (Edinburgh, UK) and used as innovative humidity sensing materials. The two biochars were selected among many available from BRC, based on the highest surface area and on the highest electrical conductivity. SWP700 is made from pyrolyzed mixed softwood pellets, obtained at a maximum treatment temperature of 700 °C with a heating rate of 87 °C/min. Its biochar yield is of 17.34%. OSR700 is produced from oil seed rape, by a pyrolysis process at 700 °C and a heating rate of 103 °C/min. In this case, a biochar yield of 22.62% is achieved. Table 1 reports the specific surface area (SSA) and the conductivity of both materials, as reported on their datasheets [24,25].
Both biochars in the form of pellets were first mixed in a mechanical grinder for 10 min and later manually ground in order to attain a homogeneous powder.
Polyvinylpyrrolidone (PVP, average Mw~13,000,000 by LS, Sigma Aldrich, Milano, Italy) was used as a polymeric binder and mixed with biochars in ethanol (for residual analysis, Sigma Aldrich ≥ 99.8% v/v).
2.2. Characterization of Biochars
SWP700 and OSR700 biochar powders were characterized by laser granulometry, X-Ray Diffraction (XRD), Raman Spectroscopy, X-Ray Photoelectron Spectroscopy (XPS), and Field Emission Scanning Electron Microscopy (FESEM) observations.
Particle size distribution was evaluated by laser granulometry (Mastersizer 3000, Malvern, Worcestershire, UK). The measurements were performed after manual grinding of the powders by means of an agate mortar and an agate pestle and sieving with a sieve having apertures of 45 µm. Laser granulometry measurements were carried out after dispersion in ethanol (500 ppm in volume) and sonication for 5 min.
XRD analysis was carried out with the aim of evidencing any possible crystallization peak among OSR700 and SWP700 raw materials. Spectra were recorded on a Pan’Analytical X’Pert Pro instrument (Pan’Analytical, Almelo, The Netherlands) working with Cu Kα radiation (0.154056 nm) in the range 5–70° 2θ, with a step size of 0.05° in 2θ and an acquisition time per step of 5 s. Diffraction patterns were indexed by means of the Powder Data File database (P.D.F. 2000, International Centre of Diffraction Data, Newtown Square, PA, USA).
A Renishaw micro Raman (Renishaw, New Mills, UK) equipped with a green laser (514 nm) and a 50× objective was used to study the disorder and graphitization grade of the biochars under test. Raman characterization were performed at room temperature. The samples, in powder form, were exposed, without any pretreatment, to the micro laser beam (2 μm in diameter) for 10 s.
X-ray photoelectron spectroscopy (XPS) investigations were carried out by means of a PHI 5000 Versaprobe (Physical Electronics, Chanhassen, MN, USA) scanning X-ray photoelectron spectrometer (monochromatic Al K-alpha X-ray source with 1486.6 eV energy, 15 kV voltage, and 1 mA anode current) to investigate surface chemical composition.
Finally, morphologies of both kinds of powders and sensors were examined by means of an FESEM (Zeiss Supra-40, Oberkochen, Germany) equipped with an Oxford Energy Dispersive X-ray detector after the Cr sputtering process.
2.3. Sensor Fabrication
Platinum (5545-LS, ESL, King of Prussia, PA, USA) interdigitated electrodes were screen-printed on commercial α-alumina substrates (Coors Tek, Golden, CO, USA, ADS-96, 96% alumina, 0.85 cm × 1.7 cm). These electrodes were then fired at 980 °C (2 °C/min heating and cooling ramps) for 18 min, obtaining a high-grade adhesion and optimizing their electrical conductivity, as per the ink manufacturer’s recommendations. Electrodes present a thickness of 400 µm, and their spacing is equal to 450 µm. In addition, the edge of an electrode belonging to one comb and the vertical connection of the second comb are separated by 400 µm.
To obtain biochar, PVP and biochar-PVP sensors, a drop coating technique was adopted by mixing with a magnetic stirrer 0.1 g of material (SWP700, OSR700, PVP, or biochar-PVP, respectively, in four different preparations) with 10 mL of ethanol in a beaker. After 1 h of mixing, solvent was evaporated at 80 °C, and sensors were realized by drop coating technique with a volume of 40 µL of this suspension onto α-alumina substrates with Pt electrodes by means of a micropipette.
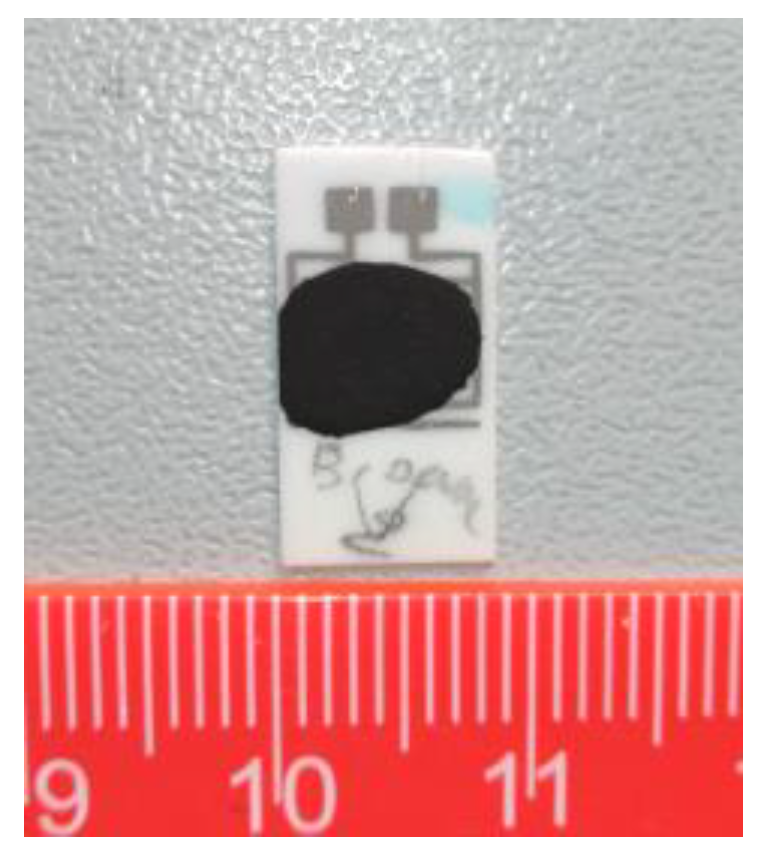
Sensors were finally dried overnight at 80 °C (3 mg of material deposited) (Figure 1).
Subsequently, the sensors were tested toward relative humidity and cross-sensitivity tests were carried out toward ozone, ammonia, carbon dioxide, and methane at room temperature (SIAD, Bergamo, Italy; research quality gases).
2.4. Electrical Characterization
Humidity sensors were inserted into a laboratory apparatus made of a hermetic chamber in which relative humidity could be varied between 0 and 99% by steps, each one of 3 min. In fact, in this system, compressed air is separated into two flows: one is dehydrated over a chromatography alumina bed, while the second one is directed through two water bubblers, generating, respectively, a dry and a humid flow. Two precision microvalves recombine the two fluxes into one by means of a mixer and adjust the RH content [4]. All humidity measurements were carried out under a constant air flow of 1700 sccm (standard cubic centimeters). A commercial humidity and temperature probe was used as reference for temperature and RH values (Delta Ohm DO9406, Caselle di Selvazzano (PD), Italy). All the measurements were done at room temperature (25 ± 0.5 °C). Relative humidity is at all temperatures and pressures defined as the ratio of the water vapor pressure (Pw) to the saturation water vapor pressure (over water, Pws) at the gas temperature (T), according to Equation (1) and Ref. [29].
The water vapor saturation pressure (in hPa) over water in the temperature range −20 °C–50 °C is given by Equation (2).
Thus, the water vapor pressure (in hPa) can be determined as follows (Equation (3)):
During tests in a dynamic flow under variable amounts of relative humidity (RH), the sensors impedances were determined by means of a LCR meter (Hioki 3533-01, Nagano, Japan). The sensors were alimented by an AC voltage of 1 V at 1 kHz. The sensor response (SR), expressed in %, is defined as the relative variation of the starting impedance under dry air (Z0), compared with the impedance measured under gas/humidity (Zg) exposure (Equation (4)).
Moreover, cross-sensitivity measurements were carried out toward NH3 (50 ppm in air), CO2 (500 and 600 ppm in dry air and in air with 40% of relative humidity), CH4 (100 ppm in air), and ozone (0.5 ppm in air) at room temperature under a constant flow of 1000 sccm, and sensors were put in another chamber of 0.25 L volume (in fact a three-neck glass flask). Target gas was diluted with air by means of flow meters (Teledyne Hastings Instruments HFM 300 controller and flow meters HFC 302, Teledyne Hastings, Hampton, VA, USA). Ozone was generated by a UV lamp (SOG-01, UVP-LLC Cambridge, UK) from a constant air flow of compressed air (1000 sccm). Ozone concentration was determined by the length of lamp exposed, according to calibration curves given by the lamp manufacturer. When performing measurements under both gas and humidity, a water bubbler was added to the flow of synthetic air used for the dilution of target gas.
The response times (the time taken by a sensor to achieve 90% of the total impedance change in the case of gas adsorption) together with the recovery times (the time necessary to reach 90% of the total impedance changes in the case of gas desorption) were also determined in the present work.
3. Results
3.1. Laser Granulometry
3.2. XRD Analysis
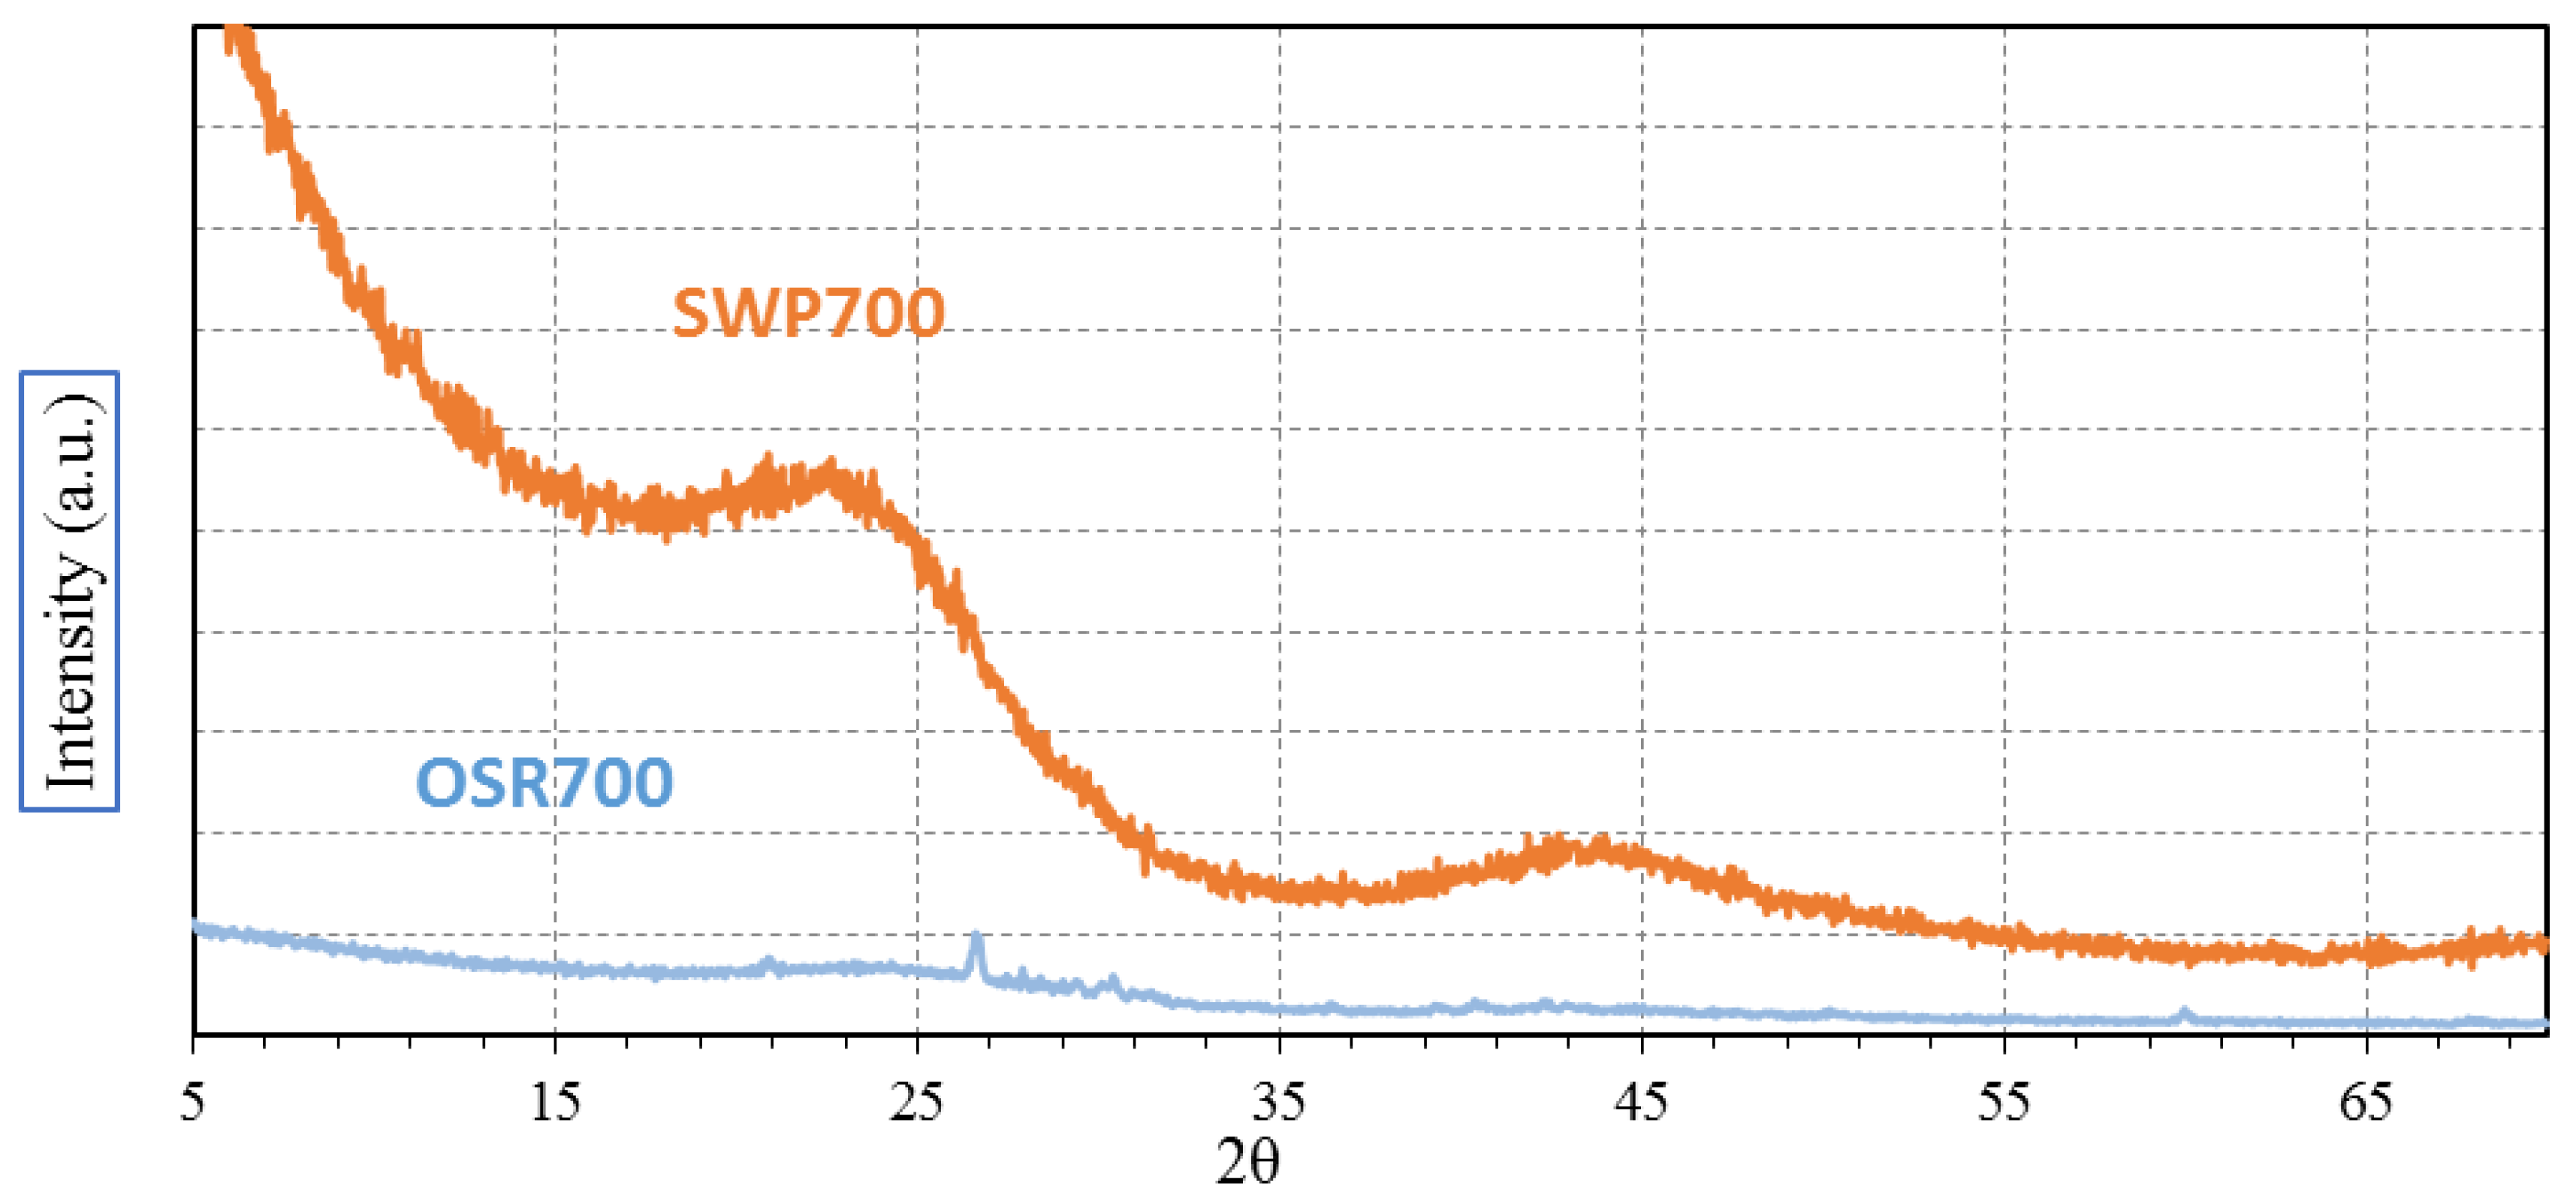
XRD patterns in Figure 3 reveal the amorphous nature of SWP700, while OSR700 presents some quartz content (peaks at 20.87°, 26.65°, 29.43°, 20.26°, 59.96° and 67.97° 2θ), JCPDS card No. 461045. The peak at 29.43° in 2θ was not indexed.
3.3. XPS Analysis
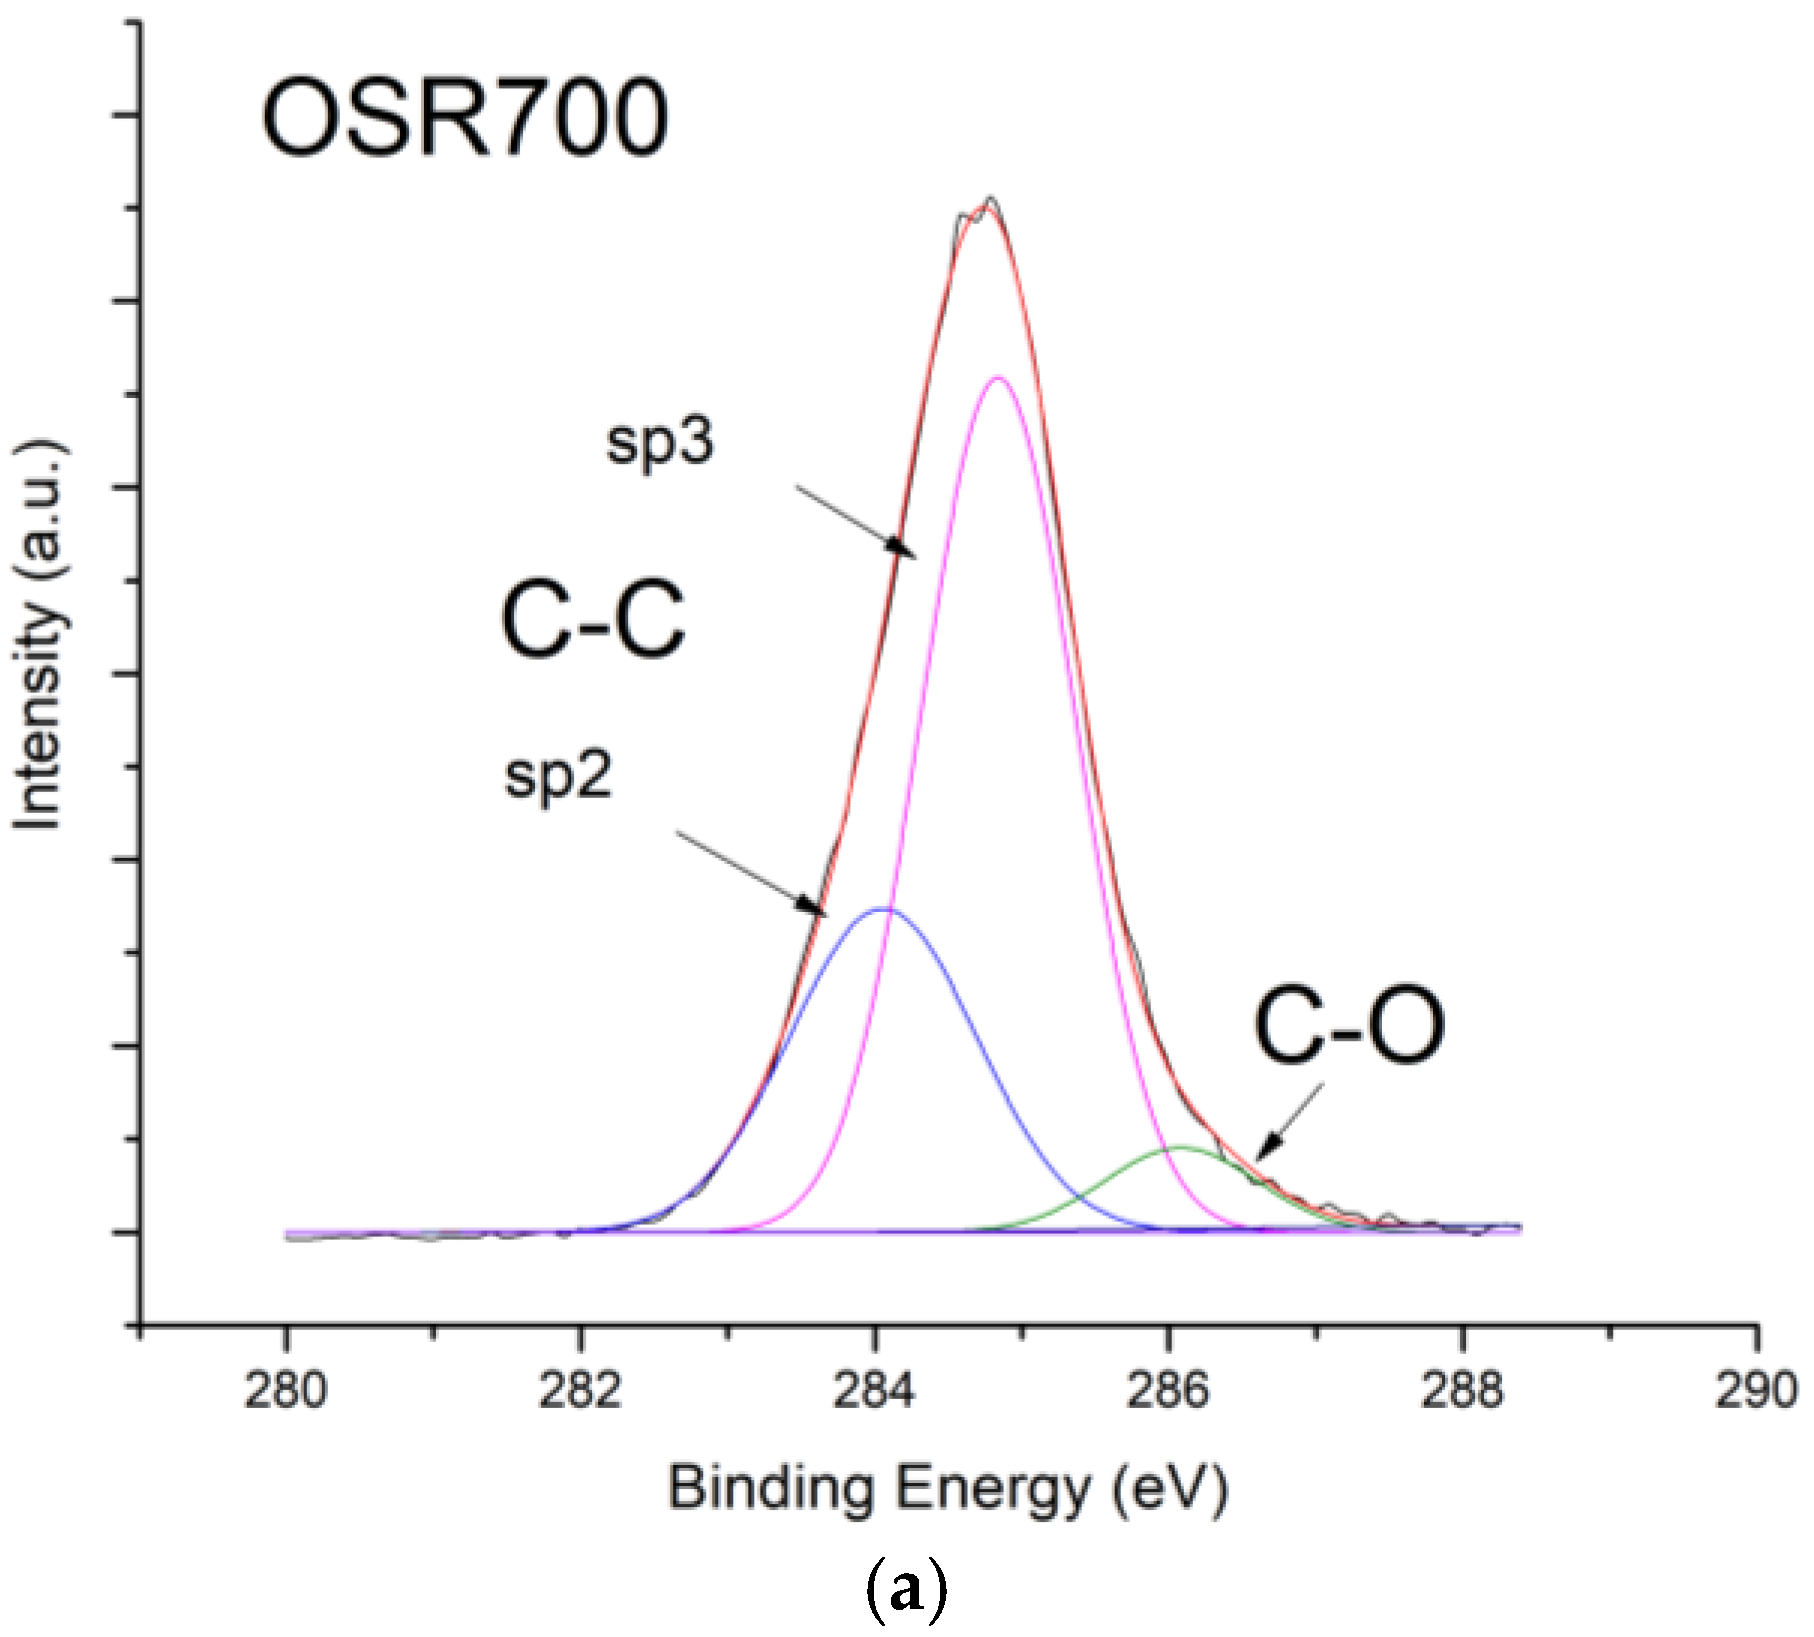
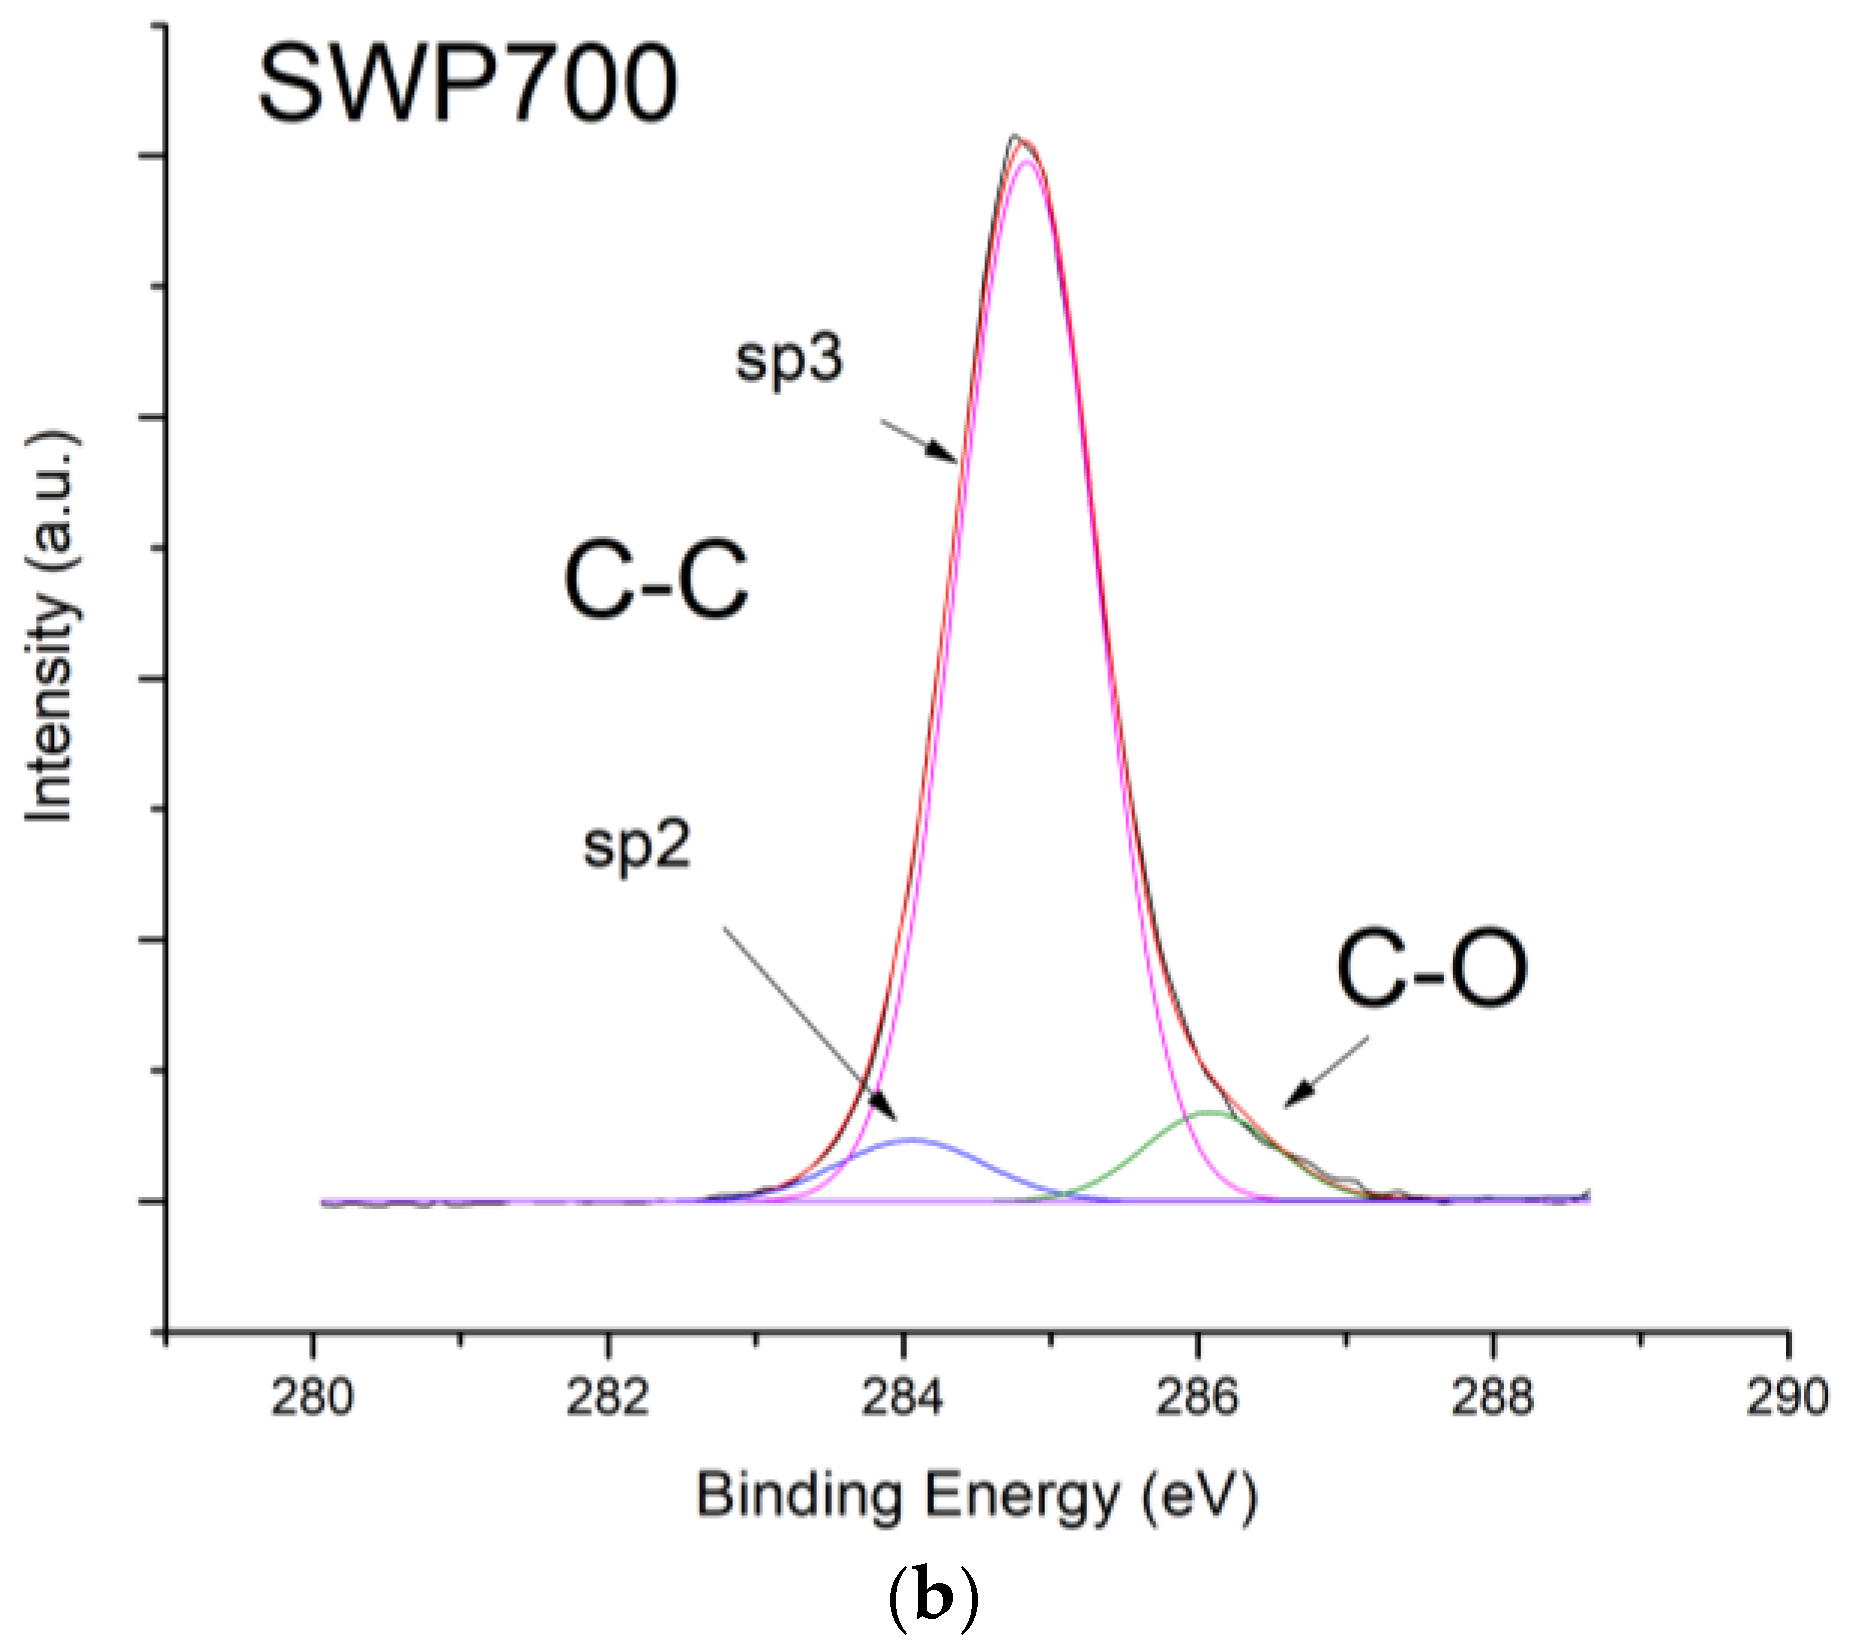
Surface chemistry of OSR700 and SWP700 were investigated using the XPS technique. The high-resolution spectra of C1s peaks are reported in Figure 4. XPS characterization shows the presence of the elements reported in Table 3. In particular, Si and Cl are present only in OSR700 while the carbon content is higher in SWP700. In both biochars, surface composition appears to be enriched in oxygen content compared to the information reported in the datasheets [24,25].
OSR700 biochar presents a higher content of C in form of sp2 bonds compared to SWP700 (29.11% vs. 5.35% of total carbon). In addition, the concentration of other elements like K and Ca in OSR700 is higher, and Si is found only in the oil seed rape sample.
3.4. Raman Characterization
In the Raman investigation, different regions of the samples were analyzed to ensure the consistency of the results, that are depicted in Figure 5.
D (~1360 cm−1) and G (~1650 cm−1) peaks were focused. The signals were analyzed with inhouse developed and validated software that allows us (i) to get rid of the background contribution and (ii) to identify the contribution of the various components. The parameter focused in this work is the ratio ID/IG of the intensities of D and G peaks. 2D region, from 2300 to 3500 cm−1, is also informative [30,31], but its investigation is beyond our interest in the present paper.
3.5. FESEM Observation
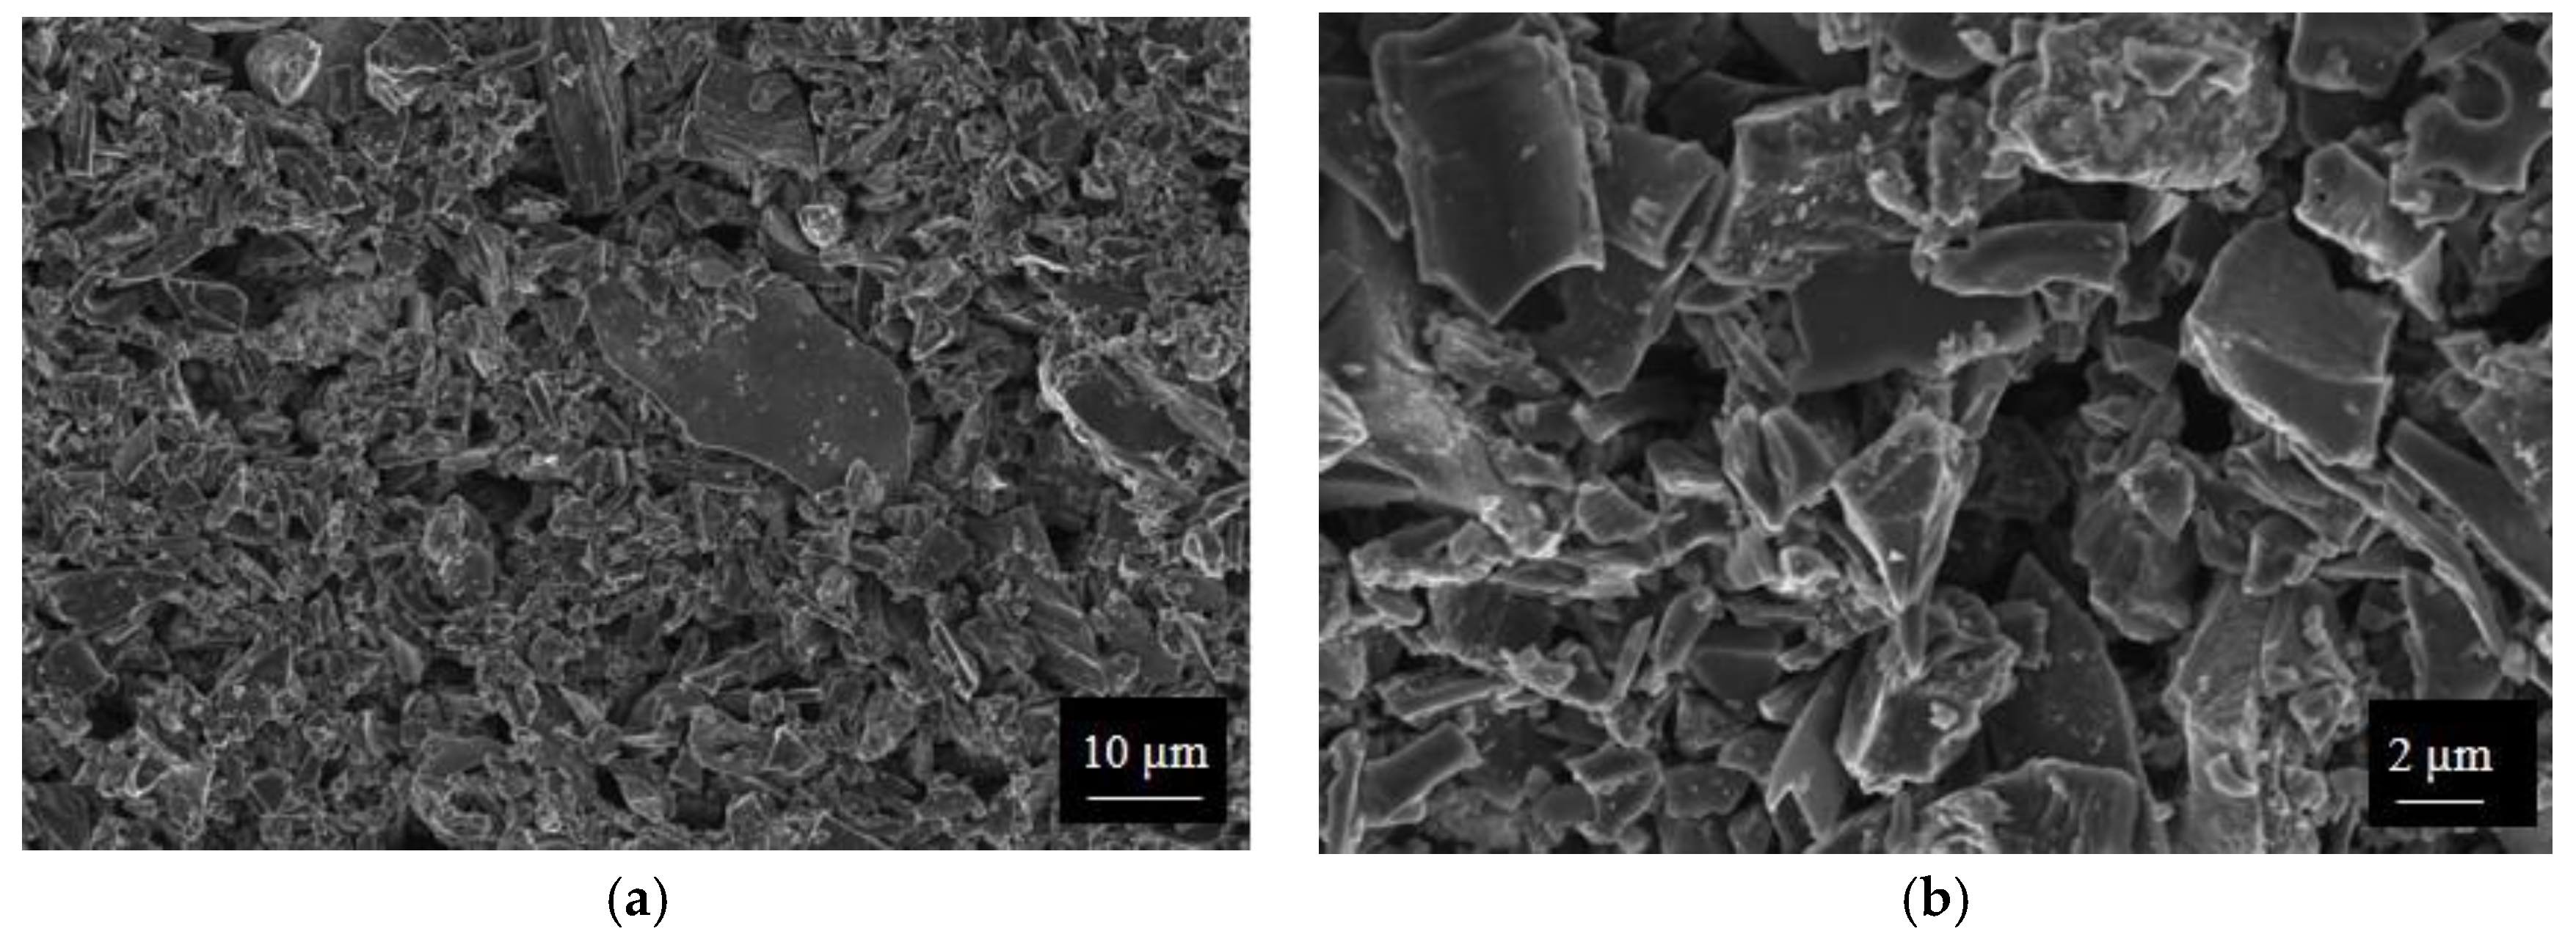
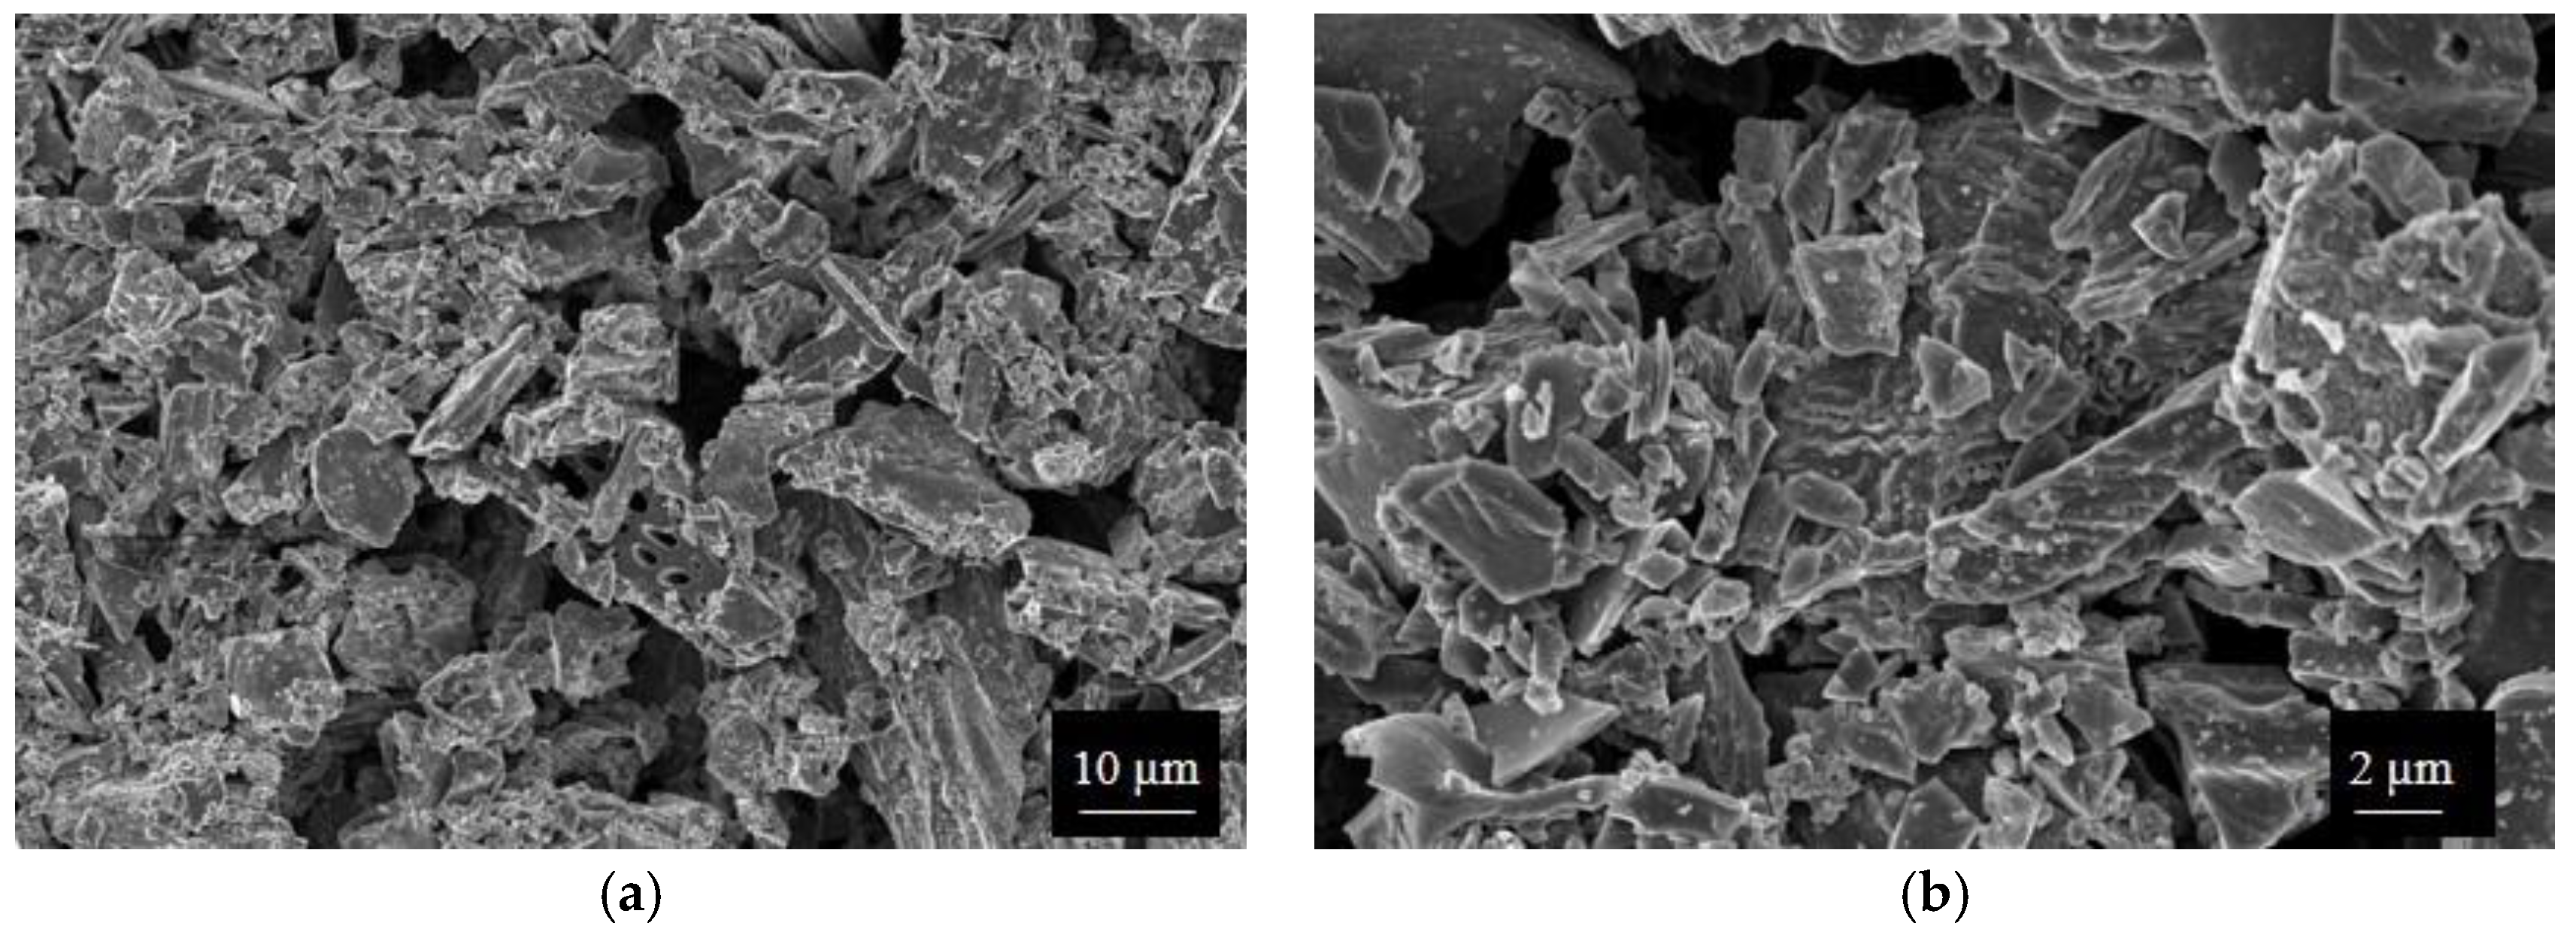
FESEM images in Figure 6 illustrate OSR700 biochar films at different magnification (2500× and 10,000×). A wide particle size distribution was observed, with some large, facetted particles surrounded by a finer fraction, in agreement with laser granulometry measurements. SWP700 biochar film observations are displayed in Figure 7, at 2500× and 10,000× magnification. The grinding process results in small fragments in the range between 1 and 50 μm, which is still in agreement with the results of particle size distribution measurements. The particles are facetted with sharp edges, as expected in a fragile powder exhibiting an irregular surface after grinding.
3.6. Electrical Characterization
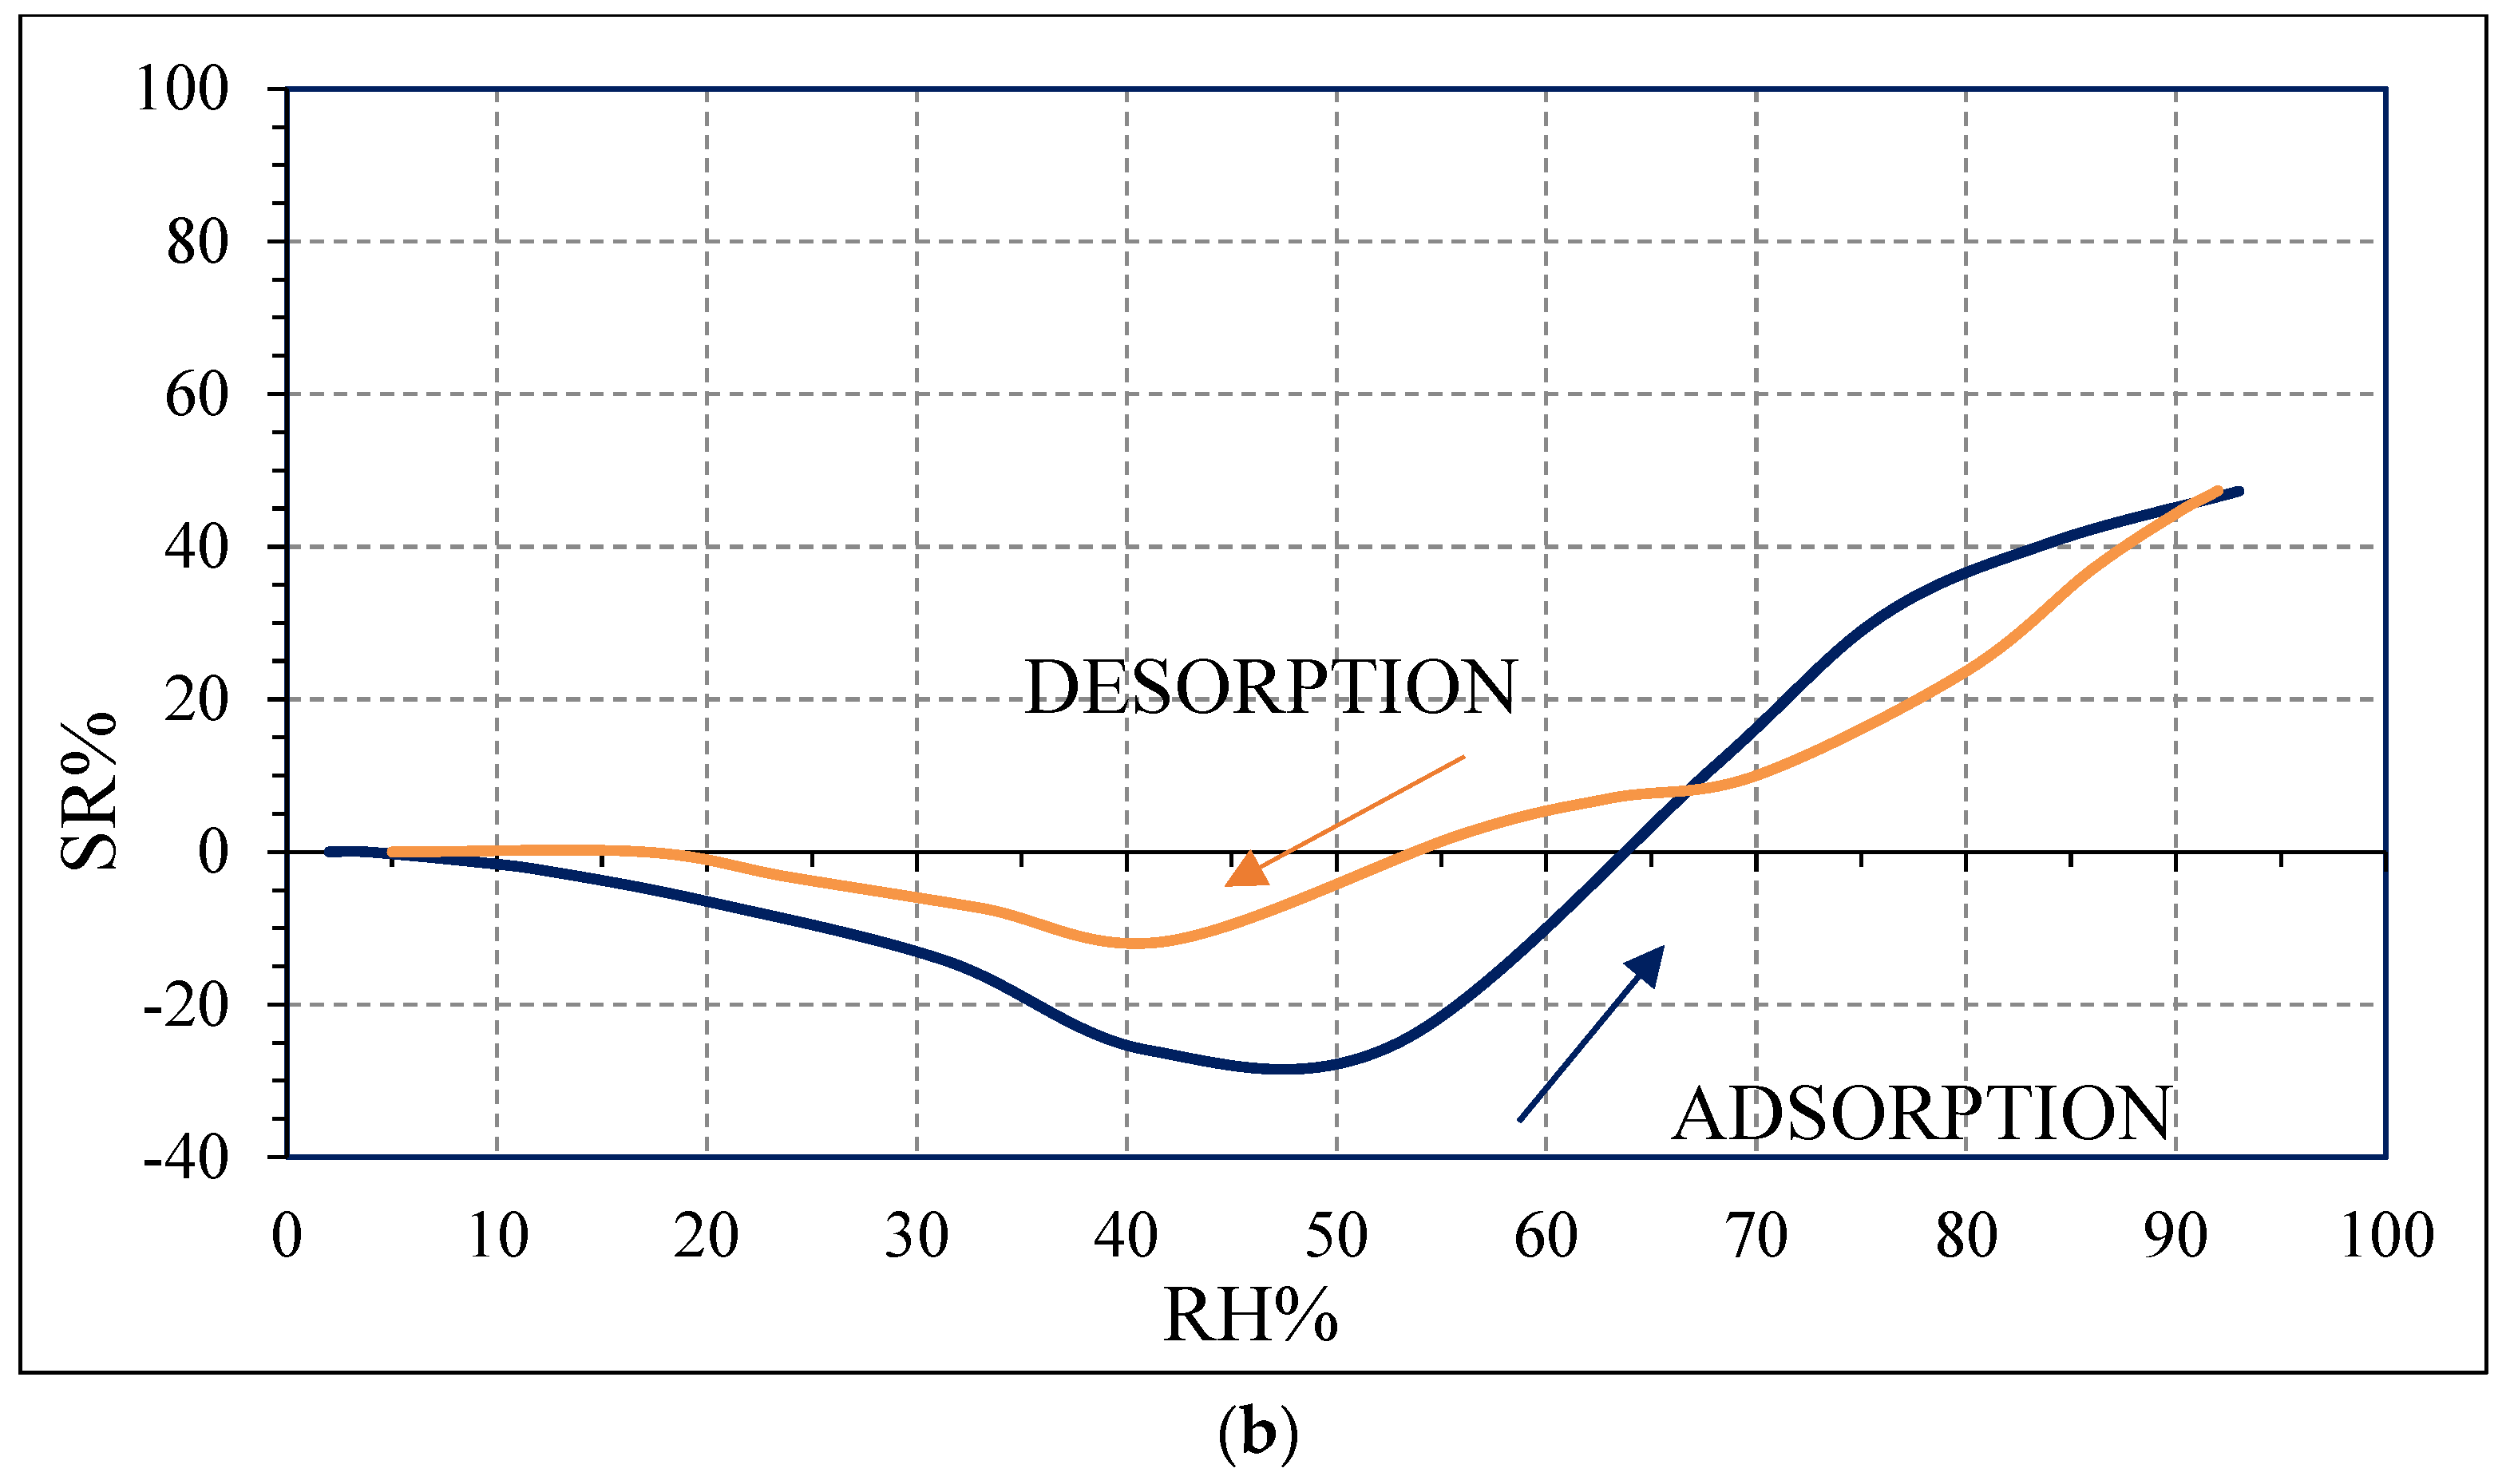
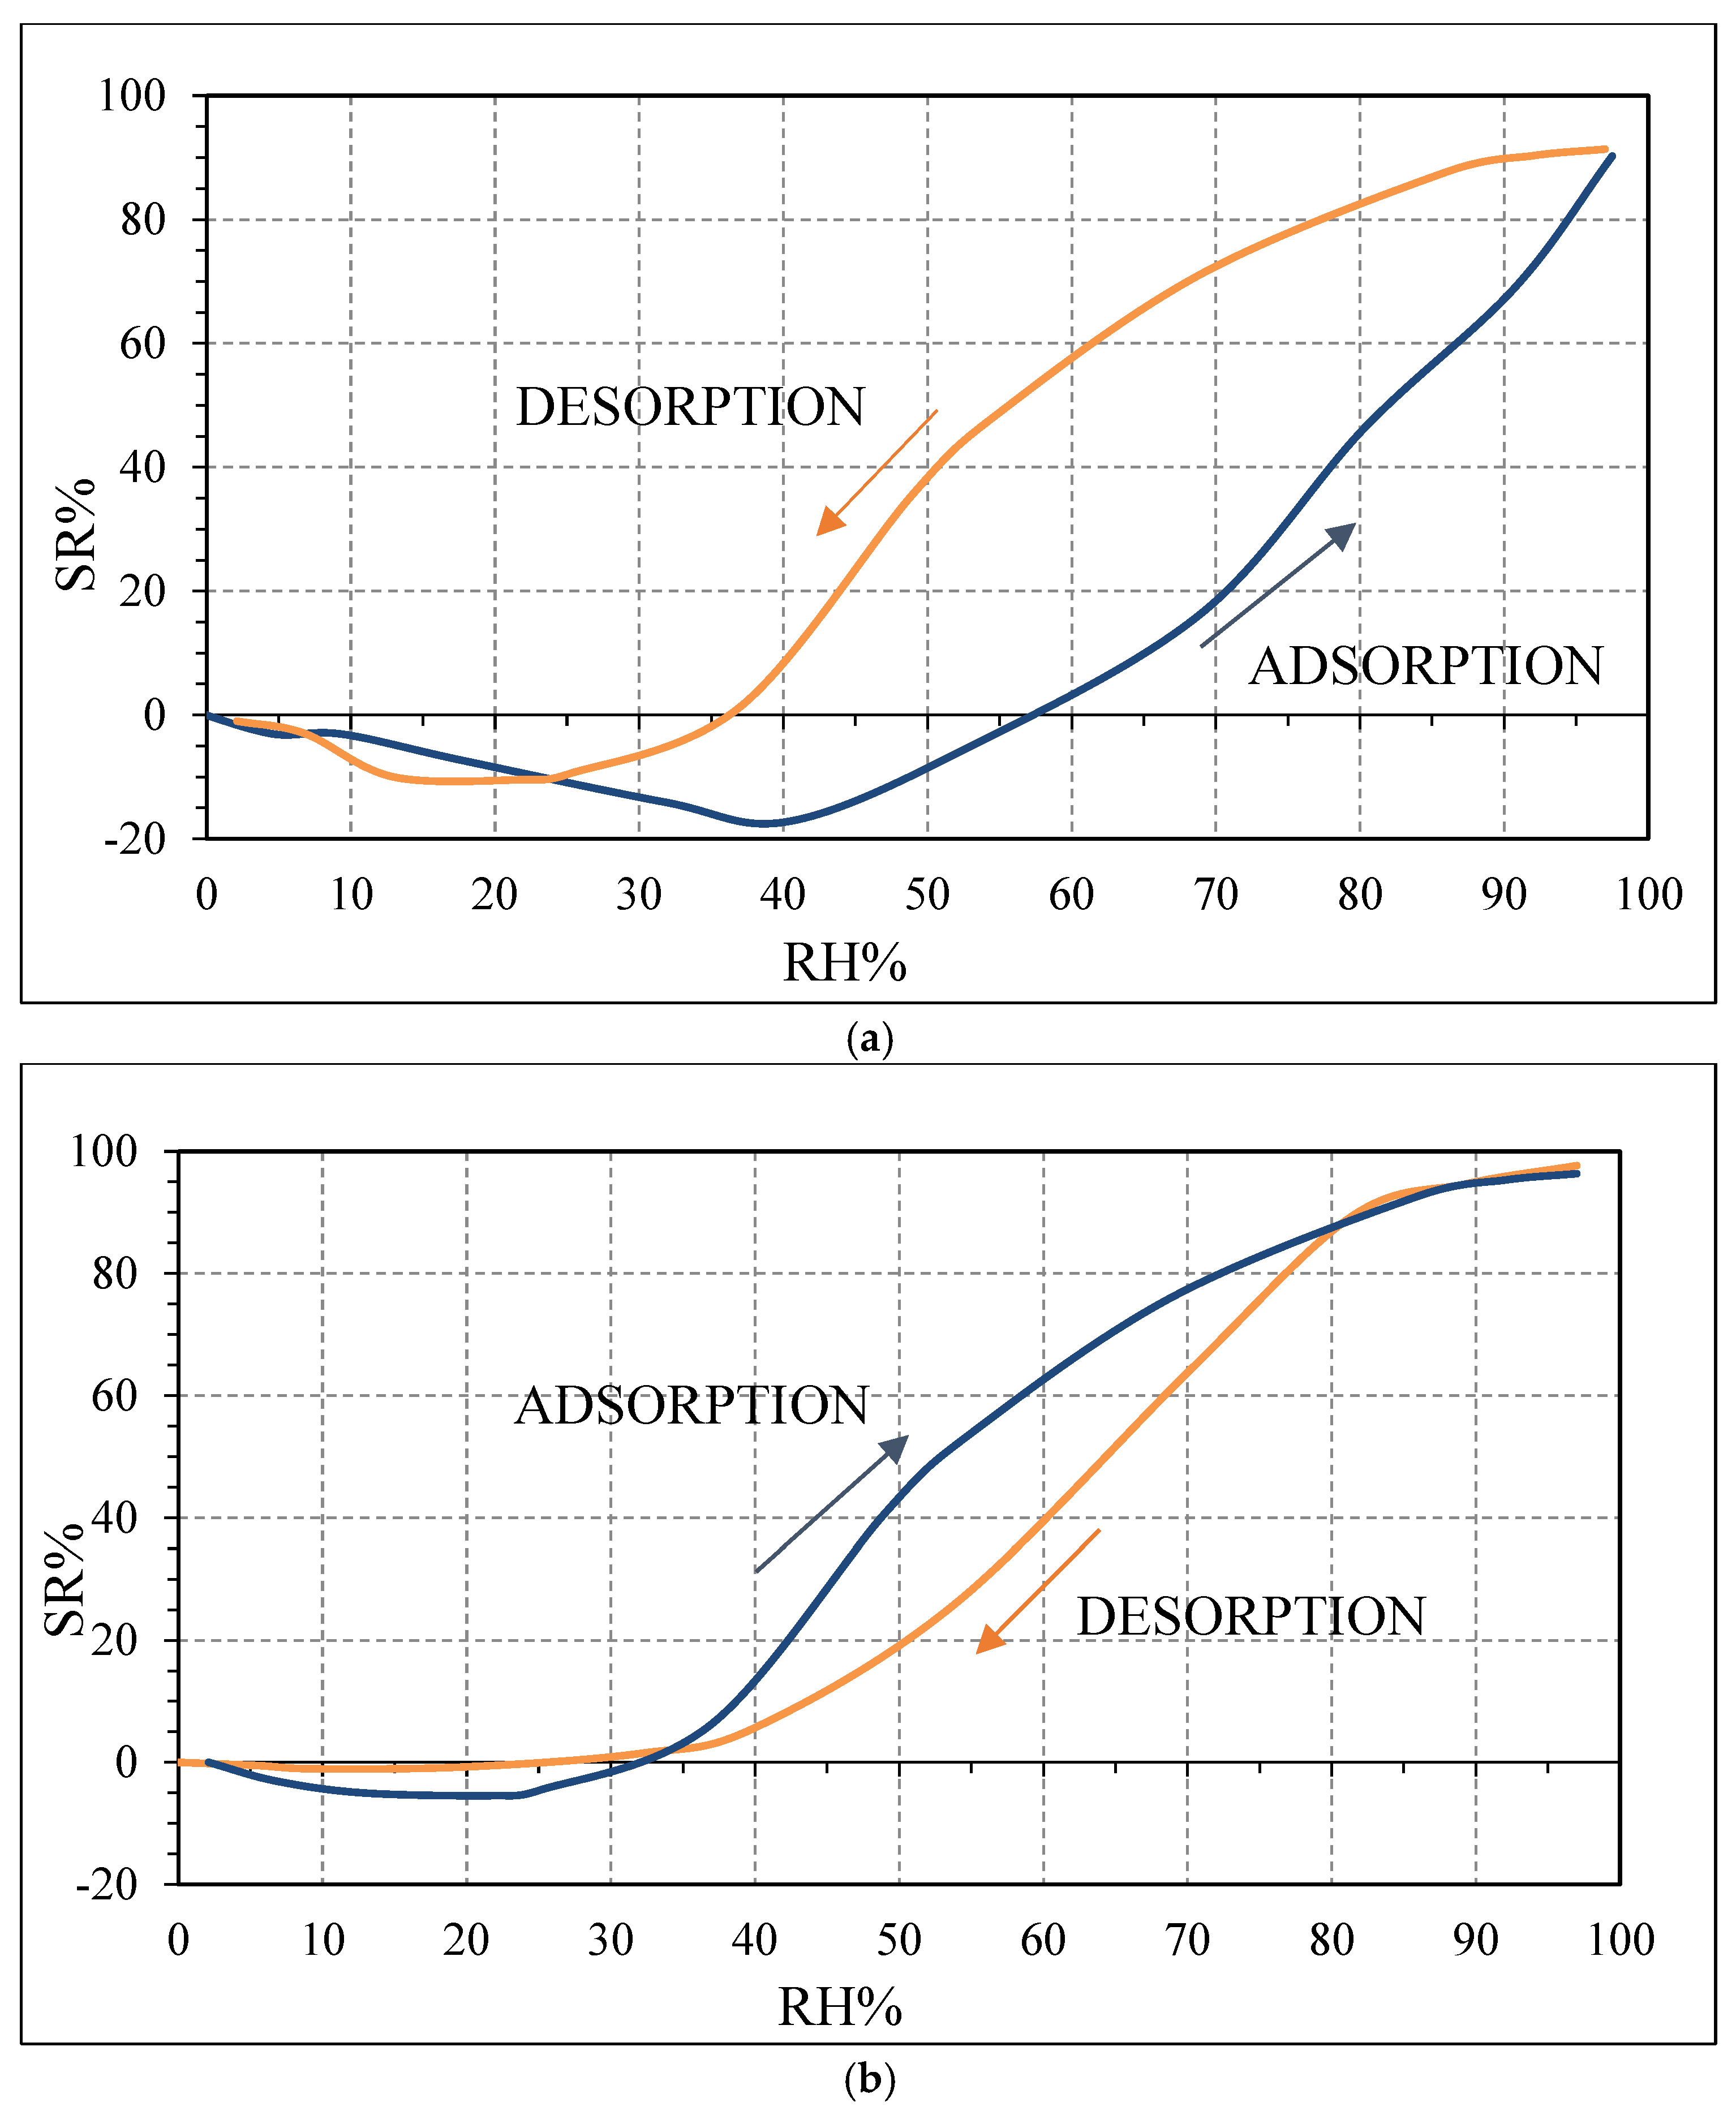
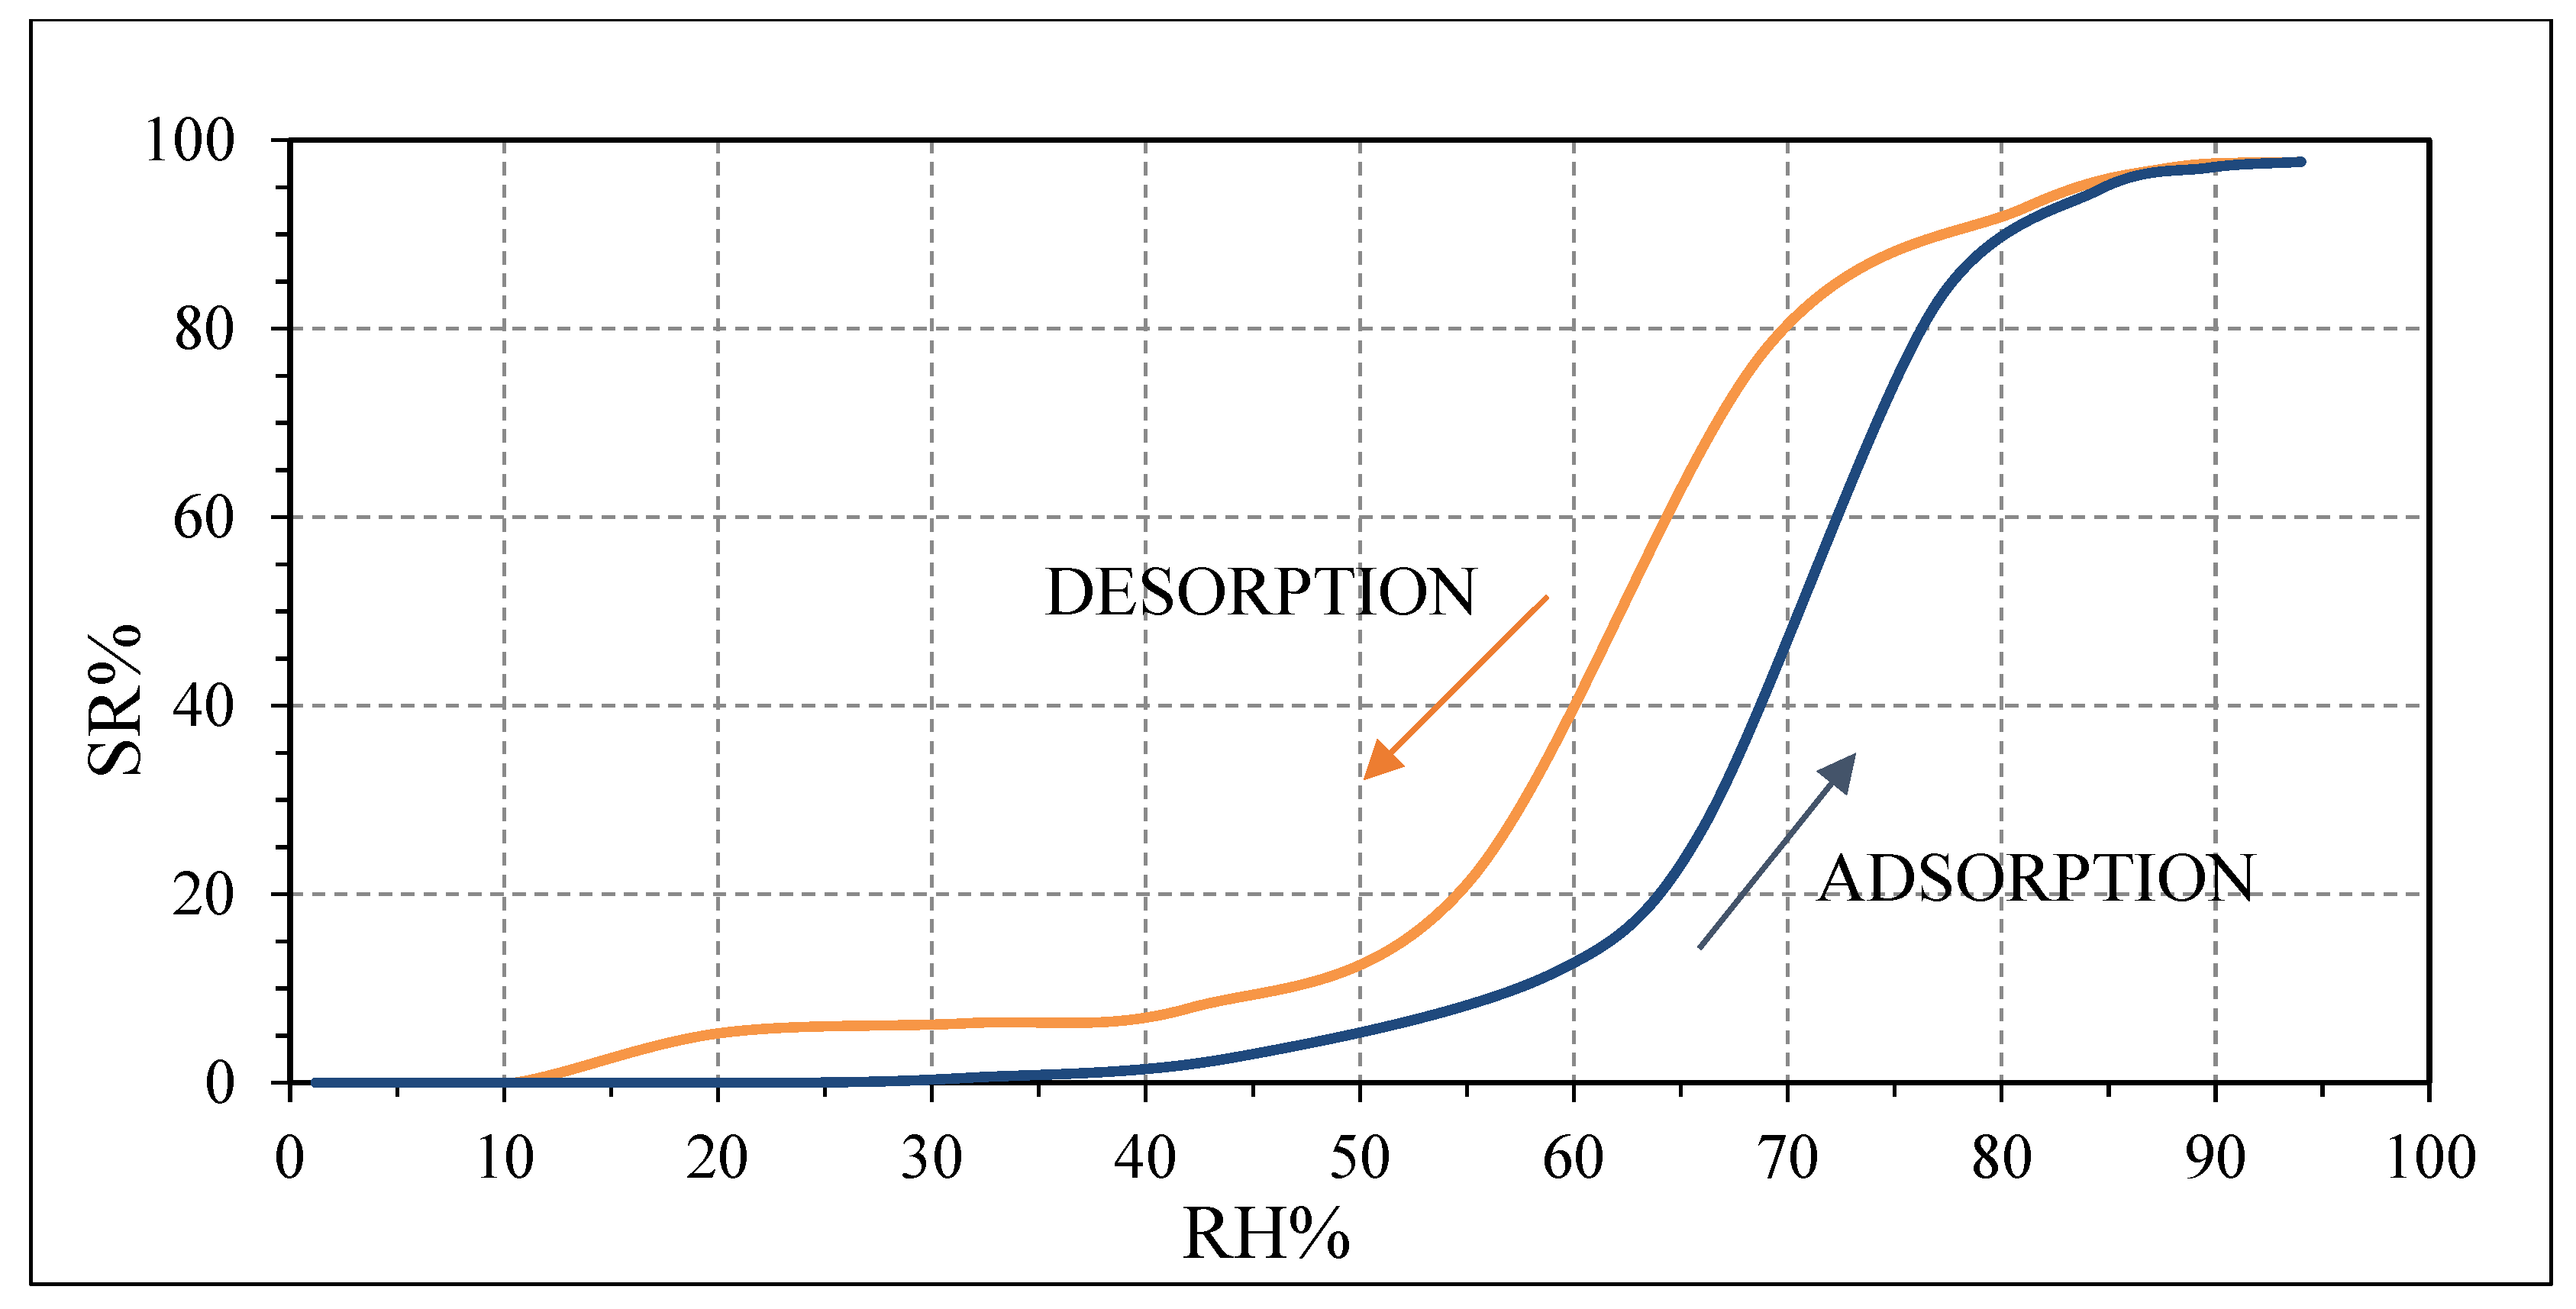
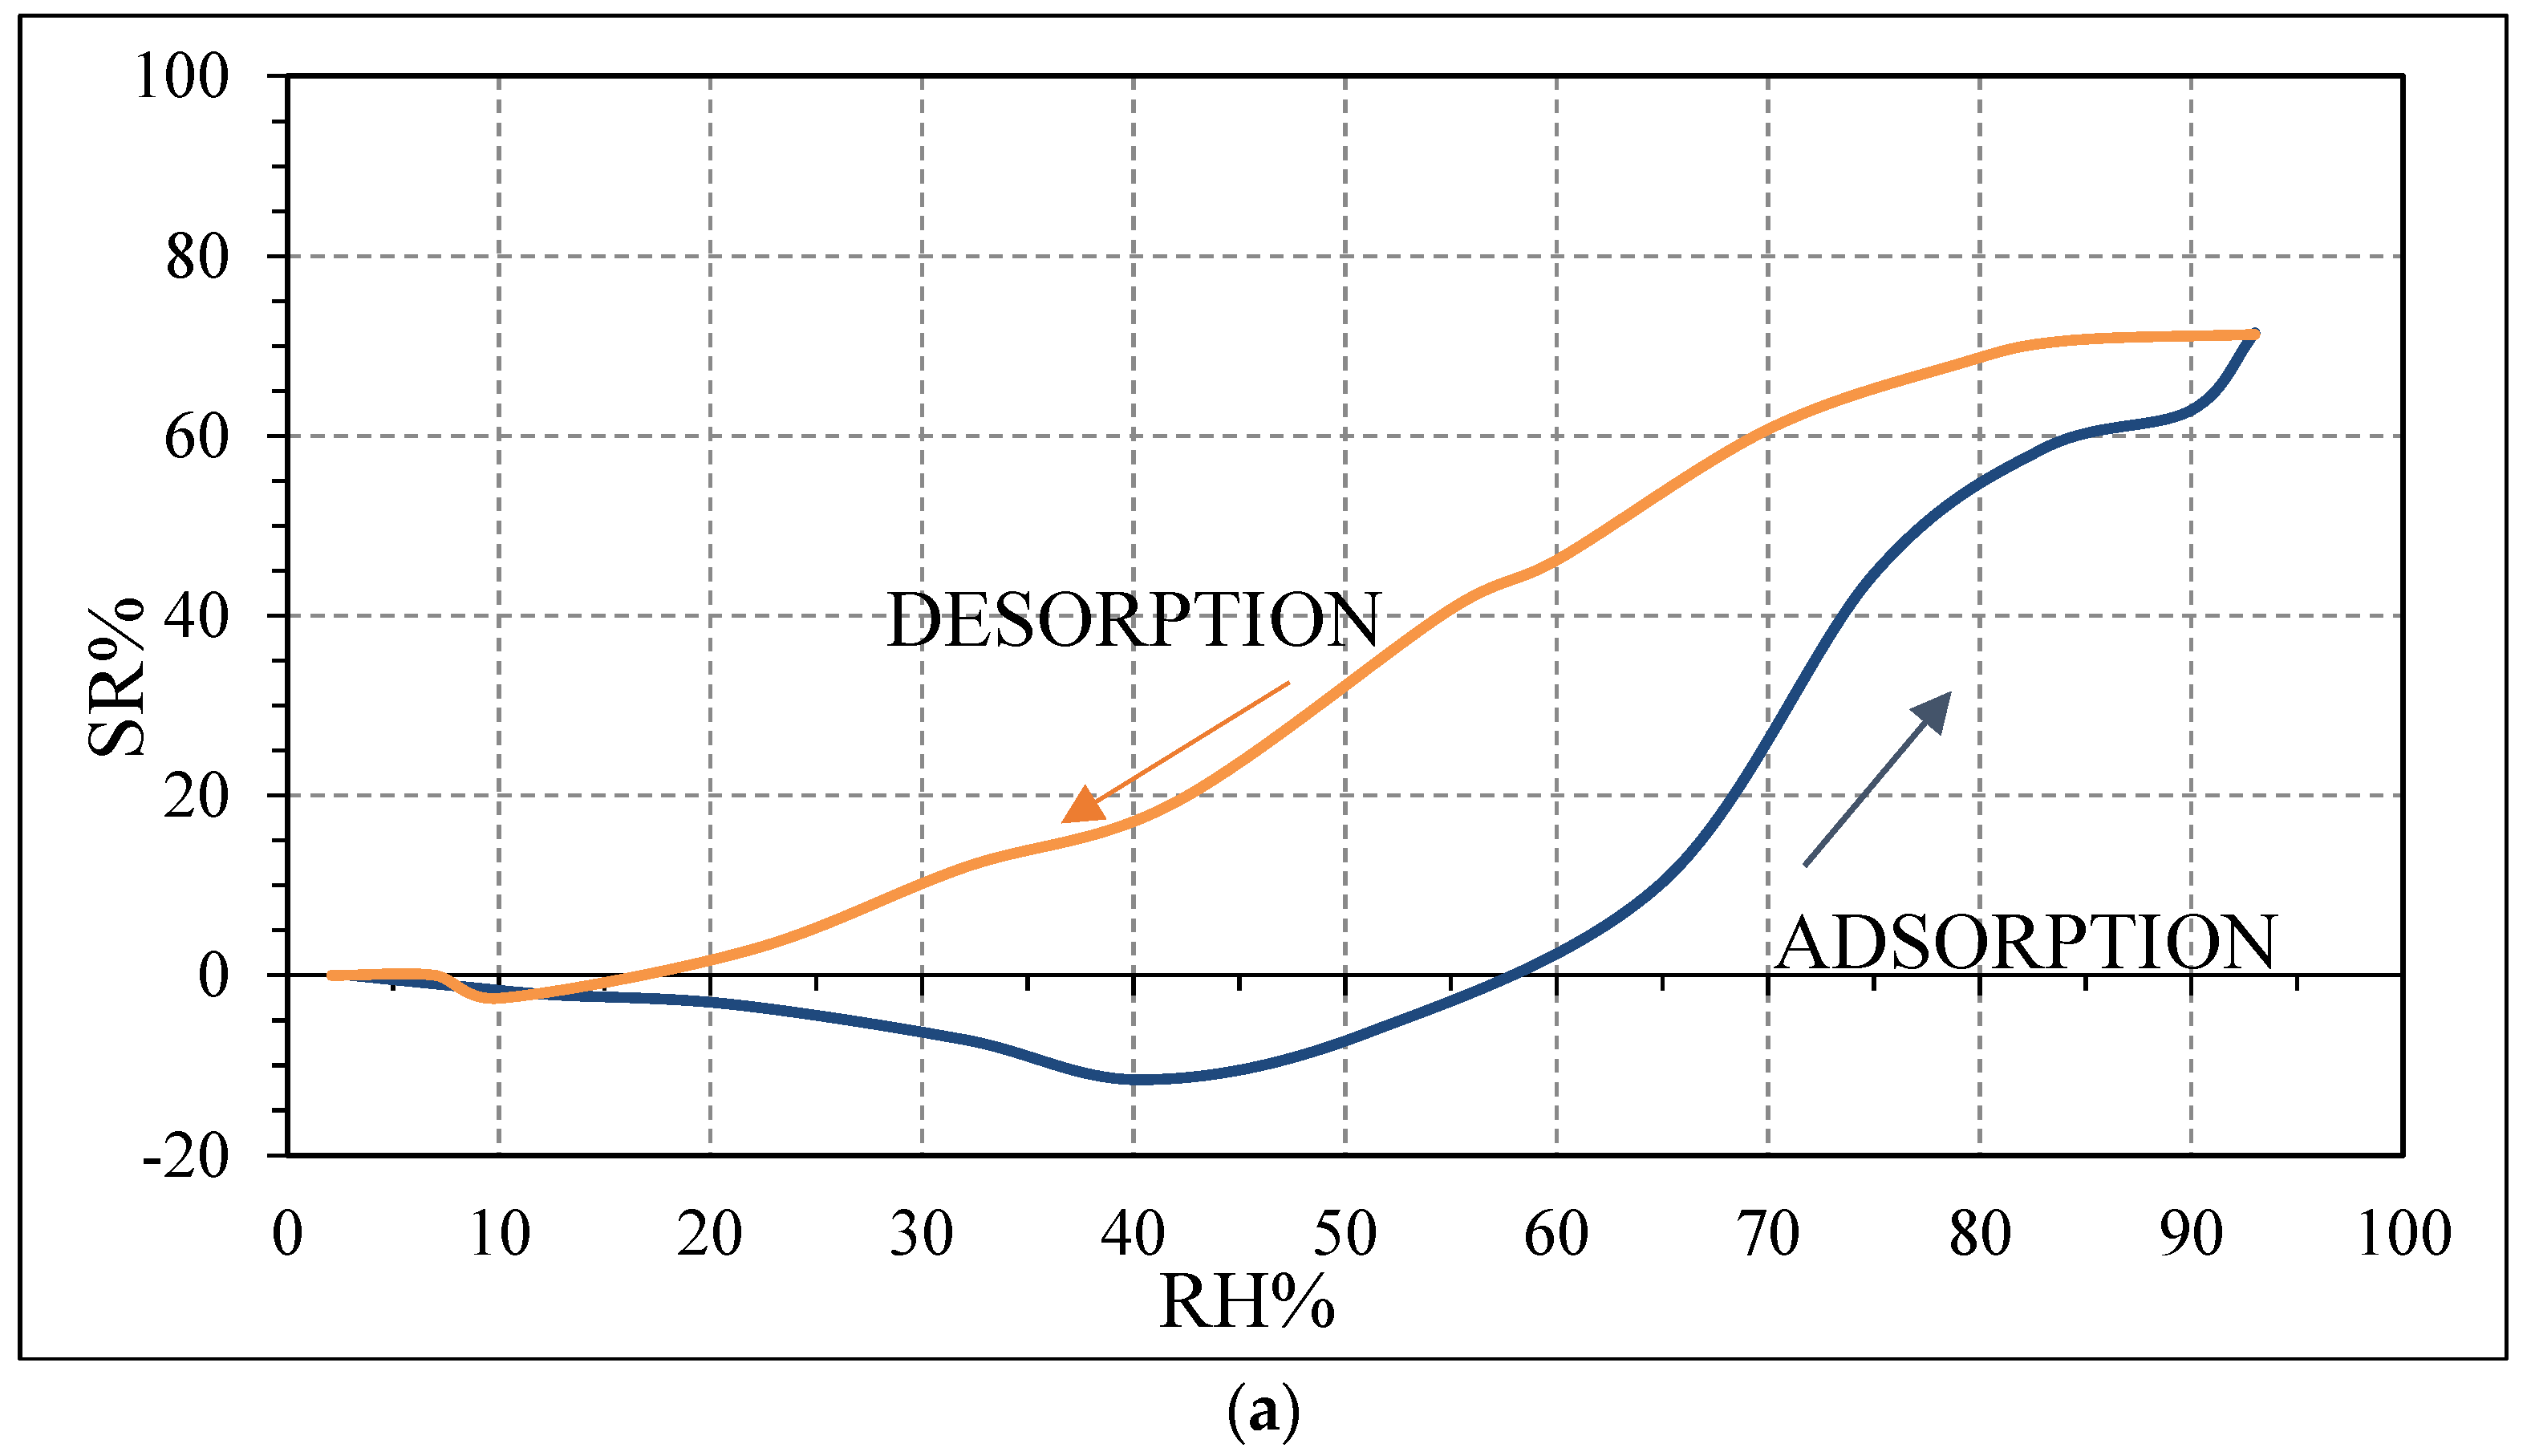
Results of the test toward humidity are illustrated in Figure 10 for OSR700 and SWP700 sensors. Both materials are sensitive toward humidity starting from low RH values. In fact, impedance begins to increase (i.e., SR% slope is negative) from 5 RH%, and an increment in impedance of the film was noticed until about 40 RH% for OSR700 sensor and until 25 RH% for SWP700. In both cases, biochar materials are behaving as p-type semiconductors under low amounts of humidity. On the contrary, for higher RH values, the impedance decreased from about 40 RH% for OSR700 and from 25 RH% for SWP700. More in detail, for the more conductive OSR700 film, the initial impedance under dry air was equal to 163.9 kΩ, and the final impedance under 99 RH% dropped down to 9 kΩ, leading to a sensor response SR% equal to 94.5%, together with a maximum hysteresis of 52% under 59 RH% (Figure 10a). For SWP 700 film, due to the highest surface area and porosity compared to OSR700 biochar, a more consistent impedance variation was reported, and the impedance declined from 9.5 MΩ in dry condition until 222 kΩ in a humid environment, with a SR% of 97.7%, as reported in Table 4. This material exhibits a lower hysteresis, with a maximum value for this parameter of 23% under 55 RH% (Figure 10b).
The response times, together with the recovery times were also determined. For OSR700 sensor they are 50 and 70 s respectively, while for SWP700 sensor both are in the order of 1 min.
Using SWP700, the biochar most sensitive towards humidity, sensors with different amounts of PVP were produced. PVP is a n-type hydrophilic conductive polymer [27,28] used here in 10 and 20 wt %. In addition, a pure PVP sensor was also realized. This reference sensor reported an impedance from 19 MΩ in dry condition to 420 kΩ under 98% of relative humidity with a response above 40 RH%. Results towards humidity of PVP sensor are shown in Figure 11 and confirm its n-type semiconducting behavior (the impedance decreases with the increasing RH values).
From now on, the sample prepared with SWP700 biochar and 10 and 20 wt % PVP are labelled SWP700-10% PVP and SWP700-20% PVP, respectively. The sensors’ response towards relative humidity are shown in Figure 12 and reported in Table 4. As expected, the sensitivity of the sensor decreased passing from the pure SWP700 biochar to the SWP700-10% PVP and SWP700-20% PVP sensors. Moreover, maximum hysteresis was equal to 42% under 60 RH% for SWP700-10% PVP composite, and 27% under 52 RH% for SWP700-20% PVP composite.
SWP700-10% PVP sensor seems to be a satisfying compromise between two fundamental parameters: sensitivity toward humidity and adhesion of the film onto the substrate. For this reason, evaluation of impedance’s changes with the temperature together with cross sensitivity tests were performed for this sensor. The former results under a constant dry air flow of 1700 sccm are summarized in Table 5, where experiments were carried out in a thermostatic chamber between 25 °C and 60 °C.
An increase in the operating temperature of 35 °C in dry conditions caused a drop in the film impedance of about 40%, as expected and reported in the literature [16,17,32].
Furthermore, cross sensitivity tests were performed under a constant flow of 1000 sccm on the same sensor, and the results are displayed in Table 6. No interferences were detected toward ozone 0.5 ppm, methane 100 ppm, and carbon dioxide 500 and 600 ppm, while only under 50 ppm of ammonia, an increase of 2.6% in impedance at room temperature was measured. Moreover, no synergic effect was observed for SWP700-10% PVP film under 600 ppm of carbon dioxide and air with 40 RH%.
4. Discussion
Water molecules can adsorb on the surface of carbon films due to a weak binding of water hydrogens to biochar surface carbon atoms [20]. Moreover, the sensing performance can be improved by the presence of defects in carbon grains, as evidenced by Raman spectroscopy results (Figure 5), which could create favorable adsorption sites to water molecules. These defects also favor water molecules adsorption by creating favorable adsorption sites [20]. Oxygen derivatives on carbon surface make the carbon surface hydrophilic and increase water vapor adsorption [20]. Thus, at low RH values, a few water vapor molecules chemically adsorb on the biochar grain surfaces. Pati et al. [33] suggested a possible charge transfer between the adsorbate and the carbon film. This, probably leads to electrons exchange with a p-type semiconductor and their transfer to the valence band, leading to an increase of the impedance [20]. However, for higher RH values (above 40 RH% for OSR700 and above 25 RH% for SWP700), more water molecules are adsorbed on the surface, and operating at room temperature, water molecules will cluster to form a liquid-like multilayer of hydrogen-bonded water molecules [34]. Moreover, these physisorbed water molecules can condense into pores having a size in the range 1–250 nm. Since the formation of clusters of H2O and the hydration of H+ into H3O+ are energetically favored in liquid water, H+ are the dominant charge carriers in the water adsorbed in the mesopores. As the amount of H+ increases when increasing the moisture content, H+ can move freely in liquid water, leading to a decrease of grain surface impedance with increasing RH values [34]. This mechanism explains why Zg, defined in Equation (1), tends to decrease with increasing RH values, leading to an enhancement of the sensor response, as observed in Figure 10, contrarily to what was expected from biochars as p-type semiconductors. Furthermore, the sp2/sp3 ratio determined by XPS measurements could also affect the sensor response at low relative humidity values (5–30%). In fact, the hydrophilic character is evidenced by a higher sp2/sp3 ratio, like in OSR700 film (sp2/sp3 = 0.45) compared to SWP700 one (sp2/sp3 = 0.06), in accordance with the literature [35]. As a consequence, the former biochar exhibits an enhanced affinity for the adsorption of water molecules at lower amounts of RH with respect to the latter one.
The difference in the hysteresis between the two biochars (Figure 10) may be probably explained by the different pore size distribution among the samples: in the case of OSR700, the hysteresis is higher because water molecules desorption is more difficult and takes longer time due to smaller pores or more tortuous ones. However, this feature was not investigated in this work and should be further studied. The effect of specific surface area on sensitivity of a quartz crystal microbalance-based polyacrylic acid ammonia sensor is reported in ref. [36]. The results of this study confirmed that the ammonia sensitivity was enhanced rapidly by the continuous increase of SSA and showed a logarithmic growth trend [36]. In our case, the higher SSA of SWP700 biochar probably favors water molecules adsorption too, leading to a faster decrease of the impedance value from 25 RH%, with respect to 40 RH% for OSR700 sensor.
Pristine PVP is a highly hydrophilic polymer due to the presence of a nitrogen atom in its molecule [37,38]. Thus, it can easily adsorb water molecules. As previously explained, at low relative humidity values, only a few water molecules can be adsorbed on the surface of PVP to generate a few H+ and H3O+ ions. Then, the intrinsic electrons of PVP are the main responsible for the conduction of PVP which behaves as a n-type semiconductor as confirmed in Figure 11 [37,38]. When increasing RH values, the water molecules on the surface of PVP provide more carriers (H+ and H3O+) which mainly contribute to the conduction of PVP [39]. Above 94 RH%, the pristine PVP can be swelled by water, generating many conductive ions [40].
The decrease in impedance for the SWP700-10% PVP sensor compared to the SWP700 is probably due to the enhanced connection between biochar grains in the polymeric medium compared to biochar as it is. Moreover, when n-p heterojunctions are formed at nanoscale level between two semiconductors, i.e., PVP and biochar, electrons are transferred from n-type PVP to p-type biochar, while holes are moved in the opposite direction, to equate the Fermi levels of both materials [41]. Then, a potential barrier with the bending of energy levels is formed at the heterojunctions. Thus, the impedance of the n-p composite increases, compared to the pure biochar [41]. With increasing initial impedance, the variation of impedance due to the presence of few water molecules becomes more evident, leading to a higher sensitivity, as experimentally observed for the sensors SWP700-10% PVP and SWP700-20% PVP (Figure 12a,b), compared to the sensor SWP700 (Figure 10b). This larger initial impedance leads to a stronger initial response [41]. Table 7 compares the results presented in this paper and literature data when possible because the initial resistance value under dry air is not always mentioned or determinable from experimental curves. The obtained results are rather promising.
Future prospective involves monitoring sensors’ response in function of the temperature, since a preliminary evaluation of carbonaceous materials change resistance values with temperature was performed only under dry air. Moreover, ageing phenomena will be investigated too, and verifying how their response is eventually affected by storage must be investigated.
5. Conclusions
In this work, two commercial biochars were evaluated as new humidity sensing materials.
The sensors were prepared by a simple and low-cost process, and their humidity sensing properties were investigated at room temperature in the relative humidity range from 0.0 to almost 100%. Both pristine materials are sensitive toward humidity starting from low RH values. In fact, impedance begins to increase from 5 RH%, and an increment in impedance was noticed until about 40 RH% for the OSR700 sensor, and until 25 RH% for the SWP700 sensor. In both cases, biochar materials behave as p-type semiconductors under low amounts of humidity. On the contrary, for higher RH values, the impedance decreased due to a higher amount of water molecules adsorption.
When PVP is added as a polymeric binder to SWP700 biochar, n-p heterojunctions are formed between the two semiconductors, leading to a higher sensitivity at low RH values for the sensors SWP700-10% PVP and SWP700-20% PVP with respect to the pure SWP700 sensor. This behavior makes these sensors potentially interesting for industrial applications where low RH values are required (drying of clothes (0–40 RH%), pharmaceuticals (20–40 RH%), cereal stocking (0–45 RH%), electronic parts, ceramic powders, humidity control in factories, dryers, dried foodstuffs (0–50 RH%), and film desiccation (0–30 RH%)…) [34]. Thus, they are rather devoted to niche markets rather than the mass market.
Finally, the response and recovery times were reasonably fast (in the order of 1 min), and the cross-sensitivity to methane, carbon dioxide, ammonia, and ozone was negligible.
Acknowledgments
Authors are grateful to Salvatore Guastella for XPS analysis, Massimo Rovere for Raman fit, and Mauro Raimondo for FE-SEM observations.
Author Contributions
M.G., P.P., A.T., J.-M.T. and D.Z conceived and designed the experiments. D.Z. performed the experiments. M.G., P.P., A.T., J.-M.T. and D.Z analyzed the data; D.Z., M.G., and J.-M.T. wrote the paper.
Conflicts of Interest
The authors declare no conflict of interest.
References
- Chen, Z.; Lu, C. Humidity Sensors: A review of materials and mechanisms. Sens. Lett. 2005, 3, 274–295. [Google Scholar] [CrossRef]
- Farahani, H.; Wagiran, R.; Hamidon, M.N. Humidity Sensors Principle, Mechanism, and Fabrication Technologies: A Comprehensive Review. Sensors 2014, 14, 7881–7939. [Google Scholar] [CrossRef] [PubMed]
- Duraia, E.M.; Beall, G.W. Humidity sensing properties of reduced humic acid. Sens. Actuators B Chem. 2015, 220, 22–26. [Google Scholar] [CrossRef]
- Tulliani, J.-M.; Bonville, P. Influence of the dopants on the electrical resistance of hematite-based humidity sensors. Ceram. Int. 2005, 31, 507–514. [Google Scholar] [CrossRef]
- Esteban-Cubillo, A.; Tulliani, J.-M.; Pecharromán, C.; Moya, J.S. Iron-oxide nanoparticles supported on sepiolite as a novel humidity sensor. J. Eur. Ceram. Soc. 2007, 27, 1983–1989. [Google Scholar] [CrossRef]
- Cavalieri, A.; Caronna, T.; Natali Sora, I.; Tulliani, J.M. Electrical characterization of room temperature humidity sensors in La0.8Sr0.2Fe1−xCuxO3 (x = 0, 0.05, 0.10). Ceram. Int. 2012, 38, 2865–2872. [Google Scholar] [CrossRef]
- Kim, Y.; Jung, B.; Lee, H.; Kim, H.; Lee, K.; Park, H. Capacitive humidity sensor design based on anodic aluminum oxide. Sens. Actuators B Chem. 2009, 141, 441–446. [Google Scholar] [CrossRef]
- Su, P.-G.; Wang, C.S. Novel flexible resistive-type humidity sensor. Sens. Actuators B Chem. 2007, 123, 1071–1076. [Google Scholar] [CrossRef]
- Islam, T.; Nimal, A.T.; Mittal, U.; Sharma, M.U. A micro interdigitated thin film metal oxide capacitive sensor for measuring moisture in the range of 175–625 ppm. Sens. Actuators B. Chem 2015, 221, 357–364. [Google Scholar] [CrossRef]
- Balde, M.; Vena, A.; Sorli, B. Fabrication of porous anodic aluminum oxide layers on paper for humidity sensors. Sens. Actuators B Chem. 2015, 220, 829–839. [Google Scholar] [CrossRef]
- Feng, X.; Chen, W.; Yan, L. Chemical free-standing dried foam films of graphene oxide for humidity sensing. Sens. Actuators B Chem. 2015, 215, 316–322. [Google Scholar] [CrossRef]
- Fernández-Ramos, M.D.; Ordóñez, Y.F.; Capitán-Vallvey, L.F.; De Vargas-Sansalvador, I.M.P.; Ballesta-Claver, J. Optical humidity sensor using methylene blue immobilized on a hydrophilic polymer. Sens. Actuators B Chem. 2015, 220, 528–533. [Google Scholar] [CrossRef]
- Jung, D.Y.; Yang, S.Y.; Park, H.; Shin, W.C.; Oh, J.G.; Cho, B.; Choi, S.Y. Interface engineering for high performance graphene electronic devices. Nano Converg. 2015. [Google Scholar] [CrossRef]
- Phan, D.-T.; Chung, G.-S. Effects of rapid thermal annealing on humidity sensor based on graphene oxide thin films. Sens. Actuators B Chem. 2015, 220, 1050–1055. [Google Scholar] [CrossRef]
- Su, P.-G.; Shiu, W.-L.; Tsai, M.-S. Flexible humidity sensor based on Au nanoparticles/graphene oxide/thiolated silica sol–gel film. Sens. Actuators B Chem. 2015, 216, 467–475. [Google Scholar] [CrossRef]
- Lukaszewicz, J.P.; Panas, M.; Siedlewski, J. Sodium-doped carbon films for humidity sensor construction. Sensors and Actuators B Chem. 1996, 32, 221–226. [Google Scholar] [CrossRef]
- Suda, T.; Kondo, N.; Okabe, T.; Saito, K. Electrical Properties of Wood ceramics. J. Porous Mater. 1999, 6, 255–258. [Google Scholar] [CrossRef]
- Lukaszewicz, J.P. Carbon-film-based humidity sensor containing sodium or potassium. Recovery effect. Sens. Actuators B Chem. 1999, 60, 184–190. [Google Scholar] [CrossRef]
- Lukaszewicz, J.P. Semiconducting carbons as selective adsorbents for humidity sensors. Electron. Technol. 2000, 33, 195–206. [Google Scholar]
- Chu, J.; Peng, X.; Feng, P.; Sheng, Y.; Zhang, J. Study of humidity sensors based on nanostructured carbon films produced by physical vapor deposition. Sens. Actuators B Chem. 2013, 178, 508–513. [Google Scholar] [CrossRef]
- Nanda, S.; Dalai, A.K.; Berruti, F.; Kozinski, J.A. Biochar as an exceptional bio resource for energy, agronomy, carbon sequestration, activated carbon and specialty materials. Waste Biomass Valorization 2015, 7, 201–235. [Google Scholar] [CrossRef]
- Hu, B.; Wang, K.; Wu, L.; Yu, S.-H.; Antonietti, M.; Titirici, M.-M. Engineering carbon materials from the hydrothermal carbonization process of biomass. Adv. Mater. 2010, 22, 813–828. [Google Scholar] [CrossRef] [PubMed]
- Chan, K.Y.; Van Zwieten, V.; Meszaros, I.; Downie, A.; Joseph, S. Agronomic values of green waste biochar as a soil amendment. Aust. J. Soil Res. 2007, 45, 629–634. [Google Scholar] [CrossRef]
- www.biochar.ac.uk. Available online: https://www.biochar.ac.uk/cms/i/user/standard_materials/21_SWP%20700-web.pdf (accessed on 26 October 2017).
- www.biochar.ac.uk. Available online: https://www.biochar.ac.uk/cms/i/user/standard_materials/19_OSR_700-web.pdf (accessed on 26 October 2017).
- Afify, A.S.; Ahmad, S.; Khushnood, R.A.; Jagdale, P.; Tulliani, J.-M. Elaboration and characterization of novel humidity sensor based on micro-carbonized bamboo particles. Sens. Actuators B Chem. 2017, 239, 1251–1256. [Google Scholar] [CrossRef]
- Azmer, M.I.; Zafar, Q.; Ahmad, Z.; Sulaiman, K. Humidity sensor based on electro spun MEH-PPV: PVP micro structured composite. RSC Adv. 2016, 6, 35387–35393. [Google Scholar] [CrossRef]
- De Queiroz, A.A.A.; Soares, D.A.W.; Trzesniak, P.; Abraham, G.A. Resistive-type humidity sensors based on PVP–Co and PVP–I2 complexes. J. Polym. Sci. Part B Polym. Phys. 2001, 39, 459–469. [Google Scholar] [CrossRef]
- www.vaisala.com. Available online: https://www.vaisala.com/sites/default/files/documents/Humidity_Conversion_Formulas_B210973EN-F.pdf (accessed on 22 November 2017).
- Ferrari, A.C. Raman spectroscopy of graphene and graphite: Disorder, electron-phonon coupling, doping and nonadiabatic effects. Solid State Commun. 2007, 143, 47–57. [Google Scholar] [CrossRef]
- Malard, L.M.; Pimenta, M.A.; Dresselhaus, G.; Dresselhaus, M.S. Raman spectroscopy in graphene. Phys. Rep. 2009, 473, 51–87. [Google Scholar] [CrossRef]
- Tripathy, A.; Pramanik, S.; Cho, J.; Santhosh, J.; Osman, N.A.A. Role of morphological structure, doping and coating of different materials in the sensing characteristics of humidity sensors. Sensors 2014, 14, 16343–16422. [Google Scholar] [CrossRef] [PubMed]
- Pati, R.; Zhang, Y.; Nayak, S.K.; Ajayan, P.M. Effect of H2O adsorption on electron transport in a carbon nanotube. Appl. Phys. Lett. 2002, 81, 2638–2640. [Google Scholar] [CrossRef]
- Traversa, E. Ceramic sensors for humidity detection. Sens. Actuators B Chem. 1995, 23, 135–156. [Google Scholar] [CrossRef]
- Paul, R.; Das, S.N.; Dalui, S.; Gayen, R.N.; Roy, R.K.; Bhar, R.; Pal, A.K. Synthesis of DLC films with different sp2/sp3 ratios and their hydrophobic behaviour. J. Phys. D: Appl. Phys. 2008, 41, 055309. [Google Scholar] [CrossRef]
- Jia, Y.; Yu, H.; Cai, J.; Li, Z.; Dong, F. Explore on the quantitative analysis of specific surface area on sensitivity of polyacrylic acid-based QCM ammonia sensor. Sens. Actuators B Chem 2017, 243, 1042–1045. [Google Scholar] [CrossRef]
- Li, Y.; Hong, L.; Chen, Y.; Wang, H.; Lu, X.; Yang, M. Poly(4-vinylpyridine)/carbon black composite as a humidity sensor. Sens. Actuators B Chem. 2007, 123, 554–559. [Google Scholar] [CrossRef]
- Zhang, J.; Shen, G.; Wang, W.; Zhou, X.; Guo, S.J. Individual nanocomposite sheets of chemically reduced graphene oxide and poly (N-vinyl pyrrolidone): preparation and humidity sensing characteristics. Mater. Chem. 2010, 20, 10824–10828. [Google Scholar] [CrossRef]
- Fei, T.; Zhao, H.; Jiang, K.; Zhou, X.; Zhang, T.J. Polymeric humidity sensors with nonlinear response: properties and mechanism investigation. Appl. Polym. Sci. 2013, 130, 2056–2061. [Google Scholar] [CrossRef]
- Pan, X.; Xue, Q.; Zhang, J.; Guo, Q.; Jin, Y.; Lu, W.; Li, X.; Ling, C. Effective enhancement of humidity sensing characteristics of novel thermally treated MWCNTs/Polyvinylpyrrolidone film caused by interfacial effect. Adv. Mater. Interfaces 2016, 3, 1–7. [Google Scholar] [CrossRef]
- Kim, J.H.; Lee, J.H.; Mirzaei, A.; Kim, H.W.; Kim, S.S. Optimization and gas sensing mechanism of n-SnO2-p-Co3O4composite nanofibers. Sens. Actuators B Chem. 2017, 248, 500–511. [Google Scholar] [CrossRef]
- Su, P.-G.; Wang, C.-S. In situ synthesized composite thin films of MWCNTs/PMMA doped with KOH as a resistive humidity sensor. Sens. Actuators B Chem. 2007, 124, 303–308. [Google Scholar] [CrossRef]
- Taccola, S.; Greco, F.; Zucca, A.; Innocenti, C.; de Julián Fernández, C.; Campo, G.; Sangregorio, C.; Mazzolai, B.; Mattoli, V. Characterization of Free-Standing PEDOT:PSS/Iron Oxide Nanoparticle Composite Thin Films and Application As Conformable Humidity Sensors. ACS Appl. Mater. Interfaces 2013, 5, 6324–6332. [Google Scholar] [CrossRef] [PubMed]
- Lee, J.; Cho, D.; Jeong, Y. A resistive-type sensor based on flexible multi-walled carbon nanotubes and polyacrylic acid composite films. Solid-State Electron. 2013, 87, 80–84. [Google Scholar] [CrossRef]
- Cunha, B.B.; Greenshields, M.W.C.C.; Mamo, M.A.; Coville, N.J.; Hűmmelgen, I.A. A surfactant dispersed N-doped carbon sphere-poly (vinyl alcohol) composite as relative humidity sensor. J. Mater. Sci. Mater. Electron. 2015, 26, 4198–4201. [Google Scholar] [CrossRef]
- Shukla, S.K.; Shukla, S.K.; Govender, P.P.; Agorku, E.S. A resistive type humidity sensor based on crystalline tin oxide nanoparticles encapsulated in polyaniline matrix. Microchim. Acta 2016, 183, 573–580. [Google Scholar] [CrossRef]
Figure 1.
Image of a biochar sensor prepared by drop coating technique.

Figure 2.
Laser granulometry measurement results: (a) OSR700; (b) SWP 700.
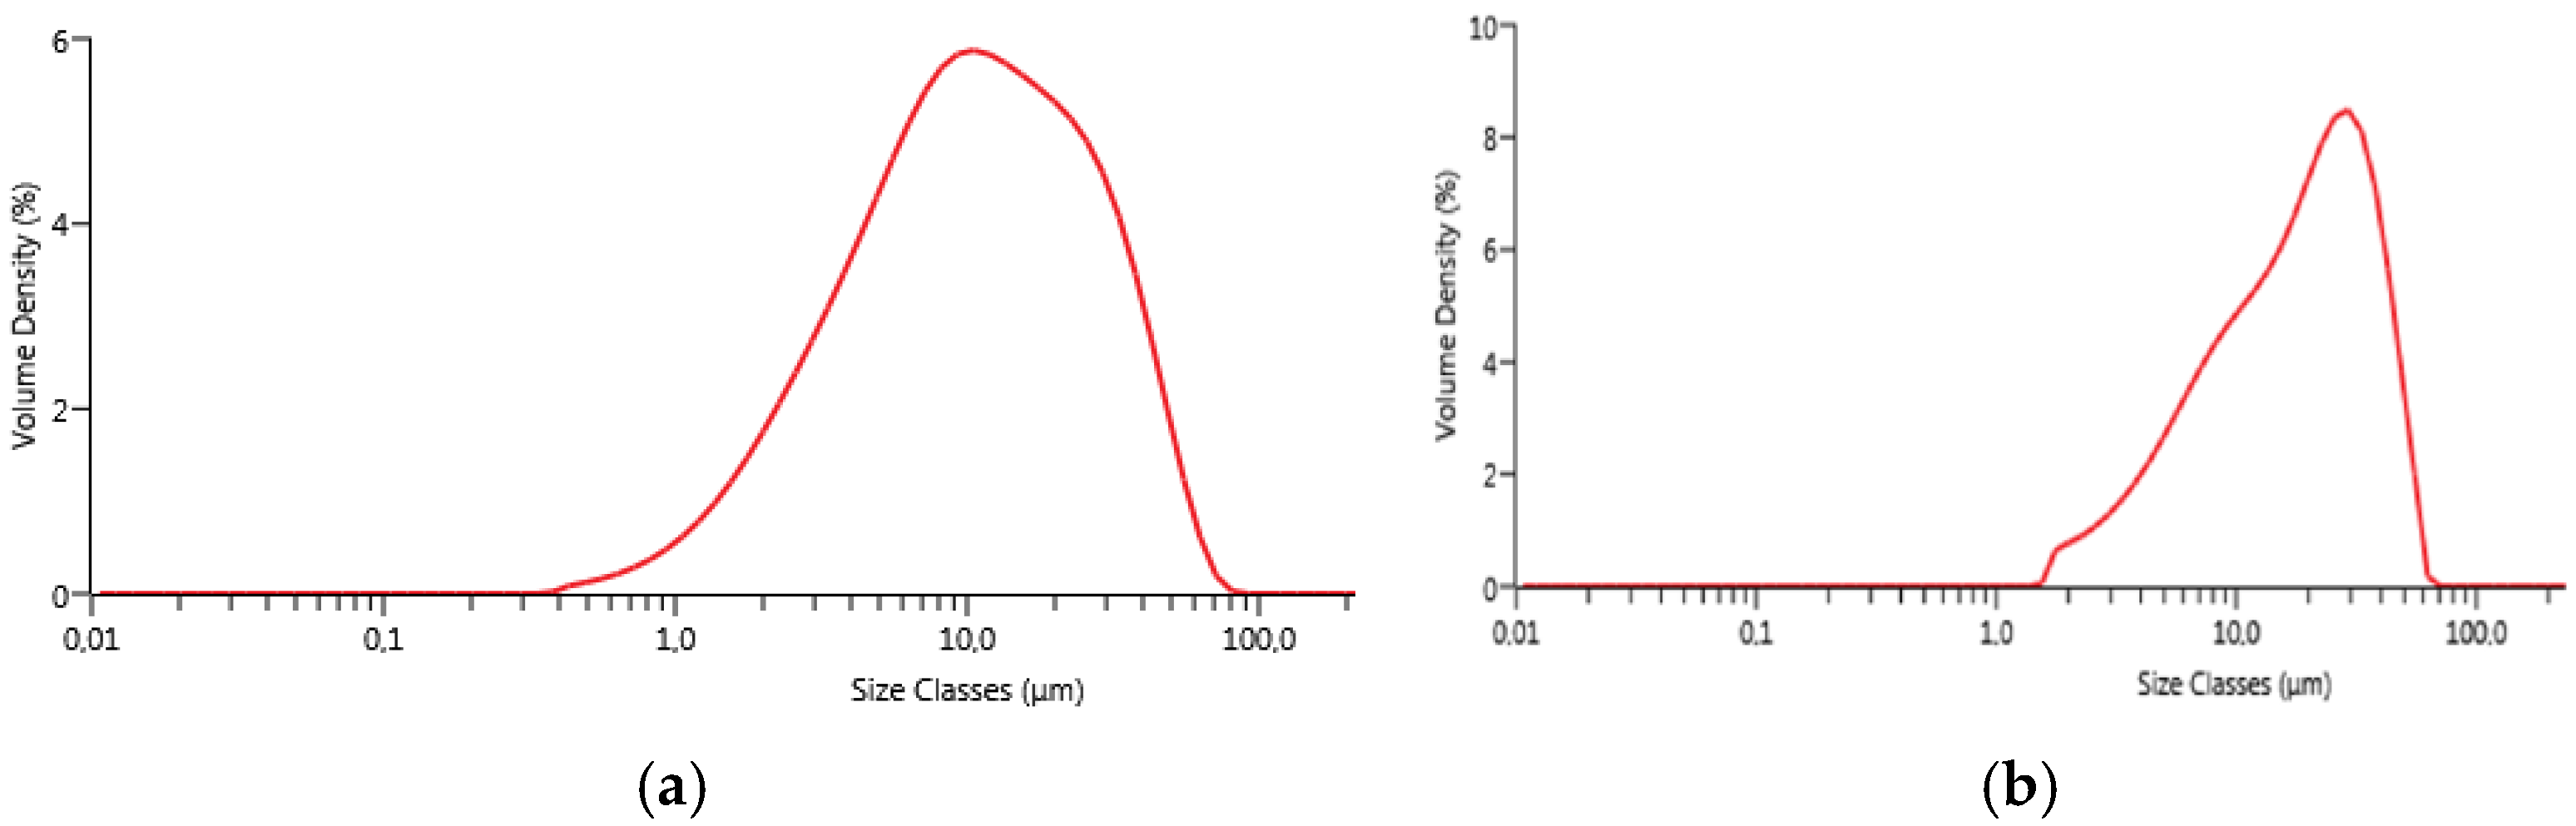
Figure 3.
X-Ray diffraction (XRD), patterns of OSR700 and SWP700 biochars.

Figure 4.
High resolution X-ray photoelectron spectroscopy (XPS) spectra of C1s peak for (a) OSR700; (b) SWP700.
Figure 4.
High resolution X-ray photoelectron spectroscopy (XPS) spectra of C1s peak for (a) OSR700; (b) SWP700.


Figure 5.
Raman spectra for (a) OSR700; (b) SWP700.
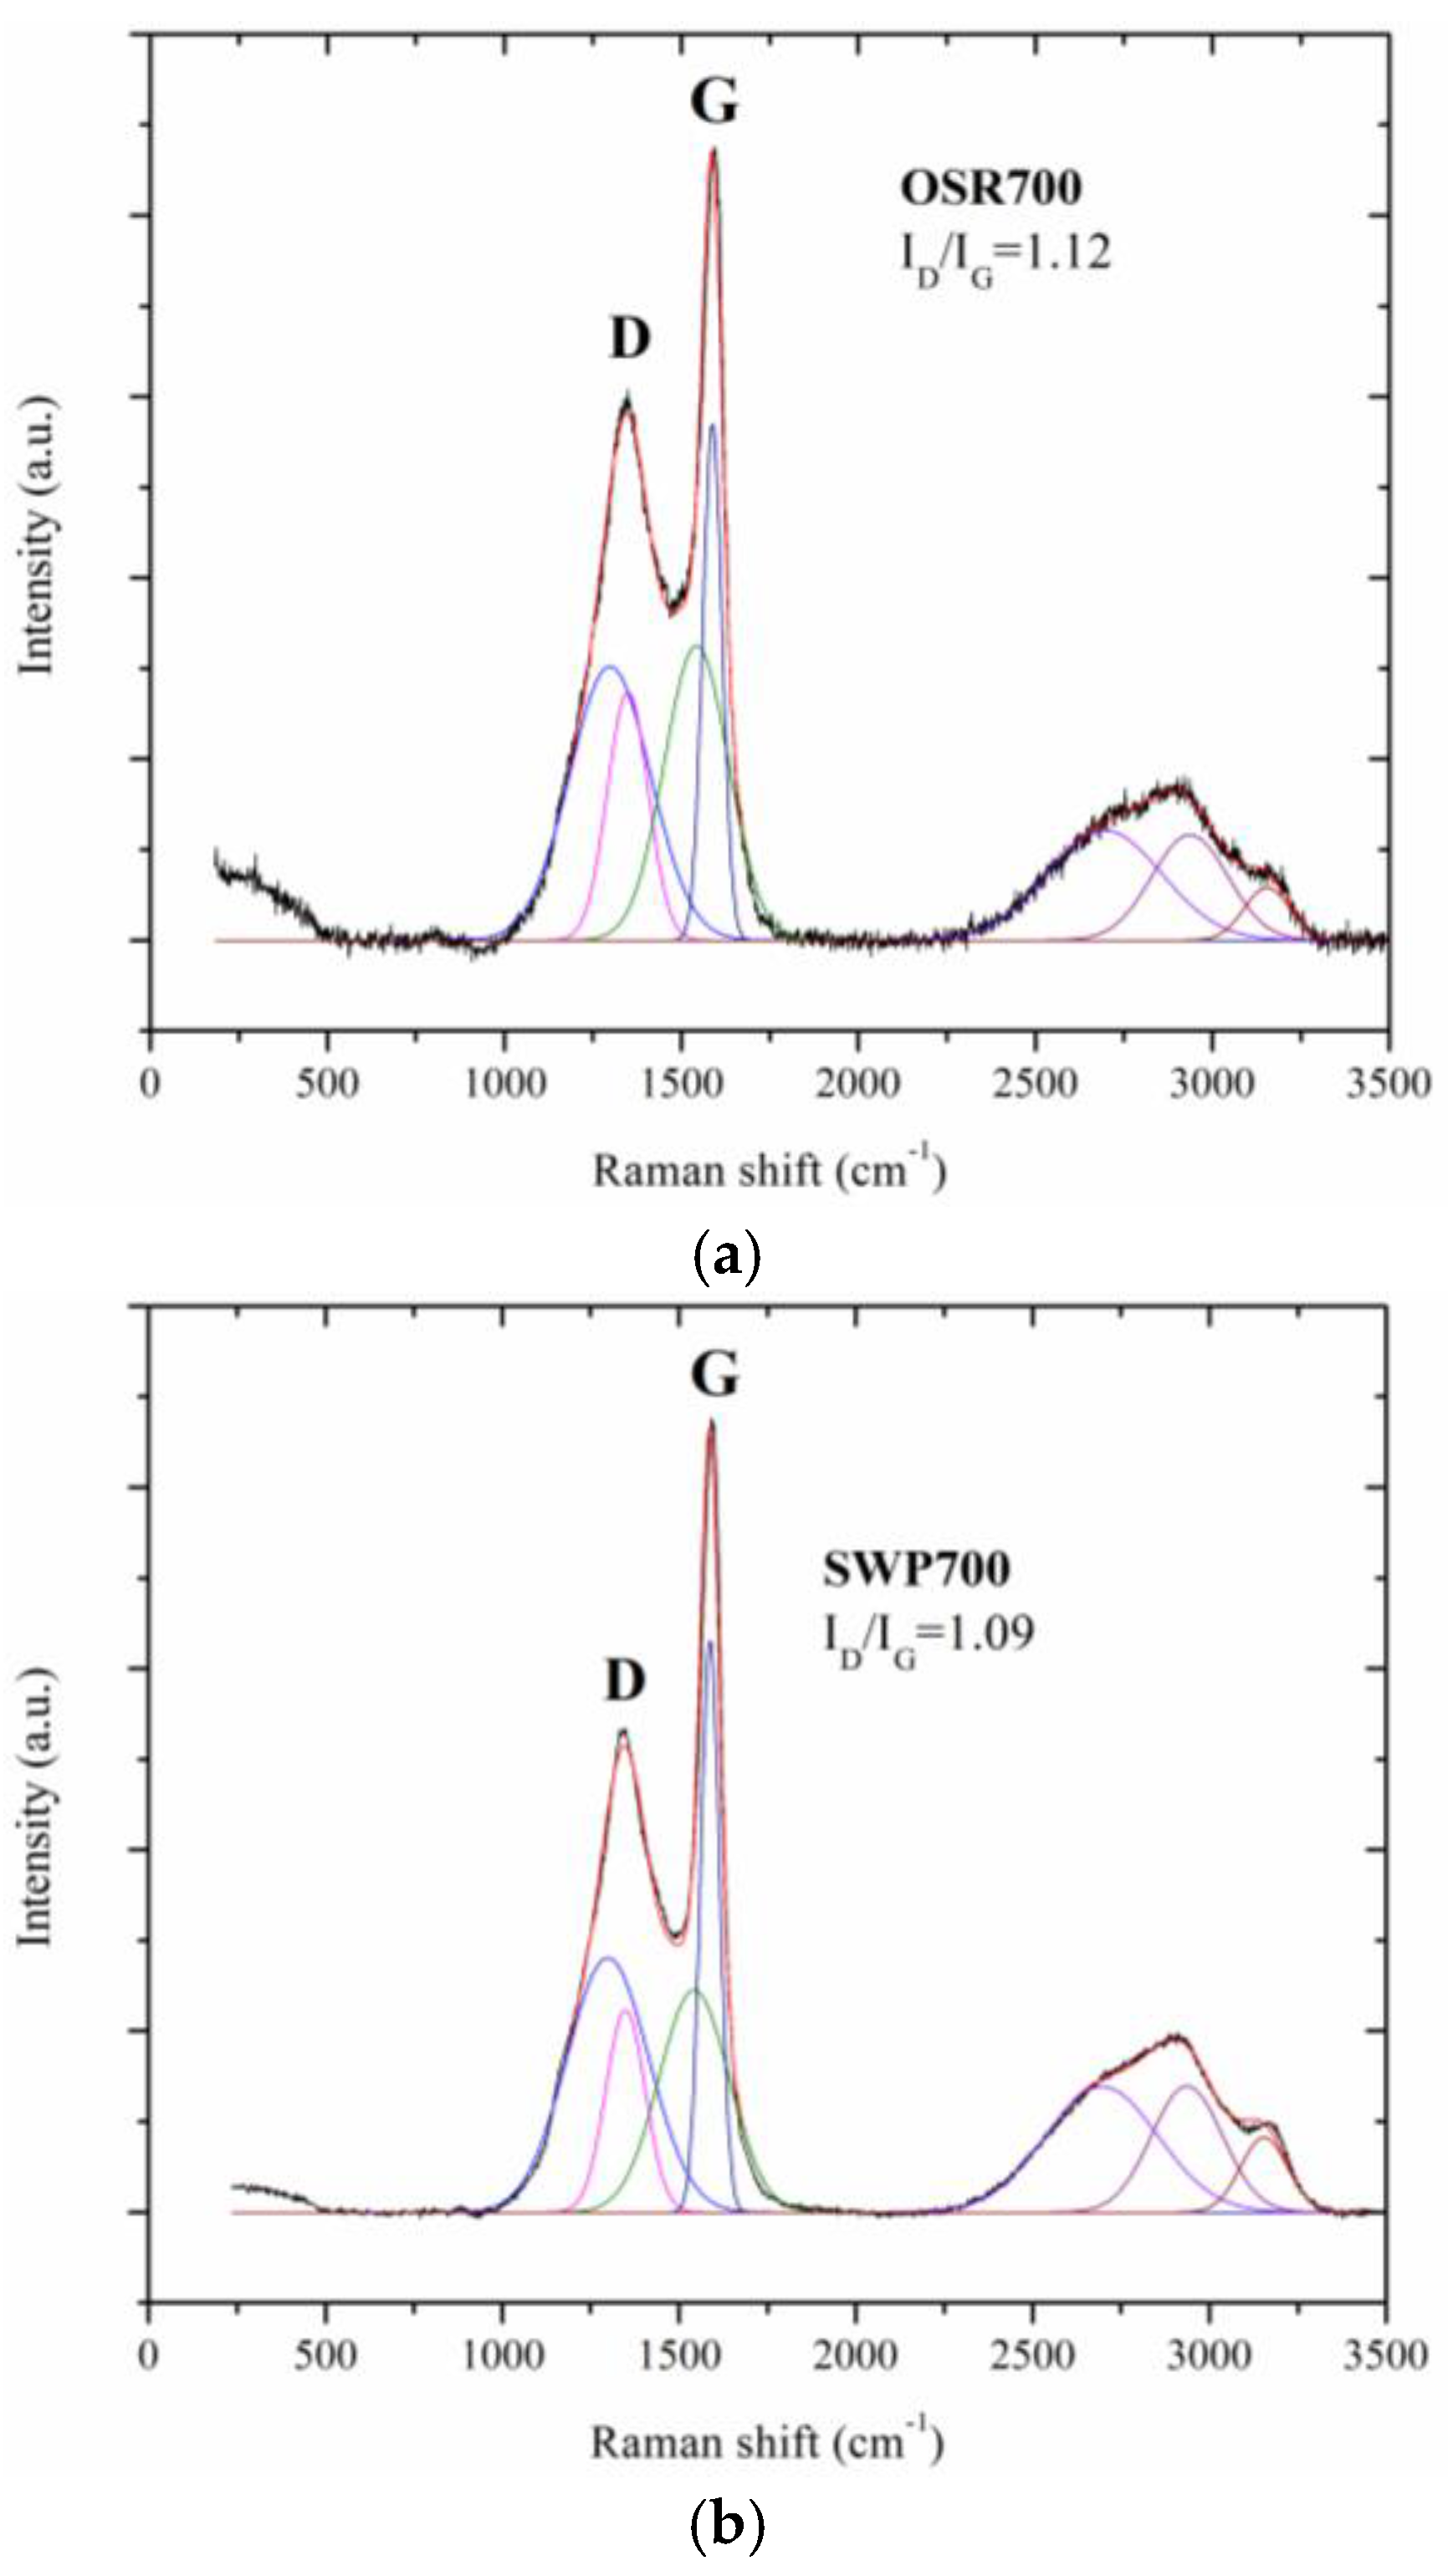
Figure 6.
Field Emission-Scanning Electron Microscopy (FESEM) micrographs of OSR700 biochar sensor at different magnifications: (a) 2500×; (b) 10,000×.
Figure 6.
Field Emission-Scanning Electron Microscopy (FESEM) micrographs of OSR700 biochar sensor at different magnifications: (a) 2500×; (b) 10,000×.

Figure 7.
FESEM micrographs of SWP700 biochar sensor at different magnifications: (a) 2500×; (b) 10,000×.
Figure 7.
FESEM micrographs of SWP700 biochar sensor at different magnifications: (a) 2500×; (b) 10,000×.

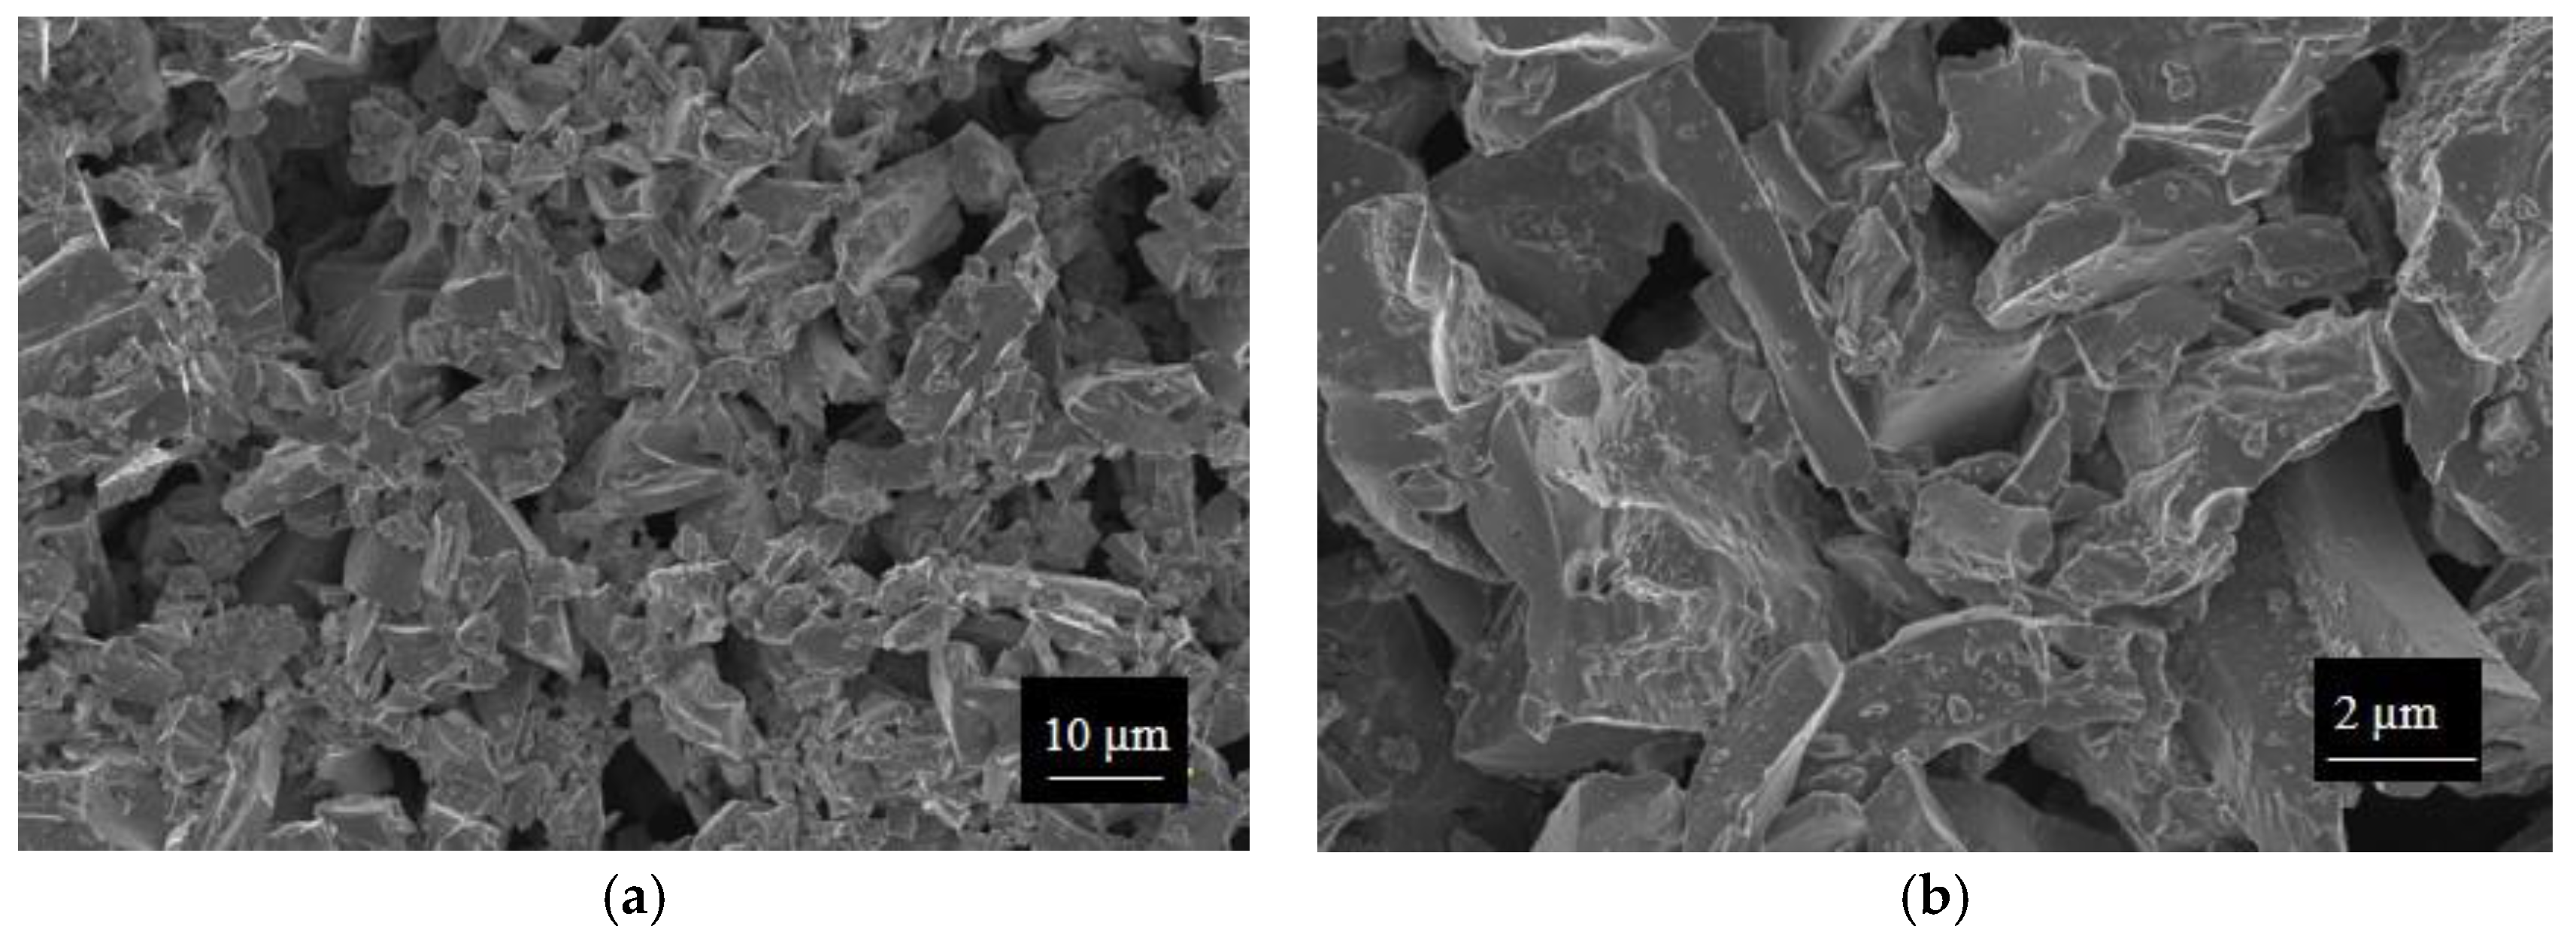
Figure 8.
FESEM micrographs of SWP700-PVP10% sensor at different magnifications: (a) 2500×; (b) 10,000×.
Figure 8.
FESEM micrographs of SWP700-PVP10% sensor at different magnifications: (a) 2500×; (b) 10,000×.

Figure 9.
FESEM micrographs of SWP700-PVP20% sensor at different magnifications: (a) 2500×; (b) 10,000×.
Figure 9.
FESEM micrographs of SWP700-PVP20% sensor at different magnifications: (a) 2500×; (b) 10,000×.
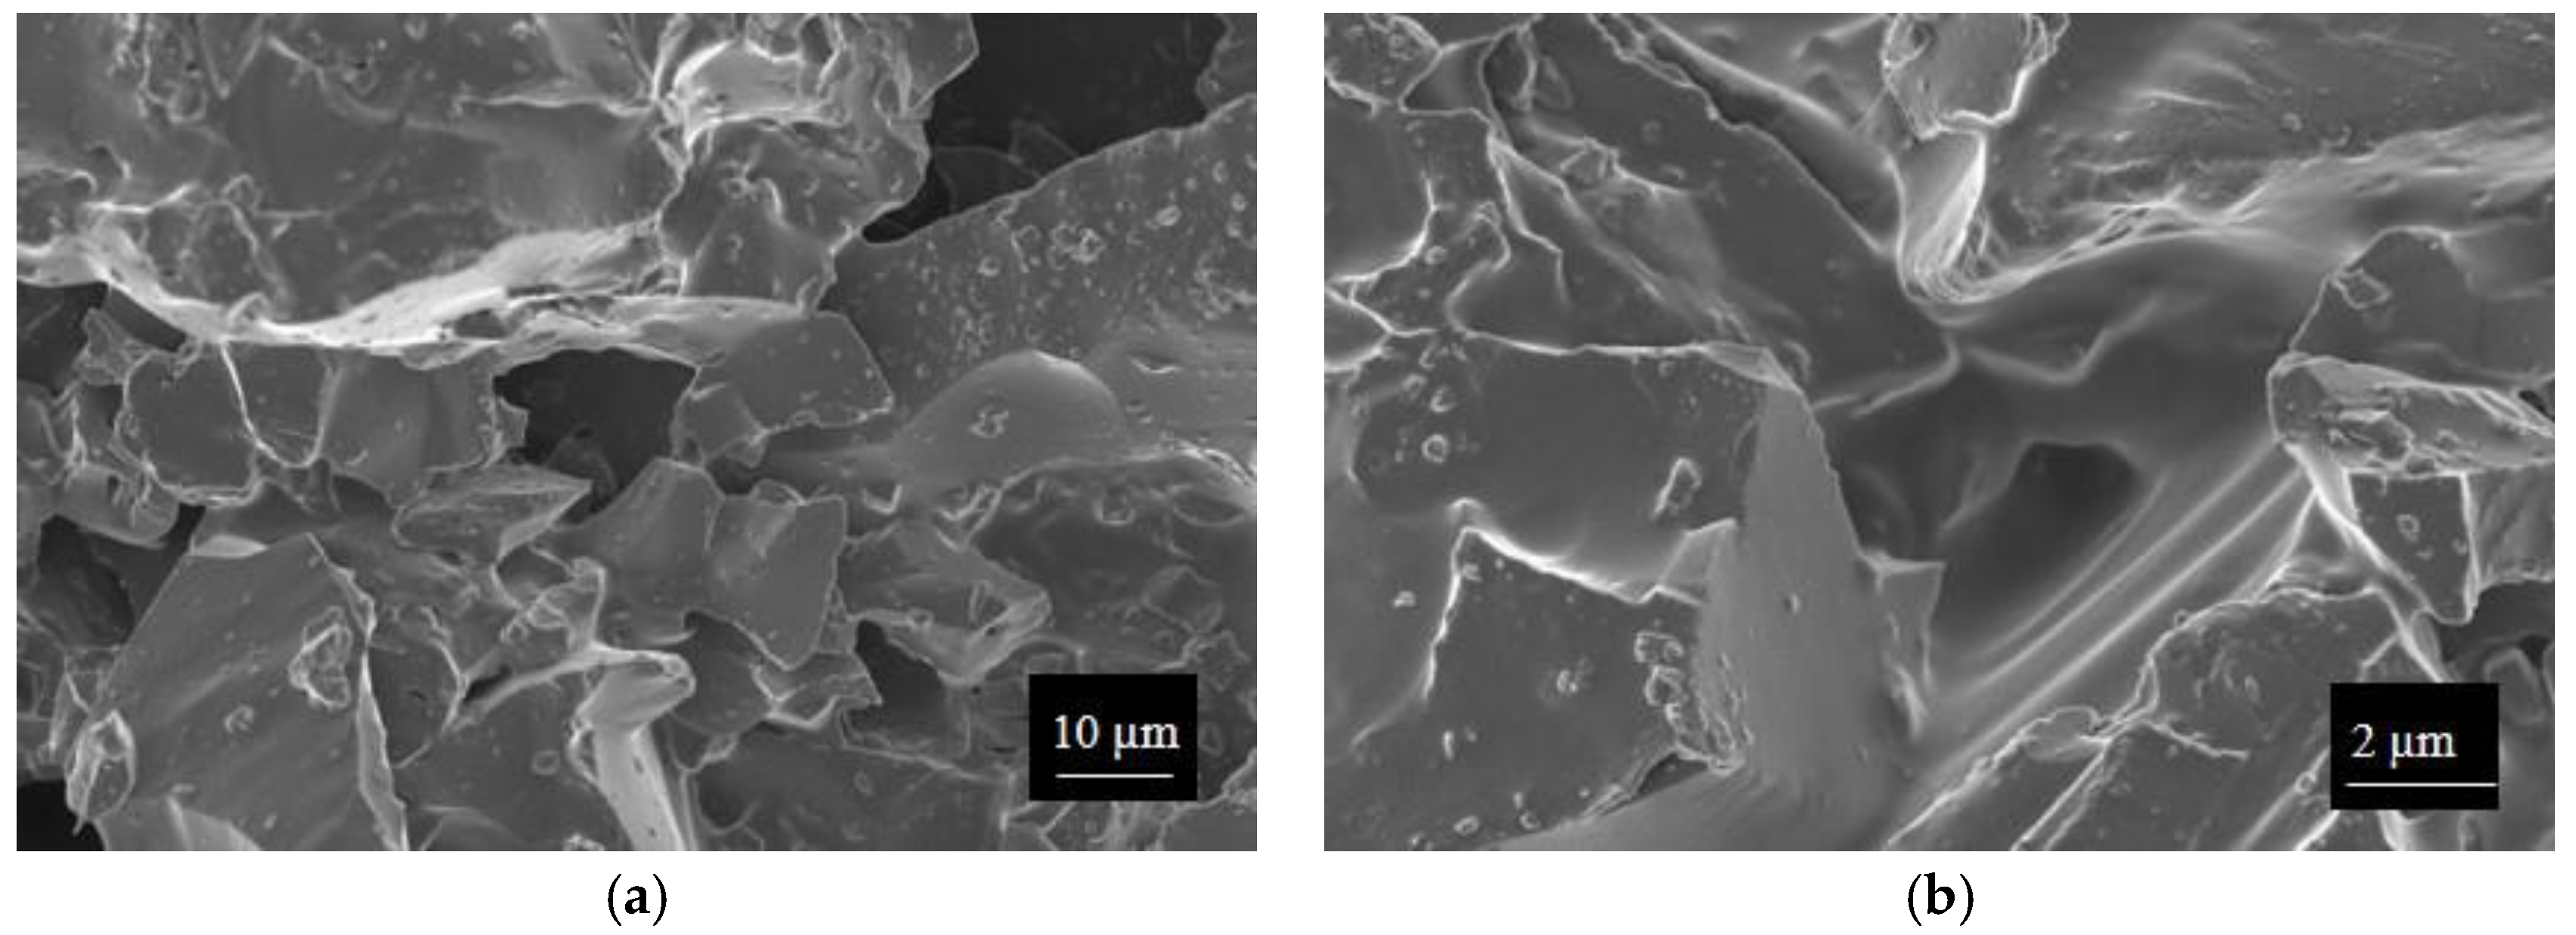
Figure 10.
Sensor response towards relative humidity of (a) OSR700; (b) SWP700 biochars.

Figure 11.
Polyvinylpyrrolidone (PVP) sensor response toward relative humidity.

Figure 12.
Sensor response toward relative humidity for SWP700 biochar with (a) 10%; (b) 20% of PVP acting as polymeric binder.
Figure 12.
Sensor response toward relative humidity for SWP700 biochar with (a) 10%; (b) 20% of PVP acting as polymeric binder.


Table 1.
Physical properties of OSR700 and SWP 700 biochars.
| Biochar | Specific Surface Area (m2/g) | Conductivity (S/m) |
|---|---|---|
| OSR700 | 25.2 | 0.311 |
| SWP700 | 162.3 | 0.016 |
Table 2.
Cumulative particle size distribution at 10% (D10), 50% (D50), and 90% (D90) for OSR700 and SWP 700 biochars.
Table 2.
Cumulative particle size distribution at 10% (D10), 50% (D50), and 90% (D90) for OSR700 and SWP 700 biochars.
| Biochar | D10 (µm) | D50 (µm) | D90 (µm) |
|---|---|---|---|
| OSR700 | 2.61 | 10.5 | 33.4 |
| SWP700 | 4.98 | 18.3 | 39.8 |
Table 3.
Weight% resulted from XPS characterization.
| Weight% | OSR700 | SWP700 |
|---|---|---|
| C1s | 55.8 | 72.1 |
| C sp2 | 29.11 | 5.35 |
| C sp3 | 63.68 | 87.13 |
| C=O | 6.21 | 6.96 |
| O1s | 23.3 | 16.1 |
| K2s | 15.2 | 10.3 |
| Ca2p | 3.2 | 1.2 |
| Si2p | 1.9 | - |
| Cl2p | traces | - |
| N1s | traces | traces |
(NB: all the elements were quantified from a survey, while C sp2, C sp3, and C=O content were determined from deconvolution of C 1s peaks in Figure 4).
Table 4.
Maximum SR% of PVP, OSR700, SWP700, SWP-10% PVP, and SWP-20% PVP sensors toward relative humidity at 26 °C.
Table 4.
Maximum SR% of PVP, OSR700, SWP700, SWP-10% PVP, and SWP-20% PVP sensors toward relative humidity at 26 °C.
| Sensor | SR% |
|---|---|
| PVP | 98 |
| OSR700 | 94.5 |
| SWP700 | 97.7 |
| SWP700-10% PVP | 65.2 |
| SWP700-20% PVP | 47.3 |
Table 5.
Impedance values of SWP700-10% PVP sensor at different temperature under dry air.
| Temperature (°C) | Z0 (kΩ) |
|---|---|
| 25 | 963 |
| 40 | 764 |
| 50 | 674 |
| 60 | 575 |
Table 6.
Impedance values of SWP700-10% PVP sensor toward ozone 0.5 ppm, ammonia 50 ppm, methane 100 ppm, and carbon dioxide 500 ppm.
Table 6.
Impedance values of SWP700-10% PVP sensor toward ozone 0.5 ppm, ammonia 50 ppm, methane 100 ppm, and carbon dioxide 500 ppm.
| Gas | Z0 (kΩ) | Zg (kΩ) |
|---|---|---|
| O3 0.5 ppm | 954 | 954 |
| NH3 50 ppm | 956 | 981 |
| CH4 100 ppm | 958 | 959 |
| CO2 500 ppm | 958 | 959 |
| CO2 600 ppm | 958 | 959 |
| RH40% | 959 | 1130 |
| CO2 600 ppm + air RH40% | 958 | 1120 |
Table 7.
Response toward humidity of carbon-based and of composite polymer-based resistive sensors at room temperature.
Table 7.
Response toward humidity of carbon-based and of composite polymer-based resistive sensors at room temperature.
| Sensing Material and Preparation Technique | Sensor Response | Reference |
|---|---|---|
| Carbon thin-film made by spray pyrolysis technique | Rg/R0 ≈ 0.95 under 2 RH% | [16] |
| Pyrolyzed medium density fiberboard impregnated with phenolic resin | Resistance linearly changed in the 10–70 RH% range | [17] |
| High frequency PVD carbon thin-films | Rg/R0 ≈ 1.08 from 11 RH% | [20] |
| Pyrolized bamboo screen-printed thick-films | Rg/R0 = 0.98 under 10 RH% | [26] |
| Spin-coated thin-films of MWCNTs/PMMA doped with KOH | The log-impedance curve linearly changed in the 30-90 RH% range from 104 to 107 Ω | [42] |
| Spin-coated PEDOT: PSS/iron oxide nanoparticle composite thin-films | Resistance linearly changed in the 30–70 RH% range | [43] |
| Drop casting of MWCNTS/PAA composite films | Almost linear resistance change in the range 30–90 RH% | [44] |
| Drop casting of N-doped carbon sphere-poly (vinyl alcohol) composites | Conductance (G) determined from 9 RH%. S = = 17 | [45] |
| Pellet of tin oxide nanoparticles encapsulated in polyaniline matrix | Rg/R0 = 0.98 under 10 RH% | [46] |
| Drop-coating biochar/PVP | Rg/R0 1.02 = under 10 RH% | This work |
(NB: PVD = physical vapor deposition; MWCNTs = multi-walled carbon nano-tubes; PMMA = poly(methylmetacrylate); PEDOT = poly(3,4-ethylenedioxythiophene); PSS = polystyrene sulfonate; PAA = poly (acrylic acid); RGO = reduced graphene oxide).
© 2017 by the authors. Licensee MDPI, Basel, Switzerland. This article is an open access article distributed under the terms and conditions of the Creative Commons Attribution (CC BY) license (http://creativecommons.org/licenses/by/4.0/).
Share and Cite
MDPI and ACS Style
Ziegler, D.; Palmero, P.; Giorcelli, M.; Tagliaferro, A.; Tulliani, J.-M. Biochars as Innovative Humidity Sensing Materials. Chemosensors 2017, 5, 35. https://doi.org/10.3390/chemosensors5040035
AMA Style
Ziegler D, Palmero P, Giorcelli M, Tagliaferro A, Tulliani J-M. Biochars as Innovative Humidity Sensing Materials. Chemosensors. 2017; 5(4):35. https://doi.org/10.3390/chemosensors5040035
Chicago/Turabian StyleZiegler, Daniele, Paola Palmero, Mauro Giorcelli, Alberto Tagliaferro, and Jean-Marc Tulliani. 2017. "Biochars as Innovative Humidity Sensing Materials" Chemosensors 5, no. 4: 35. https://doi.org/10.3390/chemosensors5040035
Note that from the first issue of 2016, this journal uses article numbers instead of page numbers. See further details here.