Dissection of Protein Kinase Pathways in Live Cells Using Photoluminescent Probes: Surveillance or Interrogation?


1
Competence Centre on Health Technologies, Tiigi 61B, 50410 Tartu, Estonia
2
Institute of Chemistry, University of Tartu, Ravila 14A, 50411 Tartu, Estonia
*
Author to whom correspondence should be addressed.
Chemosensors 2018, 6(2), 19; https://doi.org/10.3390/chemosensors6020019
Submission received: 31 March 2018
/
Revised: 22 April 2018
/
Accepted: 23 April 2018
/
Published: 25 April 2018
(This article belongs to the Special Issue Fluorescent Probes for Live Cell Imaging)
Abstract
:Protein kinases catalyze phosphorylation, a small yet crucial modification that affects participation of the substrate proteins in the intracellular signaling pathways. The activity of 538 protein kinases encoded in human genome relies upon spatiotemporally controlled mechanisms, ensuring correct progression of virtually all physiological processes on the cellular level—from cell division to cell death. The aberrant functioning of protein kinases is linked to a wide spectrum of major health issues including cancer, cardiovascular diseases, neurodegenerative diseases, inflammatory diseases, etc. Hence, significant effort of scientific community has been dedicated to the dissection of protein kinase pathways in their natural milieu. The combination of recent advances in the field of light microscopy, the wide variety of genetically encoded or synthetic photoluminescent scaffolds, and the techniques for intracellular delivery of cargoes has enabled design of a plethora of probes that can report activation of target protein kinases in human live cells. The question remains: how much do we bias intracellular signaling of protein kinases by monitoring it? This review seeks answers to this question by analyzing different classes of probes according to their general structure, mechanism of recognition of biological target, and optical properties necessary for the reporting of intracellular events.
Keywords:
protein kinase; phosphorylation; photoluminescence; fluorescence; FRET; probe; sensor; reporter1. Introduction
1.1. Brief Insight into Structure and Function of Protein Kinases
Phosphorylation is an evolutionarily conserved mechanism for regulation of a vast variety of signaling pathways. The transfer of γ-phosphoryl group from a nucleotide (usually ATP) to a Ser, Thr and/or Tyr residue in a protein substrate alters conformation of the latter and hence affects the ability of phosphorylated protein to recognize and get recognized by its endogenous binding partners.
Protein kinases (PKs) catalyze phosphorylation by enhancing the rate of reaction by 9–11 orders of magnitude [1]. To catalyze phosphorylation reaction, a PK binds the phosphoryl donor and the phosphoryl acceptor, and then performs transfer of the phosphoryl group. The ATP-binding sites of PKs incorporate an ensemble of the residues that are generally conserved in the PK family and are utmost important for catalysis [2]. For instance, by introducing point-mutation at a crucial lysine residue (Lys72 in PKAc), it is possible to generate kinase-dead mutants of PKs [3], correctly fold yet devoid of catalytic activity. However, because ATP is used as the general abundant phosphoryl donor, no selectivity is required on the level of ATP recognition by the PK (in fact, to ensure dissociation of ADP formed after the phosphoryl transfer, the aromatic ring and the ribose moiety of ATP should not be bound to the PK too strongly). Accordingly, other residues of the ATP-binding site are less conserved, which enables design of selective ATP-site targeting inhibitors.
The mechanism of recognition of the phosphoryl acceptor, however, determines the level of selectivity of the whole PK-containing pathway; PKs recognize their substrates according to the specific amino acid signature (so-called consensus sequence) in the structure of the substrate that forms a spatial pattern of characteristic interactions with the PK. The residues constituting the consensus sequence of the substrate flank the phosphorylatable residue; however, in some cases, a recognition motif of substrate might lie tens of Ångström from the phosphorylatable residue, and bind to a distant pocket formed as a result of interaction of PK with its regulatory protein (Figure 1) [4].
In organisms, to restore the initial state of the system after phosphorylation event, hydrolytic removal of phosphoryl group is performed by protein phosphatases. In humans, there are 538 protein kinases and 137 protein phosphatases [5,6]. In the “resting” state of the cell, most PKs stay inactive until an activating molecule—e.g., a secondary messenger, or a cyclin—becomes available and triggers activation of the pathway. Activation occurs via change of conformation of the PK molecule, e.g., by alleviating the intramolecular blockage of catalytic site by a fragment of PK or by a regulatory protein. In addition, catalytic activity of several PKs is enhanced by autophosphorylation—a process where the PK performs phosphorylation of a fragment (usually, so-called activation loop) included in the structure of the same PK. Autophosphorylation can be performed either by the same molecule where the phosphorylatable fragment resides (cis-phosphorylation [7]), or by the neighboring molecule of the same type of PK (trans-phosphorylation [8]). Autophosphorylation of the activation loop reorders the positioning of the catalytically important residues within the PK core and enables access of substrate proteins to the substrate-binding site. Autophosphorylation can be triggered by increased concentration of a PK in a certain cellular location, or by binding of the aforementioned activating molecule. Furthermore, PKs frequently work in cascades where the upstream PK triggers phosphorylation and activation or inactivation of the downstream PK.
Different PKs reside in different locations in cells, whereas location may also depend on the activation state of a PK. There are receptor PKs (such as growth-factor receptors) and receptor-bound PKs (such as Src family PKs) that reside at the plasma membrane (the catalytic core of PK resides inside the cell, but a portion of a receptor PK molecule protrudes to the extracellular space); those provide information considering extracellular event to the intracellular machinery and function as scaffolding proteins. There are PKs (such as Akt/PKB, or conventional/novel PKC isoforms) that are activated in the proximity of plasma membrane by binding to the lipid secondary messengers, and once activated, can perform their catalytic tasks in cytosol. There are PKs that shuttle between cytosol and nucleus (such as catalytic subunit of cAMP-dependent PK, PKAc), where those can phosphorylate transcription factors and hence alter pattern of gene expression. PKs that share high sequence similarity can be confined to different intracellular compartments by their interaction partners: for example, while Aurora A resides at the centrosome and spindle microtubules by virtue of interaction with proteins Ajuba and TPX2 [9], Aurora B is enriched at the centromeric region of chromosomes by forming complex with proteins INCENP, Survivin, and Borealin [10]. Even PKs that reside in cytosol are frequently targeted to a certain cellular location by a scaffolding protein; for example, Ca2+-activated PKs are located in the vicinity of Ca2+-channels on the plasma membrane or endoplasmic reticulum, while cAMP-dependent PKs are located in the vicinity of adenylyl cyclase [11,12,13]. The same scaffolding protein that is responsible for localization of a PK might also offer binding sites for its substrates, but also protein phosphatases and enzymes that degrade secondary messengers (e.g., phosphodiesterases). Such compartmentalization of PK signaling ensures both rapid propagation of signal as well as quick restoration of the native state of the cell.
The localized pools of PKs complicate assessment of intracellular concentrations of these enzymes, as strong local gradients are formed. For the first approximation of approximate range of intracellular concentrations of PKs, data reported for platelets can be considered: platelets are known as biological system enriched in PKs, and intracellular concentrations in the range of 3–7 μM have been reported for cGMP- and cAMP-dependent PKs in unstimulated platelets [14]. Furthermore, spatial control of PK signaling is combined with temporal control, which is achieved by the temporal availability of activating factors (as in the case of cyclin-dependent PKs) as well as presence of negative and positive feedback loops formed between upstream and downstream signaling events. The dynamic nature of intracellular processes complicates the whole picture to the extent far beyond the arrow-based schemes in textbooks; therefore, dissection of phosphorylation pathways requires novel tools capable of reporting different levels of PK signaling with high spatiotemporal resolution.
The intertwined network of PK signaling pathways largely defines the well-being of the cell. It is thus not surprising that errors in this network can manifest itself on the level of organism. The abnormally elevated activity (often driven by mutations, as in the case of Bcr-Abl [15]) or abnormally elevated levels of PKs (such as growth factor receptor PKs, Aurora family PKs, Pim family PKs, etc.) have been linked to a variety of major diseases, especially cancer [16,17]. PKs can contribute to the onset of cancer (e.g., by inducing genomic instability), or sustain its progression (e.g., by participating in angiogenesis or cell migration). Recent studies have shown that if otherwise intracellular PKs are present in bodily fluids (either in dissolved form or encapsulated into extracellular vesicles), they can serve as cancer biomarkers, applicable for diagnosis and prognosis of disease as well as monitoring of patients [18,19,20,21,22,23]. Furthermore, by virtue of incorporation of the deep narrow ATP-binding site, PKs are classified as druggable biological targets—in fact, aside from G-protein coupled receptors, PKs have been reported as the major targets of upcoming therapeutics [24].
Since the success story of Bcr-Abl-targeting Gleevec (imatinib) being accepted for treatment of Philadelphia chromosome-positive leukemia in 2001, 37 inhibitors of PKs have emerged as FDA-approved drugs, and more than 250 are in clinical trials [25]. However, the high costs and risks associated with clinical studies necessitate more effective preclinical research. Currently, studies in live cells represent the primary approximation of compromise between the required level of complexity of the screening system, the cost-effectiveness of experiments, and the ethical aspects of scientific research. Thus, development of probes applicable for monitoring of PK activity in live cells not only provides valuable information on these targets, but also enables early evaluation of the PK-targeting compounds.
Before we proceed to close inspection of different classes of these probes, let us briefly review some mechanisms underlying the ability of probe to report cellular events, and some technical aspects of the probe signal detection.
1.2. Brief Overview of Photo- and Bioluminescence Phenomena and Applications
Historically, light detection has been one of the least invasive methods for exploration of biological specimen. The conversion of natural luminescent proteins into a palette of genetically encodable tags [26], the emergence of bright organic fluorophores and nanostructures featuring long-lifetime photoluminescence, the insight into molecular mechanism of photoswitching molecules [27] and the fine-tuning of microscopic techniques [28] have triggered vast progress in the field of application of photo- and bioluminescence in recent decades. Here, we provide some definitions necessary for understanding of terms used further in the manuscript.
1.2.1. Physical Background and Definitions
Upon excitation of a molecule with UV or Vis light, an electron residing on a higher energy level in the molecule (ground singlet state, S0) can get excited to even higher orbital (excited singlet state, S1)—if the energy of the light photon is sufficient for the electron to bridge the gap between the ground and the excited states. Singlet state refers to the system where all electrons are paired, i.e., the number of electrons with upward spin is equal to the number of electrons with downward spin. The return of the electron to the ground state is in most cases non-radiative (i.e., the energy is released as heat), but it can also be accompanied with emission of photon. The latter phenomenon is termed photoluminescence. In the case electrons are excited by other means than UV-light, different kinds of luminescence can be distinguished. For example, chemiluminescence requires excitation of electrons during the preceding chemical reaction. Bioluminescence is a sub-category of chemiluminescence where the light is generated in an enzyme-catalyzed reaction.
For isolated atoms in gas phase, energies of S0 and S1 are strictly fixed. For a molecule where atoms are joined by chemical bonds, the length of bonds and the angles between those can slightly vary dependent on the temperature of the environment, giving rise to the so-called molecular vibrations. Consequently, both ground and excited singlet states of the molecule are sub-divided into vibrational levels. Excitation of an electron in the molecule usually brings the former to the highest vibrational level of S1; then, it will undergo series of non-radiative transitions to the bottom vibrational level of S1, from where it can return to S0 with emission of photon. Thus, the emitted photon will usually have lower energy (and thus lower frequency and higher wavelength) than the photon used for excitation; this phenomenon is called Stokes shift. The range of light wavelengths ensuring most efficient excitation, and the range of emitted light wavelengths depend on the chemical structure of the photoluminescent molecule. The molar absorptivity at the certain wavelength (ελ, also called molar extinction coefficient) is also characteristic of the given compound at given conditions.
Apart from the “direct” radiative return of the electron from S1 to S0, the return can also proceed via occupation of an intermediate energy level (triplet state, T1) for which the flip of electron spin might be required (so-called intersystem crossing). Triplet state refers to the system where two electrons are unpaired i.e., the number of electrons with the certain type of spin is by 2 electrons bigger than the number of electrons with the opposite spin. The “mode” of electron return determines the average time spent by the molecule in its excited state; the average time spent in the excited state by the set of chemically identical molecules is called photoluminescence lifetime. Based on lifetime duration, photoluminescence is subcategorized into fluorescence (emission occurs within nanoseconds) and phosphorescence (emission occurs within micro- to milliseconds). Accordingly, the molecules that emit light upon photoexcitation (luminophores) are categorized into fluorophores and phosphors. The exact lifetime value is an inherent property associated with the chemical structure of the fluorophore/phosphor. On the other hand, some luminophores cannot be classified as being exclusively fluorophores or phosphors.
In general, fluorescence is more abundant in nature than phosphorescence, and here we focus more closely onto inspection of fluorophores.
1.2.2. Main Classes of Fluorophores
To possess fluorescent properties, the structure of the molecule should contain a cloud of delocalized, easily excitable electrons—which can be achieved via incorporation of either an aromatic or a d-orbital-rich system.
The main types of fluorophores applied in biological studies are as follows:
- fluorescent protein tags (FPs);
- organic dyes; and
- fluorescent nanoparticles (NPs).
Wild-type fluorescent proteins have initially been discovered in several marine species, including jellyfish, sea pansy, anemones, and corals. By virtue of pioneering works by Osamu Shimomura, Martin Chalfie and Roger Y. Tsien (reviewed in [29]), these proteins have been isolated, characterized and converted into series of mutants with improved ex vivo folding characteristics, spectral properties and photostability. Probably the best-known fluorescent protein tag is enhanced green fluorescent protein (EGFP), a 27 kDa protein derived from the wild-type protein of Aequorea victoria. It features a β-barrel structure containing 11 β-strands and six α-helices (Figure 2); while five shorter helices cap the ends of the barrel, one helix runs through the barrel and contains tripeptide Ser65-Tyr66-Gly67 [30,31,32]. Aided by molecular oxygen and side-chains of amino acid residues forming β-barrel, this tripeptide undergoes cyclization that yields chromophore—the fragment responsible for fluorescent properties of EGFP. This process is called chromophore maturation, which at room temperature occurs on the scale of tens of minutes [33,34,35,36].
A palette of blue-shifted versions (e.g., ECFP and Cerulean) and yellow-shifted versions (e.g., YFP, Citrine, and Venus) of EGFP exists. These proteins were designed by incorporating point-mutations in the chromophore as well as β-strands of EGFP. On the other hand, fluorescent proteins with red-shifted spectra (such as dsRed and mCherry) feature similar architecture, yet are derived from the wild-type proteins of Anthozoa class of marine invertebrates [38], having thus evolved via evolutionarily distinct pathways. Furthermore, non-fluorescent mutants of FPs exist [39], which may have photo-protective role in marine organisms; non-fluorescent FPs absorb light, yet their emission is minimal.
While application of FPs as genetically encoded tags has vastly increased possibilities for monitoring of intracellular localization, trafficking, and interactions of tagged proteins in cells, it has several drawbacks. First, attachment of a 27-kDa FP to the protein of interest can seriously interfere with the biological activity of the latter and affect its interactions with proteins residing upstream or downstream in the signaling pathway, as well as scaffolding proteins. To some extent, this issue might be overcome by design of different constructs where position of FP relative to the N- and C-terminus of the protein of interest is changed, or the composition of linking unit between the FP and the protein of interest is altered. Furthermore, several FPs are prone to formation of oligomers. A considerable amount of effort has been spent on generation of FP mutants that have reduced tendency to aggregate (so-called monomeric versions of FPs, designated with small “m” at the beginning of FP name) [40,41]. However, at high concentrations, even monomeric FPs tend to aggregate; thus, strong overexpression of FP-tagged proteins may provide high signal intensity, but also enhances risks of artifacts associated with the abnormally large size of the aggregated construct.
The organic fluorescent dyes have considerably lower molecular weight (mostly < 1 kDa; Figure 2) and feature a variety of aromatic rings systems functionalized with electron-donating and electron-withdrawing substituents. Furthermore, organic dyes usually bear functional groups that enable ex vivo labeling of biologically active molecules yet preserve fluorescence characteristics of the dye. Different dye scaffolds have different hydrophobicity, and the combination of chemical properties of the dye and biologically active molecule determines applicability of the labeled construct in live cells: constructs that are too polar cannot cross cell plasma membrane, while constructs with extremely high hydrophobicity tend to stay bound to lipids within the membrane. In addition, it is important to consider the fact that the biologically active molecules that are labeled with organic fluorophores usually belong to the class of small-molecular-weight compounds. Thus, despite low molecular weight of the organic dye, it can still affect not only bioavailability, but also biological properties of the labeled construct compared to the non-labeled biologically active molecule.
There is a broad spectrum of fluorescent NPs that are used in biological applications. Numerous materials have been applied as NPs: silica and organically modified silica; hydrophobic and hydrophilic organic polymers; semiconducting organic polymers; quantum dots (QDs); carbonaceous nanomaterials including carbon dots, carbon nanoclusters and nanotubes; upconversion materials (UCNPs); and others. Compared to FPs and organic dyes, the application of fluorescent NPs in biological systems is relatively new [42,43]. While the majority of available reports have almost exclusively focused on applications of QDs [44,45], UCNPs and C-dots are currently on the rise [46]. QDs are nano-sized (mostly 2–10 nm) inorganic crystals that are made of semiconducting materials (e.g., CdSe, CdTe, C or Si) and possess optical properties intermediate between those of bulk semiconductors and discrete molecules. QDs have wide excitation spectrum in the UV range, whereas their emission spectrum is narrow and depends on the diameter and shape of QD: smaller QDs fluoresce in blue-green wavelengths, while emission of larger QDs is red-shifted (Figure 2). The correlation between the size of QD and its emission spectrum, as well as large Stokes shift make QDs well applicable for the multi-color imaging. In addition, QDs are endowed with good photostability, which makes those suitable for performing repeated cycles of excitation and emission (see below).
However, for attachment of ligands, it is necessary to functionalize surface of QDs, which may influence optical properties of the latter. Compared to organic dyes, few labeling protocols are available for QDs; it is also difficult to prognose the number of the biologically active molecules attached to one QD during the labeling procedure. Furthermore, some QDs require surface modification to enhance their solubility in aqueous solutions and prevent aggregation. Dependent on the coating, QDs might gain cell membrane-penetrative properties [47], yet translocation of such large particles through the membrane might cause changes in its fluidity and cause formation of pores. In the case of QDs based on transition and post-transition metallic elements, leakage of heavy metals might also contribute to their cytotoxicity. Finally, the aforementioned risks related to the altered properties of biologically active molecules upon labeling with a large entity are especially valid in the case of labeling with QDs.
1.2.3. Photoluminescence Measurement Techniques
The easiest and the most wide-spread technique in live cell imaging is measurement of fluorescence intensity. The detected signal depends primarily on the concentration and chemical nature of the fluorophore. In the cases of both fluorescence and phosphorescence, the radiative return of the excited electron to the ground state always competes with the non-radiative return. The ratio of emitted photons relative to photons absorbed is called quantum yield (QY); the product of QY and the maximal molar extinction coefficient εmax of the given photoluminescent compound determine its brightness, which is an important characteristic of the fluorophore. An exhaustive list of fluorophores together with the corresponding ε and QY values is provided in [48,49].
Even with the brightest organic dyes, the older apparatuses necessitated use of relatively high concentrations of the fluorophores (the intracellular concentration above 1 μM [50,51]) in order for fluorescence intensity to be detectable. Newer technical solutions have dramatically improved the detection limit (down to single molecule detection), yet the autofluorescence of biological systems has now become the bottle-neck by imposing the necessity for distinguishing the signal of fluorescent probe from the background. Consequently, relatively high probe concentrations are still frequently used in microscopic studies, thus increasing risk of interference with intracellular pathways of the biological targets—especially if high levels of probe over-expression or intracellular accumulation are achieved [52,53,54].
Both fluorescence spectrum and QY of a fluorophore may largely depend on the surrounding environment. One of the important parameters is pH, because the properties of the electron-donating and electron-withdrawing substituents of aromatic systems of fluorophores depend on their protonation state [55]. Therefore, the measured signal might depend on the intracellular localization of fluorophore, because pH levels vary between different cellular compartments. Just as important is polarity and crowdedness of the surrounding environment [56]. So-called static quenching occurs when a photoluminescent moiety (usually, a fluorophore) develops interactions with a quenching molecule which preclude excitation of the formed complex [57]. For instance, certain fluorophores are known to form non-specific yet strong interactions with proteins abundant in medium (a well-known example is binding of fluorescein to bovine serum albumin [58]). Because organic fluorophores are usually bulky aromatic systems, static quenching can also take place due to formation of fluorophore aggregates. Once the complex between the fluorophore and the quencher is disrupted (e.g., by increase of distance between the moieties, or by presence of detergent), static quenching is dissipated. Furthermore, certain small molecules (such as dissolved oxygen) can collide with the excited fluorophore and facilitate its return to the ground state via non-radiative way; this process is called dynamic quenching [57].
While sensitivity of fluorophore brightness to these parameters may give rise to unwanted artifacts during imaging, it can also be utilized for sensing of intramolecular events. In the context of PK-targeting probes, introduction of charged phosphoryl group to the spatial proximity of fluorophore can alter brightness of the latter several-fold. Furthermore, in the case of probes targeting Tyr PKs, phosphorylation of Tyr residue may alleviate static quenching of fluorophore by the non-phosphorylated Tyr. If phosphorylation itself does not change brightness of the proximal fluorophore sufficiently, binding of phosphorylated probe to a phospho-amino acid recognizing domain may introduce sufficient change in the polarity of the environment surrounding the fluorophore. The aforementioned types of probes are reviewed in Section 2.1 (Class 1B probes).
In addition, static quenching originating from fluorophore aggregation can be alleviated upon binding of fluorophore-containing probe to its biological target; this is utilized by fluorogenic dyes such as silicon rhodamine (Section 2.3, Class 3A probes). Fluorogenic dyes are extremely helpful in solving abundant problem of high background fluorescence signal that arises from the presence of the unbound or unmodified probe, which is not easily removed by washing procedures. In addition, if the target PK resides at the plasma membrane or close to it, certain imaging techniques such as total internal reflection fluorescence (TIRF) can be used [59]. TIRF makes use of a low-energy evanescent wave that is generated when the illuminating laser light undergoes total reflection at the interface of two different media endowed with different reflective indexes. The energy of the evanescent wave is directly proportional to the distance from the point of reflection, typically penetrating samples to the maximal depth of 100 nm. Therefore, TIRF only excites fluorophores residing on—or very close to—the cell surface, and can be used to restrict imaging to the region of interest in the cell, hence strongly diminishing signal originating from the cytoplasmic pool [60].
Apart from fluorescence intensity, fluorescence lifetime of fluorophore can also be measured. Fluorescence lifetime is independent from protein concentration (as long as the latter is sufficient for signal detection), which reduces risk of artifacts associated with a possible imbalanced enrichment of probe in a certain cellular location. On the other hand, analogically to fluorescence intensity, fluorescence lifetime is dependent on the environment surrounding fluorophore, and on its interactions with other fluorophores (see below [61]). However, more complicated equipment and software is needed for performing fluorescence lifetime imaging (FLIM) and data analysis. Furthermore, while in the case of organic dyes and some FPs [62] the decay of fluorescence intensity in time following excitation follows mono-exponential model, in the case of QDs the decay is multi-exponential, further complicating the data analysis.
If two fluorophores are positioned in sufficient proximity to each other and their electron densities (approximated as dipole moments) are suitably oriented, and if emission spectrum of one fluorophore partially overlaps with the excitation spectrum of the other, a non-radiative energy transfer can occur. Such phenomenon is named FRET (Förster-type resonant energy transfer). FRET has been widely applied in design of PK probes that report occurrence of the phosphorylation event by pronounced change of conformation (Section 2: Class 1A–B, Class 3C and Class 4A probes). Usually, FRET is detected by measuring fluorescence intensity at the emission length of donor as well as acceptor fluorophores; increased efficiency of FRET manifests itself as decrease of fluorescence intensity of the donor and/or increase of fluorescence intensity of the acceptor. Such ratiometric measurement has several advantages compared to the single-channel detection: the former is less prone to artifacts arising from the effects of microenvironment, variability of probe distribution, or instability of the excitation source [63]. However, in many popular FRET pairs utilized in genetically encoded PK probes, FRET efficiency is in the range of only 20–30%, which often results in insufficient signal-to-noise ratio. According to the recent study, the “classical” CFP-YFP pair should rather be replaced with mNeonGreen-mRuby3 or mClover3-mRuby3, which have the largest Förster distances (see Equation (1)) among all monomeric FP-based FRET pairs [64].
The FRET efficiency E depends on the donor-to-acceptor distance according to an inverse 6th order law due to the dipole–dipole coupling mechanism; R is the actual distance between donor and acceptor pair; and R0 is the so-called Förster distance between donor and acceptor (at which the FRET efficiency is equal to 50%). High FRET efficiency is also reflected as decrease in the fluorescence lifetime of the donor; τDA is the fluorescence lifetime of the donor in the presence and τD in the absence of acceptor.
In cases where FRET pair is constituted by the two separate genetically encoded tagged constructs [65,66,67,68], the ratio of expression level of the two constructs can vary substantially between the cells and/or cellular compartments. In this case, calculation of FRET efficiency and its change according to fluorescence intensities from donor/acceptor channels can be significantly biased. Here, elegant solutions are offered by the co-expression strategies based on dual promotor plasmids, internal ribosome entry sites (IRES), and viral 2A peptides [69]. In addition, as efficiency of FRET is also reflected in change of fluorescence lifetime of the donor, FLIM can be of great help.
Another characteristic issue connected with FRET is finding compromise between the optical requirement for maximal spectral overlap of donor and acceptor, and the technical requirement for the proper separation of two emission channels. In some cases, to collect more signal from the donor channel, a non-radiant acceptor can be used (e.g., REACh) that receives energy from donor yet does not emit light [70,71]. While ratiometric advantages of FRET are then lost in the case of fluorescence intensity detection, use of non-radiant acceptor is profitable in the case of FLIM techniques.
In principle, FRET can also occur between a phosphor and a fluorophore, provided that other conditions (spectral overlap, small donor-acceptor distance and suitable orientation) are fulfilled. This phenomenon was utilized for design of PK binding-responsive probes (Section 2.3, Class 3A probes) [72]. The long lifetime-photoluminescence of donor moiety incorporated in these compounds is dynamically quenched by oxygen when the probe resides in solution; upon binding to narrow ATP-binding site of PK, the triplet state of donor is stabilized, and FRET from donor to acceptor can take place. The emission wavelength of these probes depends on the fluorescent dye used as the acceptor. The long lifetime of donor determines the properties of the probe, and the signal of the acceptor can be measured after delay of tens of microseconds; by this time, autofluorescence of the biological specimen has decayed, thus these probes can be utilized for live cell imaging despite relatively low wavelength of light required for excitation of the donor (below 400 nm).
Another important parameter of fluorophore is its photostability. After returning to ground state, a fluorophore molecule can be excited again. The excitation–emission cycle can be repeated several times, but occasionally, the molecule will “slip” into the excited triplet state and stay there for some time until returning back to S1 (and, from there, to S0). The phenomenon where the molecule resides now and then in a non-photoluminescent state is called blinking [27,73,74]. Although blinking is a stochastic process, the extent of fluctuations can be influenced by the proximity of other fluorophores; this has been utilized for development of genetically encoded probes where extensive conformational change of molecule occurs upon phosphorylation (Section 2.1, Class 1A probes) [75].
While the photoluminescent molecule resides in excited triplet state, it can also get irreversibly modified—for instance, due to reaction with the dissolved molecular oxygen—and lose its photoluminescent properties. This is called photobleaching, which is usually unwanted because it depletes the pool of excitable fluorophores and hence lowers intensity of the detected signal, but also because it generates reactive oxygen species that can diffuse in the cell and trigger oxidative stress. However, photobleaching has been used in combination with FRET studies to confirm energy transfer from donor to acceptor: if acceptor is photobleached, the fluorescence intensity of donor should increase (Section 2.1, Class 1A probes). Furthermore, controlled photo-degradation of certain chemical scaffolds can be used to increase spatiotemporal resolution of probe action (Section 2.1, Class 1B probes). Namely, if the phosphorylatable amino acid within the probe is “caged” by the photo-degradable scaffold, local application of UV light releases a small pool of the active probe.
In some fluorophores, irradiation with UV light of certain wavelength causes reversible changes in the fluorophore structure (such as cis-trans isomerization of chromophores of some FPs [27]), which are reflected in emission properties of fluorophore (e.g., enhancement of fluorescent intensity and/or shift of emission spectrum occurs). The initial state of the system is either restored spontaneously or by irradiation of light with a higher wavelength. Such phenomenon is called reversible photoswitching, and it has triggered development of super-resolution microscopy techniques that have enabled imaging of cellular structures on the scale as small as 20 nm. There are several super-resolution microscopy techniques, each of which has its own advantages and drawbacks; because overview of those is beyond the scope of this publication, we suggest the following publication that provides detailed discussion of this field: [76]. Although super-resolution microscopy has initially been performed on fixed specimen, recent advances have widened the range of its application to live cells [77]. In the field of PK probes, super-resolution microscopy has provided valuable information on mechanism of activation of receptor PKs and compartmentalization of cytoplasmic PK signaling [75,78].
Finally, it should be noted that in recent years, researchers have focused on live imaging of not only cells, but also tissues, sometimes even within the transgenic organisms. The in vivo imaging necessitates use of a relatively narrow window of light wavelengths for photoexcitation (in the range of 650–1350 nm) to avoid strong scattering or absorption by fat, hemoglobin, or water. Therefore, application of near-infrared fluorophores that utilize the so-called therapeutic window is currently on the rise [33,43,45,46,50,79,80,81,82,83,84]. Furthermore, two-photon excitation strategy has gained popularity, which takes advantage of the fact that for excitation of certain fluorophores, instead of using one photon with high energy, two photons with half the energy can be applied [85]. While two-photon excitation enables imaging of live tissue up to about one millimeter in depth, it requires strong spatial focusing of the exciting light, thus increasing requirement for photostable fluorophores with high two-photon action cross-sections [86]. Alternatively, in vivo imaging can be performed with the aid of bioluminescence, discussed in detail in the following Section (examples of probes utilizing bioluminescence phenomenon are provided in Section 2.1 and Section 2.3).
1.2.4. Bioluminescence: Mechanism, Molecules and Advantages
Bioluminescence occurs in various kingdoms of life, ranging from bacteria to fungi to animals (e.g., insects). In all bioluminescent organisms, three components are required for production of light: a molecule that can be converted into an unstable intermediate by oxidation (so-called luciferin), molecular oxygen, and an enzyme that catalyzes oxidation reaction (so-called luciferase) [87]. Some organisms also require additional cofactors (typically, ATP or Ca2+). When the unstable oxidized luciferin intermediate undergoes spontaneous degradation into stable product, energy is released in the form of visible light; dependent on the structure of luciferin, the color of the emitted light may vary from blue to red.
As noted above, because bioluminescence does not require photoexcitation, it offers significant advantage for imaging techniques due to reduced autofluorescence of biological specimen and absence of photobleaching. Furthermore, bioluminescent signal can last for a prolonged period of time, as long as the enzyme is constantly supplied with its substrate [88]; this, however, might be problematic in the case of intracellular applications, as the cell membrane-penetrating forms of luciferins need to be used. Even more importantly, luciferases originating from several organisms (e.g., sea pansy, firefly or click beetle) possess relatively high molecular weight (in the range of 36–62 kDa [89]; see Figure 2), making those poorly suitable for application as genetically encoded tags. However, a luciferase molecule can be split into two halves that lack enzymatic activity of their own, yet regain it when brought spatially close. This method has been utilized in genetically encoded probes that undergo large conformational change upon phosphorylation (Section 2.1, Class 1A probes) [68,90].
Luciferases from other organisms (e.g., copepod crustacean Gaussia) are smaller (in the range of 20 kDa), yet utilize substrates that result in emission of light with low wavelength (480 nm or less). Such light can get easily absorbed by biological specimen, and is thus poorly applicable for fluorescence microscopy. The latter issue may be overcome by utilization of BRET phenomenon. BRET is a direct analog of FRET (see above), except that the bioluminescent donor does not require photoexcitation. If an acceptor with suitable optical properties is positioned in spatial proximity to the donor, non-radiative energy transfer can occur from donor to the acceptor, and light with higher wavelength that is subsequently emitted by the acceptor can then be detected. In nature, BRET phenomenon is utilized by jellyfish: the energy originating from aequorin/coelenterazine pair (luciferase/luciferin) is transferred to the green fluorescent protein. However, a combined tag incorporating both luciferase and FP moiety would possess unfavorably increased molecular weight; thus, other means of BRET development must be utilized to make it applicable for wider range of biological applications. For instance, if a protein of interest is tagged with a smaller version of luciferase (such as NanoLuc, a 19-kDa protein derived from a deep-sea shrimp [91]), and its binding partner is labeled with a suitable acceptor fluorophore, the arising BRET signal reflects presence of interaction, while loss of BRET shows disruption of interaction (e.g., by a competing binding partner) [92,93]. Such system has indeed been utilized as one of the probe variants for reporting PK signaling (Section 2.3, Class 3C probes).
2. Probes Targeting PK Pathways: Classification and Main Features
In general, an optical probe can be defined as the molecular entity which contains: (i) a part responsible for selective recognition or representation of a target; and (ii) a photoluminescent moiety used for reporting of event associated with binding, modification and/or translocation of the probe. Different probes can be classified according to the structure of the probe, the molecular event that the probe is reporting, or the technique used for detection of this event.
Here, a joined classification that considers the two first aspects is presented:
- Probes reporting phosphorylation event by changes in photoluminescent characteristics
- genetically encoded tagged substrates of protein kinases
- labeled synthetic and semisynthetic substrate peptides
- Probes reporting phosphorylation event by changes in the intracellular localization (also known as translocation probes)
- Probes reporting binding event by local enrichment of fluorescence intensity, or by changes in photoluminescent characteristics
- labeled small- or medium-molecular-weight synthetic inhibitors
- labeled PK-targeting antibodies or their analogs; labeled endogenous substrates or ligands of PKs
- tagged protein kinases constituting FRET pairs with other tagged proteins or probes from classes 3A, 3B
- Probes reporting events upstream or downstream of signaling of the PK of interest
- tagged protein kinases reporting presence of activating molecules
- probes reporting physiological outcome of signaling pathway of target PK (gene expression, activation of metabolic processes, changes in cellular phenotype and cell viability, etc.)
Here, we specifically discuss probes applied for imaging in human live cells, and focus more closely on characteristics of Classes 1A–1C, 2, 3A–3B, and 4A. Due to multitude of possible combinations and candidates, only few of the probes representing classes 3C and 4B will be reviewed in this manuscript.
2.1. Class 1
This class features phosphorylatable probes that act as PK substrates. Such probes can either be introduced into the cells as the genetically encoded constructs (1A), or as synthetic peptides (1B). Previously, the probes that are defined as Class 1 in this manuscript have been extensively reviewed [94,95,96,97,98,99,100,101]; here, we remind readers of the first steps in the field of probe development, and outline important aspects (including necessary controls) that need to be taken into account during application of these probes in cellulo.
2.1.1. Class 1A
This class features phosphorylatable probes that usually consist of the following building blocks:
- a consensus sequence that can be recognized and phosphorylated by the target PK;
- a phospho-amino acid recognizing domain (PAAD—such as SH2 that recognizes phospho-Tyr, or 14-3-3, FHA1, WW, and polo-box domain that recognize phospho-Ser/phospho-Thr);
- a FRET pair of fluorescent proteins.
The consensus sequence and the PAAD are joined by a flexible linker, and this entity is flanked by two fluorescent proteins. Phosphorylation of probe triggers a massive conformational change of the whole construct due to binding of the PAAD to the phosphorylated motif. This results in altered distance between the fluorophores and/or spatial orientation of dipoles, which is reflected in the change of efficiency of FRET (Figure 3B). In cases where phosphorylation causes a pronounced conformational change within the consensus sequence (and flanking residues) itself, PAAD can be omitted from the structure of the probe [102]; however, such cases are rare, as the change in FRET efficiency in the reporting system and hence the measurement window of the probe might be insufficient.
In principle, if a protein phosphatase can access the phosphorylated amino acid, dephosphorylation of the probe after a certain delay is possible; this restores the initial state of the system and enables “repetitive” application of the probe. To ensure such reversibility, the affinity of PAAD to phosphorylated sequence should not be too high, and the probe should reside for a sufficiently long time in an open conformation. Dependent on the used PAAD, introduction of changes into the consensus sequence might be needed to ensure that its phosphorylated form can be recognized both by target PK and by PAAD. In some cases, utilization of additional docking sequences that can be recognized by distant regions of target PK might be necessary. Considering all these details and the fact that PKs representing the same group can phosphorylate largely similar consensus sequences, detailed selectivity studies should be undertaken in biochemical format with the purified form of probe towards a panel of PKs prior to its application in cellulo [103].
The pioneering works reporting construction of genetically encoded phosphorylatable probes for PKs date back to 2000–2001. Inspired by the so-called “chameleon type” of Ca2+ sensors [106,107], Nagai et al. constructed a genetically encoded probe for a Ser/Thr protein kinase PKAc [102]. The consensus sequence was derived from KID domain of a PKA endogenous substrate CREB and sandwiched between CFP and YFP. The probe hence did not utilize any PAAD; upon phosphorylation of probe, decrease of FRET between CFP and YFP was observed (plateau achieved on the scale of 10 min). The authors reported that in biochemical assays, the probe featured KMapp and Vmax values that were similar to the characteristics of the endogenous CREB. Such in vitro control experiment, frequently omitted in the subsequent works, is helpful assessment of the impact of probe on the cellular pathways of target PK—as it is important to keep in mind that the overexpressed probe competes with endogenous substrates (Figure 3C). Furthermore, information on the kinetics of probe functioning (including rates of binding of probe to target PK or dephosphorylating phosphatase, rates of phosphorylation/dephosphorylation of the probe, and rates associated with conformational changes of probe closing/opening) is necessary in cases when rapid reporting is awaited in the subsequent in cellulo experiments.
The subsequent work by Kurokawa et al. reported probe Picchu for Abl [108]. In this probe, both the consensus sequence and the phospho-tyrosine binding domain were derived from the truncated sequence of protein Crk; again, flanking CFP and YFP were used as a FRET pair. In this case, phosphorylation of probe by Abl resulted in increase of FRET (a more usual scenario for PAAD-containing probes, as phosphorylation of the latter usually reduces distance between the fluorescent proteins located at the termini of the probe). Furthermore, a sequence responsible for localization of probe to the plasma membrane was introduced into the structure of probe; such localization of probe action by targeting of probes to various cellular compartments has been also extensively used in further studies [103,109].
Later, the development of genetically encoded phosphorylating-reporting probes was taken over by Tsien group. Ting et al. reported probes for Tyr PKs Src, Abl, and EGFR [110]; while the Abl probe was highly similar to the construct reported by Kurokawa et al. (except that full-length Crk was used), the probes for Src and EGFR incorporated SH2 domain followed by the linker and suitable consensus sequences. This type of probe design had then become prevalent in the subsequent studies reporting probes for other Tyr PKs (Figure 3A) [111,112,113,114].
Finally, in collaboration of Tsien and Taylor groups, a family of probes for Ser/Thr PKs had emerged, the so-called kinase activity reporters (KARs). The first generation of these FRET probes were developed for PKAc by Zhang et al.; modified Kemptide served as the consensus sequence, 14-3-3τ was used as the PAAD, and CFP/YFP was applied as the FRET pair [103]. In the next generations of the A-kinase activity reporters (AKARs), FHA1 was substituted for 14-3-3τ to ensure reversibility of the probe phosphorylation, and detailed research was undertaken to identify the FRET pair ensuring highest dynamic range [115]. AKARs have truly revolutionized the field of genetically encoded PK probes; based on the AKAR “core” design, similar probes for Akt/PKB (BKAR, AktAR and Aktus [116,117,118]), AMPK (AMPKAR [119,120]), JNK (JNKAR [121]), PKC (CKAR [122]), PKD (DKAR [123]), ERK family (EKAR and Erkus [124,125]) and other Ser/Thr PKs were generated (Figure 3A) [126,127,128,129,130,131,132,133]. Bipartite probes (termed kinase-inducible bimolecular switch, KIBS; see also Section 2.2) utilizing basic principles of AKAR design have also been reported [68]. In KIBS, an FP-tagged PAAD and a PK consensus sequence tagged with another FRET-supporting FP are expressed as separate constructs. By variation of consensus sequence in the second construct, monitoring of activity of multiple PKs using the same FP-tagged PAAD is achievable. However, application of bi- or multipartite probes by co-transfection of two or more separate plasmids may obscure measurement of FRET due to different expression levels of two proteins in different cells.
In recent years, Class 1A probes have been extensively used for exploration of PK signaling not only in cell lines and primary cells, but also tissues and even transgenic organisms [120,134,135]. The latter applications often take advantage of the bioluminescence phenomenon: instead of FRET pair of fluorescent proteins, a split luciferase protein is used for reporting of phosphorylation event [68,90,136,137]. The luciferase is split in two parts that are spatially distant in the open conformation of the non-phosphorylated probe, yet are able to reconstitute the bioluminescent core when brought into proximity by phosphorylation of probe and the following binding of phosphorylated consensus sequence to PAAD. In this way, phosphorylation of probe triggers massive increase of bioluminescence, and the signal intensity remains stable on an hour scale (provided that the supply of luciferase substrate is continued, and that the probe remains in the phosphorylated state).
From the very beginning of development of Class 1A probes, the authors have underlined the importance of performing necessary control experiments to make sure that the probe actually reports phosphorylation event and not spontaneous conformational changes associated with dynamical nature of proteins: see Table 1.
2.1.2. Class 1B
While the Class 1A probes are introduced into the cells in the form of plasmids and utilize cellular transcription and translation machinery for production of functional probes, an alternative approach uses pre-assembly of the probe “body” prior to introduction of the probe into the cell. Such pre-assembly may be accomplished either using organic synthesis, or by expression of the functional part of the probe in a suitable biological system, followed by purification and chemical labeling with a suitable fluorophore [138,139]. In this way, the probes representing Class 1B offer more versatility from the aspect of the choice of fluorophores (and, in principle, incorporation of non-natural amino acids to increase the proteolytic stability of the probes—although, to our knowledge, this possibility has not been used so far). On the other hand, the issue of internalization of the probe into the cells must be solved.
Apart from microinjection and electroporation, milder and arguably less “invasive” strategies can be used—which, however, pose certain limitations to the structure of probes. For instance, if a shorter peptide sequence is labeled with a fluorophore, the probe can rely on the hydrophobicity of the latter for internalization. Another option involves used of the so-called cell-penetrating peptide sequences (CPPs; such as CADY2 or Pep1), which can be incorporated into the structure of the probe [140,141], or mixed with the probe before applying in onto cells [139]. While utilization of the CPPs is tempting, one of the major risks associated with this strategy involves endosomal entrapment of the probe, as endocytosis is one of the major mechanisms of CPP delivery into the cells. Importantly, endosomes are disrupted upon fixation of the cells; hence, results of reports where probes are applied onto live cells, followed by fixation and only subsequent imaging, need to be considered with caution (see also remarks under Class 3A probes).
Another issue, frequently overlooked, is the fact that the covalently conjugated CPP can substantially alter the affinity and the selectivity of the probe. Furthermore, to overcome limited cell plasma membrane penetration, peptidic probes from Class 1B are often applied on cells at high concentrations (up to 20 μM; see Table S1). Noteworthily, recent studies have shown that compared to the extracellular milieu, the concentration of peptidic compounds in cells can be enriched up to 200-fold [53,54,142]. At millimolar concentrations, the probes will severely intervene with the intracellular pathways of target PKs by competing with the endogenous substrates (Figure 4C).
Compared to the genetically encoded constructs, probes from the Class 1B feature plethora of different designs and mechanisms for reporting the occurrence of phosphorylation event (reviewed before in [94,96]); here, we only focus on those that have been extensively applied in live cells. Most of probes incorporating the synthetic peptides rely on a local change in charge distribution in the proximity of the environmentally sensitive fluorophore [141,143,144,145]. In this case, phosphorylation of the probe triggers changes of emission spectrum, brightness, and/or fluorescence lifetime of the fluorophore. In cases when phosphorylation itself does not affect emission of fluorophore sufficiently, binding of phosphorylated consensus sequence of probe to PAAD can be applied. PAAD can be introduced into the system as a purified recombinant protein (using a suitable transport vector [139]), or PAAD natively present in the structure of the target PK can be utilized [141].
Alternatively, in the case of probes designed for monitoring of Tyr PKs, self-quenching phenomenon can be used (Figure 4B [146]). The non-phosphorylated Tyr residue within the consensus sequence serves as a static quencher for a fluorophore positioned spatially close to the quencher; phosphorylation of the probe disrupts interaction between the phenolic side-chain of Tyr and aromatic system of the fluorophore, causing increase in fluorescence of the latter. On the other hand, for probes reporting activities of basophilic Ser/Thr PKs, use of external non-conjugated negatively charged quencher is possible: upon phosphorylation of the probe, interaction between the quencher and the probe is weakened, triggering increase of emission intensity of organic dye incorporated in the probe [147].
The dynamic range of Class 1B probes reporting phosphorylation by enhancement of fluorescent intensity of single fluorophore is generally wider than that of FRET-based genetically encoded probes described under Class 1A. In the former, fluorescence intensity can change several folds, while, in the latter, change of FRET is in the range of below 50%. Utilization of only one channel for detection of Class 1B probes (except those containing two fluorophores [138,139]) solves the risk of cross-talk between the channels, yet deprives the data analysis of benefits of ratiometric measurement (unless FLIM technique is used [140,141]).
On the other hand, as pointed out above, the (semi)synthetic nature of Class 1B probes allows incorporation of specific functionalities, which are not limited with bright organic fluorophores: in recent years, the use of the so-called caged variants of Class 1B probes has gained popularity. Namely, derivatization of phosphorylatable amino acid side-chain with a photolabile group enables monitoring of probe action with high spatiotemporal resolution by uncaging a small local pool of probe using UV-light [145,146,147,148]. An obvious drawback of this strategy is using high energy photons for uncaging, which may damage the biological specimen upon prolonged irradiation. However, given the progress in the field of development of photolabile scaffolds and enhancement of spectral resolution of imaging techniques [149,150], the emergence of caged probes with minimal toxicity yet sufficient brightness is highly probable in the near future.
2.2. Class 2
This class features genetically encoded phosphorylatable probes that consist of the following building blocks:
- a consensus sequence that can be recognized and phosphorylated by the target PK;
- a nuclear localization sequence (NLS);
- a nuclear exclusion sequence (NES); and
- a fluorescent protein tag.
In its non-phosphorylated state, such probe is located in nucleus by virtue of incorporation of NLS. Phosphorylation of the consensus sequence, which is often accompanied by phosphorylation of NLS and/or NES motifs, results in translocation of probe from nucleus to cytoplasm (Figure 5). The mechanism triggering this translocation has not been unequivocally identified. It can be envisioned that binding of a target PK to the proximity of NLS masks the latter and thus NES can implement its effect. However, based on studies with the point-mutants where the phosphorylatable amino acid it is replaced with non-phosphorylatable Ala or negatively charged Glu (mimicking irreversibly phosphorylated state [151]), it more likely that incorporation of negative charge upon phosphorylation of the probe alters its interaction with nuclear import/export machinery.
The idea for development of Class 2 probes originated from the publication by Brunet et al. in 1999 reporting Akt/PKB-catalyzed phosphorylation of a fork-head transcription factor FKHRL1 that triggered retention of FKHRL1 in cytoplasm [153]. Based on the FP-tagged modified consensus sequences of fork-head transcription factors 1 and 3a, translocation probes for Akt/PKB have subsequently emerged [154,155,156,157]. Another pioneering translocation probe was developed by Giuliano et al. in 2003 [158]; the probe reported activity of PKAc and incorporated consensus sequence derived from CREB. Afterwards, Class 2 probes have been designed for Cdk2 (probe derived from a fragment of human DNA helicase B), Jnk (probe derived from a fragment of the transcription factor c-Jun), Erk1/2 (probe derived from Elk1) and p38 (probe derived from Mef2C) [151,159,160] (see Figure 5A). As with most genetically encoded Class 1A probes, the phosphorylation-induced signal change reported by most Class 2 probes achieves plateau on the scale of 10 min post PK activation.
A somewhat different kind of Class 2 probes is represented by the genetically encoded bipartite construct reported by Sample et al. [161]. It utilizes a design highly reminiscent of bipartite constructs reported under Class 1A (KIBS); one part of the probe contains phosphorylatable consensus sequence (in the reported case, Kemptide) attached to the plasma membrane, and the other part is formed by conjugation of PAAD with a reporter unit. Upon phosphorylation of the first part of the probe by a target PK (in the reported case, PKAc), the second part of the probe is recruited to the membrane. Dependent on the needs of the assay, the reporting unit might be altered (the authors report application of either FP tag or enzymatic tag); in addition, if an FP tag is also incorporated into the first part of the probe, the detection can occur via FRET measurement.
The benefits and drawbacks of Class 2 probes have been considered in detail by the earlier reviews [96,152]. A remarkable advantage of Class 2 probes is that despite incorporation of only one FP tag (in most cases), the measurement can be performed in a ratiometric format by quantifying fluorescence intensity in cytoplasm versus nucleus. The need for use of only one channel per one probe also means that probes for several PKs can be co-transfected for the simultaneous monitoring of several intracellular pathways. In addition, lack of PAAD in the structure of most Class 2 probes improves the availability of phosphorylated consensus sequence for protein phosphatases, thus ensuring more adequate reporting of intracellular balance of kinase versus phosphatase activity.
On the other hand, phosphorylation of just one residue within the probe might be insufficient for its relocalization, hence the consensus sequence often has to be altered significantly; this, in turn, necessitates performance of detailed selectivity studies to ensure that the probe is responsive to the targeted PK only. Furthermore, results of measurements can be obscured by the incomplete translocation of the probe; hence, calibration of PK activity versus probe response must be performed in advance. Another obvious limitation for Class 2 probes utilizing NLS/NES is that only PKs residing in nucleus (or diffusing freely between the cytoplasmic and the nuclear compartment) can be successfully monitored.
Class 2 probes can be easily confused with another type of probes that change cellular localization as a response to binding to secondary messenger that becomes available upon activation of a certain intracellular pathway. Because the latter situation in fact represents an event upstream of PK activation, we highlight such probes as Class 4A probes in Section 2.4.
2.3. Class 3
Contrary to the classes of probes discussed before, probes of Class 3 do not report phosphorylation event. Instead, they report presence of the target PK—which, in most of the cases, must adopt active conformation, so that the probe can bind to it (Figure 6B).
In the case of Classes 3A and 3B, binding of probes results in local enrichment of the fluorophores incorporated in the probes in a certain cellular location characteristic for the target PK. This enrichment can be distinguished from the background either after washout of the probe, or by virtue of change of photoluminescence properties of the probe associated with its binding to the target PK. Importantly, in recent years, use of Class 3A and Class 3B probes for theranostics and fluorescence-guided surgeries has been extensively explored [82,83,162,163].
In the case of Class 3C, probe is formed by application of a genetically encoded FP-tagged kinase and a synthetic labeled construct binding to it.
2.3.1. Class 3A
Class 3A probes consist of a small- or medium-molecular-weight sensing fragment (e.g., a PK inhibitor) labeled with a fluorophore (usually, organic dye). The sensing fragment selectively recognizes the target PK(s) and binds to it by forming a subset of selective interactions, which usually leads to blockage of catalytic function of the target (Figure 6C). Most Class 3A probes bind reversibly, and can undergo repeated cycles of association to and dissociation from the target PK. A question remains, however, whether the PK-bound probe reports the presence and the location of active or inactive PK.
The answer to this question depends on the structure of the sensing fragment of the probe, and on the residence time of the probe in complex with target PK. According to the widely used classification of PK inhibitors, Type I inhibitors dock into the ATP-binding site of the PK that resides in the active conformation; Type II inhibitors, on the other hand, additionally utilize pockets adjacent to the ATP-binding site, and exploit inactive conformation of the target PK [164,165]. However, there is an ongoing debate considering the fact whether Type II inhibitors select the small pool of the PK molecules that already reside in an inactive conformation, or it is rather binding of Type II inhibitor that induces conformation change of PK molecule. Next, there are also pseudo-substrate-type inhibitors that utilize the substrate-site of PK and cannot bind to autoinhibited conformations of PKs where the substrate site is blocked. Finally, bisubstrate-analog inhibitors incorporate fragments that can bind to both ATP- and substrate-binding site of PK, and hence need to compete with intracellular ATP as well as endogenous substrate for binding. While it is possible that only one fragment of the bisubstrate-analog inhibitor gets bound to the suitable site in PK molecule [166], simultaneous binding of both fragments is thermodynamically favored. Therefore, bisubstrate-analog inhibitors bind preferentially to PKs residing in sufficiently open conformation.
The residence time of inhibitor, on the other hand, determines how quickly the equilibrium in the inhibitor-containing biological system will be established, and whether duration of PK blockage of is sufficient to trigger possible relocation of the inhibitor-bound PK. Because the equilibrium Ki value of the inhibitor can be expressed as the ratio of its dissociation and association rate constants, inhibitors with similar Ki values can be endowed with very different kinetic properties. While prolonged dissociation kinetics of inhibitor is generally desirable in the case of drug development (because long residence time of drug can contribute to its so-called temporal selectivity), this property might pose issues in case of probes, especially if reporting of quick PK-related processes is anticipated.
Another important aspect in development of Class 3A probes is that while it is tempting to extrapolate properties of the sensing fragment to the whole probe, conjugating of the label with the inhibitor can result in significant change of characteristics of the latter [79,167,168]. Therefore, it is of utmost importance to establish affinity, kinetics, selectivity and cell membrane-penetrating properties of the probe after it has been fully assembled.
As with synthetic peptides described under Class 1B probes, internalization into live specimen can pose challenge for Class 3 probes as well (except for probes targeting extracellular portion of PKs [169,170]). Different approaches have been used to overcome this issue, including application of cell membrane-penetrating peptides [171] and derivatization of probes with functional groups that are cleaved by intracellular enzymes upon delivery of the probe into live cells (so-called prodrug strategy [172]). Probes utilizing smaller hydrophobic sensing fragments and non-polar fluorophores can cross cell plasma membrane on their own [83,84,163,173], although there is a risk that the probe is recruited into the hydrophobic layer instead of reaching target PK in the cytoplasm. In certain cases, assembly of probe in cellulo has been reported, where the probe was first sent into cells, followed by application of fluorophore containing selective reactive moiety [174,175]. It has also been shown that the fluorescent label incorporated in probe structure can affect efflux of probe from the cells [176]. On the other hand, intracellular accumulation of probe is possible to the levels that are up to two orders of magnitude higher than the extracellular concentration of the compound [53,54]; in this case, significant depletion of the target PK pool by the probe can occur, affecting the phosphorylation of the endogenous proteins.
However, the possibility to utilize the vast chemical space of PK-targeting scaffolds, and the relatively non-laborious protocols associated with application of synthetic compounds (i.e., as opposed to the genetically encoded probes) have contributed to the gain of popularity of Class 3A probes. A list of Class 3A probes targeting various PKs is presented in Table S2 (see also Figure 6A).
In older reports, detection of probe binding to the target was mainly performed by assessment of the characteristic localization of the fluorescence signal, corresponding to the preliminarily established localization of the target PK. Such approach suffers remarkably from the background signal of the unbound probe, which is only somewhat reduced by the repeated washing procedures. In some cases, fixation of cells was performed after application of probes to reduce the background signal and to confirm selectivity of probe binding by co-localization with immunofluorescent staining [177,178,179,180,181]. However, fixation is associated with disruption of membrane structures, which can give rise to significant artifacts in imaging: the localization of the probe before and after fixation may differ drastically. Therefore, importance of fluorogenic dyes and probes that gain photoluminescence upon binding to PK has been recognized in recent years [72,84,163,182,183,184].
As discussed above, for the sake of the possibility to restore the native-like state of the system, most Class 3A probes utilize PK-sensing fragments that do not bind covalently. However, a subset of probes utilizes irreversible inhibitors that can form covalent bonds with certain hot-spots in the PK core (usually Cys residues), resulting in permanent labeling but also inactivation of the labeled kinase [182,185,186]. In the case of photoaffinity probes, formation of covalent complex between the target PK and the probe can be triggered by a flash of UV-light that causes transformation of a certain functional group incorporated in the probe structure (e.g., aromatic azide or diazirine) into highly reactive radical species [178,179,180,187,188]. In addition, some probes can be constructed in such a way that the PK-sensing fragment is sent into the live cells, linked irreversibly to its target and labeled with a suitably functionalized reagent—such as a fluorescent dye, or a biotin conjugate. This approach, termed affinity-based protein profiling (ABPP), is useful for the pull-down of target PK together with its binding partners and/or scaffolding proteins, which can be subsequently identified using proteomics. ABPP probes are of smaller value in the context of monitoring PK pathways using imaging techniques, as it is difficult to define as “active” a PK that has been permanently inactivated as a result of the labeling event; however, information on localization and trafficking of the “chemically tagged” PKs can be obtained. In addition, because ABPP probes can be used for assessment of selectivity of non-labeled inhibitors, the former can feature a relatively wide selectivity profile which excludes their use as selective imaging reagents.
2.3.2. Class 3B
Another class of binding-responsive probes utilizes larger molecules for recognition of the target PK, typically antibodies or their analogs (e.g., affibodies, monobodies [78,80,81,189,190,191,192,193]), but also endogenous binding partners [78,190,194]. These PK-sensing entities can be produced in suitable biological systems, purified and then labeled with organic dyes or quantum dots. Such constructs can be delivered into cells using microinjection [193], although, more commonly, those are used for reporting activities of receptor Tyr PKs where binding event occurs between the probe and the extracellular part of the receptor [78,80,81,82,162,190,191,192]. Alternatively, Class 3B probes can be used as genetically encoded constructs tagged with FPs, in which case probes are easily utilizable for reporting activity of intracellular PKs [189,194].
Examples of Class 3B probes featuring various PK-sensing fragments are listed in Table S3 (see also Figure 6A). As an exception, the probe incorporating antibody recognizing phosphorylated Ser10 of histone H3 is included in the table; differently from the rest of the listed scaffolds, this probe is phosphorylation-responsive, and from this aspect bears more similarity with the probes listed under Class 1 [195].
As in the case of Class 3A, minimalization of background signal originating from the non-bound probe is also required in the case of Class 3B probes. For constructs targeting extracellular domains of PKs, extensive washing procedures can be utilized to remove the excess of the probe, taking additional advantage of the fact that antibodies usually possess long residence times in complex with their targets. Fluorescence lifetime imaging has also been applied, where the population of bound and unbound probe can be distinguished according to the altered lifetime of some fluorophores [80]. In some reports, environmentally sensitive fluorophores and special fluorescence-enhancing scaffolds have been incorporated in the structure of Class 3B probes [192,193]. In recent years, the field has also profited from the cutting-edge microscopic techniques like uPAINT where real-time binding of selected population of probes to targets is monitored [78,196].
Due to development of a unique pattern of interactions between the PK-sensing fragment and the target PK, Class 3B probes are potentially endowed with extremely high selectivity. On the other hand, the question of recognition of only active pool of target PK (discussed above) is especially valid in the case of Class 3B probes. Endogenous ligands, certain monoclonal antibodies and their analogs are able to distinguish between the active and inactive conformations of their target [193]; however, in most cases, Class 3B probes report rather on the amount of expressed PK than its activity. Furthermore, binding of such large molecule as antibody can result in (partial) unfolding of the target PK, loss of its catalytic activity and/or interactions with the endogenous binding partners. Finally, incorporation of large protein scaffolds naturally makes Class 3B probes more sensitive to the environmental conditions than Class 3A probes; thus, care needs to be taken when handling the former to avoid denaturation or proteolytic degradation.
2.3.3. Class 3C
In principle, selectivity of detection of either Class 3A or Class 3B probe can be easily elevated by utilizing FRET-pairing with the FP-labeled target PK. While bipartite design complicates understanding of influence of such probes on intracellular equilibria, those are well applicable for profiling of selectivity of inhibitors and studies of protein-protein interactions in complex environment. There are multiple designs that could belong under definition of a Class 3C probe; here, we highlight only two of those.
One of the pioneering works in the field of application of fluorescently labeled antibodies in live cells was published in 1999 by Ng et al. [197], and reported use of Cy3.5-labeled antibody that recognized a phosphorylated site on PKCα (phospho-Thr250). Fluorescence lifetime imaging confirmed that the microinjected antibody constituted FRET pair with the GFP-tagged PKCα. Because reversible phosphorylation of Thr250 of PKCα reflects activation state of the PK, the probe could be used for monitoring of efficiency and kinetics of PKCα activators, and potentially dynamics of pathways inactivating PKCα.
An example of combination of small-molecular weight labeled tracer and tagged PK is represented by the recently reported BRET-based system for in cellulo assessment of selectivity, affinity and binding kinetics of non-labeled PK inhibitors [92,93]. The PK of interest is tagged with NanoLuc, a 19 kDa luciferase, and can be recruited to a suitable intracellular location using additional localizing sequences. The tracer consists of a PK inhibitor (with a relatively wide selectivity profile, which includes the PK of interest) labeled with organic dye (an analog of Bodipy, so-called NanoBRET 590). In the presence of cell-permeable NanoLuc substrate, BRET occurs between the two constructs, whereas it can be disrupted in the presence of a non-labeled inhibitor targeting PK of interest. Using combinations of six different tracers with 178 NanoLuc-tagged PK constructs, the authors have achieved remarkable coverage of the human kinome.
Just as well as the bipartite probes can combine advantages of utilization of both constructs, those can also combine drawbacks associated with simultaneous application of two non-endogenous molecules. The issues related with Class 3A and 3B probes are discussed above; the risks related to overexpression of tagged PKs are discussed under the next Section (Class 4A probes).
2.4. Class 4
All of the aforementioned classes of probes indicate presence of the active PK of interest in the milieu either by reporting binding event to the target, or the phosphorylation reaction performed by such target. According to our classification, probes belonging to Class 4 instead report presence of molecules responsible for activation of PKs of interest, or monitor certain physiological outcomes associated with downstream signaling of PK of interest.
2.4.1. Class 4A
As noted above, Class 4A features several probes that are structurally highly similar to Class 1A; however, while the latter probes incorporate a consensus sequence that is derived from a substrate of the target PK, the former probes utilize the phenomenon of autophosphorylation. In the majority of PKs, autophosphorylation occurs in response to binding of an activating molecule. Hence, probes of Class 4A usually comprise the following fragments:
- a domain responsible for binding of the activating molecule—e.g., a secondary messenger (such as diacylglycerol (DAG) or phosphatidylinositol (3,4,5)-trisphosphate (PIP3)), or a regulatory protein (such as calmodulin or EGF);
- a catalytic core of the target PK, including autophosphorylatable region;
- a phospho-amino acid recognizing domain (PAAD); and
- a FRET pair of fluorescent proteins.
Binding of an activating molecule to PK alleviates autoinhibition within the latter and promotes phosphorylation of activation loop; phosphorylation-triggered opening of the catalytic cleft completes sequence of conformational changes in PK core (Figure 7B). Conformational changes, in turn, manifest themselves as change in FRET between the FP tags attached to the PK. Similarly to Class 1A probes, PAAD can be omitted from the structure of Class 4A probes, if conformational change associated with autophosphorylation of the PK domain is sufficiently pronounced to trigger FRET change [198,199,200]. On the other hand, the domain responsible for binding secondary messenger, as well as PAAD may constitute part of the native sequence of PK of interest.
For instance, the design of Class 4A probes reporting autophosphorylation event associated with binding of an activating molecule has taken advantage of catalytic domains MLCK and CaMKII (both react to the presence of CaM [198,199]) and EGFR (reacts to the presence of EGF [202]). The family of probes based on CaMKII, named Camuiα, also includes members incorporating a non-radiative FRET acceptor sREACh in their structure, which quenches donor GFP in the absence of CaM, thus reducing background signal of CaM-unbound probe [71,203]. In the case of Tyr PKs, bipartite probes have also been reported where FRET is measured between two differently tagged molecules of Met upon HGF-induced dimerization [67]. Another unusual probe is derived from the full-length Aurora A [200]; while it utilizes the classical reporting mechanism, it is unclear what activating mechanism triggers autophosphorylation of this PK (although interactions with localizing proteins such as TPX-2 [204] and control by phosphatases [205] have been suggested as possible mechanisms limiting autophosphorylation of Aurora A). Furthermore, the probe derived from Lck (triggered by the upstream T-cell receptors) exceptionally reports activating dephosphorylation, associated with opening of the conformation of Lck [206].
Presence of an activating molecule incorporating lipid chain can also trigger translocation of downstream PKs from cytosol to the cell membrane, where further PK activation steps occur. This phenomenon has been utilized to enhance selectivity of detection in Class 4A probes derived from Akt/PKB (so-called Akind probes; report presence of PIP3 [201]), PKCδ (report presence of DAG [207]) and FAK (report presence of PIP3 and possibly other focal adhesion molecules [208,209]).
A somewhat different design is also featured by probes derived from cyclic nucleotide-dependent PKs. The cAMP-sensing probe derived from PKA are multipartite: PKA holoenzyme consists of two catalytic subunits (PKAc) and a dimer of regulatory subunits (PKAr2), and dissociation of holoenzyme occurs upon binding of cAMP. The pioneering works used labeling of purified PKAc and PKAr with suitable organic dyes and microinjection of the obtained constructs into the cells [210,211]; subsequently, genetically encoded bipartite probes consisting of PKAr-CFP and PKAc-YFP were reported [65,212]. The cGMP-sensing probe, in turn, takes advantage of PKGI, where regulatory and catalytic parts of PK are incorporated into one chain [213]. Importantly, the authors demonstrated that binding of cGMP induces large conformational change within the probe even in the absence of autophosphorylation event; therefore, inactive PK domain could be incorporated into the structure of the probe.
While mechanism behind reporting of Class 1A and 4A probes can be relatively similar, those classes of probes have a profoundly different effect on intracellular pathways: Class 1A serves as a protein substrate, while Class 4A (once activated) usually serves as an active kinase. Therefore, while Class 1A probes can reduce rate of phosphorylation of endogenous substrates, Class 4A can vastly enhance rate of phosphorylation reactions (Figure 7C). To reduce possible artifacts originating from over-expression of PK, possibility of utilization of kinase-dead mutants should always be explored in the case of Class 4A probes. Even if functioning of probe presupposes autophosphorylation, it is necessary to establish whether the system can rely on trans-phosphorylation performed by the endogenous PK of interest.
2.4.2. Class 4B
Given the physiological importance of PKs, it is often possible to trace activation of a certain PK pathway to the events lying downstream in the signaling—such as changes in gene expression [214], cell morphology [215,216], cell cycle stage [217], or triggering of programmed cell death [218,219]. There are numerous possibilities for monitoring of these physiological events, and principles behind design of Class 4B probes cannot be easily generalized. However, it is important to keep in mind that even probes reporting most downstream events of PK signaling can interfere significantly with the intracellular equilibria: probes intercalating into DNA may alter repair mechanisms and gene expression, probes binding to cytoskeleton may influence dynamics of tubulin and actin (de)polymerization, probes indicating activity of caspases may temporarily preclude degradation of endogenous proteins, and so on. Therefore, usual precautions—such as application of a set of proper positive and negative controls; optimization of probe concentration, incubation and imaging time; and utilization of several cell lines and alternative monitoring techniques—should be taken to ensure adequacy of the obtained data.
3. Conclusions
As an experimental scientist, one usually faces an inevitable paradox: to examine the system, one has to alter it. This is especially critical if the research object is biological, as the level of complexity of such system presupposes either dramatic oversimplification of its properties to generate a feasibly examinable model, or introduction of non-native detectable entities which might interfere with the functioning of the system of interest. While artifacts can hardly be totally avoided, the awareness of the risks associated with use of certain methods or tools facilitates the choice of the least harmful scenario. Here, we provide a closer look at the pros and cons of application of photoluminescent probes and light microscopy to dissect phosphorylation-triggered pathways in live mammalian cells.
According to the classification of probes used in this publication, the constructs typically used for monitoring of PK functioning are phosphorylation-responsive (Class 1 and 2), binding-responsive (Class 3), or report events upstream or downstream of signaling of PK of interest (Class 4). The probes can respond to the aforementioned processes by changes in either fluorescent intensity (e.g., by utilizing FRET or static quenching phenomena) or localization in cell (especially pronounced in the case of Class 2 probes). The sub-classification of Class 1 considers whether the main body of probe is assembled outside the cell where the imaging is carried out, or is introduced into the cell as a genetically encoded construct. The sub-classification of Class 3, on the other hand, is based on the size and chemical structure of PK-sensing fragment. For each class and sub-class of probes, we outlined characteristic aspects that need to be taken into account for successful application of probes in cellulo.
Mapping of the reported probes onto the human kinome tree (Figure 3, Figure 4, Figure 5, Figure 6 and Figure 7) shows that for a large proportion of protein kinases, probes have not yet been uncovered, and emergence of novel scaffolds is awaited for selective, effective and minimally biased imaging of multitude of PK pathways in their natural milieu.
Supplementary Materials
The following are available online at https://www.mdpi.com/2227-9040/6/2/19/s1, Table S1: structures and properties of various Class 1B probes, Table S2: structures and properties of various Class 3A probes, Table S3: structures and properties of various Class 3B probes, together with Supplementary References.
Author Contributions
D.L. compiled the main body of the manuscript and was responsible for the choice of reviewed publications; S.K. was responsible for the part of the introduction describing physical background of photo- and bioluminescence phenomena; and K.V. was responsible for the graphics, the part of the Introduction providing brief overview of protein kinases, and the overall correction of the manuscript.
Funding
The work was supported by grants from the Estonian Research Council (IUT20-17) and Enterprise Estonia (EU48695).
Acknowledgments
We thank Asko Uri for the exhaustive discussions that provided solid basis for the given manuscript.
Conflicts of Interest
The authors confirm that this article content has no conflict of interest.
Abbreviations
| ABPP | activity-based protein profiling |
| CPP | cell-penetrating peptide |
| DAG | diacylglycerol |
| FLIM | fluorescence lifetime imaging |
| FP | fluorescent protein |
| KAR | kinase activity reporter |
| NES | nuclear export signal |
| NLS | nuclear localization signa |
| NP | nanoparticle |
| PAAD | phospho-amino acid binding domain |
| PIP3 | phosphatidylinositol(3,4,5)-trisphosphate |
| PK | protein kinase |
| PKAc | catalytic subunit of cAMP-dependent protein kinase |
| PKAr | regulatory subunit of cAMP-dependent protein kinase |
| QD | quantum dot |
| QY | quantum yield |
References
- Mildvan, A.S. Mechanisms of signaling and related enzymes. Proteins 1997, 29, 401–416. [Google Scholar] [CrossRef]
- Knight, J.D.R.; Qian, B.; Baker, D.; Kothary, R. Conservation, Variability and the Modeling of Active Protein Kinases. PLoS ONE 2007, 2, e982. [Google Scholar] [CrossRef] [PubMed]
- Kung, J.E.; Jura, N. Structural Basis for the Non-catalytic Functions of Protein Kinases. Structure 2016, 24, 7–24. [Google Scholar] [CrossRef] [PubMed]
- Miller, C.J.; Turk, B.E. Homing in: Mechanisms of Substrate Targeting by Protein Kinases. Trends Biochem. Sci. 2018. [Google Scholar] [CrossRef] [PubMed]
- Cheng, F.; Jia, P.; Wang, Q.; Zhao, Z. Quantitative network mapping of the human kinome interactome reveals new clues for rational kinase inhibitor discovery and individualized cancer therapy. Oncotarget 2014, 5, 3697–3710. [Google Scholar] [CrossRef] [PubMed]
- Shi, Y. Serine/Threonine Phosphatases: Mechanism through Structure. Cell 2009, 139, 468–484. [Google Scholar] [CrossRef] [PubMed]
- Lochhead, P.A. Protein Kinase Activation Loop Autophosphorylation in Cis: Overcoming a Catch-22 Situation. Biochemistry 2009, 2, pe4. [Google Scholar] [CrossRef] [PubMed]
- Hubbard, S.R.; Mohammadi, M.; Schlessinger, J. Autoregulatory Mechanisms in Protein-tyrosine Kinases. J. Biol. Chem. 1998, 273, 11987–11990. [Google Scholar] [CrossRef] [PubMed]
- Carmena, M.; Ruchaud, S.; Earnshaw, W.C. Making the Auroras glow: Regulation of Aurora A and B kinase function by interacting proteins. Curr. Opin. Cell Biol. 2009, 21, 796–805. [Google Scholar] [CrossRef] [PubMed] [Green Version]
- Hindriksen, S.; Lens, S.M.A.; Hadders, M.A. The Ins and Outs of Aurora B Inner Centromere Localization. Front. Cell Dev. Biol. 2017, 5. [Google Scholar] [CrossRef] [PubMed]
- Corradini, E.; Burgers, P.P.; Plank, M.; Heck, A.J.R.; Scholten, A. Huntingtin-associated Protein 1 (HAP1) Is a cGMP-dependent Kinase Anchoring Protein (GKAP) Specific for the cGMP-dependent Protein Kinase Iβ Isoform. J. Biol. Chem. 2015, 290, 7887–7896. [Google Scholar] [CrossRef] [PubMed]
- Adams, D.R.; Ron, D.; Kiely, P.A. RACK1, A multifaceted scaffolding protein: Structure and function. Cell Commun. Signal. 2011, 9, 22. [Google Scholar] [CrossRef] [PubMed]
- Bayer, K.-U.; Harbers, K.; Schulman, H. aKAP is an anchoring protein for a novel CaM kinase II isoform in skeletal muscle. EMBO J. 1998, 17, 5598–5605. [Google Scholar] [CrossRef] [PubMed]
- Eigenthaler, M.; Nolte, C.; Halbrugge, M.; Walter, U. Concentration and regulation of cyclic nucleotides, cyclic-nucleotide-dependent protein kinases and one of their major substrates in human platelets. Estimating the rate of cAMP-regulated and cGMP-regulated protein phosphorylation in intact cells. Eur. J. Biochem. 1992, 205, 471–481. [Google Scholar] [CrossRef] [PubMed]
- Torkamani, A.; Verkhivker, G.; Schork, N.J. Cancer driver mutations in protein kinase genes. Cancer Lett. 2009, 281, 117–127. [Google Scholar] [CrossRef] [PubMed]
- Quan, C.; Xiao, J.; Liu, L.; Duan, Q.; Yuan, P.; Zhu, F. Protein Kinases as Tumor Biomarkers and Therapeutic Targets. Curr. Pharm. Des. 2017, 23. [Google Scholar] [CrossRef] [PubMed]
- Yu, L.-R.; Issaq, H.J.; Veenstra, T.D. Phosphoproteomics for the discovery of kinases as cancer biomarkers and drug targets. Proteom. Clin. Appl. 2007, 1, 1042–1057. [Google Scholar] [CrossRef] [PubMed]
- Nesterova, M.V.; Johnson, N.; Cheadle, C.; Bates, S.E.; Mani, S.; Stratakis, C.A.; Kahn, I.; Gupta, R.K.; Cho-Chung, Y.S. Autoantibody Cancer Biomarker: Extracellular Protein Kinase A. Cancer Res. 2006, 66, 8971–8974. [Google Scholar] [CrossRef] [PubMed]
- Zhai, X.-H.; Yu, J.-K.; Yang, F.-Q.; Zheng, S. Identification of a new protein biomarker for colorectal cancer diagnosis. Mol. Med. Rep. 2012, 6, 444–448. [Google Scholar] [CrossRef] [PubMed]
- Zhang, K.; Chen, L.; Deng, H.; Zou, Y.; Liu, J.; Shi, H.; Xu, B.; Lu, M.; Li, C.; Jiang, J.; et al. Serum lemur tyrosine kinase-3: A novel biomarker for screening primary non-small cell lung cancer and predicting cancer progression. Int. J. Clin. Exp. Pathol. 2015, 8, 629–635. [Google Scholar] [PubMed]
- Hon, K.W.; Abu, N.; Ab Mutalib, N.-S.; Jamal, R. Exosomes As Potential Biomarkers and Targeted Therapy in Colorectal Cancer: A Mini-Review. Front. Pharmacol. 2017, 8. [Google Scholar] [CrossRef] [PubMed]
- Li, W.; Li, C.; Zhou, T.; Liu, X.; Liu, X.; Li, X.; Chen, D. Role of exosomal proteins in cancer diagnosis. Mol. Cancer 2017, 16. [Google Scholar] [CrossRef] [PubMed]
- Sandfeld-Paulsen, B.; Jakobsen, K.R.; Bæk, R.; Folkersen, B.H.; Rasmussen, T.R.; Meldgaard, P.; Varming, K.; Jørgensen, M.M.; Sorensen, B.S. Exosomal Proteins as Diagnostic Biomarkers in Lung Cancer. J. Thorac. Oncol. 2016, 11, 1701–1710. [Google Scholar] [CrossRef] [PubMed]
- Cohen, P.; Alessi, D.R. Kinase Drug Discovery—What’s Next in the Field? ACS Chem. Biol. 2013, 8, 96–104. [Google Scholar] [CrossRef] [PubMed]
- Berndt, N.; Karim, R.M.; Schönbrunn, E. Advances of small molecule targeting of kinases. Curr. Opin. Chem. Biol. 2017, 39, 126–132. [Google Scholar] [CrossRef] [PubMed]
- Wang, Y.; Shyy, J.Y.; Chien, S. Fluorescence proteins, live-cell imaging, and mechanobiology: Seeing is believing. Annu. Rev. Biomed. Eng. 2008, 10, 1–38. [Google Scholar] [CrossRef] [PubMed]
- Zhou, X.X.; Lin, M.Z. Photoswitchable fluorescent proteins: Ten years of colorful chemistry and exciting applications. Curr. Opin. Chem. Biol. 2013, 17, 682–690. [Google Scholar] [CrossRef] [PubMed]
- Lippincott-Schwartz, J.; Patterson, G.H. Photoactivatable fluorescent proteins for diffraction-limited and super-resolution imaging. Trends Cell Biol. 2009, 19, 555–565. [Google Scholar] [CrossRef] [PubMed]
- Zimmer, M. GFP: From jellyfish to the Nobel prize and beyond. Chem. Soc. Rev. 2009, 38, 3823–3832. [Google Scholar] [CrossRef] [PubMed]
- Cody, C.W.; Prasher, D.C.; Westler, W.M.; Prendergast, F.G.; Ward, W.W. Chemical structure of the hexapeptide chromophore of the Aequorea green-fluorescent protein. Biochemistry 1993, 32, 1212–1218. [Google Scholar] [CrossRef] [PubMed]
- Yang, F.; Moss, L.G.; Phillips, G.N., Jr. The molecular structure of green fluorescent protein. Nat. Biotechnol. 1996, 14, 1246–1251. [Google Scholar] [CrossRef] [PubMed]
- Yang, T.-T.; Cheng, L.; Kain, S.R. Optimized Codon Usage and Chromophore Mutations Provide Enhanced Sensitivity with the Green Fluorescent Protein. Nucleic Acids Res. 1996, 24, 4592–4593. [Google Scholar] [CrossRef] [PubMed]
- Subach, F.V.; Verkhusha, V.V. Chromophore Transformations in Red Fluorescent Proteins. Chem. Rev. 2012, 112, 4308–4327. [Google Scholar] [CrossRef] [PubMed]
- Miyawaki, A.; Shcherbakova, D.M.; Verkhusha, V.V. Red fluorescent proteins: Chromophore formation and cellular applications. Curr. Opin. Struct. Biol. 2012, 22, 679–688. [Google Scholar] [CrossRef] [PubMed]
- Macdonald, P.J.; Chen, Y.; Mueller, J.D. Chromophore maturation and fluorescence fluctuation spectroscopy of fluorescent proteins in a cell-free expression system. Anal. Biochem. 2012, 421, 291–298. [Google Scholar] [CrossRef] [PubMed]
- Craggs, T.D. Green fluorescent protein: Structure, folding and chromophore maturation. Chem. Soc. Rev. 2009, 38, 2865–2875. [Google Scholar] [CrossRef] [PubMed]
- University of California Davis. Single Molecule Tracking, Figure 1. Available online: Https://phys.libretexts.org/LibreTexts/University_of_California_Davis/UCD%3A_Biophysics_241/Experimental_Characterization/Single_Molecule_Tracking (accessed on 24 April 2018).
- Chudakov, D.M.; Matz, M.V.; Lukyanov, S.; Lukyanov, K.A. Fluorescent Proteins and Their Applications in Imaging Living Cells and Tissues. Physiol. Rev. 2010, 90, 1103–1163. [Google Scholar] [CrossRef] [PubMed]
- Bulina, M.E.; Chudakov, D.M.; Mudrik, N.N.; Lukyanov, K.A. Interconversion of Anthozoa GFP-like fluorescent and non- fluorescent proteins by mutagenesis. BMC Biochem. 2002, 3, 7. [Google Scholar] [CrossRef]
- Zacharias, D.A. Partitioning of Lipid-Modified Monomeric GFPs into Membrane Microdomains of Live Cells. Science 2002, 296, 913–916. [Google Scholar] [CrossRef] [PubMed]
- Yanushevich, Y.G.; Staroverov, D.B.; Savitsky, A.P.; Fradkov, A.F.; Gurskaya, N.G.; Bulina, M.E.; Lukyanov, K.A.; Lukyanov, S.A. A strategy for the generation of non-aggregating mutants of Anthozoa fluorescent proteins. FEBS Lett. 2002, 511, 11–14. [Google Scholar] [CrossRef]
- Chen, M.; Yin, M. Design and development of fluorescent nanostructures for bioimaging. Progr. Polym. Sci. 2014, 39, 365–395. [Google Scholar] [CrossRef]
- Wolfbeis, O.S. An overview of nanoparticles commonly used in fluorescent bioimaging. Chem. Soc. Rev. 2015, 44, 4743–4768. [Google Scholar] [CrossRef] [PubMed]
- Medintz, I.L.; Clapp, A.R.; Mattoussi, H.; Goldman, E.R.; Fisher, B.; Mauro, J.M. Self-assembled nanoscale biosensors based on quantum dot FRET donors. Nat. Mater. 2003, 2, 630–638. [Google Scholar] [CrossRef] [PubMed]
- Wegner, K.D.; Hildebrandt, N. Quantum dots: Bright and versatile in vitro and in vivo fluorescence imaging biosensors. Chem. Soc. Rev. 2015, 44, 4792–4834. [Google Scholar] [CrossRef] [PubMed]
- Biju, V. Chemical modifications and bioconjugate reactions of nanomaterials for sensing, imaging, drug delivery and therapy. Chem. Soc. Rev. 2014, 43, 744–764. [Google Scholar] [CrossRef] [PubMed]
- Delehanty, J.B.; Mattoussi, H.; Medintz, I.L. Delivering quantum dots into cells: Strategies, progress and remaining issues. Anal. Bioanal. Chem. 2009, 393, 1091–1105. [Google Scholar] [CrossRef] [PubMed]
- McNamara, George GEOMCNAMARA. Available online: http://www.geomcnamara.com/fluorophore-table (accessed on 24 April 2018).
- McNamara, George GEOMCNAMARA. Available online: http://www.geomcnamara.com/fluorescent-proteins-photophysics-data (accessed on 24 April 2018).
- Cserép, G.B.; Herner, A.; Kele, P. Bioorthogonal fluorescent labels: A review on combined forces. Methods Appl. Fluoresc. 2015, 3, 042001. [Google Scholar] [CrossRef] [PubMed]
- Geertsema, H.J.; Schulte, A.C.; Spenkelink, L.M.; McGrath, W.J.; Morrone, S.R.; Sohn, J.; Mangel, W.F.; Robinson, A.; van Oijen, A.M. Single-Molecule Imaging at High Fluorophore Concentrations by Local Activation of Dye. Biophys. J. 2015, 108, 949–956. [Google Scholar] [CrossRef] [PubMed]
- Fink, C.; Morgan, F.; Loew, L.M. Intracellular Fluorescent Probe Concentrations by Confocal Microscopy. Biophys. J. 1998, 75, 1648–1658. [Google Scholar] [CrossRef]
- Rahnel, H.; Viht, K.; Lavogina, D.; Mazina, O.; Haljasorg, T.; Enkvist, E.; Uri, A. A Selective Biligand Inhibitor of CK2 Increases Caspase-3 Activity in Cancer Cells and Inhibits Platelet Aggregation. ChemMedChem 2017, 12, 1723–1736. [Google Scholar] [CrossRef] [PubMed]
- Kriisa, M.; Sinijärv, H.; Vaasa, A.; Enkvist, E.; Kostenko, S.; Moens, U.; Uri, A. Inhibition of CREB Phosphorylation by Conjugates of Adenosine Analogues and Arginine-Rich Peptides, Inhibitors of PKA Catalytic Subunit. ChemBioChem 2015, 16, 312–319. [Google Scholar] [CrossRef] [PubMed]
- Felber, L.M.; Cloutier, S.M.; Kündig, C.; Kishi, T.; Brossard, V.; Jichlinski, P.; Leisinger, H.-J.; Deperthes, D. Evaluation of the CFP-substrate-YFP system for protease studies: Advantages and limitations. Proteom. Technol. 2004, 36, 878–885. [Google Scholar]
- Morikawa, T.J.; Fujita, H.; Kitamura, A.; Horio, T.; Yamamoto, J.; Kinjo, M.; Sasaki, A.; Machiyama, H.; Yoshizawa, K.; Ichimura, T.; et al. Dependence of fluorescent protein brightness on protein concentration in solution and enhancement of it. Sci. Rep. 2016, 6. [Google Scholar] [CrossRef] [PubMed]
- Lakowicz, J.R. Principles of Fluorescence Spectroscopy, 3rd ed.; Springer: Berlin, Germany, 2006; ISBN 978-0-387-46312-4. [Google Scholar]
- Barbero, N.; Barni, E.; Barolo, C.; Quagliotto, P.; Viscardi, G.; Napione, L.; Pavan, S.; Bussolino, F. A study of the interaction between fluorescein sodium salt and bovine serum albumin by steady-state fluorescence. Dyes Pigments 2009, 80, 307–313. [Google Scholar] [CrossRef]
- Hitosugi, T.; Sato, M.; Sasaki, K.; Umezawa, Y. Lipid Raft Specific Knockdown of Src Family Kinase Activity Inhibits Cell Adhesion and Cell Cycle Progression of Breast Cancer Cells. Cancer Res. 2007, 67, 8139–8148. [Google Scholar] [CrossRef] [PubMed]
- Axelrod, D. Total Internal Reflection Fluorescence Microscopy in Cell Biology: Total Internal Reflection Fluorescence. Traffic 2001, 2, 764–774. [Google Scholar] [CrossRef] [PubMed]
- Becker, W. Fluorescence lifetime imaging—Techniques and applications: Fluorescence Lifetime Imaging. J. Microsc. 2012, 247, 119–136. [Google Scholar] [CrossRef] [PubMed]
- Mérola, F.; Fredj, A.; Betolngar, D.-B.; Ziegler, C.; Erard, M.; Pasquier, H. Newly engineered cyan fluorescent proteins with enhanced performances for live cell FRET imaging. Biotechnol. J. 2014, 9, 180–191. [Google Scholar] [CrossRef] [PubMed]
- Nie, H.; Yang, W.; Yang, M.; Jing, J.; Zhang, X. Highly specific and ratiometric fluorescent probe for ozone assay in indoor air and living cells. Dyes Pigments 2016, 127, 67–72. [Google Scholar] [CrossRef]
- Bajar, B.; Wang, E.; Zhang, S.; Lin, M.; Chu, J. A Guide to Fluorescent Protein FRET Pairs. Sensors 2016, 16, 1488. [Google Scholar] [CrossRef] [PubMed]
- Zaccolo, M.; De Giorgi, F.; Cho, C.Y.; Feng, L.; Knapp, T.; Negulescu, P.A.; Taylor, S.S.; Tsien, R.Y.; Pozzan, T. A genetically encoded, fluorescent indicator for cyclic AMP in living cells. Nat. Cell Biol. 2000, 2, 25–29. [Google Scholar] [CrossRef] [PubMed]
- Biener-Ramanujan, E.; Ramanujan, V.K.; Herman, B.; Gertler, A. Spatio-temporal kinetics of growth hormone receptor signaling in single cells using FRET microscopy. Growth Horm. IGF Res. 2006, 16, 247–257. [Google Scholar] [CrossRef] [PubMed]
- Koschut, D.; Richert, L.; Pace, G.; Niemann, H.H.; Mély, Y.; Orian-Rousseau, V. Live cell imaging shows hepatocyte growth factor-induced Met dimerization. Biochim. Biophys. Acta 2016, 1863, 1552–1558. [Google Scholar] [CrossRef] [PubMed]
- Herbst, K.J.; Allen, M.D.; Zhang, J. Luminescent Kinase Activity Biosensors Based on a Versatile Bimolecular Switch. J. Am. Chem. Soc. 2011, 133, 5676–5679. [Google Scholar] [CrossRef] [PubMed]
- Goedhart, J.; van Weeren, L.; Adjobo-Hermans, M.J.W.; Elzenaar, I.; Hink, M.A.; Gadella, T.W.J. Quantitative Co-Expression of Proteins at the Single Cell Level—Application to a Multimeric FRET Sensor. PLoS ONE 2011, 6, e27321. [Google Scholar] [CrossRef] [PubMed]
- Ganesan, S.; Ameer-beg, S.M.; Ng, T.T.C.; Vojnovic, B.; Wouters, F.S. A dark yellow fluorescent protein (YFP)-based Resonance Energy-Accepting Chromoprotein (REACh) for Forster resonance energy transfer with GFP. Proc. Natl. Acad. Sci. USA 2006, 103, 4089–4094. [Google Scholar] [CrossRef] [PubMed]
- Lee, S.-J.R.; Escobedo-Lozoya, Y.; Szatmari, E.M.; Yasuda, R. Activation of CaMKII in single dendritic spines during long-term potentiation. Nature 2009, 458, 299–304. [Google Scholar] [CrossRef] [PubMed]
- Vaasa, A.; Ligi, K.; Mohandessi, S.; Enkvist, E.; Uri, A.; Miller, L.W. Time-gated luminescence microscopy with responsive nonmetal probes for mapping activity of protein kinases in living cells. Chem. Commun. 2012, 48, 8595. [Google Scholar] [CrossRef] [PubMed]
- Dickson, R.M.; Cubitt, A.B.; Tsien, R.Y.; Moerner, W.E. On/off blinking and switching behaviour of single molecules of green fluorescent protein. Nature 1997, 388, 355–358. [Google Scholar] [CrossRef] [PubMed]
- Bourgeois, D.; Adam, V. Reversible photoswitching in fluorescent proteins: A mechanistic view. IUBMB Life 2012, 64, 482–491. [Google Scholar] [CrossRef] [PubMed]
- Mo, G.C.H.; Ross, B.; Hertel, F.; Manna, P.; Yang, X.; Greenwald, E.; Booth, C.; Plummer, A.M.; Tenner, B.; Chen, Z.; et al. Genetically encoded biosensors for visualizing live-cell biochemical activity at super-resolution. Nat. Methods 2017, 14, 427–434. [Google Scholar] [CrossRef] [PubMed]
- Sahl, S.J.; Hell, S.W.; Jakobs, S. Fluorescence nanoscopy in cell biology. Nat. Rev. Mol. Cell Biol. 2017, 18, 685–701. [Google Scholar] [CrossRef] [PubMed]
- Jones, S.A.; Shim, S.-H.; He, J.; Zhuang, X. Fast, three-dimensional super-resolution imaging of live cells. Nat. Methods 2011, 8, 499–505. [Google Scholar] [CrossRef] [PubMed]
- Winckler, P.; Lartigue, L.; Giannone, G.; De Giorgi, F.; Ichas, F.; Sibarita, J.-B.; Lounis, B.; Cognet, L. Identification and super-resolution imaging of ligand-activated receptor dimers in live cells. Sci. Rep. 2013, 3. [Google Scholar] [CrossRef] [PubMed]
- Agnes, R.S.; Broome, A.-M.; Wang, J.; Verma, A.; Lavik, K.; Basilion, J.P. An Optical Probe for Noninvasive Molecular Imaging of Orthotopic Brain Tumors Overexpressing Epidermal Growth Factor Receptor. Mol. Cancer Ther. 2012, 11, 2202–2211. [Google Scholar] [CrossRef] [PubMed]
- Ardeshirpour, Y.; Chernomordik, V.; Zielinski, R.; Capala, J.; Griffiths, G.; Vasalatiy, O.; Smirnov, A.V.; Knutson, J.R.; Lyakhov, I.; Achilefu, S.; et al. In Vivo Fluorescence Lifetime Imaging Monitors Binding of Specific Probes to Cancer Biomarkers. PLoS ONE 2012, 7, e31881. [Google Scholar] [CrossRef] [PubMed]
- Rizvi, S.; Rouhi, S.; Taniguchi, S.; Yang, S.Y.; Green, M.; Keshtgar, M.; Seifalian, A. Near-infrared quantum dots for HER2 localization and imaging of cancer cells. Int. J. Nanomed. 2014. [Google Scholar] [CrossRef]
- Mahalingam, S.M.; Dudkin, V.Y.; Goldberg, S.; Klein, D.; Yi, F.; Singhal, S.; O’Neil, K.T.; Low, P.S. Evaluation of a Centyrin-Based Near-Infrared Probe for Fluorescence-Guided Surgery of Epidermal Growth Factor Receptor Positive Tumors. Bioconjug. Chem. 2017, 28, 2865–2873. [Google Scholar] [CrossRef] [PubMed]
- Hou, J.-T.; Ko, K.-P.; Shi, H.; Ren, W.X.; Verwilst, P.; Koo, S.; Lee, J.Y.; Chi, S.-G.; Kim, J.S. PLK1-Targeted Fluorescent Tumor Imaging with High Signal-to-Background Ratio. ACS Sens. 2017, 2, 1512–1516. [Google Scholar] [CrossRef] [PubMed]
- Miller, M.A.; Kim, E.; Cuccarese, M.F.; Plotkin, A.L.; Prytyskach, M.; Kohler, R.H.; Pittet, M.J.; Weissleder, R. Near infrared imaging of Mer tyrosine kinase (MERTK) using MERi-SiR reveals tumor associated macrophage uptake in metastatic disease. Chem. Commun. 2018, 54, 42–45. [Google Scholar] [CrossRef] [PubMed]
- Helmchen, F.; Denk, W. Deep tissue two-photon microscopy. Nat. Methods 2005, 2, 932–940. [Google Scholar] [CrossRef] [PubMed]
- Miller, D.R.; Jarrett, J.W.; Hassan, A.M.; Dunn, A.K. Deep tissue imaging with multiphoton fluorescence microscopy. Curr. Opin. Biomed. Eng. 2017, 4, 32–39. [Google Scholar] [CrossRef] [PubMed]
- Thorne, N.; Inglese, J.; Auld, D.S. Illuminating Insights into Firefly Luciferase and Other Bioluminescent Reporters Used in Chemical Biology. Chem. Biol. 2010, 17, 646–657. [Google Scholar] [CrossRef] [PubMed]
- Qu, X.; Rowe, L.; Dikici, E.; Ensor, M.; Daunert, S. Aequorin mutants with increased thermostability. Anal. Bioanal. Chem. 2014, 406, 5639–5643. [Google Scholar] [CrossRef] [PubMed]
- Inouye, S.; Shimomura, O. The use of Renilla luciferase, Oplophorus luciferase, and apoaequorin as bioluminescent reporter protein in the presence of coelenterazine analogues as substrate. Biochem. Biophys. Res. Commun. 1997, 233, 349–353. [Google Scholar] [CrossRef] [PubMed]
- Nyati, S.; Schinske, K.; Ray, D.; Nyati, M.; Ross, B.D.; Rehemtulla, A. Molecular Imaging of TGF -Induced Smad2/3 Phosphorylation Reveals a Role for Receptor Tyrosine Kinases in Modulating TGF Signaling. Clin. Cancer Res. 2011, 17, 7424–7439. [Google Scholar] [CrossRef] [PubMed]
- Hall, M.P.; Unch, J.; Binkowski, B.F.; Valley, M.P.; Butler, B.L.; Wood, M.G.; Otto, P.; Zimmerman, K.; Vidugiris, G.; Machleidt, T.; et al. Engineered Luciferase Reporter from a Deep Sea Shrimp Utilizing a Novel Imidazopyrazinone Substrate. ACS Chem. Biol. 2012, 7, 1848–1857. [Google Scholar] [CrossRef] [PubMed]
- Robers, M.B.; Dart, M.L.; Woodroofe, C.C.; Zimprich, C.A.; Kirkland, T.A.; Machleidt, T.; Kupcho, K.R.; Levin, S.; Hartnett, J.R.; Zimmerman, K.; et al. Target engagement and drug residence time can be observed in living cells with BRET. Nat. Comm. 2015, 6. [Google Scholar] [CrossRef] [PubMed]
- Vasta, J.D.; Corona, C.R.; Wilkinson, J.; Zimprich, C.A.; Hartnett, J.R.; Ingold, M.R.; Zimmerman, K.; Machleidt, T.; Kirkland, T.A.; Huwiler, K.G.; et al. Quantitative, Wide-Spectrum Kinase Profiling in Live Cells for Assessing the Effect of Cellular ATP on Target Engagement. Cell Chem. Biol. 2018, 25. [Google Scholar] [CrossRef] [PubMed]
- González-Vera, J.; Morris, M. Fluorescent Reporters and Biosensors for Probing the Dynamic Behavior of Protein Kinases. Proteomes 2015, 3, 369–410. [Google Scholar] [CrossRef] [PubMed]
- Oldach, L.; Zhang, J. Genetically Encoded Fluorescent Biosensors for Live-Cell Visualization of Protein Phosphorylation. Chem. Biol. 2014, 21, 186–197. [Google Scholar] [CrossRef] [PubMed]
- Tarrant, M.K.; Cole, P.A. The Chemical Biology of Protein Phosphorylation. Annu. Rev. Biochem. 2009, 78, 797–825. [Google Scholar] [CrossRef] [PubMed]
- Ni, Q.; Titov, D.; Zhang, J. Analyzing protein kinase dynamics in living cells with FRET reporters. Methods 2006, 40, 279–286. [Google Scholar] [CrossRef] [PubMed]
- Antal, C.E.; Newton, A.C. Spatiotemporal Dynamics of Phosphorylation in Lipid Second Messenger Signaling. Mol. Cell. Proteom. 2013, 12, 3498–3508. [Google Scholar] [CrossRef] [PubMed]
- Zhang, J.; Allen, M.D. FRET-based biosensors for protein kinases: Illuminating the kinome. Mol. BioSyst. 2007, 3, 759–765. [Google Scholar] [CrossRef] [PubMed]
- Aoki, K.; Kiyokawa, E.; Nakamura, T.; Matsuda, M. Visualization of growth signal transduction cascades in living cells with genetically encoded probes based on Forster resonance energy transfer. Philos. Trans. R. Soc. B 2008, 363, 2143–2151. [Google Scholar] [CrossRef] [PubMed]
- Lawrence, D.S.; Wang, Q. Seeing Is Believing: Peptide-Based Fluorescent Sensors of Protein Tyrosine Kinase Activity. ChemBioChem 2007, 8, 373–378. [Google Scholar] [CrossRef] [PubMed]
- Nagai, Y.; Miyazaki, M.; Aoki, R.; Zama, T.; Inouye, S.; Hirose, K.; Iino, M.; Hagiwara, M. A fluorescent indicator for visualizing cAMP-induced phosphorylation in vivo. Nat. Biotechnol. 2000, 18, 313–316. [Google Scholar] [CrossRef] [PubMed]
- Zhang, J.; Ma, Y.; Taylor, S.S.; Tsien, R.Y. Genetically encoded reporters of protein kinase A activity reveal impact of substrate tethering. Proc. Natl. Acad. Sci. USA 2001, 98, 14997–15002. [Google Scholar] [CrossRef] [PubMed]
- Manning, G.; Whyte, D.B.; Martinez, R.; Hunter, T.; Sudarsanam, S. The Protein Kinase Complement of the Human Genome. Science 2002, 298, 1912–1934. [Google Scholar] [CrossRef] [PubMed]
- Eid, S.; Fulle, S. KinMap. Available online: http://www.kinhub.org/kinmap/index.html (accessed on 24 April 2018).
- Romoser, V.A.; Hinkle, P.M.; Persechini, A. Detection in Living Cells of Ca2+-dependent Changes in the Fluorescence Emission of an Indicator Composed of Two Green Fluorescent Protein Variants Linked by a Calmodulin-binding Sequence. J. Biol. Chem. 1997, 272, 13270–13274. [Google Scholar] [CrossRef] [PubMed]
- Miyawaki, A.; Llopis, J.; Heim, R.; McCaffery, J.M.; Adams, J.A.; Ikura, M.; Tsien, R.Y. Fluorescent indicators for Ca2+ based on green fluorescent proteins and calmodulin. Nature 1997, 388, 882–887. [Google Scholar] [CrossRef] [PubMed]
- Kurokawa, K.; Mochizuki, N.; Ohba, Y.; Mizuno, H.; Miyawaki, A.; Matsuda, M. A Pair of Fluorescent Resonance Energy Transfer-based Probes for Tyrosine Phosphorylation of the CrkII Adaptor Protein in Vivo. J. Biol. Chem. 2001, 276, 31305–31310. [Google Scholar] [CrossRef] [PubMed]
- VanEngelenburg, S.B.; Palmer, A.E. Fluorescent biosensors of protein function. Curr. Opin. Chem. Biol. 2008, 12, 60–65. [Google Scholar] [CrossRef] [PubMed]
- Ting, A.Y.; Kain, K.H.; Klemke, R.L.; Tsien, R.Y. Genetically encoded fluorescent reporters of protein tyrosine kinase activities in living cells. Proc. Natl. Acad. Sci. USA 2001, 98, 15003–15008. [Google Scholar] [CrossRef] [PubMed]
- Sato, M.; Ozawa, T.; Inukai, K.; Asano, T.; Umezawa, Y. Fluorescent Indicators for Imaging Protein Phosphorylation in Single Living Cells. Nat. Biotechnol. 2002, 20, 287–294. [Google Scholar] [CrossRef] [PubMed]
- Seong, J.; Ouyang, M.; Kim, T.; Sun, J.; Wen, P.-C.; Lu, S.; Zhuo, Y.; Llewellyn, N.M.; Schlaepfer, D.D.; Guan, J.-L.; et al. Detection of focal adhesion kinase activation at membrane microdomains by fluorescence resonance energy transfer. Nat. Commun. 2011, 2, 406. [Google Scholar] [CrossRef] [PubMed]
- Xiang, X.; Sun, J.; Wu, J.; He, H.-T.; Wang, Y.; Zhu, C. A FRET-Based Biosensor for Imaging SYK Activities in Living Cells. Cell. Mol. Bioeng. 2011, 4, 670–677. [Google Scholar] [CrossRef] [PubMed]
- Randriamampita, C.; Mouchacca, P.; Malissen, B.; Marguet, D.; Trautmann, A.; Lellouch, A.C. A Novel ZAP-70 Dependent FRET Based Biosensor Reveals Kinase Activity at both the Immunological Synapse and the Antisynapse. PLoS ONE 2008, 3, e1521. [Google Scholar] [CrossRef] [PubMed]
- Allen, M.D.; Zhang, J. Subcellular dynamics of protein kinase a activity visualized by FRET-based reporters. Biochem. Biophys. Res. Commun. 2006, 348, 716–721. [Google Scholar] [CrossRef] [PubMed]
- Kunkel, M.T.; Ni, Q.; Tsien, R.Y.; Zhang, J.; Newton, A.C. Spatio-temporal Dynamics of Protein Kinase B/Akt Signaling Revealed by a Genetically Encoded Fluorescent Reporter. J. Biol. Chem. 2005, 280, 5581–5587. [Google Scholar] [CrossRef] [PubMed]
- Gao, X.; Zhang, J. Spatiotemporal Analysis of Differential Akt Regulation in Plasma Membrane Microdomains. Mol. Biol. Cell 2008, 19, 4366–4373. [Google Scholar] [CrossRef] [PubMed]
- Sasaki, K.; Sato, M.; Umezawa, Y. Fluorescent Indicators for Akt/Protein Kinase B and Dynamics of Akt Activity Visualized in Living Cells. J. Biol. Chem. 2003, 278, 30945–30951. [Google Scholar] [CrossRef] [PubMed]
- Tsou, P.; Zheng, B.; Hsu, C.-H.; Sasaki, A.T.; Cantley, L.C. A Fluorescent Reporter of AMPK Activity and Cellular Energy Stress. Cell Metab. 2011, 13, 476–486. [Google Scholar] [CrossRef] [PubMed]
- Konagaya, Y.; Terai, K.; Hirao, Y.; Takakura, K.; Imajo, M.; Kamioka, Y.; Sasaoka, N.; Kakizuka, A.; Sumiyama, K.; Asano, T.; et al. A Highly Sensitive FRET Biosensor for AMPK Exhibits Heterogeneous AMPK Responses among Cells and Organs. Cell Rep. 2017, 21, 2628–2638. [Google Scholar] [CrossRef] [PubMed]
- Fosbrink, M.; Aye-Han, N.-N.; Cheong, R.; Levchenko, A.; Zhang, J. Visualization of JNK activity dynamics with a genetically encoded fluorescent biosensor. Proc. Natl. Acad. Sci. USA 2010, 107, 5459–5464. [Google Scholar] [CrossRef] [PubMed]
- Gallegos, L.L.; Kunkel, M.T.; Newton, A.C. Targeting Protein Kinase C Activity Reporter to Discrete Intracellular Regions Reveals Spatiotemporal Differences in Agonist-dependent Signaling. J. Biol. Chem. 2006, 281, 30947–30956. [Google Scholar] [CrossRef] [PubMed]
- Kunkel, M.T.; Newton, A.C. Imaging Kinase Activity at Protein Scaffolds. Methods Mol. Biol. 2014, 1071, 129–137. [Google Scholar] [CrossRef] [PubMed]
- Harvey, C.D.; Ehrhardt, A.G.; Cellurale, C.; Zhong, H.; Yasuda, R.; Davis, R.J.; Svoboda, K. A genetically encoded fluorescent sensor of ERK activity. Proc. Natl. Acad. Sci. USA 2008, 105, 19264–19269. [Google Scholar] [CrossRef] [PubMed]
- Sato, M.; Kawai, Y.; Umezawa, Y. Genetically Encoded Fluorescent Indicators To Visualize Protein Phosphorylation by Extracellular Signal-Regulated Kinase in Single Living Cells. Anal. Chem. 2007, 79, 2570–2575. [Google Scholar] [CrossRef] [PubMed]
- Hukasova, E.; Silva Cascales, H.; Kumar, S.R.; Lindqvist, A. Monitoring Kinase and Phosphatase Activities Through the Cell Cycle by Ratiometric FRET. J. Vis. Exp. 2012. [Google Scholar] [CrossRef] [PubMed]
- Johnson, S.A.; You, Z.; Hunter, T. Monitoring ATM kinase activity in living cells. DNA Repair 2007, 6, 1277–1284. [Google Scholar] [CrossRef] [PubMed]
- Lin, C.-W.; Ting, A.Y. A Genetically Encoded Fluorescent Reporter of Histone Phosphorylation in Living Cells. Angew. Chem. Int. Ed. 2004, 43, 2940–2943. [Google Scholar] [CrossRef] [PubMed]
- Gavet, O.; Pines, J. Progressive Activation of CyclinB1-Cdk1 Coordinates Entry to Mitosis. Dev. Cell 2010, 18, 533–543. [Google Scholar] [CrossRef] [PubMed]
- Fuller, B.G.; Lampson, M.A.; Foley, E.A.; Rosasco-Nitcher, S.; Le, K.V.; Tobelmann, P.; Brautigan, D.L.; Stukenberg, P.T.; Kapoor, T.M. Midzone activation of aurora B in anaphase produces an intracellular phosphorylation gradient. Nature 2008, 453, 1132–1136. [Google Scholar] [CrossRef] [PubMed]
- Macůrek, L.; Lindqvist, A.; Lim, D.; Lampson, M.A.; Klompmaker, R.; Freire, R.; Clouin, C.; Taylor, S.S.; Yaffe, M.B.; Medema, R.H. Polo-like kinase-1 is activated by aurora A to promote checkpoint recovery. Nature 2008, 455, 119–123. [Google Scholar] [CrossRef] [PubMed]
- Tomida, T.; Takekawa, M.; O’Grady, P.; Saito, H. Stimulus-Specific Distinctions in Spatial and Temporal Dynamics of Stress-Activated Protein Kinase Kinase Kinases Revealed by a Fluorescence Resonance Energy Transfer Biosensor. Mol. Cell. Biol. 2009, 29, 6117–6127. [Google Scholar] [CrossRef] [PubMed]
- Timm, T.; von Kries, J.P.; Li, X.; Zempel, H.; Mandelkow, E.; Mandelkow, E.-M. Microtubule Affinity Regulating Kinase Activity in Living Neurons Was Examined by a Genetically Encoded Fluorescence Resonance Energy Transfer/Fluorescence Lifetime Imaging-based Biosensor. J. Biol. Chem. 2011, 286, 41711–41722. [Google Scholar] [CrossRef] [PubMed]
- Kamioka, Y.; Sumiyama, K.; Mizuno, R.; Matsuda, M. Live imaging of transgenic mice expressing FRET biosensors. Conf. Proc. IEEE Eng. Med. Biol. Soc. 2013, 2013, 125–128. [Google Scholar] [PubMed]
- Hiratsuka, T.; Fujita, Y.; Naoki, H.; Aoki, K.; Kamioka, Y.; Matsuda, M. Intercellular propagation of extracellular signal-regulated kinase activation revealed by in vivo imaging of mouse skin. eLife 2015, 4. [Google Scholar] [CrossRef] [PubMed] [Green Version]
- Williams, T.M.; Nyati, S.; Ross, B.D.; Rehemtulla, A. Molecular Imaging of the ATM Kinase Activity. Int. J. Radiat. Oncol. Biol. Phys. 2013, 86, 969–977. [Google Scholar] [CrossRef] [PubMed]
- Zhang, L.; Lee, K.C.; Bhojani, M.S.; Khan, A.P.; Shilman, A.; Holland, E.C.; Ross, B.D.; Rehemtulla, A. Molecular imaging of Akt kinase activity. Nat. Med. 2007, 13, 1114–1119. [Google Scholar] [CrossRef] [PubMed]
- Post, P.L.; DeBiasio, R.L.; Taylor, D.L. A fluorescent protein biosensor of myosin II regulatory light chain phosphorylation reports a gradient of phosphorylated myosin II in migrating cells. Mol. Biol. Cell 1995, 6, 1755–1768. [Google Scholar] [CrossRef] [PubMed]
- Van, T.N.N.; Pellerano, M.; Lykaso, S.; Morris, M.C. Fluorescent Protein Biosensor for Probing CDK/Cyclin Activity in vitro and in Living Cells. ChemBioChem 2014, 15, 2298–2305. [Google Scholar] [CrossRef] [PubMed]
- Damayanti, N.P.; Parker, L.L.; Irudayaraj, J.M.K. Fluorescence Lifetime Imaging of Biosensor Peptide Phosphorylation in Single Live Cells. Angew. Chem. Int. Ed. 2013, 52, 3931–3934. [Google Scholar] [CrossRef] [PubMed]
- Damayanti, N.P.; Buno, K.; Cui, Y.; Voytik-Harbin, S.L.; Pili, R.; Freeman, J.; Irudayaraj, J.M.K. Real-Time Multiplex Kinase Phosphorylation Sensors in Living Cells. ACS Sens. 2017, 2, 1225–1230. [Google Scholar] [CrossRef] [PubMed]
- Lindgren, M.E.; Hällbrink, M.M.; Elmquist, A.M.; Langel, Ü. Passage of cell-penetrating peptides across a human epithelial cell layer in vitro. Biochem. J. 2004, 377, 69–76. [Google Scholar] [CrossRef] [PubMed]
- Higashi, H.; Sato, K.; Ohtake, A.; Omori, A.; Yoshida, S.; Kudo, Y. Imaging of cAMP-dependent protein kinase activity in living neural cells using a novel fluorescent substrate. FEBS Lett. 1997, 414, 55–60. [Google Scholar] [CrossRef]
- Yeh, R.H.; Yan, X.; Cammer, M.; Bresnick, A.R.; Lawrence, D.S. Real Time Visualization of Protein Kinase Activity in Living Cells. J. Biol. Chem. 2002, 277, 11527–11532. [Google Scholar] [CrossRef] [PubMed]
- Dai, Z.; Dulyaninova, N.G.; Kumar, S.; Bresnick, A.R.; Lawrence, D.S. Visual Snapshots of Intracellular Kinase Activity at the Onset of Mitosis. Chem. Biol. 2007, 14, 1254–1260. [Google Scholar] [CrossRef] [PubMed]
- Wang, Q.; Dai, Z.; Cahill, S.M.; Blumenstein, M.; Lawrence, D.S. Light-Regulated Sampling of Protein Tyrosine Kinase Activity. J. Am. Chem. Soc. 2006, 128, 14016–14017. [Google Scholar] [CrossRef] [PubMed]
- Oien, N.P.; Nguyen, L.T.; Jernigan, F.E.; Priestman, M.A.; Lawrence, D.S. Long-Wavelength Fluorescent Reporters for Monitoring Protein Kinase Activity. Angew. Chem. Int. Ed. 2014, 53, 3975–3978. [Google Scholar] [CrossRef] [PubMed]
- Veldhuyzen, W.F.; Nguyen, Q.; McMaster, G.; Lawrence, D.S. A Light-Activated Probe of Intracellular Protein Kinase Activity. J. Am. Chem. Soc. 2003, 125, 13358–13359. [Google Scholar] [CrossRef] [PubMed]
- Aujard, I.; Benbrahim, C.; Gouget, M.; Ruel, O.; Baudin, J.B.; Neveu, P.; Jullien, L. o-nitrobenzyl photolabile protecting groups with red-shifted absorption: Syntheses and uncaging cross-sections for one- and two-photon excitation. Chemistry 2006, 12, 6865–6879. [Google Scholar] [CrossRef] [PubMed]
- Hammer, C.A.; Falahati, K.; Jakob, A.; Klimek, R.; Burghardt, I.; Heckel, A.; Wachtveitl, J. Sensitized Two-Photon Activation of Coumarin Photocages. J. Phys. Chem. Lett. 2018, 9, 1448–1453. [Google Scholar] [CrossRef] [PubMed]
- Regot, S.; Hughey, J.J.; Bajar, B.T.; Carrasco, S.; Covert, M.W. High-Sensitivity Measurements of Multiple Kinase Activities in Live Single Cells. Cell 2014, 157, 1724–1734. [Google Scholar] [CrossRef] [PubMed]
- Kudo, T.; Jeknić, S.; Macklin, D.N.; Akhter, S.; Hughey, J.J.; Regot, S.; Covert, M.W. Live-cell measurements of kinase activity in single cells using translocation reporters. Nat. Protoc. 2017, 13, 155–169. [Google Scholar] [CrossRef] [PubMed]
- Brunet, A.; Bonni, A.; Zigmond, M.J.; Lin, M.Z.; Juo, P.; Hu, L.S.; Anderson, M.J.; Arden, K.C.; Blenis, J.; Greenberg, M.E. Akt Promotes Cell Survival by Phosphorylating and Inhibiting a Forkhead Transcription Factor. Cell 1999, 96, 857–868. [Google Scholar] [CrossRef]
- Hung, Y.P. Single Cell Imaging of Metabolism with Fluorescent Biosensors; Harvard University: Cambridge, MA, USA, 2012. [Google Scholar]
- Gross, S.M.; Rotwein, P. Akt signaling dynamics in individual cells. J. Cell Sci. 2015, 128, 2509–2519. [Google Scholar] [CrossRef] [PubMed]
- Gross, S.M.; Rotwein, P. Mapping growth-factor-modulated Akt signaling dynamics. J. Cell Sci. 2016, 129, 2052–2063. [Google Scholar] [CrossRef] [PubMed]
- Maryu, G.; Matsuda, M.; Aoki, K. Multiplexed Fluorescence Imaging of ERK and Akt Activities and Cell-cycle Progression. Cell Struct. Funct. 2016, 41, 81–92. [Google Scholar] [CrossRef] [PubMed]
- Giuliano, K.A.; Chen, Y.-T.; Haskins, J.R. Fluorescent protein biosensors. Mod. Drug Discov. 2003, 6, 33–37. [Google Scholar]
- Hahn, A.T.; Jones, J.T.; Meyer, T. Quantitative analysis of cell cycle phase durations and PC12 differentiation using fluorescent biosensors. Cell Cycle 2009, 8, 1044–1052. [Google Scholar] [CrossRef] [PubMed]
- Spencer, S.L.; Cappell, S.D.; Tsai, F.-C.; Overton, K.W.; Wang, C.L.; Meyer, T. The Proliferation-Quiescence Decision Is Controlled by a Bifurcation in CDK2 Activity at Mitotic Exit. Cell 2013, 155, 369–383. [Google Scholar] [CrossRef] [PubMed]
- Sample, V.; Ni, Q.; Mehta, S.; Inoue, T.; Zhang, J. Controlling Enzymatic Action in Living Cells with a Kinase-Inducible Bimolecular Switch. ACS Chem. Biol. 2013, 8, 116–121. [Google Scholar] [CrossRef] [PubMed]
- Milanole, G.; Gao, B.; Paoletti, A.; Pieters, G.; Dugave, C.; Deutsch, E.; Rivera, S.; Law, F.; Perfettini, J.-L.; Mari, E.; et al. Bimodal fluorescence/ 129 Xe NMR probe for molecular imaging and biological inhibition of EGFR in Non-Small Cell Lung Cancer. Bioorg. Med. Chem. 2017, 25, 6653–6660. [Google Scholar] [CrossRef] [PubMed]
- Jiao, Y.; Yin, J.; Haiyang, H.; Peng, X.; Gao, Q.; Duan, C. Conformationally Induced Off−On Cell Membrane Chemosensor Targeting Receptor Protein-Tyrosine Kinases for in Vivo and in Vitro Fluorescence Imaging of Cancers. J. Am. Chem. Soc. 2018. [Google Scholar] [CrossRef] [PubMed]
- Roskoski, R. Classification of small molecule protein kinase inhibitors based upon the structures of their drug-enzyme complexes. Pharmacol. Res. 2016, 103, 26–48. [Google Scholar] [CrossRef] [PubMed]
- Zhang, J.; Yang, P.L.; Gray, N.S. Targeting cancer with small molecule kinase inhibitors. Nat. Rev. Cancer 2009, 9, 28–39. [Google Scholar] [CrossRef] [PubMed]
- Ivan, T.; Enkvist, E.; Sinijarv, H.; Uri, A. Competitive ligands facilitate dissociation of the complex of bifunctional inhibitor and protein kinase. Biophys. Chem. 2017, 228, 17–24. [Google Scholar] [CrossRef] [PubMed]
- Kestav, K.; Viht, K.; Konovalov, A.; Enkvist, E.; Uri, A.; Lavogina, D. Slowly on, Slowly off: Bisubstrate-Analogue Conjugates of 5-Iodotubercidin and Histone H3 Peptide Targeting Protein Kinase Haspin. ChemBioChem 2017, 18, 790–798. [Google Scholar] [CrossRef] [PubMed]
- Vaasa, A.; Lust, M.; Terrin, A.; Uri, A.; Zaccolo, M. Small-molecule FRET probes for protein kinase activity monitoring in living cells. Biochem. Biophys. Res. Commun. 2010, 397, 750–755. [Google Scholar] [CrossRef] [PubMed]
- Kamkaew, A.; Burgess, K. Double-Targeting Using a TrkC Ligand Conjugated to Dipyrrometheneboron Difluoride (BODIPY) Based Photodynamic Therapy (PDT) Agent. J. Med. Chem. 2013, 56, 7608–7614. [Google Scholar] [CrossRef] [PubMed]
- Ko, E.; Kamkaew, A.; Burgess, K. Small Molecule Ligands for Active Targeting of TrkC-Expressing Tumor Cells. ACS Med. Chem. Lett. 2012, 3, 1008–1012. [Google Scholar] [CrossRef] [PubMed]
- Kurzawa, L.; Pellerano, M.; Coppolani, J.B.; Morris, M.C. Fluorescent Peptide Biosensor for Probing the Relative Abundance of Cyclin-Dependent Kinases in Living Cells. PLoS ONE 2011, 6, e26555. [Google Scholar] [CrossRef] [PubMed]
- Viht, K.; Saaver, S.; Vahter, J.; Enkvist, E.; Lavogina, D.; Sinijärv, H.; Raidaru, G.; Guerra, B.; Issinger, O.-G.; Uri, A. Acetoxymethyl Ester of Tetrabromobenzimidazole–Peptoid Conjugate for Inhibition of Protein Kinase CK2 in Living Cells. Bioconjug. Chem. 2015, 26, 2324–2335. [Google Scholar] [CrossRef] [PubMed]
- Vetter, M.L.; Zhang, Z.; Liu, S.; Wang, J.; Cho, H.; Zhang, J.; Zhang, W.; Gray, N.S.; Yang, P.L. Fluorescent Visualization of Src by Using Dasatinib-BODIPY. ChemBioChem 2014, 15, 1317–1324. [Google Scholar] [CrossRef] [PubMed]
- Budin, G.; Yang, K.S.; Reiner, T.; Weissleder, R. Bioorthogonal Probes for Polo-like Kinase 1 Imaging and Quantification. Angew. Chem. Int. Ed. 2011, 50, 9378–9381. [Google Scholar] [CrossRef] [PubMed]
- Yang, K.S.; Budin, G.; Reiner, T.; Vinegoni, C.; Weissleder, R. Bioorthogonal Imaging of Aurora Kinase A in Live Cells. Angew. Chem. Int. Ed. 2012, 51, 6598–6603. [Google Scholar] [CrossRef] [PubMed]
- Mikula, H.; Stapleton, S.; Kohler, R.H.; Vinegoni, C.; Weissleder, R. Design and Development of Fluorescent Vemurafenib Analogs for In Vivo Imaging. Theranostics 2017, 7, 1257–1265. [Google Scholar] [CrossRef] [PubMed]
- Zhang, Z.; Kwiatkowski, N.; Zeng, H.; Lim, S.M.; Gray, N.S.; Zhang, W.; Yang, P.L. Leveraging kinase inhibitors to develop small molecule tools for imaging kinases by fluorescence microscopy. Mol. BioSyst. 2012, 8, 2523. [Google Scholar] [CrossRef] [PubMed]
- Li, Z.; Hao, P.; Li, L.; Tan, C.Y.J.; Cheng, X.; Chen, G.Y.J.; Sze, S.K.; Shen, H.-M.; Yao, S.Q. Design and Synthesis of Minimalist Terminal Alkyne-Containing Diazirine Photo-Crosslinkers and Their Incorporation into Kinase Inhibitors for Cell- and Tissue-Based Proteome Profiling. Angew. Chem. Int. Ed. 2013, 52, 8551–8556. [Google Scholar] [CrossRef] [PubMed]
- Shi, H.; Cheng, X.; Sze, S.K.; Yao, S.Q. Proteome profiling reveals potential cellular targets of staurosporine using a clickable cell-permeable probe. Chem. Commun. 2011, 47, 11306. [Google Scholar] [CrossRef] [PubMed]
- Li, Z.; Qian, L.; Li, L.; Bernhammer, J.C.; Huynh, H.V.; Lee, J.-S.; Yao, S.Q. Tetrazole Photoclick Chemistry: Reinvestigating Its Suitability as a Bioorthogonal Reaction and Potential Applications. Angew. Chem. Int. Ed. 2016, 55, 2002–2006. [Google Scholar] [CrossRef] [PubMed]
- Hwang, G.; Kim, H.; Yoon, H.; Song, C.; Lim, D.-K.; Sim, T.; Lee, J. In situ imaging of quantum dot-AZD4547 conjugates for tracking the dynamic behavior of fibroblast growth factor receptor 3. Int. J. Nanomed. 2017, 12, 5345–5357. [Google Scholar] [CrossRef] [PubMed]
- Zhang, Q.; Liu, H.; Pan, Z. A general approach for the development of fluorogenic probes suitable for no-wash imaging of kinases in live cells. Chem. Commun. 2014, 50, 15319–15322. [Google Scholar] [CrossRef] [PubMed]
- Lee, H.; Liu, W.; Brown, A.S.; Landgraf, R.; Wilson, J.N. Fluorescent Kinase Probes Enabling Identification and Dynamic Imaging of HER2(+) Cells. Anal. Chem. 2016, 88, 11310–11313. [Google Scholar] [CrossRef] [PubMed]
- Lee, H.; Landgraf, R.; Wilson, J.N. Synthesis and photophysical properties of a fluorescent cyanoquinoline probe for profiling ERBB2 kinase inhibitor response. Bioorg. Med. Chem. 2017, 25, 6016–6023. [Google Scholar] [CrossRef] [PubMed]
- Zambaldo, C.; Sadhu, K.K.; Karthikeyan, G.; Barluenga, S.; Daguer, J.-P.; Winssinger, N. Selective affinity-based probe for oncogenic kinases suitable for live cell imaging. Chem. Sci. 2013, 4, 2088. [Google Scholar] [CrossRef]
- Turetsky, A.; Kim, E.; Kohler, R.H.; Miller, M.A.; Weissleder, R. Single cell imaging of Bruton’s Tyrosine Kinase using an irreversible inhibitor. Sci. Rep. 2015, 4. [Google Scholar] [CrossRef] [PubMed]
- Shi, H.; Zhang, C.-J.; Chen, G.Y.J.; Yao, S.Q. Cell-Based Proteome Profiling of Potential Dasatinib Targets by Use of Affinity-Based Probes. J. Am. Chem. Soc. 2012, 134, 3001–3014. [Google Scholar] [CrossRef] [PubMed]
- Su, Y.; Pan, S.; Li, Z.; Li, L.; Wu, X.; Hao, P.; Sze, S.K.; Yao, S.Q. Multiplex Imaging and Cellular Target Identification of Kinase Inhibitors via an Affinity-Based Proteome Profiling Approach. Sci. Rep. 2015, 5. [Google Scholar] [CrossRef] [PubMed]
- Barcomb, K.; Goodell, D.J.; Arnold, D.B.; Bayer, K.U. Live imaging of endogenous Ca2+/calmodulin-dependent protein kinase II in neurons reveals that ischemia-related aggregation does not require kinase activity. J. Neurochem. 2015, 135, 666–673. [Google Scholar] [CrossRef] [PubMed]
- Kantelhardt, S.R.; Caarls, W.; de Vries, A.H.B.; Hagen, G.M.; Jovin, T.M.; Schulz-Schaeffer, W.; Rohde, V.; Giese, A.; Arndt-Jovin, D.J. Specific Visualization of Glioma Cells in Living Low-Grade Tumor Tissue. PLoS ONE 2010, 5, e11323. [Google Scholar] [CrossRef] [PubMed]
- Lyakhov, I.; Zielinski, R.; Kuban, M.; Kramer-Marek, G.; Fisher, R.; Chertov, O.; Bindu, L.; Capala, J. HER2- and EGFR-Specific Affiprobes: Novel Recombinant Optical Probes for Cell Imaging. ChemBioChem 2010, 11, 345–350. [Google Scholar] [CrossRef] [PubMed]
- Wang, Y.; Telmer, C.A.; Schmidt, B.F.; Franke, J.D.; Ort, S.; Arndt-Jovin, D.J.; Bruchez, M.P. Fluorogen Activating Protein–Affibody Probes: Modular, No-Wash Measurement of Epidermal Growth Factor Receptors. Bioconjug. Chem. 2015, 26, 137–144. [Google Scholar] [CrossRef] [PubMed]
- Gulyani, A.; Vitriol, E.; Allen, R.; Wu, J.; Gremyachinskiy, D.; Lewis, S.; Dewar, B.; Graves, L.M.; Kay, B.K.; Kuhlman, B.; et al. A biosensor generated via high-throughput screening quantifies cell edge Src dynamics. Nat. Chem. Biol. 2011, 7, 437–444. [Google Scholar] [CrossRef] [PubMed]
- Malkov, D.; Fetter, J.; Zenser, N.; Song, K. A Novel Biosensor Assay for Detecting Activation of Endogenous EGFR in Living Cells; Sigma® Life Science: St. Louis, MO, USA, 2011. [Google Scholar]
- Hayashi-Takanaka, Y.; Yamagata, K.; Nozaki, N.; Kimura, H. Visualizing histone modifications in living cells: Spatiotemporal dynamics of H3 phosphorylation during interphase. J. Cell Biol. 2009, 187, 781–790. [Google Scholar] [CrossRef] [PubMed]
- Giannone, G.; Hosy, E.; Sibarita, J.-B.; Choquet, D.; Cognet, L. High-Content Super-Resolution Imaging of Live Cell by uPAINT. In Nanoimaging; Methods in Molecular Biology; Humana Press: Totowa, NJ, USA, 2013; Volume 950, pp. 95–110. ISBN 978-1-62703-137-0. [Google Scholar]
- Ng, T.; Squire, A.; Hansra, G.; Bornancin, F.; Prevostel, C.; Hanby, A.; Harris, W.; Barnes, D.; Schmidt, S.; Mellor, H.; et al. Imaging Protein Kinase Calpha Activation in Cells. Science 1999, 283, 2085–2089. [Google Scholar] [CrossRef] [PubMed]
- Chew, T.-L.; Wolf, W.A.; Gallagher, P.J.; Matsumura, F.; Chisholm, R.L. A fluorescent resonant energy transfer–based biosensor reveals transient and regional myosin light chain kinase activation in lamella and cleavage furrows. J. Cell Biol. 2002, 156, 543–553. [Google Scholar] [CrossRef] [PubMed]
- Takao, K. Visualization of Synaptic Ca2+/Calmodulin-Dependent Protein Kinase II Activity in Living Neurons. J. Neurosci. 2005, 25, 3107–3112. [Google Scholar] [CrossRef] [PubMed]
- Bertolin, G.; Sizaire, F.; Herbomel, G.; Reboutier, D.; Prigent, C.; Tramier, M. A FRET biosensor reveals spatiotemporal activation and functions of aurora kinase A in living cells. Nat. Commun. 2016, 7, 12674. [Google Scholar] [CrossRef] [PubMed]
- Broussard, J.A.; Rappaz, B.; Webb, D.J.; Brown, C.M. Fluorescence resonance energy transfer microscopy as demonstrated by measuring the activation of the serine/threonine kinase Akt. Nat. Protoc. 2013, 8, 265–281. [Google Scholar] [CrossRef] [PubMed]
- Offterdinger, M.; Georget, V.; Girod, A.; Bastiaens, P.I.H. Imaging Phosphorylation Dynamics of the Epidermal Growth Factor Receptor. J. Biol. Chem. 2004, 279, 36972–36981. [Google Scholar] [CrossRef] [PubMed]
- Shibata, A.C.E.; Maebashi, H.K.; Nakahata, Y.; Nabekura, J.; Murakoshi, H. Development of a Molecularly Evolved, Highly Sensitive CaMKII FRET Sensor with Improved Expression Pattern. PLoS ONE 2015, 10, e0121109. [Google Scholar] [CrossRef] [PubMed]
- Bayliss, R.; Sardon, T.; Vernos, I.; Conti, E. Structural Basis of Aurora-A Activation by TPX2 at the Mitotic Spindle. Mol. Cell 2003, 12, 851–862. [Google Scholar] [CrossRef]
- Ohashi, S.; Sakashita, G.; Ban, R.; Nagasawa, M.; Matsuzaki, H.; Murata, Y.; Taniguchi, H.; Shima, H.; Furukawa, K.; Urano, T. Phospho-regulation of human protein kinase Aurora-A: Analysis using anti-phospho-Thr288 monoclonal antibodies. Oncogene 2006, 25, 7691–7702. [Google Scholar] [CrossRef] [PubMed]
- Paster, W.; Paar, C.; Eckerstorfer, P.; Jakober, A.; Drbal, K.; Schutz, G.J.; Sonnleitner, A.; Stockinger, H. Genetically Encoded Forster Resonance Energy Transfer Sensors for the Conformation of the Src Family Kinase Lck. J. Immunol. 2009, 182, 2160–2167. [Google Scholar] [CrossRef] [PubMed]
- Tewson, P.; Westenberg, M.; Zhao, Y.; Campbell, R.E.; Quinn, A.M.; Hughes, T.E. Simultaneous Detection of Ca2+ and Diacylglycerol Signaling in Living Cells. PLoS ONE 2012, 7, e42791. [Google Scholar] [CrossRef] [PubMed]
- Ritt, M.; Guan, J.L.; Sivaramakrishnan, S. Visualizing and Manipulating Focal Adhesion Kinase Regulation in Live Cells. J. Biol. Chem. 2013, 288, 8875–8886. [Google Scholar] [CrossRef] [PubMed]
- Goni, G.M.; Epifano, C.; Boskovic, J.; Camacho-Artacho, M.; Zhou, J.; Bronowska, A.; Martin, M.T.; Eck, M.J.; Kremer, L.; Grater, F.; et al. Phosphatidylinositol 4,5-bisphosphate triggers activation of focal adhesion kinase by inducing clustering and conformational changes. Proc. Natl. Acad. Sci. USA 2014, 111, E3177–E3186. [Google Scholar] [CrossRef] [PubMed]
- Adams, S.R.; Harootunian, A.T.; Buechler, Y.J.; Taylor, S.S.; Tsien, R.Y. Fluorescence ratio imaging of cyclic AMP in single cells. Nature 1991, 349, 694–697. [Google Scholar] [CrossRef] [PubMed]
- Goaillard, J.-M.; Vincent, P.; Fischmeister, R. Simultaneous measurements of intracellular cAMP and l-type Ca2+ current in single frog ventricular myocytes. J. Physiol. 2001, 530, 79–91. [Google Scholar] [CrossRef] [PubMed]
- Schleicher, K.; Zaccolo, M. Using cAMP Sensors to Study Cardiac Nanodomains. J. Cardiovasc. Dev. Dis. 2018, 5, 17. [Google Scholar] [CrossRef] [PubMed]
- Honda, A.; Adams, S.R.; Sawyer, C.L.; Lev-Ram, V.; Tsien, R.Y.; Dostmann, W.R.G. Spatiotemporal dynamics of guanosine 3’,5’-cyclic monophosphate revealed by a genetically encoded, fluorescent indicator. Proc. Natl. Acad. Sci. USA 2001, 98, 2437–2442. [Google Scholar] [CrossRef] [PubMed]
- Hodneland Nilsson, L.I.; Nitschke Pettersen, I.K.; Nikolaisen, J.; Micklem, D.; Avsnes Dale, H.; Vatne Røsland, G.; Lorens, J.; Tronstad, K.J. A new live-cell reporter strategy to simultaneously monitor mitochondrial biogenesis and morphology. Sci. Rep. 2015, 5, 17217. [Google Scholar] [CrossRef] [PubMed]
- Balboula, A.Z.; Nguyen, A.L.; Gentilello, A.S.; Quartuccio, S.M.; Drutovic, D.; Solc, P.; Schindler, K. Haspin kinase regulates microtubule-organizing center clustering and stability through Aurora kinase C in mouse oocytes. J. Cell Sci. 2016, 129, 3648–3660. [Google Scholar] [CrossRef] [PubMed]
- Verma, D.; Bajpai, V.K.; Ye, N.; Maneshi, M.M.; Jetta, D.; Andreadis, S.T.; Sachs, F.; Hua, S.Z. Flow induced adherens junction remodeling driven by cytoskeletal forces. Exp. Cell Res. 2017, 359, 327–336. [Google Scholar] [CrossRef] [PubMed]
- Nahar, K.; Goto, T.; Kaida, A.; Deguchi, S.; Miura, M. Effects of Chk1 inhibition on the temporal duration of radiation-induced G2 arrest in HeLa cells. J. Radiat. Res. 2014, 55, 1021–1027. [Google Scholar] [CrossRef] [PubMed]
- Rosado, A.; Zanella, F.; Garcia, B.; Carnero, A.; Link, W. A Dual-Color Fluorescence-Based Platform to Identify Selective Inhibitors of Akt Signaling. PLoS ONE 2008, 3, e1823. [Google Scholar] [CrossRef] [PubMed] [Green Version]
- Shcherbo, D.; Souslova, E.A.; Goedhart, J.; Chepurnykh, T.V.; Gaintzeva, A.; Shemiakina, I.I.; Gadella, T.W.; Lukyanov, S.; Chudakov, D.M. Practical and reliable FRET/FLIM pair of fluorescent proteins. BMC Biotechnol. 2009, 9, 24. [Google Scholar] [CrossRef] [PubMed]
Figure 1.
Example of spatial structure of complex between PK, ATP, peptide substrate, and a regulatory protein (based on PDB 1QMZ). (A) PK (CDK2) is shown as grey cartoon, regulatory protein (cyclin A) as cyan cartoon, MgATP as colored spheres, and substrate as colored sticks. The distant site on cyclin A responsible for recognition of longer protein substrates is indicated with black dotted oval. (B) The same complex as in (A), but MgATP and substrate peptide are hidden for clarity. The catalytically important Lys residue (mentioned in text) and activation loop are highlighted in red and Lys and phospho-Thr in the activated loop are shown as lines.

Figure 2.
Relative sizes of different fluorophores. Coordinates for spatial structures of GFP and firefly luciferase were obtained from PDB 1EMA and 1LCI, respectively. Figure adapted from [37].
Figure 2.
Relative sizes of different fluorophores. Coordinates for spatial structures of GFP and firefly luciferase were obtained from PDB 1EMA and 1LCI, respectively. Figure adapted from [37].

Figure 3.
Class 1A probes. (A) Human PKs for which Class 1A probes (red circles) have been reported (kinome tree adapted from [104], illustration generated by analog of software available at [105]). (B) Principle of functioning of a Class 1A probe containing PAAD (adapted from [96]). (C) Probe competes with the endogenous substrate for phosphorylation. PK, protein kinase; PP, protein phosphatase.

Figure 4.
Class 1B probes. (A) Human PKs for which Class 1B probes (blue circles) have been reported (kinome tree adapted from [104], illustration generated by analog of software available at [105]). (B) Principle of functioning of a self-quenching probe (adapted from [96]). (C) Probe competes with the endogenous substrate for phosphorylation.

Figure 5.
Class 2 probes. (A) Human PKs for which Class 2 probes (yellow circles) have been reported (kinome tree adapted from [104], illustration generated by analog of software available at [105]). (B) Principle of functioning of a Class 2 probe (adapted from [152]).

Figure 6.
Class 3A and Class 3B probes: kinome coverage and principle of functioning. (A) Human PKs for which Class 3A (green circles) or Class 3B (magenta circles) probes have been reported (kinome tree adapted from [104], illustration generated by analog of software available at [105]). (B) Example of Class 3A and Class 3B probe gaining photoluminescence after binding to target PK. (C) Effect of Class 3A and Class 3B probes on phosphorylation of endogenous substrates; blunt-end arrow denotes inhibition.

Figure 7.
Class 4A probes: kinome coverage and principle of functioning. (A) Human PKs for which Class 4A probes (brown circles) have been reported (kinome tree adapted from [104], illustration generated by analog of software available at [105]). (B) Class 4A probes incorporate tagged PK, which performs autophosphorylation upon binding of an activating molecule (denoted as X). (C) Effect of Class 4A probes on phosphorylation of endogenous substrates (adapted from [201]).


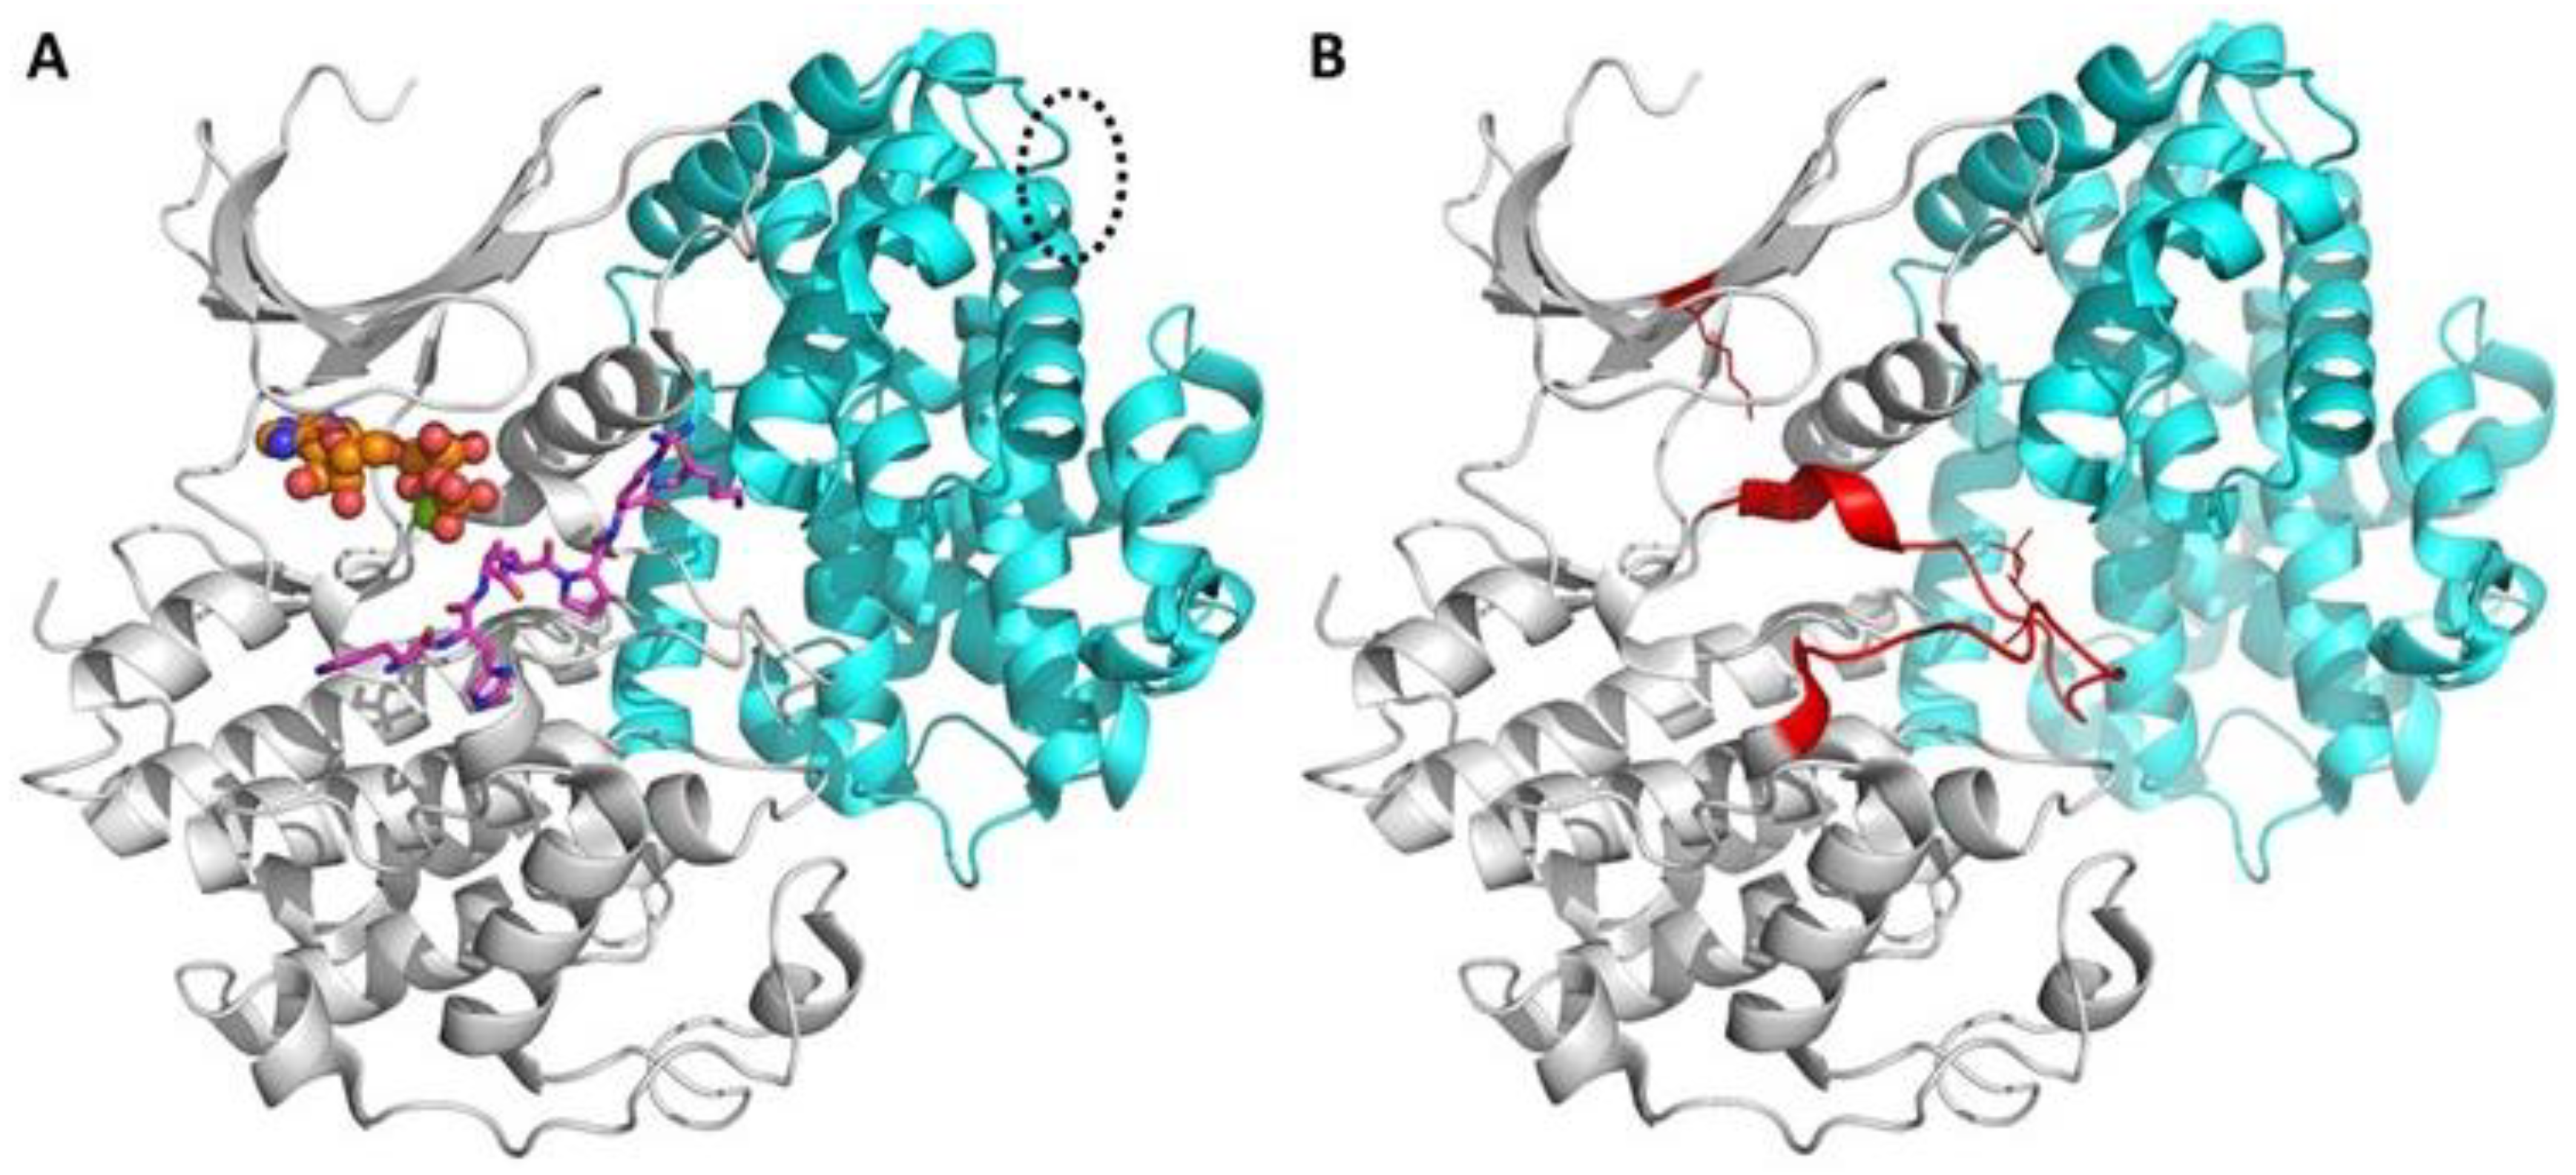
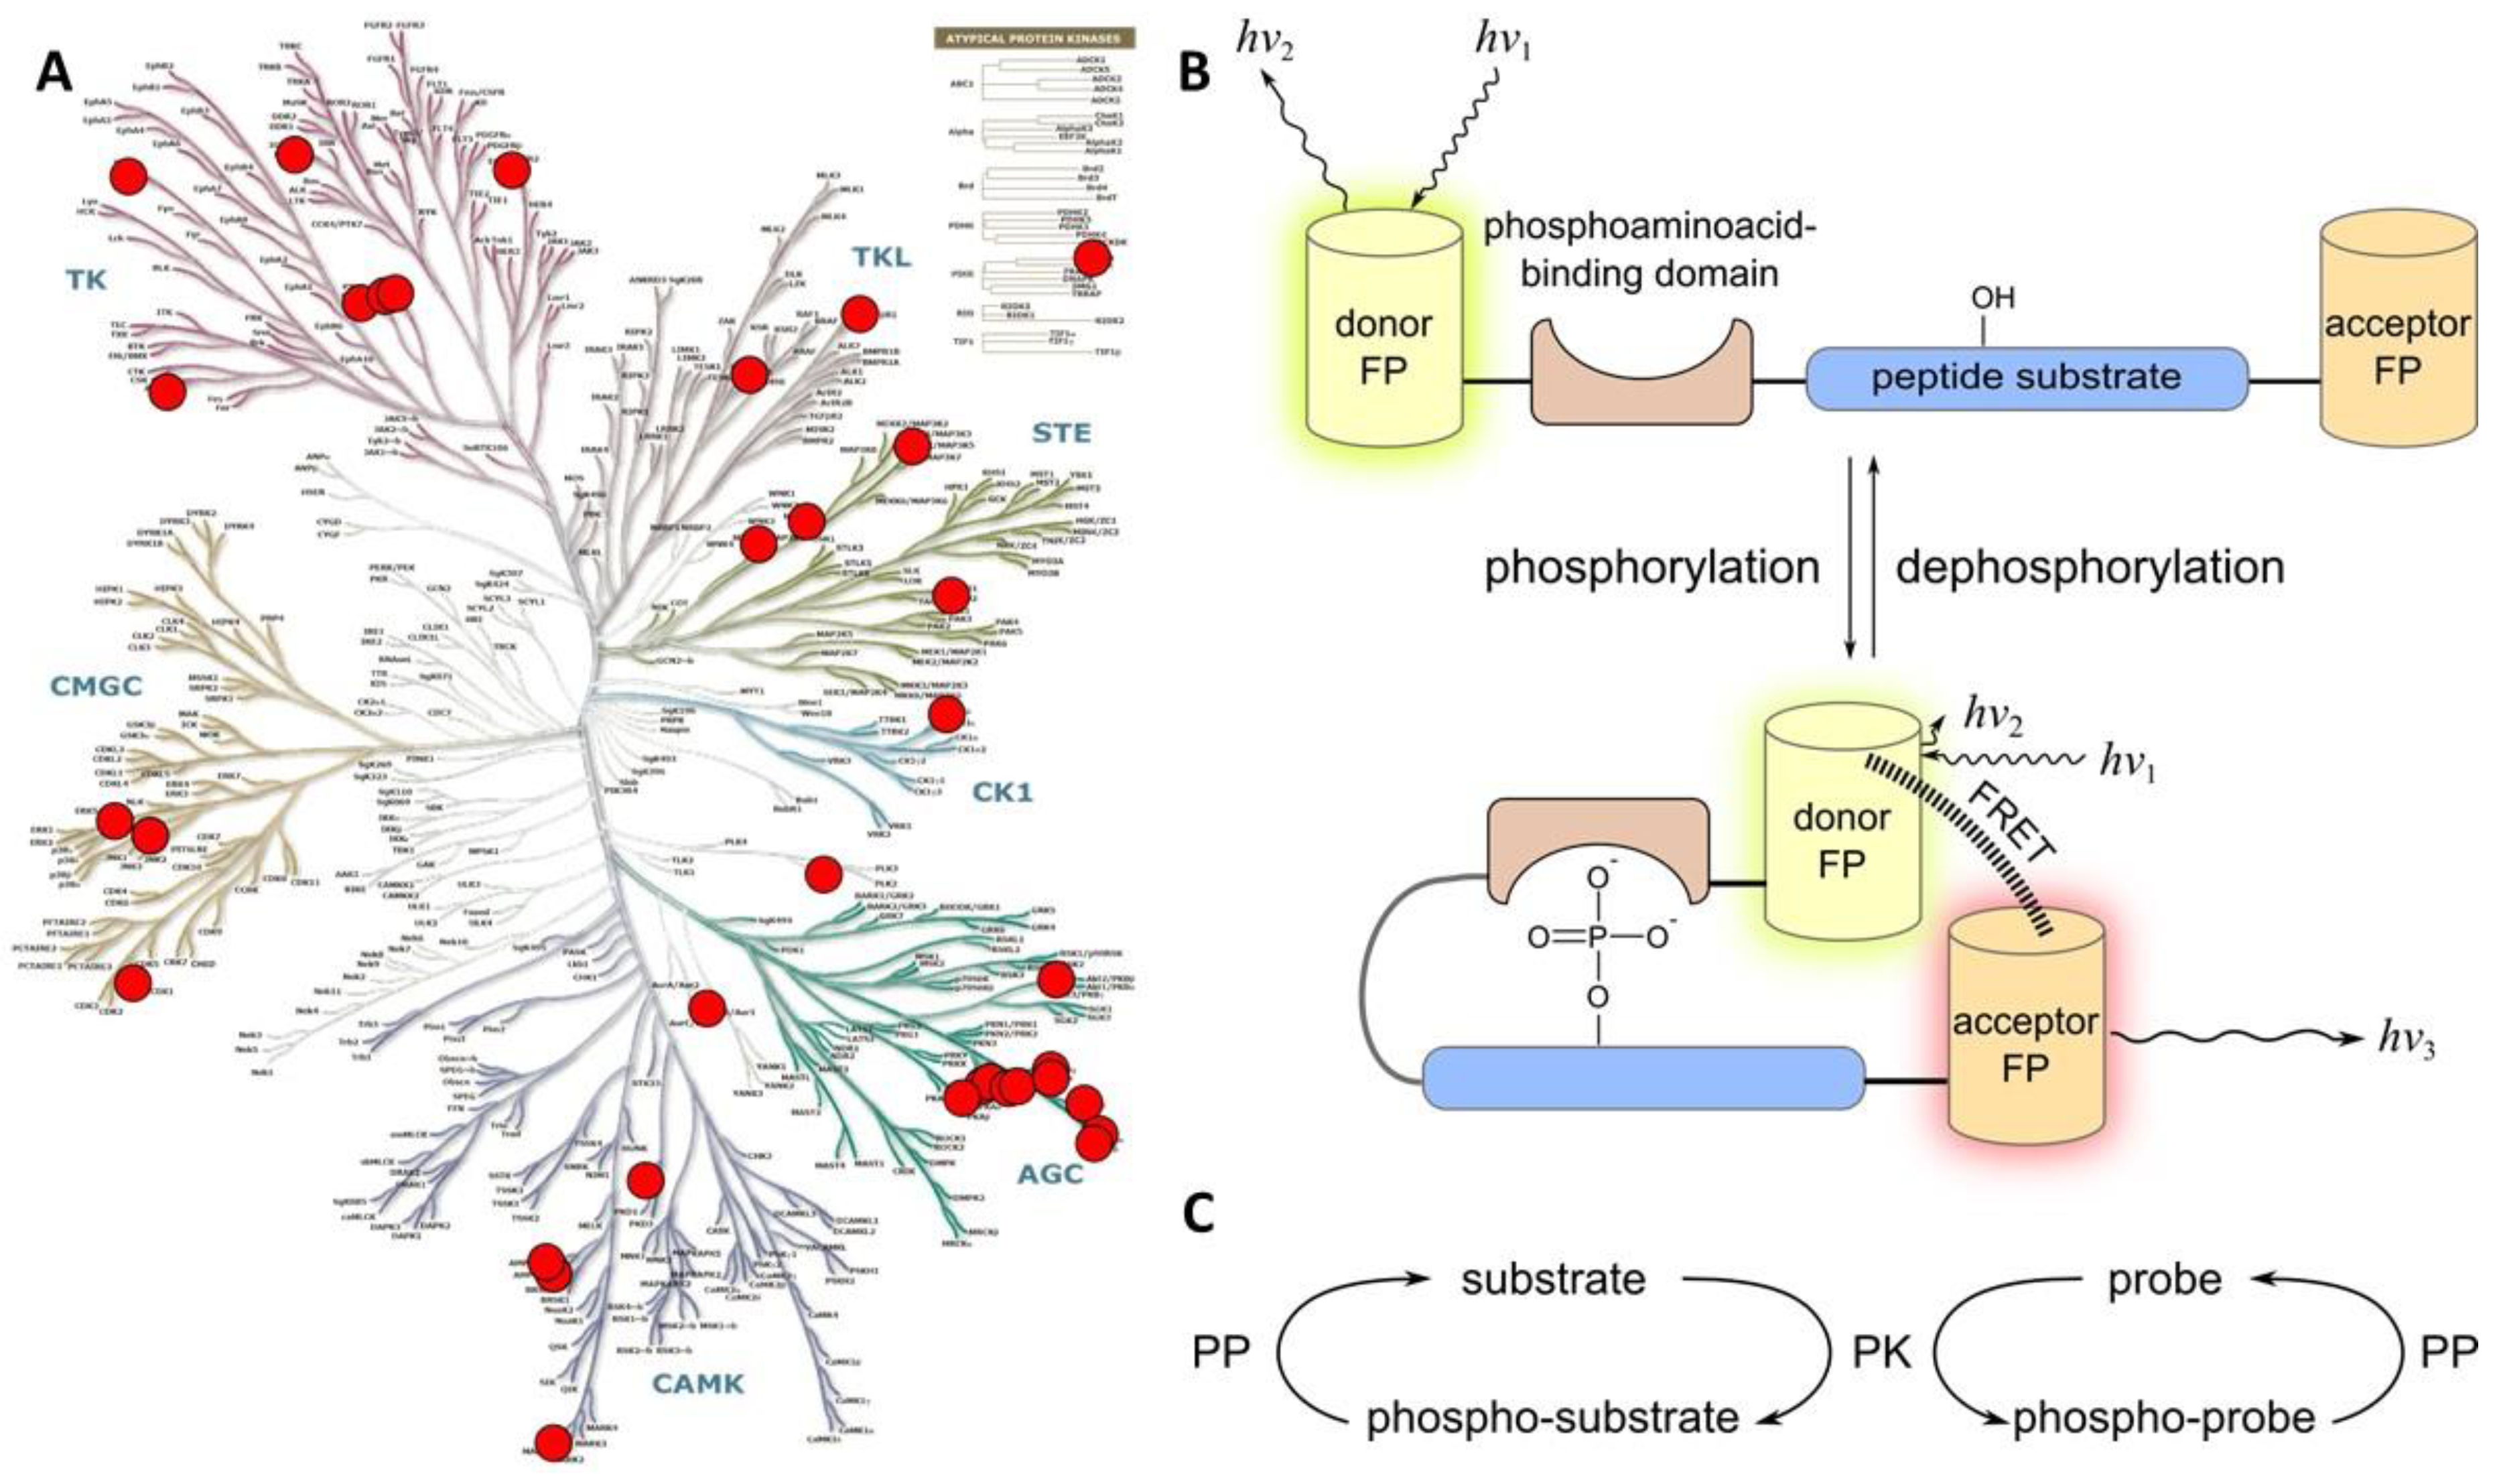
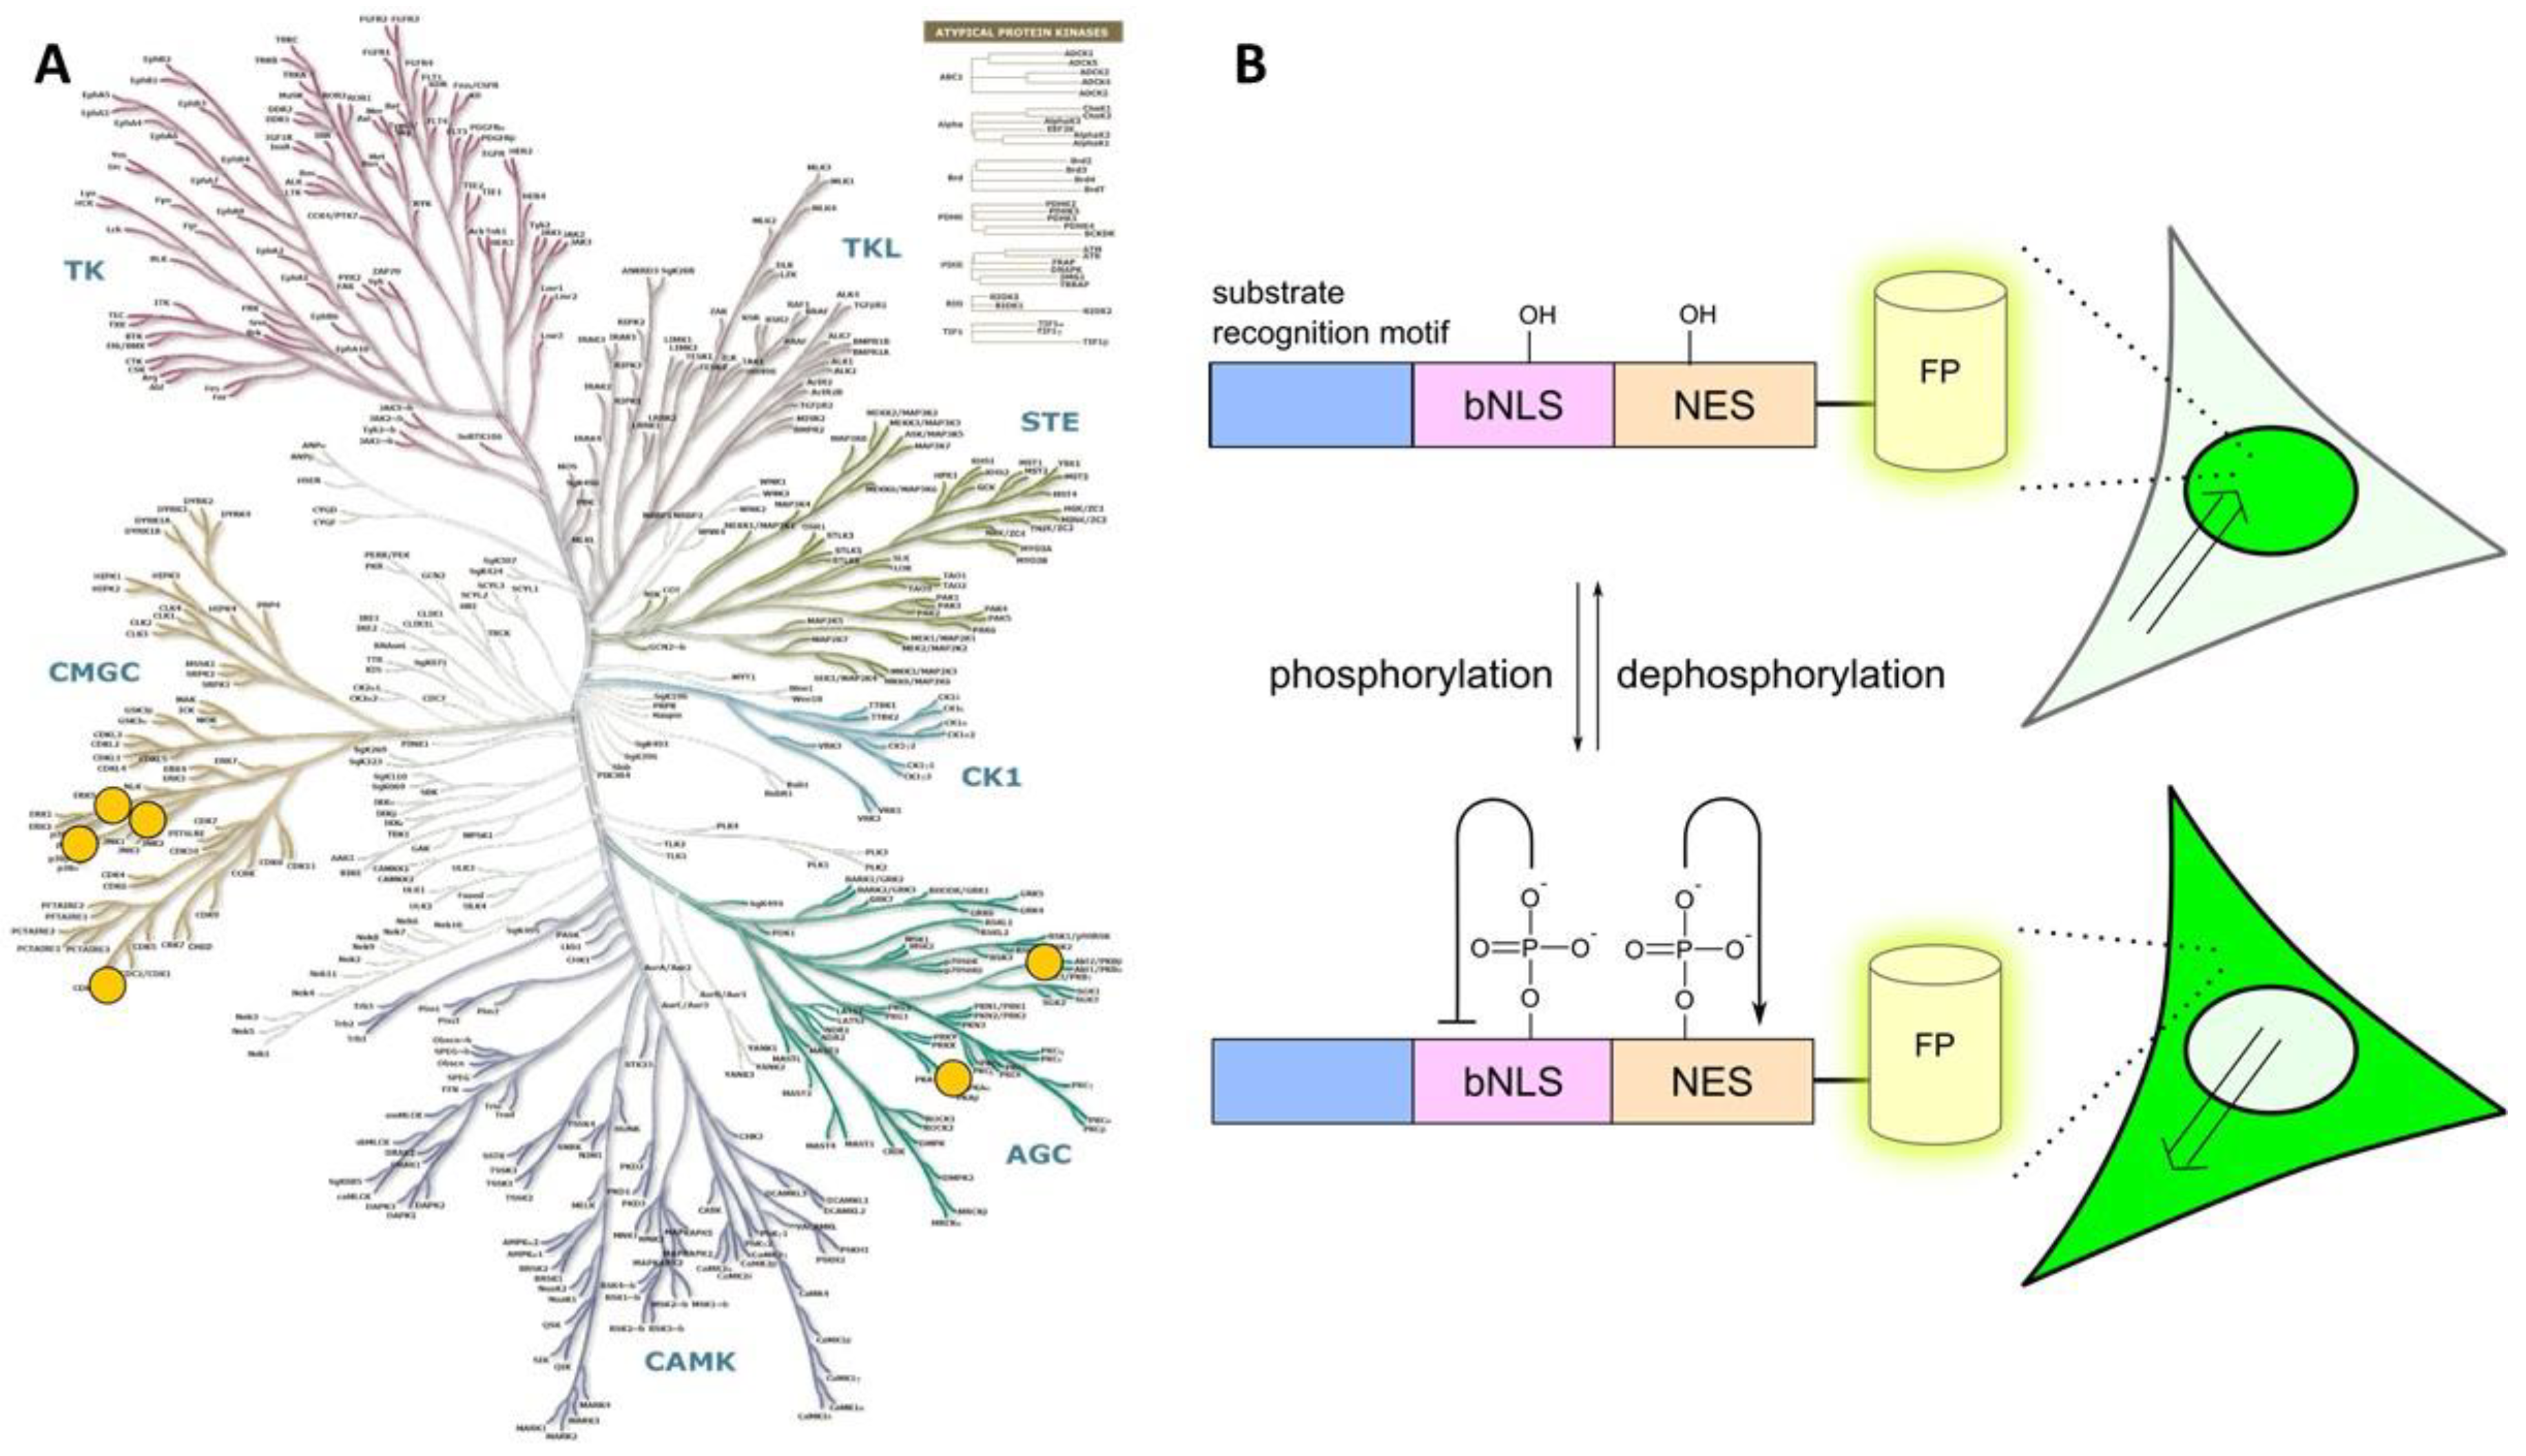
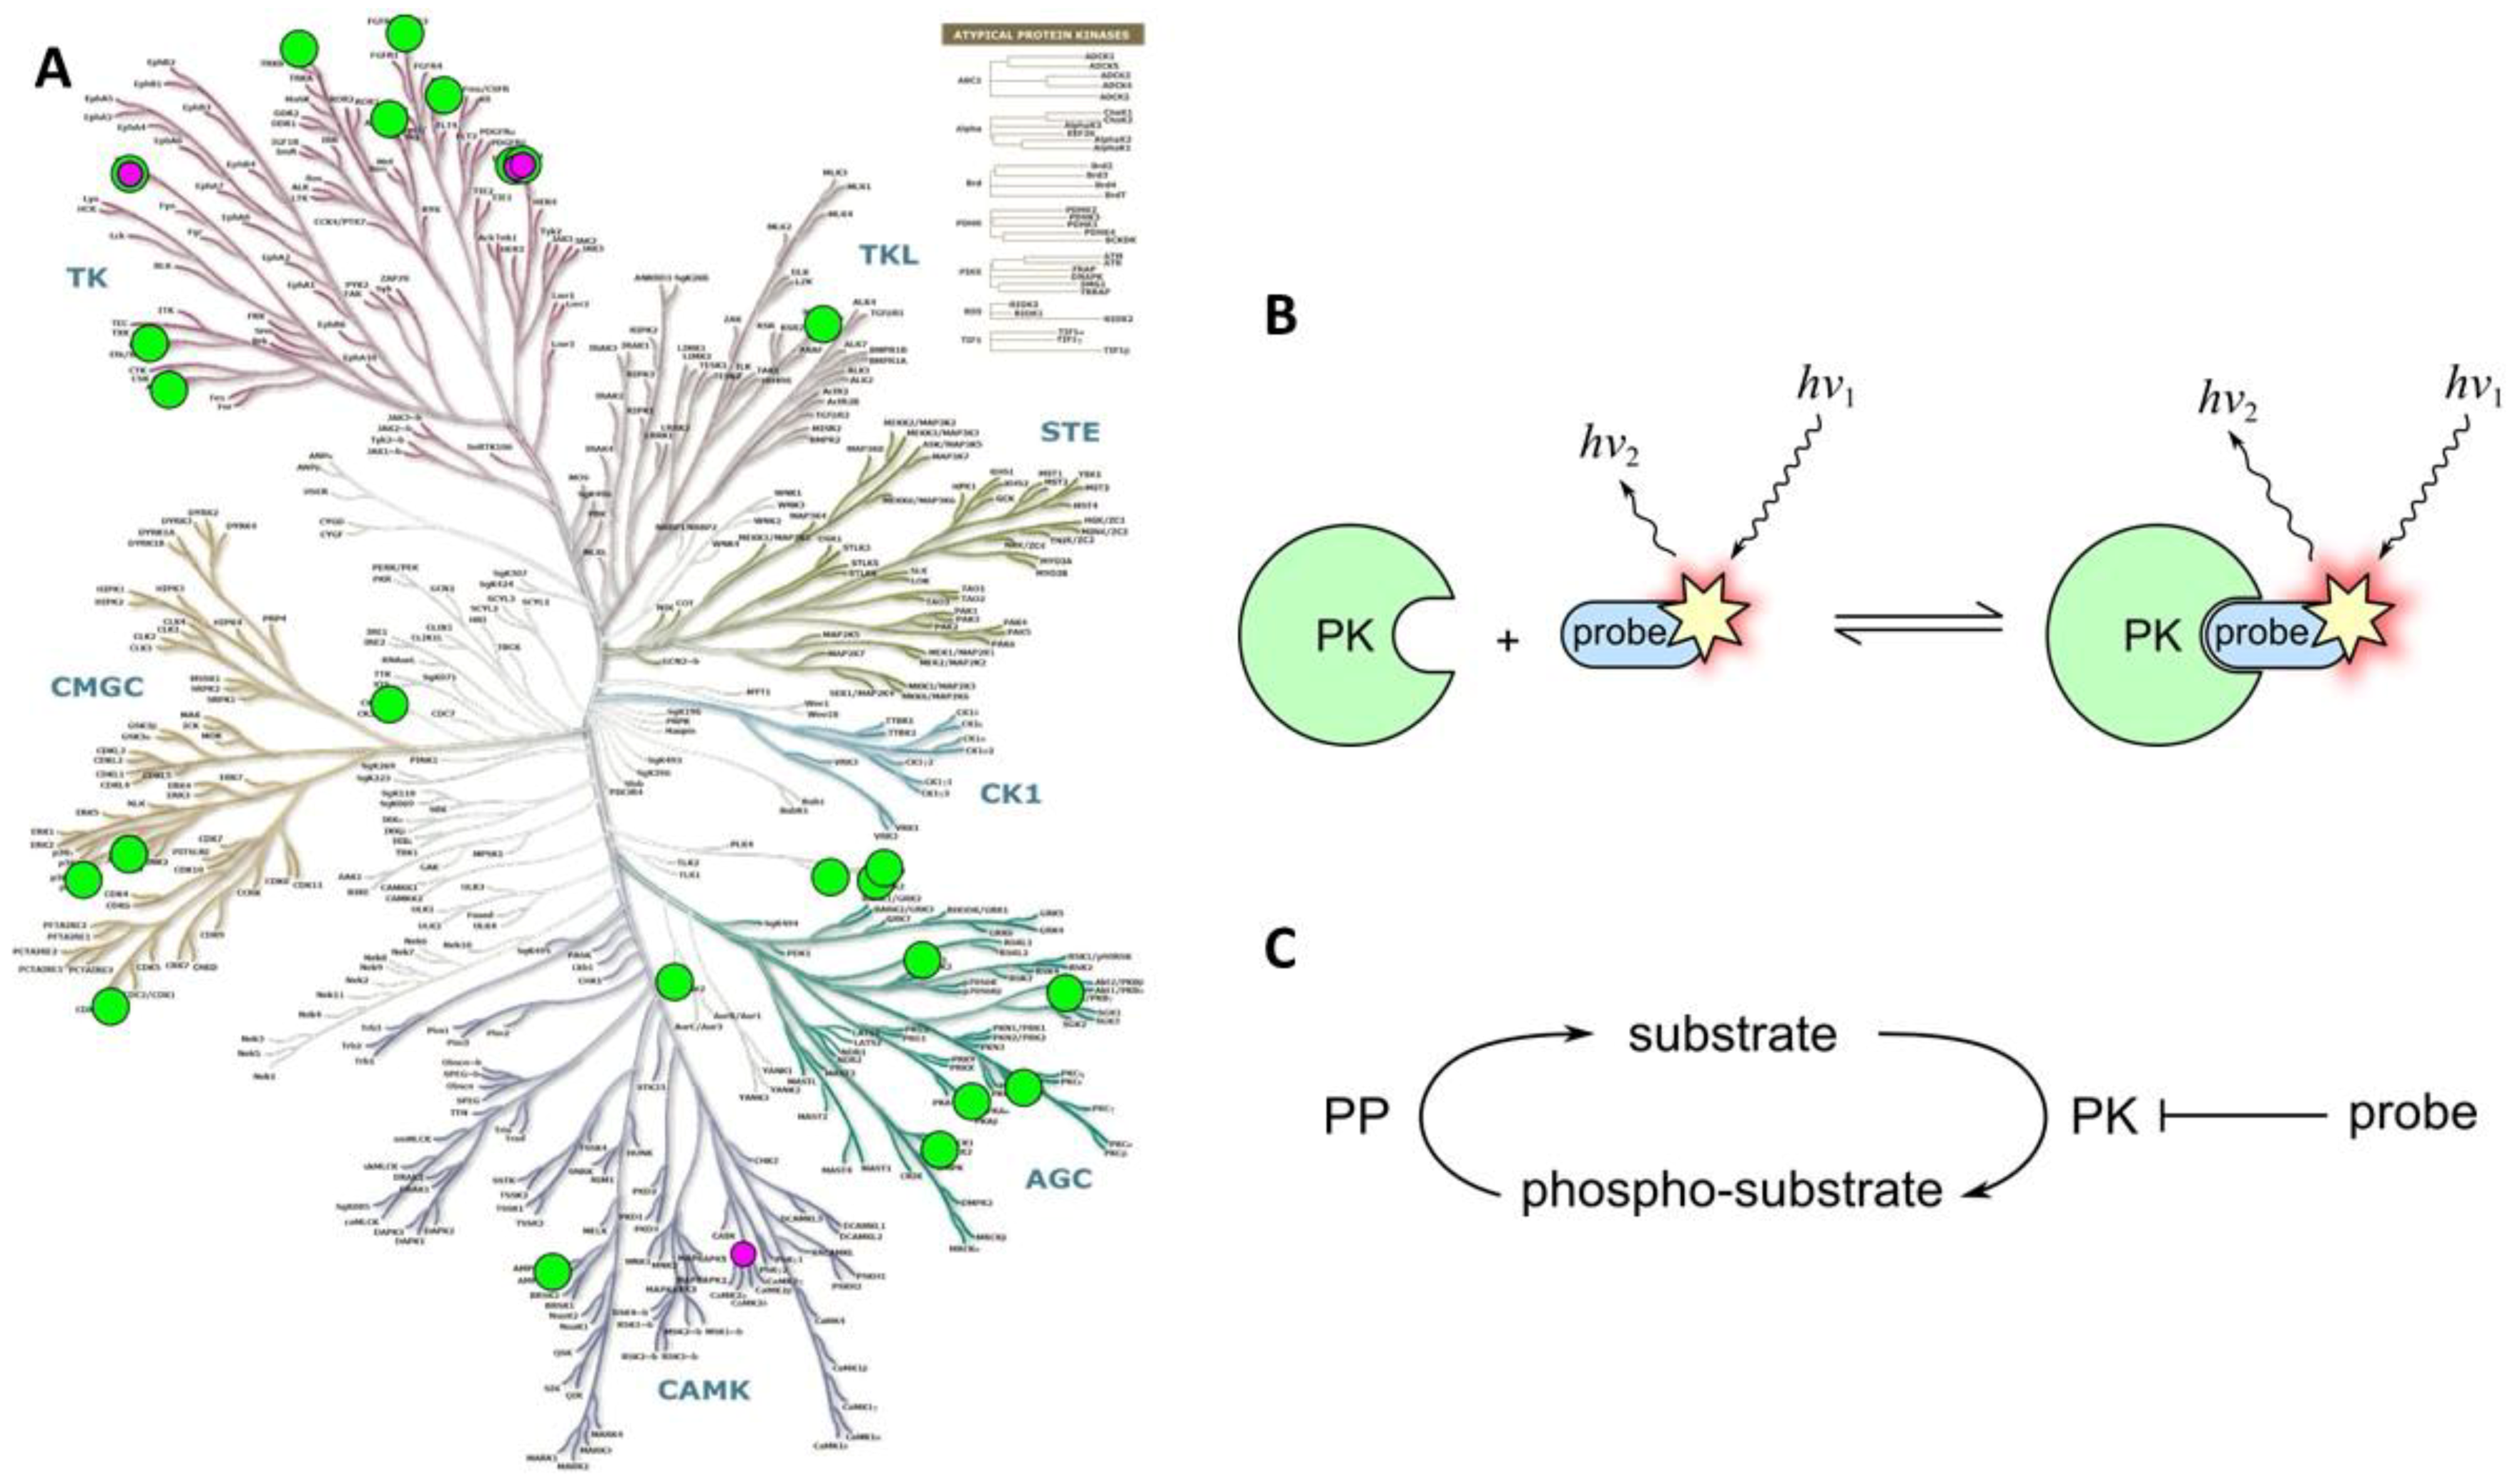
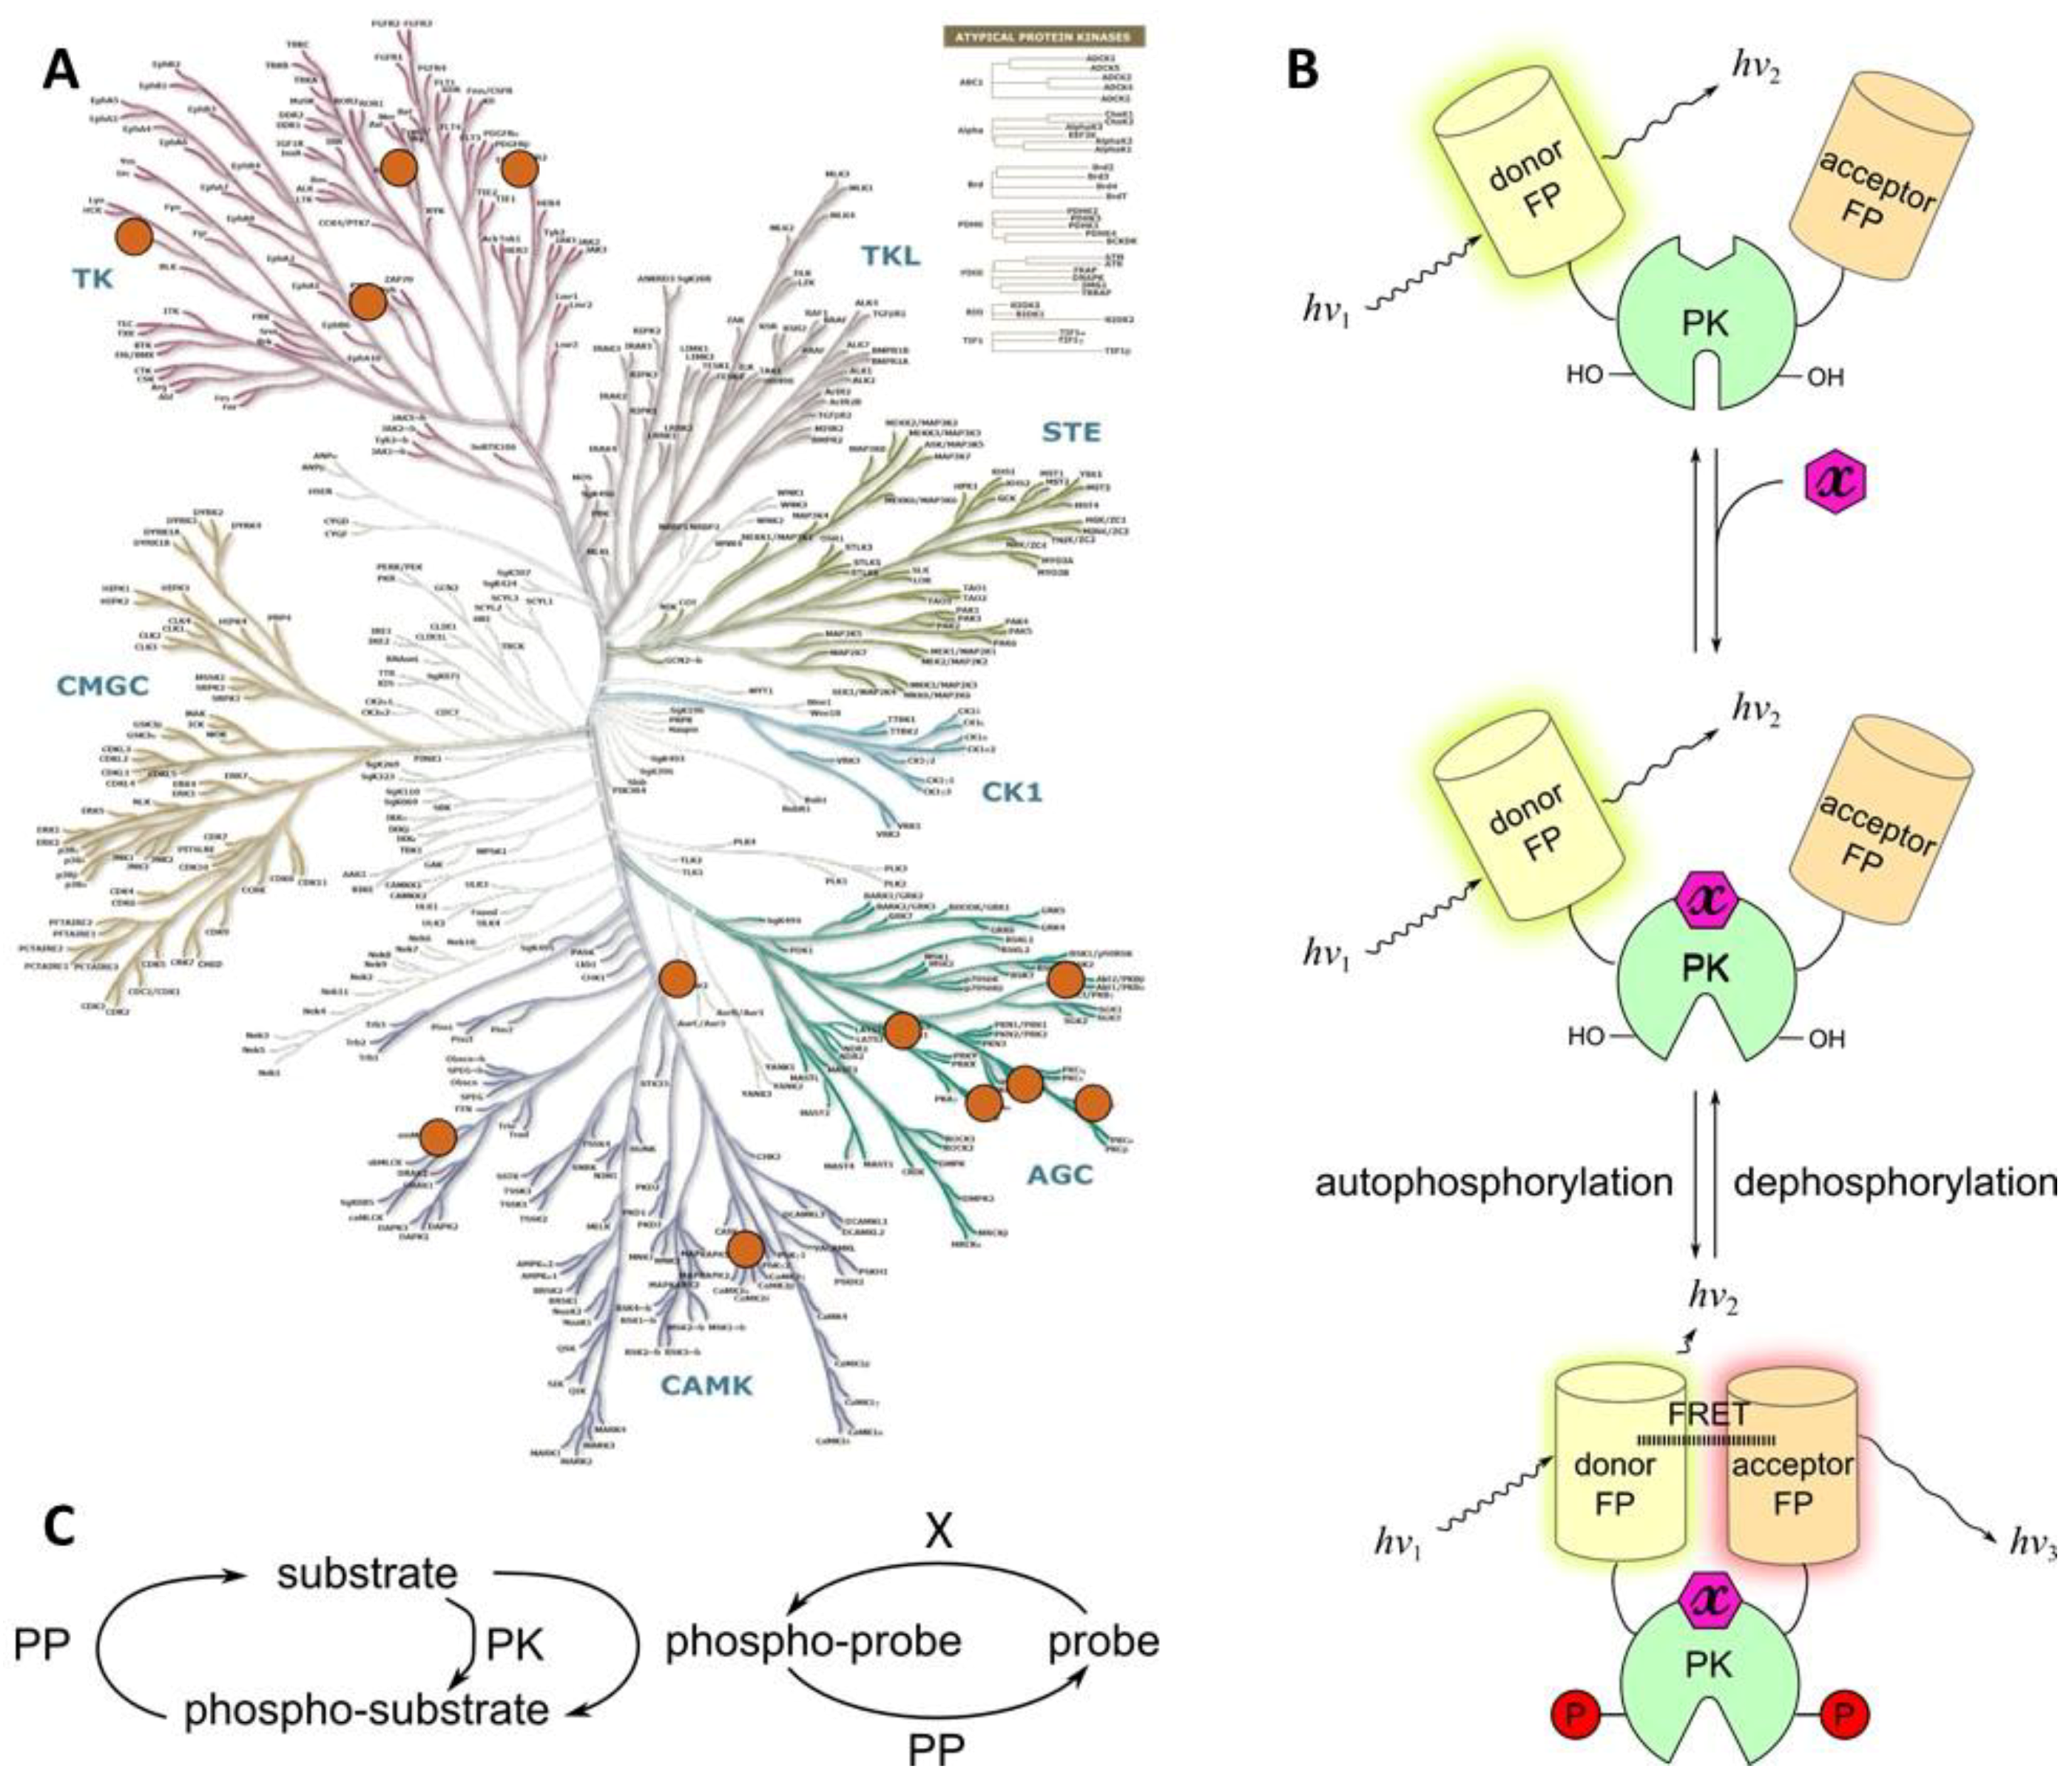
Table 1.
Control experiments necessary for characterization of Class 1A probes.
| Biochemical Assays | In cellulo Assays |
|---|---|
| Phosphorylation assay in the presence/absence of dilution series of target PK | Utilization of probe in a cell line with low endogenous expression of target PK, in the presence/absence of the overexpressed target PK |
| Phosphorylation assay in the presence of target PK and in the presence/absence of a dephosphorylating phosphatase 1 | Utilization of probe in conditions where the target PK knocked down/out |
| For probes utilizing FRET phenomenon, phosphorylation assay in the presence of target PK and in the presence/absence of a protease that does not degrade fluorescent proteins but cuts the probe (to establish minimal level of FRET) | Utilization of probe in conditions where the kinase-dead mutant of the target PK is overexpressed |
| Application of selective activators and inhibitors of target PK, and corresponding compounds that should affect closely related PKs yet not the target PK | |
| Use of a point-mutated probe variant as a negative control where the non-phosphorylatable amino acid is substituted for the Ser, Thr or Tyr contained in the consensus sequence. | |
| For probes that contain PAAD, introduction of point-mutations to the crucial positions of PAAD domain should also be considered to provide another set of negative controls that can be phosphorylated by target PK, yet recognition of the phosphorylated sequence by PAAD is disrupted. | |
| Use of a truncated probe variant as a negative control where one of the fluorescent proteins is omitted | |
| For probes utilizing FRET phenomenon, acceptor photobleaching experiment to monitor presence/absence of increase of fluorescence intensity of donor fluorophore dependent on the assay conditions used | |
Green highlight: control of phosphorylation event reporting; pink highlight: control of optical properties; blue highlight: control of selectivity. 1 Screening of several protein phosphatases might be necessary (see [103]).
© 2018 by the authors. Licensee MDPI, Basel, Switzerland. This article is an open access article distributed under the terms and conditions of the Creative Commons Attribution (CC BY) license (http://creativecommons.org/licenses/by/4.0/).
Share and Cite
MDPI and ACS Style
Lavogina, D.; Kopanchuk, S.; Viht, K. Dissection of Protein Kinase Pathways in Live Cells Using Photoluminescent Probes: Surveillance or Interrogation? Chemosensors 2018, 6, 19. https://doi.org/10.3390/chemosensors6020019
AMA Style
Lavogina D, Kopanchuk S, Viht K. Dissection of Protein Kinase Pathways in Live Cells Using Photoluminescent Probes: Surveillance or Interrogation? Chemosensors. 2018; 6(2):19. https://doi.org/10.3390/chemosensors6020019
Chicago/Turabian StyleLavogina, Darja, Sergei Kopanchuk, and Kaido Viht. 2018. "Dissection of Protein Kinase Pathways in Live Cells Using Photoluminescent Probes: Surveillance or Interrogation?" Chemosensors 6, no. 2: 19. https://doi.org/10.3390/chemosensors6020019
Note that from the first issue of 2016, this journal uses article numbers instead of page numbers. See further details here.