Article

Development of Sub 10 fs Visible-NIR, UV, and DUV Pulses and Their Applications to Ultrafast Spectroscopy

by
Takayoshi Kobayashi
1,*,
Atsushi Yabushita
2 and
Yuichiro Kida
3
1
The University of Electro-Communications, 1-5-1, Chofugaoka, Chofu, Tokyo 182-8585, Japan
2
National Chiao-Tung University, 1001, Ta-Hsueh Road, Hsinchu 300, Taiwan
3
RIKEN SPring-8 Center, Koto 1-1-1, Sayo, Hyogo 679-5148, Japan
*
Author to whom correspondence should be addressed.
Photonics 2016, 3(4), 64; https://doi.org/10.3390/photonics3040064
Submission received: 15 November 2016 / Revised: 13 December 2016 / Accepted: 13 December 2016 / Published: 17 December 2016
(This article belongs to the Special Issue Ultrafast Photonics and Attosecond Sciences)

Abstract

:
In the first section of this Chapter, the basics of nonlinear optical (NLO) processes are systematically described. Then the generation of the visible pulse utilizing the NLO processes is described and ultrafast spectroscopy using the visible pulse is discussed. By using such short pulse, fast chemical reactions, which cannot be identified by utilizing strobe light or flash lamp, can be studied. After the development of femtosecond lasers, they have been widely applied to observe the transition state of various chemical reactions. In the near infrared (NIR) region, a commercial light source of Ti:sapphire laser is available as a femtosecond light source, but not available in the visible and ultraviolet (UV) regions. In this article, we report our development of sub 10 fs visible-NIR, UV, and deep-ultraviolet (DUV) pulses and their applications to ultrafast spectroscopy.

1. Generation of Ultrashort Laser Pulse

1.1. Basics of Nonlinear Optical Processes

1.1.1. Nonlinear Optical Processes and Nonlinear Susceptibilities

In the following, we would like to briefly introduce nonlinear optics in a way that differs slightly from that used by most textbooks in wide circulation. Under high-intensity laser irradiation, nonlinear optical (NLO) processes take place in nonlinear media above some field intensity level. In the perturbative regime (<1014 W/cm2), which lies below the threshold of the non-perturbative regime, the nonlinear macroscopic polarization is the source term that generates the NLO processes. The polarization induced by N electric fields Ek (k = 1 to N) is given by
P N L = ε 0 Σ n = 1 N χ ( n ) Π k = 1 n E k
Utilizing Equation (1), NLO processes can be classified into two categories: those involving only virtual states and those involving real states, hereafter referred to as Case I and Case II processes.

(i) Case I: NLO Processes Involving Only Virtual States

In Case I processes, the nonlinear growth of the macroscopic polarization involves only virtual state(s), and these can be considered to be NLO processes not accompanied by a change in the optical properties of the material. All frequency-mixing processes are classified as Case I. Examples of second-order Case I processes are second-harmonic generation (SHG), sum-frequency generation (SFG), difference-frequency generation (DFG), optical rectification (OR), optical parametric fluorescence (OPF) or optical parametric generation (OPG), optical parametric amplification (OPA), and optical parametric oscillation (OPO). OPA and OPF are amplification and noise generation processes, respectively, which are analogous to stimulated emission and spontaneous fluorescence in a laser. In other words, parametric processes (e.g., OPA and OPF) involve only virtual states, and lasing processes (e.g., stimulated emission and spontaneous fluorescence) involve only real states. OPF and OPG are sometimes referred to as spontaneous parametric down-conversion (SPDC), especially when the two generated photons degenerate in frequency. SPDC is becoming an extensively utilized technique for the generation of entangled photon pairs in quantum information science.
P ( n ) ( ω ) = ε 0 χ ( n ) ( ω ) | E 1 ( ω 1 ) | 2 E 2 ( ω 2 ) Π l = 3 n E l ( ω l ) = ε 0 χ ( n ) ( ω ) I ( ω 1 ) E 2 ( ω 2 ) Π l = 3 n E l ( ω l ) = ε 0 χ e f f ( n 2 ) ( ω ) Π l = 3 n E l ( ω l )
All second-order nonlinear processes are Case I processes, and they are always associated with a change in frequency between the incident and output fields. If we include electro-optical (EO) effects as NLO processes, the Pockels (linear EO) effect is an exception to the above statement, because the frequency of the optical field introduced into such systems (linear and nonlinear (second-order) EO devices) does not change detectably. In other words, the frequency of the incident light passing through a radio frequency (RF)-modulated EO device used as a phase or amplitude modulator changes only by the RF field, which is an extremely small change that cannot be detected by a spectrometer. This is different from the case of SHG or SFG.
The most widely known odd-order NLO process is third-harmonic generation (THG). THG is an example of a third-order frequency mixing process in which the three interacting fields are all degenerate. For Case I processes, the sizes of the real and imaginary parts of the nonlinear susceptibility determine the relative phase shift between the incident and output fields. The phase shift is not important in most cases, since the phase delay time corresponding to the phase shift is much smaller than the pulse duration used in most practical applications. It is also unimportant from the viewpoint of basic physics because the phase of the optical field can be described only when a time zero, from which absolute time can be determined, is appropriately defined. This is possible in the case of an extremely short pulse, where the pulse envelope contains only few cycles, because the peak of the pulse can be taken as the time zero. The ratio of the contributions of the real and imaginary parts of the nonlinear susceptibility gives the phase. It is important to note that, in general, the imaginary part of the susceptibility is responsible for either loss or gain. However, as described above, the imaginary part of the susceptibility in second-order and higher-order NLO processes involving only virtual states is irrelevant to the energy transfer between the field and the matter.

(ii) Case II: NLO Processes Involving Only Real States

NLO processes involving real states are always driven by a pair of electric fields with conjugate phases of a degenerate frequency, E l ( ω ) E m ( ω ) = E l ( ω ) E l ( ω ) = E l ( ω ) E l ( ω ) * = I l ( ω ) . Then, in the expression for the macroscopic nonlinear polarization P N L , the pair electric field appears in the form of the intensity, as given below.
In this way, the susceptibility in Case II processes can be represented by an effective nonlinear susceptibility with two order lower NL process. Case II processes can be classified into two sub-cases, that when the real part of the susceptibility is dominant and that when the imaginary part is dominant. This classification can be easily understood in the case of third-order processes, where the nonlinear polarization of the intensity-dependent NLO processes can be expressed as
P ( 3 ) = ε 0 χ ( 3 ) ( ω 2 , ω 1 , ω 1 , ω 2 ) | E 1 ( ω 1 ) | 2 E 2 ( ω 2 ) = ε 0 χ e f f ( 1 ) ( ω 2 ) E 2 ( ω 2 )
Here, χ e f f ( 1 ) ( ω 2 ) is an effective linear susceptibility at frequency ω2 of the nonlinear material of interest, under the influence of a laser field with frequency ω1.
χ e f f ( 1 ) ( ω 2 ) = χ ( 3 ) ( ω 2 ; ω 1 , ω 1 , ω 2 ) | E 1 ( ω 1 ) | 2 = χ ( 3 ) ( ω 2 ; ω 1 , ω 1 , ω 2 ) I 1 ( ω 1 )
The real part of the effective linear susceptibility χ e f f ( 1 ) ( ω 2 ) corresponds to the change in the refractive index, whereas the imaginary part corresponds to the change in the absorbance or to the intensity of stimulated emission. Compared with Case I processes, in Case II processes, a large nonlinear effect is induced due to the real-state population. In third-order Case II processes, the real part is phrased as the nonlinear refractive index (n2). This induces various processes that originate from the change in the refractive index (Δn = n2I), including self-focusing, self-phase modulation (SPM), cross-phase modulation (XPM), the optical Kerr effect (OKE), self-steepening, the photorefractive effect, dual-beam induced phase-grating formation induced diffraction, and optical bistability of the transmissivity through or reflectivity from a cavity containing nonlinear material. Third-order processes due to the imaginary part of susceptibility, which contribute to intensity-dependent effective absorptivity or transmissivity, include absorption saturation, inverse absorption saturation, and induced absorption. The induced absorption takes place when the excited-state population is created either by a preceding pulse in a double pulse or in a train that is short and intense enough to induce sufficient transfer of the population from the ground state to the relevant excited state. It can also take place even in the case of a single pulse if the leading edge of the single pulse is intense enough. The induced absorption is due to the transition from the populated excited state to a higher excited state. In higher-order NLO processes such as multi-step multiphoton absorption and resonant hyper-Raman processes also belong to Case II. In these examples, the absorptivity and Raman cross section are correspondingly the modified optical properties.

1.1.2. Optical Parametric Amplification (OPA)

Both Case I and Case II processes are important in the generation of ultrashort pulses, as will be discussed in Section 1.2 in the context of SHG and OPA, and SPM, respectively. For ultrashort pulse generation in the visible and part of the near-infrared (NIR) ranges, the second-order nonlinear polarization effect has been utilized in second-order nonlinear crystals without inversion symmetry. Even though OPF can in principle be used to generate pulses that are spectrally broad enough to be ultrashort, their timing jitter and energy fluctuation are too high to be used in experiments because they originate from vacuum noise; therefore, OPA is used instead of OPF to obtain pulses with sufficient stability.
As mentioned previously, in an OPA process, an intense pump beam amplifies a weak signal without real population inversion. In this case, conservation of energy is satisfied among the pump photon of frequency (angular frequency, hereafter referred simply as frequency in many cases) ωp, the signal photon of frequency ωs, and an idler photon of frequency ωi = ωpωs, which is generated simultaneously through the second-order nonlinear polarization. The idler pulse is generated from a vacuum, which is coupled with the pump, and associatively amplifies the signal at a frequency of ωs = ωpωi. Spatial and temporal overlap of the three fields needs to be maintained for efficient conversion through continuous conversion of a pump photon to a signal photon mediated by an idler photon. Initially, the intensity of the pump pulse is much higher than that of the signal pulse, signal amplification continues along with pump propagation through the nonlinear crystal, and the energy of the pump photon is consequently divided into the signal photon and the idler photon. This process can be considered as a parametric down-conversion (PDC) process from the higher frequency pump photon to the lower frequency signal and idler photons through an increase in the photon numbers of the signal and idler and a corresponding decrease in that of the pump.
As mentioned above, in the case of OPA, the angular frequencies of the pump, signal, and idler pulses must satisfy the following condition:
ω p = ω s + ω i
Since the above relationship involves pulses, the angular frequencies have a finite width corresponding to the inverse of the pulse widths. Here, the angular frequencies are taken to be the center frequencies. Due to the finite width of the pulses, each of the terms in Equation (5) has some flexibility. This relationship can be recast in the photon picture as ω p = ω s + ω i , which is a statement of energy conservation. This relationship is derived from the viewpoint of the wave nature of the pulses and represents the coherent coupling in time of the three pulses.
In order for energy transfer to occur efficiently among the three waves, the constructive phase relationship in the time domain, which corresponds to energy conversation, must be satisfied. The reverse process (generation of a pump photon from the combination of a signal and idler photon) is also possible when the phase relation is satisfied among them. The waves must also interfere constructively in the spatial domain in order to achieve the best conversion efficiency. Based on this requirement, the wave vectors of the pump, signal, and idler photons should satisfy
k p = k s + k i ,
which is known as the phase-matching condition. Here, kj are the wave vectors, with the suffixes j = p, s, and i corresponding to the pump, signal, and idler photons, respectively. A wave vector is a vector whose magnitude is the wave number and whose direction is parallel to the wave normal and perpendicular to the wave front.
In the wave picture, the phase-matching condition corresponds to efficient coherent energy mixing under the condition of constructive coupling of a pump wave and an idler wave to generate a signal wave. In the photon picture, it corresponds to momentum conservation k p = k s + k i in parametric processes such as OPA. The allowance of the condition is within the inverse of the beam widths of the pump and signal due to their finite widths ( Δ k p and Δ k s ), resulting in the angular dispersion in the idler beam, Δ k i . For ordinary materials, in their spectral range of transparency, which is the requirement for small absorption loss, the refractive index (n) has a normal dispersion relation. The refractive index in a non-absorbing region increases monotonically with photon energy ( ω ) in a concave manner. Here, concave means that the slope of the dispersion curve is positive, n / ω > 0 , and the slope monotonically increases with photon energy, as indicated by the inequality 2 n / ω 2 > 0 . Therefore, it is not possible for Equation (6) to be satisfied for common materials without birefringence, since the wave vector relation (6) is equivalent to the following relation.
n ( ω p ) ω p = n ( ω s ) ω s + n ( ω i ) ω i
In the case of SHG, the phase-matching condition implies that n(ω) must equal n(2ω), which is clearly impossible in ordinary materials based on the abovementioned inequalities relevant to the dispersion relations. In a birefringent material like a uniaxial crystal, the dispersion curves of the ordinary (o) and extraordinary (e) beams are generally different. Therefore, it is possible for Equations (6) and (7) to be simultaneously satisfied, i.e., to achieve phase-matching conditions. Phase matching is classified into Type-I and Type-II depending on the polarization of the signal and idler. Type-I phase-matching refers to the case when the polarization of the signal and idler are parallel, and Type-II phase-matching refers to the case when their polarizations are perpendicular. In practice, after the electric field polarizations of the signal and idler and the cut angle of the crystal are properly selected, the phase-matching condition is satisfied by tuning the crystal orientation (with respect to the input beam(s)). This phase-matching method is called the “angle tuning” method. There is another phase-matching method called “temperature tuning”, which takes advantage of the different temperature dependences of the dispersion curves.
Among the many nonlinear optical crystals, β-BaB2O4 (β-barium borate, BBO) is one of the most useful and frequently used in ultrafast laser systems, especially in combination with Ti-sapphire lasers, which are some of the most popular ultrashort pulse lasers. These crystals are used especially in the UV and visible light range due to the unique features of BBO: wide transparency range (189–3500 nm), wide phase-matching ranges (Type I SHG: 410–3300 nm, Type II SHG: 530–3300 nm), large second-order nonlinear coefficient (d32 = 2.22 pm/V, d31 = 0.16 pm/V), high damage threshold (>5 GW/cm2 for a 10 ns pulse, >50 GW/cm2 for a 1 ps pulse), and excellent optical homogeneity. In a uniaxial crystal, the ordinary and extraordinary rays can exist with polarizations that are perpendicular to each other, which is useful for the parametric interaction. Uniaxial crystals are classified into two groups in terms of their refractive indices: positive and negative crystals. In uniaxial crystals, there are two different refractive indices for the two polarization directions, parallel and perpendicular to the principle axis defining the uniaxial symmetry direction. The phase propagation properties of ordinary and extraordinary rays are governed by the ordinary index (no) and extraordinary index (ne), respectively. Positive and negative crystals are defined by the following: ne > no and no > ne, respectively. In BBO, which is a negative uniaxial crystal, Type-I (e → o + o) OPA is more suitable for ultrashort pulse generation than Type-II (e → o + e) OPA because of the smaller group velocity mismatch (GVM) and the larger effective nonlinear coefficient.
The phase-matching condition for OPA can be classified into collinear phase matching and noncollinear phase matching according to the propagation directions of the pump, signal, and idler beams in the OPA. These will be discussed in the following subsection.

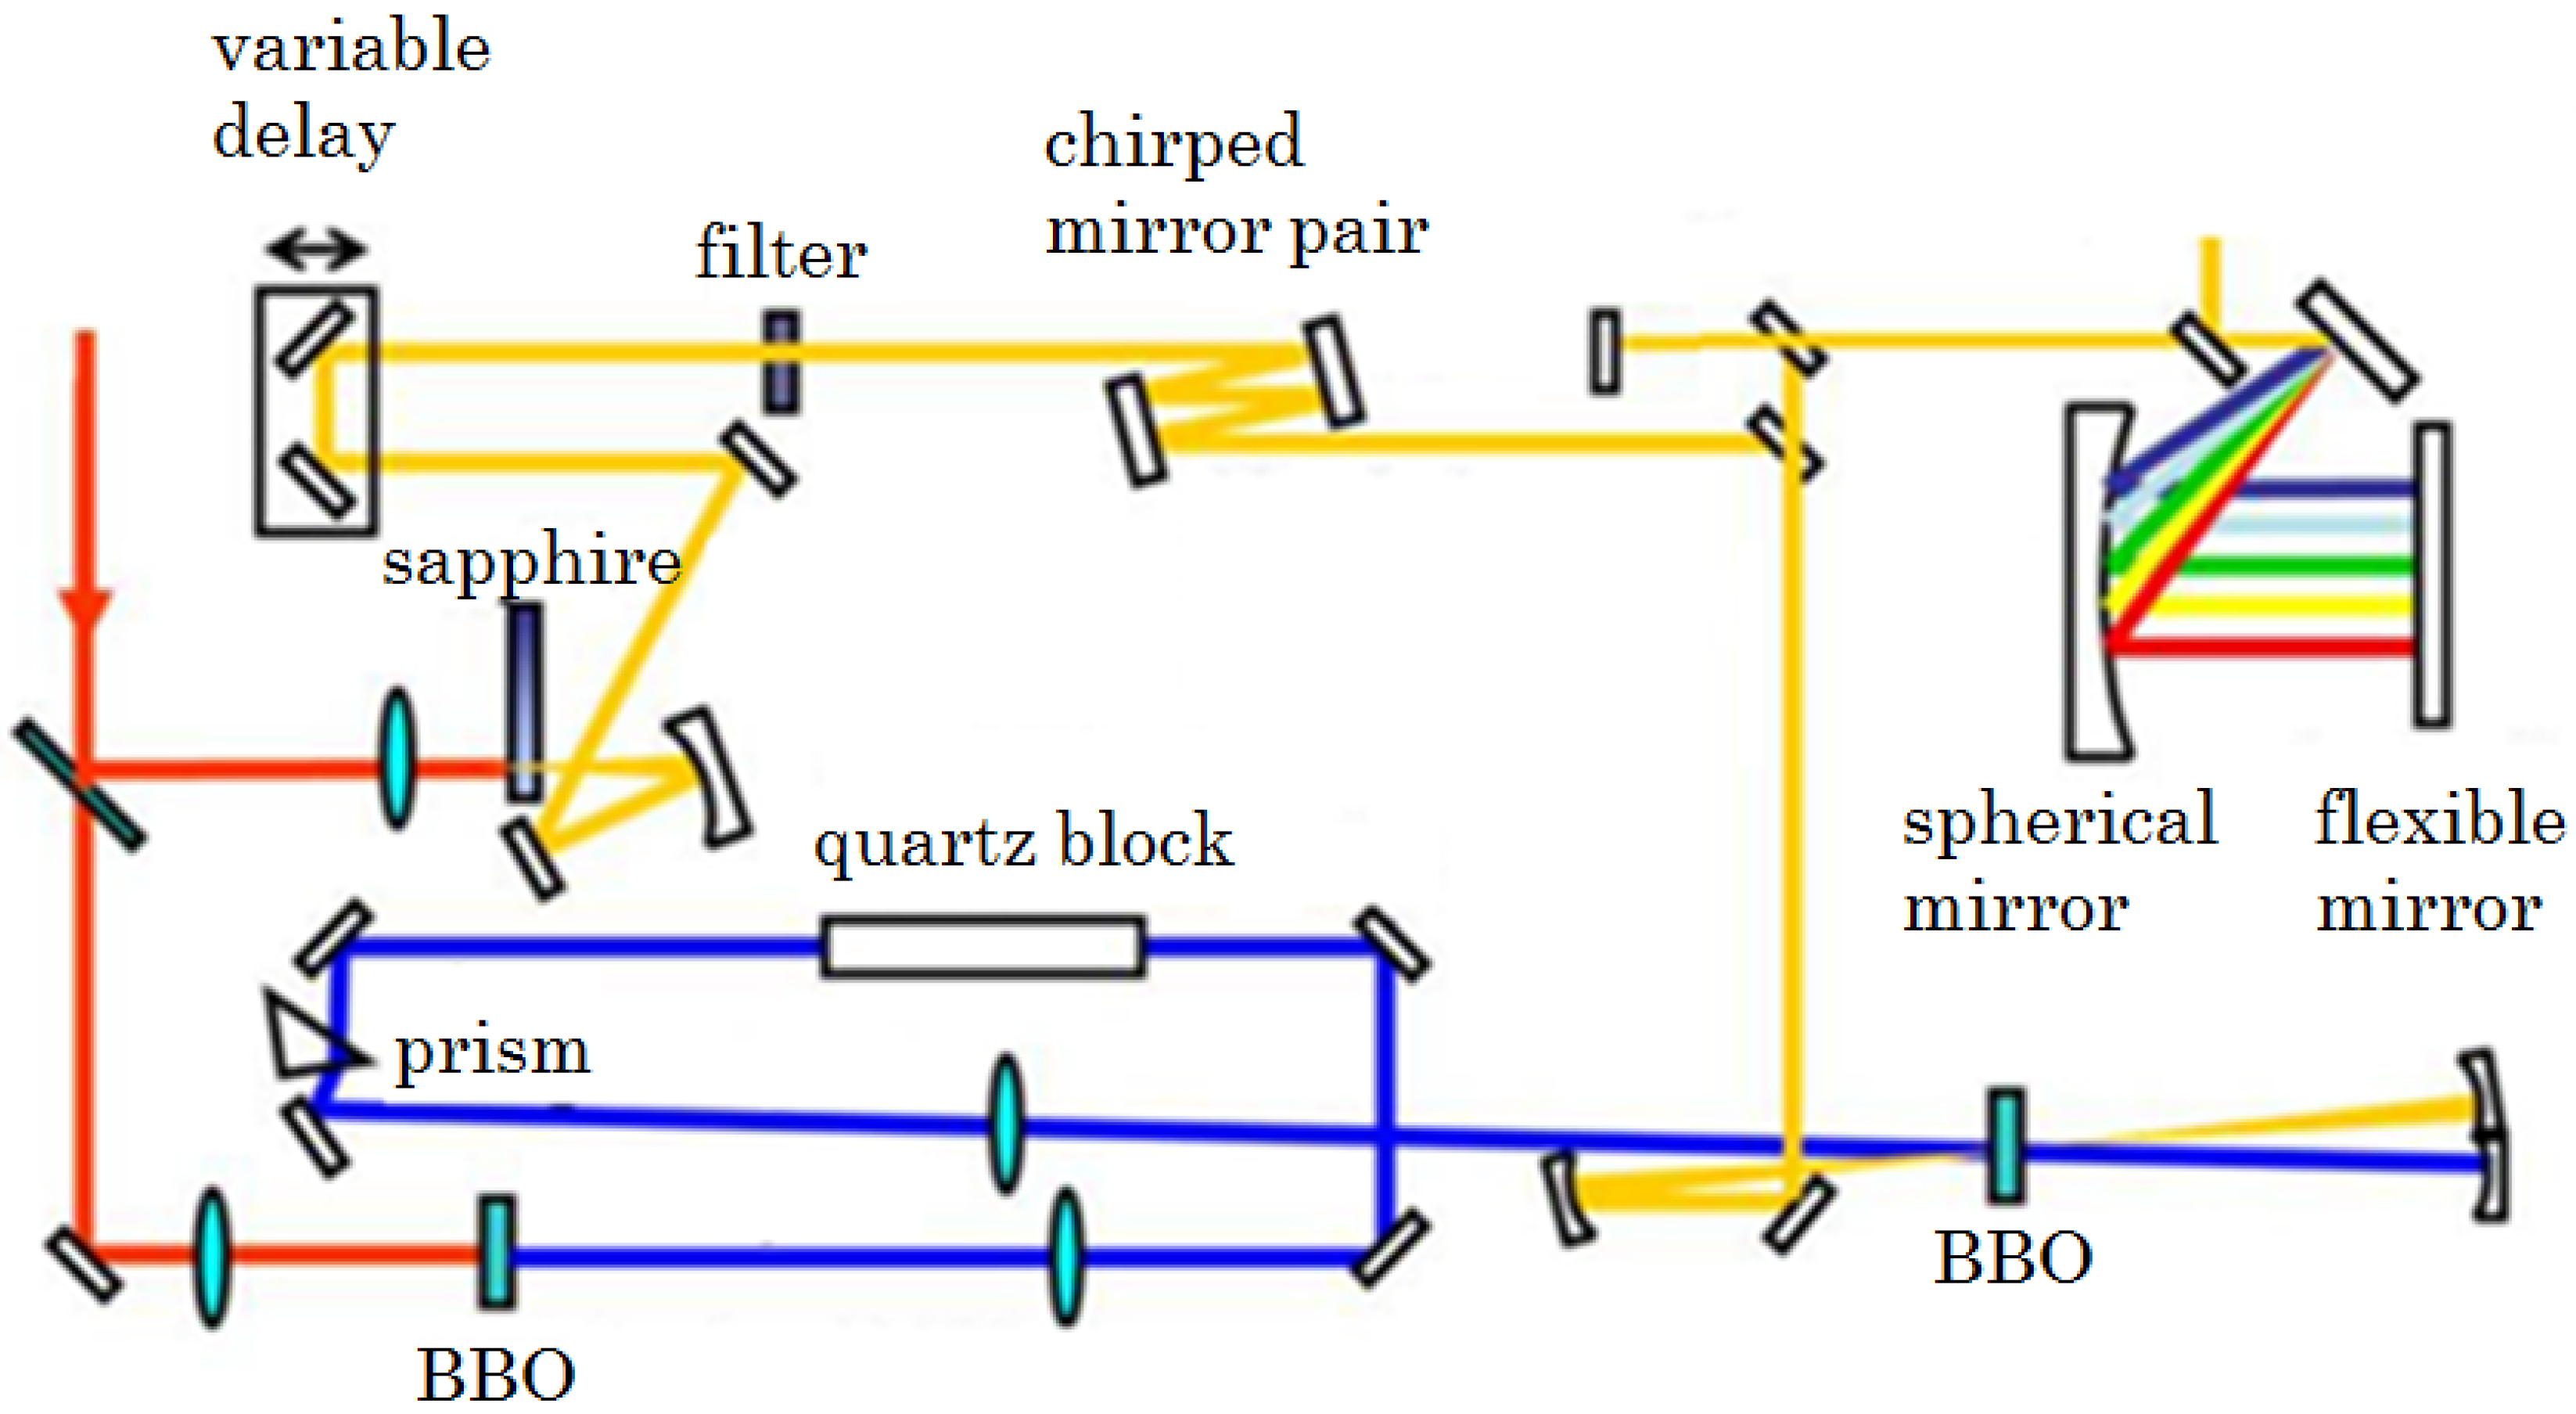
1.2. Visible Ultrashort Pulse Generation by Non-Collinear Optical Parametric Amplification

Fast chemical reactions that cannot be visualized by the naked eye can be made observable by utilizing a strobe light, as was first demonstrated by Prof. Porter [1]. The time resolution of the flash photolysis in their experiment was limited by the nanosecond duration of the discharge flash lamp used. Lasers [2] can be used to generate light for spectroscopic studies with a much higher intensity than that generated by flash lamps. The discovery of mode-locking [3] enabled the generation of ultrashort femtosecond laser pulses, which were applied for the observation of ultrafast processes in chemical reactions by Prof. Zewail [4]. His pioneering work was followed by time-resolved studies of various chemical reactions, which has led to a research field called femtochemistry. The method can also be used for the study of photophysical and photobiological processes like vision [5] and photosynthesis [6]. Ultrafast dynamics provides key information for the study of photosensors [7,8,9], optical memory [10,11,12], and optical switches [13,14,15].
For time-resolved spectroscopy, the ultrashort pulses need to be broadband and have high intensity. The Ti-sapphire laser is a commercially available light source that provides high-intensity ultrashort pulses in the near infrared (NIR) spectral region, corresponding to the gain bandwidth of the Ti:sapphire crystal. However, for the study of photochemical reactions caused by the absorption of visible light, it is necessary to generate visible ultrashort pulses, which can be prepared as follows.
The base of the intense ultrashort visible pulse is the Ti:sapphire laser. To obtain a high intensity pulse, the output from the Ti:sapphire laser oscillator is regeneratively amplified. To obtain broad spectrum, SPM of the amplified pulse is used.
SPM is one of the methods used to broaden the spectrum of the NIR pulses supplied by a Ti:sapphire laser. Although the spectrum of pulses generated by SPM covers the visible spectral region, the pulse intensity is insufficient for application to time-resolved spectroscopy. Thus, it is necessary to amplify pulses broadened by SPM. We used OPA, which is a widely used method to amplify light; however, its gain bandwidth is insufficient to amplify the visible broadband spectrum for generating ultrashort pulses as short as 10 fs. To solve this problem, we have developed a method called non-collinear optical parametric amplification (NOPA) [16,17,18], which is described below.
We have used the NIR pulsed output from a regenerative amplifier (Legend USP, Coherent Inc., California, U.S.A.) as the input seed source for the NOPA. The pump pulse of the NOPA is a UV pulse obtained by SHG with BBO of the regenerative amplified pulse. The regenerative amplifier has a repetition rate of 5 kHz, a center wavelength of 800 nm, a pulse energy of 0.5 mJ, and a pulse duration of 35 fs. Focusing the NIR pulse into a sapphire plate with a thickness of 2 mm produces a broadband spectrum, which is often referred to as “a white light continuum (WLC)”, by the SPM process as shown in Figure 1.
To use the WLC as a seed pulse in the NOPA, its temporal duration should be compressed to be equal to or slightly shorter than that of the pump SHG pulse for the NOPA for efficient amplification. Generation of the WLC (in the sapphire plate) results in a temporally stretched pulse, so a pair of chirped mirrors is employed for pulse compression. In addition, the NOPA pump pulse is stretched to better match the pulse duration of the seed, as described below.
The NIR pulse from the regenerative amplifier was focused into a thin BBO (β-BaB2O4) crystal with a thickness of 0.4 mm to generate a second harmonic (SH) pulse, which acts as the NOPA pump pulse. The SH pulse was guided through a quartz glass block with a length of 100 mm to stretch it before being focused into another BBO crystal along with the seed pulse to generate the NOPA output. The BBO crystal used for NOPA has a thickness of 1 mm and a cut angle of 31.4°, which is ideal for generating the broadest spectral pulse with a center around 620 nm. The pump pulse and the seed pulse were focused into the BBO crystal with a non-collinear angle of 3.7°. Under these conditions, the seed pulse was amplified in most of the visible spectral region to generate the NOPA signal. A schematic illustration of the NOPA setup is presented in Figure 2.
The pulse duration of the NOPA signal was compressed using a diffraction grating and a deformable mirror. By using the compressor shown in Figure 2, the setup itself introduces negative chirp to compensate for the material chirp caused by the BBO crystal used for NOPA. Higher-order chirp was compensated for by adjusting the electric voltages applied to the deformable mirror (linear piezoelectric deformable mirror, Flexible Optical B.V.).
The compressed NOPA signal pulse was separated into two beams using a quartz glass plate with a thickness of 1 mm. The two beams have the same pulse duration and a power ratio of 10:1. The higher (lower) intensity beam was used as the pump (probe) pulse for pump-probe measurements. Their sum-frequency spectrum was measured as a SHG-FROG (second-harmonic generation frequency-resolved optical gating) trace by scanning the optical delay between the pump pulse and the probe pulse. The pulse duration was estimated to be 10 fs from the measured SHG-FROG trace.

2. Spectroscopic Application of the Ultrashort Laser Pulses

2.1. Ultrafast Time-Resolved Spectroscopy Using Visible Pulses

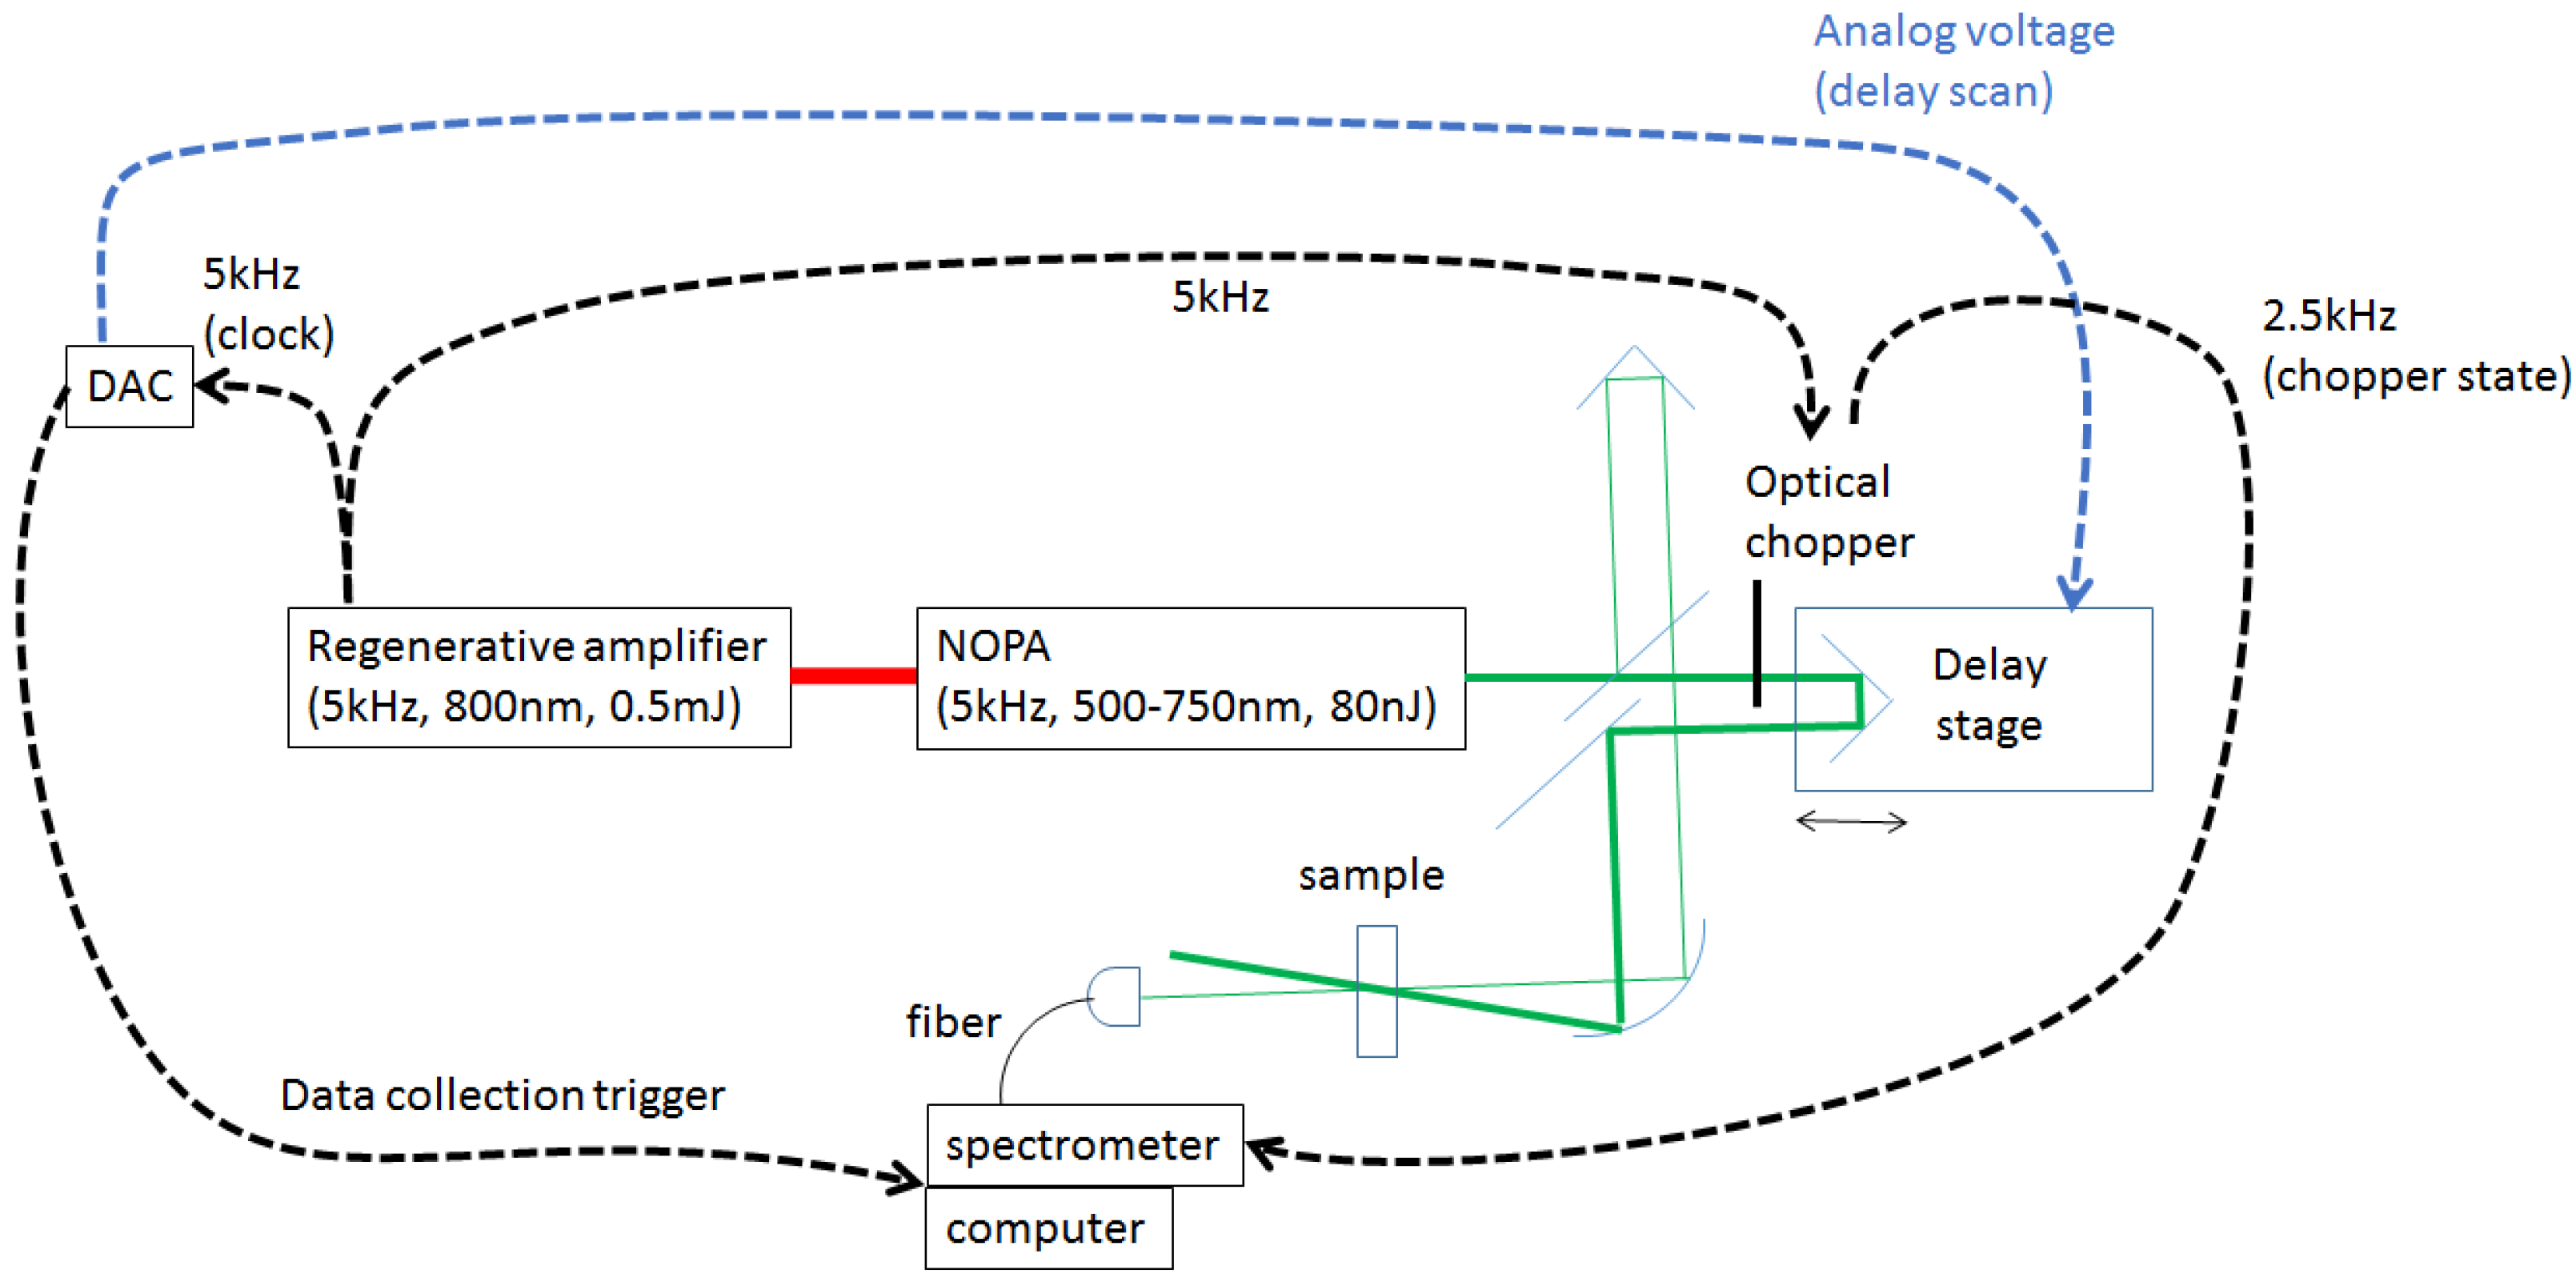
2.1.1. Fastscan Time-Resolved Transient Absorption Spectroscopy System

Ultrashort visible laser pulses can be used to study the ultrafast dynamics of various photoreactions. In particular, utilizing a 10-fs visible pulse, we can study electronic and vibrational dynamics simultaneously as follows.
Wave packet motion on the energy potential surface with the period of molecular vibration can be observed as changes in both shape and intensity of the transient absorption spectrum. They can be measured with the time resolution of the pulse duration, which is enough to temporally resolve the effect of molecular vibration with a typical period of 10–100 fs. To study the electronic and vibrational dynamics simultaneously, the transient absorption spectra should be measured in small steps over a wide range of time delays. If the delay is scanned using a motorized stage, typical measurements take around one hour per scan of the entire delay region. However, laboratory conditions such as temperature and humidity change on the order of several minutes. Thus, the results obtained in the one-hour scan are drastically affected by the instability of the light source caused by such changes in the laboratory conditions. Moreover, the long measurement time causes serious damage accumulation in the sample over the course of the measurement. To overcome these problems, we have developed a fastscan time-resolved transient absorption spectroscopy system, which can perform one scan in five seconds, thus avoiding the damage to the sample and the effect of light source instability. A schematic illustration of the fastscan system is presented in Figure 3.
A 5-kHz signal synchronized with the regenerative amplifier laser pulse was sent to a digital-to-analog converter (DAC) and an optical chopper. The DAC sends a data acquisition trigger to the spectrometer at 5 kHz and an analog voltage to an optical delay stage. The optical chopper in the path of the pump pulse was operated at 2.5 kHz and synchronized with the laser repetition rate of 5 kHz. The spectrum of the probe pulse transmitted through the sample, with and without excitation by the pump pulse, was measured by the spectrometer. The fastscan system has improved the reproducibility and reliability of time-resolved transient absorption spectrum measurements. Details regarding this method have been reported previously in [19,20].

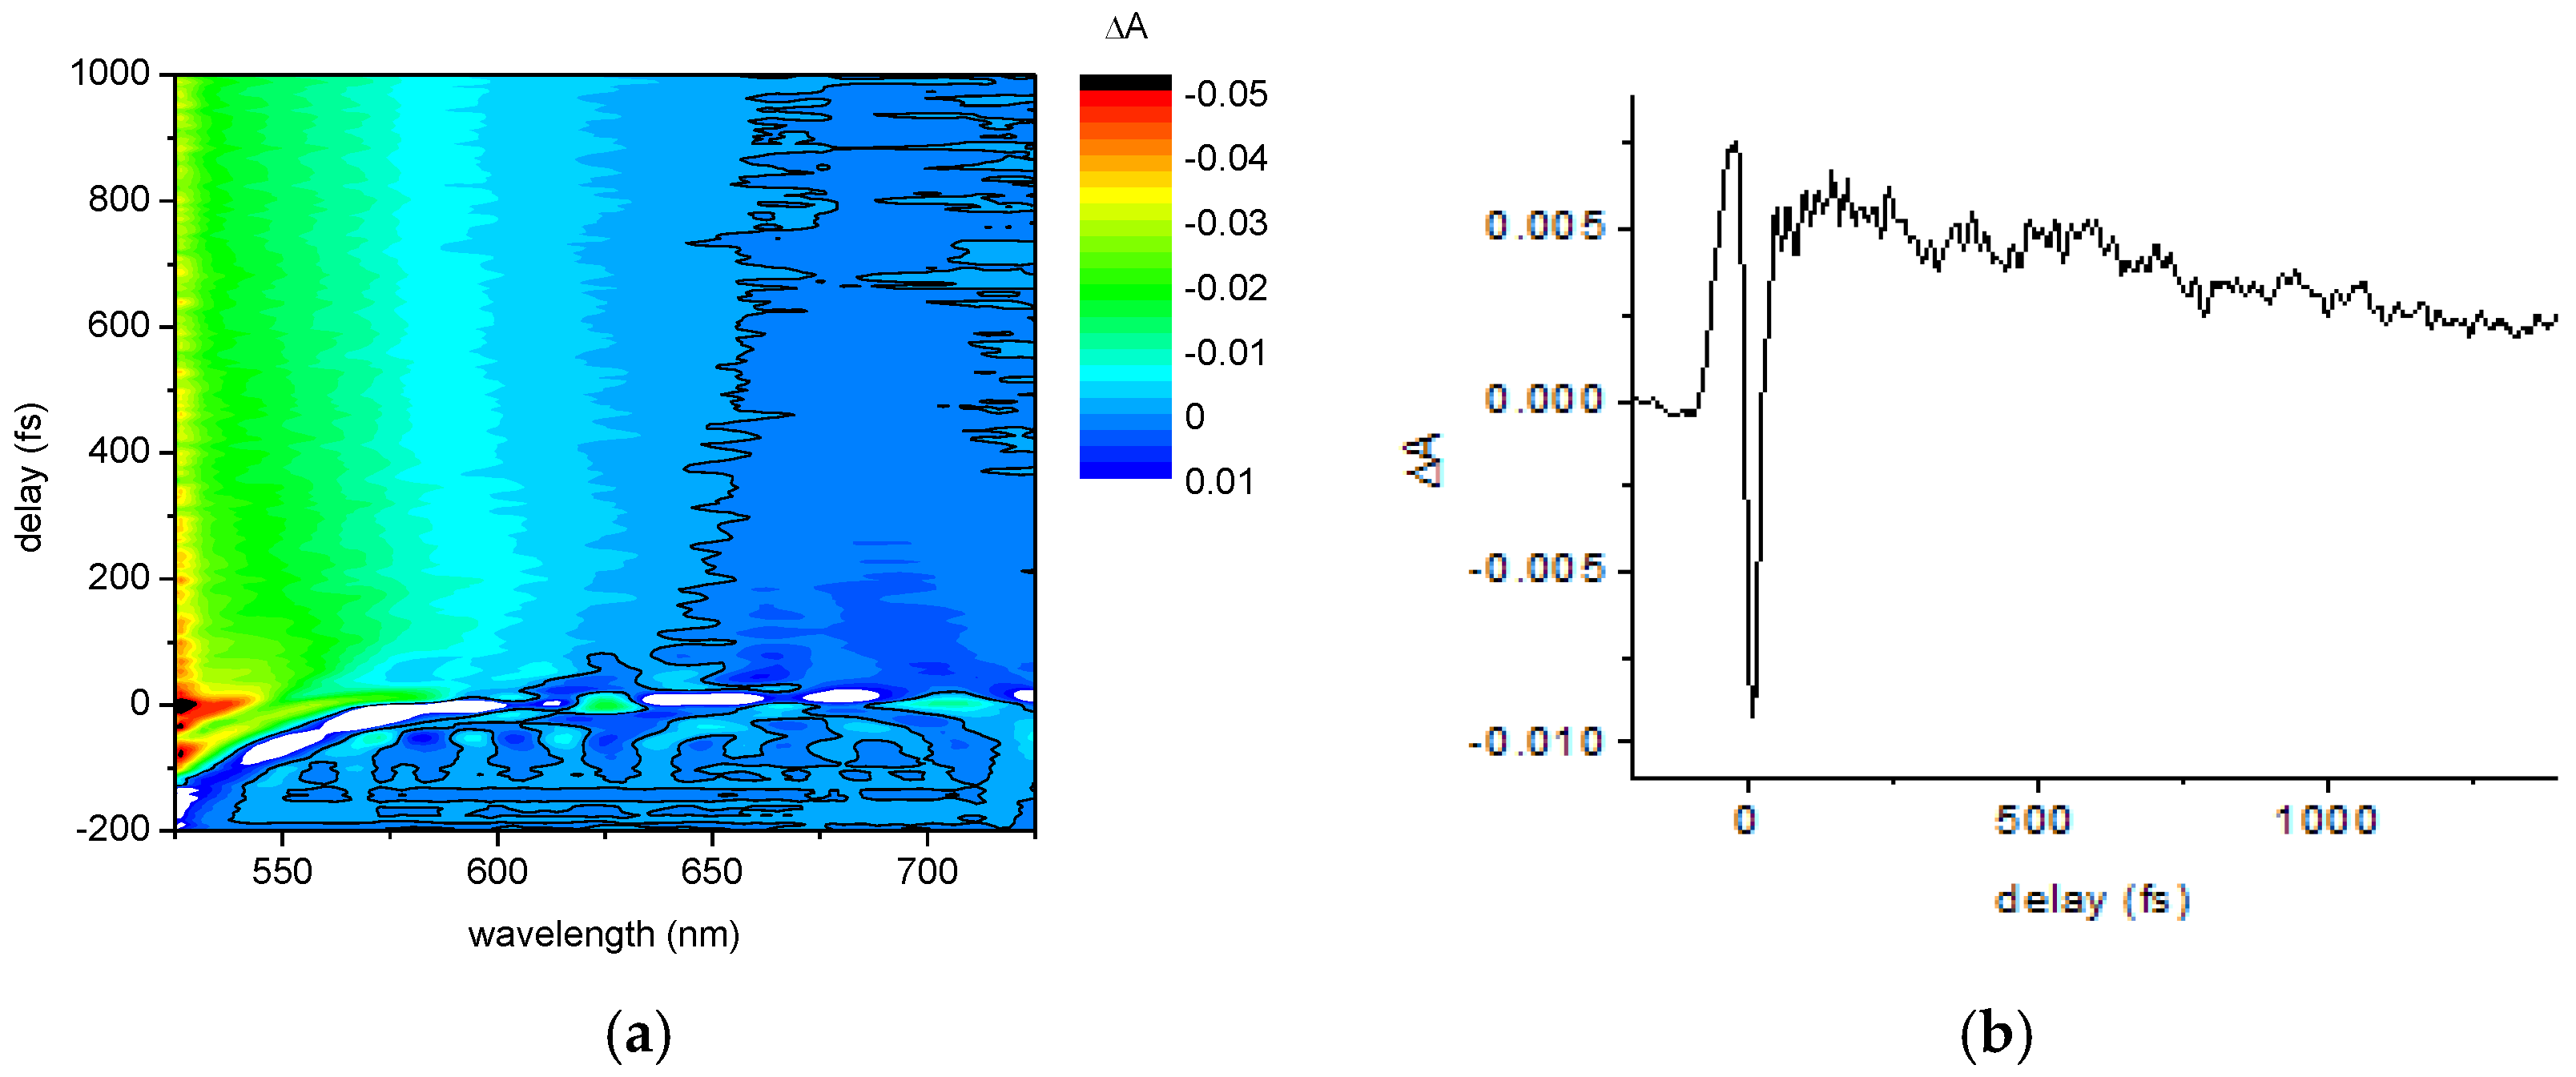
2.1.2. Ultrafast Electronic and Vibrational Dynamics Measured Using Visible Pulse

Visible ultrashort pulses have been used to measure time-resolved transient absorption spectra by the pump-probe method. The measurements were made with a time resolution of 10 fs, which is enough to temporally resolve the signal modulation caused by molecular vibrations with a period of 10 fs or longer. The system investigated is a benzene solution of a photovoltaic polymer, poly(3-hexylthiophene-2,5-diyl) (P3HT). Figure 4 shows the time-resolved transient absorption spectra measured using a pump-probe delay step size of 3.58 fs and a wavelength step size of 2.57 nm.
The slow decay observed in Figure 4b reflects the electronic dynamics of the system. Meanwhile, the fast modulation on the trace reflects the quantum beat (QB). The QB signal is due to the changes in intensity of the ground-state and excited-state absorption and induced emission caused by molecular vibration.
Figure 5a shows the Fourier power spectrum of the transient absorption trace of Figure 4b, which agrees with the Raman spectrum of the sample. The peaks observed around 1440, 1380, and 730 cm−1 were assigned to the Raman-active C=C stretching mode of the P3HT thiophene ring, the C–C skeletal stretching mode, and C–S–C deformation, respectively. The modes observed around 990 and 1170 cm−1 correspond to the ring stretching mode and the C–H bending mode of benzene.
The time-gated Fourier transform of the transient absorption trace in Figure 4b was calculated using a Blackman window with a full width at half maximum of 280 fs, as shown in the spectrogram plotted in Figure 5b. The spectrogram shows that the vibrational modes decay on the femtosecond time scale. Therefore, to estimate their lifetimes, we have analyzed the vibrational dynamics using the linear prediction singular value decomposition (LP-SVD) method. The results are summarized in Table 1.
The P3HT molecular vibrational modes corresponding to the solvent at frequencies of 991 and 1174 cm−1 have lifetimes longer than the longest measured pump-probe delay time of 1.4 ps. Thus, these modes are assigned to the species with the longer lifetimes. Since there is no appreciable transient absorption signal after 5 ps, the longer life component means the electronic ground state. The P3HT vibrational modes observed at 1439 and 1378 cm−1, whose lifetimes are shorter than 1.4 ps, are thought to correspond to vibration in an excited electronic state.

2.2. UV and DUV Pulse Generation and Spectroscopy

Several schemes have been demonstrated for the generation of deep-ultraviolet (DUV) pulses shorter than 10 fs. Second-order [21] as well as third-order NLO effects [22,23,24,25,26] have been employed for this purpose, and some of the generated pulses have enabled the investigation of chemical reactions initiated by DUV radiation [27,28]. Compared to the visible spectral range, the generation and manipulation of sub-10-fs pulses is not easily realized in the DUV range. This is because of the large group-velocity dispersion (GVD) induced in transparent media in this wavelength range. For instance, the GVD in 2 m of air stretches a 10-fs DUV pulse to a duration longer than 50 fs, and the GVD in a 1-mm-thick fused-silica plate has a similar effect. This makes it difficult to use short DUV pulses in atmosphere. Furthermore, when shortening the pulse duration, the GVD compensation must be done without inducing high-order spectral phase distortion, which deteriorates the temporal quality of the pulse by generating satellite pulses, and makes it difficult to apply the pulses in spectroscopy.
We have recently investigated two schemes for the generation of sub-10-fs DUV pulses that do not suffer from the above-mentioned problems. The sub-10-fs pulses generated here can be applied to ultrafast spectroscopy performed under atmospheric conditions. One of the schemes (i) does not involve any pulse compressor for the dispersion compensation, while the other one (ii) uses external pulse compressors that allow one to compensate for a large amount of GVD. Both schemes generate single DUV pulses with durations of 10 fs or shorter and with smooth temporal profiles [26,29].

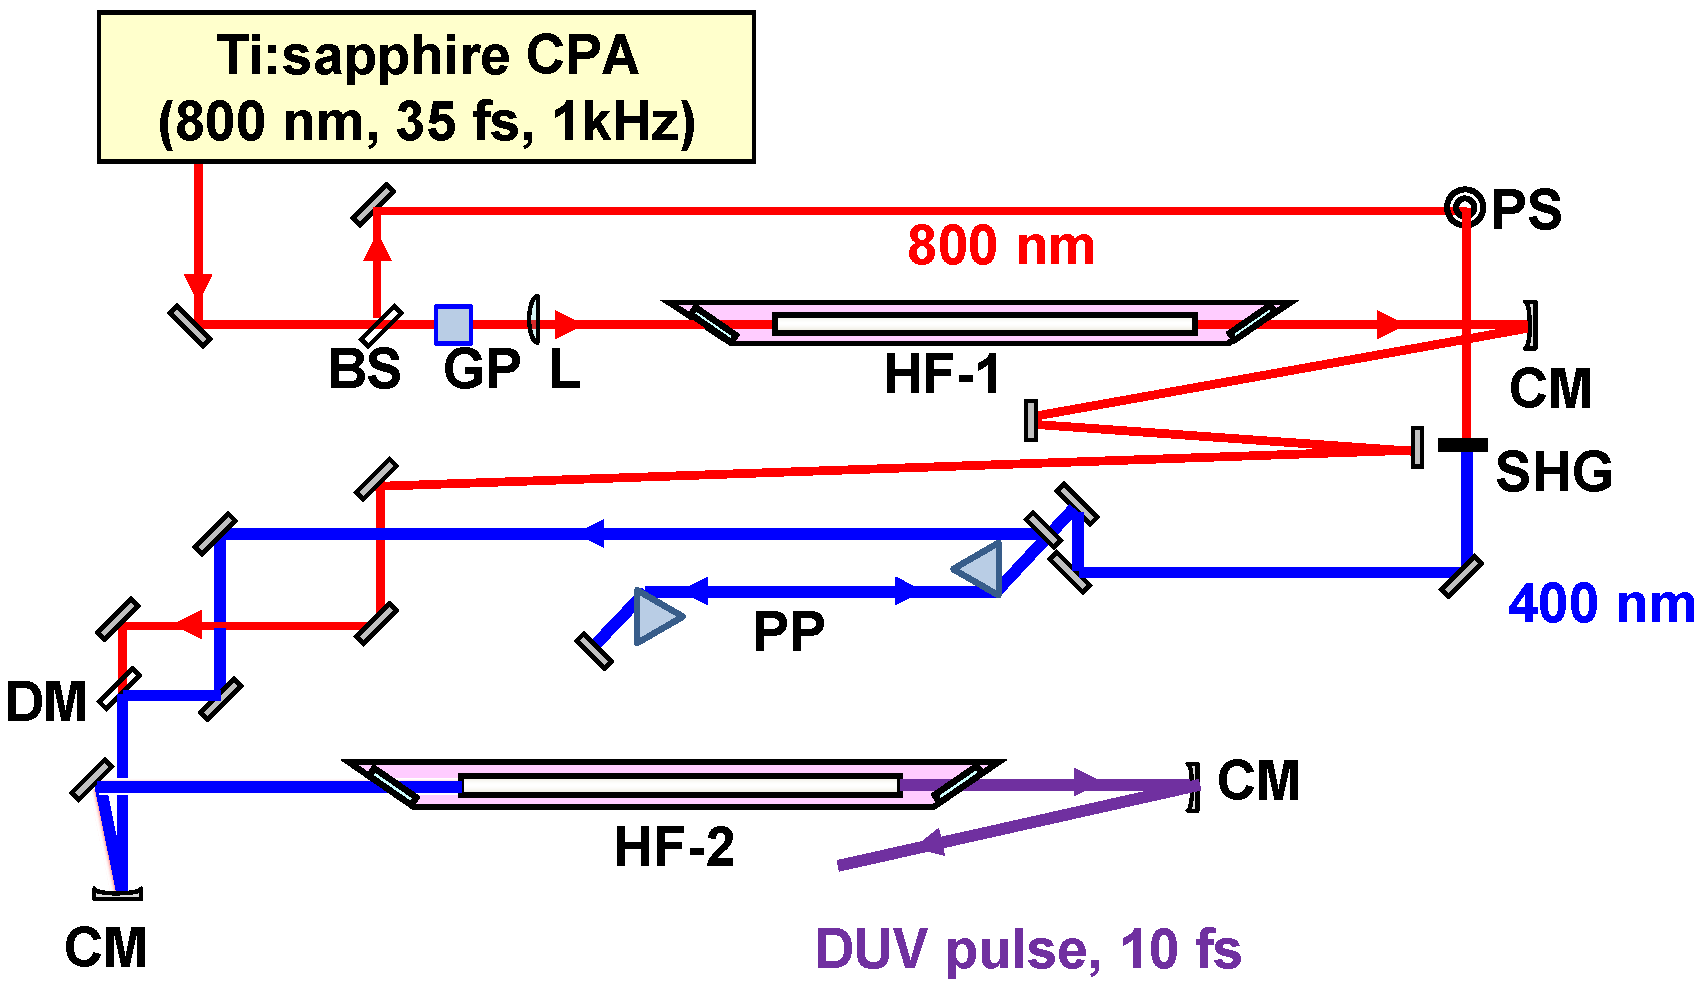
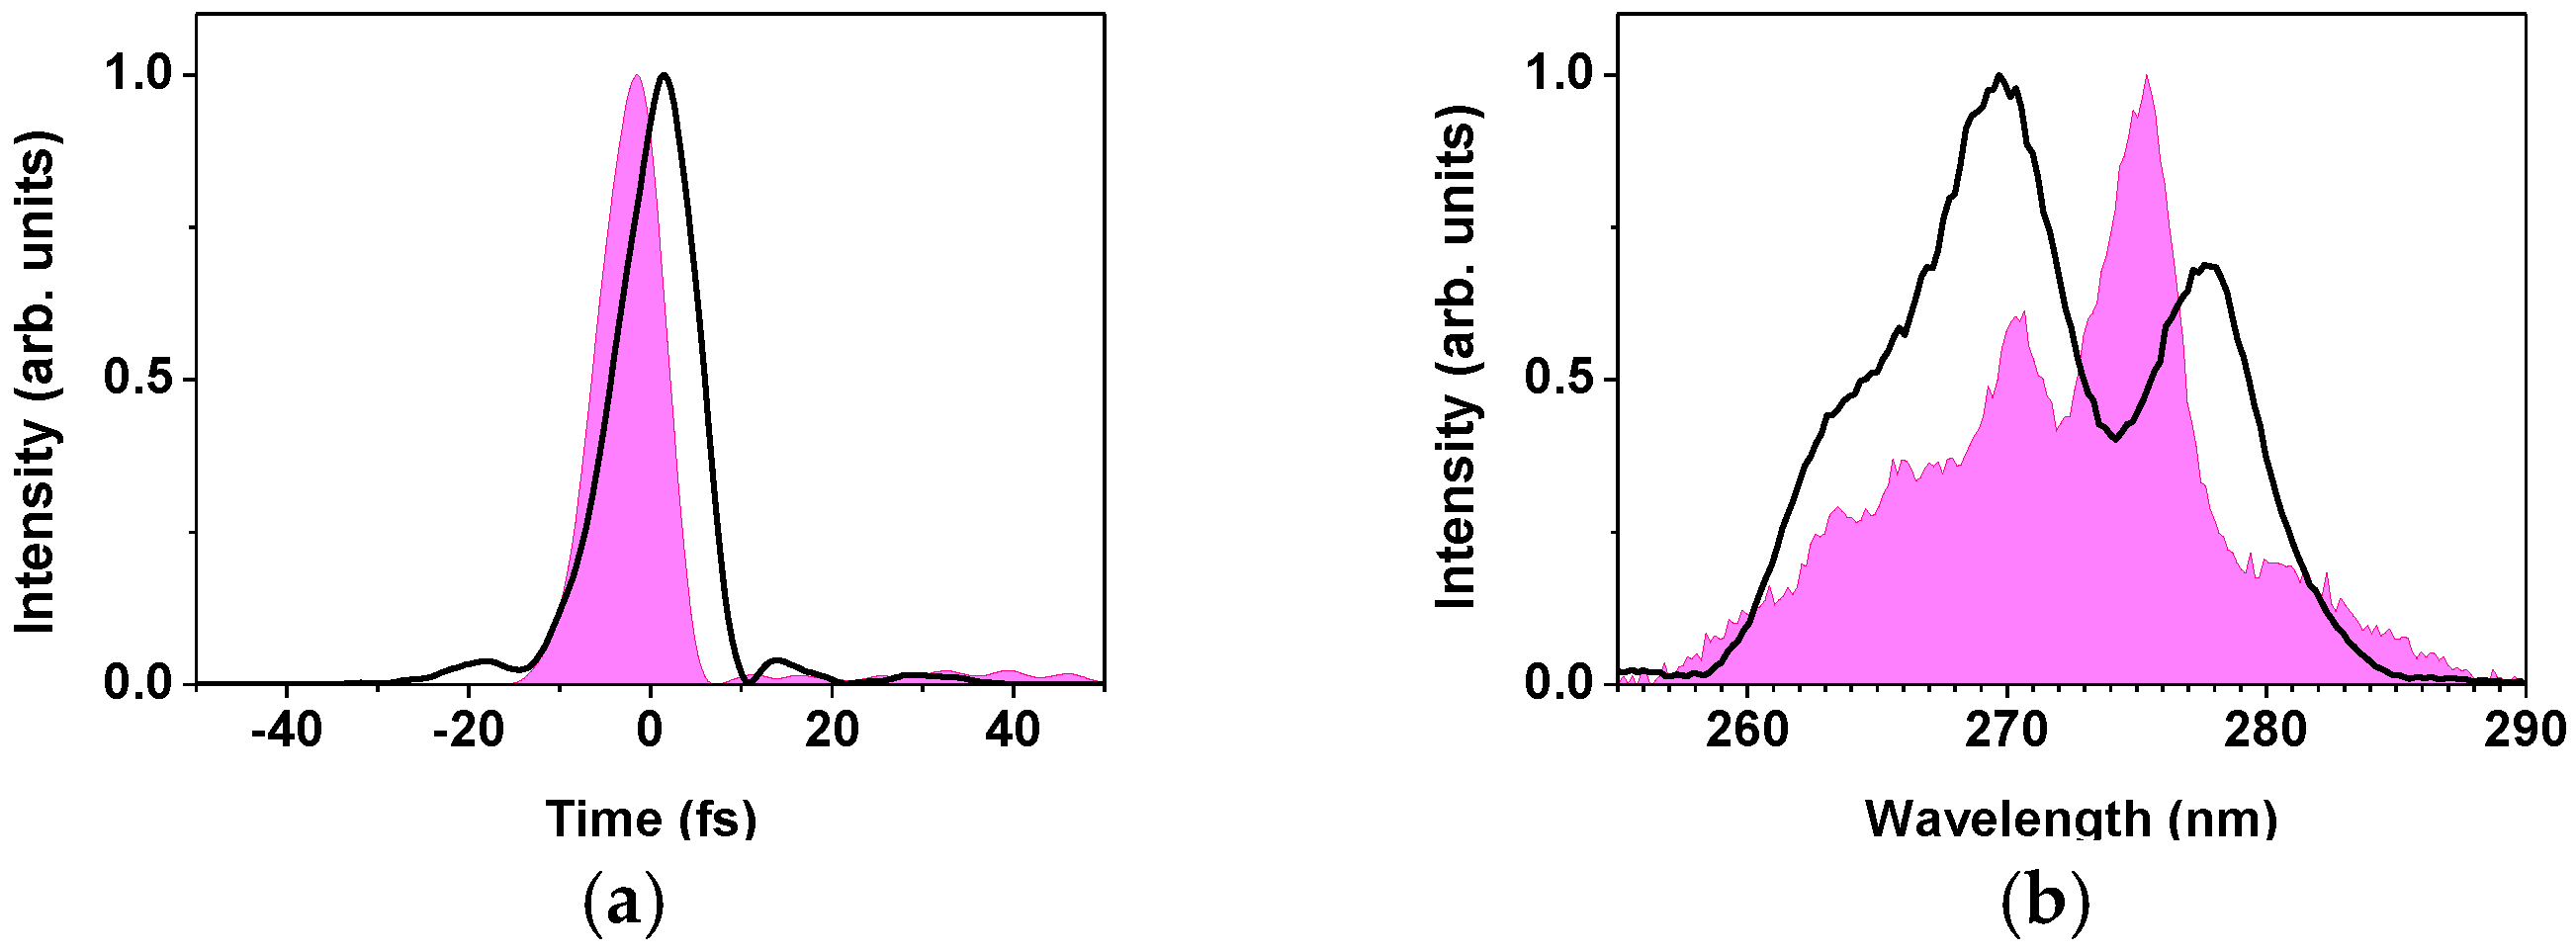
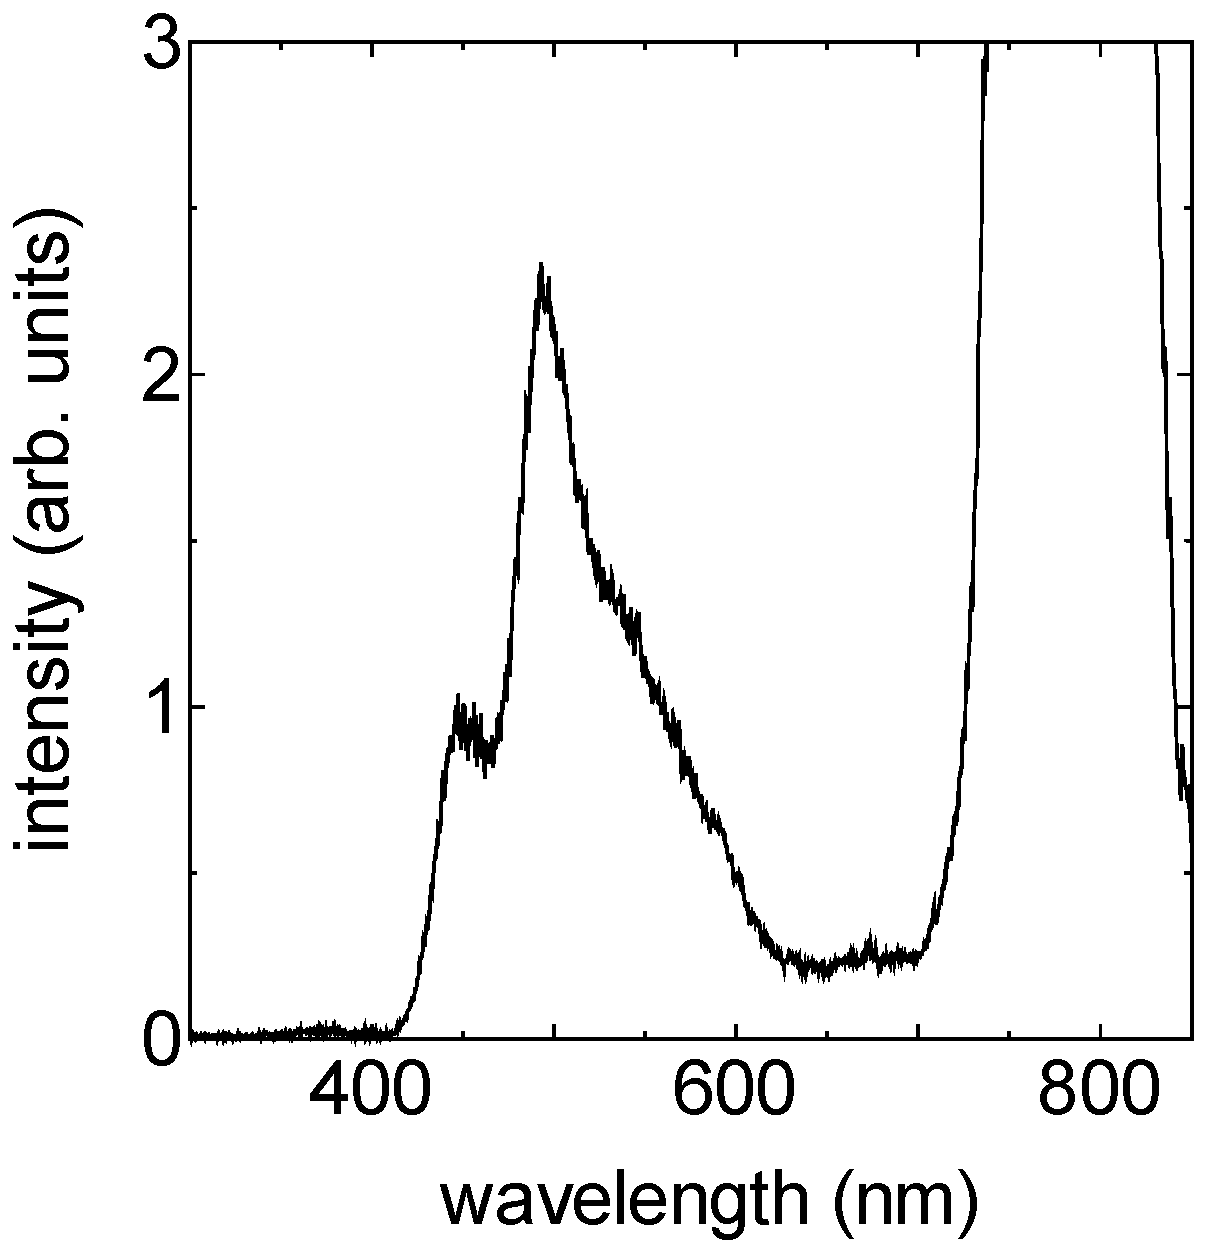
2.2.1. Sub-10-fs Deep-Ultraviolet Light Source

Both schemes mentioned above are based on chirped-pulse four-wave mixing (FWM), where two chirped input pulses are employed to generate a DUV pulse [30,31]. The central wavelengths of the two input pulses are located in the near-infrared (NIR) (800 nm) and near-ultraviolet (NUV) (400 nm) ranges. The former input pulse is positively chirped while the latter is negatively chirped to generate a negatively chirped DUV pulse, and this is schematically illustrated in Figure 6. The negative frequency chirp is advantageous since it cancels out the pulse broadening effect that originates from the above-mentioned GVD [26,30,31,32,33]. The cancellation of the material dispersion does not induce significant high-order dispersion when the magnitude of the dispersion is not too large, leading to a smooth temporal profile of the compressed DUV pulse.
To generate sub-10-fs DUV pulses using chirped-pulse FWM, at least one of the input pulses must have a broad bandwidth that supports a transform-limited pulse duration of shorter than 10 fs. In addition, the input pulses must have smooth temporal phase profiles or must not have appreciable high-order phase distortion. Otherwise, the generated DUV pulse will have complex phase and spectral structures, which prevent the generation of short DUV pulses with smooth temporal profiles. Ideally, a linearly chirped input pulse with a smooth temporal profile is suitable for the generation of a sub-10-fs DUV pulse with excellent temporal characteristics. However, such an input pulse is extremely difficult to generate in practice.
Alternatively, in general, sub-10-fs pulses are generated by spectral broadening of an intense NIR pulse via SPM followed by compensation of the group-delay dispersion (GDD) [34,35,36]. The broadband pulse generated by the SPM contains high-order temporal phase distortion consisting of both negative and positive frequency chirps. Although the whole temporal profile of the broadband pulse with the complex phase is not suitable for chirped-pulse FWM, the pulse transiently behaves like a linearly and positively chirped pulse around the middle of the temporal profile. By temporally extracting this region and forcing it to interact with the other input pulse, it is possible to realize an ideal interaction between two quasi-linearly chirped input pulses. This produces a linearly negatively chirped broadband pulse, which after the compression, results in a sub-10-fs DUV pulse with a smooth temporal profile.
Based on the above discussion, we have investigated a scheme that involves two input pulses for chirped-pulse FWM: a broadband and long NIR pulse generated by SPM and a relatively narrowband NUV pulse with negative chirp [26,37]. A schematic illustration of the optical setup is depicted in Figure 7, and applies to both schemes (i) and (ii). As described in detail elsewhere [26,29], the NIR output of a Ti:sapphire chirped-pulse amplifier (CPA), which has a pulse duration of 35 fs, a center wavelength of 800 nm, and a pulse energy of 1.2 mJ, is first split into two pulses using a beam splitter (labeled BS in the figure). The spectral width of one of the pulses is broadened by SPM in a gas-filled hollow fiber placed after a glass plate used for lengthening the pulse duration. The specific role of the glass plate is to adjust the temporal width of the positively chirped part inside the broadband NIR pulse after the hollow fiber [26,37]. The other NIR pulse is frequency-doubled to produce a NUV pulse at 400 nm. The pulse durations of the broadband NIR pulse and the NUV pulse are adjusted with chirped mirrors and a pulse stretcher consisting of two prisms. The resultant NUV pulse is negatively chirped, whereas the broadband NIR pulse is positively chirped; the pulse duration of the latter is longer than that of the former. The two pulses are eventually focused into another gas-filled hollow fiber to induce the chirped-pulse FWM.
In scheme (i), which does not employ an external pulse compressor, the DUV pulse emerging from the hollow fiber has a pulse energy of about 0.3 μJ [26] and is compressed by propagation through air [26,28]. The shortest pulse duration obtained using this scheme is 8.7 fs, and these pulses have been applied to ultrafast pump-probe spectroscopy in the liquid phase [28]. The temporal profile of the generated pulse has a single pulse structure (Figure 8a) and does not lack any spectral component within the spectral range of 257–288 nm (Figure 8b). The temporal profile of the DUV pulse was characterized using a dispersion-free self-diffraction FROG setup that prevented pulse broadening during the characterization [26].
The limitation of scheme (i), if any, is the fact that the maximum amount of material dispersion being compensated for is determined by the magnitude of the negative frequency chirp of the DUV pulse. To compensate for a larger amount of normal GVD, e.g., for a longer propagation distance in air before the sample position, longer input pulses are required for the chirped-pulse FWM to increase the magnitude of the negative frequency chirp of the DUV pulse. This eventually leads to a reduction in the energy of the DUV pulse. Scheme (ii) discussed below may be employed in such cases.
In scheme (ii), an external pulse compressor consisting of a pair of prisms and a pair of gratings is added to the optical setup of scheme (i) to increase the amount of acceptable normal GVD being compensated for [29]. The GDD and the third-order dispersion of the DUV pulse are adjusted by the compressor to generate 10-fs DUV pulses without the generation of satellite pulses arising from the third-order dispersion. In this scheme, a GDD of up to 1000 fs2 can be compensated for while retaining the single-pulse structure, as shown in Figure 8a. The pulse durations of the input pulses for the chirped-pulse FWM are adjusted to be shorter than those used in scheme (i), ensuring high-efficiency frequency conversion into the DUV. Note that the NIR pulse is still kept longer than the NUV pulse to produce the smooth temporal phase and spectral profile (Figure 8b). The energy throughput of the external pulse compressor is limited to less than 20% [29], as it is dominated by the low diffraction efficiencies of the gratings. However, the energy reduction is compensated for by the increased efficiency in the FWM. The pulse energy of the DUV pulse is higher than 100 nJ, which is sufficient for spectroscopy, after the compressor. Although both schemes (i) and (ii) can be used to generate DUV pulses of 10 fs or shorter durations, scheme (i) gives a shorter pulse duration than scheme (ii), where the fourth-order dispersion is much larger than that in the former.

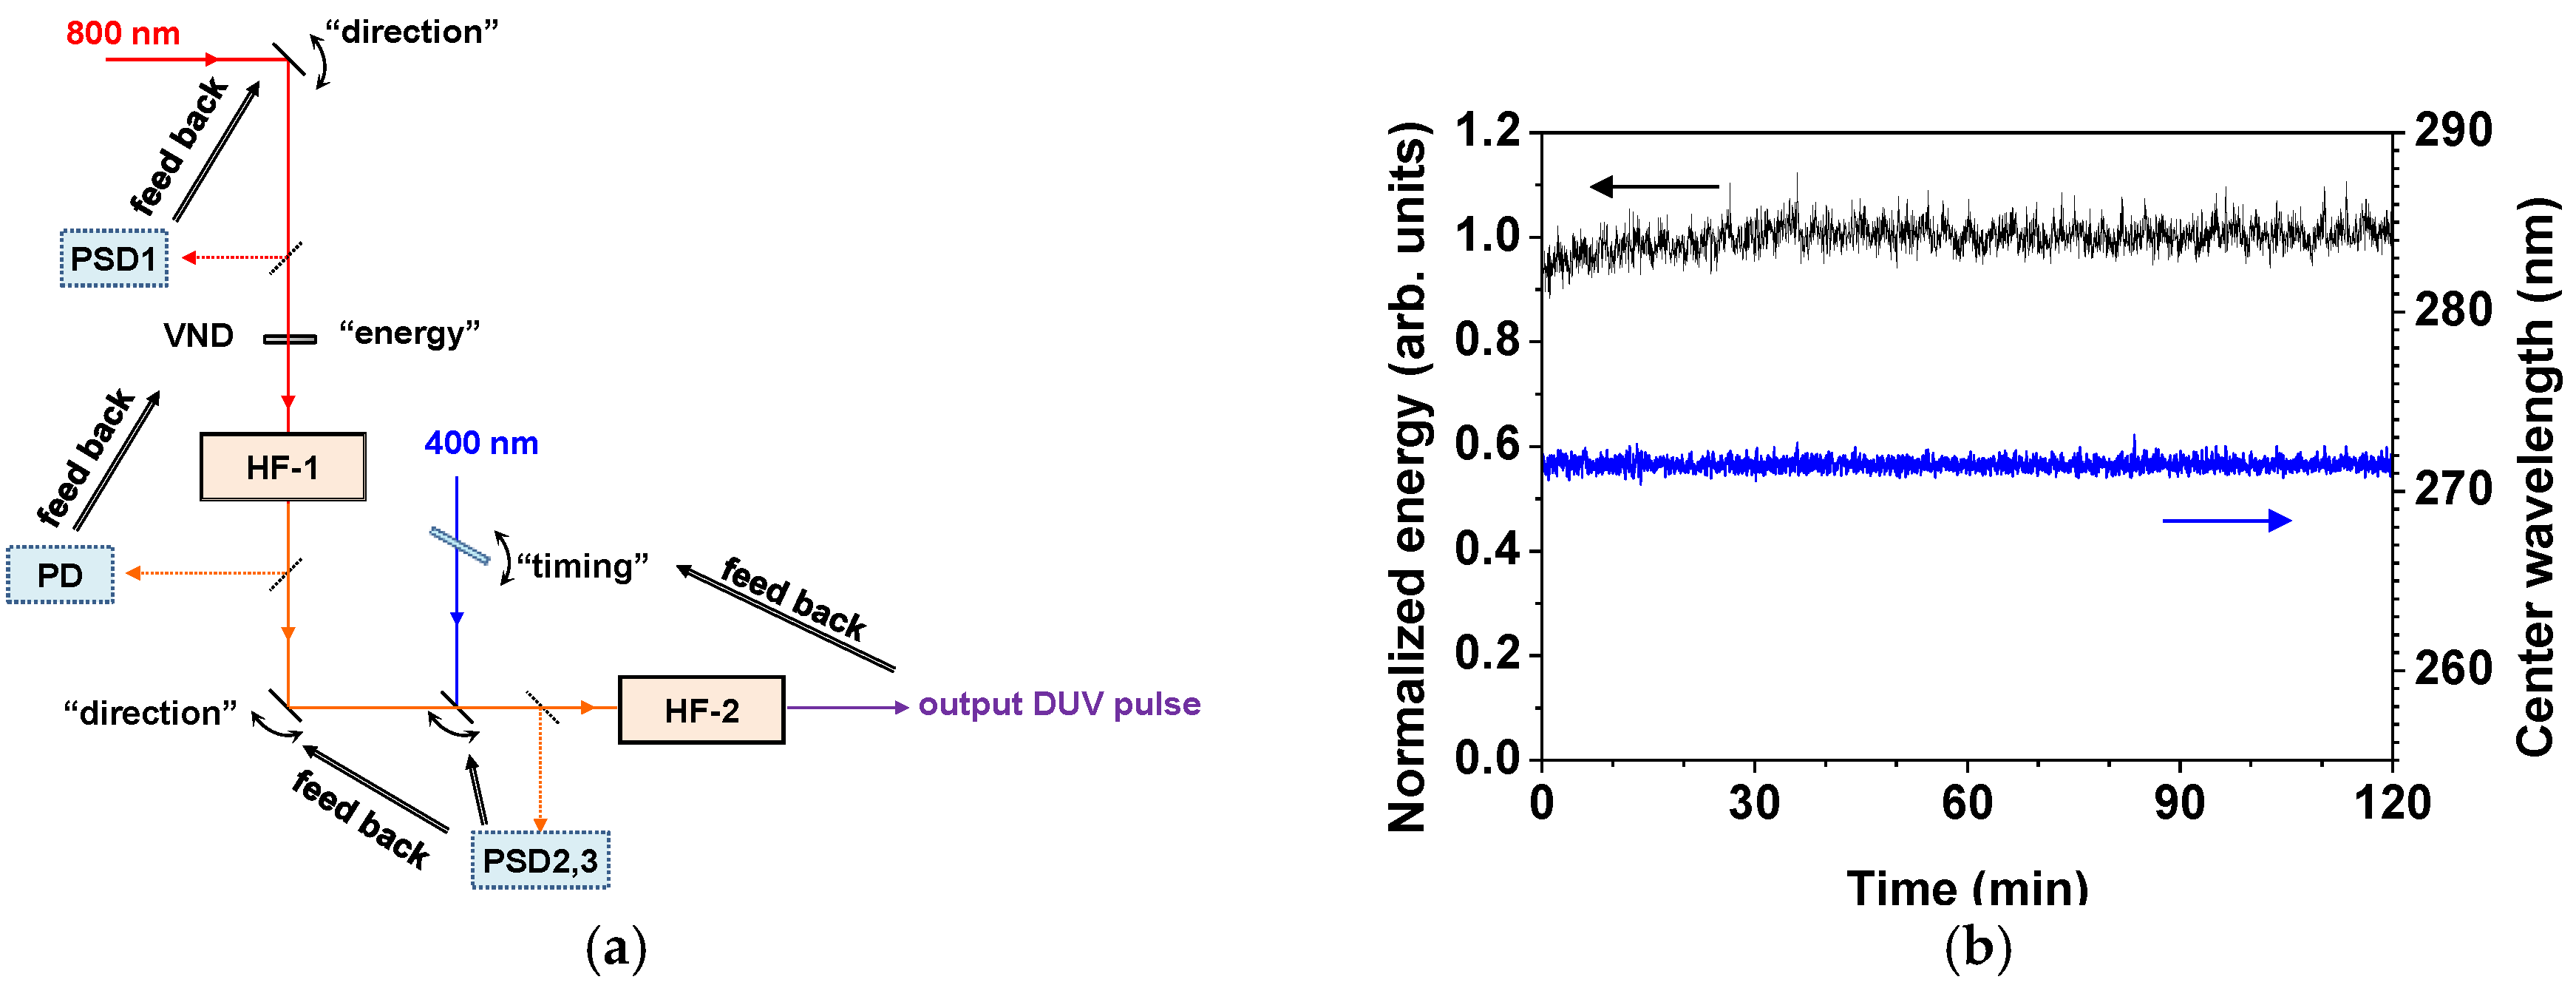
2.2.2. Stabilization of the Light Source

For spectroscopic applications of ultrashort DUV pulses, the pulse stabilities in terms of the pulse energy and the temporal and spectral intensity profiles are important since they affect the reproducibility and the signal-to-noise ratio of the spectroscopic signals. Because the schemes presented above employ two NLO processes (SPM and FWM) that are sensitive to intensity fluctuations of the input pulses, stabilization of the intensities is necessary when these fluctuations are not negligibly small. Moreover, the schemes utilize hollow fibers in which the energy coupling efficiency into the propagation modes is sensitive to the spatial positions of the input beams. As is well known, the beam-pointing instability of the input beams is transformed into energy instability inside the fibers, which also deteriorates the energy and spectral stabilities of the DUV pulse.
We have quantitatively investigated the energy and spectral stabilities of DUV pulses, as well as other parameters such as bandwidth and pulse duration [38] based on the scheme illustrated in Figure 9a. The bandwidth and accordingly its temporal width DUV pulses are affected by that of the broadband NIR pulses, so the NIR pulse properties are stabilized at the beginning of designing the optical system and its alignment. Stabilization of the DUV pulses is achieved by stabilizing the beam pointing of the NIR beam at the entrance of the first hollow fiber (HF-1). The spatial position of the input beam is recorded with a position-sensitive detector (PSD1) and the signal is fed back to a piezo-driven mirror, whose tilt is automatically adjusted to maintain the beam position. Although this notably reduces the energy and spectral instabilities in the broadband NIR pulse, long-term spectral instability cannot be removed [38] without employing an additional feedback scheme. Here, a part of the output pulse energy from HF-1 is recorded by a photo detector (PD), and a variable neutral density filter (VND) placed in front of HF-1 is used to make the energy recorded by the PD constant [38].
The beam pointing of the input beams into the second hollow fiber (HF-2) has also been stabilized by using another set of piezo-driven mirrors and position-sensitive detectors (PSD2,3). The implementation of the feedback scheme markedly reduces short-term fluctuations in the DUV pulse energy [38]. Although these stabilization schemes are sufficient for the sub-10-fs pulses generated in scheme (i), long-term energy and wavelength fluctuations of the DUV pulse are typical in the case of scheme (ii). These fluctuations originate from the variation fluctuations in the time delay between the two input pulses in HF-2. The imperfect temporal overlap between the two input pulses leads to a reduction in the DUV pulse energy. For this reason, the DUV pulse energy is especially sensitive to fluctuations in the time delay in scheme (ii), where the pulse durations of the two input pulses are short. Since the scheme uses chirped pulses whose instantaneous wavelengths vary with time, the central wavelength of the DUV pulse also fluctuates when there is timing instability. The timing and related fluctuations in the energy and wavelength are removed by an additional feedback scheme, which consists of a glass plate mounted on a rotational stage in the NUV beam line and a spectrometer for monitoring the central wavelength of the DUV pulse. The central wavelength and the pulse energy are simultaneously stabilized using this scheme [38]. The resultant DUV pulse has power fluctuations of smaller than 3% rms and a stable central wavelength, as can be seen in Figure 9b.

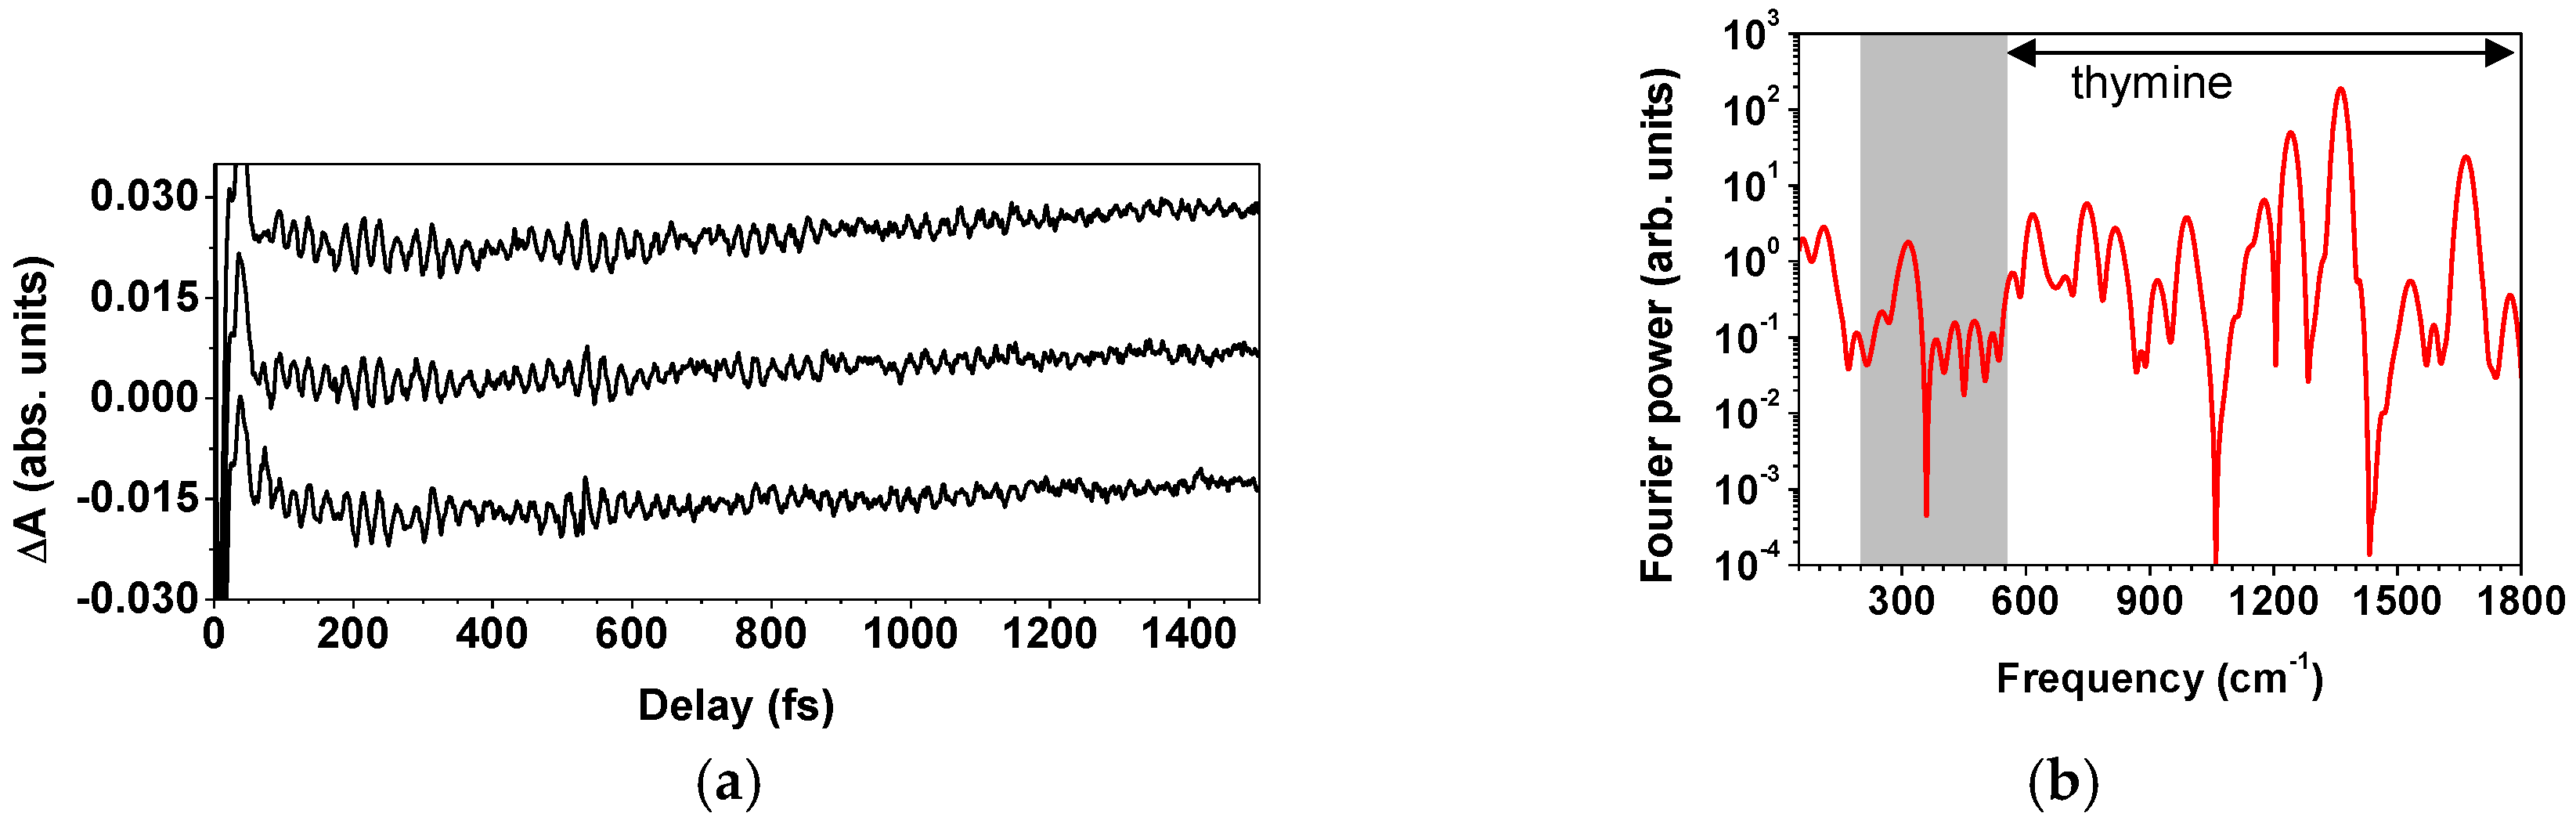
2.2.3. Spectroscopic Applications of the Light Source

The stabilized sub-10-fs DUV light source described above has been used to perform transient absorption spectroscopy of aqueous solutions of nucleobases [28]. Combined with the multichannel lock-in amplifier, the light source has allowed us to simultaneously probe the vibrational dynamics and the electronic excited-state dynamics. The measured transient absorption as a function of the pump-probe time delay exhibits oscillatory structures originating from the modulations by the molecular vibration QB in the electronic excited state as well as in the electronic ground state. In our study, the DUV light source was stable enough to resolve the structures over the measurement time of 2 h. The pump-probe measurements showed good reproducibility among three replicate measurements (Figure 10a) [28]. The vibrational frequencies of the oscillatory structures obtained by Fourier transform of the transient absorption spectrum (a typical spectrum is shown in Figure 10b) is consistent with the frequencies characterized with spontaneous Raman scattering, as discussed in detail in [28].

Author Contributions

T.K. conceived and designed the experiments; A.Y. and Y.K. performed the experiments, analyzed the data. All of the authors wrote the paper.

Conflicts of Interest

The authors declare no conflict of interest.

References

  1. Norrish, R.G.W.; Porter, G. Chemical reactions produced by very high light intensities. Nature 1949, 164, 658. [Google Scholar] [CrossRef]
  2. Maiman, T.H. Stimulated Optical Radiation in Ruby. Nature 1960, 187, 493–494. [Google Scholar] [CrossRef]
  3. Lamb, W.E. Theory of an optical maser. Phys. Rev. 1964, 134, A1429–A1450. [Google Scholar] [CrossRef]
  4. Polanyi, J.C.; Zewail, A.H. Direct Observation of the Transition State. Acc. Chem. Res. 1995, 28, 119–132. [Google Scholar] [CrossRef]
  5. Chosrowjan, H.; Mataga, N.; Shibata, Y.; Tachibanaki, S.; Kandori, H.; Shichida, Y.; Okada, T.; Kouyama, T. Rhodopsin Emission in Real Time: A New Aspect of the Primary Event in Vision. J. Am. Chem. Soc. 1998, 120, 9706–9707. [Google Scholar] [CrossRef]
  6. Pellegrino, F. Ultrafast energy transfer processes in photosynthetic systems probed by picosecond fluorescence spectroscopy. Opt. Eng. 1983, 22, 508–520. [Google Scholar] [CrossRef]
  7. Boyer, A.; Déry, M.; Selles, P.; Arbour, C.; Boucher, F. Colour discrimination by forward and reverse photocurrents in bacteriorhodopsin-based photosensor. Biosens. Bioelectron. 1995, 10, 415–422. [Google Scholar] [CrossRef]
  8. Hellingwerf, K.J.; Hendriks, J.; Gensch, T. On the Configurational and Conformational Changes in Photoactive Yellow Protein that Leads to Signal Generation in Ectothiorhodospira halophila. J. Biol. Phys. 2002, 28, 395–412. [Google Scholar] [CrossRef] [PubMed]
  9. Imamoto, Y.; Kataoka, M. Structure and photoreaction of photoactive yellow protein, a structural prototype of the PAS domain superfamily. Photochem. Photobiol. 2007, 83, 40–49. [Google Scholar] [CrossRef] [PubMed]
  10. Kuhnert, L. A new optical photochemical memory device in a light-sensitive chemical active medium. Nature 1986, 319, 393–394. [Google Scholar] [CrossRef]
  11. Ikeda, T.; Horiuchi, S.; Karanjit, D.B.; Kurihara, S.; Tazuke, S. Photochemical Image Storage in Polymer Liquid Crystals. Chem. Lett. 1988, 17, 1679–1682. [Google Scholar] [CrossRef]
  12. Korolev, N.E.; Mokienko, I.Y.; Poletimov, A.E.; Shcheulin, A.S. Optical storage material based on doped fluoride crystals. Phys. Status Solidi 1991, 127, 327–333. [Google Scholar] [CrossRef]
  13. De Waele, V.; Schmidhammer, U.; Mrozek, T.; Daub, J.; Riedle, E. Ultrafast bidirectional dihydroazulene/vinylheptafulvene (DHA/VHF) molecular switches: Photochemical ring closure of vinylheptafulvene proven by a two-pulse experiment. J. Am. Chem. Soc. 2002, 124, 2438–2439. [Google Scholar] [CrossRef] [PubMed]
  14. Hulin, D.; Mysyrowicz, A.; Antonetti, A.; Migus, A.; Masselink, W.T.; Morkoç, H.; Gibbs, H.M.; Peyghambarian, N. Ultrafast all-optical gate with subpicosecond ON and OFF response time. Appl. Phys. Lett. 1986, 49, 749. [Google Scholar] [CrossRef]
  15. Eichmann, G.; Li, Y.; Alfano, R.R. Optical binary coded ternary arithmetic and logic. Appl. Opt. 1986, 25, 3113. [Google Scholar] [CrossRef] [PubMed]
  16. Wilhelm, T.; Piel, J.; Riedle, E. Sub-20-fs pulses tunable across the visible from a blue-pumped single-pass noncollinear parametric converter. Opt. Lett. 1997, 22, 1494. [Google Scholar] [CrossRef] [PubMed]
  17. Cerullo, G.; Nisoli, M.; Stagira, S.; De Silvestri, S. Sub-8-fs pulses from an ultrabroadband optical parametric amplifier in the visible. Opt. Lett. 1998, 23, 1283–1285. [Google Scholar] [CrossRef] [PubMed]
  18. Kobayashi, T.; Shirakawa, A. Tunable visible and near-infrared pulse generator in a 5 fs regime. Appl. Phys. B Lasers Opt. 2000, 70, S239–S246. [Google Scholar] [CrossRef]
  19. Yabushita, A.; Lee, Y.-H.; Kobayashi, T. Development of a multiplex fast-scan system for ultrafast time-resolved spectroscopy. Rev. Sci. Instrum. 2010, 81, 63110. [Google Scholar] [CrossRef] [PubMed]
  20. Yabushita, A.; Kao, C.-H.; Lee, Y.-H.; Kobayashi, T. Development and demonstration of table-top synchronized fast-scan femtosecond time-resolved spectroscopy system by single-shot scan photo detector array. Jpn. J. Appl. Phys. 2015, 54, 072401. [Google Scholar] [CrossRef]
  21. Baum, P.; Lochbrunner, S.; Riedle, E. Tunable sub-10-fs ultraviolet pulses generated by achromatic frequency doubling. Opt. Lett. 2004, 29, 1686–1688. [Google Scholar] [CrossRef] [PubMed]
  22. Durfee, C.G.; Backus, S.; Kapteyn, H.C.; Murnane, M.M. Intense 8-fs pulse generation in the deep ultraviolet. Opt. Lett. 1999, 24, 697–699. [Google Scholar] [CrossRef] [PubMed]
  23. Trushin, S.A.; Kosma, K.; Fuß, W.; Schmid, W.E. Sub-10-fs supercontinuum radiation generated by filamentation of few-cycle 800 nm pulses in argon. Opt. Lett. 2007, 32, 2432–2434. [Google Scholar] [CrossRef] [PubMed]
  24. Graf, U.; Fieß, M.; Schultze, M.; Kienberger, R.; Krausz, F.; Goulielmakis, E. Intense few-cycle light pulses in the deep ultraviolet. Opt. Express 2008, 16, 18956–18963. [Google Scholar] [CrossRef] [PubMed]
  25. Reiter, F.; Graf, U.; Schultze, M.; Schweinberger, W.; Schröder, H.; Karpowicz, N.; Azzeer, A.M.; Kienberger, R.; Krausz, F.; Goulielmakis, E. Generation of sub-3 fs pulses in the deep ultraviolet. Opt. Lett. 2010, 35, 2248–2250. [Google Scholar] [CrossRef] [PubMed]
  26. Kida, Y.; Liu, J.; Teramoto, T.; Kobayashi, T. Sub-10 fs deep-ultraviolet pulses generated by chirped-pulse four-wave mixing. Opt. Lett. 2010, 35, 1807–1809. [Google Scholar] [CrossRef] [PubMed]
  27. Kosma, K.; Trushin, S.A.; Fuß, W.; Schmid, W.E. Cyclohexadiene ring opening observed with 13 fs resolution: Coherent oscillations confirm the reaction path. Phys. Chem. Chem. Phys. 2009, 11, 172–181. [Google Scholar] [CrossRef] [PubMed]
  28. Kobayashi, T.; Kida, Y. Ultrafast spectroscopy with sub-10 fs deep-ultraviolet pulses. Phys. Chem. Chem. Phys. 2012, 14, 6200–6210. [Google Scholar] [CrossRef] [PubMed]
  29. Kida, Y.; Liu, J.; Kobayashi, T. Single 10-fs deep-ultraviolet pulses generated by broadband four-wave mixing and high-order dispersion compensation. Appl. Phys. B 2011, 105, 675–679. [Google Scholar] [CrossRef]
  30. Wojtkiewicz, J.; Durfee, C.G. Hollow-fiber OP-CPA for energetic ultrafast ultraviolet pulse generation. In Proceedings of the Conference on Lasers and Electro-Optics, Long Beach, CA, USA, 19–22 May 2002; pp. 423–424.
  31. Wojtkiewicz, J.; Hudek, K.; Durfee, C.C. Chirped-pulse frequency conversion of ultrafast pulses to the deep-UV. In Proceedings of the Conference on Lasers and Electro-Optics, Baltimore, MD, USA, 22 May 2005; pp. 186–188.
  32. Tzankov, P.; Steinkellner, O.; Zheng, J.; Husakou, A.; Herrmann, J.; Freyer, W.; Petrov, V.; Noack, F. Generation and Compression of Femtosecond Pulses in the Vacuum Ultraviolet by Chirped-Pulse Four-Wave Difference-Frequency Mixing. In Proceedings of the Conference on Lasers and Electro-Optics, Anaheim, CA, USA, 25–29 March 2006.
  33. Liu, J.; Kobayashi, T. Generation of sub-20-fs multicolor laser pulses using cascaded four-wave mixing with chirped incident pulses. Opt. Lett. 2009, 34, 2402–2404. [Google Scholar] [CrossRef] [PubMed]
  34. Fork, R.L.; Cruz, C.H.B.; Becker, P.C.; Shank, C.V. Compression of optical pulses to six femtoseconds by using cubic phase compensation. Opt. Lett. 1987, 12, 483–485. [Google Scholar] [CrossRef] [PubMed]
  35. Nisoli, M.; de Silvestri, S.; Svelto, O. Generation of high energy 10 fs pulses by a new pulse compression technique. Appl. Phys. Lett. 1996, 68, 2793. [Google Scholar] [CrossRef]
  36. Cavalieri, A.L.; Goulielmakis, E.; Horvath, B.; Helml, W.; Schultze, M.; Fieß, M.; Pervak, V.; Veisz, L.; Yakovlev, V.S.; Uiberacker, M.; et al. Intense 1.5-cycle near infrared laser waveforms and their use for the generation of ultra-broadband soft-x-ray harmonic continua. New J. Phys. 2007, 9, 242. [Google Scholar] [CrossRef]
  37. Kida, Y.; Kobayashi, T. Generation of sub-10 fs ultraviolet Gaussian pulses. J. Opt. Soc. Am. B 2010, 28, 139–148. [Google Scholar] [CrossRef]
  38. Kida, Y.; Okamura, K.; Liu, J.; Kobayashi, T. Sub-10-fs deep-ultraviolet light source with stable power and spectrum. Appl. Opt. 2012, 51, 6403–6410. [Google Scholar] [CrossRef] [PubMed]
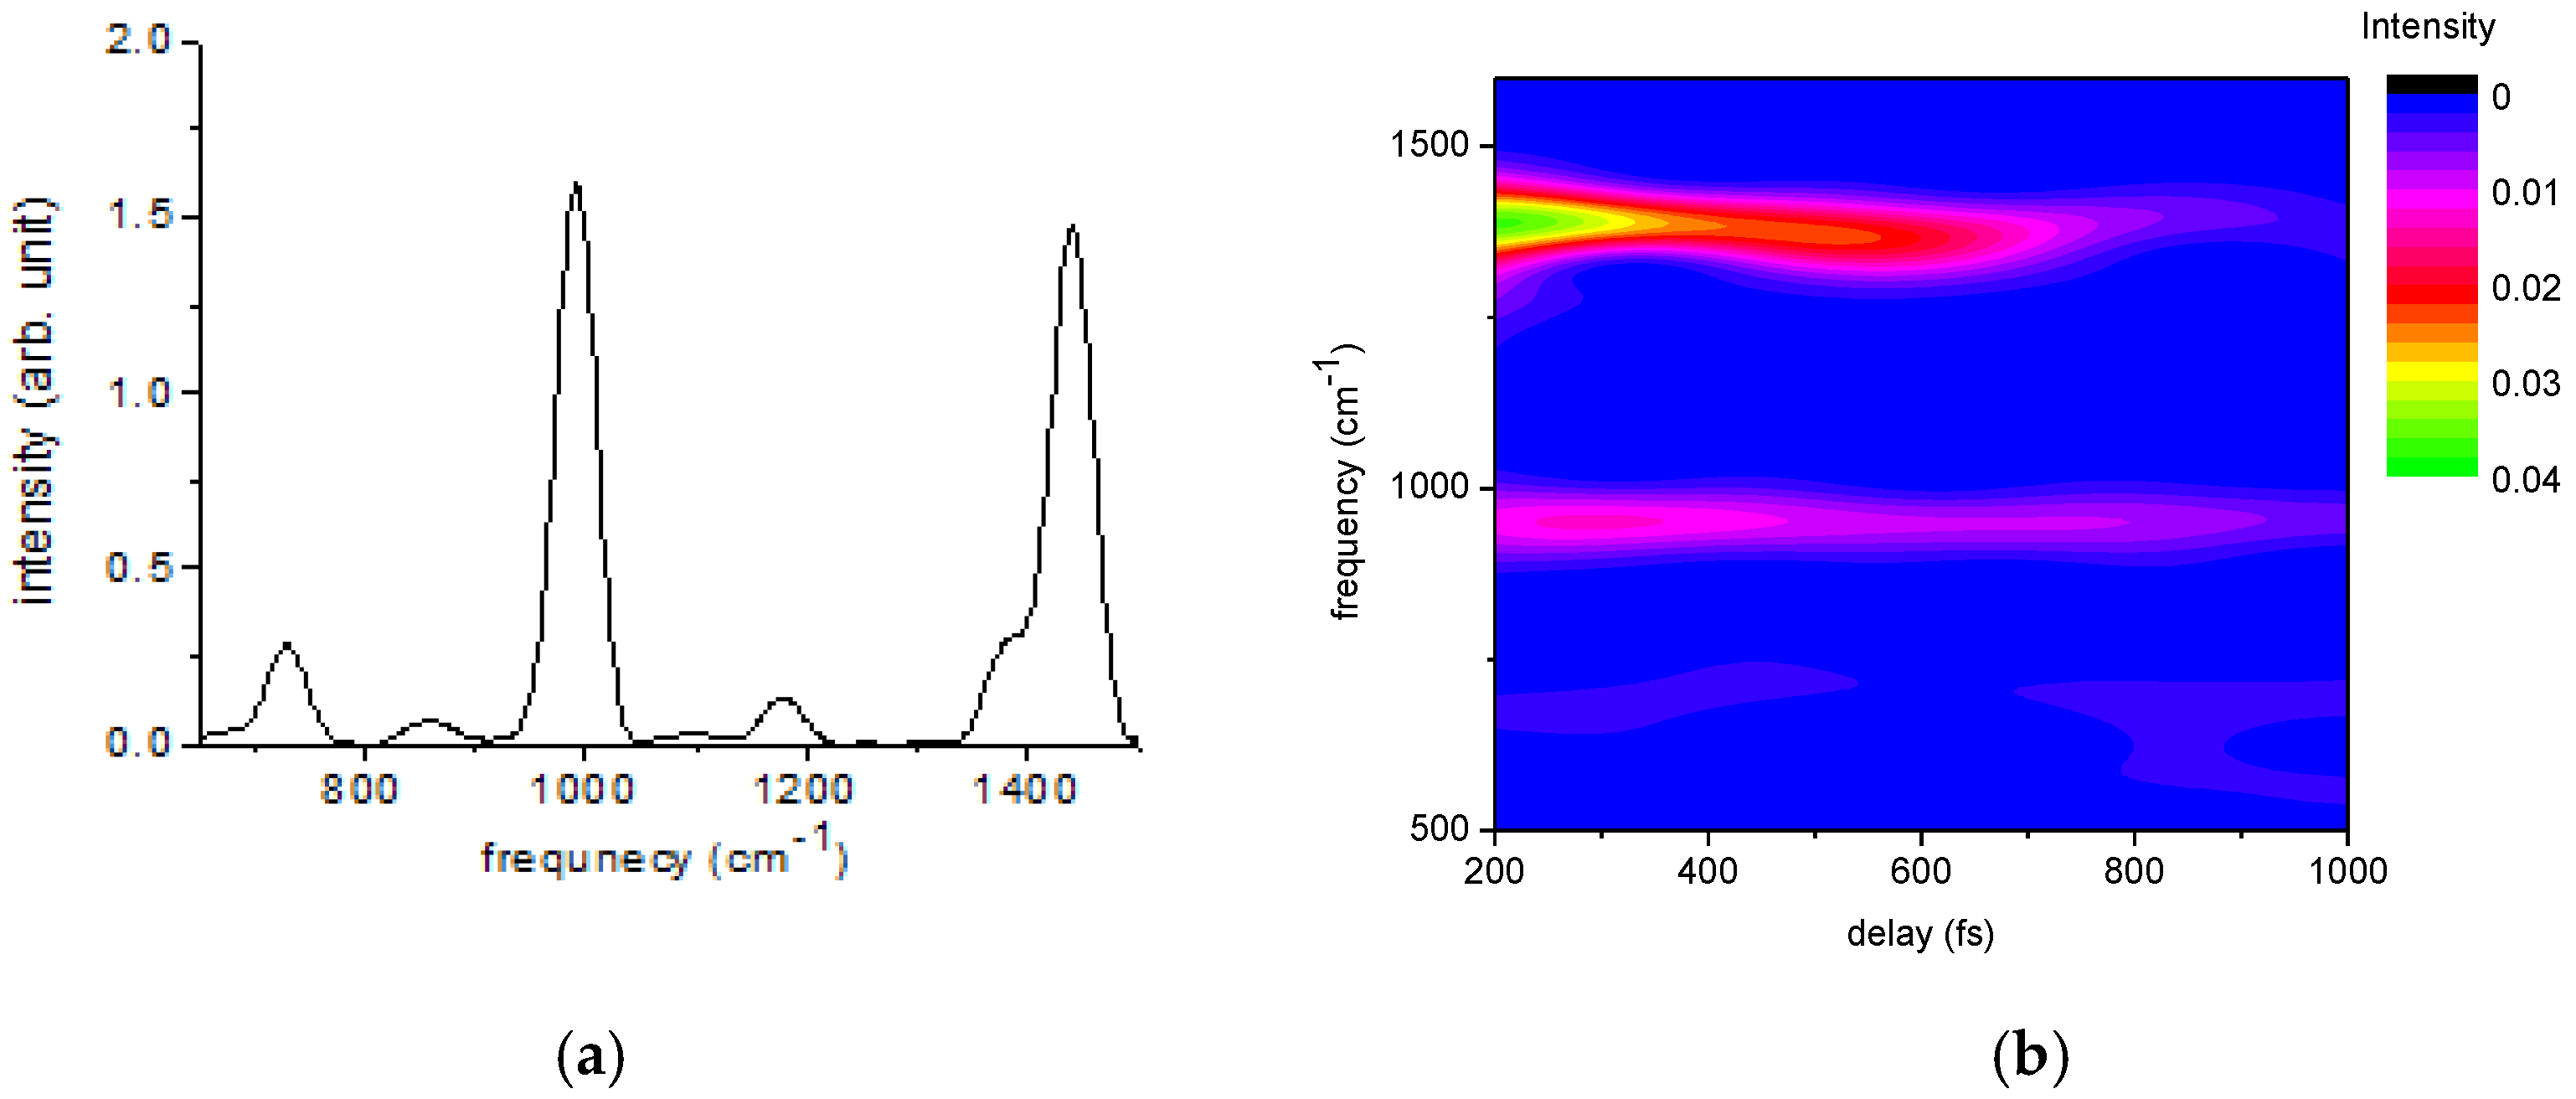
Figure 1. Visible broadband spectrum generated by self-phase modulation of the NIR pulse. The very intense signal in the 800-nm region is due to the fundamental of the Ti:sapphire laser.
Photonics 03 00064 g001
Figure 2. Schematic setup of non-collinear optical parametric amplification (NOPA). The filter is a short-pass cut-off filter which was used to block the fundamental light with wavelength of 800 nm. A quartz block was inserted to broaden time duration of the second harmonic pulse used as the NOPA pump. Red, blue, and yellow color lines represent the light with wavelengths of 800 nm, 400 nm, and visible broadband, respectively.
Photonics 03 00064 g002
Figure 3. Schematic setup of the fastscan time-resolved absorption change spectroscopy system.
Photonics 03 00064 g003
Figure 4. (a) Two dimensional view of the time-resolved absorption change spectra; (b) Time-resolved absorption change trace probed at 640 nm.
Photonics 03 00064 g004
Figure 5. (a) Fourier power spectrum; and (b) spectrogram calculated from the time-resolved absorption change trace shown in Figure 4b. The spectrogram was calculated using a Blackman window with a full width half maximum of 280 fs.
Photonics 03 00064 g005
Figure 6. The energy diagram of the four-wave mixing (FWM) induced by (a) a positively-chirped NIR pulse; and a non-chirped near-ultraviolet (NUV) pulse and that induced by (b) a negatively chirped NUV pulse and a non-chirped NIR pulse. These show that both the negative frequency chirp in the NUV pulse and the positive frequency chirp in the NIR pulse lead to the negative frequency chirp in the DUV pulse.
Photonics 03 00064 g006
Figure 7. The schematic illustration of the generation schemes of the ultrashort DUV pulses. BS: beam splitter; GP: glass plate; L: focusing lens; HF-1, HF-2: hollow fibers; PS: periscope; SHG: second-harmonic generation crystal; PP: pulse stretcher consisting of two prisms; DM: dichroic mirror; CM: concave mirror.
Photonics 03 00064 g007
Figure 8. (a) Temporal; and (b) spectral intensity profiles of the DUV pulses generated by the scheme (i) (solid area) and scheme (ii) (solid line), respectively.
Photonics 03 00064 g008
Figure 9. (a) Schematic drawing of the stabilization scheme; (b) Evolutions of the energy and the central wavelength of the DUV pulse recorded over 2 h after the stabilization.
Photonics 03 00064 g009
Figure 10. (a) Measured transient absorption signals as a function of the pump-probe time delay; (b) The Fourier transform of a typical transient absorption signal. The gray shaded part in (b) shows the signals that originate from other components than thymine.
Photonics 03 00064 g010
Table 1. Molecular vibration dynamics estimated by the linear prediction singular value decomposition (LP-SVD) method.
Frequency (cm−1)AmplitudeLifetime (fs)Origin
143937527P3HT
991152117benzene
137811875P3HT
117433705benzene

