Article

Optical Klystron Enhancement to Self Amplified Spontaneous Emission at FERMI

1
Elettra-Sincrotrone Trieste S.C.p.A., Strada Statale 14-km 163.5 in AREA Science Park, Basovizza, 34149 Trieste, Italy
2
Laboratory of Quantum Optics, University of Nova Gorica, 5001 Nova Gorica, Slovenia
3
Paul Scherrer Institut, 5232 Villigen, Switzerland
4
Enea, via Enrico Fermi 45, Frascati, 00044 Roma, Italy
*
Author to whom correspondence should be addressed.
Photonics 2017, 4(1), 15; https://doi.org/10.3390/photonics4010015
Submission received: 1 February 2017 / Accepted: 23 February 2017 / Published: 1 March 2017
(This article belongs to the Special Issue Extreme UV Lasers: Technologies and Applications)

Abstract

:
The optical klystron enhancement to a self-amplified spontaneous emission free electron laser has been studied in theory and in simulations and has been experimentally demonstrated on a single-pass high-gain free electron laser, the FERMI FEL-1, in 2014. The main concept consists of two undulators separated by a dispersive section that converts the energy modulation induced in the first undulator in density modulation, enhancing the coherent harmonic generation in the first part of the second undulator. This scheme could be replicated in a multi-stage: the bunching is enhanced after each dispersive section, consistently reducing the saturation length. We have applied the multi-stage optical klystron (OK) scheme on the FEL-2 line at FERMI, whose layout includes three dispersive sections. Optimizing the strength of the dispersions allowed a significant increase of the self-amplified spontaneous emission (SASE) intensity in comparison to a single-stage OK and extending to the soft-X rays the OK enhanced SASE previously demonstrated on FEL-1.

1. Introduction

The optical klystron (OK) concept was proposed by Vinokurov and Skrinsky in 1977 [1] to enhance the gain of an oscillator free electron laser (FEL) driven by a storage ring. The basic scheme consists of two undulators separated by a dispersive section, which converts the beam energy modulation produced in the first undulator into a density modulation, thus enhancing the electron bunching and the radiation emission in the second undulator. The first implementation of the OK FEL scheme was realized in 1979 at the VEPP-3 storage ring of the Budker Institute of Nuclear Physics (BINP, Novosibirsk, Russia) [2], where they obtained an initial gain of 0.5% at 630 nm that was later improved up to 2.5% per pass [3]. Afterwards, other FEL oscillator facilities implemented the OK scheme, such as ACO SR FEL (LURE, France), which lased at 635 nm in 1983 [4] and at 463 nm in 1987 [5]. The progress in optical cavity mirror coatings allowed later for lasing in ultra-violet, at 240 nm in 1989 (OK-4/VEPP-3 storage ring FEL [6]) and below, down to 193 nm in 1999 (OK-4 Duke SR FEL [7]). In 2000, the ELETTRA storage ring FEL lased at 217.9 nm [8,9] and a few years later at 190 nm, which is the shortest wavelength obtained with an OK FEL oscillator [10]. The gain of the optical klystron decreases with decreasing wavelength, while the optical cavity mirrors’ losses increase, and this has constituted a strong constraint in reaching emission at shorter wavelengths. A distributed optical klystron was proposed by Litvinenko [11] to increase the gain. The first successful experiment was conducted in the DOK-1 FEL, at Duke University, Durham, NC, USA [12], obtaining a gain of about 48% per pass.
The progress of linac technologies has allowed for generating very high brightness electron beams able to drive single-pass high-gain FELs, providing intense radiation in the extreme-ultra-violet [13,14,15] and in the X-ray regimes [16,17]. A common high-gain FEL mode of operation is the self-amplified spontaneous emission (SASE) mode, where a high brightness electron beam is driven through a long undulator tuned to emit radiation with a central wavelength λ r . The incoherent spontaneous radiation emitted by the beam interacts with the beam itself and is amplified. The FEL signal grows exponentially along the undulator with a characteristic power folding length L g = λ u 4 π 3 ρ [18,19] where λ u is the undulator period and ρ is the Pierce parameter, also known as the FEL parameter [20,21,22], typically in the range 10 3 10 4 . The radiation intensity growth saturates after about 20 L g . The saturation length corresponds to the undulator distance required to extract the maximum energy from the electron beam. This distance can be of the order of 100 m for an FEL operating in the hard X-rays. Theoretical studies [23,24,25,26,27,28] have shown that the increase in density modulation induced by the optical klystron dispersive section may significantly reduce the saturation length.
An Optical Klystron device, originally introduced to enhance the gain in oscillator FELs, can be used to shorten the undulator required to reach saturation in single-pass SASE FEL devices. This concept was successfully demonstrated on the FEL-1 line at the FERMI facility [29]. We extend the OK using a multi-stage configuration in which several dispersive sections are inserted along the undulator. We have exploited this scheme in the FERMI FEL-2 layout, which includes three dispersive sections alternated to undulator segments. The values of the dispersions were optimized to maximize the SASE FEL emission in the soft X-rays. The paper is organized as follows. A review of the optical klystron concept in the context of enhancing the SASE performance is provided in Section 2. The first experiment based on a single OK scheme and carried on at FERMI FEL-1 is addressed in Section 3, where we show the performance of the OK in the vacuum ultraviolet (VUV) regime in comparison with the theoretical expectations and simulations. In Section 4, the new experiment in the soft X-ray regime of multi-stage OK with the three dispersive sections of the FERMI FEL-2 line is described.

2. Theoretical Gain of the Optical Klystron SASE Relative to the SASE FEL

The aforementioned theoretical studies that were focused on the possibility of applying the optical klystron concept to high-gain FEL amplifiers have provided an important result: the OK high-gain FEL performance is strongly influenced by the electron beam relative uncorrelated energy spread, which has to be substantially lower than the ρ FEL parameter. We briefly recall the one-dimensional theoretical approach developed in [25,28] that provides an approximate expression for the gain factor G of the optical klystron relative to the SASE operating without enabling the dispersive section.
We consider the FEL resonant wavelength condition λ r = 2 π c ω r = λ u ( 1 + K 2 ) / 2 γ 0 2 , where K = e B u λ u 2 π m e c is the normalized undulator strength, B u is the peak magnetic field and γ 0 m e c 2 is the electron energy. We assume a Gaussian distribution of the electron energies with an rms value σ δ , where δ = ( γ γ 0 ) / γ 0 is the relative energy deviation from the mean value. The OK enhancement factor to the radiation electric field E at the scaled frequency ν = ω / ω r can be written as follows [28]:
R ν = E ν O K E ν n o O K = 1 d ξ d V ( ξ ) / d ξ μ ξ 2 exp ( i ρ R 56 ξ k r ν ) exp ( i k r ν R 56 / 2 ) 1 + 2 d ξ V ( ξ ) μ ξ 3 ,
where ξ = δ / ρ , μ is the complex growth rate of the radiation field in each undulator, V ( ξ ) is the normalized energy distribution of the electron bunch and R 56 is the momentum compaction of the dispersive section. Integrating the enhancement factor R ( ν ) over the SASE spectrum S ( ν ) , which is assumed to be Gaussian with an rms bandwidth equal to ρ, one can obtain the OK power gain factor G as:
G = d ν R ( ν ) 2 S ( ν ) .
If the first undulator induces an energy modulation with an amplitude smaller than the intrinsic energy spread, the second term in the integral at the numerator dominates over the first one. In this case and considering ( σ ξ < < 1 ), the gain factor G can be well approximated by the following equation [28] (the equation reported in [28] contains a typo that has been fixed in Equation (3)):
G 1 9 5 + D 2 e D 2 σ ξ 2 + 2 3 D e D 2 σ ξ 2 2 + 4 + 3 D e D 2 σ ξ 2 2 cos D 2 ρ D e D 2 σ ξ 2 2 sin D 2 ρ e D 2 σ ν 2 8 ρ 2 ,
where D = k r R 56 ρ .
When the strength of the dispersive section is low, i.e., R 56 is of the order of few λ r , the chicane works as a phase shifter and the effect of the OK on FEL gain is mainly interferential. By further increasing the chicane strength, the microbunching induced by the OK dominates and the gain factor G increases progressively up to the maximum FEL intensity that occurs when k r R 56 σ δ = 1 . Since σ δ < ρ , when the R 56 is close to the optimum value, D is much larger than 1 so that Equation (3) reduces to [28]:
G 1 9 5 + D 2 e D 2 σ ξ 2 + 2 3 D e D 2 σ ξ 2 2 .
It is straightforward to see that G is maximized when D = 1 / σ ξ and the maximum theoretical power gain factor G m a x is:
G m a x 1 9 5 + 1 σ ξ 2 e 1 + 2 3 1 σ ξ e 1 / 2 .
Equation (5) confirms that the smaller the uncorrelated energy spread of the beam, the higher the G m a x is expected to be.
On the other hand, if the first undulator is sufficiently long to induce a deep energy modulation, comparable to or larger than the intrinsic energy spread, the maximum gain of the OK does not occur more for D = 1 / σ ξ . In order to better figure out what happens in this scenario, it is helpful to take into account the analytical treatment originally developed for the High Gain Harmonic Generation (HGHG) FEL [30]. In the latter scheme, an external seed laser interacts with the electron bunch in an undulator, named the modulator, imprinting a periodic energy modulation at the seed laser wavelength λ s with an amplitude Δ γ . This energy modulation is converted into density modulation by means of a dispersive section, as in the optical klystron, and then the beam is sent to an undulator, named the radiator, tuned at λ s , or, more often, to a higher harmonic λ n = λ s / n . A figure of merit of the HGHG scheme is the so-called “bunching factor”, representing the normalised density modulation at the nth harmonic and defined as:
b n = e x p 1 2 n 2 σ δ 2 k r 2 R 56 2 J n n Δ γ γ 0 k r R 56 ,
where J n is the nth order of the Bessel function.
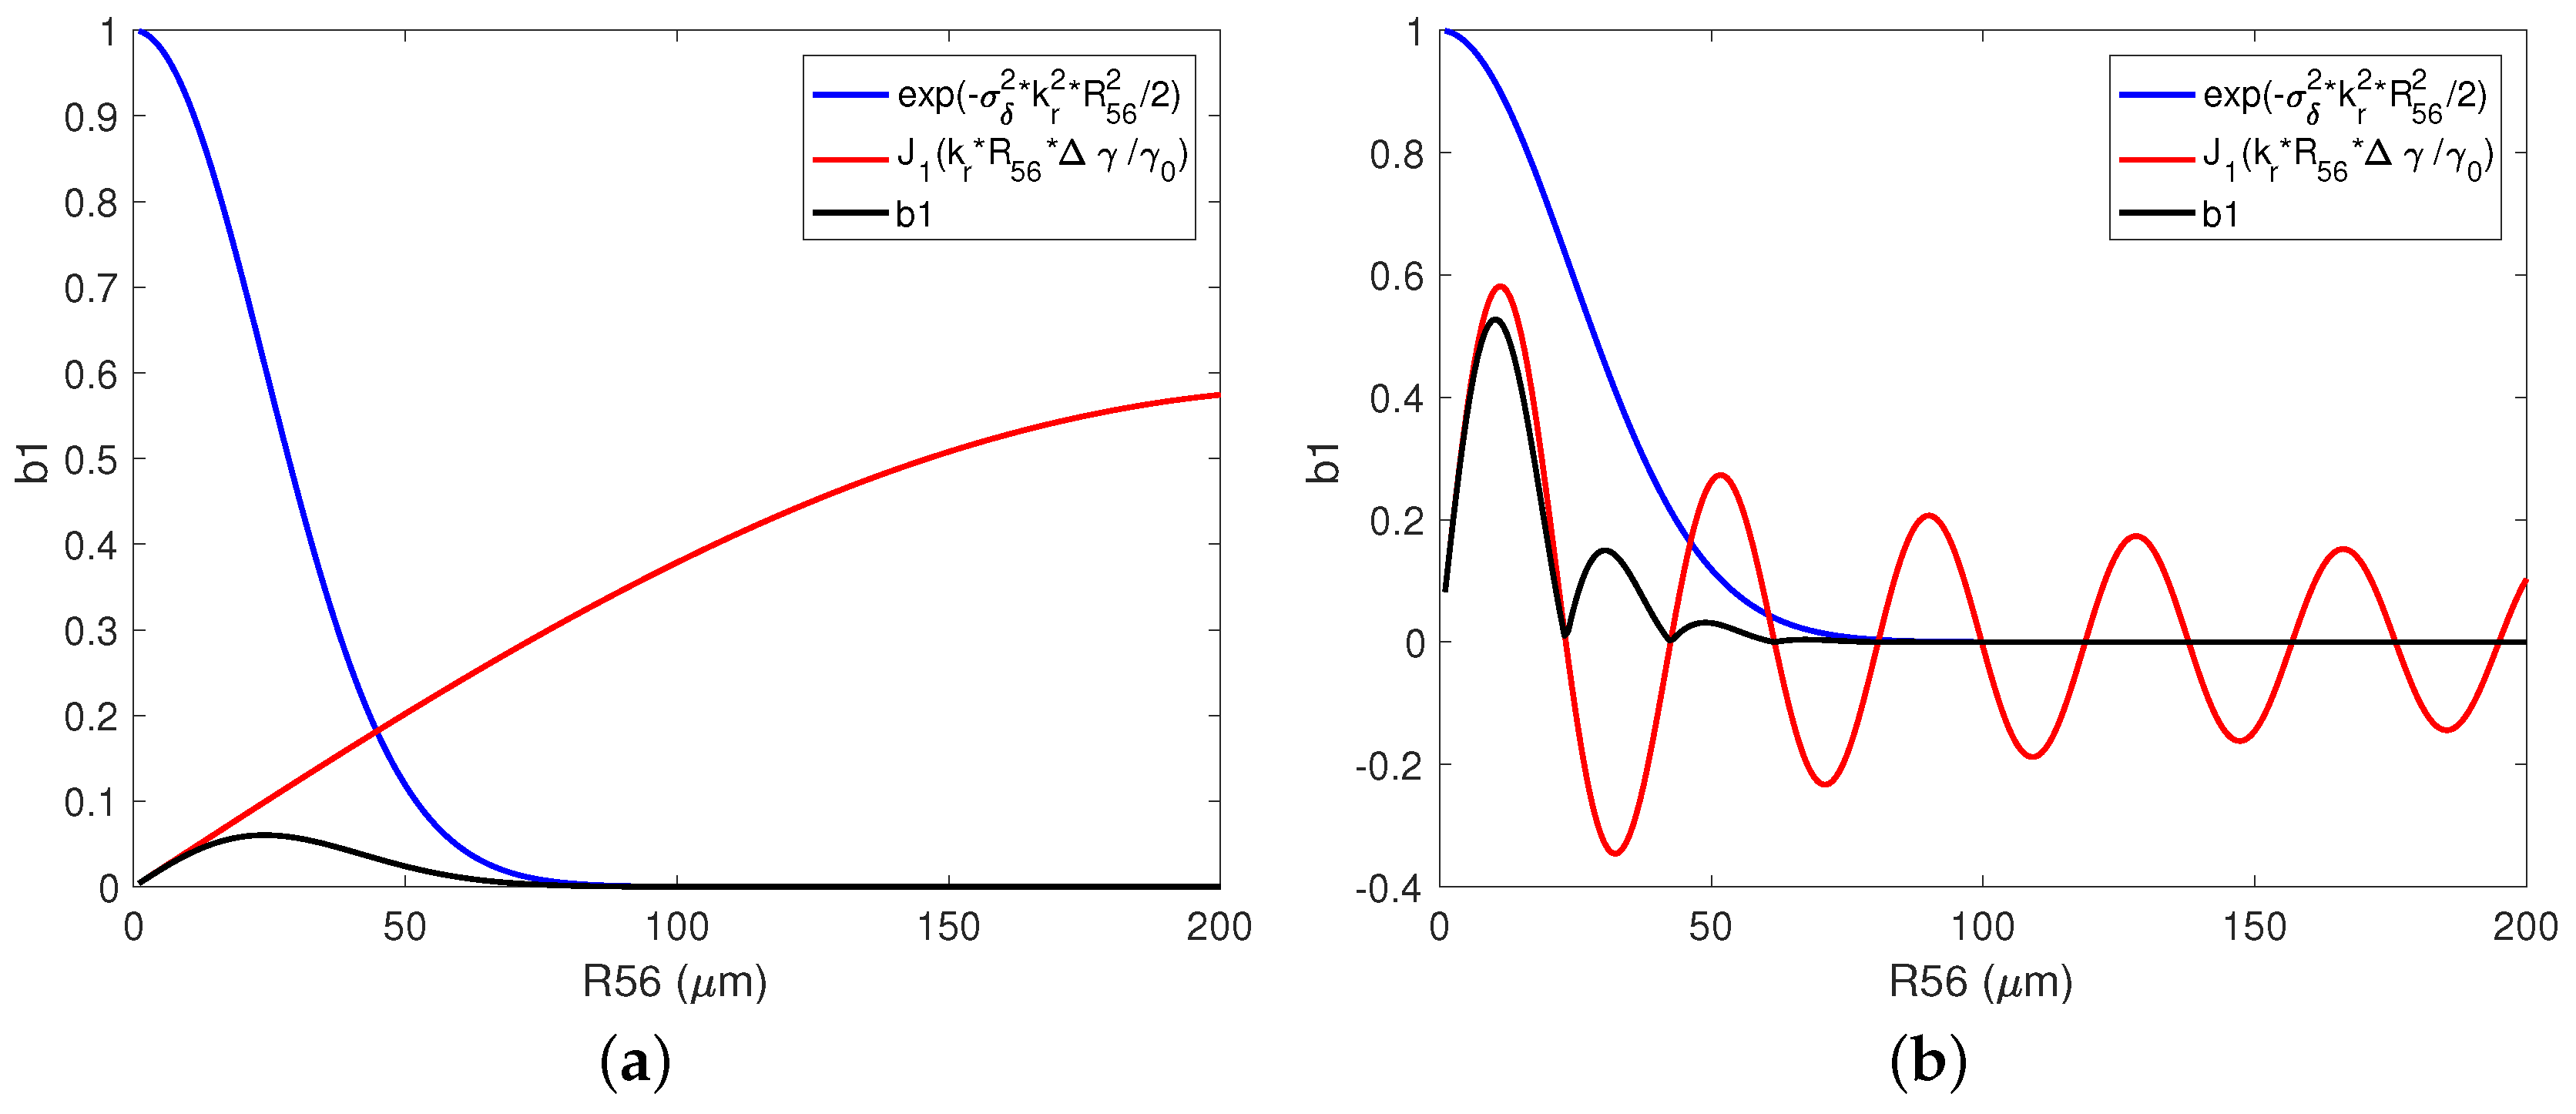
We can use Equation (6) for describing the OK behavior versus R 56 , taking Δ γ as the energy modulation induced by the radiation of the first undulator. For example, we have considered an electron bunch with a mean energy of 1.5 GeV and an intrinsic energy spread of 50 keV ( σ δ = 3 . 3 × 10 5 ). The undulators are all tuned to be resonant at 5 nm, thus n = 1 . Figure 1 shows the bunching factor versus R 56 when the first undulator induced an energy modulation of 10 keV and 200 keV. In the former scenario (see Figure 1a), being Δ γ / γ 0 < σ δ , the contribution to the bunching coming from the exponential decay dominates over the Bessel function and the maximum bunching occurs when σ δ k r R 56 1 , thus in agreement with the results of Equation (5). In the scenario plotted in Figure 1b, the induced modulation is much larger than the intrinsic energy spread and the Bessel function dominates: the maximum bunching is obtained when the Bessel function assumes the peak value, which means when Δ γ γ 0 k r R 56 1 . 8412 [31]. This is what happens in a seed FEL or eventually in a SASE after several gain length.
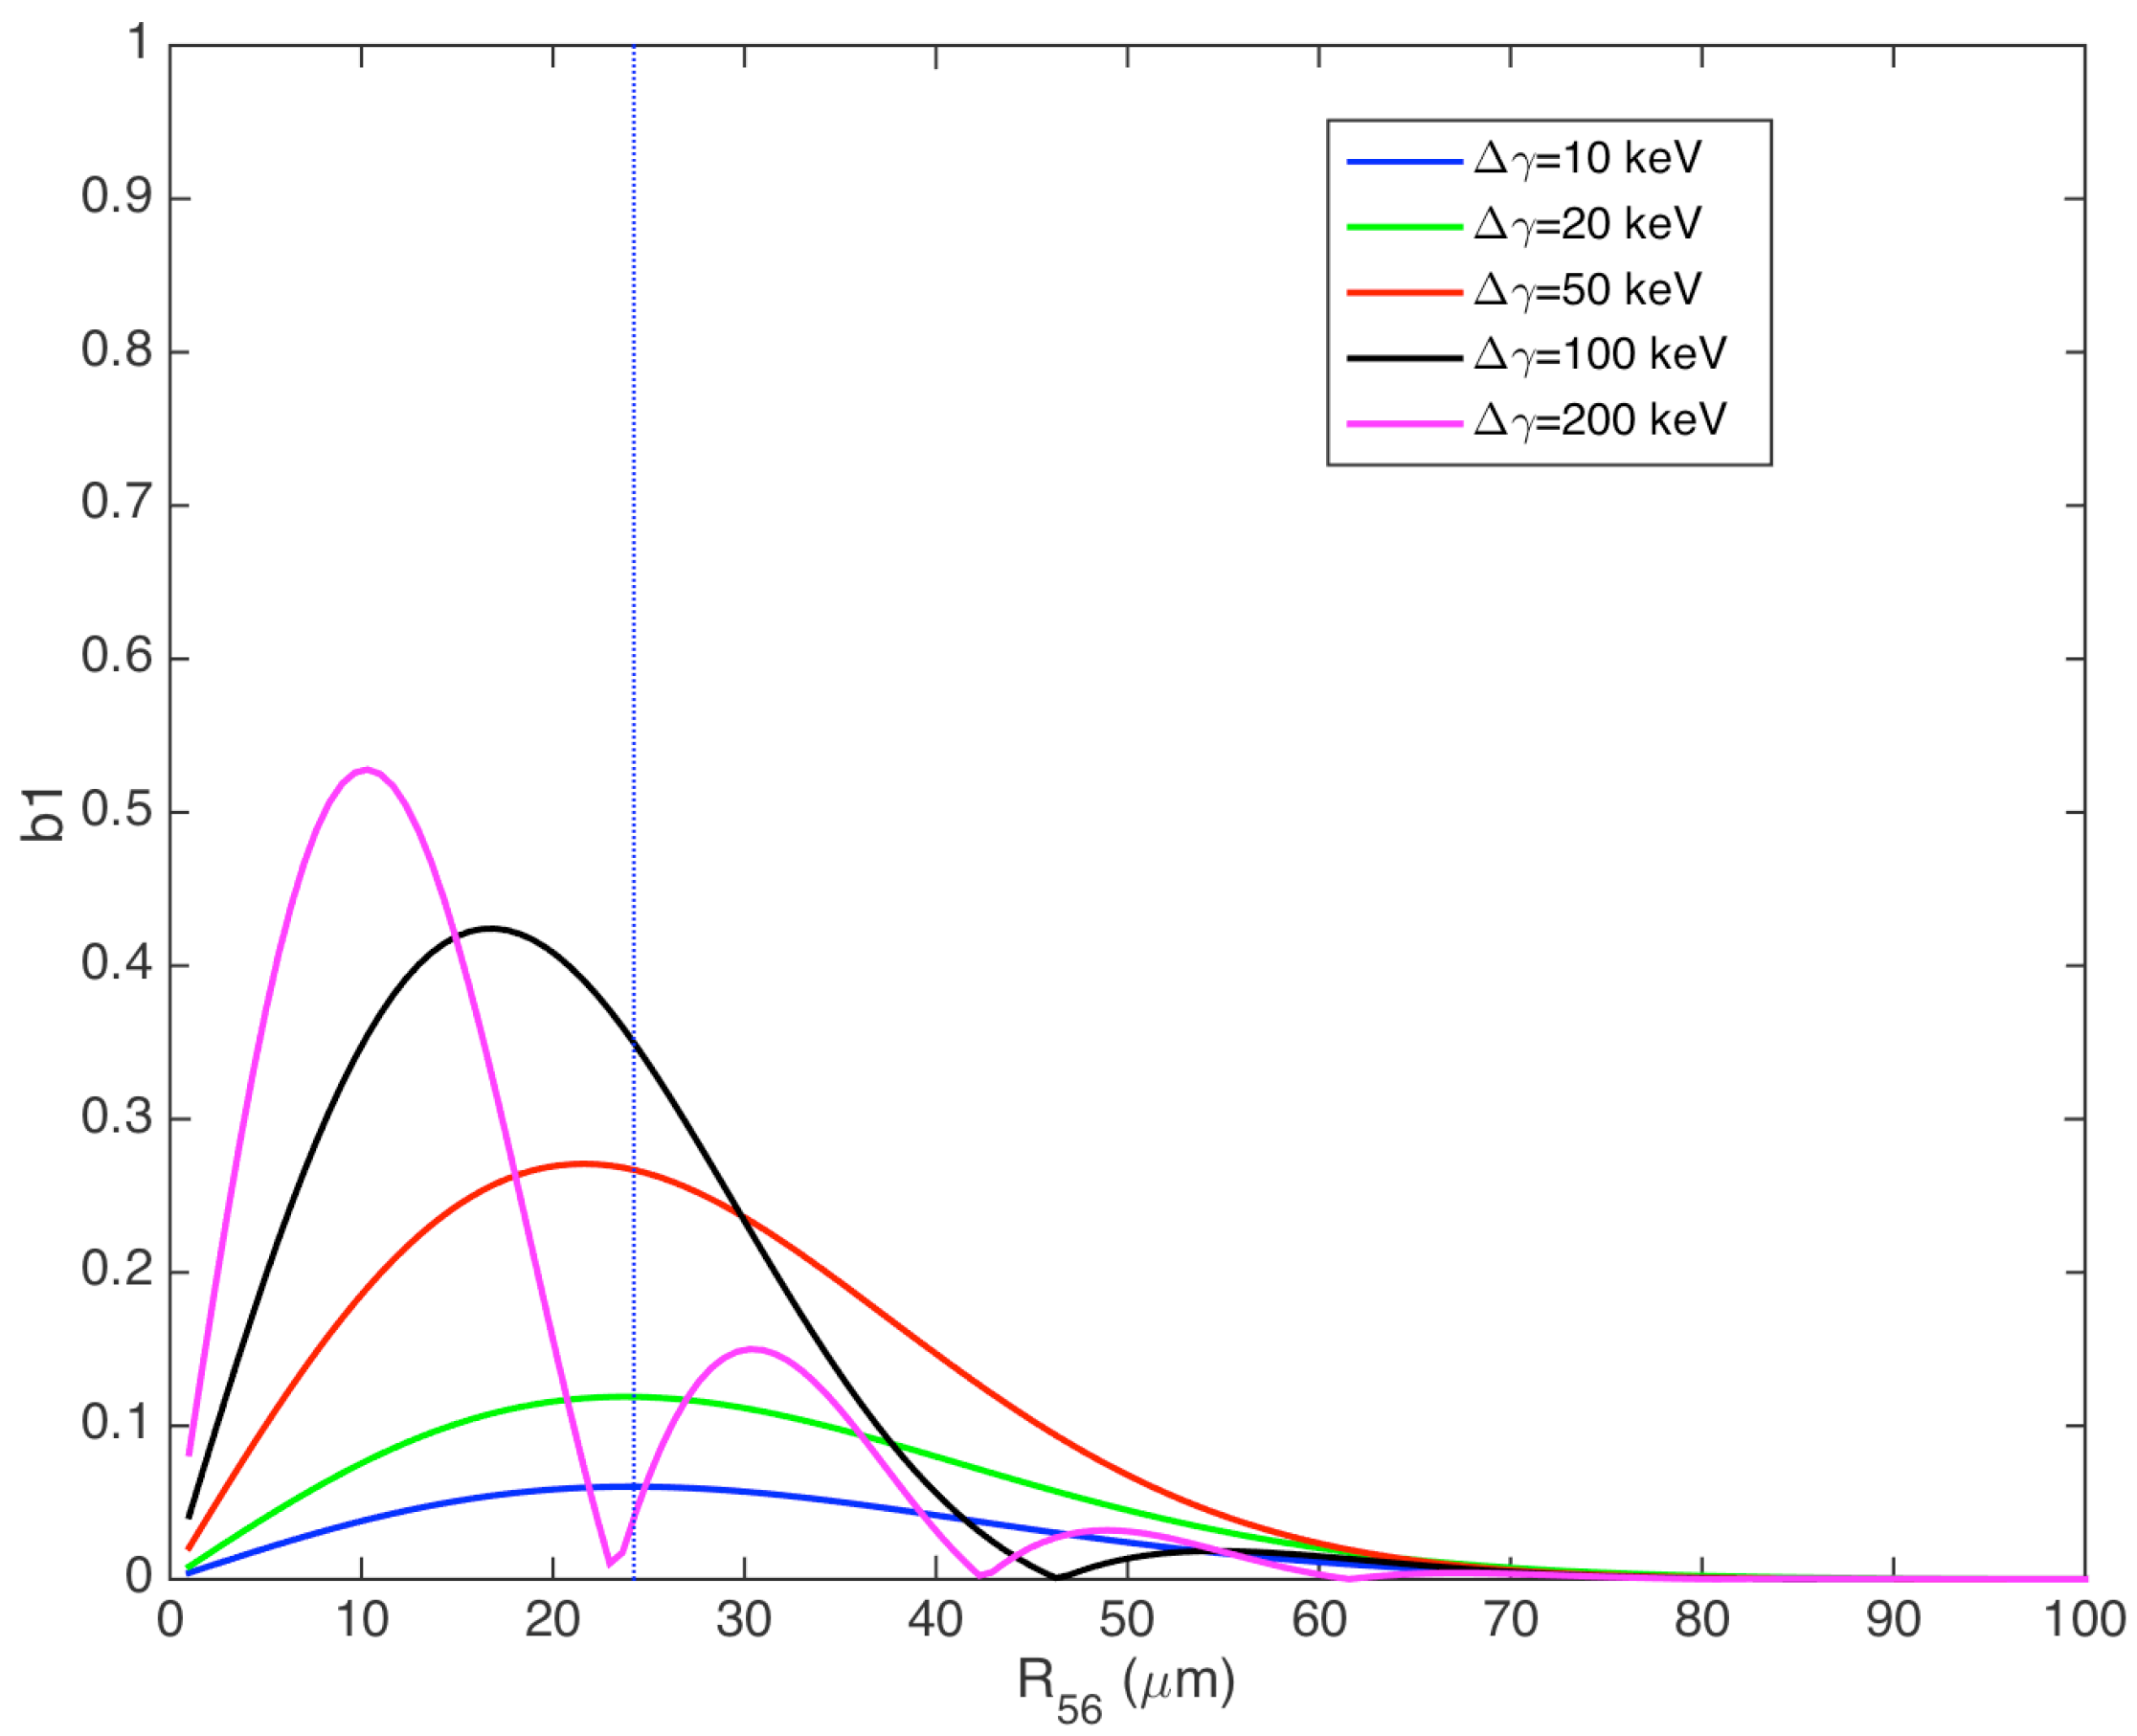
If the OK scheme is replicated in a second stage, the bunched electron beam passing through the second undulator could be able to generate an intense radiation inducing an energy modulation comparable with the intrinsic energy spread. If this happens, the optimum R 56 of the second dispersive section maximizing the bunching of the second stage is shifted towards lower values, as shown in Figure 2.

3. Experimental Demonstration of the OK SASE on the FEL-1 Line at FERMI

As mentioned in the introduction, the first experimental demonstration of the optical klystron enhancement to a SASE FEL was performed on the FEL-1 line at FERMI in the VUV spectral range. FEL-1 [14] was designed to operate in HGHG mode, but it has been found to be suitable to realize an optical klystron in a high-gain FEL, by simply tuning both the modulator and the radiators at the same wavelength and exploiting the dispersive section to enhance the bunching induced by the spontaneous emission produced in the modulator. The wavelength tuning for both modulator and radiators is realized by changing the undulator gap [32,33]. The FERMI electron bunch has a strong requirement on the intrinsic energy spread σ δ that derives from the HGHG FEL mode: in order to efficiently lase at the harmonic n of the seed laser, σ δ should be smaller than ρ / n 2 + 1 . A laser heater system [34,35] has been installed after the injector [36] at 100 MeV to suppress the microbunching instability driven by the coherent synchrotron radiation in the magnetic bunch compressor and by the longitudinal space charge forces along the linac. A fine-tuning of the laser heater energy per pulse, in the range 0.5–1.0 μ J, permits us to constrain σ δ after the compression and the linac transport to less than 10 4 [37]. Considering the typical spectral range of FEL-1 operation, this means σ δ ρ / 20 with a relevant improvement in the FEL output performance [38]. Nevertheless, we have intentionally increased the beam intrinsic energy spread by exploiting the laser heater in order to study the OK performance as a function of σ δ .
In the experiment reported in the paper [29], a 1.058 GeV-500 A electron beam was used, with a normalized emittance ( ϵ n ) of about 1.2 mm mrad. Both modulator and radiators have been tuned at 43 nm. Without activating the dispersive section, i.e., R 56 = 0 μ m, the FEL energy per pulse was measured to be only a few micro-Joules (“pure” SASE mode). The optimization of the laser heater intensity ( 0 . 8 μ J) led to minimizing the uncorrelated energy spread at the end of the linac, which we measured to be about 90 keV (rms). This is also the best condition for the OK. Then, the dispersive section R 56 has been progressively increased in the range 0 to 300 μ m, while detecting the output FEL intensity by means of calibrated gas cells [39]. We call R 56 o p t the experimental value of R 56 that maximizes the OK FEL pulse energy, and, in this case, R 56 o p t = 84 μ 
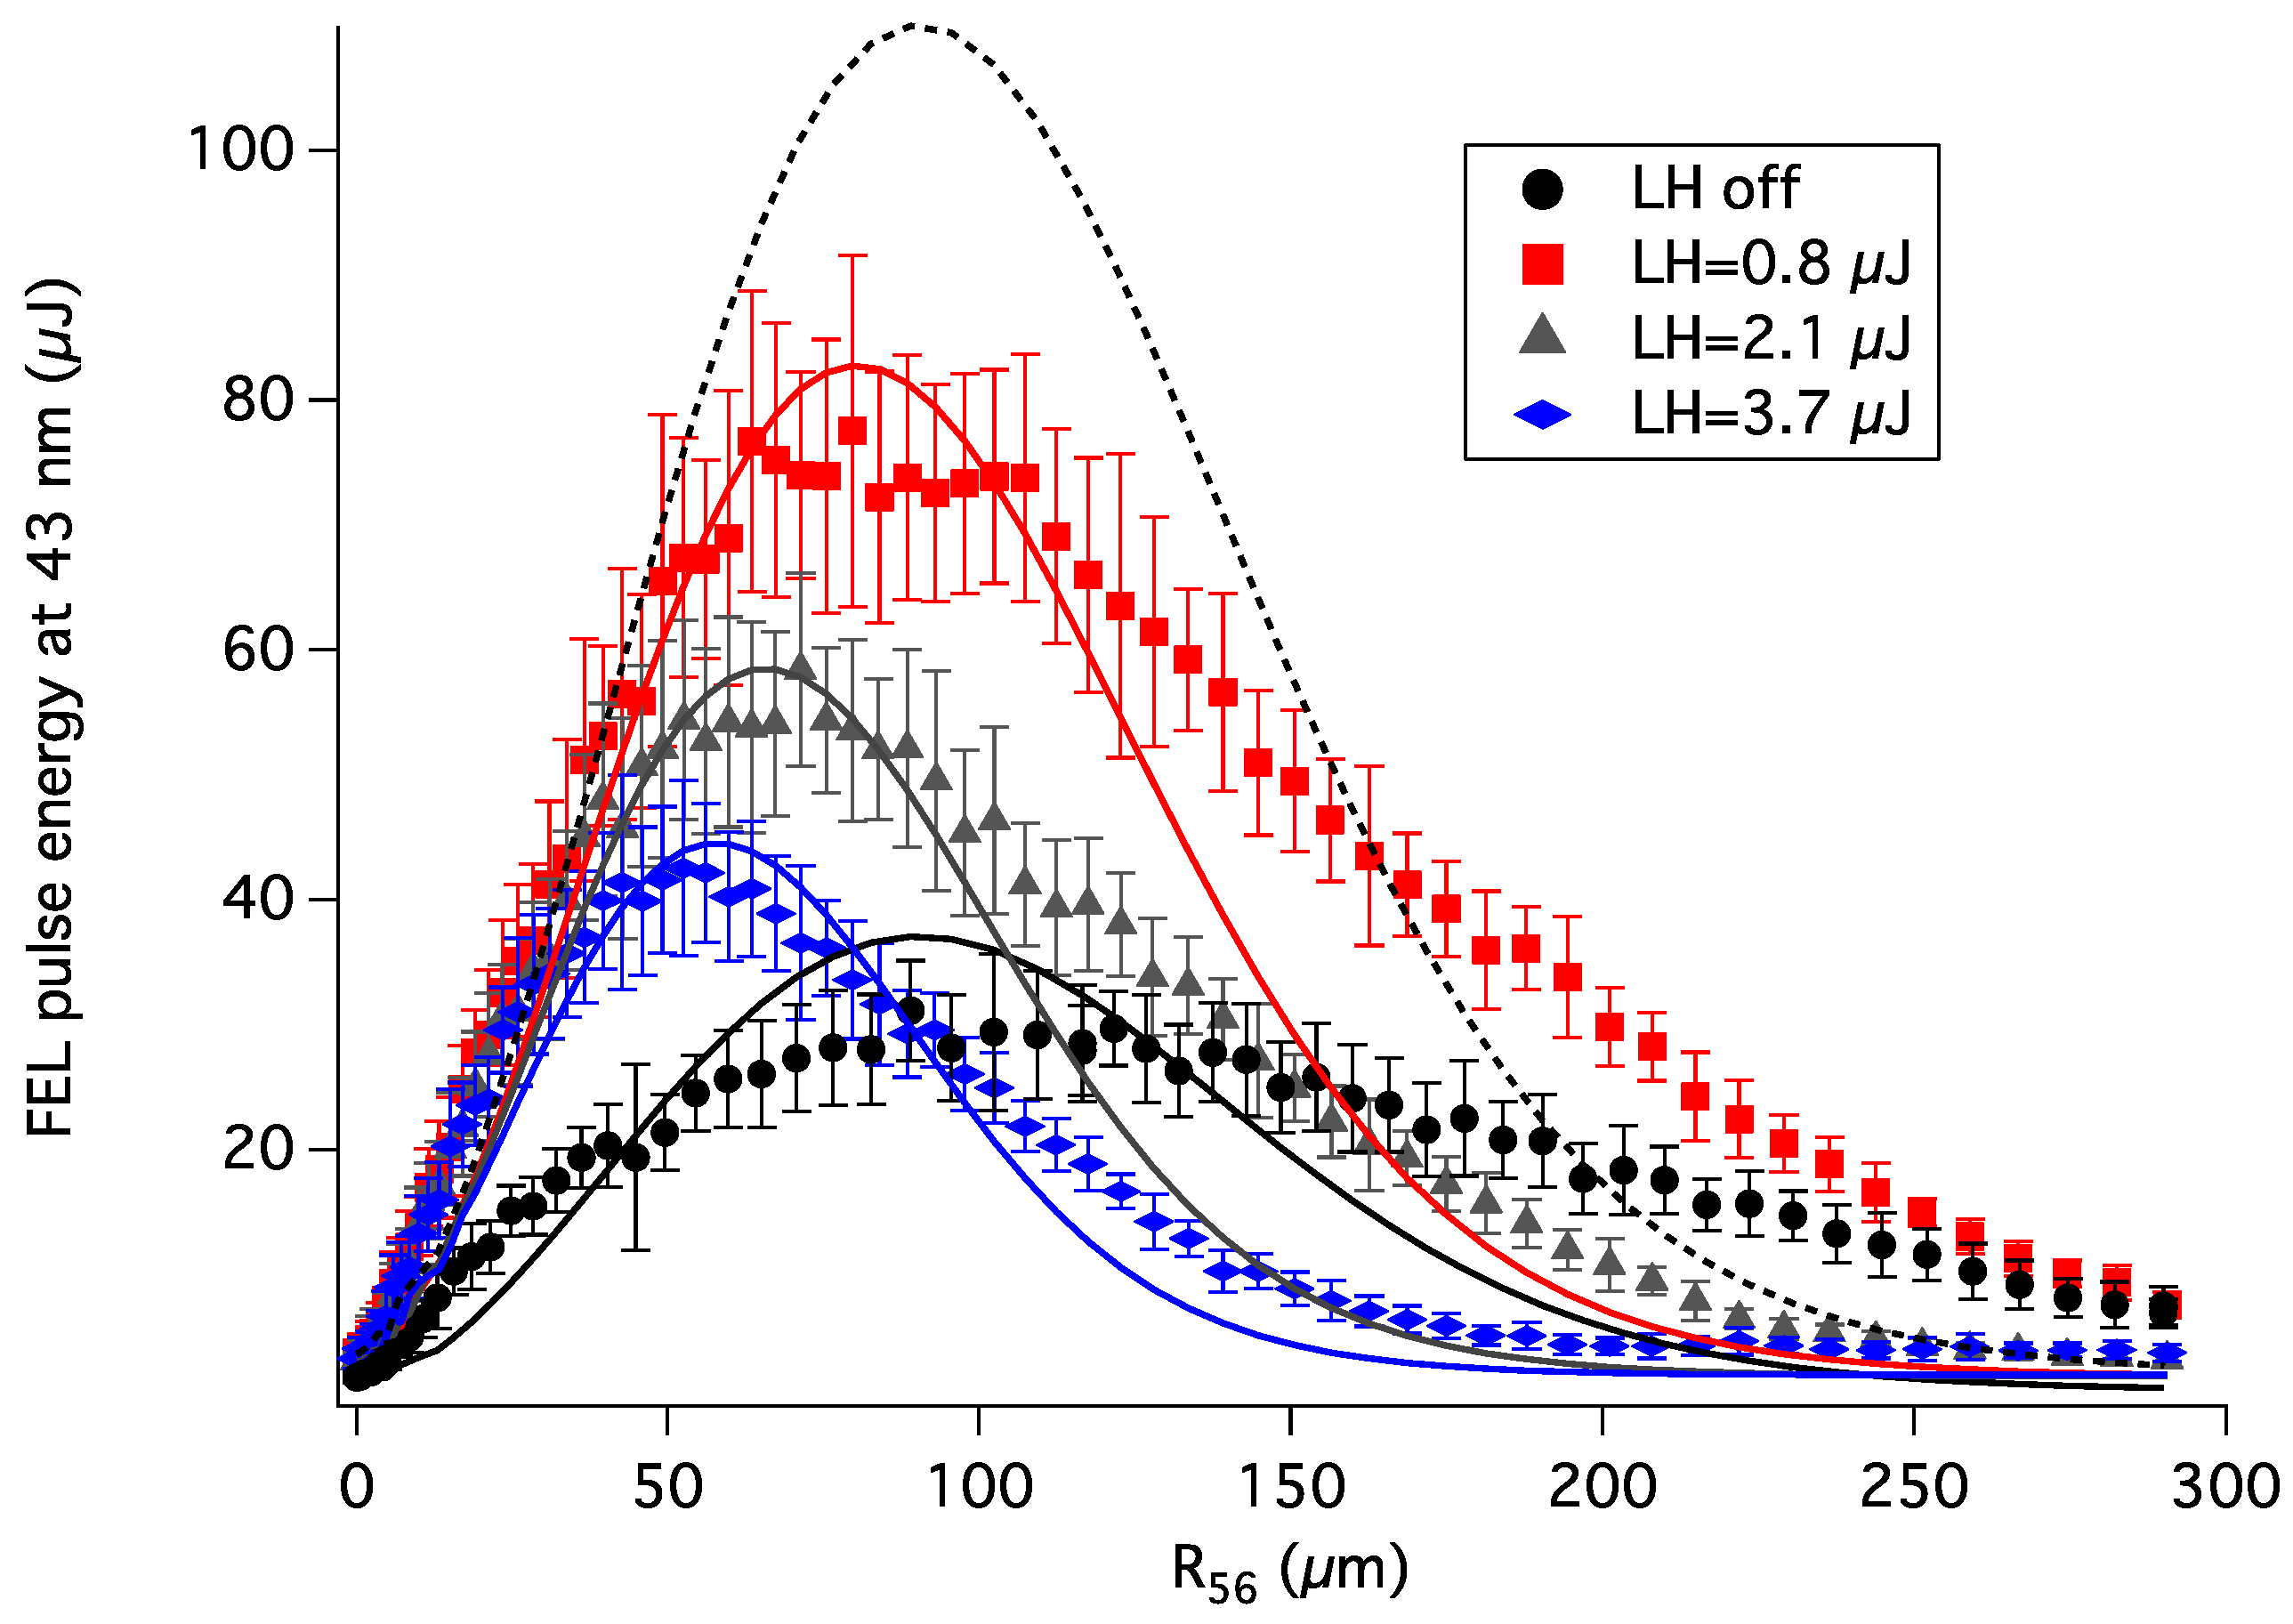
m. The radiation intensity has been enhanced by more than an order of magnitude with respect to the SASE operating without dispersion (red squares in Figure 3). We repeated the measurements of the OK FEL pulse energy as a function of the R 56 for different values of the laser heater energy, i.e., for different values of the induced slice energy spread, and the results are plotted in Figure 3.
Increasing the laser heater energy provides additional energy spread that depletes the OK enhancement, as observed also in [40], and its maximum value is obtained for smaller values of R 56 (see gray triangles and blue diamonds curves in Figure 3). Since, in the present scheme, the first undulator is three meters long, which means slightly more than two in gain length, the spontaneous radiation induced a very small energy modulation in comparison to the uncorrelated energy spread. Therefore, Equation (4) is valid and the peak of the OK SASE occurs when σ δ k r R 56 = 1 . By measuring the R 56 o p t in the cases plotted in Figure 3, it is possible to infer the intrinsic electron energy spread σ δ (see Table 1).
We have calculated the theoretical OK FEL gain factor G for each case by using Equation (4) and taking ρ = 1 . 7 × 10 3 and the value of σ δ listed in Table 1. The predicted OK FEL energy per pulse has been obtained multiplying the SASE pulse energy measured for R 56 = 0 by the calculated G. The results are plotted in Figure 3 (solid lines) for comparison with the measurements. A good agreement has been observed for values of the R 56 smaller or close to the optimum value R 56 o p t , while, for larger R 56 , the measured OK FEL energy is larger than expected by the 1D theory. The latter, in fact, makes the strong assumption that the beam energy distribution over a radiation wavelength is Gaussian and independent from the position along the bunch, with a second moment that we indicate as σ δ , λ r . However, as stated in [29], in a real electron beam, collective effects such as the microbunching instability lead to a dependence on the energy distribution from the bunch longitudinal position. We can therefore define the energy spread σ δ , F E L as that one calculated over the longitudinal scale affecting the FEL gain, i.e., the FEL cooperation length L c = λ r / 4 π ρ . In general, the energy spread σ δ , F E L can be larger than σ δ , λ r , leading to a reduced FEL emission. In our measurements, when the laser heater intensity is very low (red square data in Figure 3), and the microbunching instability is not completely suppressed, experimental data and model expectations agree only qualitatively. This effect is indeed much more evident in the case of a laser heater turned completely off: the intrinsic energy spread σ δ , λ r is very low, but the microbunching instabilities deteriorate the longitudinal phase space on the scale of the FEL cooperation length and longer wavelengths, enhancing the energy spread σ δ , F E L and depleting the OK performance. The ideal case of a cold beam without any microbunching modulations and with a very low energy spread has been simulated by taking the slice energy spread inferred by the experimental case with the laser heater off ( σ δ = 6 . 8 × 10 5 ) and the SASE level measured when the laser heater is tuned to suppress the microbunching and optimize the OK performance (LH energy = 0 . 8 μ J). In this ideal case, the theoretical behavior of the OK versus R 56 would provide an FEL emission much stronger than other curve (see the dashed black line in Figure 3). On the other side, when the laser heater is strong enough to almost suppress the microbunching instability (blue diamond data), the increased energy spread σ δ , λ r is comparable to σ δ , F E L , and the model is in agreement with the experiment results.
We have exploited the OK setup to enhance the SASE also at 32.4 nm and at 20 nm, setting the laser heater to optimize the OK output intensity (with an energy 0 . 8 μ J), and obtaining a gain factor of about 20 and 10, respectively. The optimum R 56 o p t measured for OK FEL operating at 32.4 nm and at 20 nm are, respectively, 75 μ m and 35 μ m.
The OK enhancement to the SASE process translates to a reduced number of undulators needed to reach the FEL saturation. In order to evaluate the actual advantage of this configuration, the FEL gain length has been calculated by measuring the exponential growth of the FEL output versus the number of resonant radiators (progressively detuning each radiator undulator). The measurement was repeated for three different values of the dispersive section R 56 , obtaining a gain length of about 1.2 m in all the cases as expected [29]. This value is in good agreement with the GENESIS 1.3 [41] simulation, which has been performed by using the same electron beam parameters as in the experiment. 
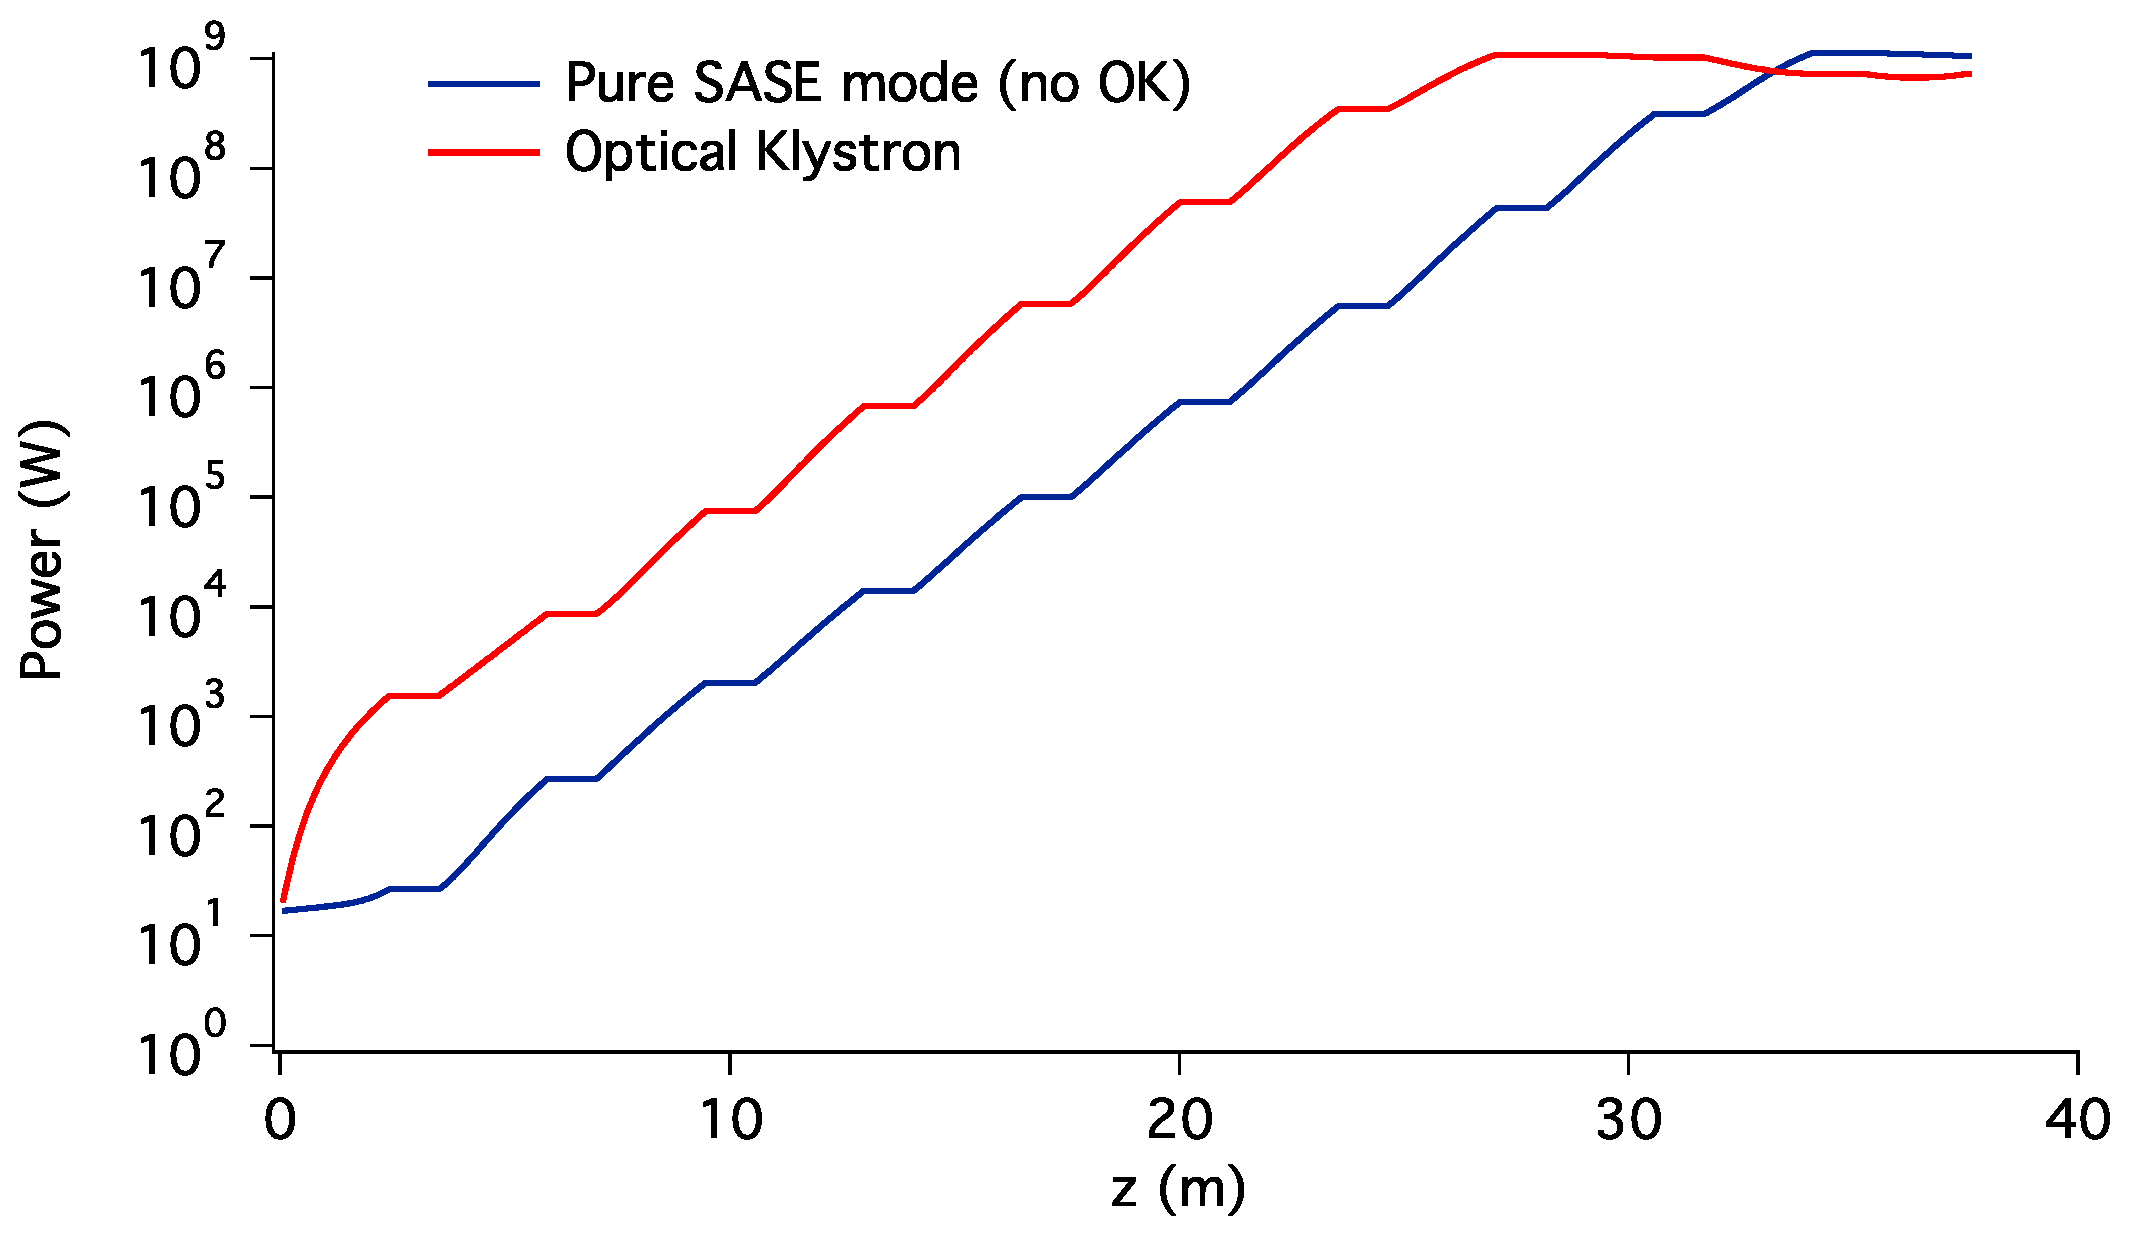
Figure 4 shows the simulated FEL power at 32.4 nm as a function of the longitudinal position along the radiator, assuming to have enough undulators to reach the FEL saturation. The optimization of the optical klystron would allow us to reach saturation savings of about 15%–20% of the total undulator length, with respect to standard SASE operation.

4. Experimental Demonstration of Multi-Stage OK SASE on FEL-2 Line at FERMI

As mentioned above, the OK scheme can be replicated in a multi-stage configuration, with alternating undulators and dispersive sections. The FERMI FEL-2 layout, designed for the double-stage cascade HGHG scheme [15], includes three dispersive sections that are suited to test and verify the multi-stage OK enhancement to SASE in the soft X-ray regime. 
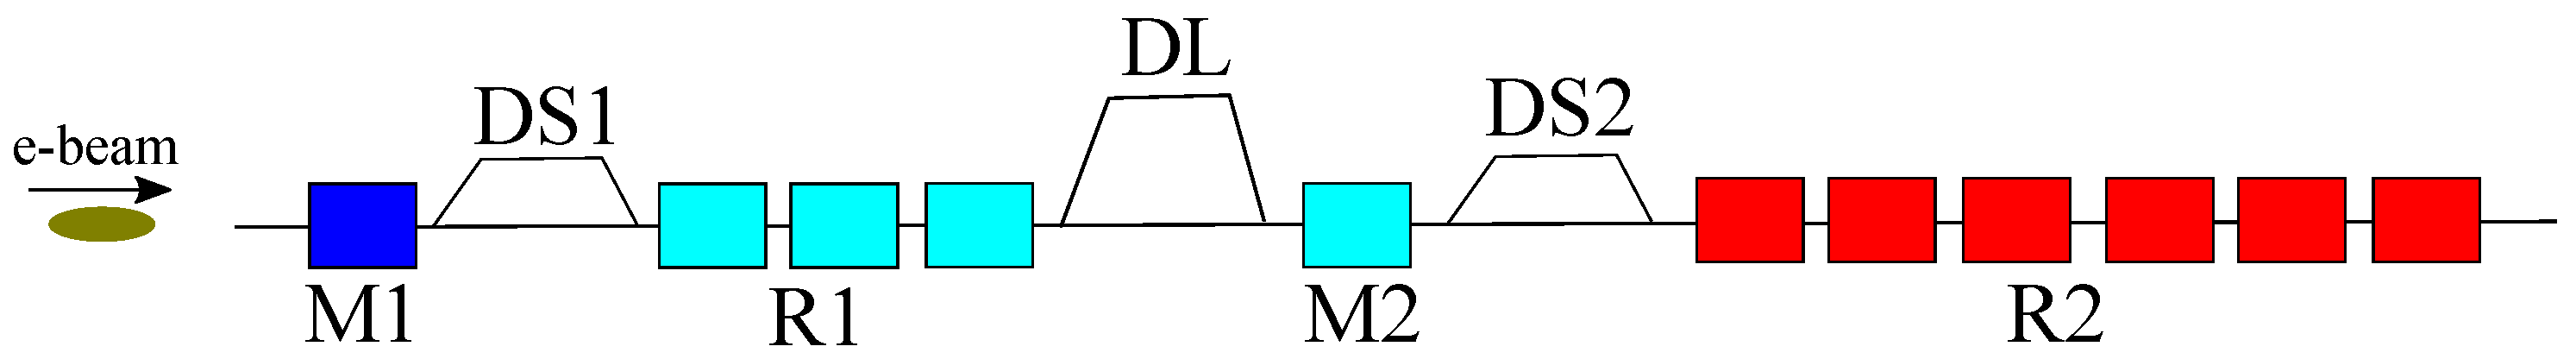
Figure 5 shows a sketch of the actual FEL-2 undulator layout.
All undulators have a variable gap allowing for tuning the magnetic field to satisfy the resonant condition in a wide wavelength range. However, the modulator M1 is designed to be resonant with the seed laser at optical wavelengths, i.e., 200–400 nm, and it cannot be tuned down to 20 nm, which is the upper limit of the spectral range of the FEL-2 final amplifier. For this reason, a first series of experiments was carried out without using M1 and the first dispersive section DS1. The rest of the undulators of R1, M2 and R2 were tuned at the same wavelength. In this setup, we have used only the two dispersive sections DL and DS2. 
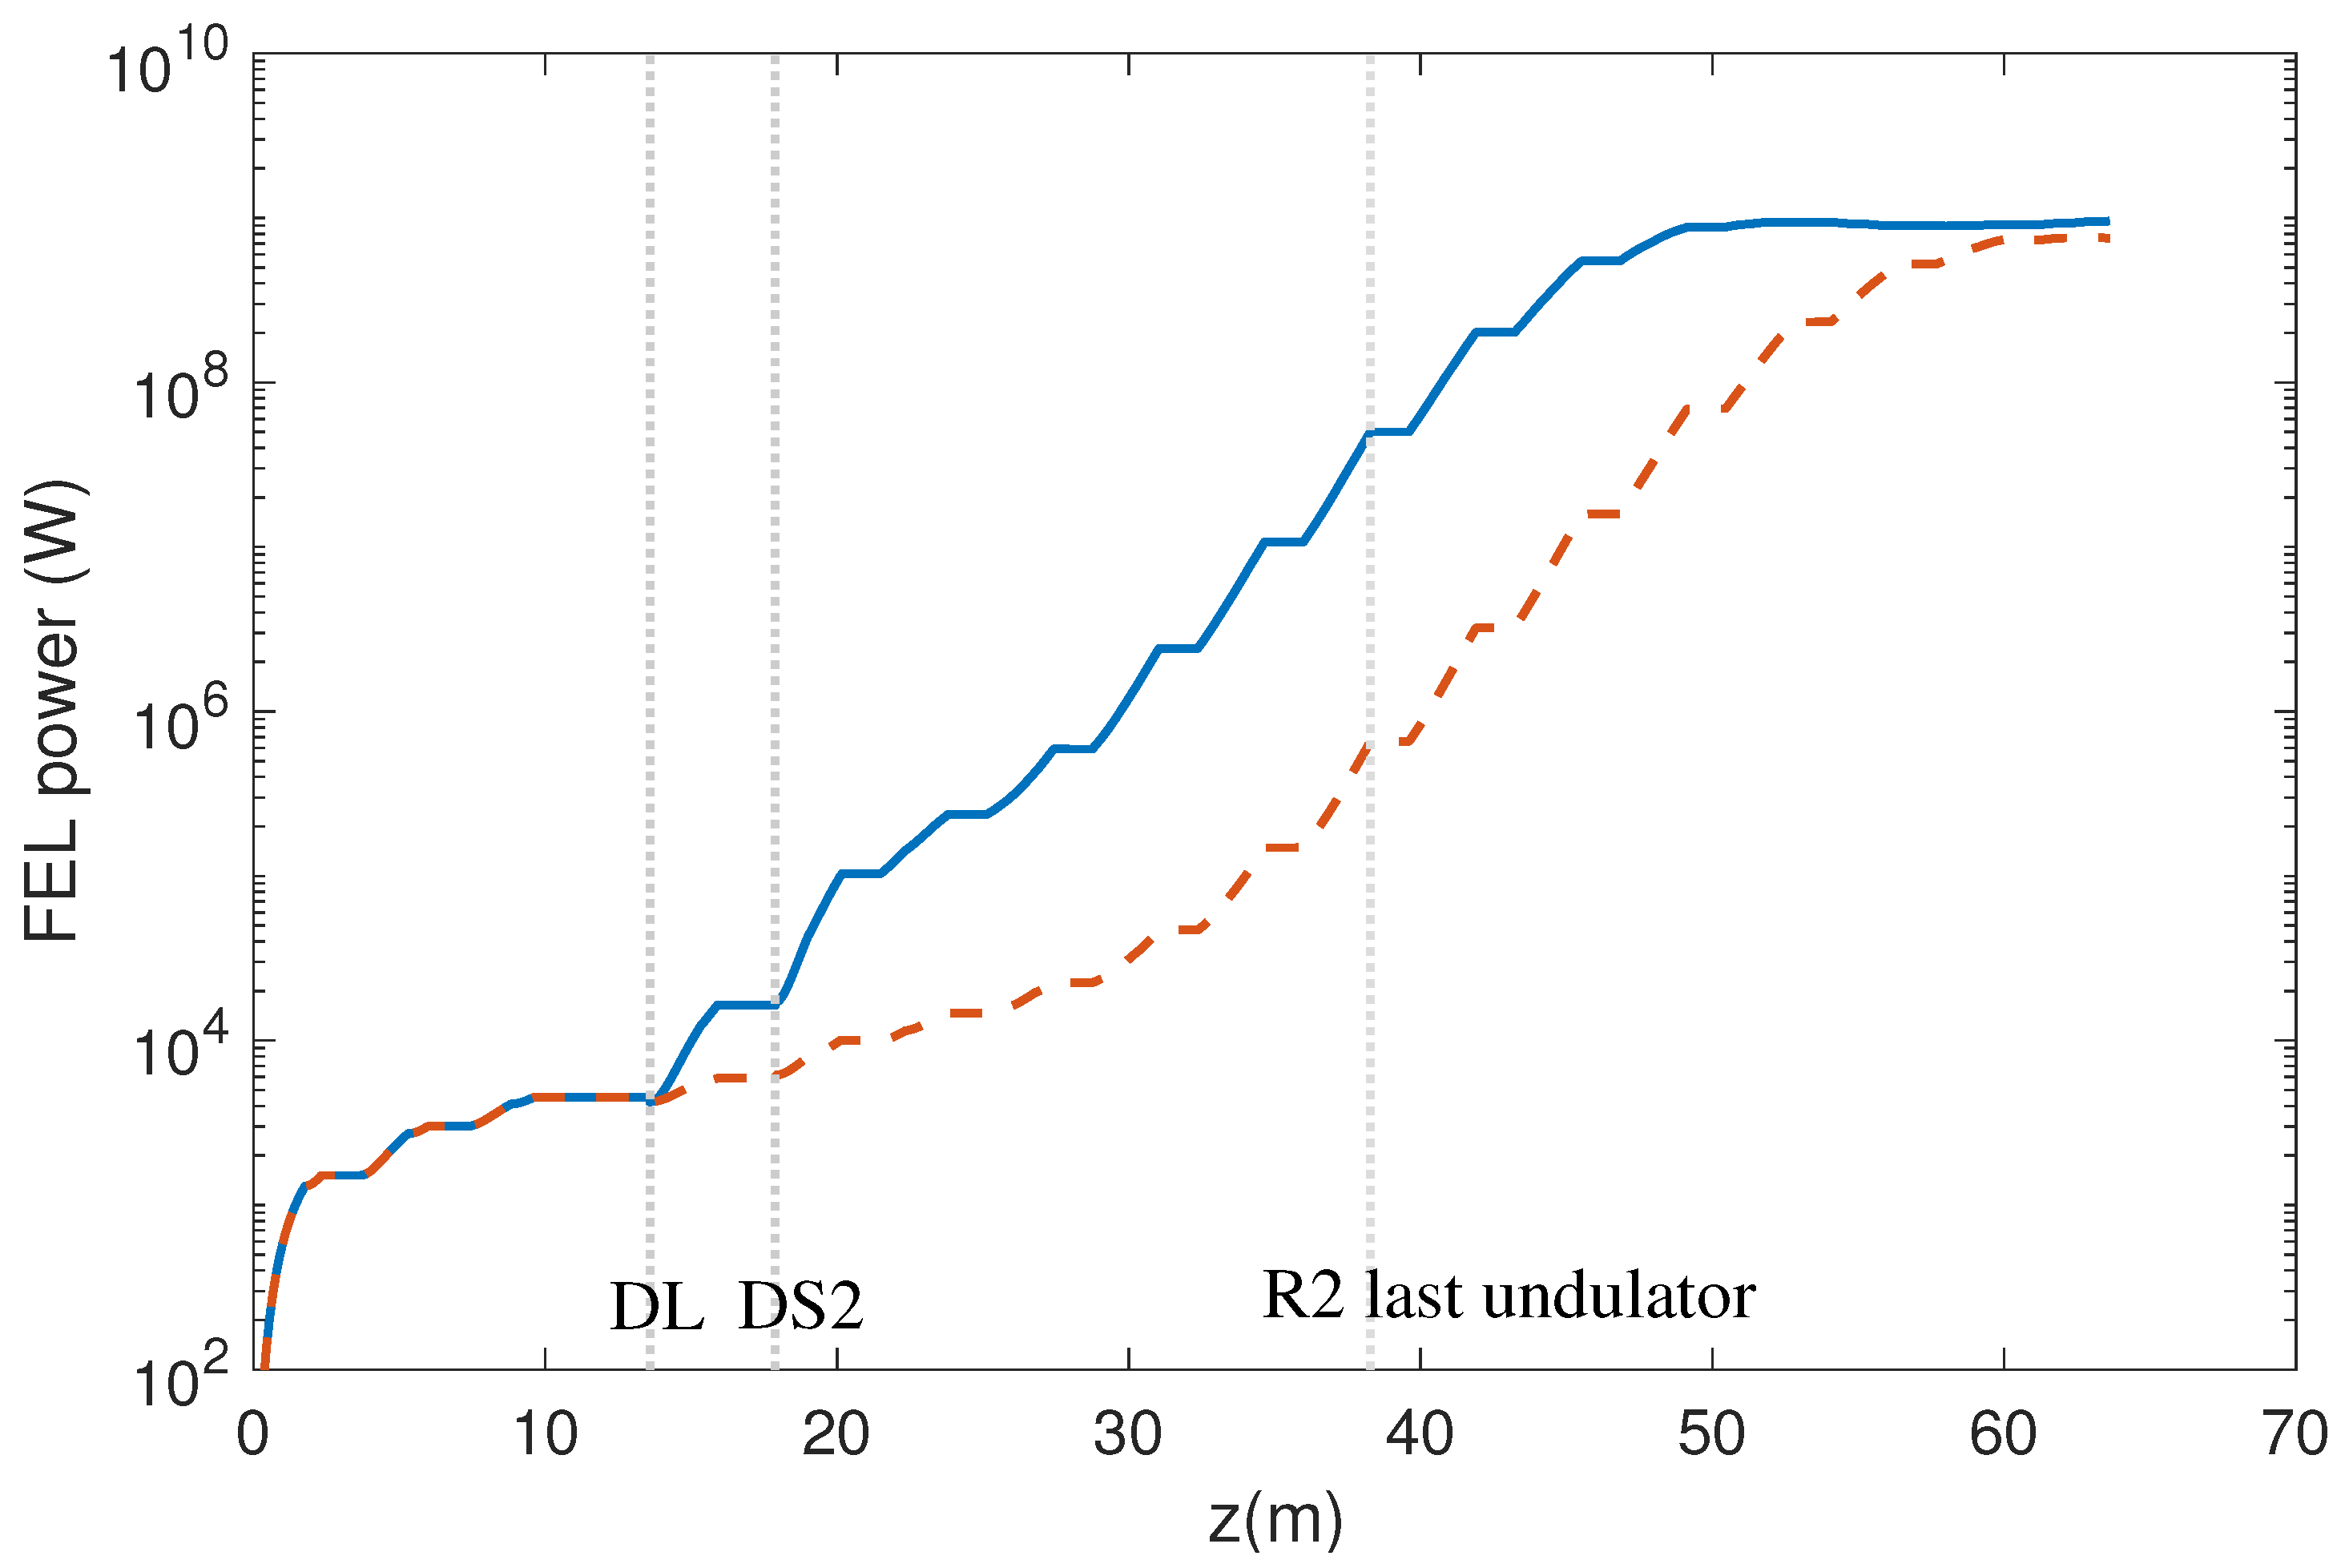
Figure 6 shows the results of GENESIS simulation of the two-stage OK scheme compared to the SASE mode without enabling any dispersions, when R1, M2 and R2 are tuned to be resonant with λ r = 5 . 3 nm. An ideal electron beam has been considered, with a peak current of 700 A, beam energy 1.525 GeV, slice emittance ϵ n = 1 mm mrad, and an average beam spot size along the undulator of about 70 μ m. By optimizing DL, the FEL power increases by about a factor 4 in M2, against the 30 % increment of SASE with the dispersion of DL set to zero. Furthermore, setting DS2 at the optimum value enhances the FEL power in the first undulator of R2 by more than a factor 6, while, without the dispersion, the gain would be less than a factor 2. The expected output power at the end of R2 exploiting the two-stage OK at 5.3 nm is higher than without any dispersions by two orders of magnitude, and only 2–3 more undulators would be necessary to reach FEL saturation.
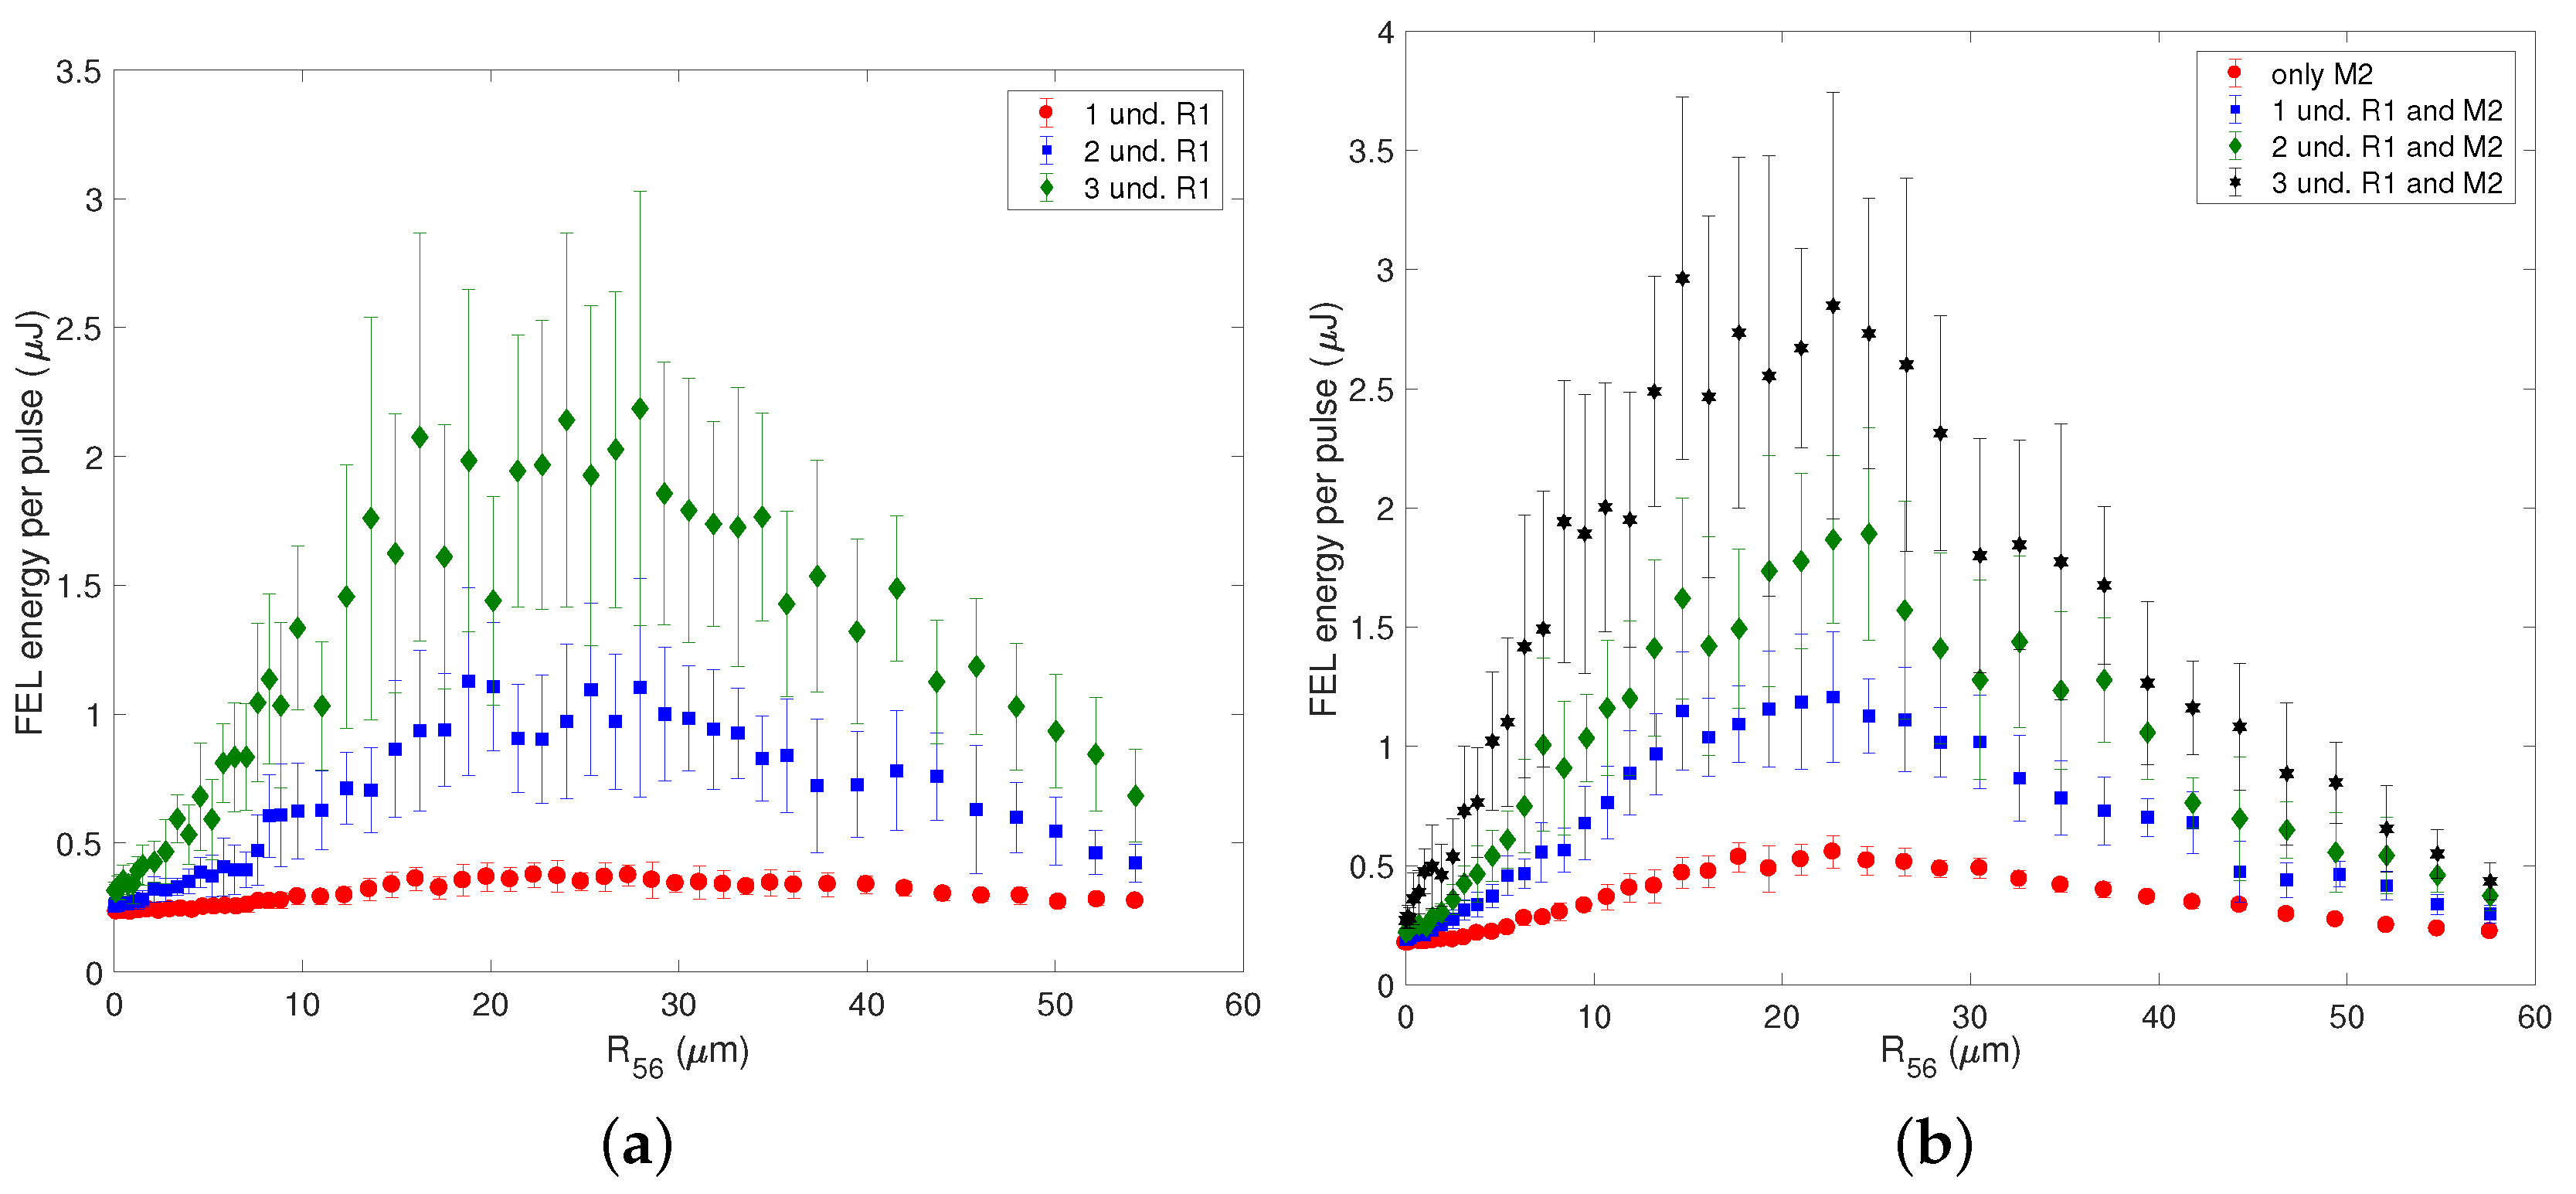
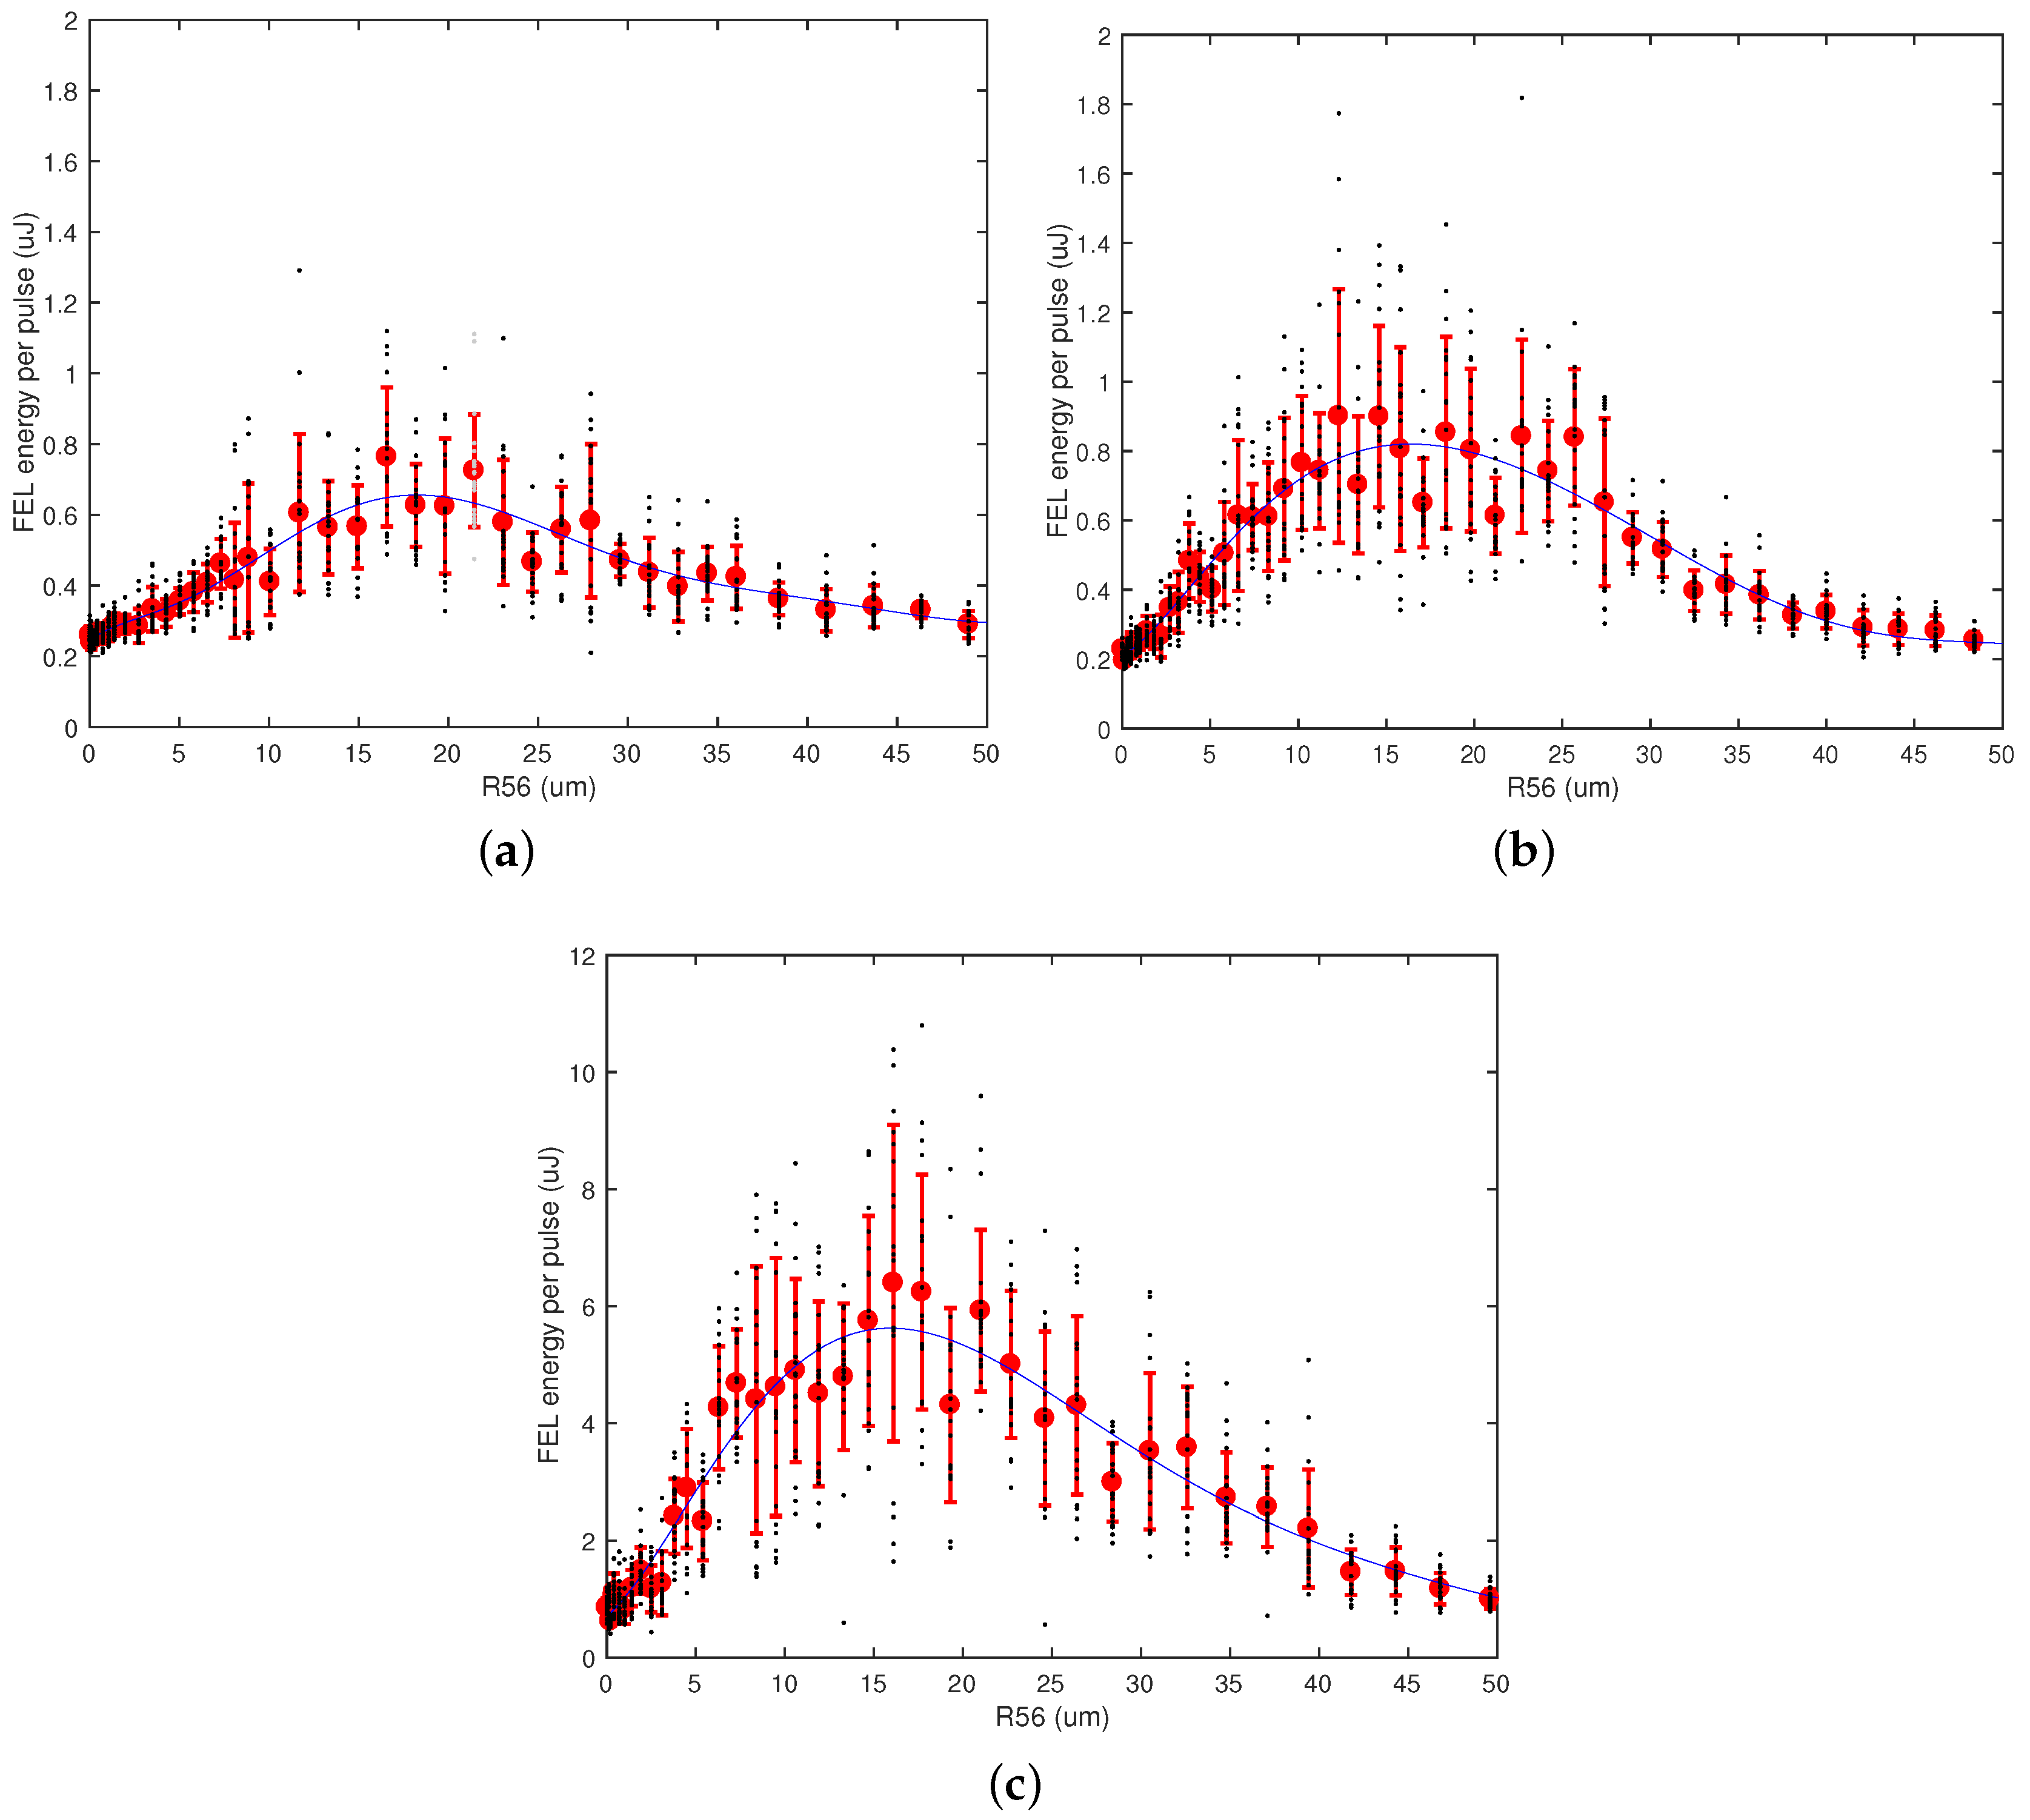
Several experiments in two-stage OK mode have been performed, and we report the case at 5.3 nm in Figure 7 as an example.
When DL and DS2 are set straight, i.e., R 56 = 0 μ m, the FEL is in the SASE standard configuration. In this condition, we have measured an energy per pulse of about 0.2 μ J. An increase of the R 56 of the DL (Figure 7a) only, or similarly of the R 56 of DS2 only (Figure 7b), corresponds to a single-stage OK layout, as described in the previous section. Figure 7a shows that the SASE output is enhanced by more than a factor 3 by using only DL or, alternatively, DS2. In the latter case, the FEL pulse energy is slightly higher because of the contribution of the M2 undulator to the energy modulation before the dispersive section: this increases the bunching factor at the entrance of R2, slightly reducing the value of R 56 o p t , which is R 56 , D L o p t = 18 μ m, in the first case, and R 56 , D S 2 o p t = 16 . 4 μ m, in the second case. From the relationship σ δ k r R 56 , D L o p t = 1 , we can estimate the intrinsic beam energy spread σ δ = 4 . 6 × 10 5 
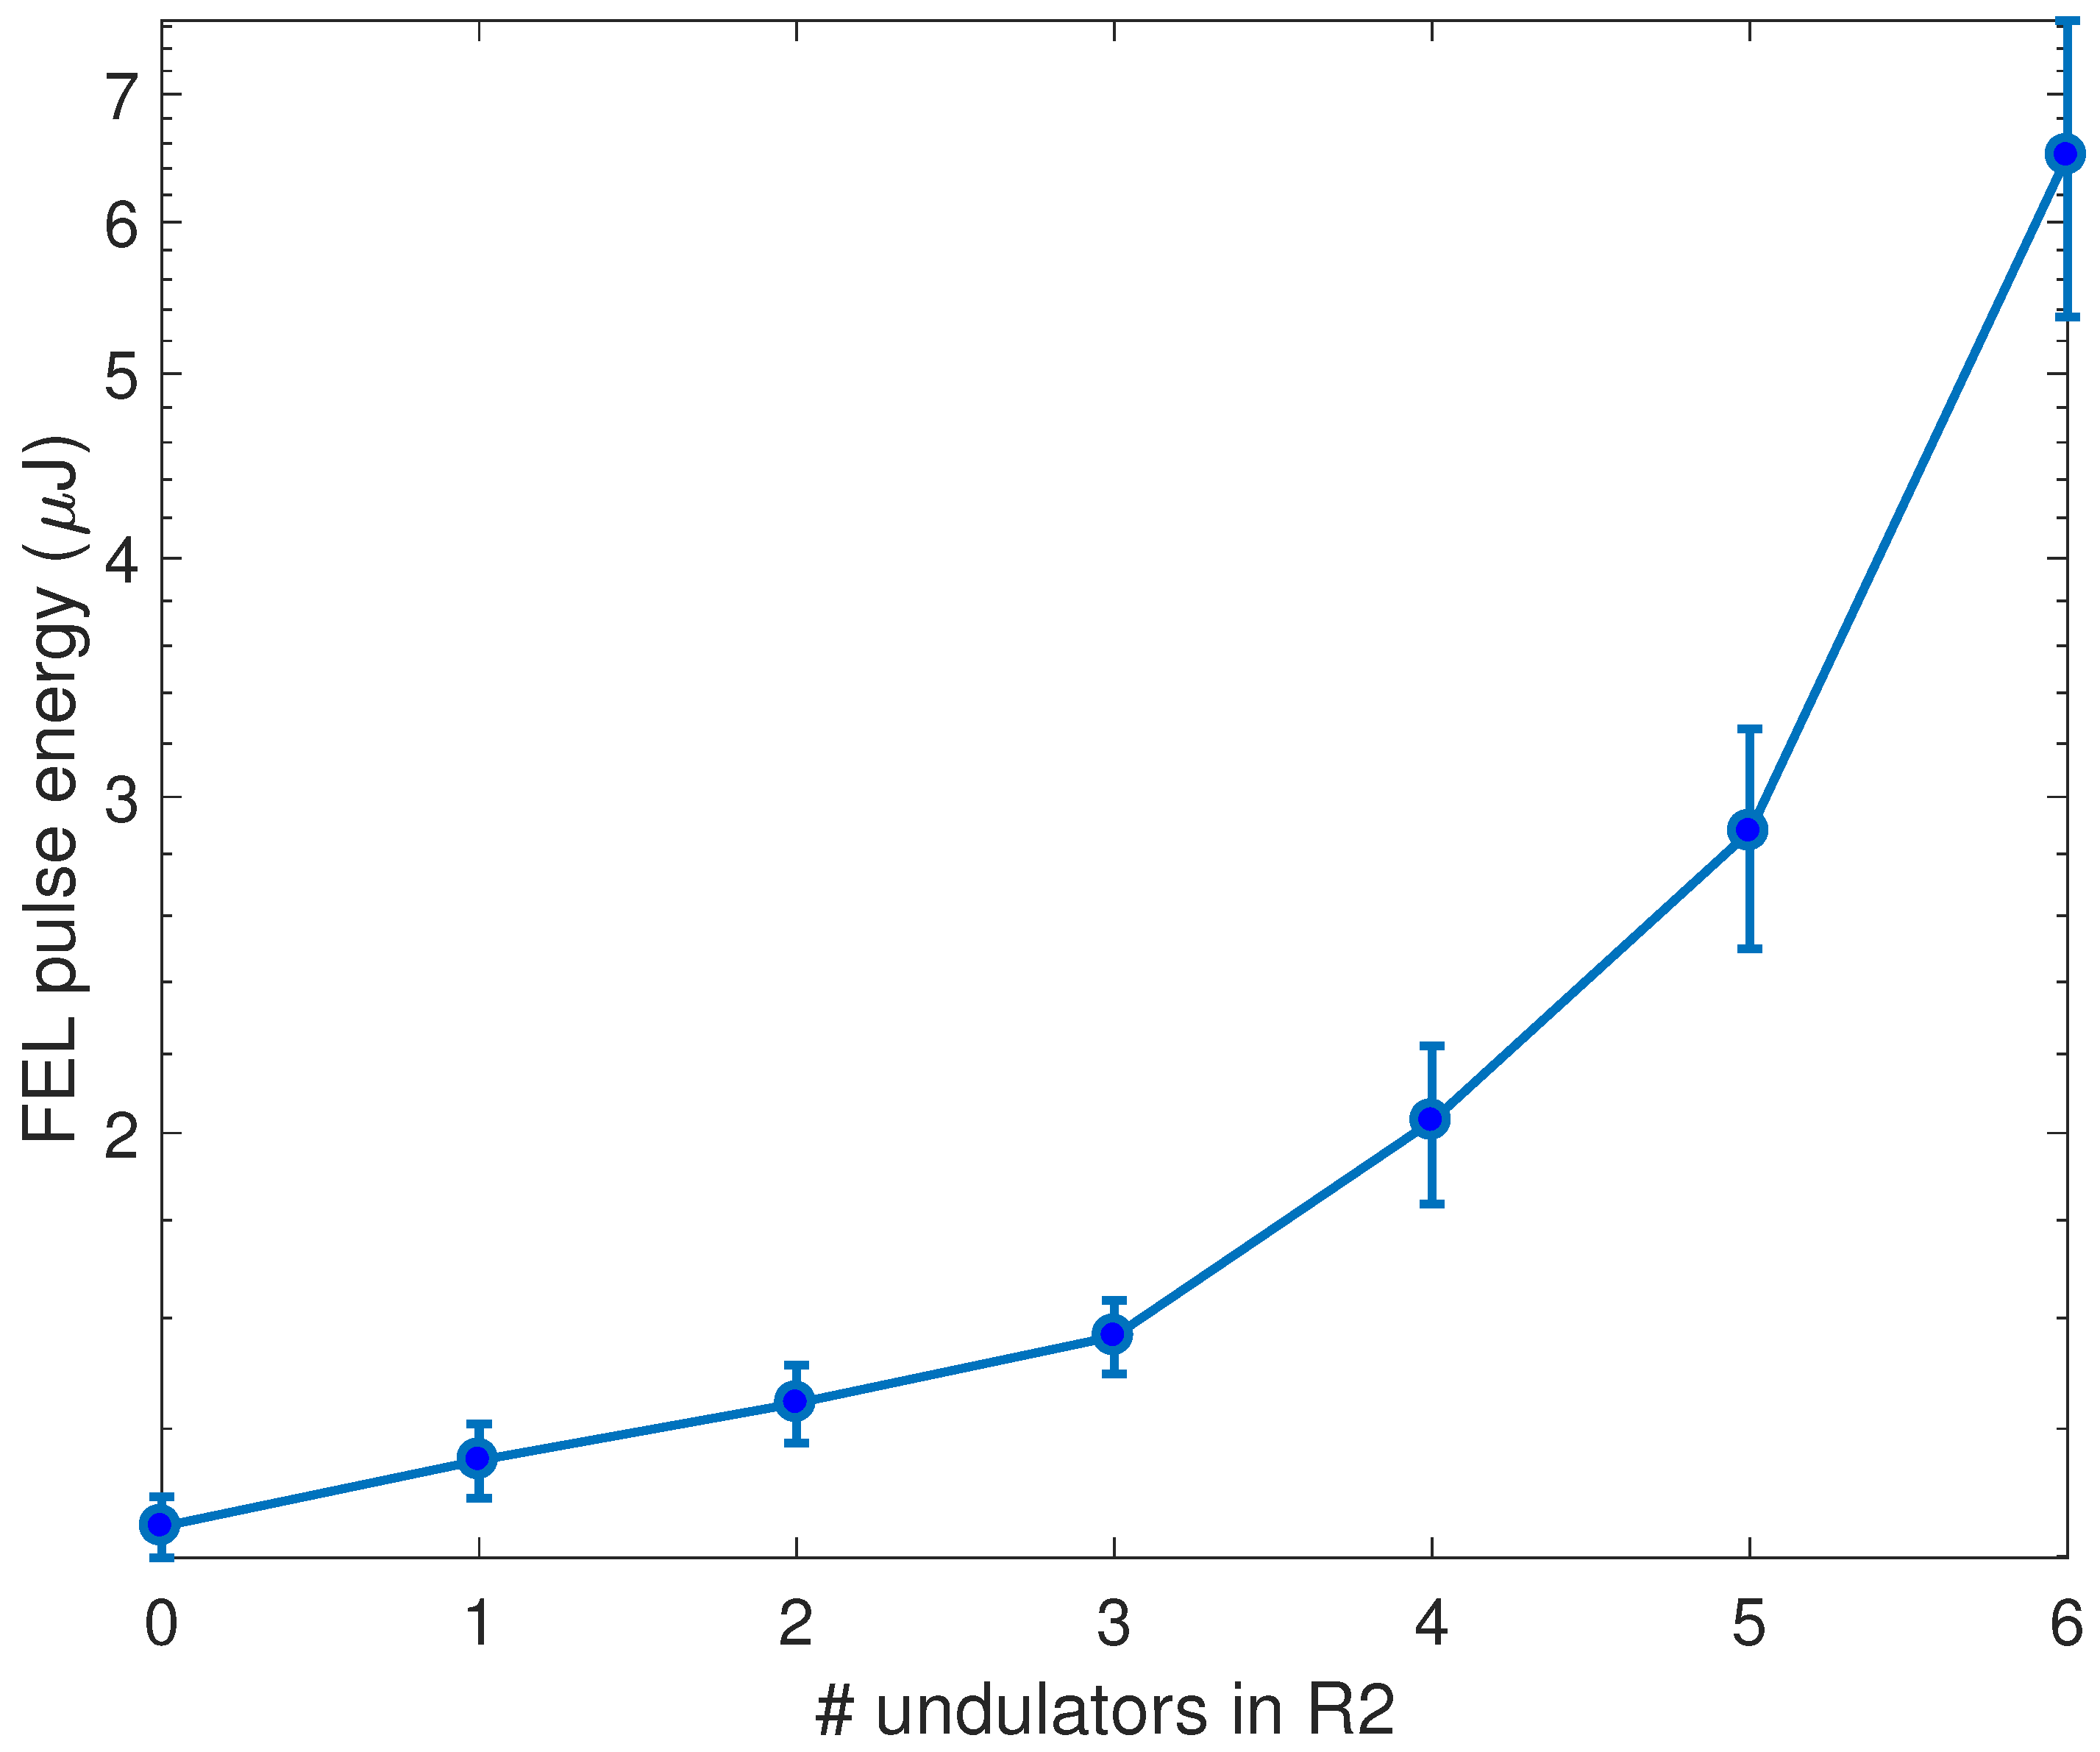
. Some more measurements have been performed varying the number of undulators used before the dispersive section in order to study the effect of the energy modulation induced by the spontaneous emission. The results are reported in the Appendix A.
A further enhancement of the pulse energy has been obtained by setting R 56 , D L to the optimum value of 18 μ m and by using DS2 for a second-stage OK. Figure 7c shows that the two-stage OK scheme increased the FEL output by about a factor of 10 relative to the single stage OK, reaching an average energy per pulse of 6 μ J with isolated shots over 10 μ J. The optimum R 56 , D S 2 is further shifted to 16 μ m, consistently to the augmented bunching at the entrance of R2 undulators. To demonstrate the role played by the M2 undulator, we have excluded it (by completely detuning its gap), and we have repeated the scan of DS2 with the DL set at its optimum value: the FEL intensity progressively decreased because of the overbunching induced by DS2 itself. In this layout, we have demonstrated an average enhancement of the FEL pulse energy by about a factor of 30 with the two-stage OK scheme relative to the SASE operating without any dispersions.
The FEL exponential growth in the two-stage OK regime has been measured as in the previous section by progressively detuning the undulators of R2, and the results are plotted in Figure 8. Taking into account the last step-up and considering an undulator length of 2.42 m, we have estimated a gain length of about 3.0 m.
As previously explained, the modulator M1 is not tunable down to 20 nm, but its resonance can be set to one of the sub-harmonics of the FEL output wavelength λ m = m λ r . In this layout, we may expect some contribution of the modulator and of the first dispersive section DS1 in converting the energy modulation induced in M1 in bunching at λ m and at its higher harmonic λ r . 
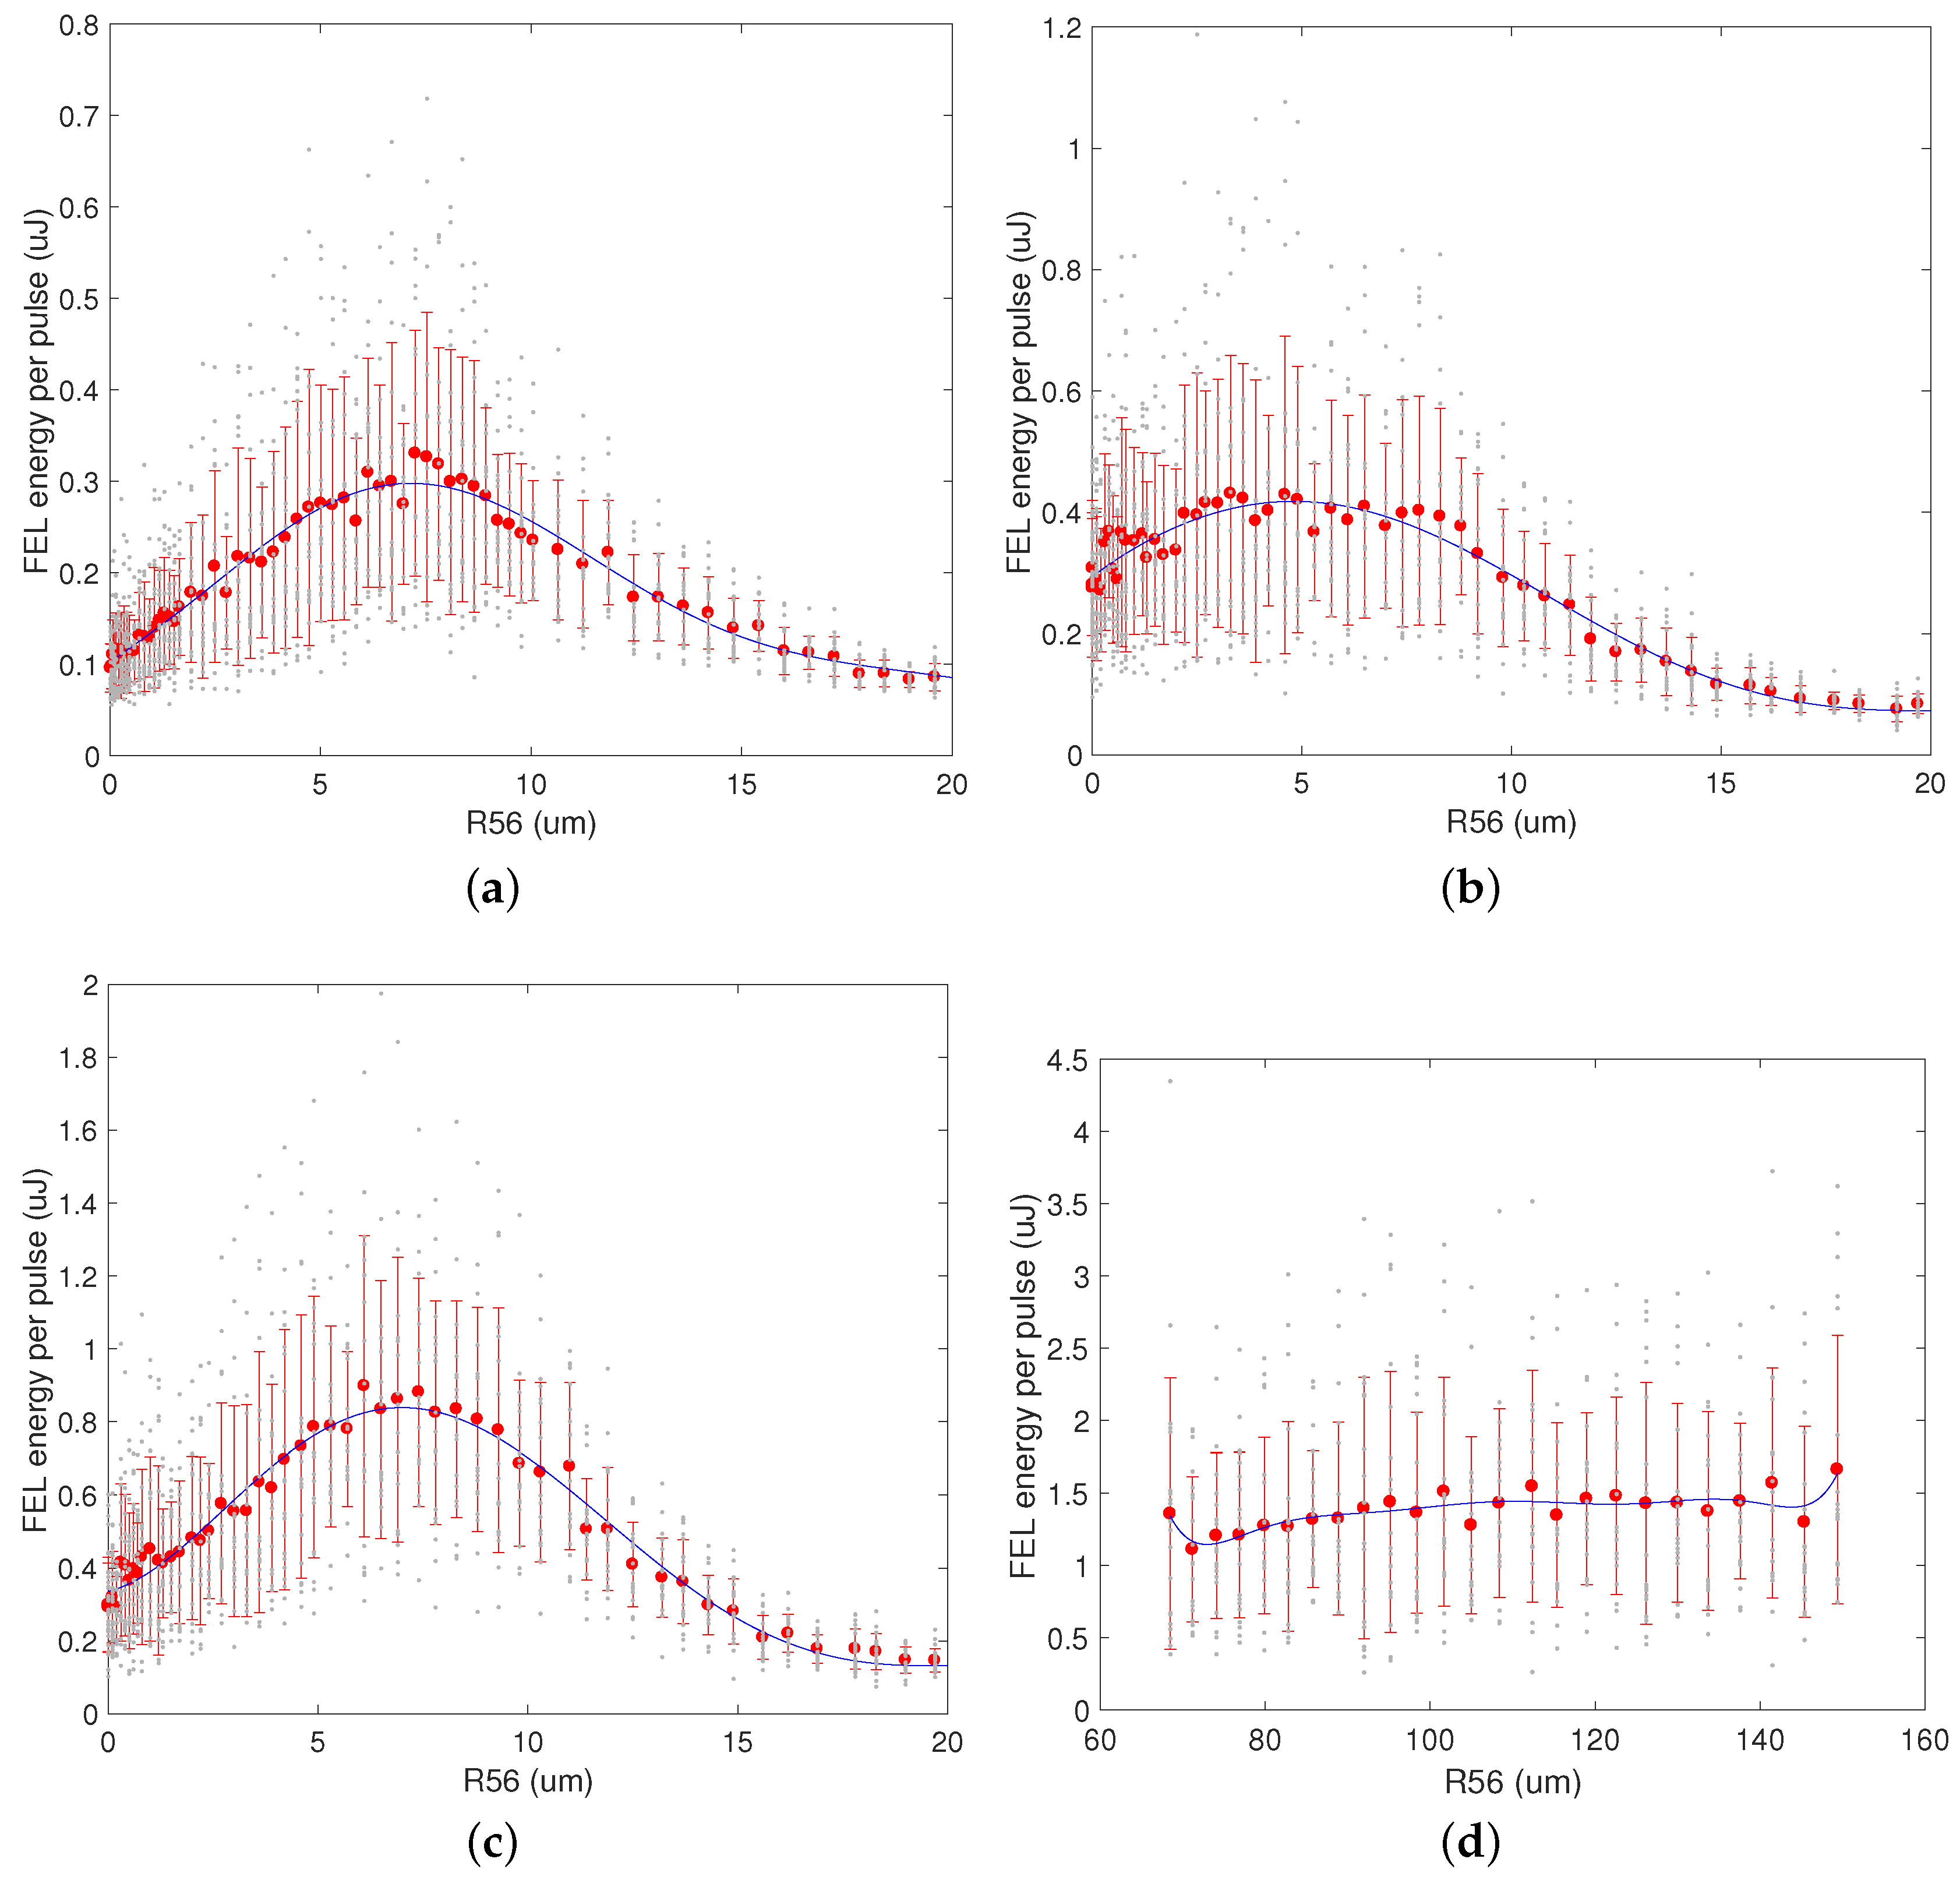
Figure 9 shows the results of an experiment of three-stage OK realized by tuning M1 at 66 nm and R1, M2 and R2 at 4.4 nm. Figure 9a presents the single-stage OK enhancement to SASE obtained by using the dispersive element DL: the maximum FEL intensity is achieved at R 56 , D L = 7 . 1 μ m, corresponding to an estimate of the slice energy spread σ δ = 9 . 8 × 10 5 . This value is larger than what we estimated in the experiment at 5.3 nm because the larger sensitivity to the microbunching instabilities at shorter wavelengths required a more powerful laser heater, with a consequent increase of the slice energy spread. At the time of the experiment, the radiator R1 was composed of two undulators, so that the induced energy modulation before DS2 was lower than the one corresponding to the experiment shown in Figure 7. At a wavelength of 4.4 nm, the two-stage OK increased the FEL intensity by about 30%–50% (see Figure 9b) with respect to the single-stage OK (Figure 9a). In this condition, the gain length is relatively long and the gain process is far from reaching the onset of saturation. However, the implementation of a three-stage OK enhanced the SASE output pulse energy (see Figure 9c) by about a factor of two with respect to the two-stage OK mode.
In the single and multi-stage OK configuration, with all the undulators tuned at the same wavelength, there exists a clear optimum value of the dispersion R 56 that maximizes the SASE output pulse energy. On the contrary, the optimization of DS1 with the modulator M1 tuned at a sub-harmonic of the final wavelength shows a modest sensitivity to the value of the dispersion. Figure 9d shows the FEL pulse energy in the three-stage OK configuration as a function of the R 56 , D S 1 , after optimizing DL and DS2. It is essential to set the dispersion different from zero to observe the enhancement, but the plot doesn’t show a clear maximum in the dispersion range analysed. The reason is linked to the dynamics of the bunching factor, which results from an energy modulation at the subharmonic 66 nm rather than at the final wavelength of 4.4 nm. The optimum value of the dispersion matches the condition σ δ R 56 = λ m / 2 π , where λ m is the long wavelength of the first modulator, even if the relevant modulation for the growth of the FEL signal is the contribution at the high order harmonic λ r .

5. Conclusions

We have studied single and multi-stage OK configurations in different wavelength ranges in the FERMI FEL layouts. A single-stage OK configuration has been set-up and studied in the VUV on the FERMI FEL-1 line. Multiple-stage configurations were tested on two-stage HGHG configuration of FERMI FEL-2 by exploiting the two dispersive sections of the two stages and the delay line between the two stages. A double-stage OK setup allowed for varying independently the dispersions in the stages and investigating the behavior of the system in the soft-X ray range. We have shown and verified that the relationship between the initial energy spread and the optimized value of the dispersion is independent from the specific dispersive section used (see Appendix A). This supports the fact that the relation σ δ R 56 = λ r / 2 π , depending only on the intrinsic energy spread, on the dispersion value and on the final wavelength, can be used as an indirect diagnostic to infer the intrinsic beam slice energy spread [29]. After optimizing the two dispersions, we have observed at a wavelength of 5.3 nm a gain of about 30 with respect to the standard SASE configuration. Assuming as a reference the measured gain length of 2.42 m, this corresponds to an overall undulator magnetic shortening of about 8.2 m. The three-stages of configuration were tested at 4.4 nm, with the first stage operating at a sub-harmonic of the final output wavelength. In this multi-stage “harmonic” configuration, where the shorter wavelength increases the sensitivity to the beam energy spread, we still observed a gain in pulse energy of about 15. This last experiment paves the way for multi-stage OK FEL configurations, with the additional degree of freedom of the combination of different harmonic resonances that can be used in the optimization of single-pass SASE FEL sources.

Acknowledgments

The authors are grateful to the entire FERMI commissioning team for their valuable support in the optimization of the machine during the described experiments and the PADReS team for the help in delivering the radiation to the end-station.

Author Contributions

G.P., E.A., E.F., E.R. and S.S. performed the experiments; all authors participated to the analysis and discussion of the experimental data; G.P. wrote the paper.

Conflicts of Interest

The authors declare no conflict of interest.

Appendix A

In a single stage OK scheme, the larger the energy modulation induced by the spontaneous emission in the undulators before the dispersive section, the smaller the optimum R 56 o p t to maximize the bunching after the dispersive section. Figure A1 illustrates the effect of the number of undulators used before the dispersive section in the case of exploiting only DL or only DS2. As in the previous experiments, we plot the average over 20 shots for each value of R 56 with an error bar corresponding to the standard deviation. The value R 56 o p t is obtained by fitting the data with an 8th-degree polynomial function. Taking, for instance, the case of a single undulator (red circles), R 56 , D L o p t = 22 . 67 μ m and R 56 , D S o p t = 22 . 69 μ m, which provides σ δ = 3 . 7 × 10 5 . One can see that, for up to three undulators, the maximum of the FEL intensity occurs for almost the same R 56 , while adding the forth undulator (black hexagons in Figure A1b) shifts the R 56 o p t to lower values and the relationship σ δ k r R 56 , D L o p t = 1 is no longer valid. It is worthwhile to remark that the electron bunch used in this experiment was better optimized in terms of slice energy spread (laser heater perfectly tuned) and trajectory steering along the undulators than in the case illustrated in Section 4, and this has also improved the OK performance, which can be compared to the Figure 7 only qualitatively.
Figure A1. OK enhancement at 5.3 nm to SASE as a function of the number of undulators used before the dispersive section, by exploiting only DL (a) or only DS2 (b). Beam energy = 1.525 GeV, σ δ = 3 . 7 × 10 5 .
Photonics 04 00015 g010

References

  1. Vinokurov, N.A.; Skrinsky, A.N. About the Maximum Power of an Optical Klystron on a Storage Ring. Report No. BINP 77-67; Budker Institute for Nuclear Physics: Novossibirsk, Russia, 1977. [Google Scholar]
  2. Artamonov, A.S.; Vinokurov, N.A.; Voblyi, P.D.; Gluskin, E.S.; Kornyukhin, G.A.; Kochubei, V.A.; Kulipanov, G.N.; Litvinenko, V.N.; Mezentsev, N.A.; Skrinsky, A.N. The first experiments with an optical klystron installed on the VEPP-3 storage ring. Nucl. Instrum. Meth. 1980, 177, 247–252. [Google Scholar] [CrossRef]
  3. Kornyukhin, G.A.; Kulipanov, G.N.; Litvinenko, V.N.; Mesentsev, N.A.; Skrinsky, A.N.; Vinokurov, N.A.; Voblyi, P.D. Status of the INP optical klystron. Nucl. Instrum. Meth. A 1985, 237, 281–288. [Google Scholar] [CrossRef]
  4. Billardon, M.; Elleaume, P.; Ortega, J.M.; Bazin, C.; Bergher, M.; Velghe, M.; Petroff, Y. First Operation of a Storage-Ring Free-Electron Laser. Phys. Rev. Lett. 1983, 51, 1652. [Google Scholar] [CrossRef]
  5. Billardon, M.; Elleaume, P.; Ortega, J.M.; Bazin, C.; Bergher, M.; Couprie, M.E.; Lapierre, Y.; Prazers, R.; Velghe, M.; Petroff, Y.; et al. Short-Wave-Length Operation of a Storage Ring Free-Electron Laser. Europhys. Lett. 1987, 3, 689. [Google Scholar] [CrossRef]
  6. Drobyazkro, I.B.; Kulipanov, G.N.; Litvinenko, V.N.; Pinayev, I.V.; Popik, V.M.; Silvestrov, I.G.; Skrinsky, A.N.; Sokolov, A.S.; Vinokurov, N.A. Lasing in visible and ultraviolet regions in an optical klystron installed on the VEPP-3 storage ring. Nucl. Instrum. Meth. A 1989, 282, 424–430. [Google Scholar] [CrossRef]
  7. Litvinenko, V.N.; Park, S.H.; Pinayev, I.V.; Wu, Y. Operation of the OK-4/Duke storage ring FEL below 200 nm. Nucl. Instrum. Meth. A 2001, 475, 195–204. [Google Scholar] [CrossRef]
  8. Walker, R.; Clarke, J.A.; Couprie, M.E.; Dattoli, G.; Eriksson, M.; Garzella, D.; Giannessi, L.; Marsi, M.; Nahon, L.; Nölle, D.; et al. First lasing and initial performance of the European UV/VUV storage ring FEL at ELETTRA. Nucl. Instrum. Meth. A 2001, 475, 20–27. [Google Scholar] [CrossRef]
  9. De Ninno, G.; Allaria, E.; Coreno, M.; Chowdhury, S.; Curbis, F.; Danailov, M.B.; Diviacco, B.; Ferianis, M.; Karantzoulis, E.; Longhi, E.C.; et al. Self-Induced Harmonic Generation in a Storage-Ring Free-Electron Laser. Phys. Rev. Lett. 2008, 100, 104801. [Google Scholar] [CrossRef] [PubMed]
  10. Marsi, M.; Trovó, M.; Walker, R.P.; Giannessi, L.; Dattoli, G.; Gatto, A.; Kaiser, N.; Günster, S.; Ristau, D.; Couprie, M.E.; et al. Operation and performance of a free electron laser oscillator down to 190 nm. Appl. Phys. Lett. 2002, 80, 2851–2853. [Google Scholar] [CrossRef]
  11. Litvinenko, V.N. High gain distributed optical klystron. Nucl. Instrum. Meth. A 1991, 304, 463–464. [Google Scholar] [CrossRef]
  12. Wu, Y.K.; Vinokurov, N.A.; Mikhailov, S.; Li, J.; Popov, V. High-Gain Lasing and Polarization Switch with a Distributed Optical-Klystron Free-Electron Laser. Phys. Rev. Lett. 2006, 96, 224801. [Google Scholar] [CrossRef] [PubMed]
  13. Ackermann, W.; Asova, G.; Ayvazyan, V.; Azima, A.; Baboi, N.; Bähr, J.; Balandin, V.; Beutner, B.; Brandt, A.; Bolzmann, A. Operation of a free-electron laser from the extreme ultraviolet to the water window. Nat. Photonics 2007, 1, 336–342. [Google Scholar] [CrossRef] [Green Version]
  14. Allaria, E.; Appio, R.; Badano, L.; Barletta, W.A.; Bassanese, S.; Biedron, S.G.; Borga, A.; Busetto, E.; Castronovo, D.; Cinquegrana, P.; et al. Highly coherent and stable pulses from the FERMI seeded free-electron laser in the extreme ultraviolet. Nat. Photonics 2012, 6, 699–704. [Google Scholar] [CrossRef]
  15. Allaria, E.; Castronovo, D.; Cinquegrana, P.; Craievich, P.; Dal Forno, M.; Danailov, M.B.; D’Auria, G.; Demidovich, A.; De Ninno, G.; Di Mitri, S.; et al. Two-stage seeded soft-X-ray free-electron laser. Nat. Photonics 2013, 7, 913–918. [Google Scholar] [CrossRef]
  16. Emma, P.; Akre, R.; Arthur, J.; Bionta, R.; Bostedt, C.; Bozek, J.; Brachmann, A.; Bucksbaum, P.; Coffee, R.; Decker, F.-J.; et al. First lasing and operation of an Angstrom-wavelength free-electron laser. Nat. Photonics 2010, 4, 641–647. [Google Scholar] [CrossRef]
  17. Ishikawa, T.; Aoyagi, H.; Asaka, T.; Asano, Y.; Azumi, N.; Bizen, T.; Ego, H.; Fukami, K.; Fukui, T.; Furukawa, Y.; et al. A compact X-ray free-electron laser emitting in the sub-angström region. Nat. Photonics 2012, 6, 540–544. [Google Scholar] [CrossRef]
  18. Haus, H. Noise in free-electron laser amplifier. IEEE J. Quantum Electron. 1981, 17, 1427–1435. [Google Scholar] [CrossRef]
  19. Xie, M. Design optimization for an X-Ray Free Electron Laser driven by SLAC linac. In Proceedings of the Particle Accelerator Conference, Dallas, TX, USA, 1–5 May 1995.
  20. Colson, W. The nonlinear wave equation for higher harmonics in free-electron lasers. IEEE J. Quantum Electron. 1981, 17, 1417–1427. [Google Scholar] [CrossRef]
  21. Bonifacio, R.; Pellegrini, C.; Narducci, L. Collective instabilities and high-gain regime in a free electron laser. Opt. Commun. 1984, 50, 373–378. [Google Scholar] [CrossRef]
  22. Bonifacio, R.; Casagrande, F.; Cerchioni, G.; Souza, L.D.; Pierini, P.; Piovella, N. Physics of the high-gain FEL and superradiance. Riv. Nuovo Cimento 1990, 13, 1–69. [Google Scholar] [CrossRef]
  23. Vinokurov, N.A. Multisegment wigglers for short wavelength FEL. Nucl. Instrum. Meth. A 1996, 375, 264–268. [Google Scholar] [CrossRef]
  24. Hahn, S.J.; Pae, K.H. A High-Gain Klystron FEL Based on Self-Amplied Spontaneous Emission. J. Korean Phys. Soc. 1997, 31, 856–861. [Google Scholar]
  25. Kim, K.J. Undulator interruption in high-gain free-electron lasers. Nucl. Instrum. Meth. A 1998, 407, 126–129. [Google Scholar] [CrossRef]
  26. Neil, G.R.; Freund, H.P. Dispersively enhanced bunching in high-gain free-electron lasers. Nucl. Instrum. Meth. A 2001, 475, 381–384. [Google Scholar] [CrossRef]
  27. Saldin, E.L.; Schneidmiller, E.A.; Yurkov, M.V. The Free Electron Laser Klystron Amplifier Concept. arXiv 2003. [Google Scholar]
  28. Ding, Y.; Emma, P.; Huang, Z.; Kumar, V. Optical klystron enhancement to self-amplified spontaneous emission free electron lasers. Phys. Rev. ST Accel. Beams 2006, 9, 070702. [Google Scholar] [CrossRef]
  29. Penco, G.; Allaria, E.; De Ninno, G.; Ferrari, E.; Giannessi, L. Experimental Demonstration of Enhanced Self-Amplified Spontaneous Emission by an Optical Klystron. Phys. Rev. Lett. 2015, 114, 013901. [Google Scholar] [CrossRef] [PubMed]
  30. Yu, L.H. Generation of intense uv radiation by subharmonically seeded single-pass free-electron lasers. Phys. Rev. A 1991, 44, 5178. [Google Scholar] [CrossRef] [PubMed]
  31. Andrews, K.W. A table of maxima and minima of the Bessel function Jn(z) for n = 0 to n = 30. Acta Cryst. A 1981, 37, 765–766. [Google Scholar] [CrossRef]
  32. Sasaki, S.; Miyata, K.; Takada, T. A new undulator for generating variably polarized radiation. Jpn. J. Appl. Phys. 1992, 31, L1794–L1796. [Google Scholar] [CrossRef]
  33. Allaria, E.; Battistoni, A.; Bencivenga, F.; Borghes, R.; Callegari, C.; Capotondi, F.; Castronovo, D.; Cinquegrana, P.; Cocco, D.; Coreno, M.; et al. Tunability experiments at the FERMI@ Elettra free-electron laser. New J. Phys. 2012, 14, 113009. [Google Scholar] [CrossRef]
  34. Saldin, E.L.; Schneidmiller, E.A.; Yurkov, M.V. Longitudinal space charge-driven microbunching instability in the TESLA Test Facility linac. Nucl. Instrum. Meth. A 2004, 528, 355–359. [Google Scholar] [CrossRef]
  35. Huang, Z.; Borland, M.; Emma, P.; Wu, J.; Limborg, C.; Stupakov, G.; Welch, J. Suppression of microbunching instability in the linac coherent light source. Phys. Rev. Spec. Top. Accel. Beams 2004, 7, 074401. [Google Scholar] [CrossRef]
  36. Penco, G.; Allaria, E.; Badano, L.; Cinquegrana, P.; Craievich, P.; Danailov, M.B.; Demidovich, A.; Ivanov, R.; Lutman, A.A.; Rumiz, L.; et al. Optimization of a high brightness photoinjector for a seeded FEL facility. J. Instrum. 2013, 8, P05015. [Google Scholar] [CrossRef]
  37. Spampinati, S.; Allaria, E.; Badano, L.; Bassanese, S.; Biedron, S.; Castronovo, D.; Craievich, P.; Danailov, M.B.; Demidovich, A.; De Ninno, G.; et al. Laser heater commissioning at an externally seeded free-electron laser. Phys. Rev. ST Accel. Beams 2014, 17, 120705. [Google Scholar] [CrossRef]
  38. Spampinati, S.; De Ninno, G.; Allaria, E.; Castronovo, D.; Danailov, M.B.; Demidovich, A.; Di Mitri, S.; Diviacco, B.; Fawley, W.M.; Fröhlich, L.; et al. Progress with the FERMI laser heater commissioning. In Proceedings of the 2013 FEL Conference, Manhattan, NY, USA, 26–30 August 2013.
  39. Zangrando, M.; Cudin, I.; Fava, C.; Gerusina, S.; Gobessi, R.; Rumiz, L.; Svetina, C.; Parmigiani, F.; Cocco, D. First Results from the Commissioning of the FERMI@Elettra Free Electron Laser by means of the Photon Analysis Delivery and Reduction System (PADReS). In Advances in X-ray Free-Electron Lasers: Radiation Schemes, X-ray Optics, and Instrumentation; Tschentscher, T., Cocco, D., Eds.; SPIE: Prague, Czech Republic, 2011; Volume 8078, p. 80780I. [Google Scholar]
  40. Ferrari, E.; Allaria, E.; Fawley, W.; Giannessi, L.; Huang, Z.; Penco, G.; Spampinati, S. Impact of Non-Gaussian Electron Energy Heating upon the Performance of a Seeded Free-Electron Laser. Phys. Rev. Lett. 2014, 112, 114802. [Google Scholar] [CrossRef] [PubMed]
  41. Reiche, S. GENESIS 1.3: A fully 3D time-dependent FEL simulation code. Nucl. Instrum. Meth. A 1999, 429, 243–248. [Google Scholar] [CrossRef]
Figure 1. Bunching factor (in black) at the first harmonic vs. the R 56 of the dispersive section for an energy modulation of 10 keV (a) and 200 keV (b). The maximum bunching is obtained, respectively, for R 56 = 23 . 3 μ m and R 56 = 10 . 2 μ m, while the condition σ δ k r R 56 1 would imply R 56 = 23 . 9 μ m. Beam energy = 1.5 GeV, σ δ = 3 . 3 × 10 5 , λ r = 5 nm.
Photonics 04 00015 g001
Figure 2. Bunching factor b 1 vs. the R 56 for different energy modulation induced in the undulator before the dispersive section: the larger the energy modulation, the lower the R 56 value that maximizes the bunching. The vertical dot line corresponds to the R 56 satisfying the relationship σ δ k r R 56 = 1 . Beam energy = 1.5 GeV, σ δ = 3 . 3 × 10 5 , λ r = 5 nm.
Photonics 04 00015 g002
Figure 3. Free electron laser (FEL) pulse energy in the optical klystron (OK) regime at 43 nm versus R 56 for different laser heater energy [29]: 0.8 μ J (red squares), 2.1 μ J (gray triangles), 3.7 μ J (blue diamonds) and 0 μ J, i.e., off (black circles). Each data point is the average pulse energy over 20 FEL shots with an error bar corresponding to the standard deviation. Solid lines correspond to the theoretical gain factor G calculated in each case by using Equation (4). The dashed line refers to the hypothetical case of a cold beam, taking the case of laser heater off for the slice energy spread and the case of a laser heater energy of 0.8 μ J to have the FEL pulse energy at R 56 = 0 , i.e., no microbunching instability. Electron beam energy: 1.058 GeV, peak current: 700 A.
Photonics 04 00015 g003
Figure 4. Simulated FEL power gain curve at 32.4 nm for the OK (red) and the “pure” self-amplified spontaneous emission (SASE) mode (blue) as a function of the position along the undulator’s chain. The starting point (z = 0) corresponds to the exit of the dispersive section. The FEL power does not increase in correspondence of the 1.3 m-long intra-undulator sections. The dispersive section R 56 = 78 μ m and ρ = 1 . 3 × 10 3 .
Photonics 04 00015 g004
Figure 5. FERMI FEL-2 layout, including the modulator and radiators of the first stage (M1 and R1) and those ones of the second stage (M2 and R2), the dispersive sections of the first (DS1) and second stage (DS2) and the delay-line (DL) that is used for the HGHG fresh bunch technique. For more details concerning the undulator characteristics, we refer to [15].
Photonics 04 00015 g005
Figure 6. GENESIS simulation of the pure SASE (red dotted line) and of the two-stage OK scheme (blue line) for λ r = 5 . 3 nm. The position of DL, DS2 and the last undulator of R2 are highlighted by the vertical gray dotted line.
Photonics 04 00015 g006
Figure 7. FEL energy per pulse vs. the R 56 of the DL (a) and DS2 (b) operating alone, i.e., in single-stage OK mode; (c) scan of the R 56 of DS2 with the DL optimized, i.e., applying the distributed optical klystron mode. Beam energy: 1.525 GeV, peak current: 700 A. Each data point is the average pulse energy over 20 FEL shots with an error bar corresponding to the standard deviation. The experimental data are fitted with a 8th-degree polynomial function (blue solid line) used to obtained the value of R 56 o p t .
Photonics 04 00015 g007
Figure 8. FEL gain curve at 5.3 nm in the two-stage OK mode measured by progressively detuning the undulators of R2.
Photonics 04 00015 g008
Figure 9. (a) single-stage OK obtained by scanning the R 56 of the DL with the M1 completely detuned, DS1 and DS2 set straight; (b) optimized DL ( R 56 , D L = 7 . 5 μ m) and double-stage OK obtained by scanning R 56 , D S 2 ; (c) three-stage OK: FEL energy per pulse as a function of DS2 R 56 with M1 set to be resonant at 66 nm, DS1 activated ( R 56 , D S 1 = 110 μ m), and optimized DL ( R 56 , D L = 7 . 5 μ m); (d) three-stage OK: FEL energy per pulse as a function of R 56 , D S 1 , after optimizing DL ( R 56 , D L = 7 . 5 μ m) and DS2 ( R 56 , D S 2 = 6 . 1 μ m). Beam energy = 1.46 GeV, peak current: 700 A. Each data point is the average pulse energy over 20 FEL shots with an error bar corresponding to the standard deviation. The experimental data are fitted with a 8th-degree polynomial function (blue solid line) used to obtaining the value of R 56 o p t .
Photonics 04 00015 g009
Table 1. Relative slice energy spread σ δ calculated from the condition σ δ k r R 56 = 1 for different laser heater configurations. Free electron laser (FEL) in optical klystron at 43 nm.
Laser Heater Energy (μJ)σδ R 56 opt
0 6 . 8 × 10 5 100 ± 7
0.8 8 . 1 × 10 5 84 ± 5
2.1 1 . 0 × 10 4 67 ± 4
3.7 1 . 3 × 10 4 54 ± 3

