
Impacts of Forest Fires and Climate Variability on the Hydrology of an Alpine Medium Sized Catchment in the Canadian Rocky Mountains

Abstract
:1. Introduction
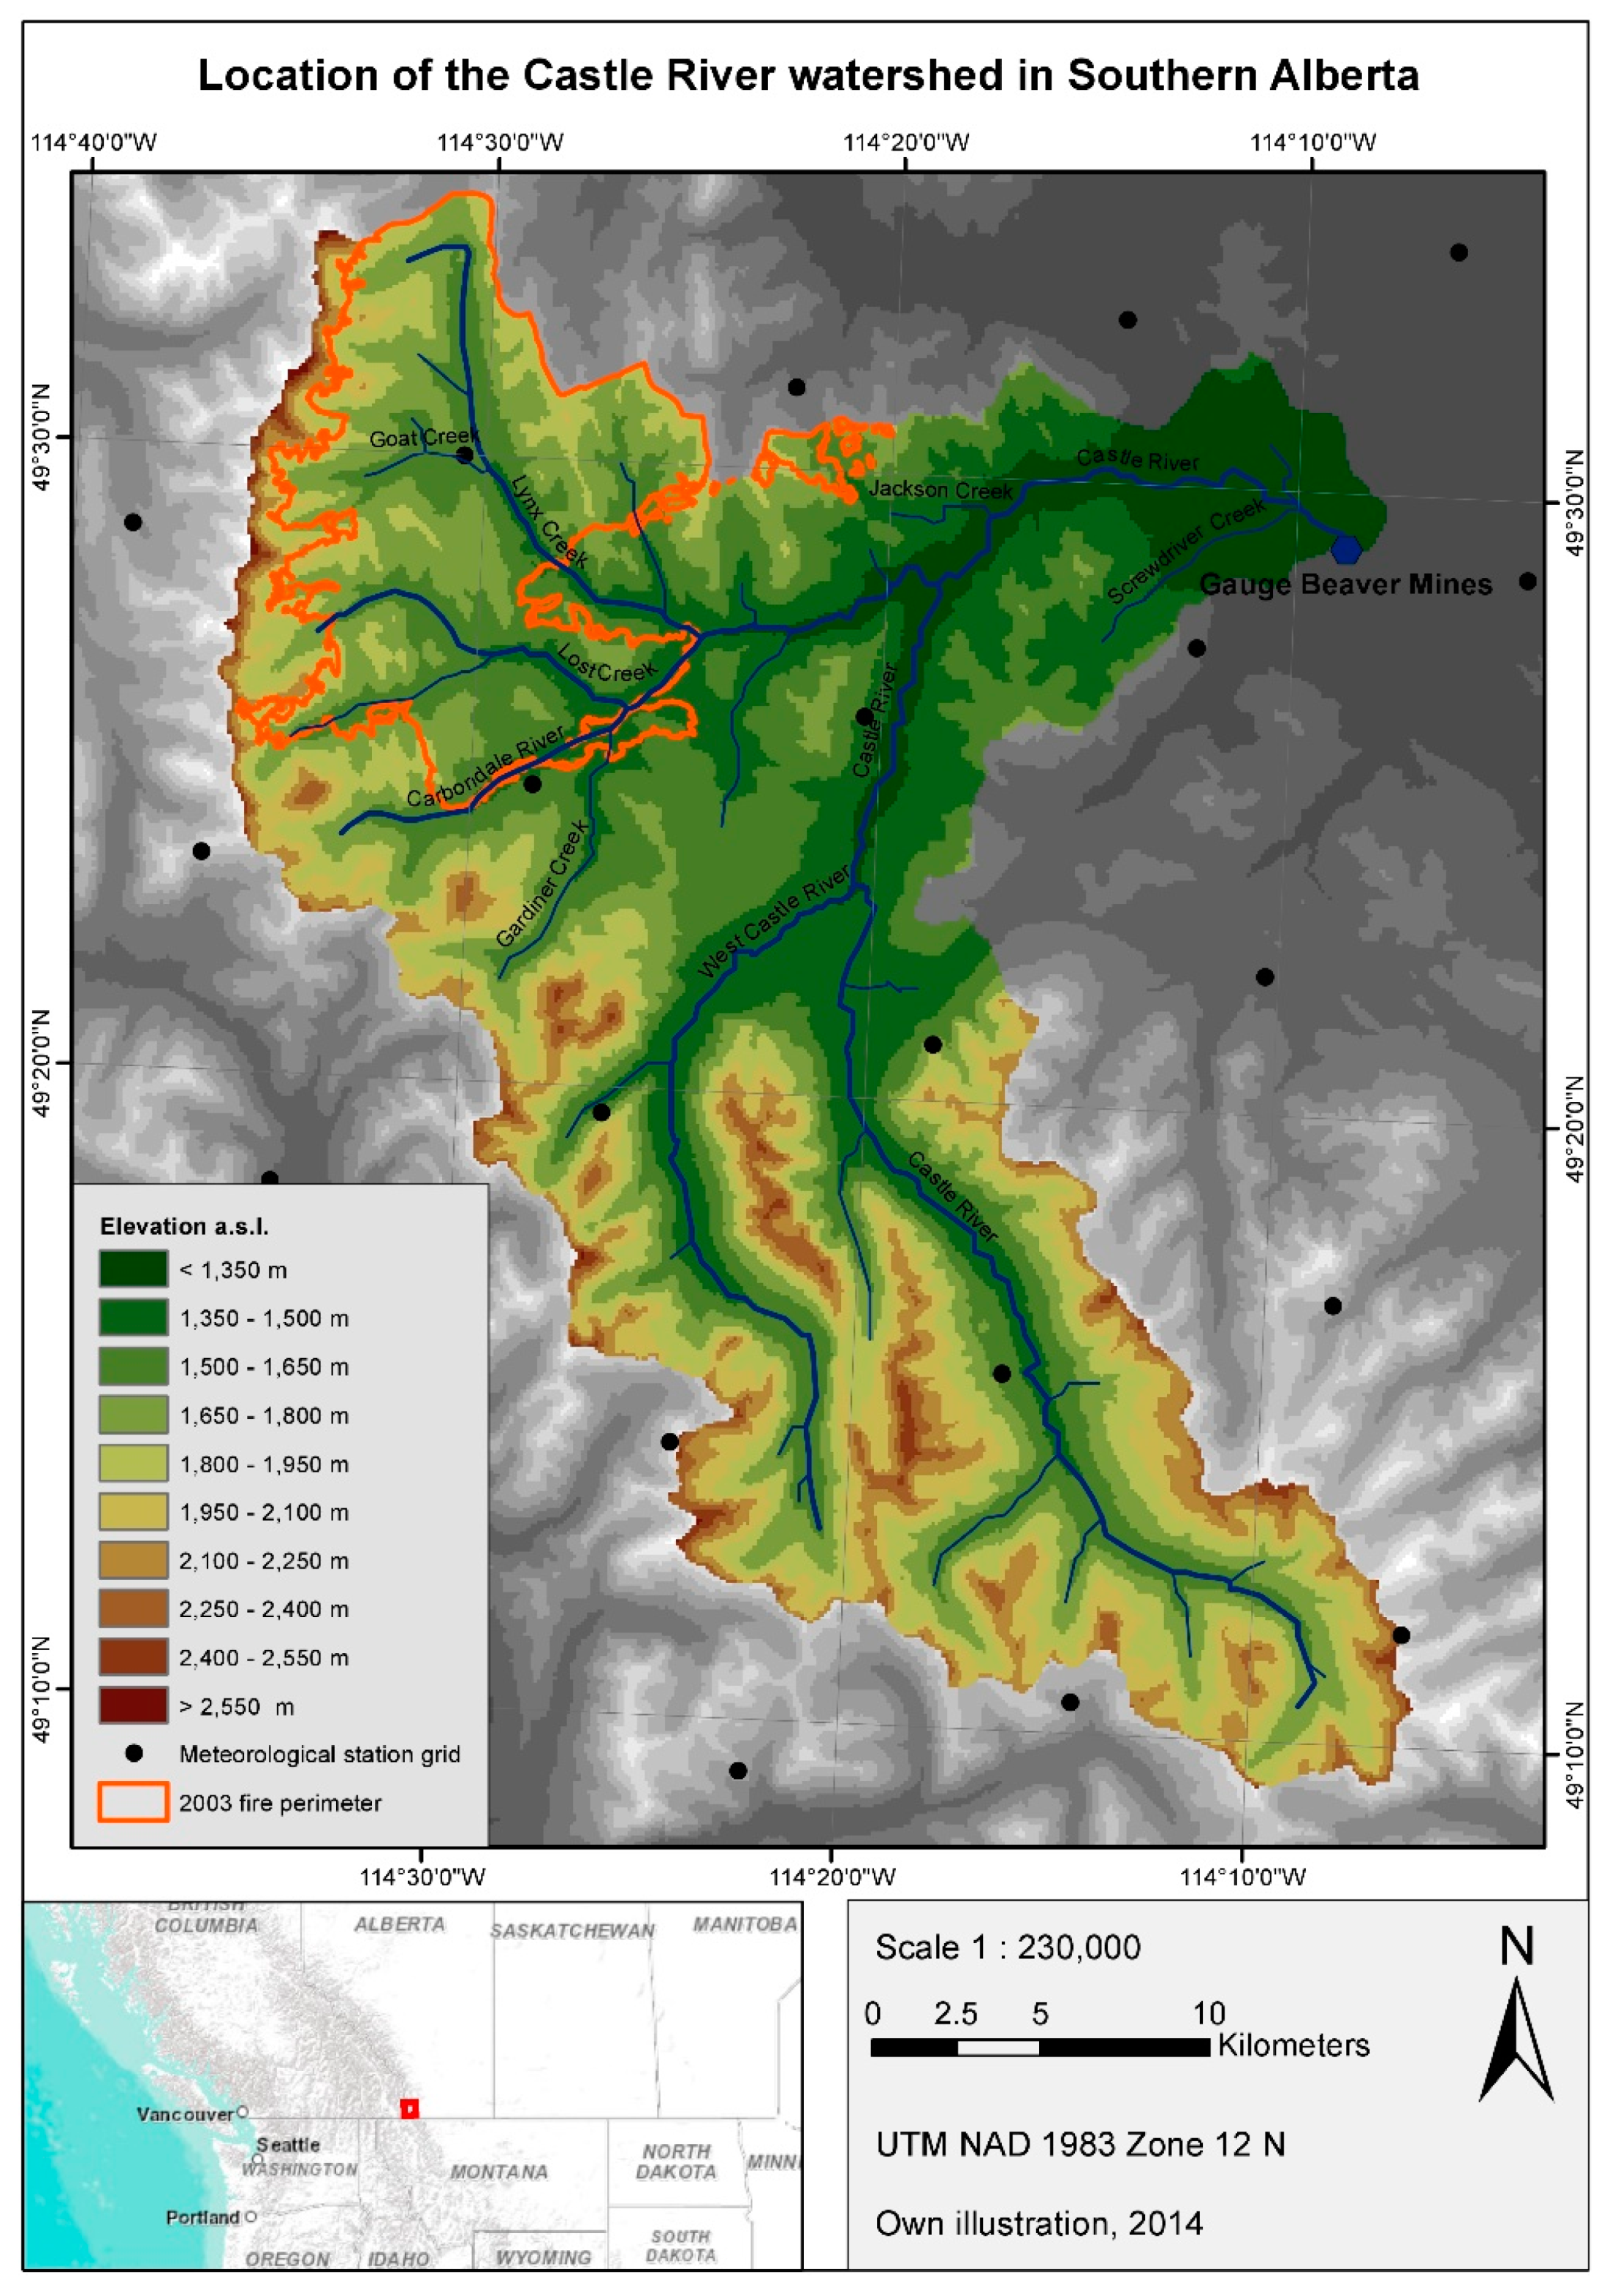
2. Study Area

3. Data and Methods
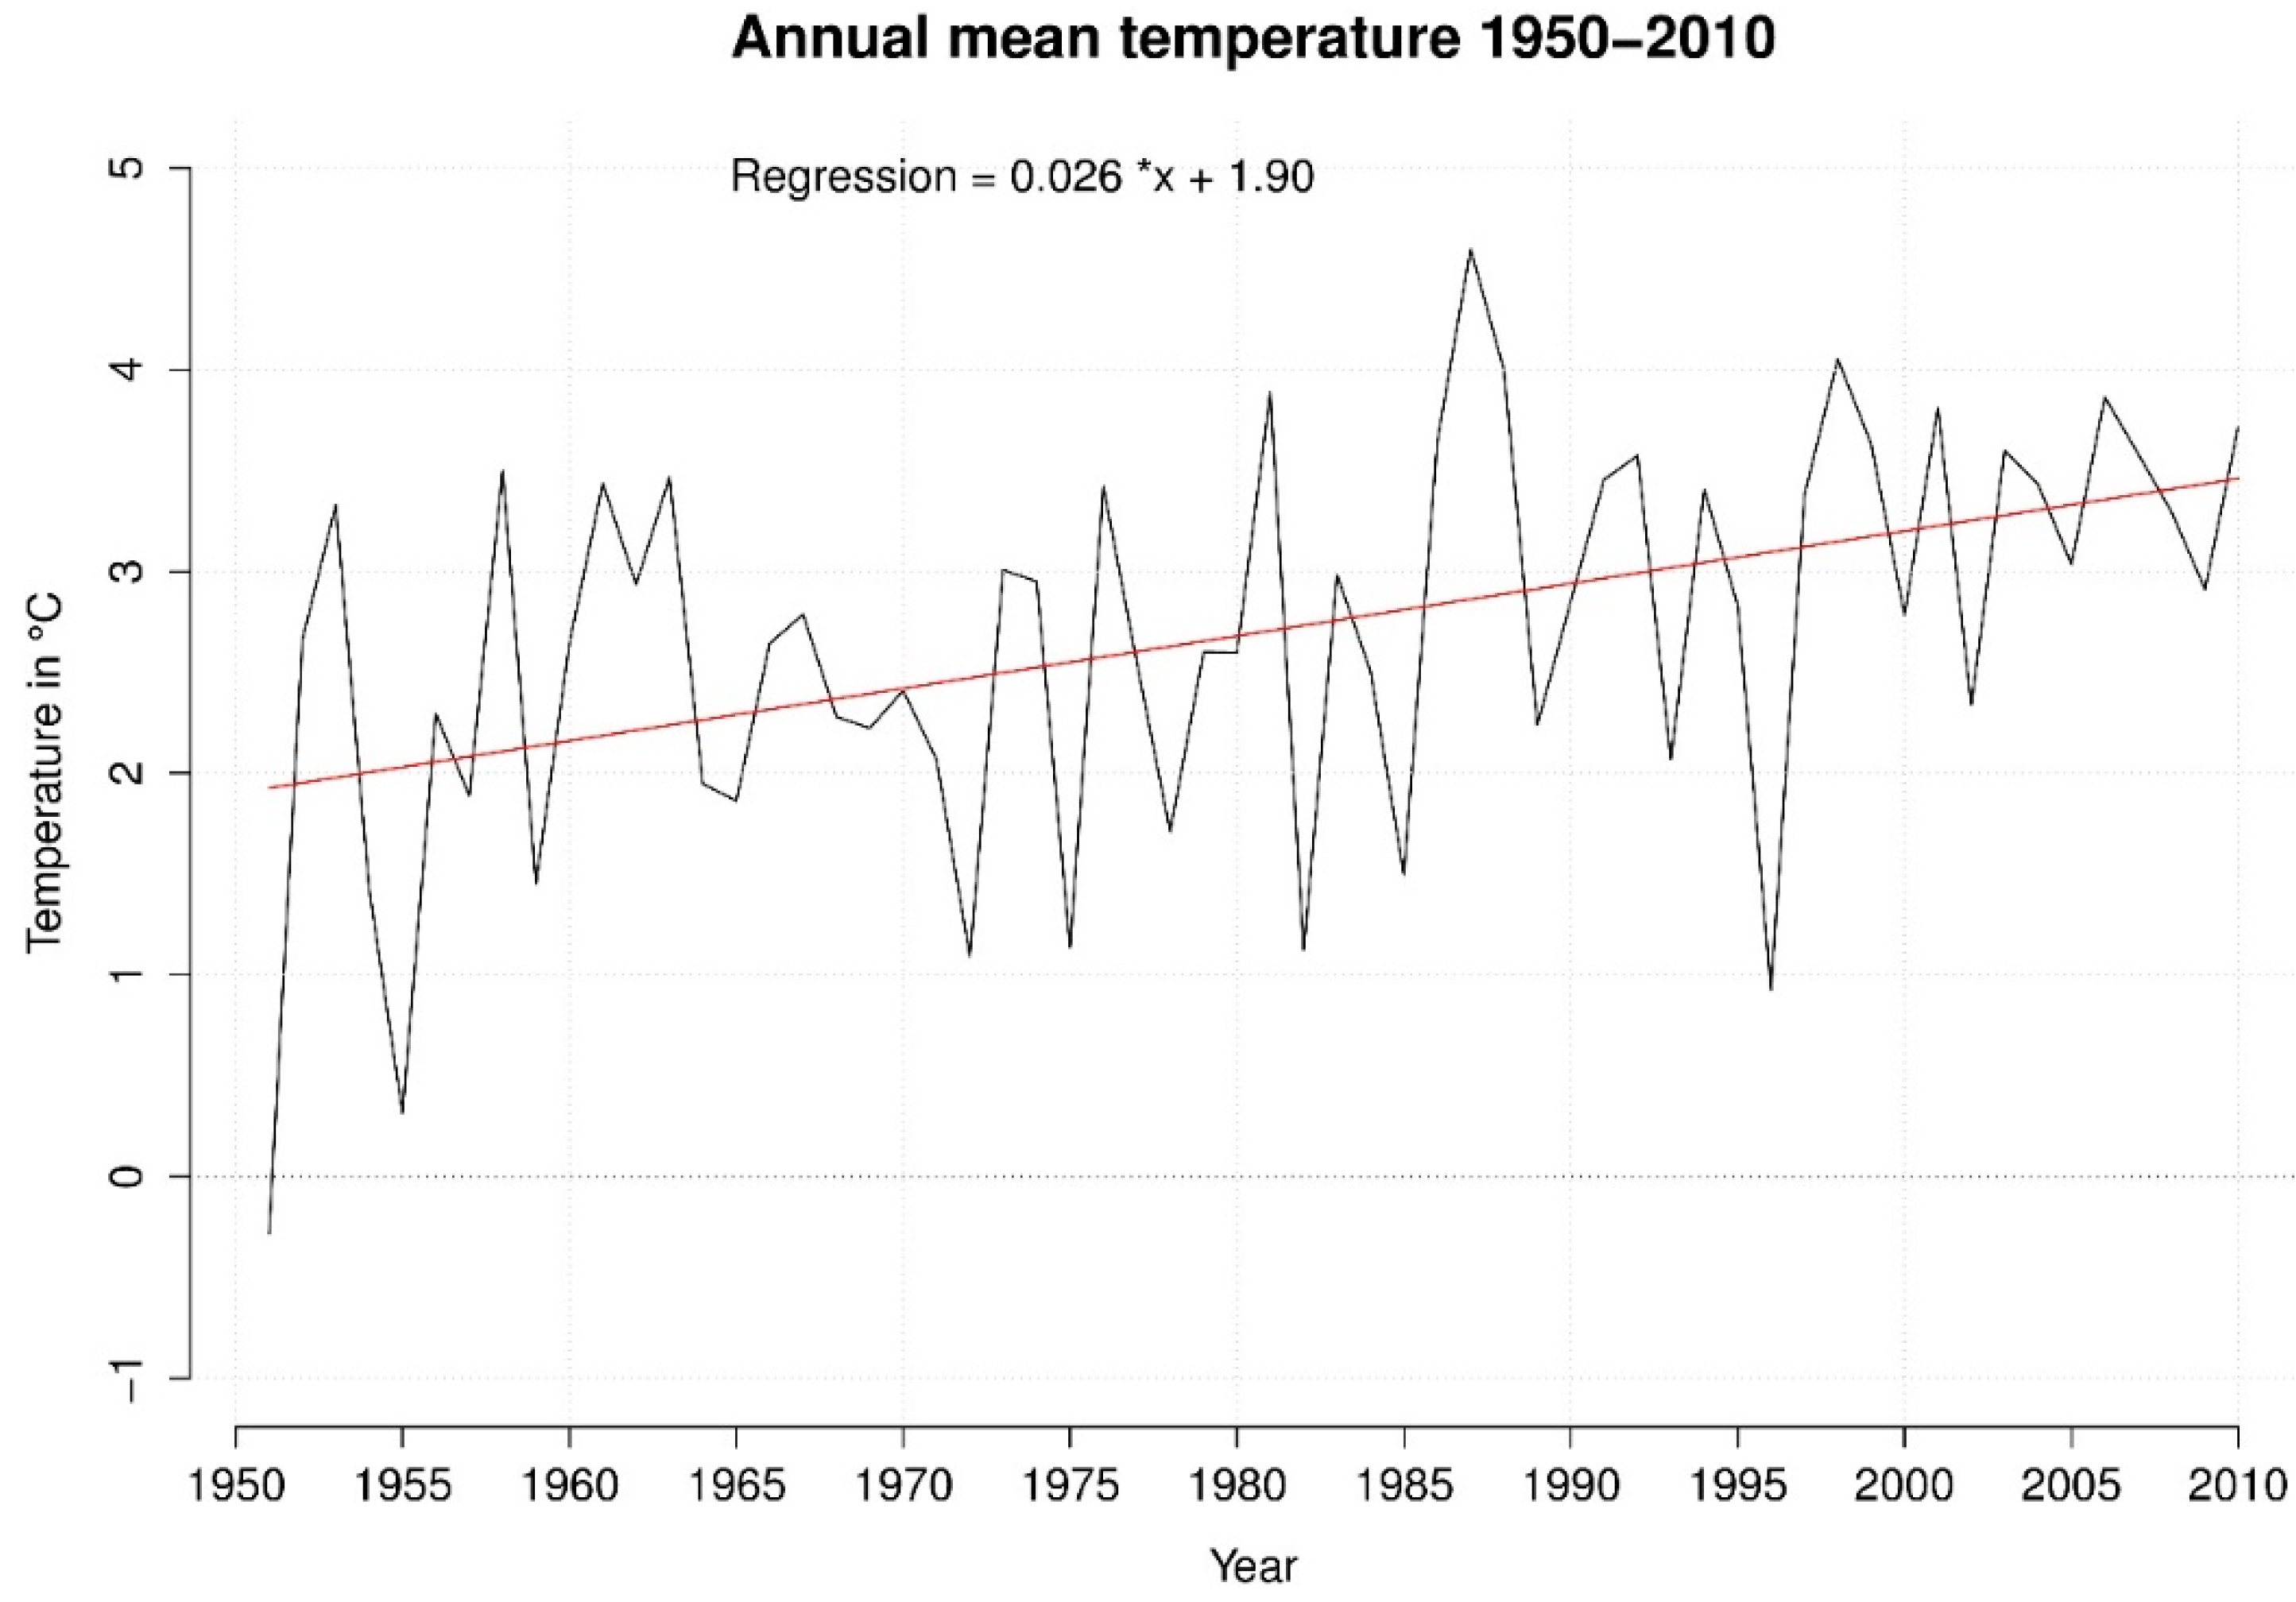
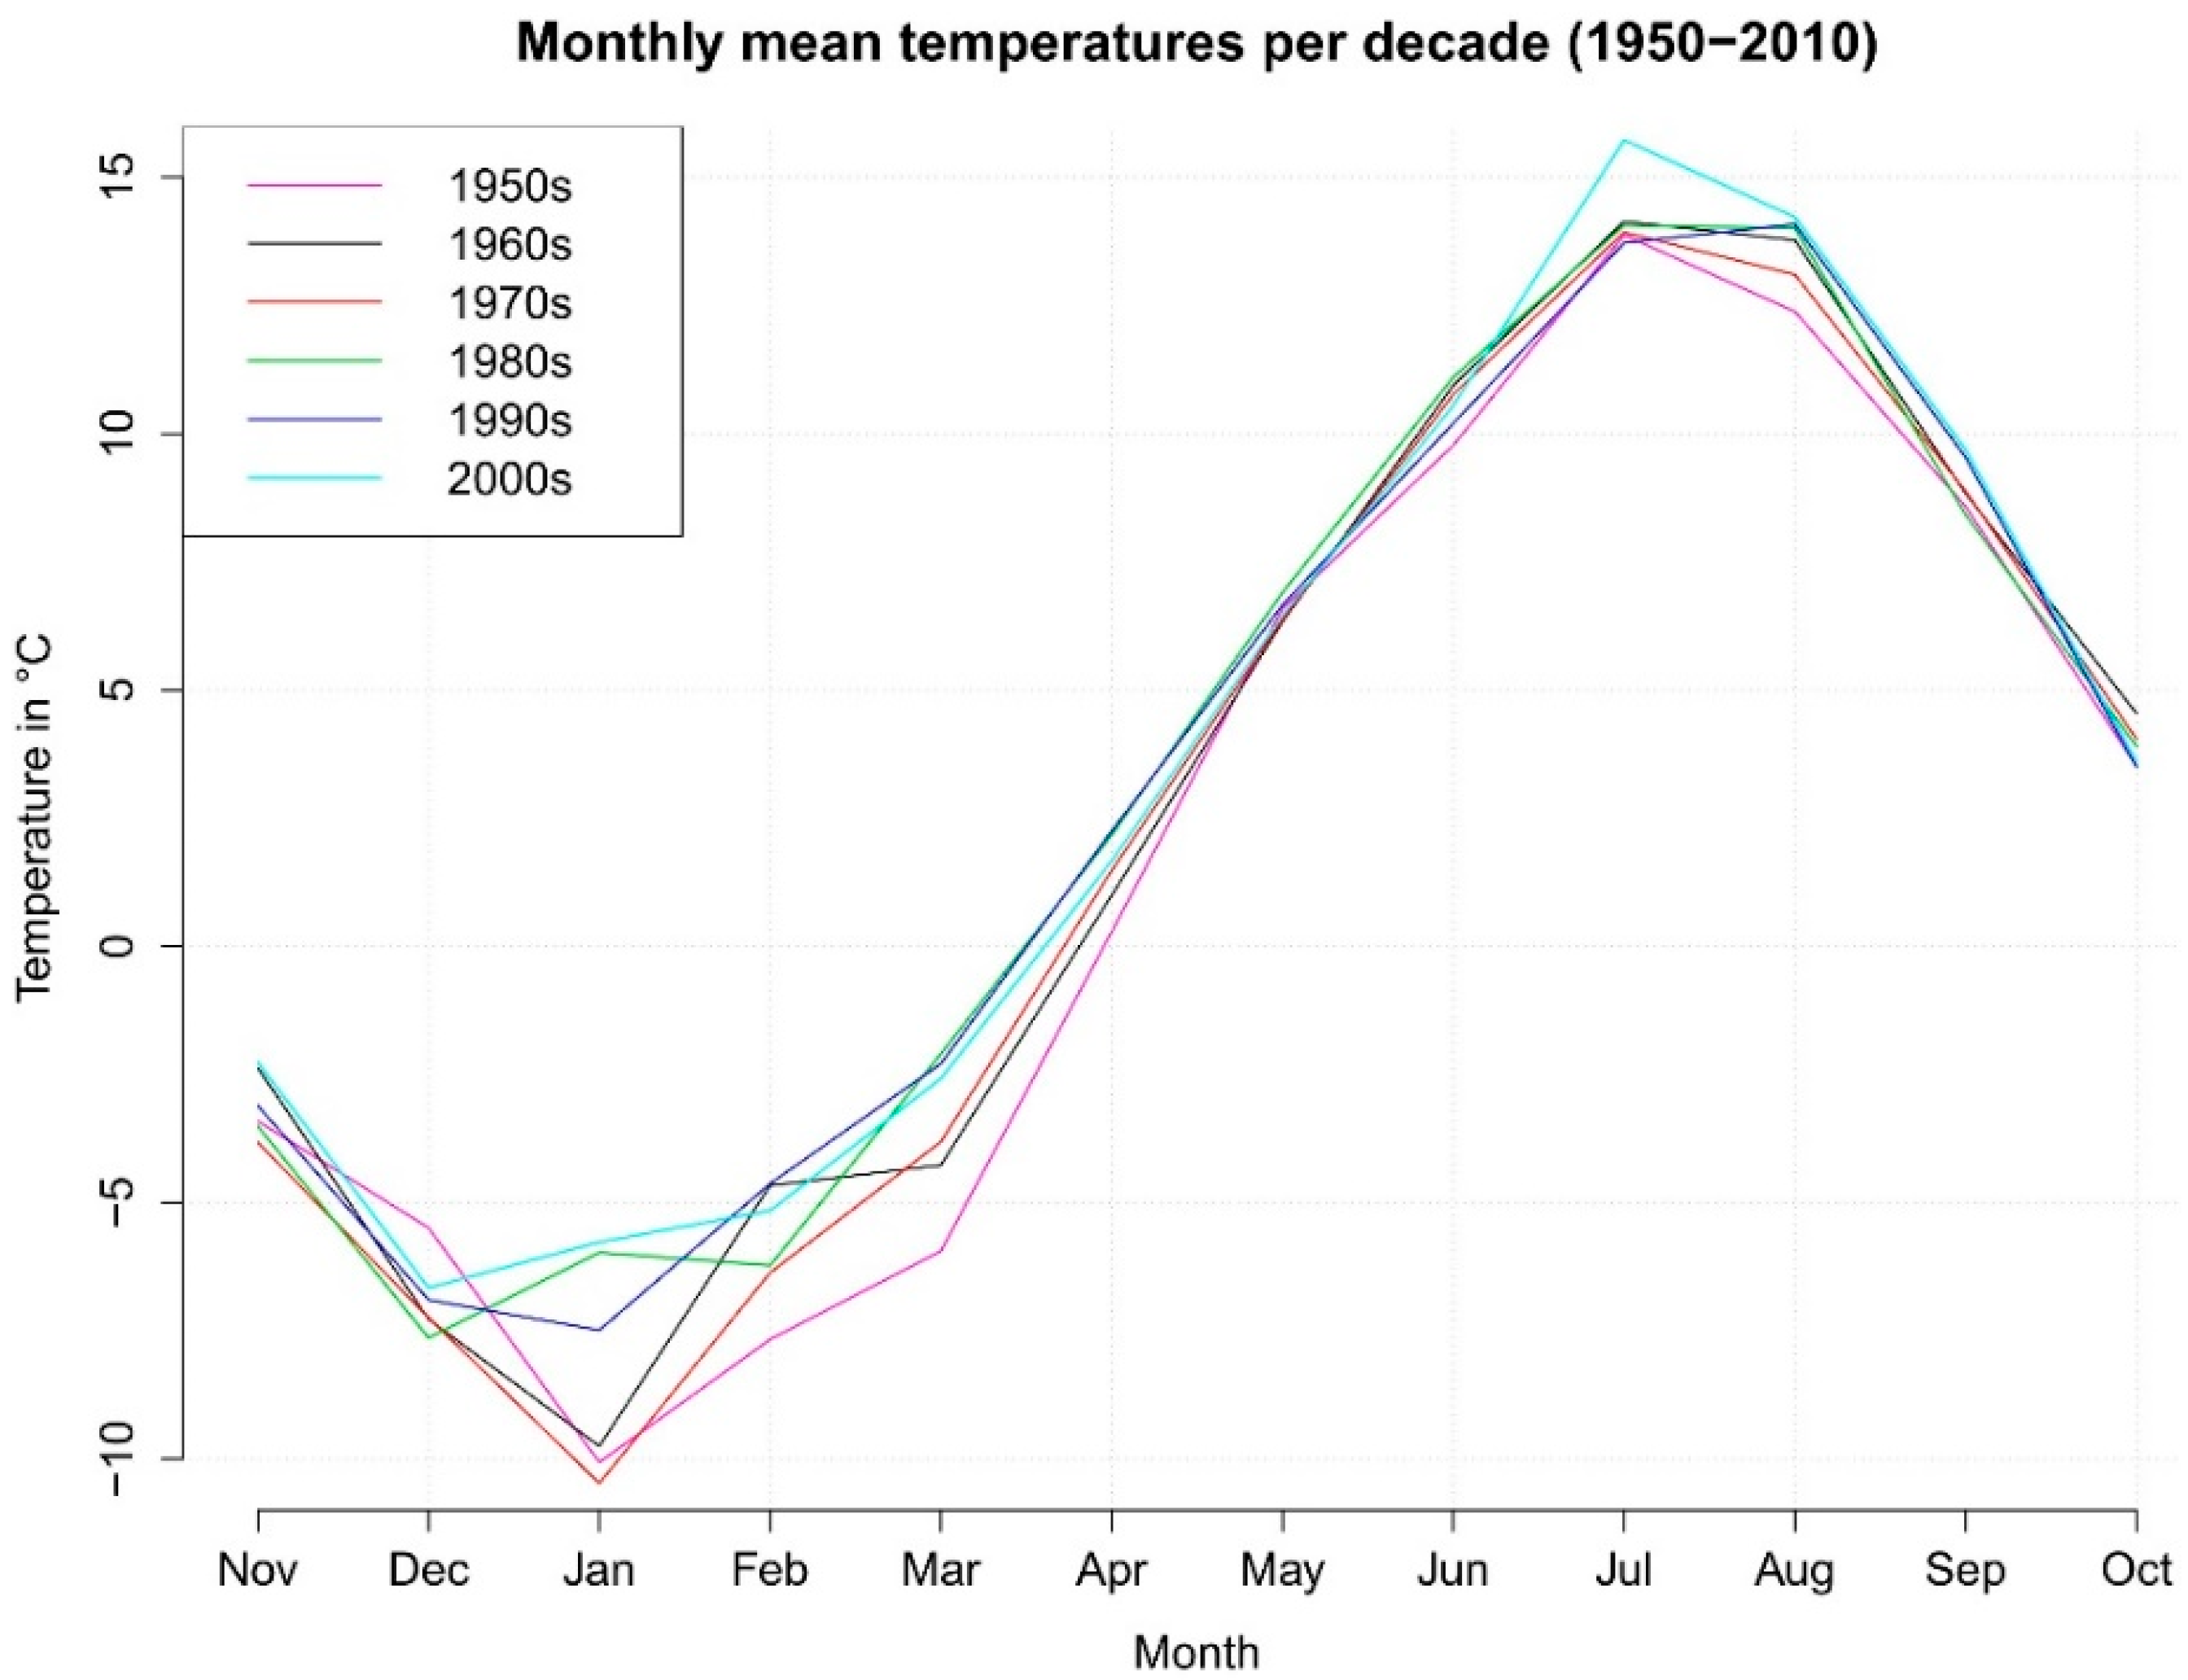
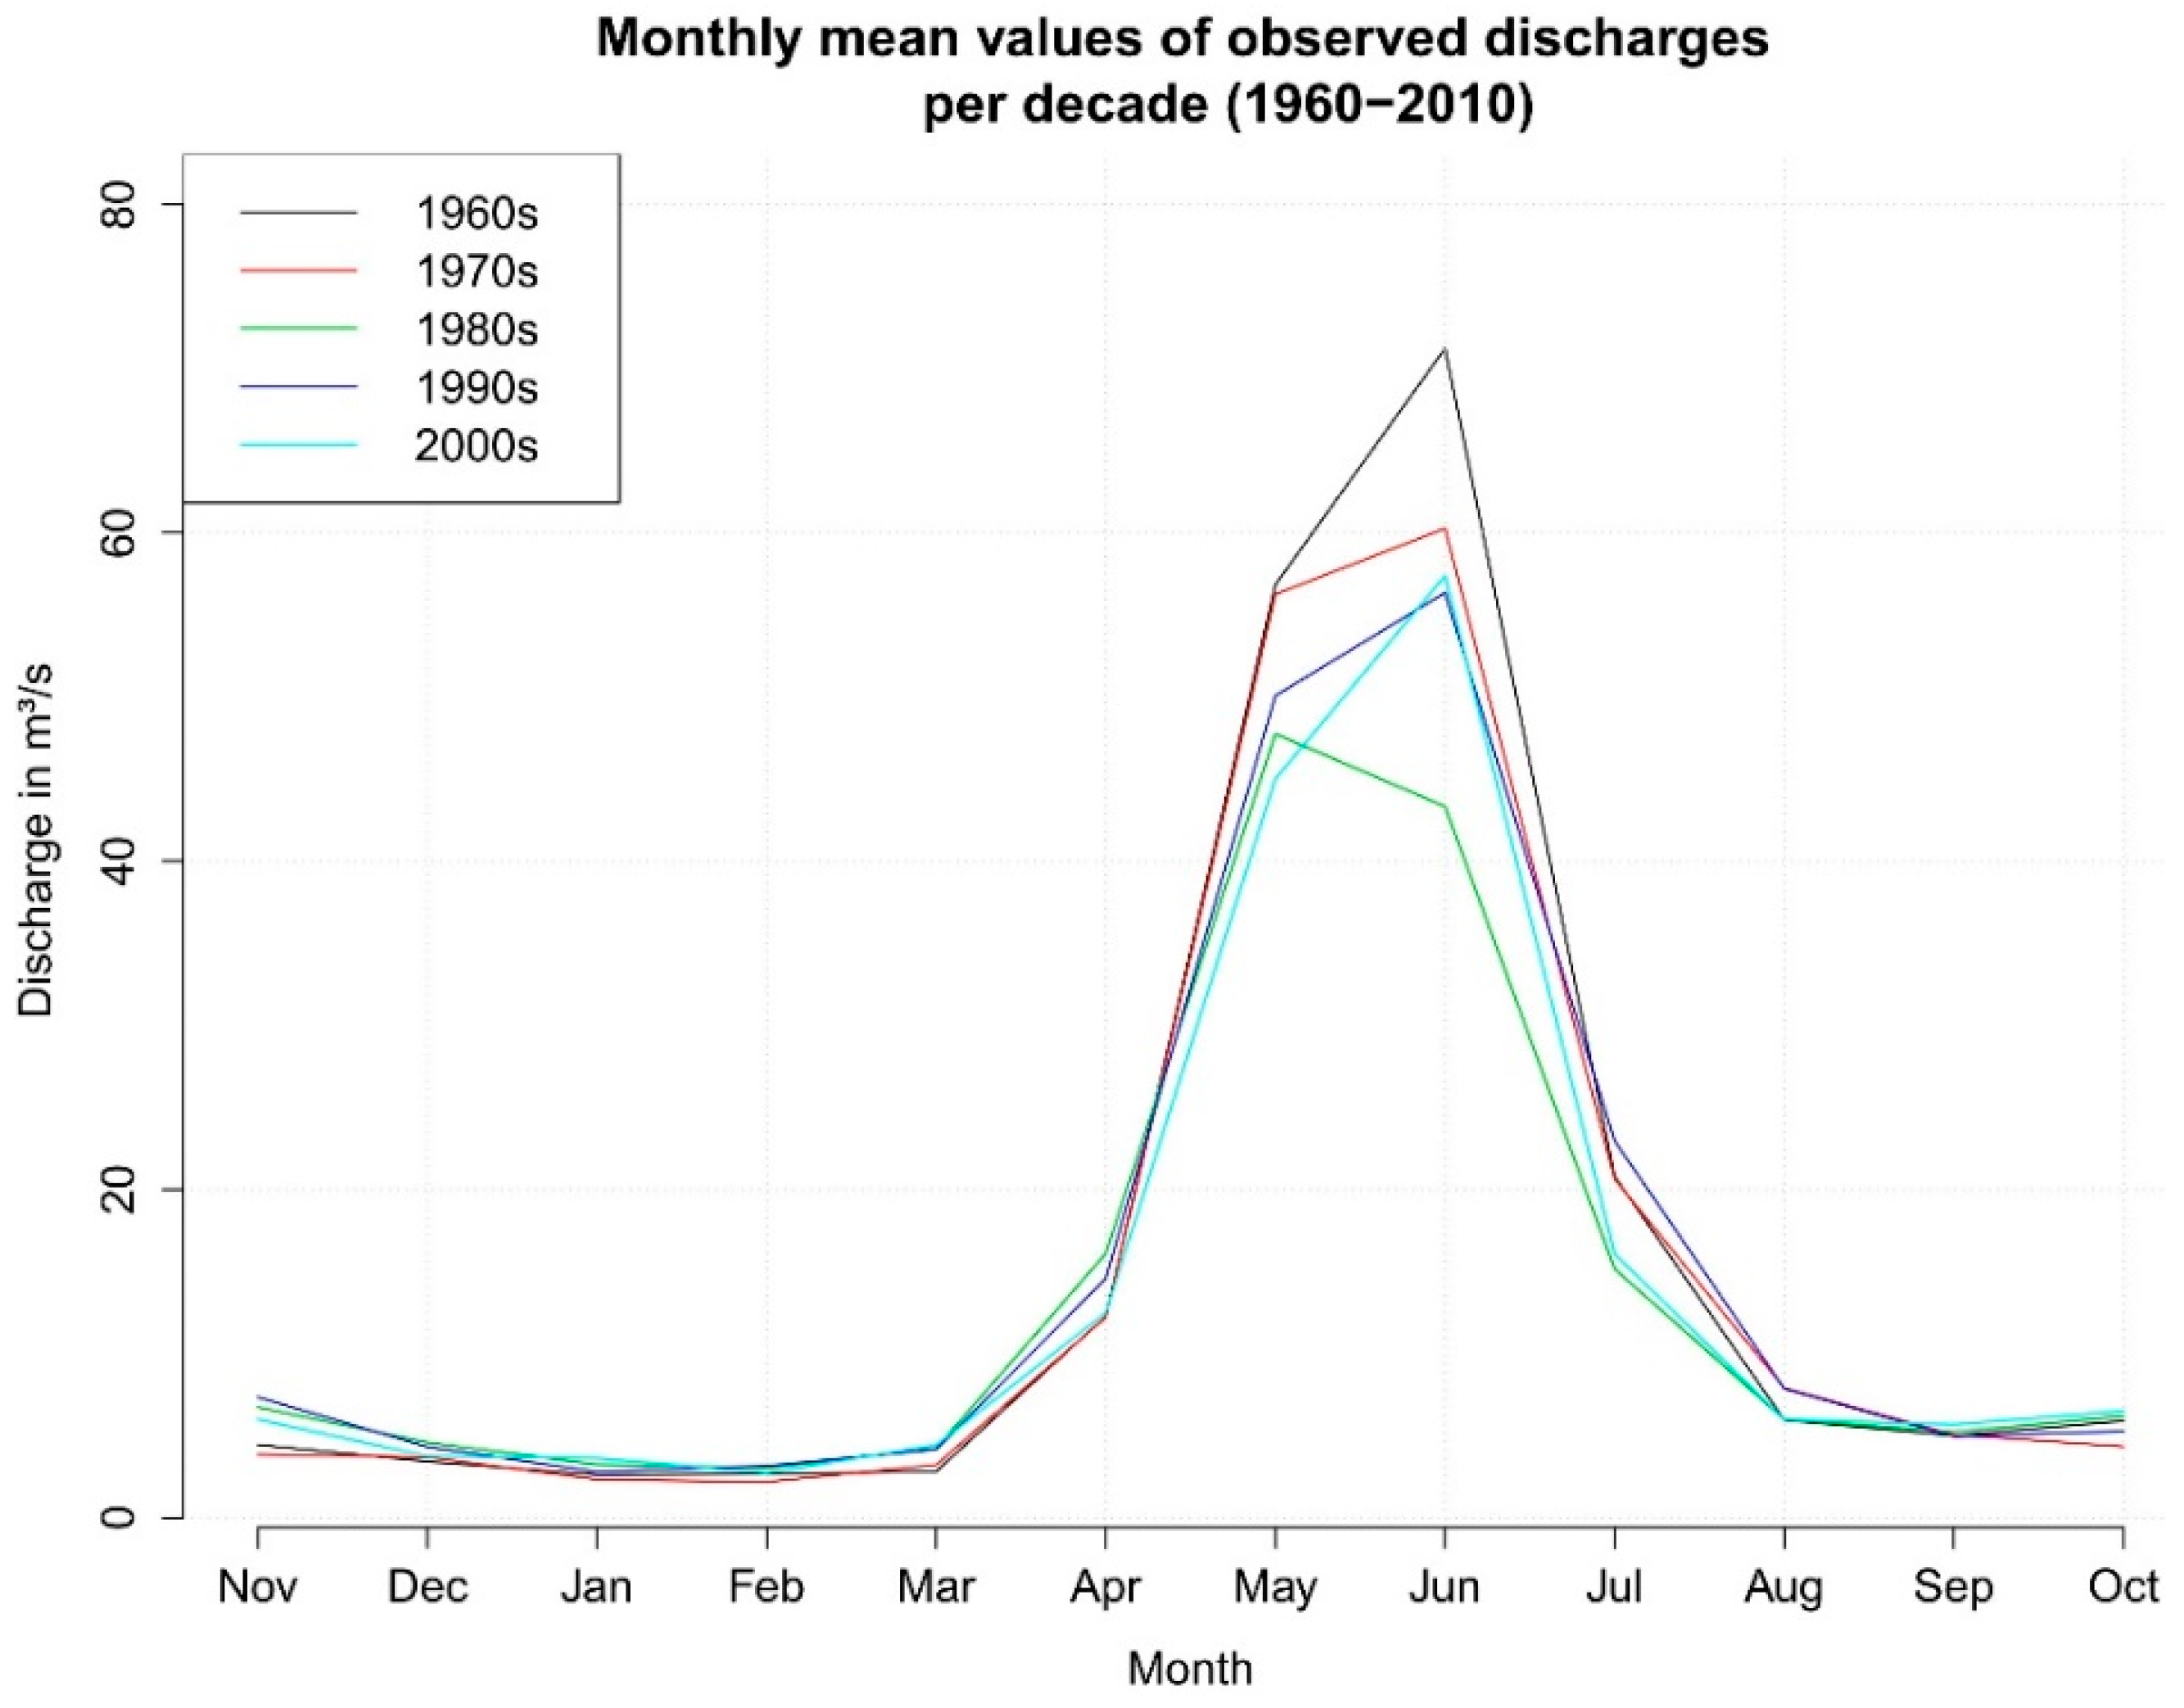
3.1. Climate and Streamflow Observations and Trends
3.2. Hydrological Modeling with WaSiM ETH
3.2.1. WaSiM Input Data
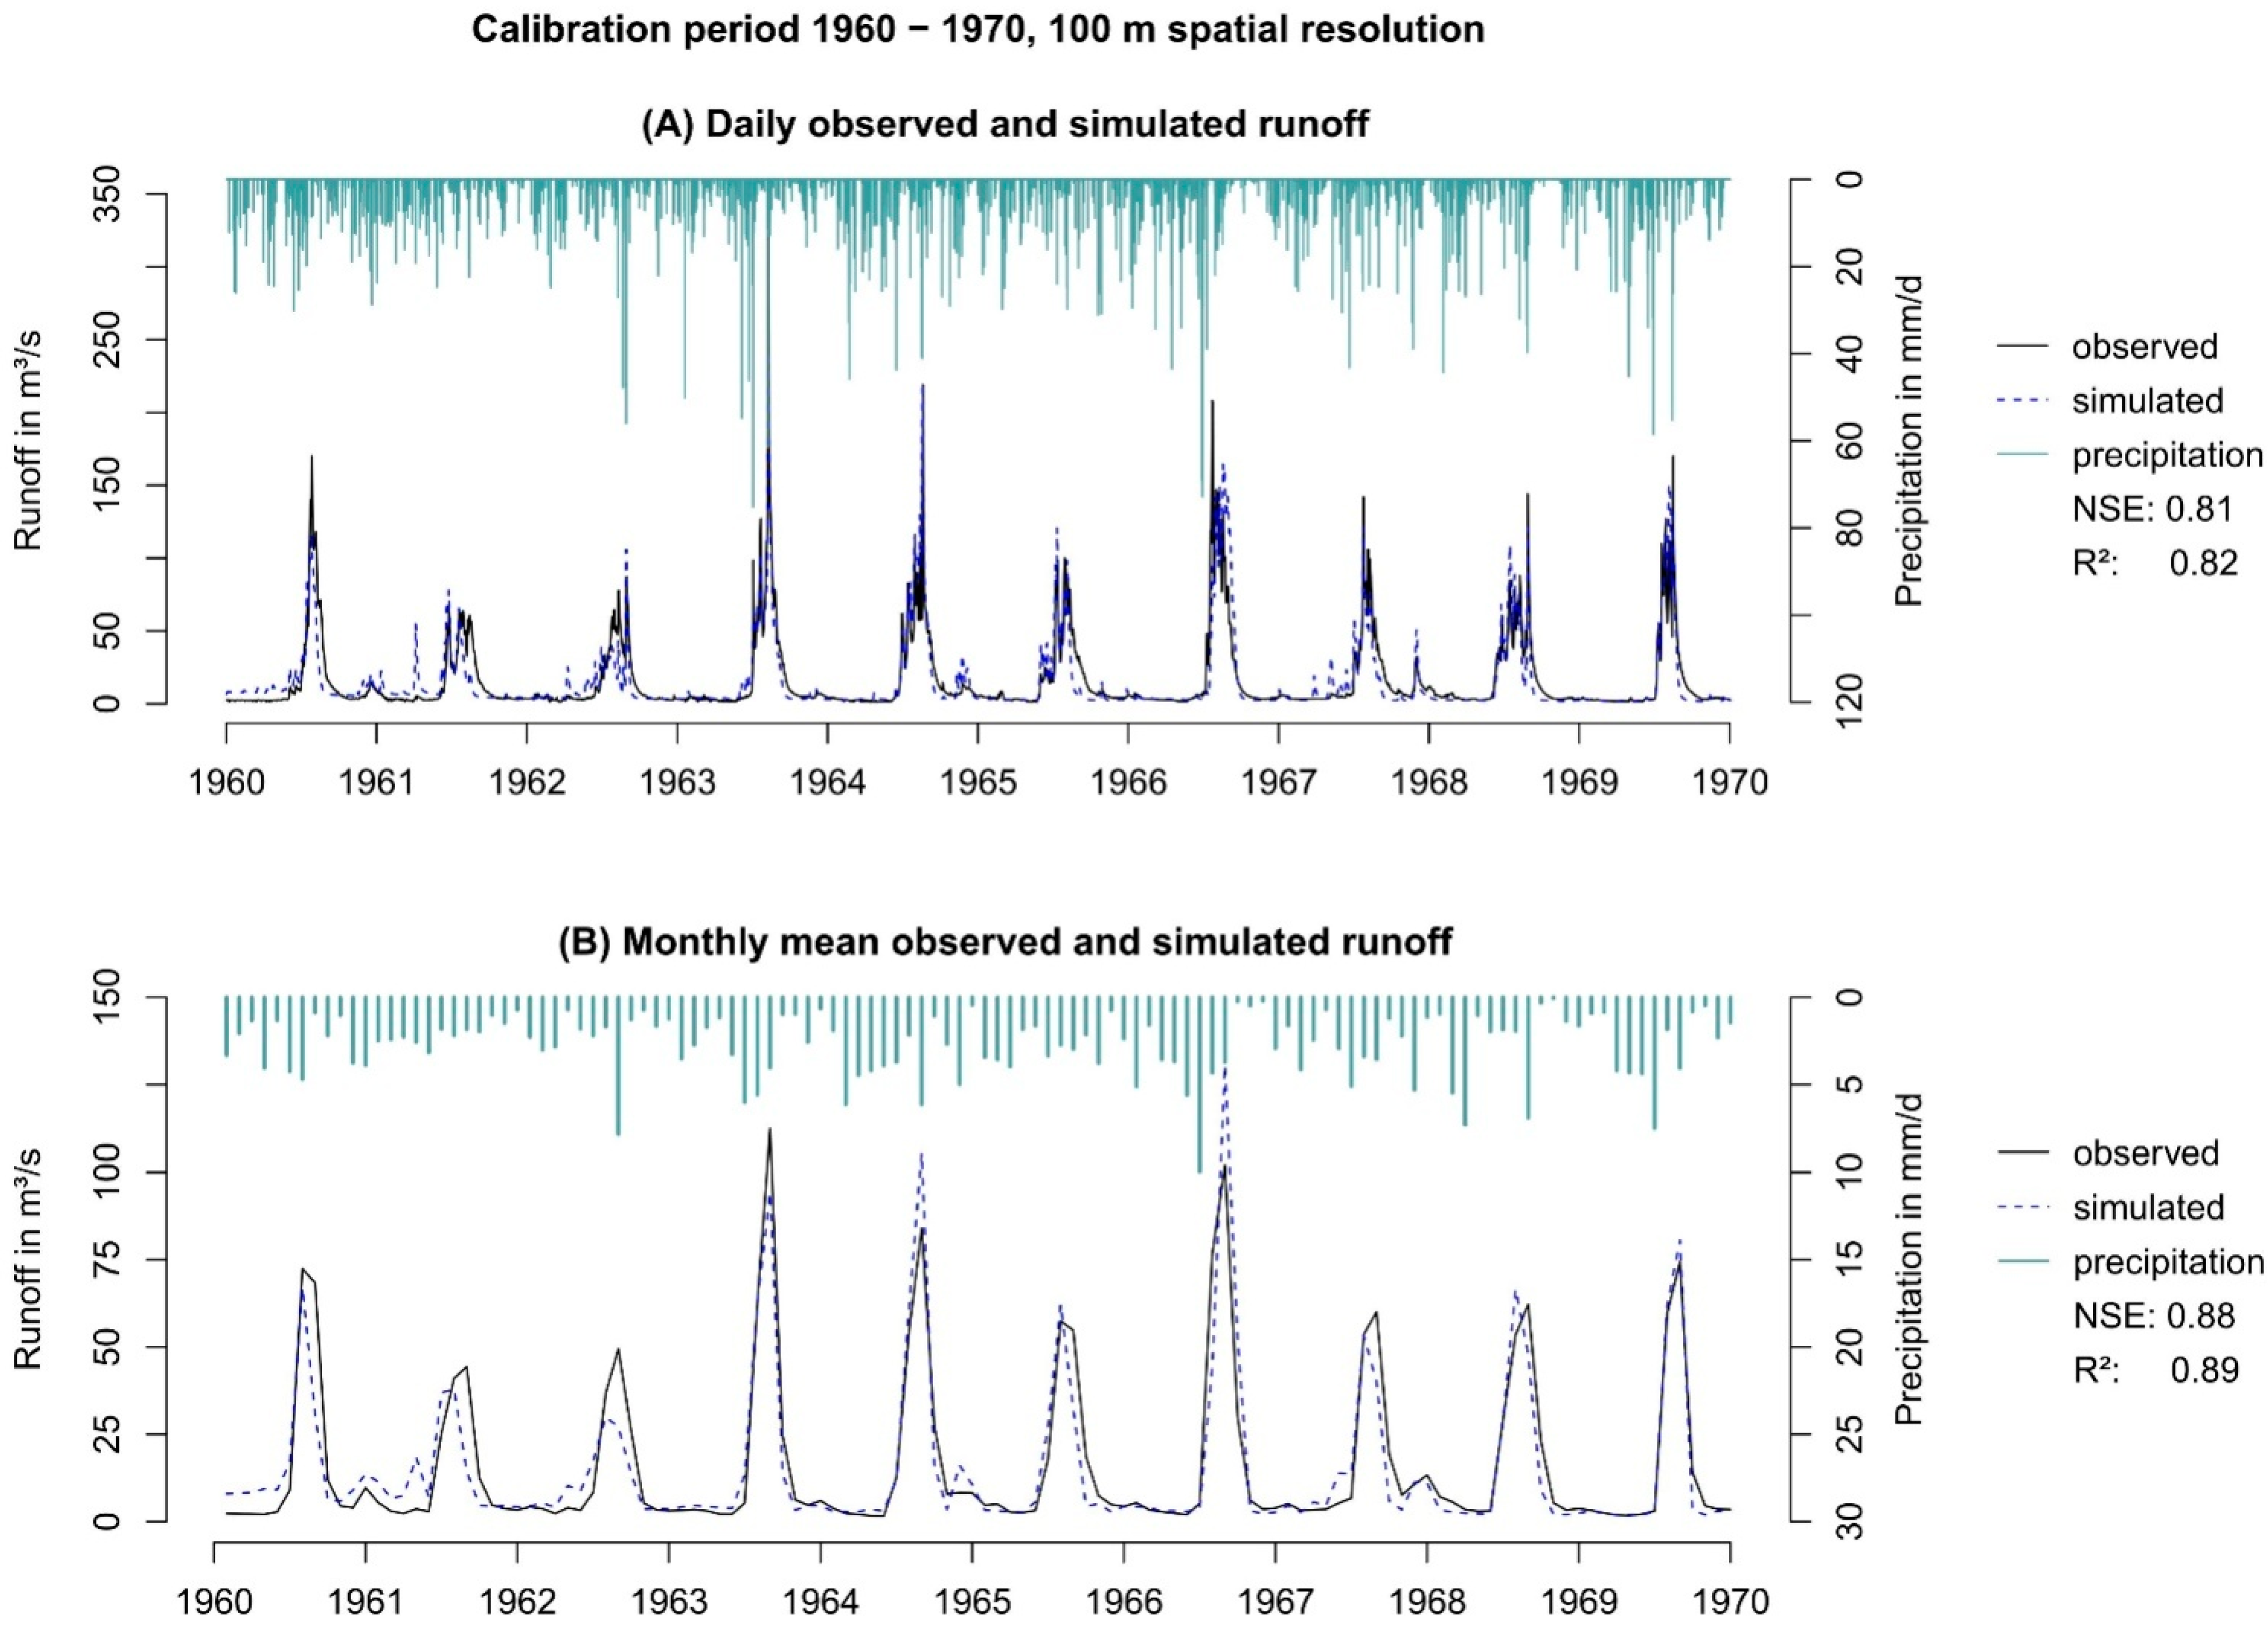
3.2.2. Calibration and Validation
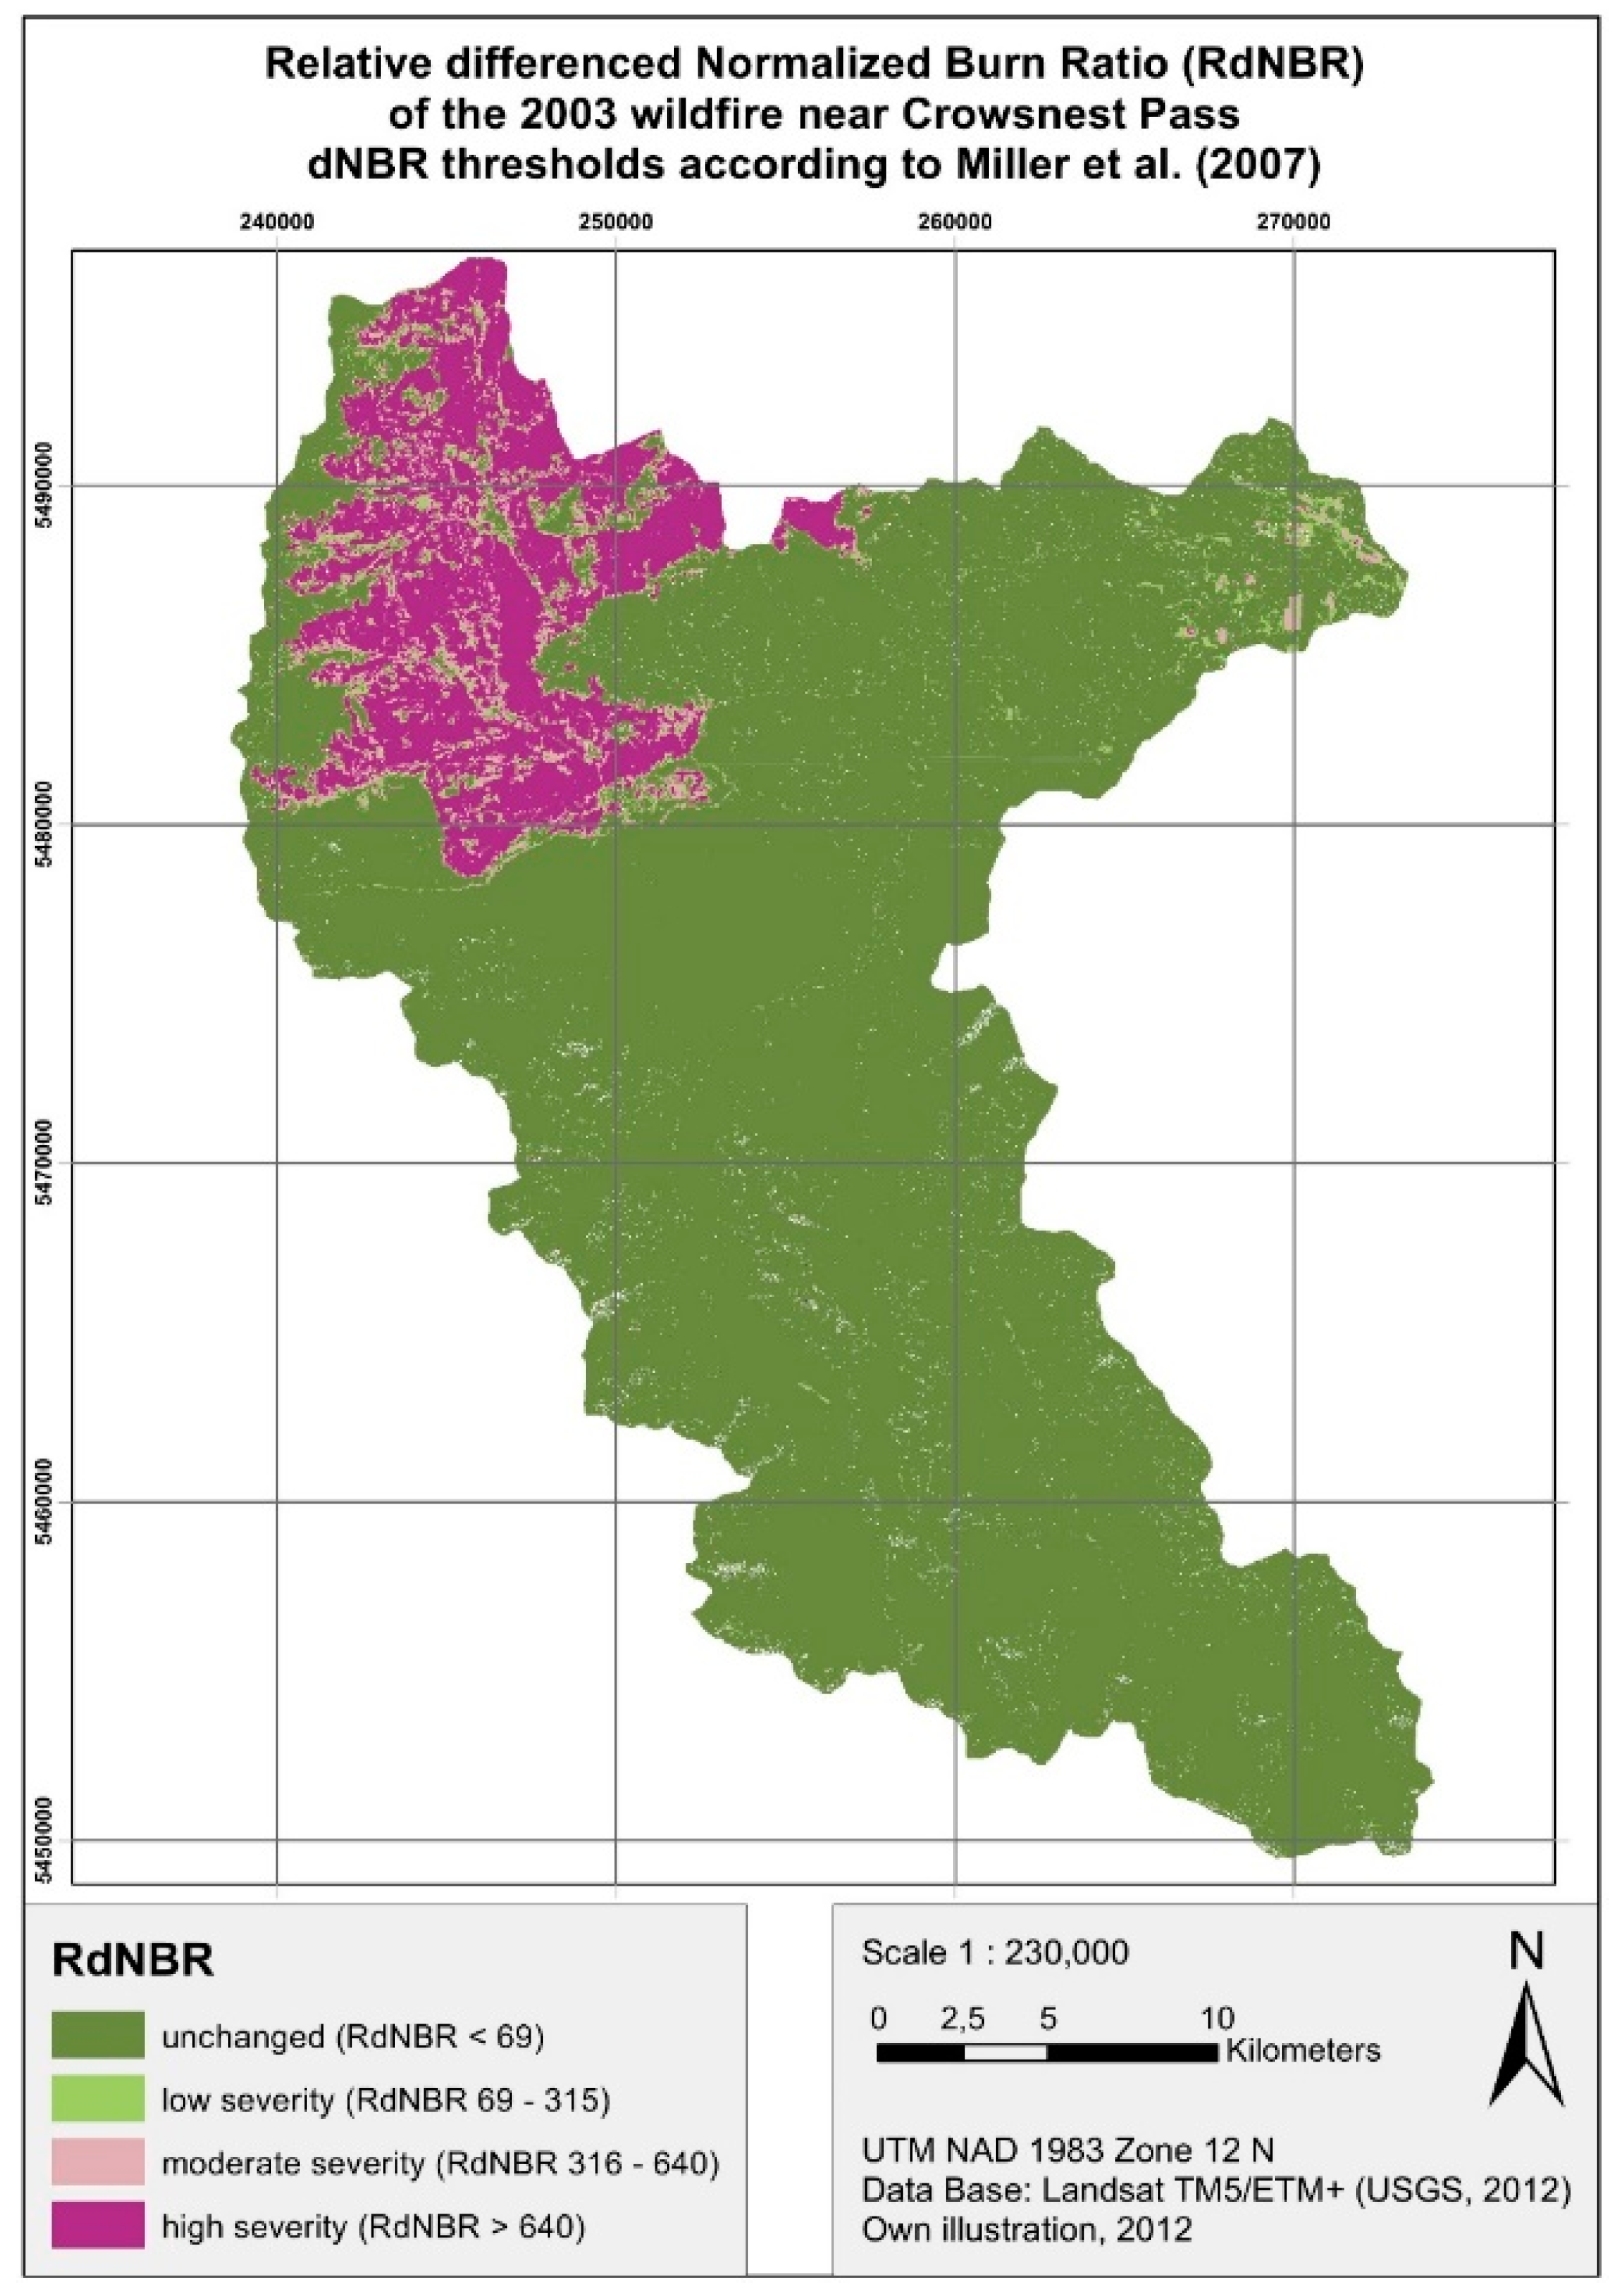
3.3. Remote Sensing of Forest Fires
3.3.1. Data
3.3.2. Normalized Burn Ratio and Change Detection Algorithm
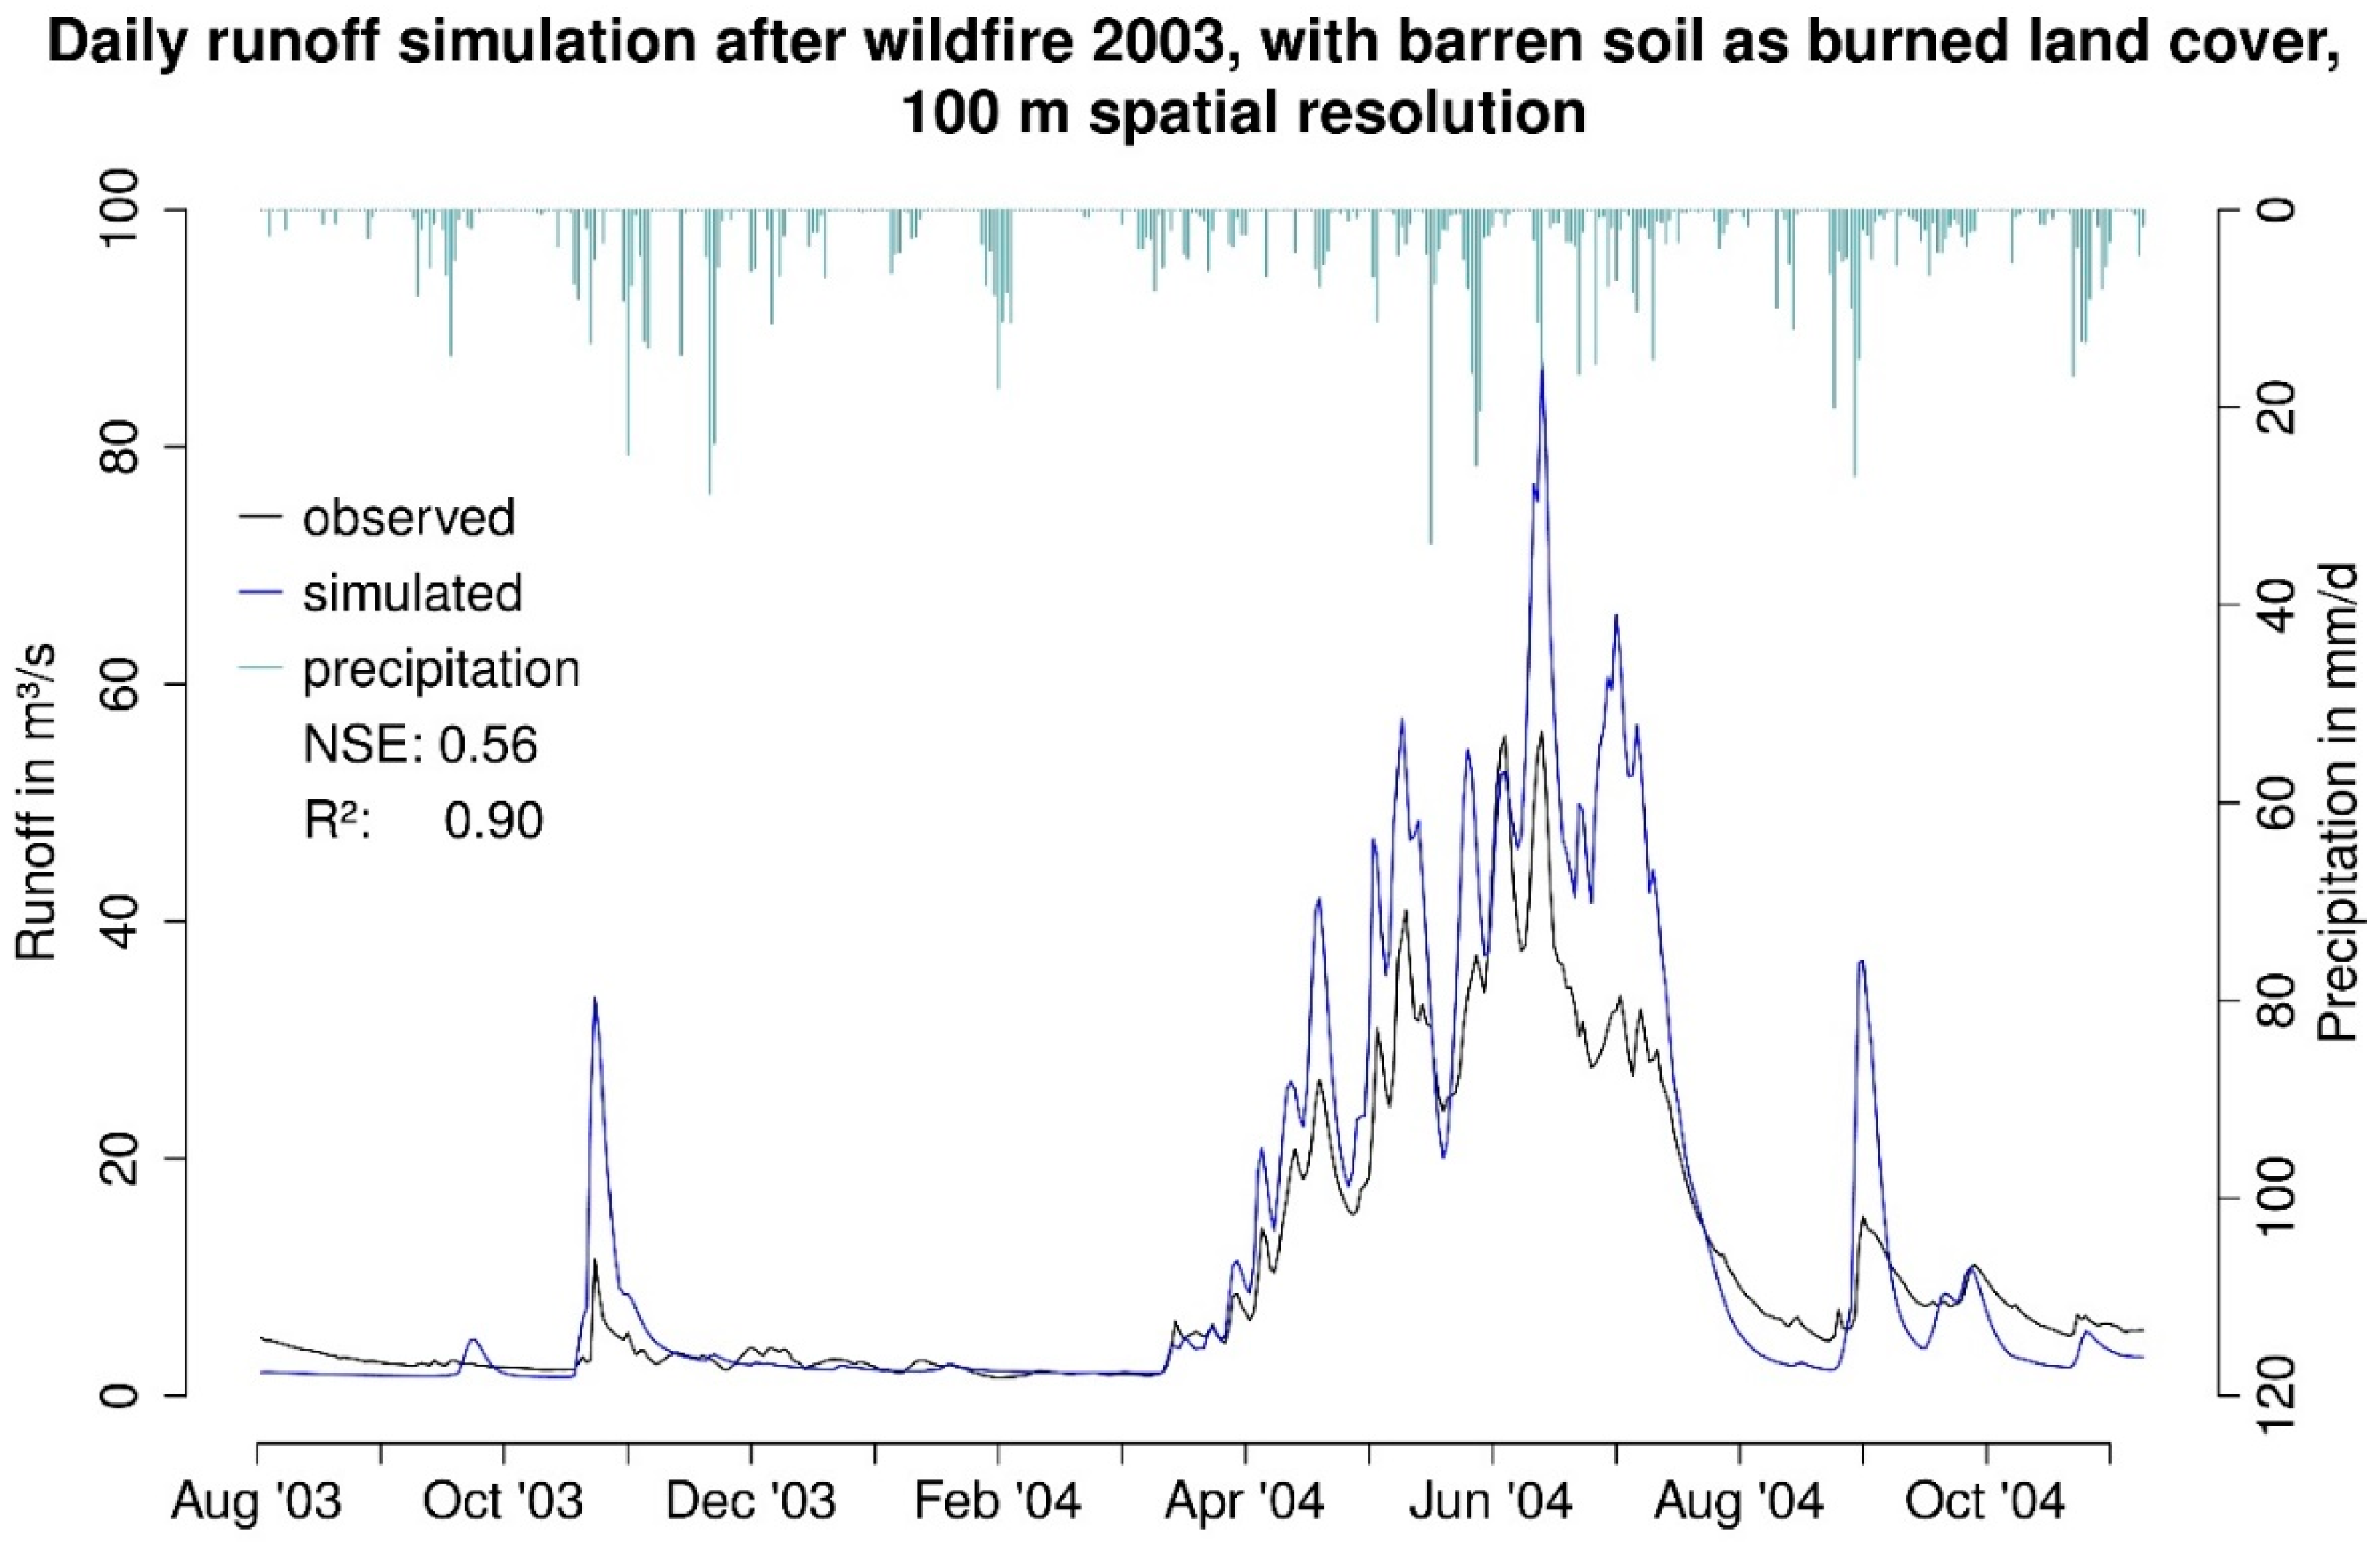
3.4. Impacts of Forest Fires on Runoff
3.4.1. Background
3.4.2. Data and Methods

| Parameter in (Landuse_Table) | Explanation | Previous Land Cover (Coniferous Forest) | Barren Land | Grass | Shrub |
|---|---|---|---|---|---|
| Albedo | Albedo | 0.12 | 0.25 | 0.25 | 0.2 |
| rsc (s/m) | Leaf surface resistance | 220–320 | 400 | 200–360 | 200–320 |
| rs_interception (s/m) | Evaporation of intercepted water | 5 | 0.5 | 5 | 5 |
| rs_evaporation (s/m) | Evaporation of water from the soil surface | 1000 | 200 | 600 | 1000 |
| LAI (1/1) | Leaf Area Index | 6–10 | 1 | 2–3 | 3–5 |
| Z0 (m) | Roughness length | 3 | 1 | 0.03–0.04 | 0.2 |
| VCF | Vegetation covered fraction | 0.9–0.95 | 0.2 | 0.8–0.9 | 0.9–0.95 |
| RootDepth (m) | Root depth | 1.2 | 0.2 | 0.4 | 0.5 |
4. Results and Discussion
4.1. Observed Climate and Streamflow Trend Results


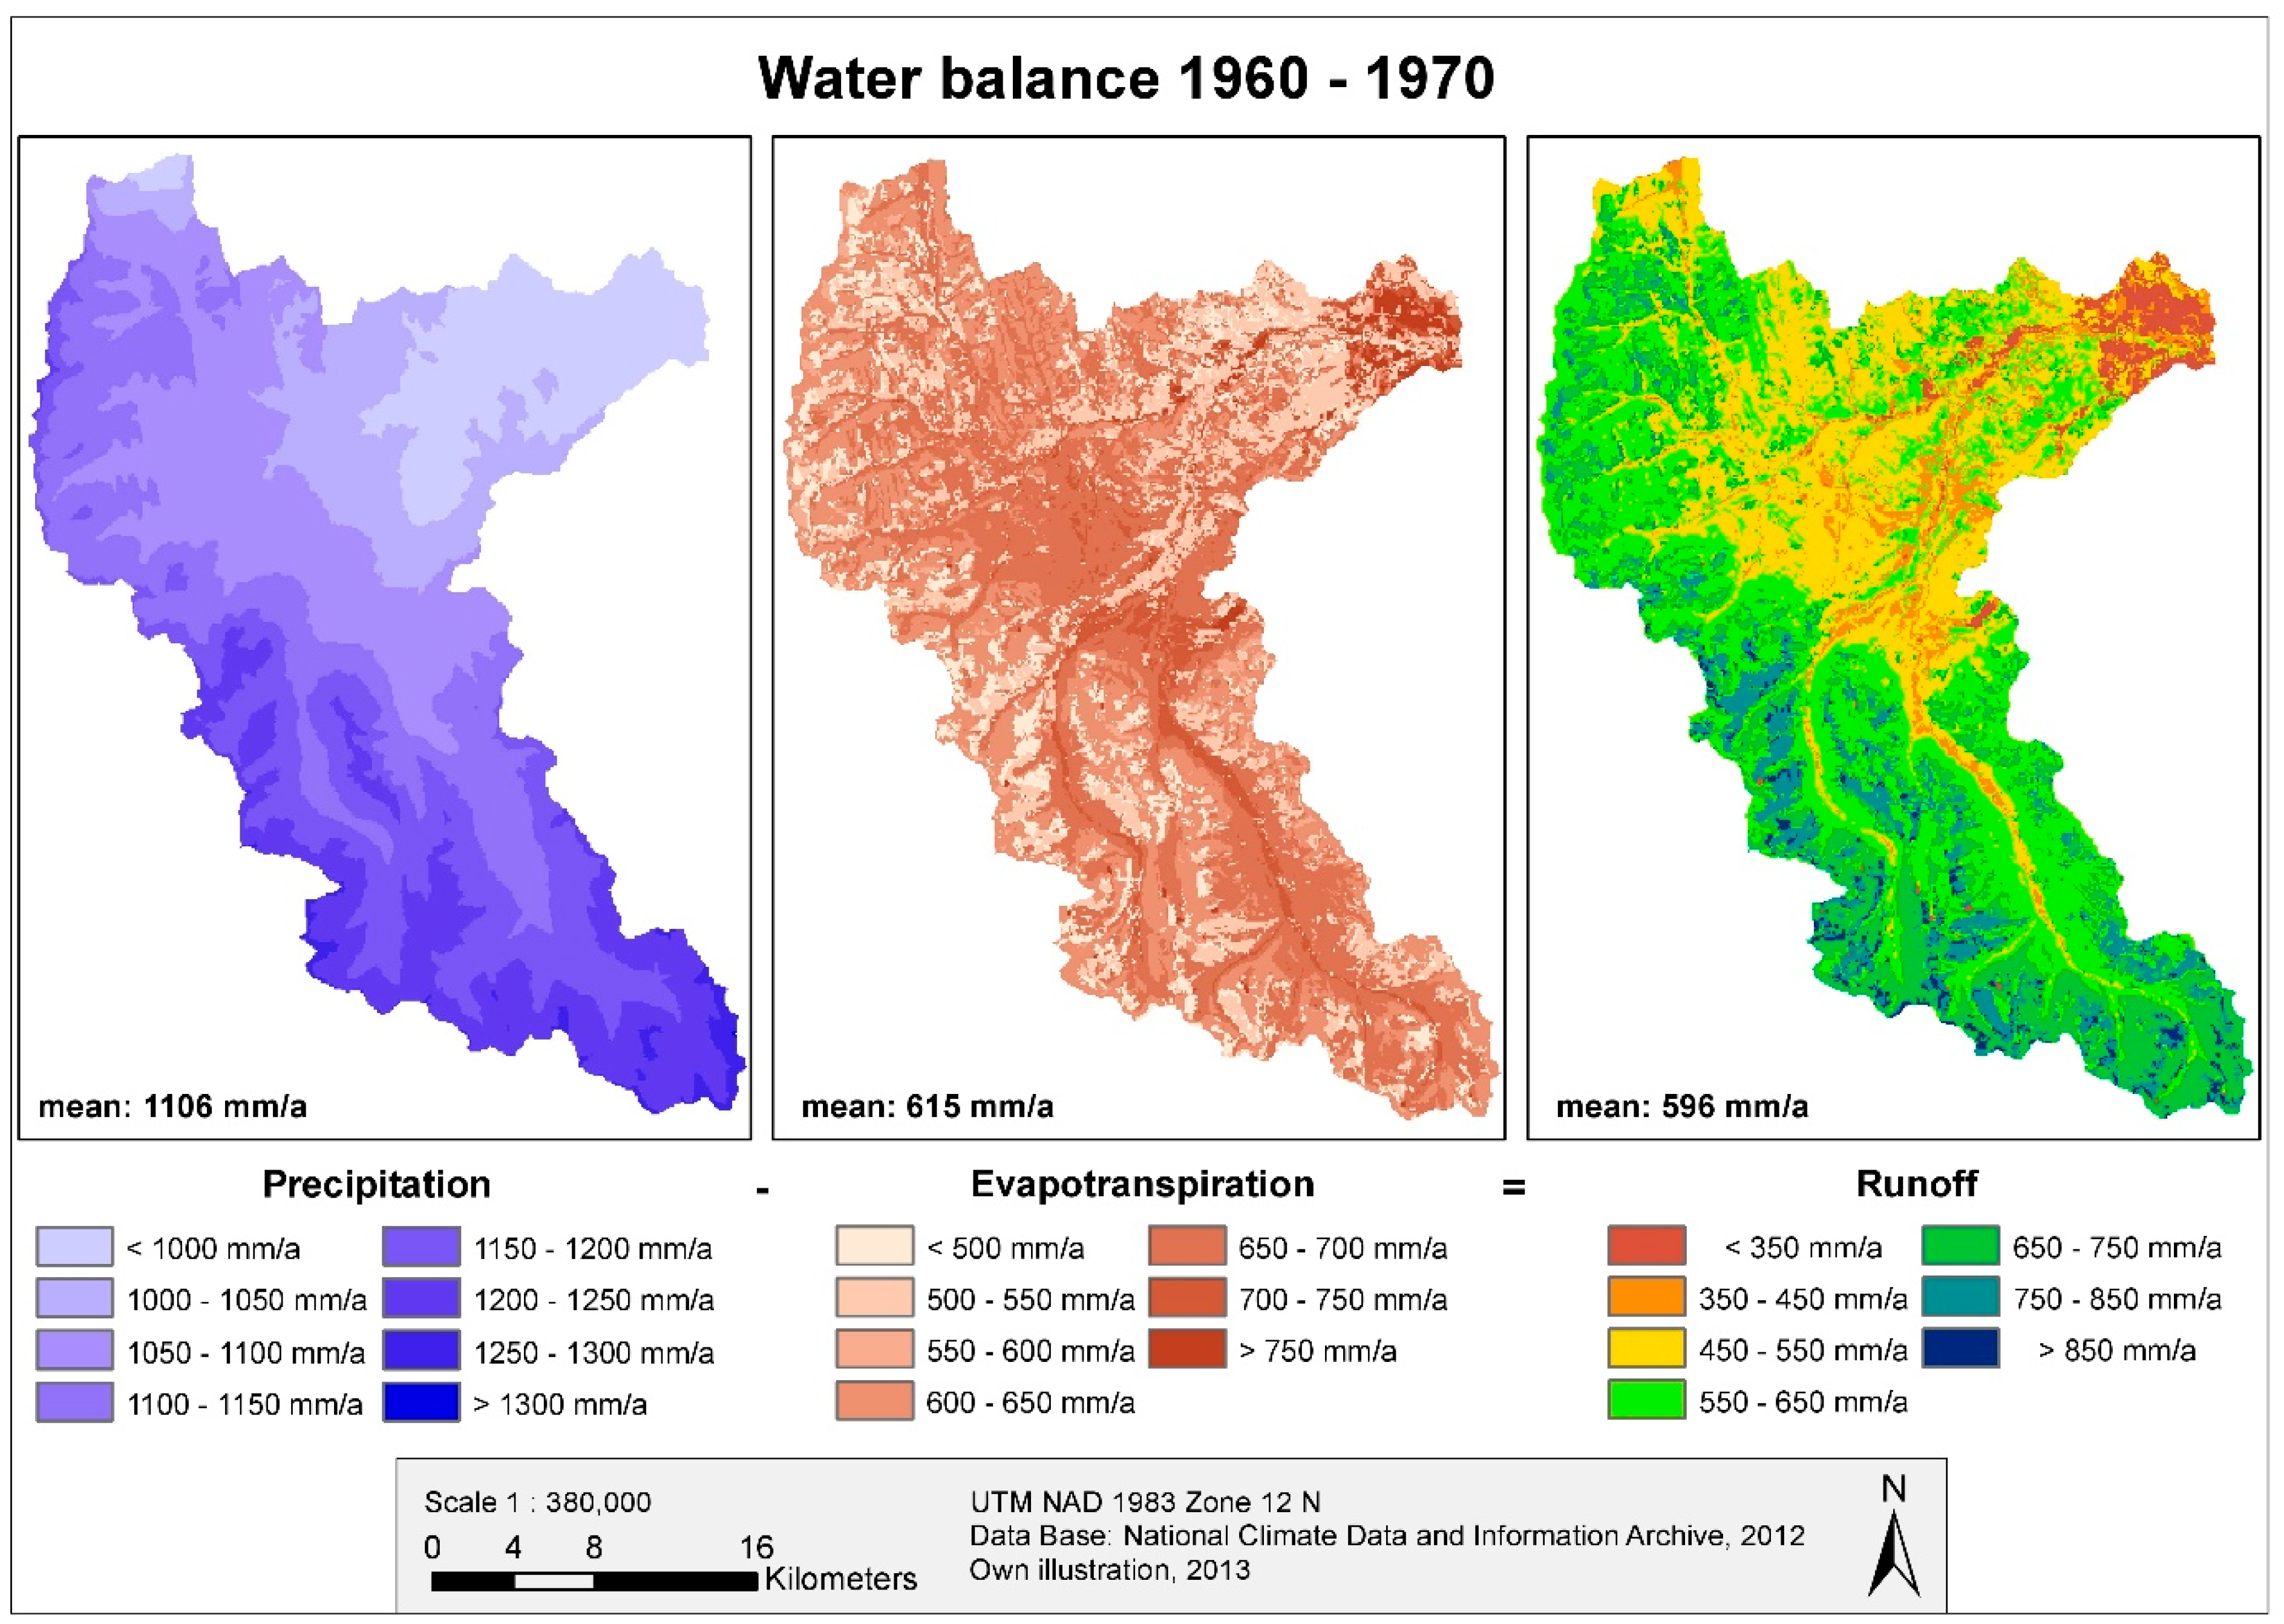
4.2. Calibration and Validation Results of WaSiM
| Period | Data | MQ | MQ Relative Error | MHQ | MLQ | NSE | R2 | |
|---|---|---|---|---|---|---|---|---|
| Calibration: | 1960–1970 | observed | 15.47 | 87 | 1.20 | |||
| simulated | 14.75 | −5% | 106 | 3.26 | 0.81 | 0.82 | ||
| Validation: | 1970–1980 | observed | 13.38 | 94 | 1.61 | |||
| simulated | 13.58 | +1% | 95 | 3.18 | 0.81 | 0.82 | ||
| Validation: | 1980–1990 | observed | 12.16 | 93 | 2.09 | |||
| simulated | 12.98 | +6% | 110 | 3.29 | 0.76 | 0.87 | ||
| Validation: | 1990–1999 | observed | 14.87 | 91 | 1.65 | |||
| simulated | 14.13 | −5% | 123 | 4.01 | 0.76 | 0.76 | ||
| Validation: | 2000–2010 | observed | 13.27 | 90 | 1.36 | |||
| simulated | 15.55 | +15% | 89 | 4.92 | 0.45 | 0.63 |


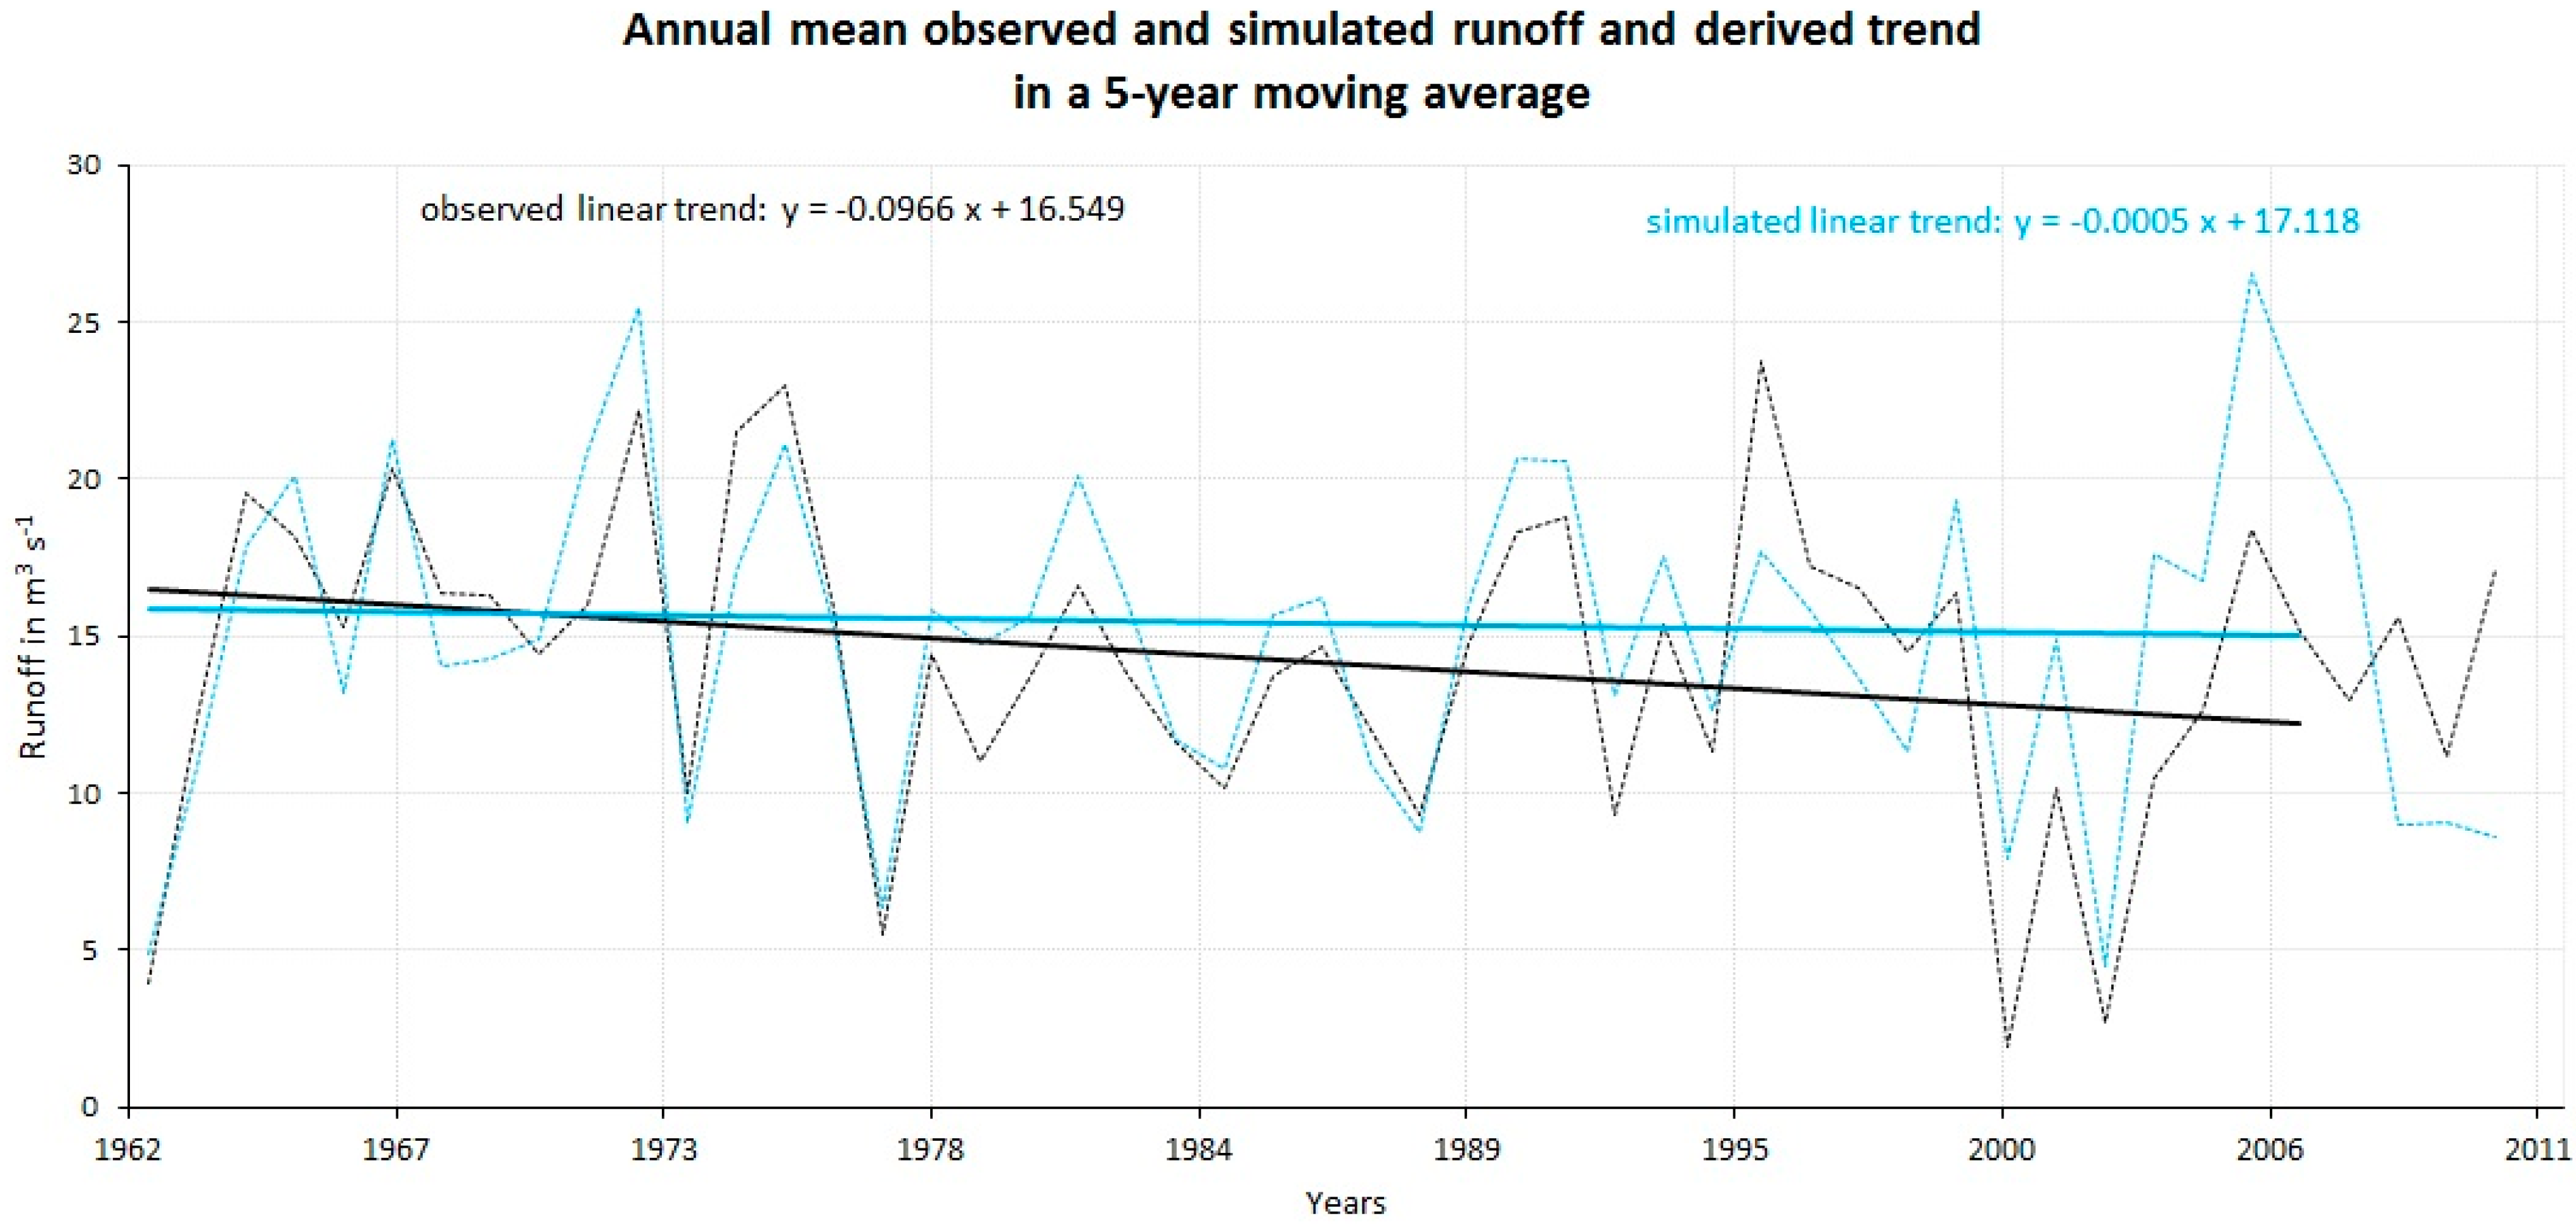
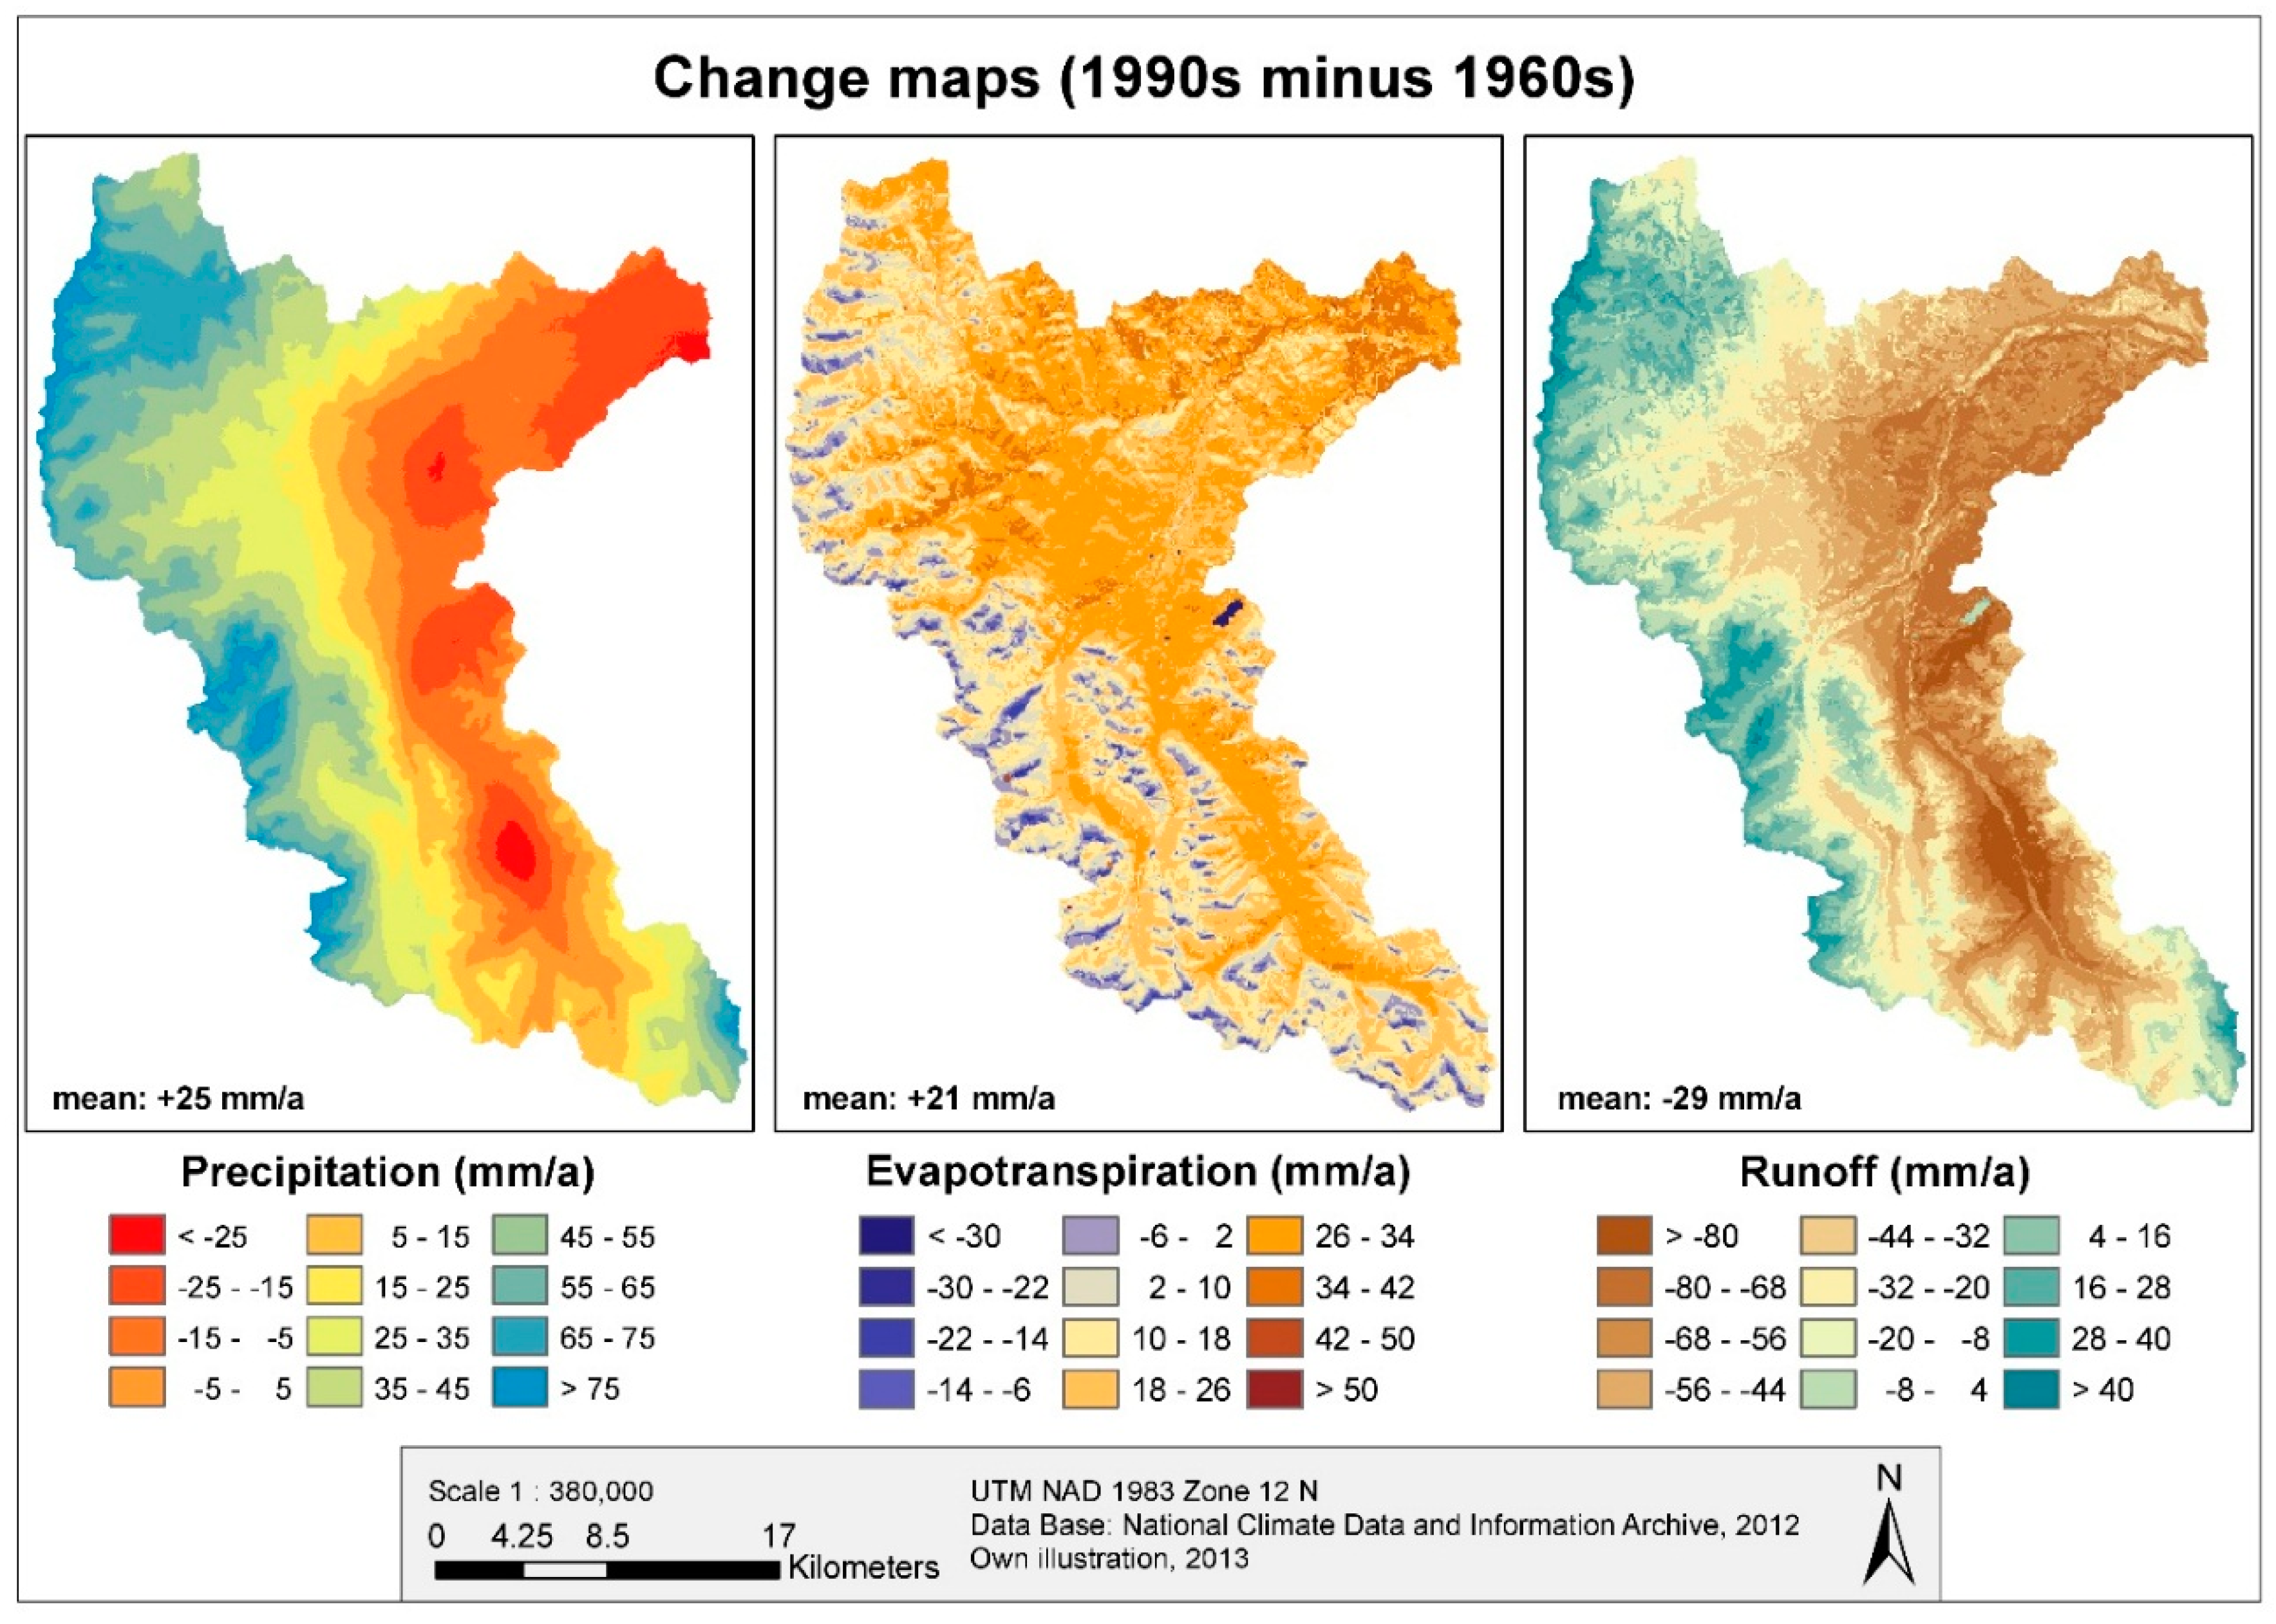
4.3. Comparison of Observed and Simulated Declining Runoff Trend

4.4. Results of Burn Ratio and Derived Burned Areas

4.5. Results of Simulated Runoff Reaction to Fires

5. Conclusions and Outlook
Acknowledgments
Author Contributions
Conflict of Interest
References
- Byrne, J.; Kienzle, S.; Johnson, D.; Duke, G.; Gannon, V.; Selinger, B.; Thomas, J. Current and future water issues in the Oldman River Basin of Alberta, Canada. Water Sci. Technol. 2006, 53, 327–334. [Google Scholar] [CrossRef] [PubMed]
- Forbes, K.A.; Kienzle, S.W.; Coburn, C.A.; Byrne, J.M.; Rasmussen, J. Simulating the hydrological response to predicted climate change on a watershed in southern Alberta, Canada. Clim. Chang. 2011, 105, 555–576. [Google Scholar] [CrossRef]
- Lapp, S.; Byrne, J.; Townshend, I.; Kienzle, S. Climate warming impacts on snowpack accumulation in an alpine watershed. Int. J. Climatol. 2005, 25, 521–536. [Google Scholar] [CrossRef]
- Kienzle, S.W. Water Yield and Streamflow Trend Analysis for Alberta Watersheds. Available online: http://www.albertawater.com/index.php/projects-research/dynamics-of-alberta-s-water-supply/41-water-research/dynamics-of-alberta-s-water-supply/518-water-yield-and-streamflow-trend-analysis-for-alberta-s-watersheds (accessed on 1 March 2013).
- Rood, S.B.; Samuelson, G.M.; Weber, J.K.; Wywrot, K.A. Twentieth-century decline in streamflows from the hydrographic apex of North America. J. Hydrol. 2005, 306, 215–233. [Google Scholar] [CrossRef]
- Sheppard, D.H.; Parkstrom, G.; Taylor, C. Bringing It Back: A Restoration Framework for the Castle Wilderness. Available online: http://www.ccwc.ab.ca/files/BRINGING_IT_BACK.pdf (accessed on 17 December 2012).
- Wulder, M.A.; White, J.C.; Alvarez, F.; Han, T.; Rogan, J.; Hawkes, B. Characterizing boreal forest wildfire with multi-temporal Landsat and LIDAR data. Remote Sens. Environ. 2009, 113, 1540–1555. [Google Scholar] [CrossRef]
- Stocks, B.J.; Mason, J.A.; Todd, J.B.; Bosch, E.M.; Wotton, B.M.; Amiro, B.D.; Flannigan, M.D.; Hirsch, K.G.; Logan, K.A.; Martell, D.L.; et al. Large forest fires in Canada, 1959–1997. J. Geophys. Res. 2003. [Google Scholar] [CrossRef]
- Flannigan, M.D.; Logan, K.A.; Amiro, B.D.; Skinner, W.R.; Stocks, B.J. Future area burned in Canada. Clim. Chang. 2005, 72, 1–16. [Google Scholar] [CrossRef]
- Pierson, F.B.; Robichaud, P.R.; Spaeth, K.E. Spatial and temporal effects of wildfire on the hydrology of a steep rangeland watershed. Hydrol. Process. 2001, 15, 2905–2916. [Google Scholar] [CrossRef]
- Silins, U.B.; Kevin, D.; Stone, M.; Emelko, M.B.; Boon, S.; Williams, C.; Wagner, M.J. Howery, Jocelyn Southern Rockies Watershed Project: Impact of Natural Disturbance by Wildfire on Hydrology, Water Quality, and Aquatic Ecology of Rocky Mountain Watersheds Phase I (2004–2008) Final Report. Available online: http://oldmanbasin.org/assets/files/Publications/SouthernRockiesWatershedProject-FinalReport-(Phase-I-2004-2008).pdf (accessed on 17 December 2012).
- Wainwright, J.; Mulligan, M. Environmental Modelling: Finding Simplicity in Complexity; Wiley: Chichester, UK, 2004. [Google Scholar]
- Miller, J.D.; Thode, A.E. Quantifying burn severity in a heterogeneous landscape with a relative version of the delta Normalized Burn Ratio (dNBR). Remote Sens. Environ. 2007, 109, 66–80. [Google Scholar] [CrossRef]
- Silins, U.; Stone, M.; Emelko, M.B.; Bladon, K.D. Sediment production following severe wildfire and post-fire salvage logging in the Rocky Mountain headwaters of the Oldman River Basin, Alberta. CATENA 2009, 79, 189–197. [Google Scholar] [CrossRef]
- Environment Canada. Water Survey of Canada-Castle River near Beaver Mines: Station ID 05AA022. Available online: http://www.wsc.ec.gc.ca/applications/H2O/report-eng.cfm?yearb=&yeare=&station=05AA022&report=daily&year=2011 (accessed on 17 December 2012).
- Alberta Wilderness Association. Areas of Concern-Castle. Available online: http://albertawilderness.ca/issues/wildlands/areas-of-concern/castle (accessed on 10 December 2012).
- Kulig, J.C.; Edge, D.; Reimer, W.; Townshend, I.; Lightfoot, N. Levels of Risk: Perspectives of the Lost Creek Fire. Available online: https://www.uleth.ca/dspace/bitstream/handle/10133/1266/Levels%20of%20Risk.pdf?sequence=1 (accessed on 17 December 2012).
- Agriculture and Agri-Food Canada. Gridded Climate Data. Available online: http://www4.agr.gc.ca/AAFC-AAC/display-afficher.do?id=1227620138144&lang=eng (accessed on 10 October 2012).
- University of Waterloo. Climate Dataset (Daily 10km Grids). Available online: http://www.lib.uwaterloo.ca/locations/umd/digital/documents/ClimateDatasetDaily10kmGrids.html (accessed on 25 February 2013).
- Schulla, J. Model Description WaSiM (Water Balance Simulation Model). Available online: http://www.wasim.ch/downloads/doku/wasim/wasim_2012_ed2_en.pdf (accessed on 17 December 2012).
- Jasper, K.; Calanca, P.; Gyalistras, D.; Fuhrer, J. Differential impacts of climate change on the hydrology of two alpine river basins. Clim. Res. 2004, 26, 113–129. [Google Scholar] [CrossRef]
- Beckers, J.; Smerdon, B.; Wilson, M. Review of hydrologic models for forest management and climate change applications in British Columbia and Alberta. In FORREX Forum for Research and Extension in Natural Resources, Kamloops; Forrex Forum for Research and Extension in Natural Resources: Kamloops, BC, Canada, 2009; Forrex Series 25. [Google Scholar]
- Klein Tank, A.M.G.; Wijngaard, J.B.; Können, G.P.; Böhm, R.; Demarée, G.; Gocheva, A.; Mileta, M.; Pashiardis, S.; Hejkrlik, L.; Kern-Hansen, C.; et al. Daily dataset of 20th-century surface air temperature and precipitation series for the European Climate Assessment. Int. J. Climatol. 2002, 22, 1441–1453. [Google Scholar] [CrossRef]
- National Climate Data Information Archive Climate Data Online. Available online: http://climate.weatheroffice.gc.ca/climateData/canada_e.html (accessed on 1 January 2013).
- Thornton, P.E.; Hasenauer, H.; White, M.A. Simultaneous estimation of daily solar radiation and humidity from observed temperature and precipitation: An application over complex terrain in Austria. Agric. For. Meteorol. 2000, 104, 255–271. [Google Scholar] [CrossRef]
- Bristow, K.L.; Campbell, G.S. On the relationship between incoming solar radiation and daily maximum and minimum temperature. Agric. For. Meteorol. 1984, 31, 159–166. [Google Scholar] [CrossRef]
- GeoBase Canadian Council on Geomatics. Digital Elevation Model Data. Available online: http://www.geobase.ca/geobase/en/find.do?produit=cded (accessed on 2 November 2012).
- GeoBase National Land Cover Project Team; DB Geoservices Inc. GeoBase Land Cover Product: User Needs Assessment. Available online: http://www.geobase.ca/geobase/en/data/landcover/csc2000v/description.html (accessed on 5 February 2013).
- CSSS Canadian Society of Soil Sciences; Department of Soil Science, University of Saskatchewan. Soils of Canada: Orders. Available online: http://www.soilsofcanada.ca/orders/index.php (accessed on 2 February 2013),.
- Moriasi, D.N.; Arnold, J.G.; van Liew, M.W.; Bingner, R.L.; Harmel, R.D.; Veith, T.L. Model evaluation guidelines for systematic quantification of accuracy in watershed simulations. Trans. ASABE 2007, 50, 885–900. [Google Scholar] [CrossRef]
- Nash, J.E.; Sutcliffe, J.V. River flow forecasting through conceptual models, Part I-A discussion of principles. J. Hydrol. 1970, 10, 282–290. [Google Scholar] [CrossRef]
- Krause, P.; Boyle, D.P.; Bäse, F. Comparison of different efficiency criteria for hydrological model assessment. Adv. Geosci. 2005, 2005, 89–97. [Google Scholar] [CrossRef]
- ESRD Alberta Spatial Wildfire Data: Historical Wildfire Perimeter Data: 1931–2011. Available online: http://srd.alberta.ca/Wildfire/WildfireStatus/HistoricalWildfireInformation/SpatialWildfireData.aspx (accessed on 2 February 2013).
- Soverel, N.O.; Perrakis, D.D.B.; Coops, N.C. Estimating burn severity from Landsat dNBR and RdNBR indices across western Canada. Remote Sens. Environ. 2010, 114, 1896–1909. [Google Scholar] [CrossRef]
- Key, C.H.; Benson, N.C. Landscape assessment: Remote sensing of severity, the normalized burn ratio. In FIREMON: Fire Effects Monitoring and Inventory System: General Technical Report; Lutes, D.C., Ed.; USDA Forest Service, Rocky Mountain Research Station: Ogden, UT, USA, 2006; Volume 2006, pp. 219–273. [Google Scholar]
- Miller, J.D.; Knapp, E.E.; Key, C.H.; Skinner, C.N.; Isbell, C.J.; Creasy, R.M.; Sherlock, J.W. Calibration and validation of the relative differenced Normalized Burn Ratio (RdNBR) to three measures of fire severity in the Sierra Nevada and Klamath Mountains, California, USA. Remote Sens. Environ. 2009, 113, 645–656. [Google Scholar] [CrossRef]
- Epting, J.; Verbyla, D.; Sorbel, B. Evaluation of remotely sensed indices for assessing burn severity in interior Alaska using Landsat TM and ETM+. Remote Sens. Environ. 2005, 96, 328–339. [Google Scholar] [CrossRef]
- Verbyla, D.L.; Kasischke, E.S.; Hoy, E.E. Seasonal and topographic effects on estimating fire severity from Landsat TM/ETM+ data. Int. J. Wildland Fire 2008, 17, 527–534. [Google Scholar] [CrossRef]
- Luce, C.H. Land use and land cover effects on runoff processes: Fire. In Encyclopedia of Hydrological Sciences; Anderson, M.G., McDonnel, J.J., Eds.; Wiley: Hoboken, NJ, USA, 2005; Volume 3, pp. 1831–1837. [Google Scholar]
- IPCC. Climate Change 2007-Impacts, Adaptation and Vulnerability: Working Group II Contribution to the Fourth Assessment Report of the Intergovernmental Panel on Climate Change; Parry, M.L., Canziani, O.F., Palutikof, J.P., van der Linden, P.J., Hanson, C.E., Eds.; IPCC Secretariat: Geneva, Switzerland, 2007. [Google Scholar]
- Nkemdirim, L.; Weber, L. Comparison between the Droughts of the 1930s and the 1980s in the Southern Prairies of Canada. J. Clim. 1999, 12, 2434–2450. [Google Scholar] [CrossRef]
- Field, C.B.M.; Brklacich, M.; Forbes, D.L.; Kovacs, J.A.; Running Steven, W.; Scott, M.J. Chapter 14: North America. In Climate Change 2007-Impacts, Adaptation and Vulnerability: Working Group II Contribution to the Fourth Assessment Report of the Intergovernmental Panel on Climate Change; Parry, M.L., Canziani, O.F., Palutikof, J.P., van der Linden, P.J., Hanson, C.E., Eds.; IPCC Secretariat: Geneva, Switzerland, 2007. [Google Scholar]
- Lemmen, D.S.; Warren, F.J.; Lacroix, J.; Bush, E. From Impacts to Adaptation: Canada in a Changing Climate 2007; Government of Canada: Ottawa, ON, Canada, 2007; Available online: http://www.nrcan.gc.ca/sites/www.nrcan.gc.ca.earth-sciences/files/pdf/assess/2007/pdf/full-complet_e.pdf (accessed on 5 February 2013).
- Brutsaert, W. Hydrology: An Introduction; Cambridge University Press: Cambridge, UK/New York, NY, USA, 2005. [Google Scholar]
- MacDonald, M.K.; Pomeroy, J.W.; Pietroniro, A. On the importance of sublimation to an alpine snow mass balance in the Canadian Rocky Mountains. Hydrol. Earth Syst. Sci. 2010, 14, 1401–1415. [Google Scholar] [CrossRef]
- Roeder, A.; Hill, J.; Duguy, B.; Alloza, J.; Vallejo, R. Mapping fire events and post fire succession using long time-series of Landsat-TM and -MSS data. In Proceedings of the 5th International Workshop on Remote Sensing and GIS Applications to Forest Fire Management: Fire Effects Assessment, Zaragoza, Spain, 16–18 June 2005; La Riva Fernández, J.R.D., Pérez Cabello, F., Chuvieco Salinero, E., Eds.; Universidad de Zaragoza, Servicio de Publicaciones: Zaragoza, Spain, 2005; pp. 287–290. [Google Scholar]
- Gillett, N.P. Detecting the effect of climate change on Canadian forest fires. Geophys. Res. Lett. 2004, 31, L18211. [Google Scholar] [CrossRef]
© 2015 by the authors; licensee MDPI, Basel, Switzerland. This article is an open access article distributed under the terms and conditions of the Creative Commons Attribution license (http://creativecommons.org/licenses/by/4.0/).
Share and Cite
Springer, J.; Ludwig, R.; Kienzle, S.W. Impacts of Forest Fires and Climate Variability on the Hydrology of an Alpine Medium Sized Catchment in the Canadian Rocky Mountains. Hydrology 2015, 2, 23-47. https://doi.org/10.3390/hydrology2010023
Springer J, Ludwig R, Kienzle SW. Impacts of Forest Fires and Climate Variability on the Hydrology of an Alpine Medium Sized Catchment in the Canadian Rocky Mountains. Hydrology. 2015; 2(1):23-47. https://doi.org/10.3390/hydrology2010023
Chicago/Turabian StyleSpringer, Johanna, Ralf Ludwig, and Stefan W. Kienzle. 2015. "Impacts of Forest Fires and Climate Variability on the Hydrology of an Alpine Medium Sized Catchment in the Canadian Rocky Mountains" Hydrology 2, no. 1: 23-47. https://doi.org/10.3390/hydrology2010023