Estimating Aquifer Storage and Recovery (ASR) Regional and Local Suitability: A Case Study in Washington State, USA


1
Water Resources Graduate Program, Oregon State University, Corvallis, OR 97330, USA
2
Hydrogeology and Water Resources, College of Earth, Ocean, and Atmospheric Sciences, Oregon State University, Corvallis, OR 97330, USA
3
EA Engineering, Science, and Technology, INC., Olympia, WA 98508, USA
*
Author to whom correspondence should be addressed.
Hydrology 2018, 5(1), 7; https://doi.org/10.3390/hydrology5010007
Submission received: 21 December 2017
/
Revised: 5 January 2018
/
Accepted: 5 January 2018
/
Published: 12 January 2018
Abstract
:Developing aquifers as underground water supply reservoirs is an advantageous approach applicable to meeting water management objectives. Aquifer storage and recovery (ASR) is a direct injection and subsequent withdrawal technology that is used to increase water supply storage through injection wells. Due to site-specific hydrogeological quantification and evaluation to assess ASR suitability, limited methods have been developed to identify suitability on regional scales that are also applicable at local scales. This paper presents an ASR site scoring system developed to qualitatively assess regional and local suitability of ASR using 9 scored metrics to determine total percent of ASR suitability, partitioned into hydrogeologic properties, operational considerations, and regulatory influences. The development and application of a qualitative water well suitability method was used to assess the potential groundwater response to injection, estimate suitability based on predesignated injection rates, and provide cumulative approximation of statewide and local storage prospects. The two methods allowed for rapid assessment of ASR suitability and its applicability to regional and local water management objectives at over 280 locations within 62 watersheds in Washington, USA. It was determined that over 50% of locations evaluated are suitable for ASR and statewide injection potential equaled 6400 million liters per day. The results also indicate current limitations and/or potential benefits of developing ASR systems at the local level with the intent of assisting local water managers in strategic water supply planning.
1. Introduction
In the state of Washington, USA, interest in aquifer storage and recovery (ASR) as a managed recharge technology is growing throughout the state. Understanding the potential of ASR on a large scale requires detailed characterization of technical and regulatory factors, which can be cost prohibitive. Therefore, the following case study describes a qualitative and quantitative method developed to estimate local, watershed, and regional scale ASR suitability. As of this writing, the following case study is the largest know regional assessment of ASR suitability conducted in the United States to date.
More than 1.5 billion people rely on groundwater resources worldwide [1]. Water scarcity and poor management are realities many will face as global population is expected to increase and climate-driven alterations stress current supplies. Arguably considered detrimental to environmental ecosystems and cultural legacies [2], aboveground reservoir storage methods traditionally meet demand for water supply. Under adverse water management scenarios, integrating conjunctive use concepts into groundwater and surface water management plans will be essential to support future demand [3]. One such method is incorporating managed aquifer recharge (MAR) schemes to meet current and future water storage requirements [4,5]. Aquifer storage and recovery (ASR) is a practical MAR mitigation strategy that can provide large water storage capacity, reestablish environmental habitats, prevent saltwater intrusion, and eliminate many negative consequences that are associated with dams, including a much smaller infrastructure and environmental footprint when compared to that of aboveground reservoir storage [6,7,8,9]. The practice of ASR involves the use of injection and recovery wells to add surplus water to aquifers for subsequent withdrawal, typically during peak demand or for emergency purposes.
Worldwide interest and application of underground water storage began over 70 years ago [4,10,11,12]. Current research methods for identifying and regionally mapping reservoir storage suitability generally include an operational research approach, such as a Multi-Criteria Decision Analysis (MCDA). The MCDA is a qualitative overlay method that requires weighing and ranking of various thematic layers, relevant to a given objective, typically within a geographical information system (GIS) [13,14,15,16,17,18,19,20,21,22,23,24,25,26,27,28]. Rahman et al. [20] present a comprehensive review of MCDA and its application. Results obtained from MCDA’s aid in strategic water planning but typically require extensive characterization or interpolation of hydrogeologic conditions, therefore estimates of storage capacity tend to be limited to local regions.
Rahman et al. [20] utilized this concept to create an interactive non-site specific tool to evaluate MAR in the Algarve region of Southern Portugal. Results depended on depth-to-groundwater, soil infiltration rates, and transmissive layers covering an area of 114 km2 within the Querença-Silves aquifer. Constraint mapping and a site suitably analysis showed that less than 12% of the study area contained properties suitable for infiltration ponds. It was suggested that applying a groundwater flow and transport model with the non-site specific tool will increase selection confidence. Nasiri et al. [22] conducted an MCDA within a GIS platform to produce zones that are suitable for regional flood spreading within the Garabaygan Basin of Iran. Delineating transmissivities and alluvium thickness throughout the watershed, the study found 15% of the 714 km2 study site is suitable for artificial aquifer recharge. Chowdhury et al. [14] used a MCDA technique and integrated satellite imagery within a GIS platform to delineate artificial recharge zones within a 4500 km2 area of West Bengal. It was suggested 40 recharge sites met acceptable criteria based on geomorphology, geology, slope class, drainage density, and aquifer transmissivity. Results indicated check dams, which increase infiltration into aquifers, were most suitable. It was also suggested that injection wells are a viable option, but the exact locations were not identifiable until techno-economic field assessments are conducted.
Since ASR uses injection wells to replenish aquifers, conducting large-scale suitability assessments using MCDA and thematic overlay methods pose a greater degree of difficulty as continuity in hydrogeologic data decrease as the study area increases. This tends to result in hybrid assessments of MCDAs that focus on specific metrics based on project objectives and available data. These studies tend to involve a review of available data that help preliminarily identify suitable locations by process of elimination, weighted criteria ranking, checklist method, and/or scoring approaches [9,29,30,31,32].
At the request of the St. Johns River Water Management District in Florida, USA, CH2M Hill [33] completed a suitability assessment of ASR. An ASR feasibility screening tool was developed to determine the extent in which ASR can assist in meeting a water facility’s supply and storage objectives based on technical, cost, and regulatory components. The technical screening tool included estimating the storage needs for ASR in comparison to other storage options. If a need for ASR was established, hydrogeologic factors, design factors, and operating factors were given scores based on the following sections: storage-zone confinement, storage-zone transmissivity, storage zone gradient and direction, recharge water quality, native groundwater quality, overall physical, geochemical, and design interactions, and interfering uses and impacts. A ranking score of 1 to 5 was assigned for each section and total scores determined the feasibility level of low to high confidence and its associated recommendation for additional studies. The second component of the screening features included cost factors, which provided estimates for ASR systems in regard to flow rates as compared to other storage options. Regulatory factors allowed for federal and local regulatory considerations that governed ASR. The screening tool was used to examine current ASR locations, including, Boynton Beach, Manatee, Marathon, Palm Bay, Peace River, Florida, Highland Ranch, Colorado, and Seattle, Washington. It was determined all examined locations were rated as having moderate or high levels of confidence, and thereafter used as a tool to preliminary assess ASR suitability within locations of interest.
As part of the Comprehensive Everglades Restoration Plan, Brown et al. [34] created an ASR site selection index to support the future expansion of 333 ASR well locations used for wetland replenishment. A land use pass/fail screening process within GIS identified 97 possible polygons that contained only the following: land with at least 2 ha to support a water treatment plant near a cluster of ASR wells, located within 4.8 km of source water. The second tier involved the criterion-based ranking of land, delineated in polygon form within GIS, to identify ecological suitability, local water well user density, water quality, road density, location of power lines, transmissivity, and operational flexibility. Applying a weighting factor to the ranked criterion, assigned through approved consensus, and then normalized between 0 and 1 produced an ASR suitability index map. The index map displayed polygons of suitable locations, which included pilot projects currently under evaluation.
Based on Brown et al. [35], Woody [30] conducted an ASR suitability assessment at discrete locations throughout 18 state-designated watersheds in Oregon, USA. By eliminating the 2 ha requirement from the initial pass/fail screening tier, Woody allowed for the inclusion of ASR for municipal use. Adjustments to the second tier ranking system included eliminating proximity to powerlines, as this was not a limiting factor based on objectives, and the incorporation of regional hydraulic gradients and aquifer thicknesses [34] into the ranking scheme increased confidence in the assessment. Additionally, the scale of the study area necessitated the removal of the weighting and normalization of polygons within GIS. The ranking of sites resulted in percentages of suitability at 88 discrete locations. Results showed 54% of sites maintain the proper criteria suited for ASR.
Sinclair, Knight, and Merz [36] conducted a feasibility study into the technical viability of ASR in Australia’s North Wyndham Vale, Ravenhall, and Royal Park region. Their assessment included understanding the feasibility of target aquifers, relevant regulatory factors, an environmental management evaluation, and a risk assessment. Results of the study identified locations where risk of potential groundwater contamination from industrial pollution is high, where potential sites may have low storage capacities, and where sites exist that might be suitable for small to medium scale ASR projects.
Ahani Amineh et al. [32] conducted an MCDA, based upon nine ASR metrics, to delineate areas suitable for artificial recharge in a 69,300 km2 area within the Hamon-Jazmoorian plain of southeast Iran. The nine metrics included proximity to demand, groundwater and surface water quality, construction cost, operating cost, transmissivity, water demand, storage, and source water availability. After applying an Analytical Hierarchy Process and assigning weighted criteria, an overlay method in GIS produced maps of suitability, with the basin showing 3% as very suitable and 31% potentially suitable for artificial recharge projects.
Quantitatively evaluating aquifer recharge tends to necessitate the development of groundwater flow and transport models [37], which limit study sites to local scales and are computationally intensive. Smith and Pollack [38] reduced computational time by applying the Glover equation to estimate hydraulic loads through the use of an ensemble of local models based on lumped parameters derived from regional datasets within GIS. Although the results provided spatial estimates of attainable hydraulic loads along a 5334 km2 portion of Perth’s surficial aquifer in Australia, it required a spatial dataset that included ground surface elevation, mean water table depth, and basement depth. Ward et al. [39] developed a predictive framework using dimensionless values representing lateral flow, dispersive mixing, mixed convection, and free convection for ASR injection within brackish aquifers. While their method reduced the need for numerical modeling, it required knowledge of average vertical and horizontal hydraulic conductivities, density of ambient and injected water, aquifer thickness, and hydraulic gradient. Bakker et al. [40] developed a numerical solution for the recovery efficiency of a fully penetrating ASR well in a saltwater aquifer. Results were based on average horizontal hydraulic conductivity, aquifer thickness, and density differences between injected and ambient groundwater.
A major drawback to regional assessments is that regional data becomes sparse with an increase in areal extent [41]. The methods that are presented in this case study allowed for the rapid assessment of ASR suitability in Washington, USA.
2. Study Area
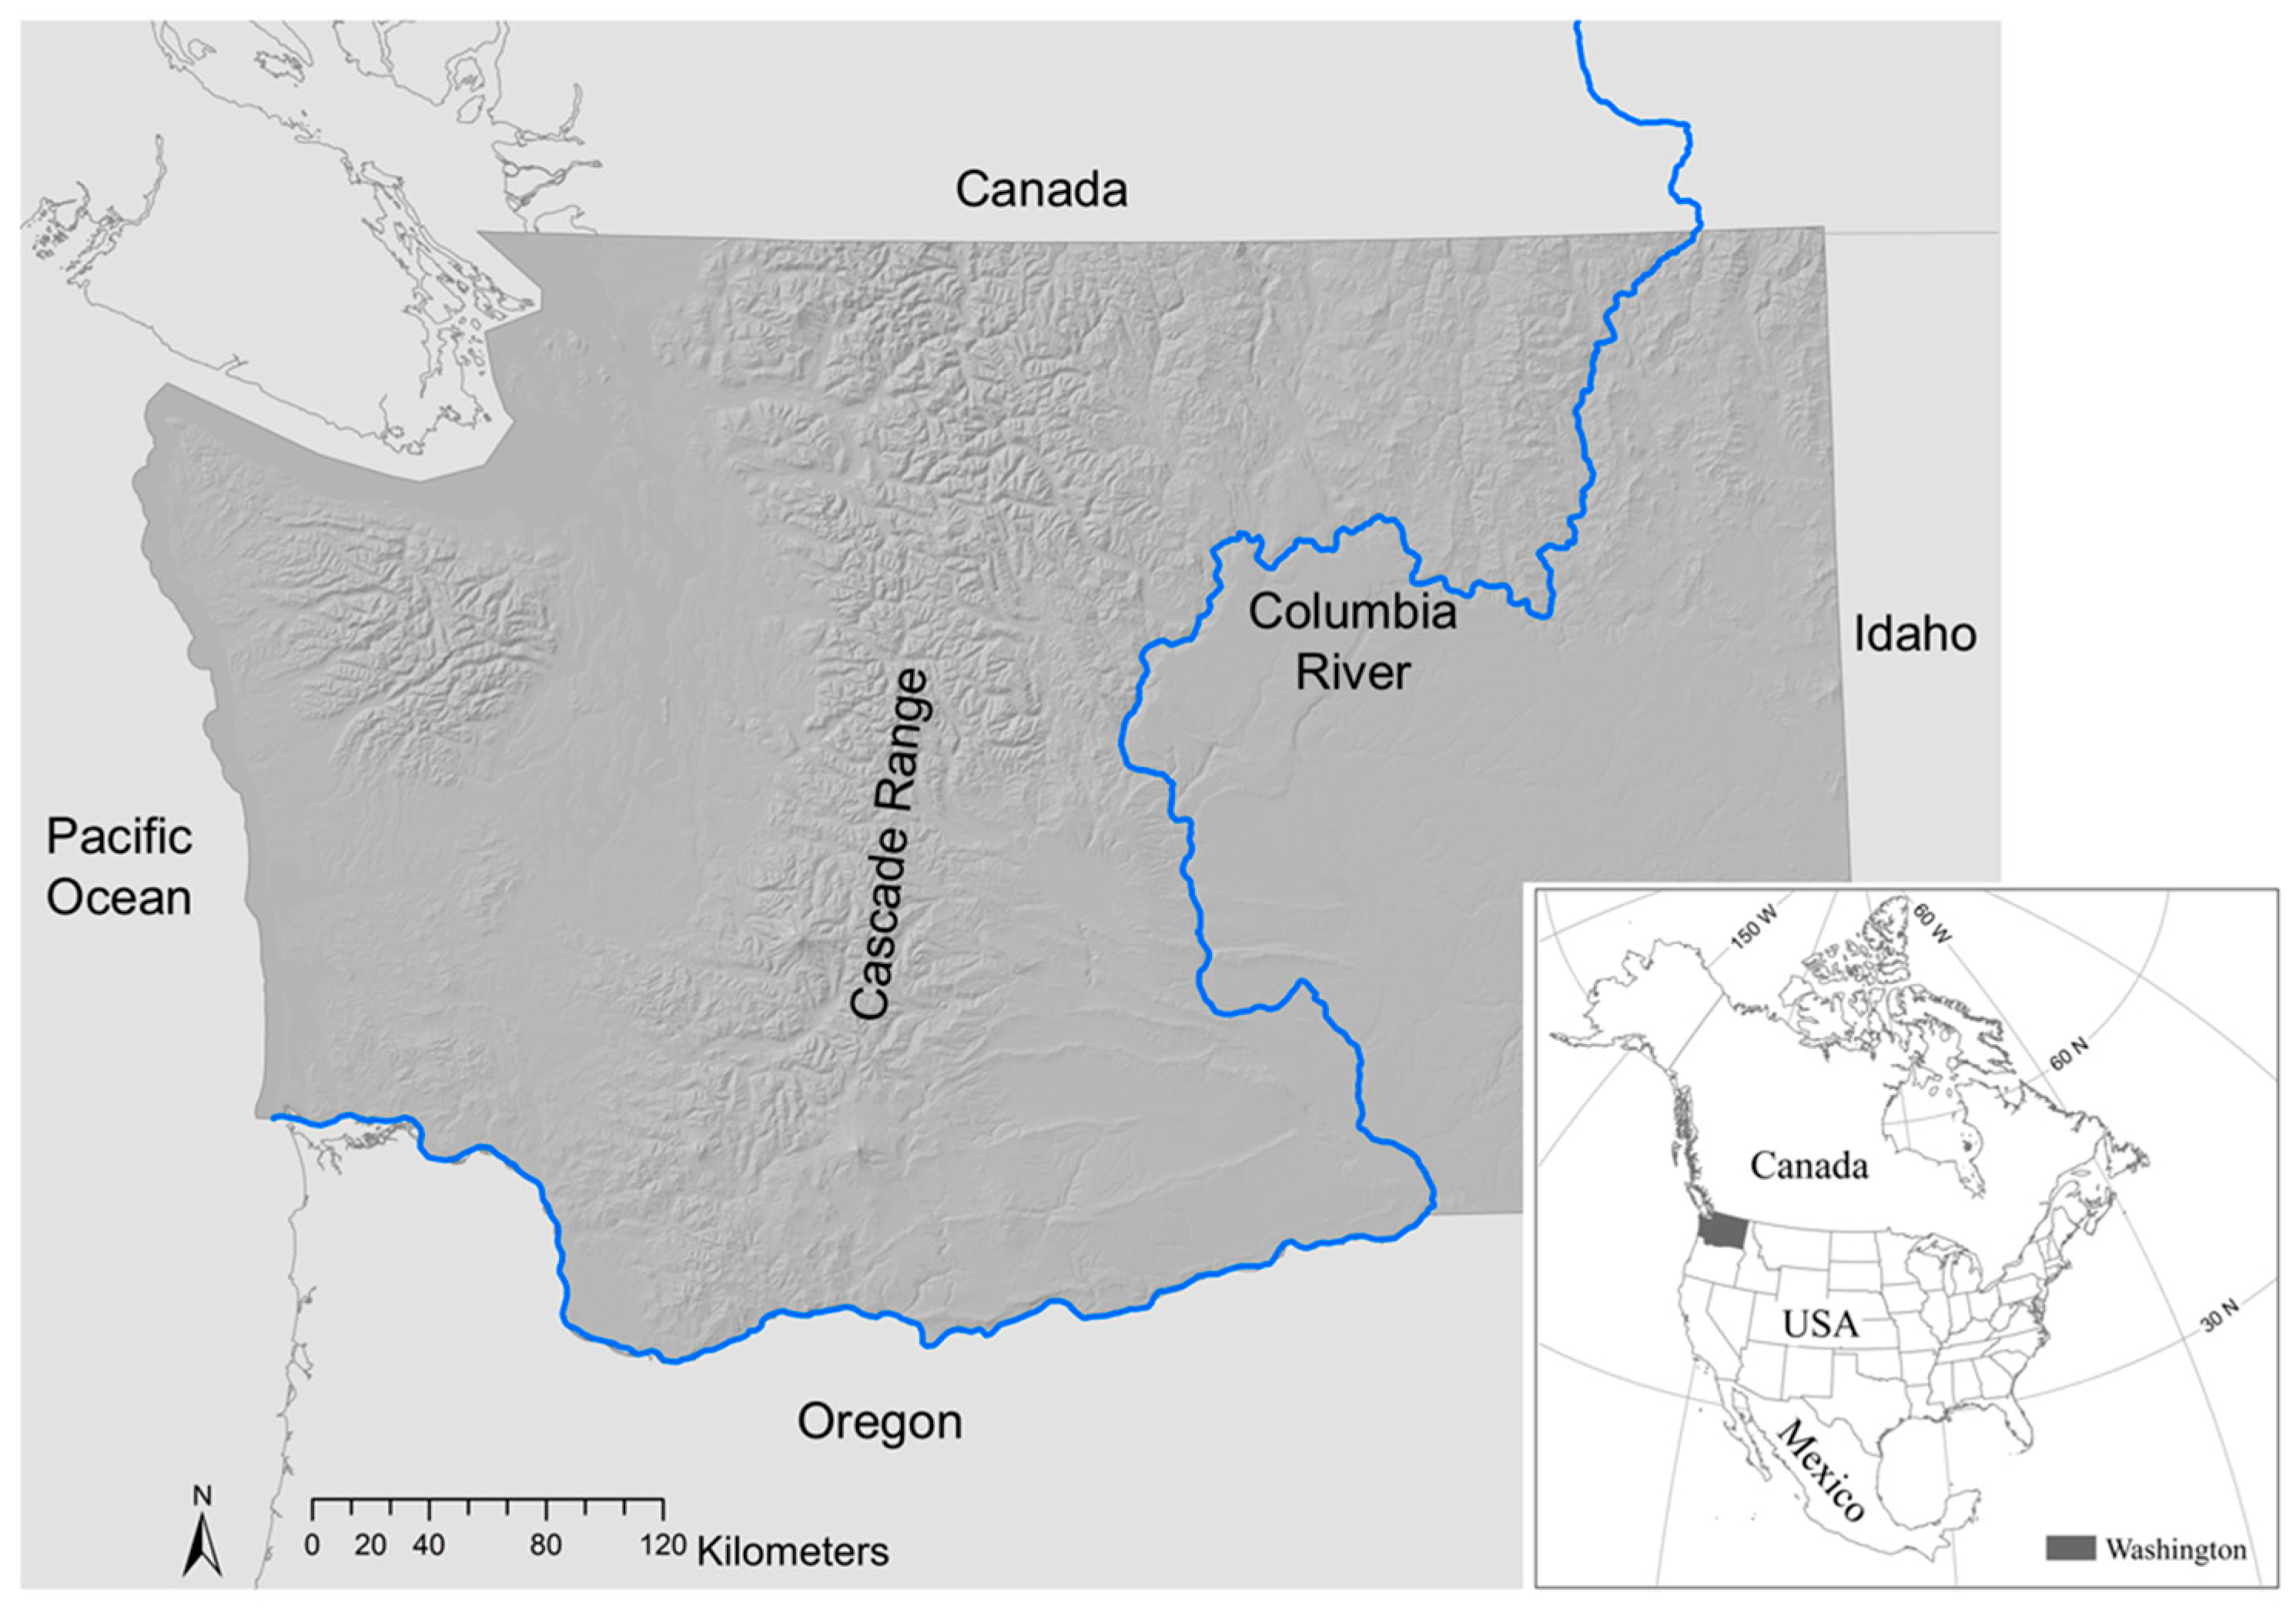
Washington covers an area of 185,000 km2 and is the northwestern most state within the contiguous USA (Figure 1). Seven million people populate the state of Washington. Annually, Lane [42] reported that total freshwater withdrawals are met by surface water (71%) and groundwater (29%). The state’s average annual precipitation is approximately 1000 mm per year, occurring mostly in winter, with distinct spatial variability in precipitation generally shaped by the Cascade Range. Annual precipitation typically does not exceed 1300 mm east of the mountain range, while precipitation in excess of 2000 mm can occur along its spine and throughout many western locations [43].
The Columbia River (Figure 1) is the largest river in Washington, and it is a transboundary resource utilized by Canada and the United States, within the confines of the 1964 Columbia River Treaty. It is also the largest producer of hydroelectricity in North America [44], and is a dividing boundary between Washington and Oregon.
Washington has three distinct surface flow regimes: snow-dominated, rain-dominated, and a mix of rain and snow watersheds [45]. Characterized by wintertime snowpack storage and late springtime runoff, most of the state’s snow-dominated watersheds are in the Cascade Range. Annual precipitation averages are expected to remain constant, however, future climatic predictions indicate significant atrophy of the Cascade Range snowpack. Alterations in the type and timing of precipitation are anticipated due to an increase in rain-on-snow events, which will likely alter peak surface flows. Timing of surface flows are predicted to occur earlier in the year causing a deficit in historical springtime runoff and summertime water availability [46]. Although less snowfall and more rainfall will likely keep annual precipitation amounts constant, demand, which is greatest in summer, will likely continue, while precipitation is at its lowest [47].
In western Washington, historically rain-dominated watersheds support the region west of the Cascade Range. In addition, seventy percent of the state’s population lives in the Puget Sound area (Figure 2), where warm sea surface temperatures in winter and opposing temperatures in the summer regulate local weather conditions and produce climatic maritime patterns. Watersheds within the Puget Sound are generally rain-dominated due to the prevailing westerly winds, which release the majority of precipitation through orographic lift when warm, humid air rises up the Cascade Range. As dry air descends the eastern slopes of the range, the rain shadow effect results in semi-arid to arid climate conditions along the eastern stretch of the range, and produces mix rain and snow watersheds that govern most of the area’s surface flow regimes.
Two principal aquifers dominate the state: the Puget Sound Lowlands and the Columbia River aquifer system. Puget Sound overlies the Puget Sound Lowlands aquifer [48] (Figure 2). The Puget Sound Lowlands aquifer is located in the forearc basin of the Cascadia Subduction Zone, which is a tectonically active region resulting from the convergence of the Juan de Fuca and North American plates. The Lowlands are largely comprised of Quaternary sedimentary basins, which were carved out during the last glacial maximum [49]. The aquifer consists of an upper unconfined to semi-confined layer of outwash and proglacial deposits. The lower confined unit, which is found at depths greater than 45 m, is formed by undifferentiated glacial and interglacial deposits and is not heavily utilized for water resource purposes [48].
In eastern Washington, the principal aquifer is the Columbia River aquifer system (Figure 2), located within the Columbia River Plateau. Formed by the Columbia River Basalt Group (CRBG), it contains more than 300 Miocene-age continental flood basalt sheet flows up to 3000 m thick. The CRBG is overlain by Quaternary sediments and unconformably underlain by Pre-Tertiary rocks [50]. Groundwater in the Columbia River aquifer system moves mostly within laterally extensive, stacked interflow zones located at the top and bottom of individual basalt flows, which act as aquitards. Water use is primarily from irrigation for agricultural purposes. Groundwater withdrawals are generally met by the Columbia River aquifer system, and surface water withdrawals are obtained from tributaries along the Columbia and Snake River.
2.1. Water Rights in Washington
In Washington, “all waters within the state belong to the public and are subject to existing rights”. The Water Code, officially enacted in 1917, follows the prior appropriation doctrine of “first in time, first in right”. Adoption of the 1945 Groundwater Code provided statutes to regulate and appropriate public groundwater within the state, based on a priority system; however, priority is given to surface water right holders when their water right is considered hydraulically connected to groundwater sources [51].
2.2. Washington Watershed Boundaries
In 1971, under the Water Resources Act [52], the state’s natural resource agencies delineated 62 watersheds, known as Water Resource Inventory Areas (WRIA), for use in administrative and planning purposes. The WRIAs are federally-designated natural watershed classifications, but they do not extend beyond state boarders (Figure 2).
2.3. Washington ASR Regulatory Framework
In the state of Washington, ASR projects have been legally possible since 1945, when the state enacted the public’s first groundwater code. Authorization to recover managed recharge groundwater, present from uncontrolled leakage from irrigation canals, was obtained through the creation of groundwater management sub-areas. A few sub-areas were established, although the process to create sub-areas and to obtain access to stored water was quite cumbersome and not well suited to individual ASR projects. A new process to permit ASR began in 2000, when the state legislation expanded the definition of ‘reservoir’ to include “any naturally occurring underground geological formation where water is collected and stored for the subsequent use as part of an underground artificial storage and recovery project.” The state defines ASR as projects that add water to underground geologic formations for subsequent beneficial use. Managed recharge methods under the reservoir permitting structure includes surface spreading and infiltration, the use of injection wells, or any state-approved method [53].
2.3.1. Reservoir Application Process
The application process for a reservoir permit [53] requires a description of the hydrogeologic system, operational plan, legal framework, environmental assessment, monitoring plan, and when necessary, a descriptive mitigation plan. The hydrogeologic system or model must characterize the hydrogeology, compatibility of injected water with ambient conditions, the proximity to natural hazards, and locations of streams, springs, creeks, or rivers that are affected by a proposed ASR project. An operational plan provides estimates of source water quality and availability, injection and withdrawal rates, storage duration, proposed site locations, water treatment compliance, and other parameters required for discharging or suspended sediments from ASR well. The legal framework requires documentation of water rights used for source water storage, a list of all water rights within the project area, proximity to instream flow diversion points and stream closures, plus ownership of operating facilities used for a planned project. The environmental assessment is a description of historical or existing wetland habitats, flood plains, and proximity to contaminated areas, in addition to descriptions of slope stability, wetland habitat, ground deformation, and surface water bodies. A monitoring plan is implemented during the pilot and operational phase to evaluate and verify assumptions within the hydrogeologic conceptual model. When a mitigation plan is necessary, a licensed engineer must describe actions that will be taken to prevent adverse impacts to the environment, including a description of the methods and evaluations of each measurement.
2.3.2. ASR Authorization and Process
To obtain authorization [53] for an ASR project, a reservoir permit, water rights, compliance with EPA regulations, and possibly a discharge permit is required. Generally, two water right permits are required for a reservoir application. The first allows for the introduction of non-native water to the reservoir, and the second permit grants recovery of stored water. For applicants with a water right with no change to the proposed end use of the stored water, then a secondary permit is not required. For projects that do not require an applicant to obtain a new water right, then the state may grant priority processing, which allows for expedited assistance and permitting during project initiation.
2.3.3. Water Quality Requirements
Injection water must meet state groundwater quality standards according to the antidegradation policy of the water quality standards for ground waters of the state of Washington. Therefore, if groundwater meets drinking water standards, injected water must be at least of the same quality. All ASR wells must be registered with the US Environmental Protection Agency as Class V non-hazardous injection wells of the Underground Injection Control Program, in addition injection water is federally regulated to meet drinking water standards [53].
3. Methods
A scoring system and an analytical method were created for this study to assess ASR suitability throughout the state of Washington. The site scoring system was developed to provide a percentage of total suitability at each location. An analytical method was produced to estimate hydrogeologic properties of each water well under a range of designated injection rate scenarios and to provide overall estimations of cumulative injection capacity.
3.1. Site Scoring System
The site scoring system was developed to identify suitable locations based on ASR metrics relevant at different scales. To obtain a percent of total suitability, a scoring scheme based on a combination of metrics was calculated at each location. Metrics that are used in local scale assessments generally overlap with regional suitability assessments, but decrease as the scale increases (Figure 3). Therefore, a combination of ASR metrics were scored to estimate suitability and to reflect adjustments in scale (Figure 3).
The site scoring system allowed for the calculation of suitability at 284 discrete locations throughout Washington’s WRIAs. The locations were determined from a statewide water well selection process. Each location was scored based on metrics classified within three subcategories: hydrogeologic properties, regulatory influences, and operational considerations.
For statewide estimation of ASR suitability, cumulative scores of the three subcategories were calculated and divided by total possible points, resulting in a total percent of ASR suitability. Each subcategory was also individually scored. The subcategory and their respective metrics included the following: hydrogeologic properties—scores for transmissivity, regional hydraulic gradient, and optimal storage thickness were assigned. Metrics within the operational considerations subcategory included well density, distance to source water, recharge water quality, and ambient water quality. Percent of suitability for regulatory influences included threatened and endangered species and predicted water exceeds demand (Figure 4).
3.1.1. Water Well Selection Process
An extensive search for water well logs within each WRIA was requested through Washington State Department of Ecology [54] online well log database. The well log data tables were downloaded in comma-separated values format, uploaded into ArcGIS, and converted into shapefiles. Due to the assumption that source water greater than 5 km distant is cost prohibitive [31,34], only water wells located within a 5 km buffered radius of major streams and fresh water bodies passed the initial evaluation. Attribute tables containing thousands of water wells that passed this phase were imported into a Microsoft Excel spreadsheet, and each well log was examined for the following information: well depth, static water level, open interval or screen length, yield rate, drawdown depth, drawdown time, and recorded lithology. At the conclusion of the well selection process, 284 water wells were identified as having the required information (Figure 5).
3.1.2. Hydrogeologic Properties
Understanding hydrogeologic properties is paramount to predicting ASR suitability. Estimating hydraulic load on an aquifer system from injection wells is dependent upon many of the aquifer’s properties, including transmissivity, regional gradient, and geometry [55]. However, undertaking a statewide ASR assessment presents challenges when on-site field investigations are prohibitive due to cost or other constraints. Therefore, transmissivity, regional hydraulic gradient, and optimal storage thickness were chosen as suitable indicators.
Transmissivity characterizes the ability of the aquifer to transmit water through its entire thickness. Aquifers with transmissivities assumed inadequate to accommodate additional storage space were considered unsuitable based on the assumed induced high pressures sustained during injection [34]. Brown determined a range between 500 to 2300 m2 per day was sufficient to support ASR storage. Transmissivity scores were calculated as follows: if T was less than 500 m2 per day or greater than 2300 m2 per day a score of 0 was assigned; if T was determined to be between 500 m2 to 2300 m2 per day, then a score of 2 was assigned. Transmissivity values were determined from available data or calculated using the Razack and Huntley (1991) [56] method.
It has been shown that the regional hydraulic gradient is important to the recovery potential of injected water [34,37,57]. To reduce the effects of injected water moving away from the recharge zone, shallow regional horizontal hydraulic gradients less than or equal to 0.01 were considered to be most suitable for ASR [34]. Therefore, a score of 0 was given to steep gradients (greater than 0.01), a score of 1 was assigned to moderate gradients (between 0.01 and 0.001), and a score of 2 was given to shallow gradients (less than 0.001). Values of horizontal hydraulic gradients were obtained through the available literature.
Optimum storage zone thickness of 8 m was assumed suitable for ASR [30,34], as excessive recharge can fracture overlying layers within confined aquifers, or injected water may reach ground surface causing groundwater flooding within unconfined aquifers. Storage zone thickness was obtained from well logs and was based on the maximum thickness of a water-bearing zone. Water wells with zones less than 8 m scored 0, and water wells with water bearing zones equal to or greater than 8 m scored a 2.
3.1.3. Operational Considerations
Incorporating a regional assessment of operational considerations allowed for the identification of potential locations impacted by local well density, recharge water quality, ambient groundwater quality, and distance to source water.
Water wells in close proximity to injection wells may capture stored water if residual pressure dissipates during injection or the injection bubble migrates away from the ASR well. If more than five wells within the same formation were located within a 1.6 km radius of a study well, then a score of 0 was given. Study wells located near 1 to 5 wells scored 1, and water wells in compete isolation from other wells scored 2.
Regional suitability assessment of ASR prohibited in-depth analysis of water quality. As water quality constraints are highly site-specific and require extensive research, suitability was based on the extent to which groundwater and surface water met drinking water standard. A score of 0 indicated no water quality standards were met, a score of 1 meant some water quality standards were met, and a score of 2 indicated that all of the water quality standards were met. Additionally, a water well earned a score of 2 if it was determined the study well was operated by a water distributor and located within close proximity to a water treatment facility, thereby indicating the potential for treatment prior to injection. Although improving the quality of groundwater is not feasible, density differences between injected and ambient groundwater may still be good candidates for ASR [30], and were not immediately dismissed from the study. Study wells identified as Group B water systems in Washington’s Department of Health [58] state database, earned a score of 2, if water from the well was not treated prior to distribution, as it was assumed all of the water quality standards were met.
Financial infrastructure concerns exist when constructing an ASR scheme to support meeting future and current water demands [8]. Due to economic constraints that were induced by water conveyance costs [31], wells located beyond a 5 km radius from source water were eliminated from examination. Scores for study wells were derived based on proximity of source water to the study well: source water between a 1.5 to 5 km radius received a score of 1, and wells closer than a 1.5 km radius to source water received a score of 2.
3.1.4. Regulatory Influences
Regulatory influences are subjective and difficult to assess regionally. The use of two criteria, with regionally available data, was identified to produce meaningful results. Therefore, regulatory influences were subdivided into threatened and endangered species, and predicted water supply exceeds demand.
In 1999, the ‘Washington Statewide Strategy to Recover Salmon’ identified 16 watersheds [59,60] where flows were considered too over-appropriated to support fish populations. Unnatural flow conditions create inhospitable environments for salmon and other aquatic species [61]. Many watersheds are over-appropriated and natural flows are unable to meet state allocated requirements [60]. Regulating flow conditions to restore fish habitat is further complicated by the upstream migration of salmon, which typically coincide with peak irrigation demand; conversely, high flow conditions can disrupt the incubation of salmonids in the wintertime [61]. Hence, any perturbations to natural flows were assumed to cause a disturbance to fish within a fish-critical basin. Therefore, study wells within fish-critical basins scored a 0. A score of 1 was given if an ASR project could potentially affect threatened or endangered species in all other basins, and a score of 2 was given if an ASR project was determined to not impact flows. Individual scores were based on sources that were identified within their respective watershed.
Monthly surface water supply, surface water irrigation demand, and municipal demand were modeled for year 2030 in 33 WRIAs [62]. Examination of forecasts for surface water supply in year 2030 compared against historical flows were used to determine the likelihood an average year supply exceeds demand for at least four out of five winter months (November through March), as it was assumed injection of excessive runoff could occur during this time. For WRIAs within the modeled area, a score of 0 was assigned if demand exceeded supply for four out of five winter months, and a score of 2 was given if supply exceeded demand during this time.
3.2. Water Well Suitability
The second method estimates ASR suitability from aquifer hydraulic properties using the Theis (1935) [63] and Cooper–Jacob (1946) approximation [64]. Using hydraulic parameters obtained from water well logs, the following method was applied to predict water level response to recharge [4]:
W(u) is the well function (dimensionless), T is transmissivity (L2/t), Q is the injection rate (L3/t), S is storativity (dimensionless), r is well radius (L), t is time, ho is initial uniform head (L), and hw is the hydraulic head due to injection (L). Since this is an injection problem the left-hand side of (1) will be positive. Cooper and Jacob (1946) [64] determined that for large values of t and/or small values of r, u is very small and the Theis equation simplifies to the following:
where, QD is the designated injection rate. To understand groundwater response to injection, the following water well suitability was calculated for each well (Figure 6):
where DSWL is the depth to static water level below ground surface (L). Due to regional data constraints, a storage coefficient (S) of 0.01, an average well radius (r) of 19.7 cm [65], and an injection time (t) of 90 days per year were assumed for all of the wells. The 90-day injection period represents capturing three months of wintertime surface flows when obtaining water rights are most flexible. Transmissivities (T) were calculated from specific capacity obtained from well log data. Desired injection rates (QD) ranging from 50 to 500 Ls−1 were chosen to determine a series of groundwater response to recharge, as ASR wells operating in Washington inject at rates within this range. Well suitability greater than or equal to 1 indicated that the hydrogeologic conditions of the aquifer would accommodate the desired injection rate. A result of less than 1 indicated the injection rate would cause the potentiometric surface to rise above the ground surface before 90 days (Figure 6). An aquifer of uniform thickness, confined, horizontal, homogeneous, and of infinite extent was assumed, and well losses were negligible.
To estimate the potential injection capacity, water well suitability was constrained to a value of 1 for each well. Maximum injection rates varied depending upon individual hydraulic variables, rather than assigned injection rates (QD). The cumulative estimates of potential injection capacity were calculated at each well, within each WRIA, and at the state level.
4. Results and Discussion
Assessing ASR suitability on a regional scale provided approximation and locality of statewide expansion. Two hundred and eighty-four wells in 62 watersheds within Washington, USA were evaluated for suitability. Two methods were utilized to conduct the assessment. A qualitative site scoring system was used to estimate variables that affect ASR suitability based on relevant metrics. A qualitative water well stability method was developed to calculate hydrogeologic properties to estimate changes in water level response to injection and potential injection rates.
4.1. Site Scoring System
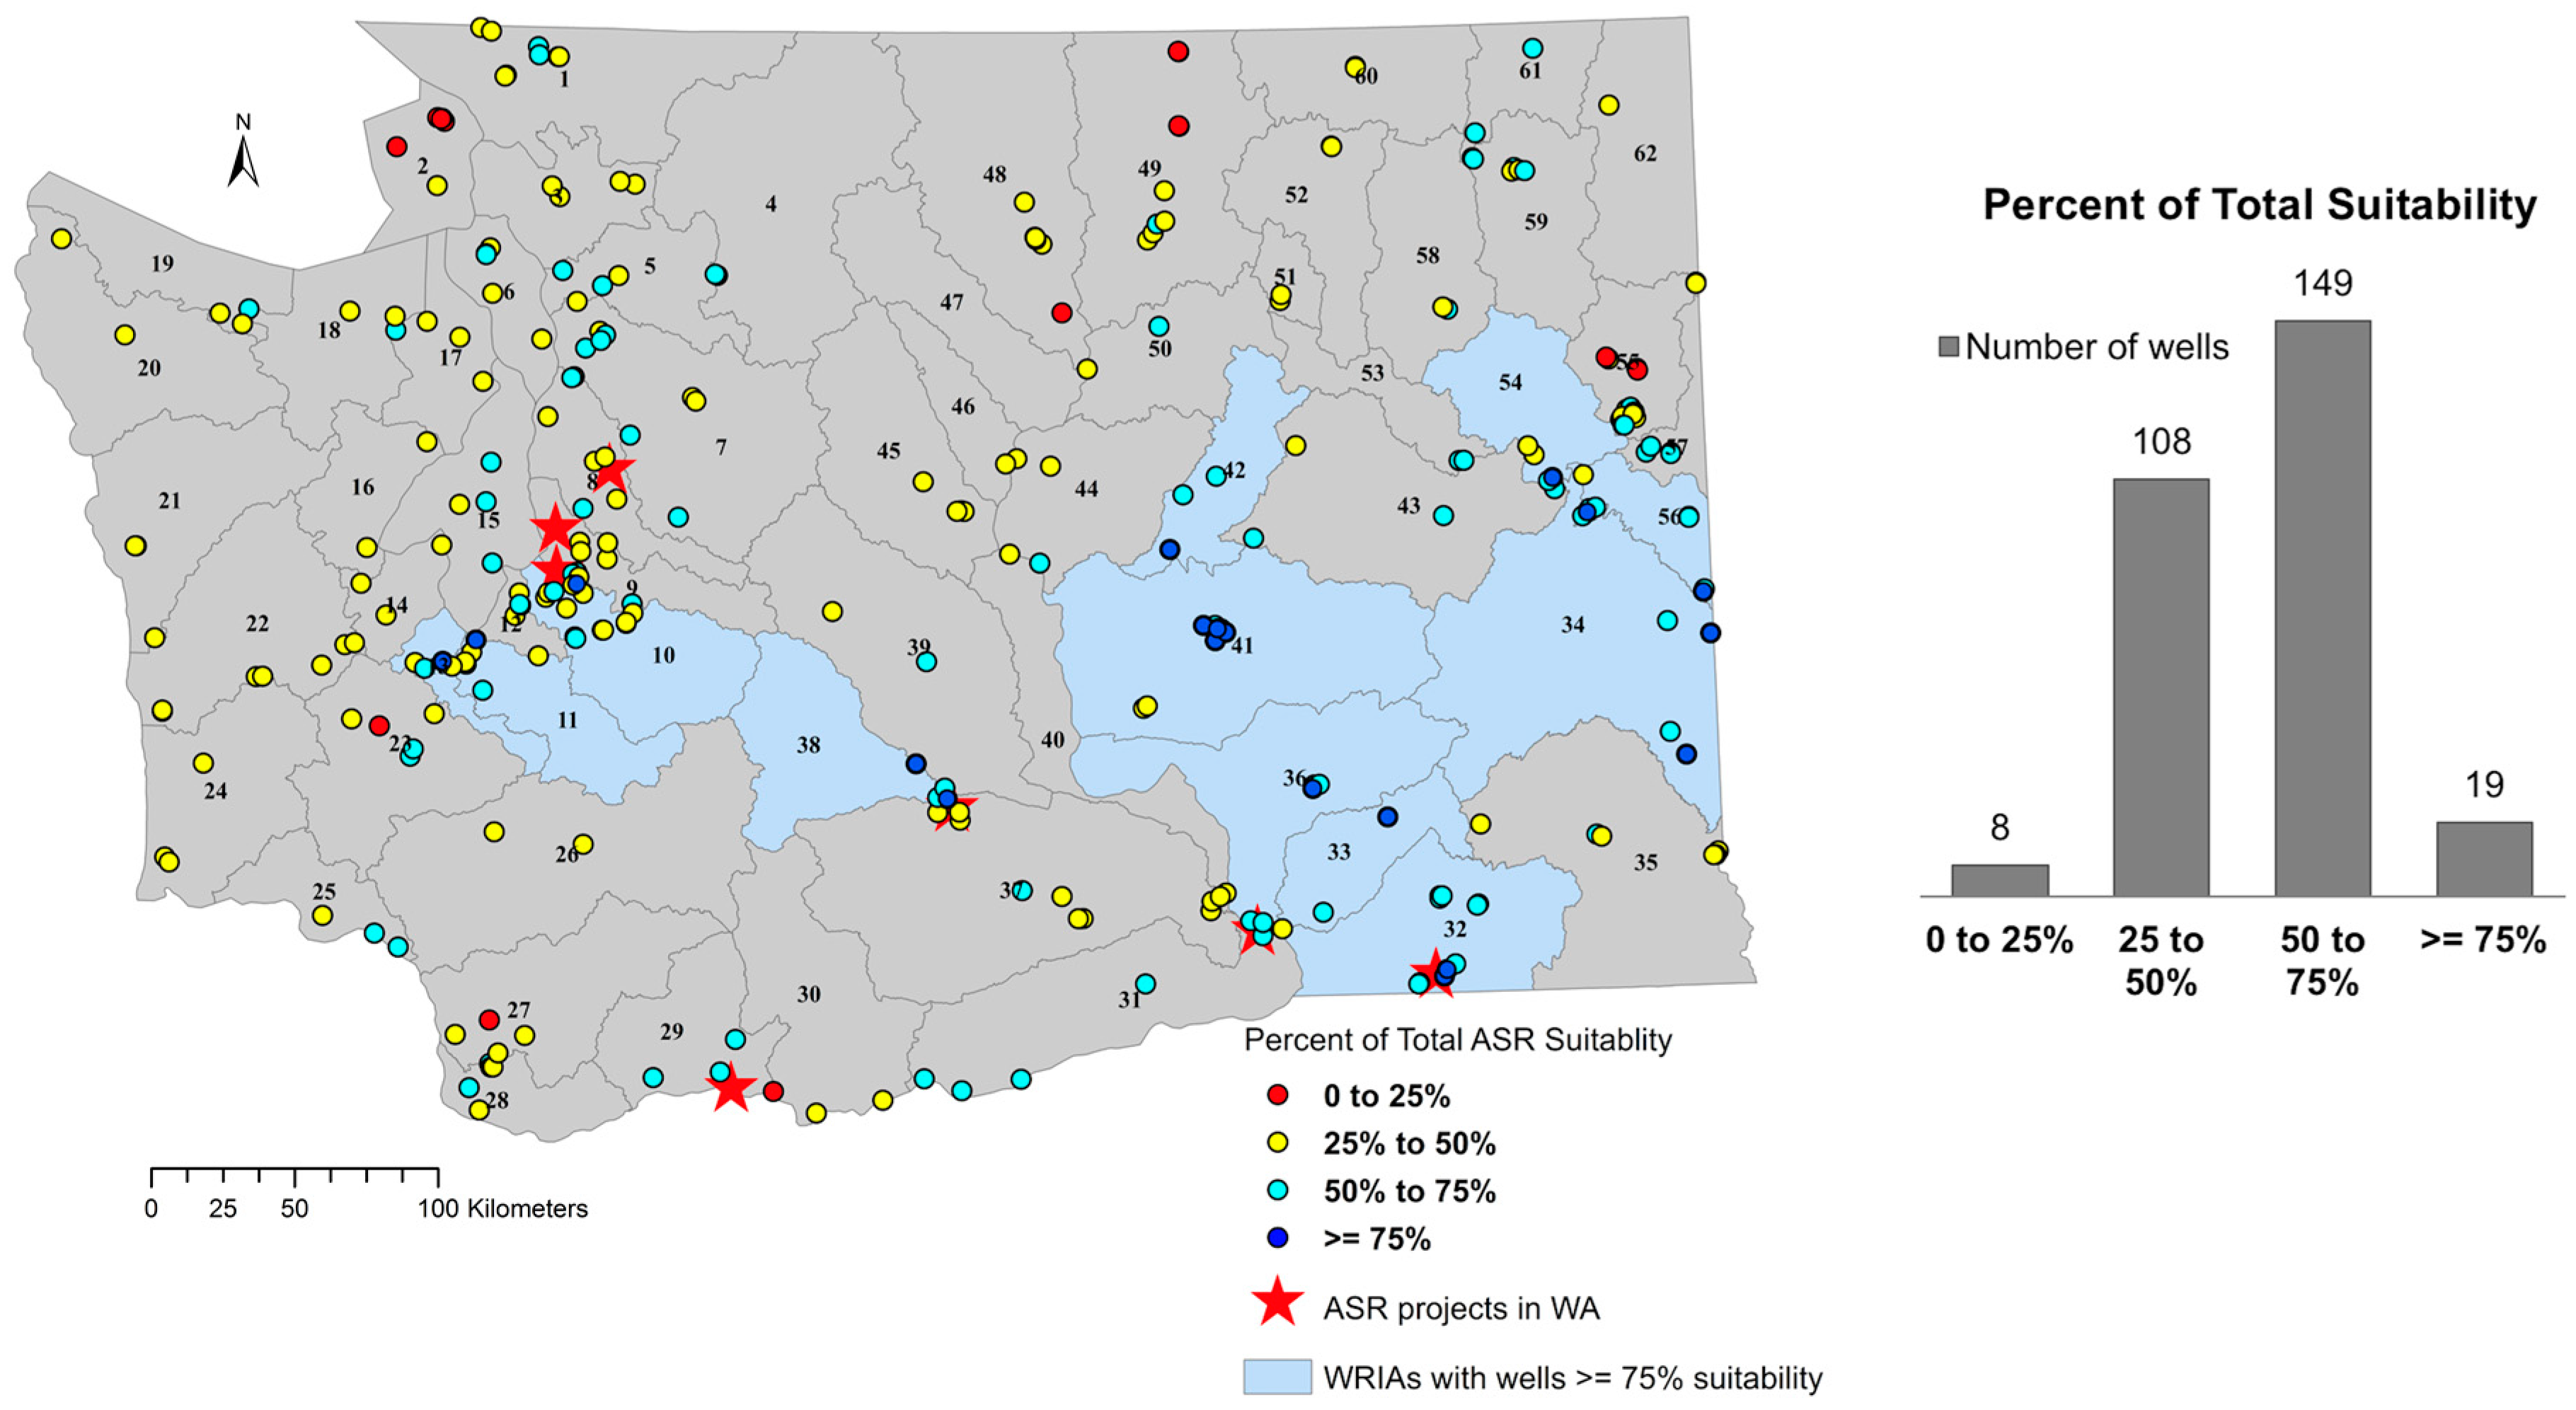
Of the 284 wells surveyed, 149 water wells have at least 50 to 75% of the metrics considered suitable for ASR development, with 19 water wells in 12 WRIAs have greater than 75% of total ASR suitability (Figure 7).
Subcatagory Results
As for each subcategory, 169 water wells meet 50% of operational considerations, 68% meet at least 50% of hydrogeologic considerations, and 62% meet at least 50% of the regulatory influences suitable for ASR (Figure 8).
The greatest statewide impact to ASR suitability is the well density metric within the operational considerations subcategory. Only 33 percent of wells surveyed are sufficiently isolated from local wells. Isolation indicates the vulnerably of local wells capturing injected water. The greatest influence on the regulatory influences subcategory is the predicted water supply exceeds demand metric. Of the 154 wells with data, 66% are in WRIAs determined to sustain excess flows for at least four winter months. This is a significant forecast, as these wells lie within the eastern portion of the state, which are the driest WRIAs and most water is over-appropriated, yet capturing excess runoff for injection is predicted to be possible through year 2030. Within the hydrogeologic properties subcategory, the optimal storage thickness metric indicates 57% of wells indicate aquifer thicknesses suitable for ASR.
4.2. Water Well Suitability
4.2.1. Desired Injection Rate
A water well suitability value was calculated for each well using desired injection rates of 50 to 500 Ls−1. Aquifer transmissivities ranged from fewer than 10 m2 per day to over 5000 m2 per day. With a desired injection rate of 50 Ls−1, 150 wells are considered to be suitable for ASR, which suggests that water level response to injection would not exceed ground surface. The cumulative seasonal injection rate of the 150 suitable wells was estimated to provide 648 ML per day of added storage (Figure 9). At a desired injection rate of 500 Ls−1, 33 wells are identified as suitable for ASR, with an estimated cumulative injection rate of over 1400 ML per day (Figure 9).
4.2.2. Potential Injection Capacity
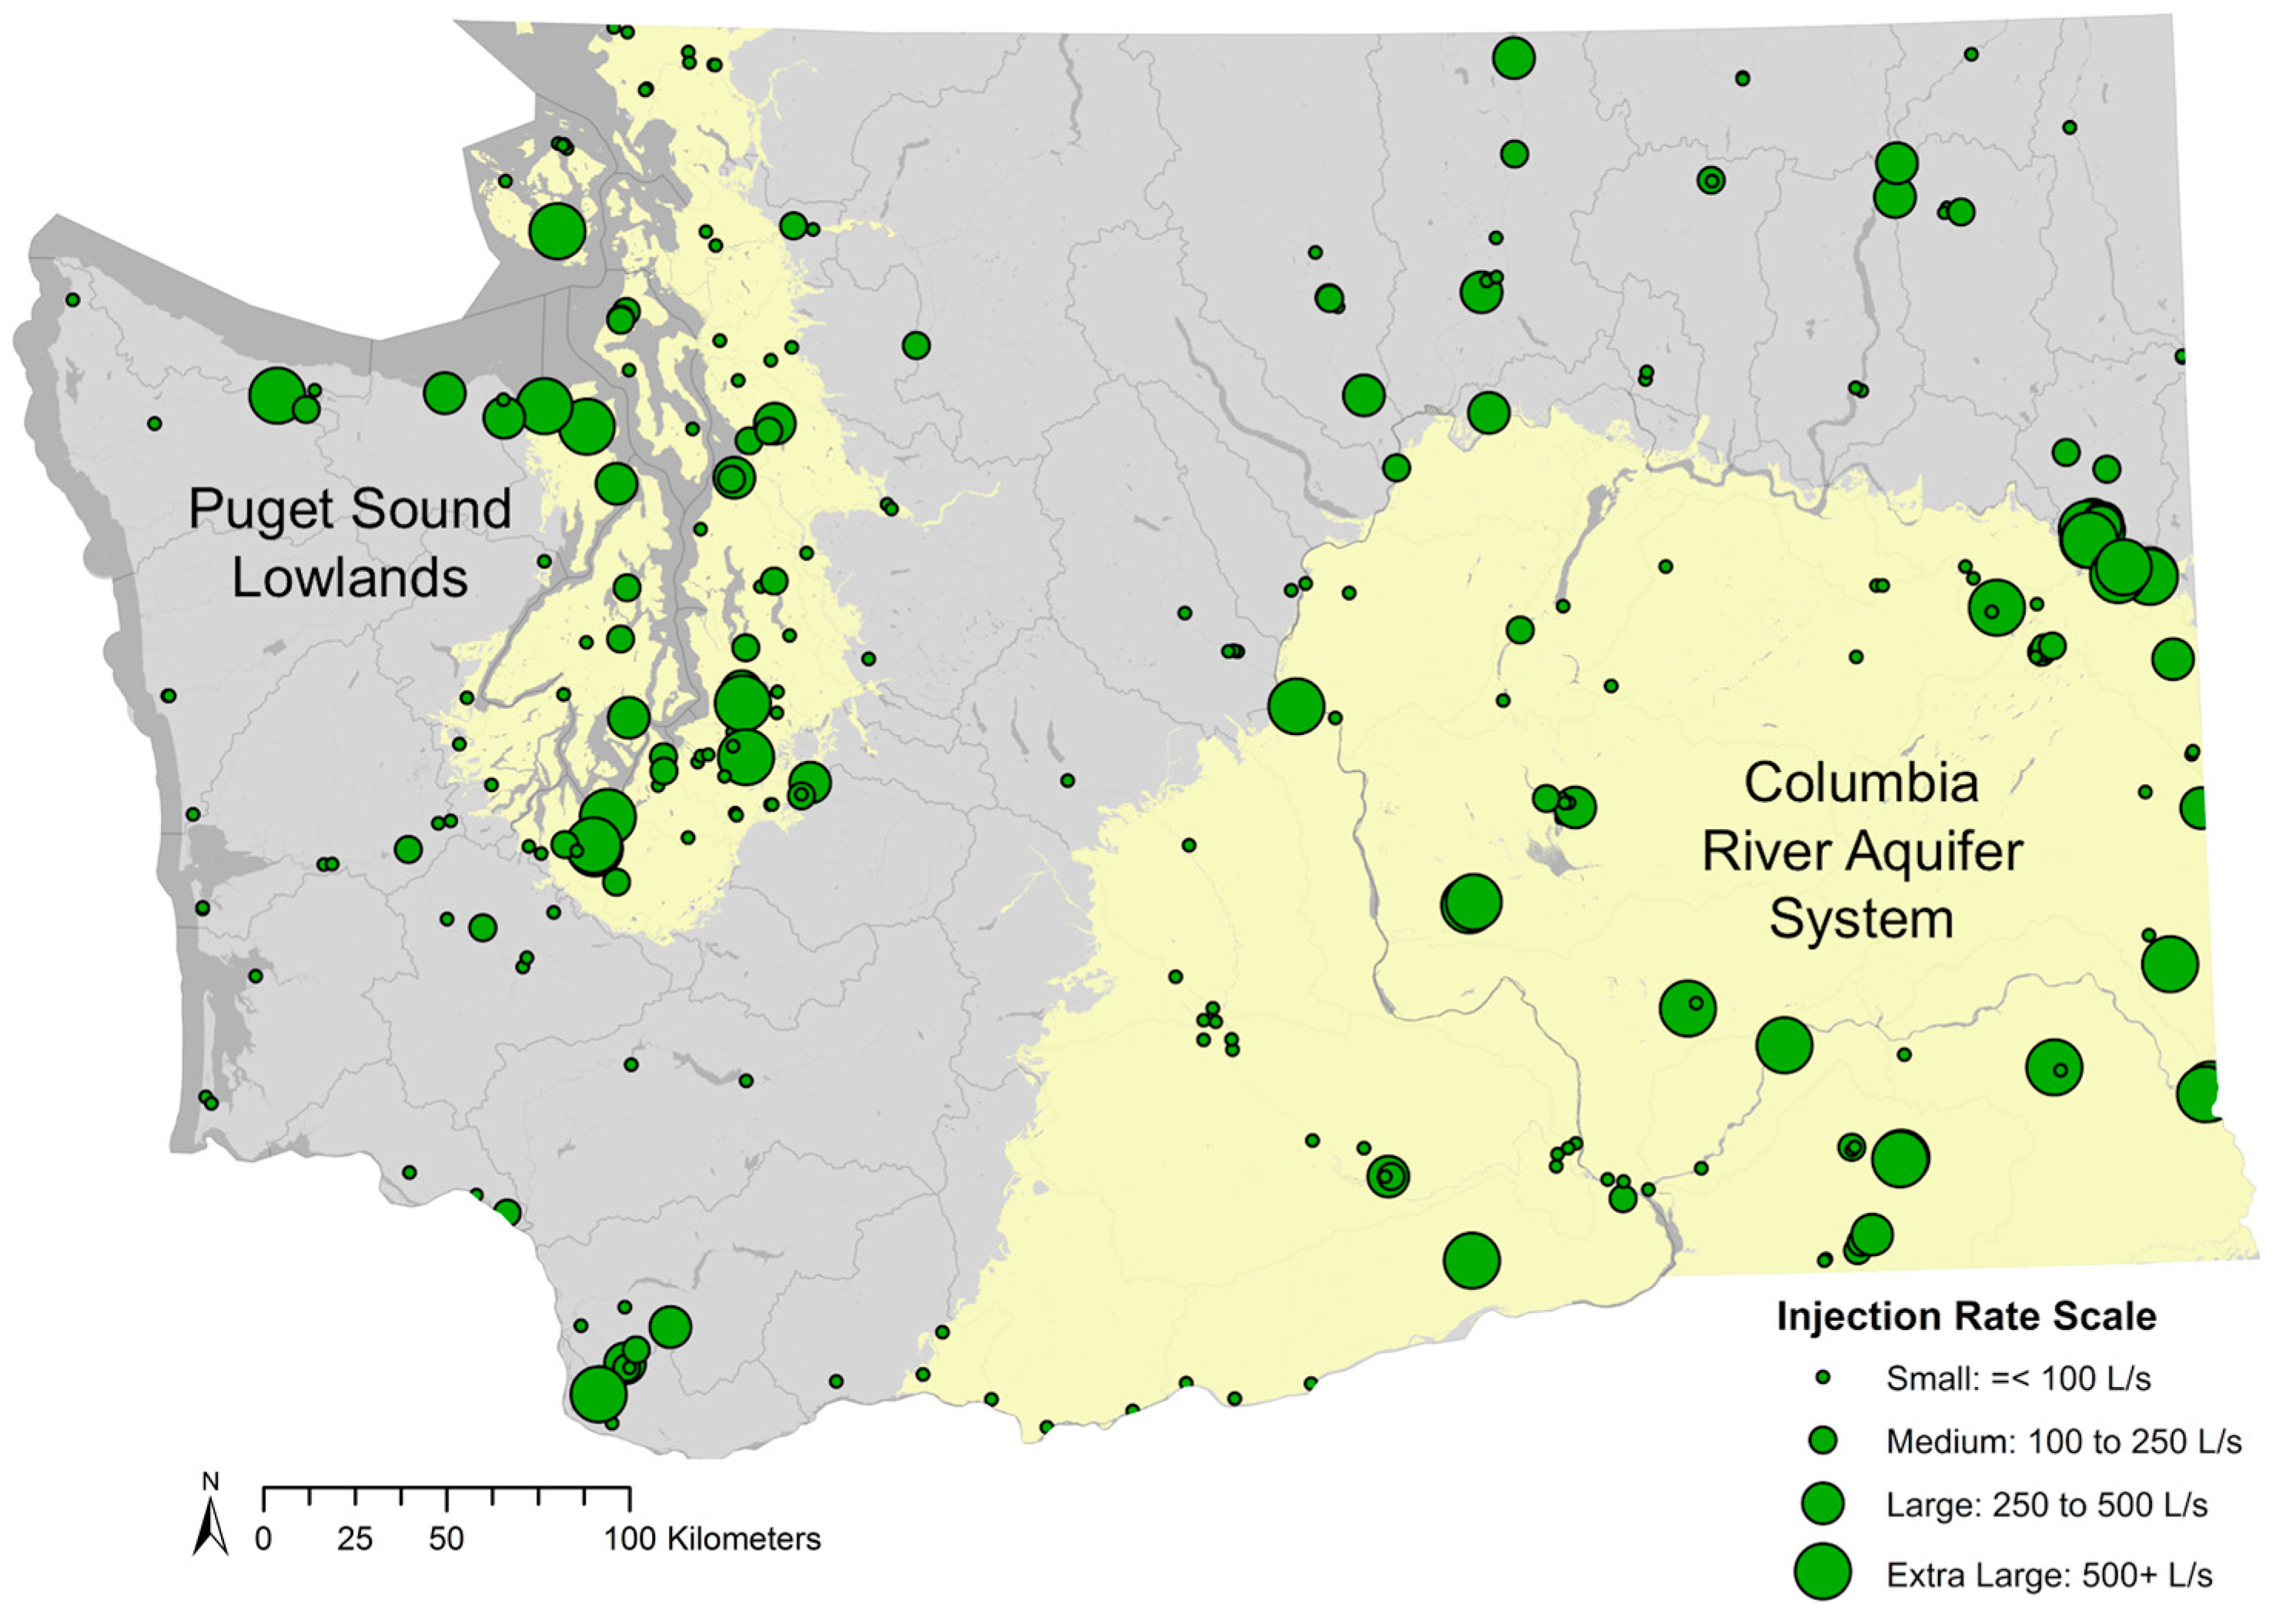
Constraining the water well suitability value to 1 allows for the estimation of potential injection capacity per well and cumulative statewide potential for ASR. Scaling results were assigned to represent capacity at each well. A scale of small (less than or equal to 100 Ls−1), medium (100 to 250 Ls−1), large (250 to 500 Ls−1), and extra-large (over 500 Ls−1) were assigned, and are spatially represented in Figure 10. Results from potential injection capacity indicate statewide potential for ASR, based on all 284 water wells, exceeds 6500 ML per day.
4.2.3. Assessment of Principal Aquifers in Washington
Two primary aquifers—the Fraser and Puget aquifer—are delineated within the Puget Sound Lowlands [48]. The Fraser aquifer is unconfined to semi-confined glacial outwash, which is the target aquifer for municipal, domestic, and agricultural use. The Puget aquifer underlies the Fraser, and is found at depths greater than 45 m [66]. Due to the prolific nature of the Fraser aquifer, the Puget aquifer is not heavily utilized as a groundwater source. Transmissivity values calculated from well logs range from 10 m2 per day to over 5000 m2 per day. Cumulative injection estimates suggest 1900 ML per day of water can be added to the aquifer. Since the Puget aquifer is generally isolated from withdrawals for common water use, the Puget aquifer can likely provide adequate storage and isolation, reducing the potential of piracy by domestic wells.
The Columbia River aquifer system include (youngest to oldest) the following basalts: Saddle Mountain, Wanapum, Grande Ronde, and Imnaha. In between each basalt formation is collectively known as the Ellensburg Formation. The largest and most utilized formation is the Grande Ronde basalts which exceed over 900 m in thickness [50]. The target formation for ASR in the Columbia River aquifer system is the Ellensburg Formation. A total of 93 water wells indicate cumulative injection of up to 3400 ML per day can be stored within the Columbia River aquifer system.
4.2.4. Watershed Scale Assessment
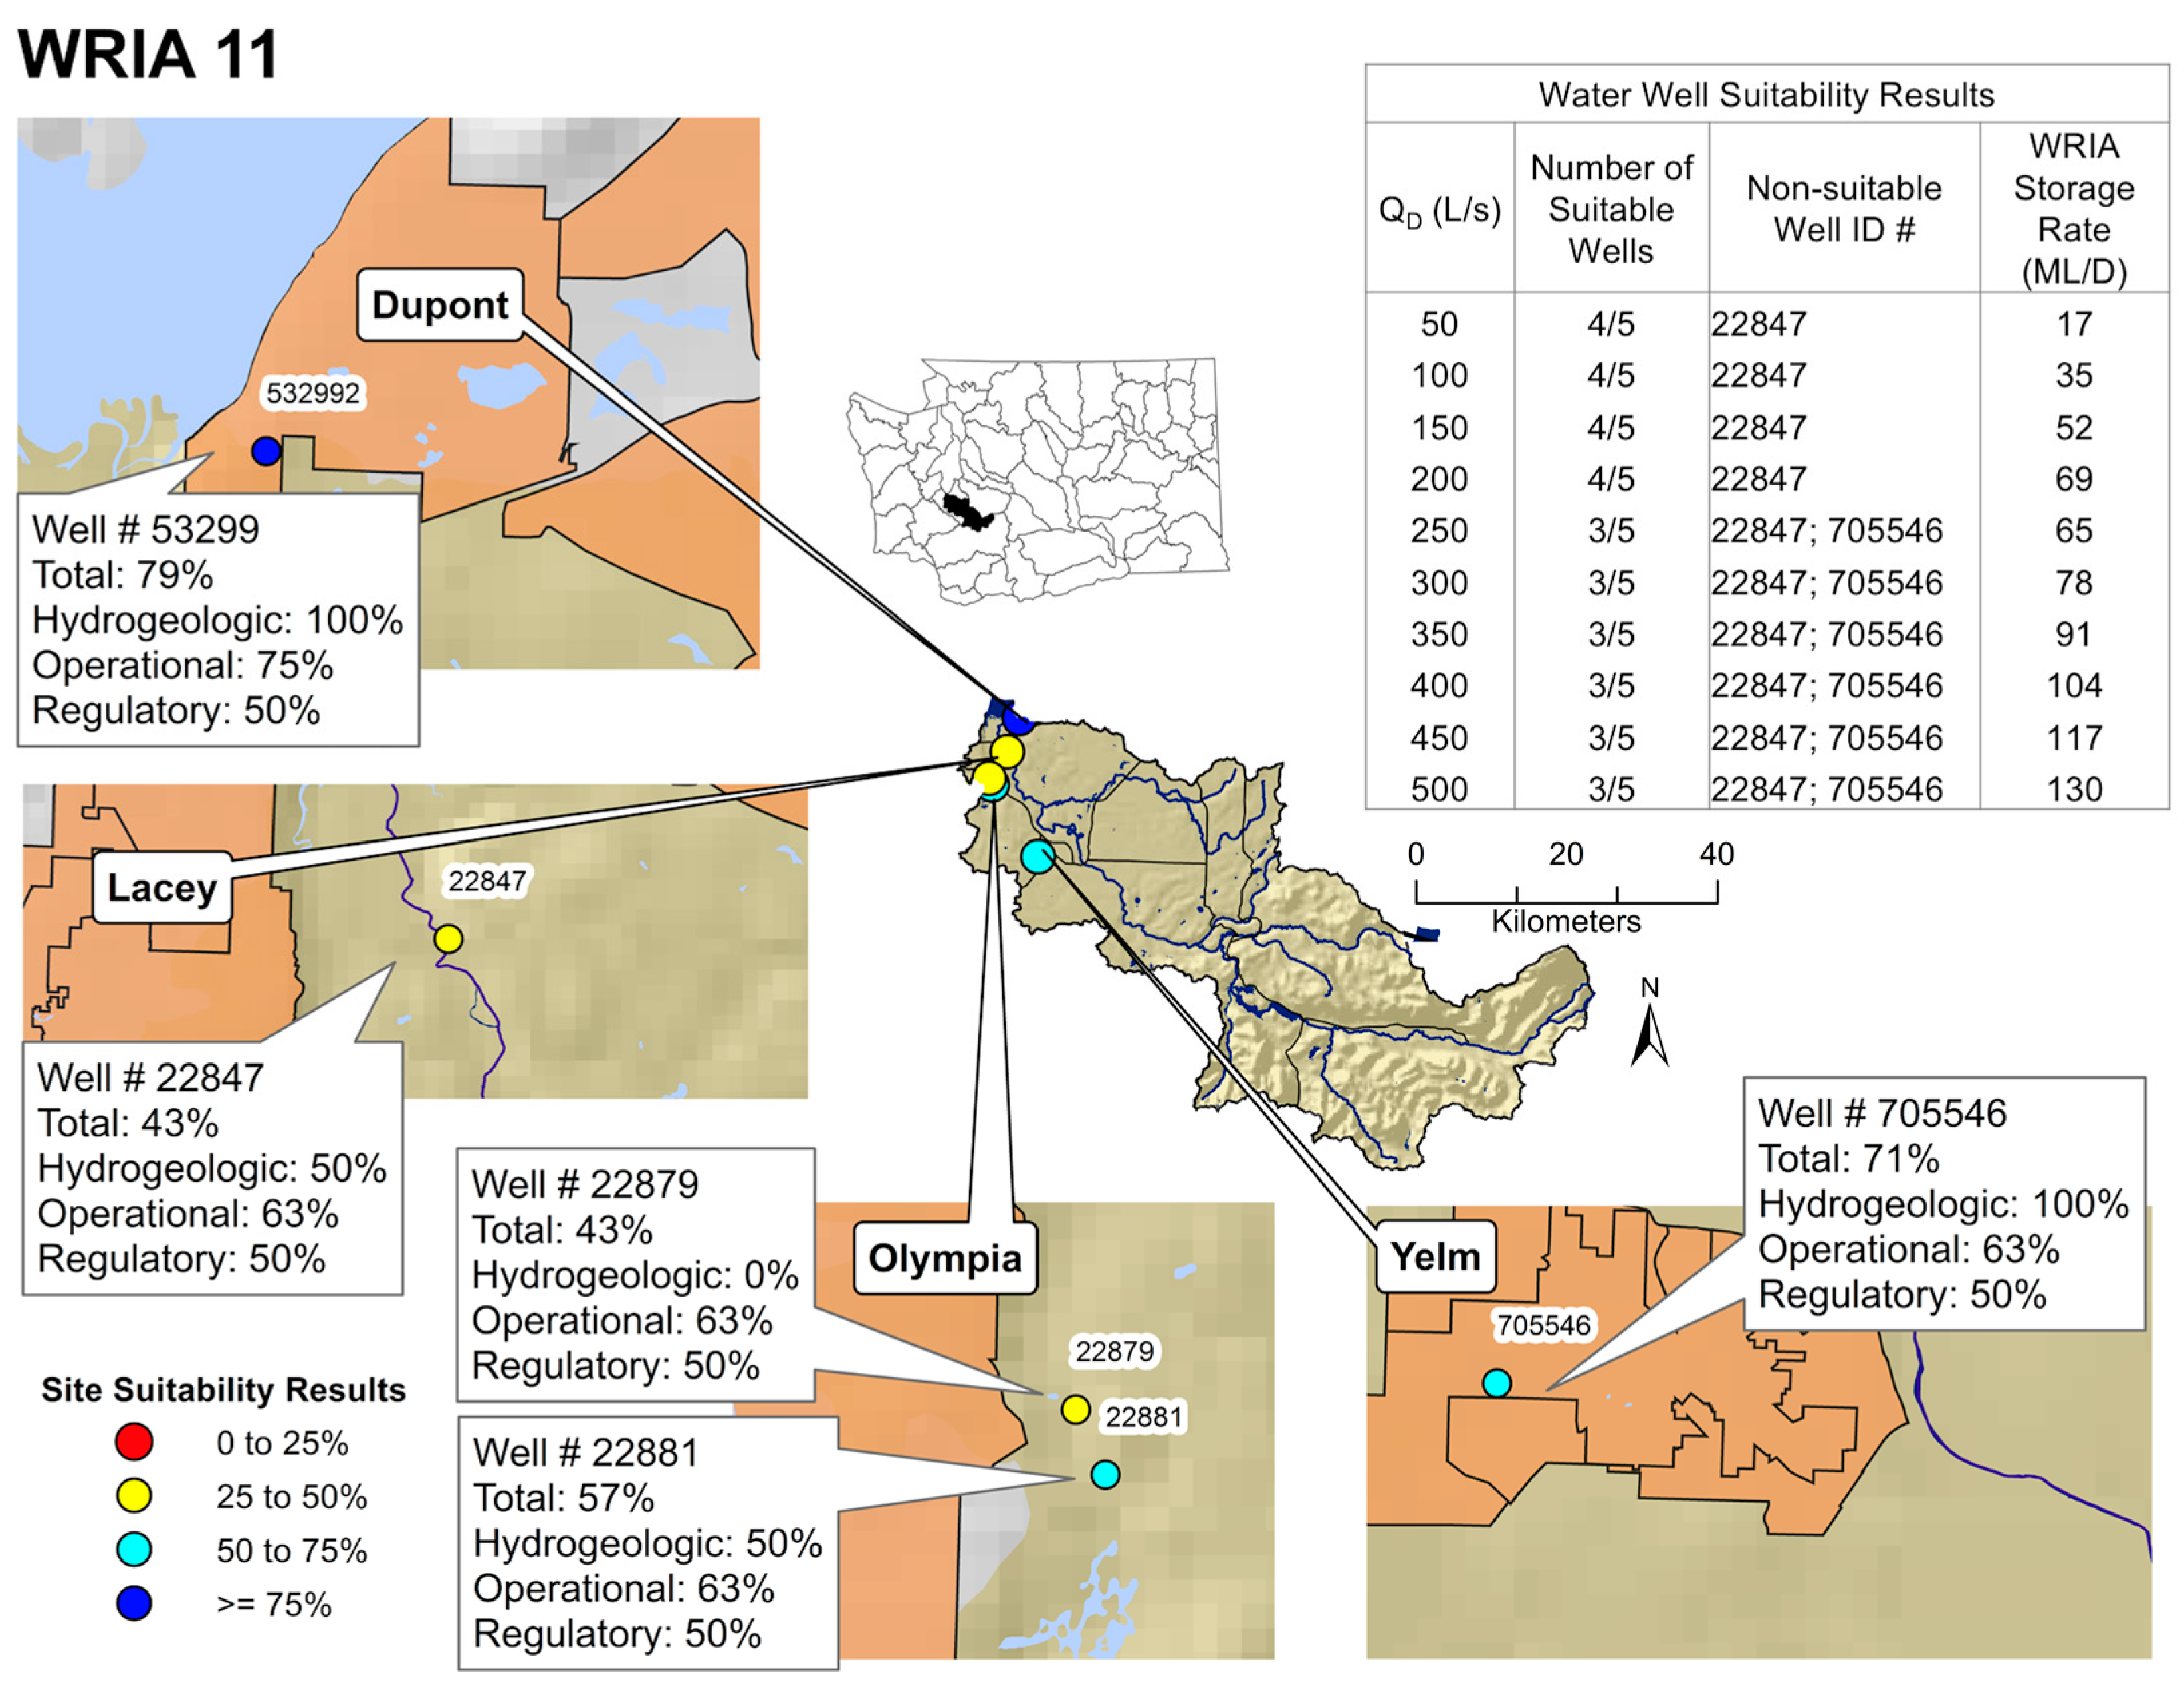
Sixty-two WRIAs were assessed for ASR suitability. To understand the extent to which results can be utilized, of the 5 water wells assessed for suitably in WRIA 11, 4 out of 5 wells can sustain injection rates of up to 200 Ls−1, and 3 out of 5 wells can sustain injection rates of up to 500 Ls−1. Potential injection capacity of the five water wells equals over 650 ML per day (Figure 11).
4.3. Local Scale Assessment and Application
Applicability of results on a local scale are represented by the city of Dupont. The city has not conducted a feasibility study of ASR, but it has experienced a 1500% increase in population from 1990 to 2010 [67]. The city of DuPont’s municipal well #532992 (Figure 11), located within WRIA 11, met 79% of total suitably for ASR based on the site scoring system. On a subcategory level, 100% of hydrogeologic properties, 75% of operational considerations, and 50% of regulatory influences were met. Located at a depth of 118 m, the DuPont well is drilled within a confined aquifer of Quaternary glacial drift sediment in the Puget Lowlands. Transmissivity of the aquifer, calculated from specific capacity, was estimated at 1200 m2 per day, which is within the appropriate range for injection thresholds. Additionally, no other wells access the same depth within a 1.6 km radius. The well met all of the desired injection rates and with a potential injection capacity of 565 Ls−1.
Although results of this study aid in identifying suitable locations, it can also elucidate factors that reduce ASR potential. For example, the city of Lacey (Figure 11) experienced a 120% population increase from 1990 to 2010 [67]. The city’s municipal well # 22847, drilled to a depth of 33 m and located within a sand and gravel aquifer of the Puget Lowlands, met only 43% of total suitability according to the site scoring system. The subcategories of hydrogeologic properties, operational considerations, and regulatory influences, scored 50%, 63%, and 50%, respectively. The metrics with the greatest influence on the site scoring system were transmissivity and well density, which scored 0. Although preliminary findings suggest this well is unsuitable for ASR, increasing well depth might enhance transmissivity and isolation, likely allowing for the development of a productive injection and recovery scheme.
5. Conclusions
This study was designed to determine the suitability of ASR in Washington, USA on regional and local scales. The use of two methods to produce meaningful results can be utilized by state agencies, watershed councils, local government agencies, and water managers. By partitioning total percent of suitability into hydrogeologic properties, regulatory influences, and operational considerations, one can easily determine which factors can be improved upon to increase the likelihood of a successful ASR scheme, and to recognize limitations. Although detailed site-specific field investigations are a requirement to estimate the extent of suitability, results suggest ASR is a viable option for statewide expansion, to supplement current water storage within many watersheds, and provide information on where further field investigations can be targeted. Due to limited data requirements, the site scoring system and water well suitability method is adaptable, and should prove applicable to water practitioners in regions with and without provincial datasets.
Acknowledgments
This work was funded by a grant to Oregon State University (Michael E. Campana, PI) from the Office of Columbia River, Washington State Department of Ecology, Washington, USA, Grant # 13-0138.
Author Contributions
M.G. conceived, designed the methodology, analyzed the results, and contributed to the writing of this article. M.C. designed the methodology, analyzed results, and contributed to the writing of this article. D.N. contributed to the design of the methodology and to the writing of the policy and historical context of ASR in Washington.
Conflicts of Interest
The authors declare no conflict of interest.
References
- Alley, W.M.; Healy, R.W.; LaBaugh, J.W.; Reilly, T.E. Flow and storage in groundwater systems. Science 2002, 296, 1985–1990. [Google Scholar] [CrossRef] [PubMed]
- Harden, B. A River Lost: The Life and Death of the Columbia; W.W. Norton & Company: New York, NY, USA; London, UK, 1996; ISBN 9780393316902. [Google Scholar]
- Castle, S.L; Thomas, B.F; Reager, J.T; Rodell, M.; Swenson, S.C; Famiglietti, J.S. Groundwater depletion during drought threatens future water security of the Colorado River Basin. Geophys. Res. Lett. 2014, 41, 5904–5911. [Google Scholar] [CrossRef] [PubMed]
- Todd, D.K. Groundwater Hydrology, 2nd ed.; John Wiley and Sons: New York, NY, USA, 1980. [Google Scholar]
- Asano, T. Artificial Recharge of Groundwater; Butterworth Publishers: Boston, MA, USA, 1985; ISBN 0-250-40549-0. [Google Scholar]
- Pyne, D.R. Artificial Recharge and Wells; Lewis Publishers: Ann Arbor, MI, USA, 1995; ISBN 10.1566700973. [Google Scholar]
- Khan, S.; Mushtaq, S.; Hanjra, M.A.; Schaeffer, J. Estimating potential costs and gains from an aquifer storage and recovery program in Australia. Agric. Water Manag. 2008, 95, 477–488. [Google Scholar] [CrossRef]
- Maliva, R.; Missimer, T. Aquifer storage and recovery: Developing sustainable water supplies. IDA J. Desalin. Water Reuse 2010, 2, 74–80. [Google Scholar] [CrossRef]
- Maliva, R.; Missimer, T. Aquifer Storage and Recovery and Managed AQUIFER Recharge Using Wells: Planning, Design, and Operation. Methods in Water Resources Evaluation; Schlumberger Publisher: Sugarland, TX, USA, 2010; ISBN 0978853067. [Google Scholar]
- Mitchelson, A.; Muckel, D. Spreading Water for Storage Underground; US Dept. of Agriculture: Washington, DC, USA, 1937; Volume 578, p. 80.
- Babcock, H.M.; Cushing, E.M. Recharge to ground-water from floods in a typical desert wash, Pinal County, Arizona. Eos Trans. Am. Geophys. Union 1942, 23, 49–56. [Google Scholar] [CrossRef]
- Meinzer, O.E. General principles of artificial ground-water recharge. Econ. Geol. 1946, 41, 191–201. [Google Scholar] [CrossRef]
- Ganapuram, S.; Kumar, G.V.; Krishna, I.M.; Kahya, E.; Demirel, M.C. Mapping of groundwater potential zones in the Musi basin using remote sensing data and GIS. Adv. Eng. Softw. 2009, 40, 506–518. [Google Scholar] [CrossRef]
- Chowdhury, A.; Jha, M.K.; Chowdary, V.M. Delineation of groundwater recharge zones and identification of artificial recharge sites in West Medinipur district, West Bengal, using RS, GIS and MCDM techniques. Environ. Earth Sci. 2010, 59, 1209. [Google Scholar] [CrossRef]
- Dar, I.; Sankar, K.; Dar, M. Remote sensing technology and geographic information system modeling: An integrated approach towards the mapping of groundwater potential zones in Hardrock terrain, Mamundiyar basin. J. Hydrol. 2010, 394, 285–295. [Google Scholar] [CrossRef]
- Oh, H.J.; Kim, Y.S.; Choi, J.K.; Park, E.; Lee, S. GIS mapping of regional probabilistic groundwater potential in the area of Pohang City, Korea. J. Hydrol. 2011, 399, 158–172. [Google Scholar] [CrossRef]
- Ozdemir, A. GIS-based groundwater spring potential mapping in the Sultan Mountains (Konya, Turkey) using frequency ratio, weights of evidence and logistic regression methods and their comparison. J. Hydrol. 2011, 411, 290–308. [Google Scholar] [CrossRef]
- Abdalla, F. Mapping of groundwater prospective zones using remote sensing and GIS techniques: A case study from the Central Eastern Desert, Egypt. J. Afr. Earth Sci. 2012, 70, 8–17. [Google Scholar] [CrossRef]
- Lee, S.; Kim, Y.S.; Oh, H.J. Application of a weights-of-evidence method and GIS to regional groundwater productivity potential mapping. J. Eviron. Manag. 2012, 96, 91–105. [Google Scholar] [CrossRef] [PubMed]
- Rahman, M.A.; Rusteberg, B.; Gogu, R.C.; Ferreira, J.L.; Sauter, M. A new spatial multi-criteria decision support tool for site selection for implementation of managed aquifer recharge. J. Eviron. Manag. 2012, 99, 61–75. [Google Scholar] [CrossRef] [PubMed]
- Agarwal, R.; Garg, P.; Garg, R. Remote sensing and GIS based approach for identification of artificial recharge sites. Water Resour. Manag. 2013, 27, 2671–2689. [Google Scholar] [CrossRef]
- Nasiri, H.; Boloorani, A.D.; Sabokbar, H.A.F.; Jafari, H.R.; Hamzeh, M.; Rafii, Y. Determining the most suitable areas for artificial groundwater recharge via an integrated PROMETHEE II-AHP method in GIS environment (case study: Garabaygan Basin, Iran). Environ. Monit. Assess. 2013, 185, 707–718. [Google Scholar] [CrossRef] [PubMed]
- Singh, A.; Panda, S.; Kumar, K.; Sharma, C. Artificial groundwater recharge zones mapping using remote sensing and GIS: A case study in Indian Punjab. Environ. Manag. 2013, 52, 61–71. [Google Scholar] [CrossRef] [PubMed]
- Kumari, N.; Krishna, A.P. Geospatial techniques based assessment of groundwater recharge site suitability. Int. J. Adv. Remote Sens. GIS 2013, 2, 96–109. [Google Scholar]
- Mahmoud, S.; Alazba, A.; Amin, T. Identification of potential sites for groundwater recharge using a GIS-based decision support system in Jazan region, Saudi Arabia. Water Resour. Manag. 2014, 28, 3319–3340. [Google Scholar] [CrossRef]
- Kumar, T.; Gautam, A.; Jhariya, D. Multi-criteria decision analysis for planning and management of groundwater resources in Balod District, India. Envrion. Earth Sci. 2016, 75, 649. [Google Scholar] [CrossRef]
- Senanayake, I.; Dissanayake, D.; Myadunna, B.; Weerasekera, W. An approach to delineate groundwater recharge potential sites in Ambalantota, Sri Lanka using GIS techniques. Geosci. Front. 2016, 7, 115–124. [Google Scholar] [CrossRef]
- Yeh, H.; Cheng, Y.; Lin, H.; Lee, C. Mapping groundwater recharge potential zone using a GIS approach in Hualian River, Taiwan. Sustain. Environ. Res. 2016, 26, 33–43. [Google Scholar] [CrossRef]
- Topper, R.; Barkmann, P.; Bird, D.; Sares, M. Artificial groundwater recharge and management. In State of the Art Water Supply Practices; Technical Report; Southeastern Wisconsin Regional Planning Commission: Waukesha, WI, USA, 2004; Available online: http://www.sewrpc.org/SEWRPCFiles/Publications/TechRep/tr-043_water_supply_practices.pdf (accessed on 1 February 2016).
- Woody, J. A Preliminary Assessment of Hydrogeologic Suitability for Aquifer Storage and Recovery (ASR) in Oregon. Master’s Thesis, Oregon State University, Corvallis, OR, USA, 2007. [Google Scholar]
- Brown, C.; Ward, J.; Mirecki, J. A revised brackish water aquifer storage and recovery (ASR) site selection index for water resources management. Water Resour. Manag. 2016, 30, 2465–2481. [Google Scholar] [CrossRef]
- Amineh, Z.B.; Hashemian, S.J.; Magholi, A. Integrating spatial multi criteria decision making (SMCDM) with geographic information system (GIS) for delineation of the most suitable areas for aquifer storage and recovery (ASR). J. Hydrol. 2017, 551, 577–595. [Google Scholar] [CrossRef]
- Hill, C. Water Supply Needs and Sources Assessment Alternative Water Supply Strategies Investigation: A Tool for Assessing the Feasibility of Aquifer Storage and Recovery; Special Publication SJ; St. Johns River Water Management District: Palatka, FL, USA, 1997. [Google Scholar]
- Brown, C. Planning Decision Framework for Brackish Water Aquifer, Storage and Recovery (ASR) Projects. Ph.D. Thesis, University of Florida, Gainesville, FL, USA, 2005. [Google Scholar]
- Brown, C.J.; Weiss, R.; Verrastro, R.; Shulbert, S. Development of an aquifer storage and recovery (ASR) site selection suitability index in support of the comprehensive everglades restoration project. J. Hydrol. 2005, 13, 1–13. [Google Scholar]
- Parsons, S.; Dillon, P.; Irvine, E.; Holland, G.; Kaufman, C. Progress in Managed Aquifer Recharge in Australia; Waterlines Report Series No. 73; National Water Commission: Canberra, Australia, 2012. [Google Scholar]
- Lowry, C.S.; Anderson, M.P. An assessment of aquifer storage recovery using ground water flow models. Groundwater 2006, 44, 661–667. [Google Scholar] [CrossRef] [PubMed]
- Smith, A.J.; Pollock, D.W. Assessment of managed aquifer recharge potential using ensembles of local models. Groundwater 2012, 50, 133–143. [Google Scholar] [CrossRef] [PubMed]
- Ward, J.D.; Simmons, C.T.; Dillon, P.J.; Pavelic, P. Integrated assessment of lateral flow, density effects and dispersion in aquifer storage and recovery. J. Hydrol. 2009, 370, 83–99. [Google Scholar] [CrossRef]
- Bakker, M. Radial Dupuit interface flow to assess the aquifer storage and recovery potential of saltwater aquifers. Hydrogeol. J. 2010, 18, 107–115. [Google Scholar] [CrossRef]
- Sutanudjaja, E.H.; Van Beek, L.P.H.; De Jong, S.M.; van Geer, F.C.; Bierkens, M.F.P. Large-scale groundwater modeling using global datasets: A test case for the Rhine-Meuse basin. Hydrol. Earth Syst. Sci. 2011, 15, 2913–2935. [Google Scholar] [CrossRef] [Green Version]
- Lane, R.C. Water Use Trends in Washington, 1985–2005: U.S. Geological Survey Fact Sheet 2010-3057. 2010; p. 4. Available online: https://pubs.usgs.gov/fs/2010/3057/ (accessed on 11 August 2017).
- Kimbrough, R.A.; Ruppert, G.P.; Wiggins, W.D.; Smith, R.R.; Kresch, D.L. U.S. Geological Survey Water Data Report WA-05-1: Water Resources Data-Washington Water Year 2005; U.S. Department of the Interior, U.S. Geological Survey: Washington, DC, USA, 2005. Available online: https://pubs.usgs.gov/wdr/2005/wdr-wa-05-1/ (accessed on 10 June 2017).
- Cohen, S.J.; Miller, K.A.; Hamlet, A.F.; Avis, W. Climate change and resource management in the Columbia River Basin. Water Int. 2000, 25, 253–272. [Google Scholar] [CrossRef]
- Elsner, M.M.; Cuo, L.; Voisin, N.; Deems, J.S.; Hamlet, A.F.; Vano, J.A.; Mickelson, K.E.; Lee, S.Y.; Lettenmaier, D.P. Implications of 21st century climate change for the hydrology of Washington State. Clim. Chang. 2010, 102, 225–260. [Google Scholar] [CrossRef]
- Snover, A.K.; Mote, P.W.; Whitely Binder, L.C.; Hamlet, A.F.; Mantua, N.J. Uncertain Future: Climate Change and Its Effects on Puget Sound, 2005. Available online: https://digital.lib.washington.edu/researchworks/handle/1773/38383 (accessed on 2 October 2017).
- Dalton, M.; Mote, P.; Snover, A. Climate Change in the Northwest: Implications for our Landscapes, Waters, and Communities; Island Press: Washington, DC, USA, 2008. [Google Scholar]
- Vaccaro, J.J.; Hansen, A.J.; Jones, M.A. Hydrogeologic framework of the Puget Sound aquifer system, Washington and British Columbia (No. 1424); U.S. Geological Survey: Washington, DC, USA, 1998. Available online: https://pubs.er.usgs.gov/publication/pp1424D (accessed on 15 February 2017).
- Brocher, T.M.; Parsons, T.; Blakely, R.J.; Christensen, N.I.; Fisher, M.A.; Wells, R.E. Upper crustal structure in Puget Lowland, Washington: Results from the 1998 seismic hazards investigation in Puget Sound. J. Geophys. Res. Solid Earth 2001, 106, 13541–13564. [Google Scholar] [CrossRef]
- Tolan, T.L.; Reidel, S.P.; Beeson, M.H.; Anderson, J.L.; Fecht, K.R.; Swanson, D.A. Revisions to the estimates of the areal extent and volume of the Columbia River Basalt Group. Geol. Soc. Am. Spec. Pap. 1989, 239, 1–20. [Google Scholar]
- Washington State Legislature. Chapter WAC 173–200 WAC. Water Quality Standards for Groundwaters of the State of Washington. Available online: http://apps.leg.wa.gov/wac/default.aspx?cite=173-200 (accessed on 7 August 2017).
- Washington State Legislature. Water Resources Act of 1971. Chapter 90.54. RCW. Available online: http://app.leg.wa.gov/rcw/default.aspx?cite=90.54 (accessed on 7 August 2017).
- Washington State Legislature. Chapter 173–175 WAC. Underground Artificial Storage and Recovery. Available online: http://apps.leg.wa.gov/wac/default.aspx?cite=173-157 (accessed on 5 August 2017).
- Washington State Department of Ecology. Water Resources Explorer. 2012. Available online: https://fortress.wa.gov/ecy/waterresources/map/WaterResourcesExplorer.aspx (accessed on 7 April 2017).
- Bear, J.; Jacobs, M. On the movement of water bodies injected into aquifers. J. Hydrol. 1965, 3, 37–57. [Google Scholar] [CrossRef]
- Razack, M.; Huntley, D. Assessing transmissivity from specific capacity in a large and heterogeneous alluvial aquifer. Groundwater 1991, 29, 856–861. [Google Scholar] [CrossRef]
- Merritt, M.L. Recovering fresh water stored in saline limestone aquifers. Groundwater 1986, 24, 516–529. [Google Scholar] [CrossRef]
- Washington State Department of Health. Division of Environmental Health Office of Drinking Water. Available online: https://fortress.wa.gov/doh/eh/portal/odw/si/Intro.aspx (accessed on 9 May 2014).
- Washington State Department of Ecology. Map of 16 Fish-Critical Basins. Available online: http://www.ecy.wa.gov/programs/wr/instream-flows/Images/pdfs/16fishbasins.pdf (accessed on 15 April 2014).
- Joint Natural Resources Cabinet. Statewide Strategy to Recover Salmon. Extinction Is not an Option; State of Washington, Governor’s Salmon Recovery Office: Olympia, WA, USA, 1999; p. 396.
- Quinn, T.P. The Behavior and Ecology of Pacific Salmon and Trout; American Fisheries Society: Bethesda, MD, USA, 2005. [Google Scholar]
- Washington State University. Columbia River Basin: Long-Term Water Supply and Demand Forecast; Publication No. 12-12-001; Washington State Department of Ecology: Olympia, WA, USA, 2011; p. 452.
- Theis, C. The relation between the lowering of the peizometric surface and the rate and duration of discharge of a well using groundwater storage. Trans. Am. Geophys. Union 1935, 16, 519–524. [Google Scholar] [CrossRef]
- Cooper, H.; Jacob, C. A generalized graphical method for evaluating formation constants and summarizing well-field history. Trans. Am. Geophys. Union 1946, 27, 526–534. [Google Scholar] [CrossRef]
- Bloetscher, F. Manual of Water Supply Practices—M63 Aquifer Storage and Recovery, 1st ed.; American Water Works Association: Denver, CO, USA, 2015; p. 146. [Google Scholar]
- Morgan, D.; Jones, J. Geological Survey Open-File Report: Numerical Model Analysis of the Effects of Ground-Water Withdraws on Discharge to Streams and Springs in Small Basins Typical of the Puget Sound Lowland; U.S. Dept. of the Interior, U.S. Geological Survey: Washington, DC, USA, 1999; p. 81.
- United States Census Bureau. Washington State and County Quick Facts. Available online: https://www.census.gov/quickfacts/WA (accessed on 16 October 2017).
Figure 1.
Location map of the state of Washington, USA.

Figure 2.
Washington State Water Resource Inventory areas and the state’s principal aquifers.
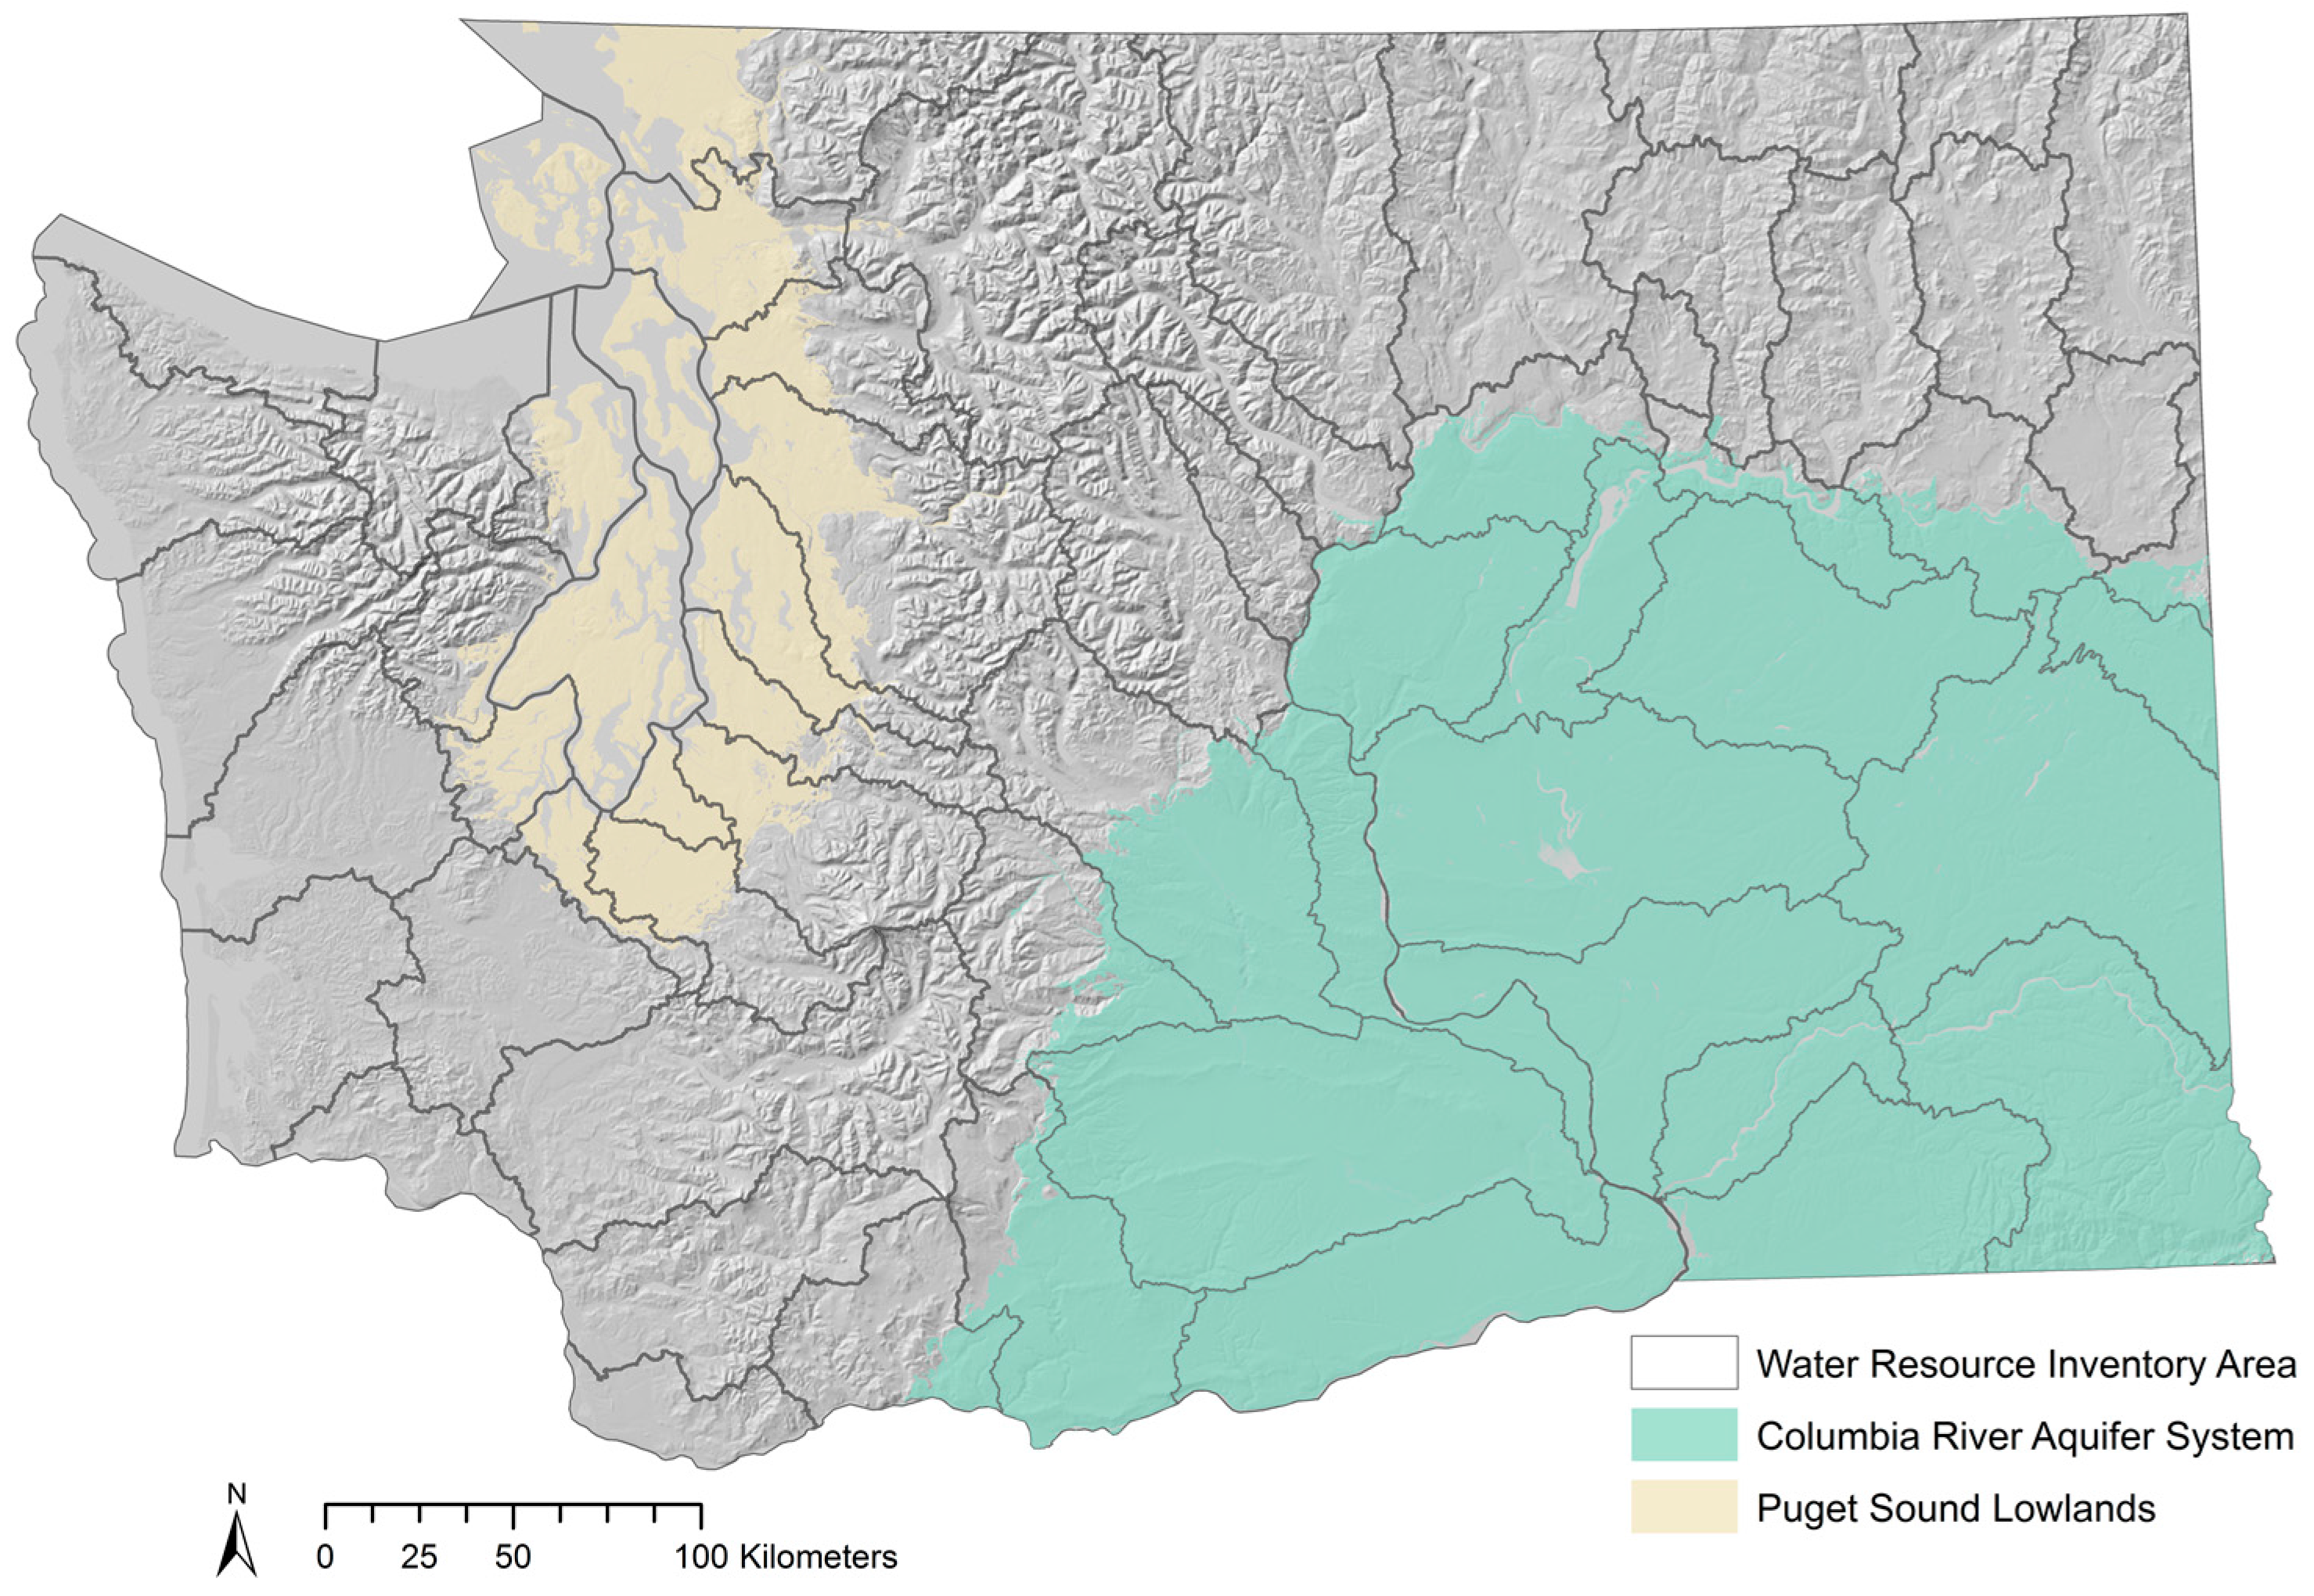
Figure 3.
Aquifer storage and recovery (ASR) metrics based on local and regional assessments. Scored metrics from both were applied in this study.
Figure 3.
Aquifer storage and recovery (ASR) metrics based on local and regional assessments. Scored metrics from both were applied in this study.
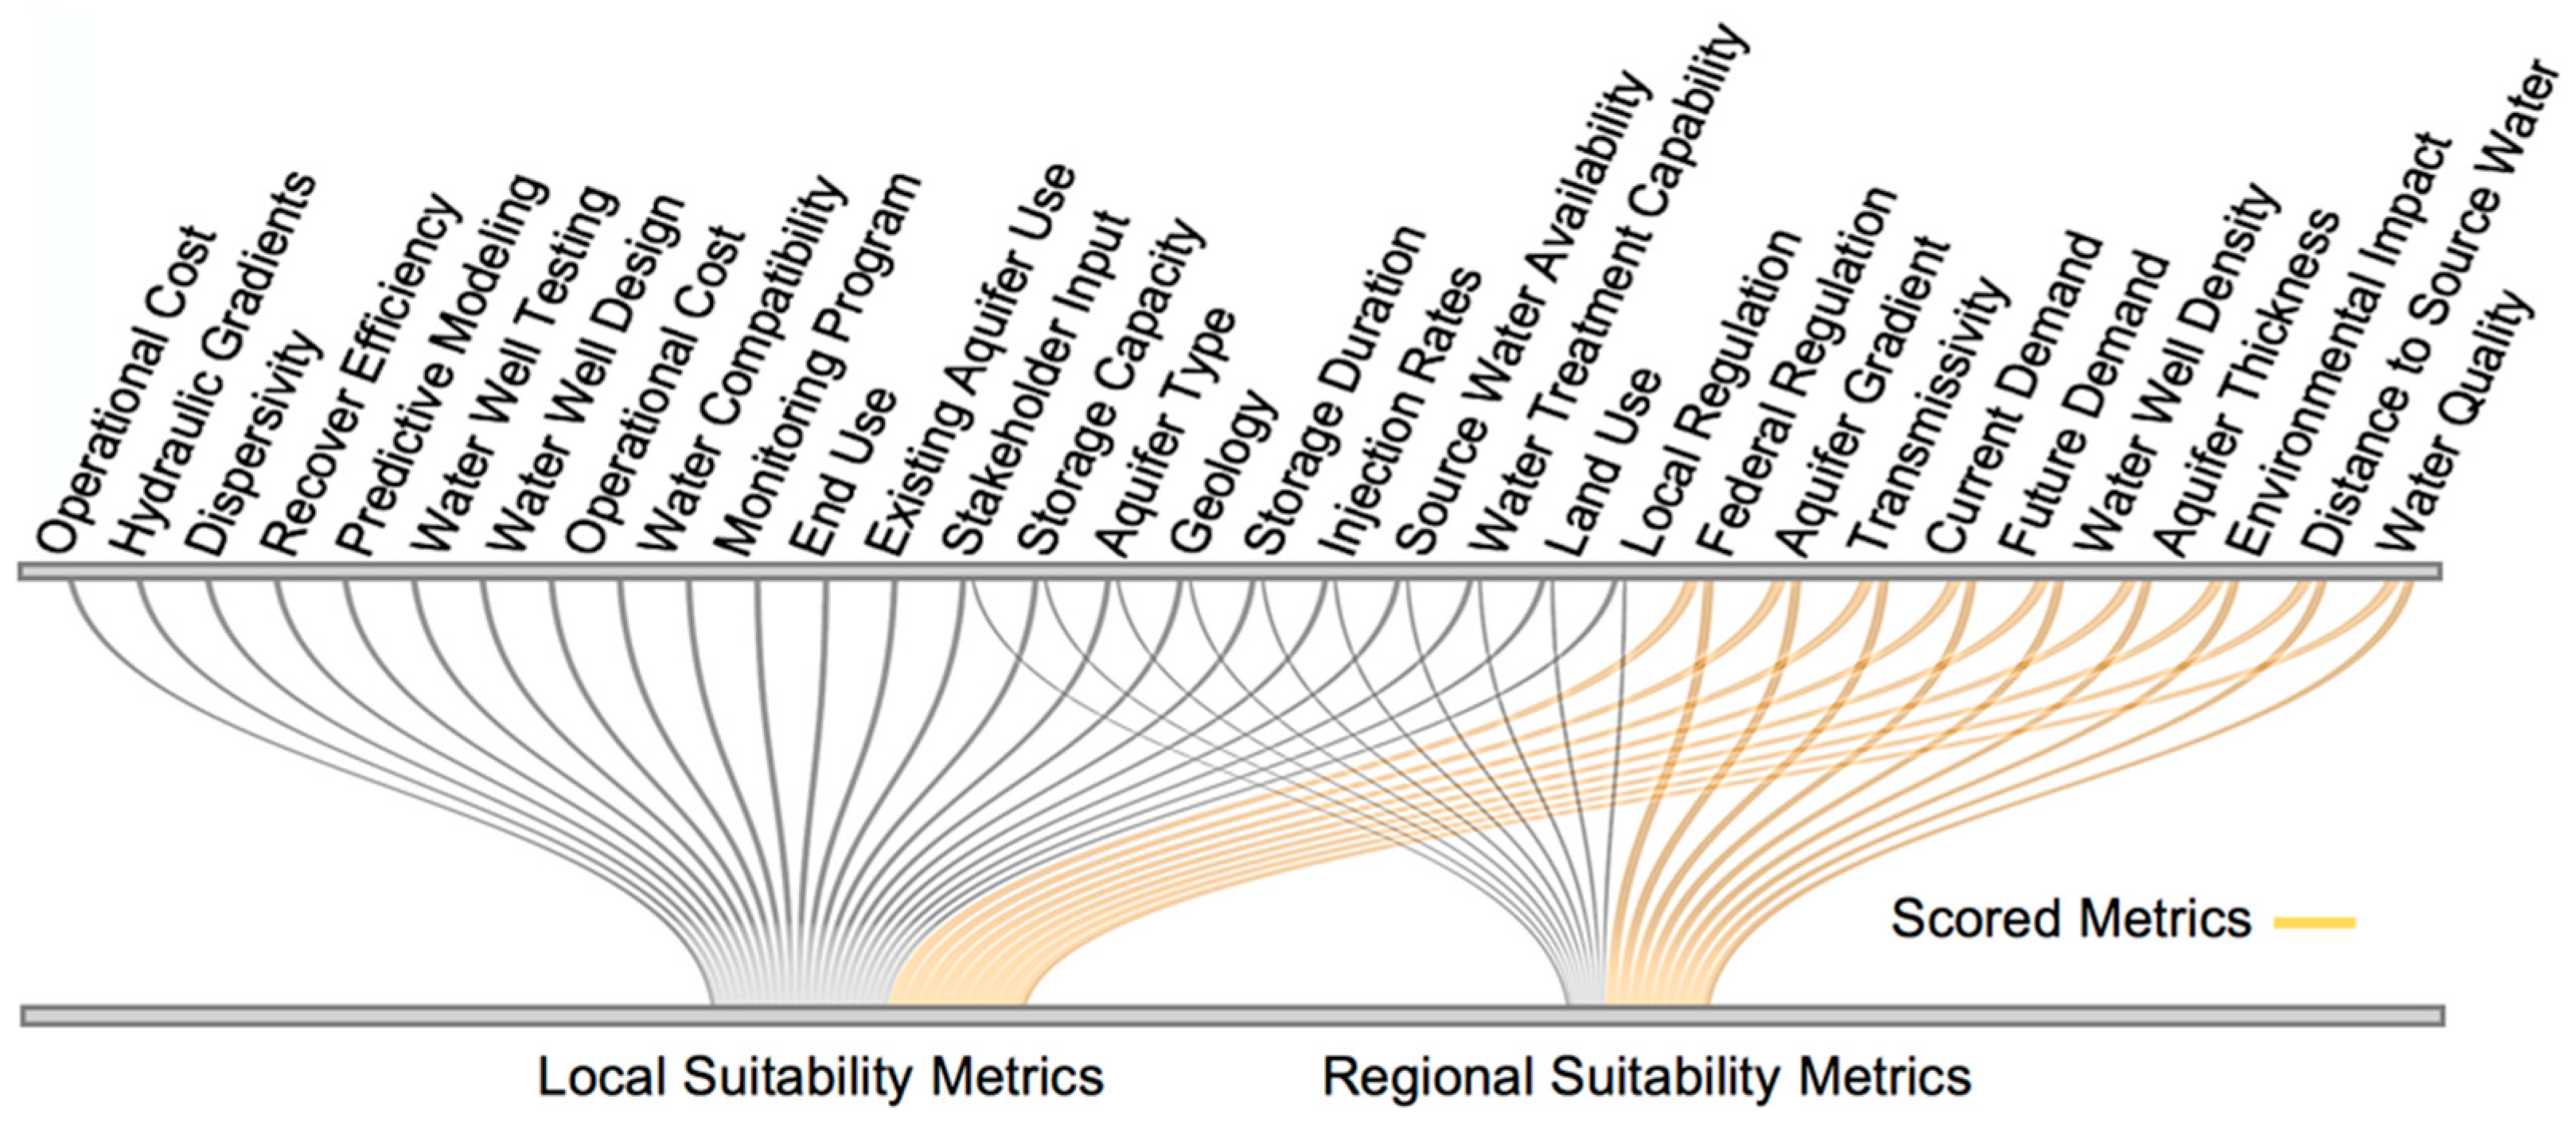
Figure 4.
Scoring system to determine ASR suitability.
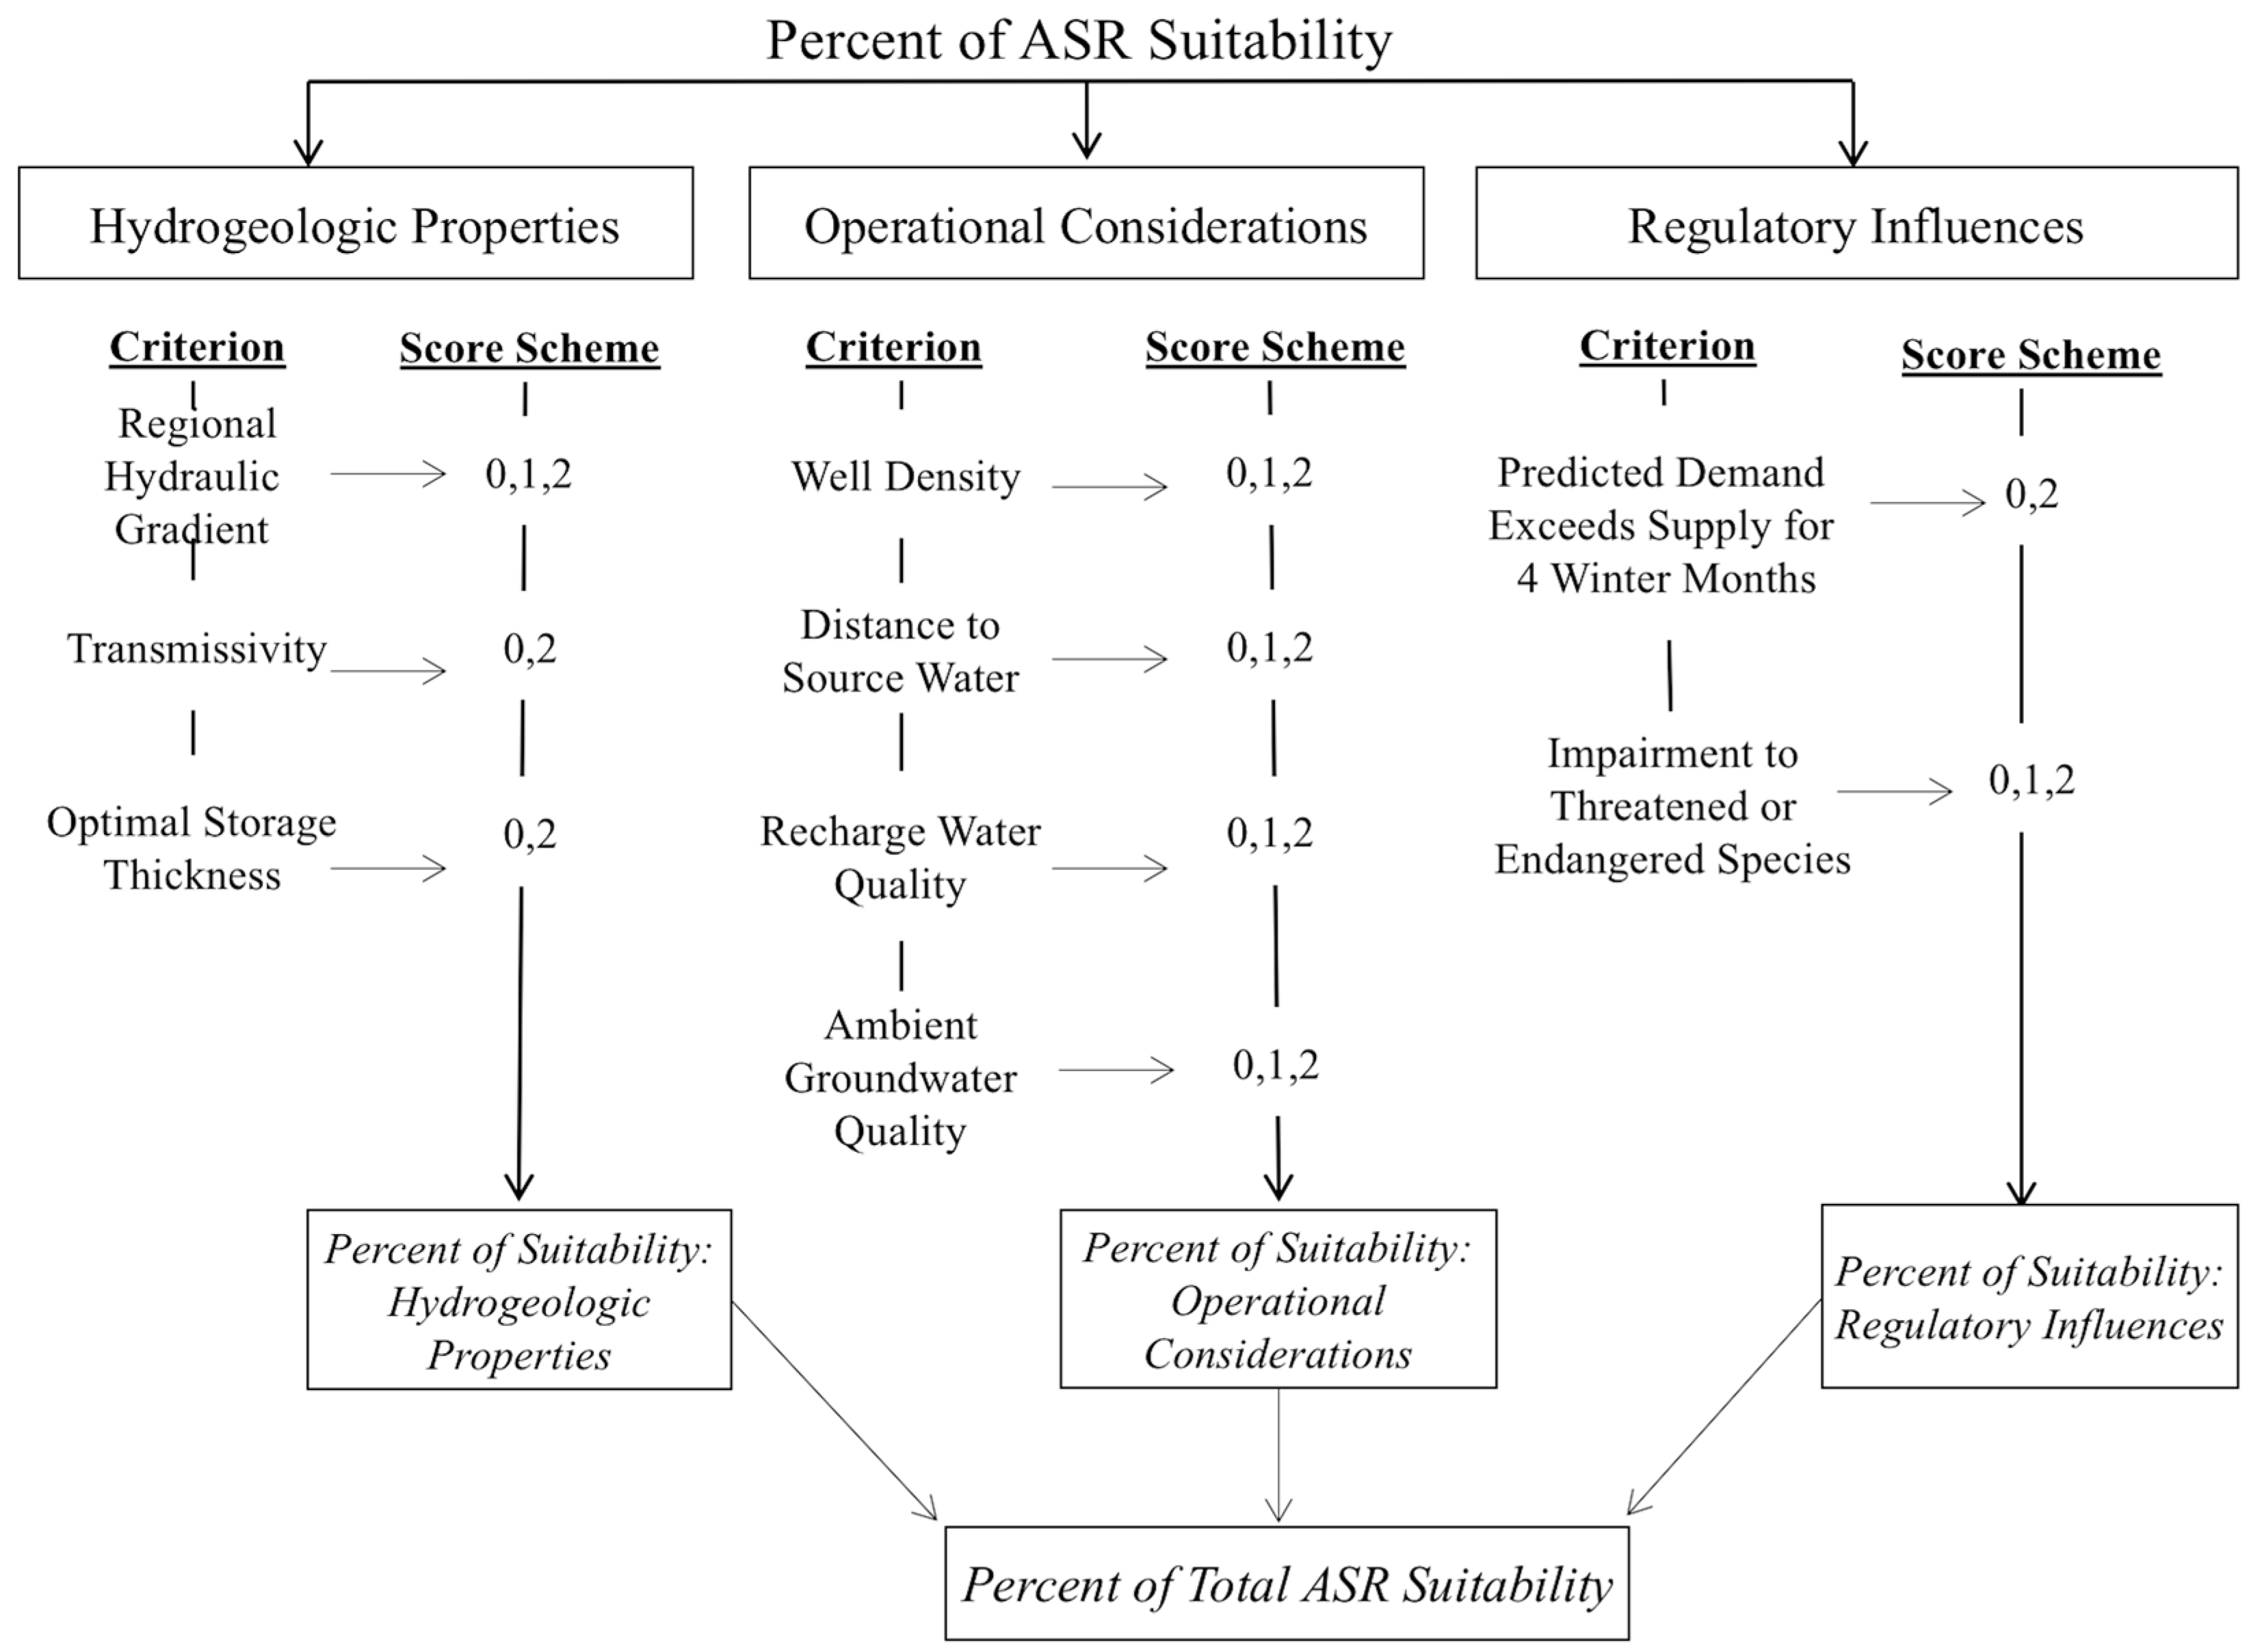
Figure 5.
Location of 284 water wells evaluated for ASR suitability.
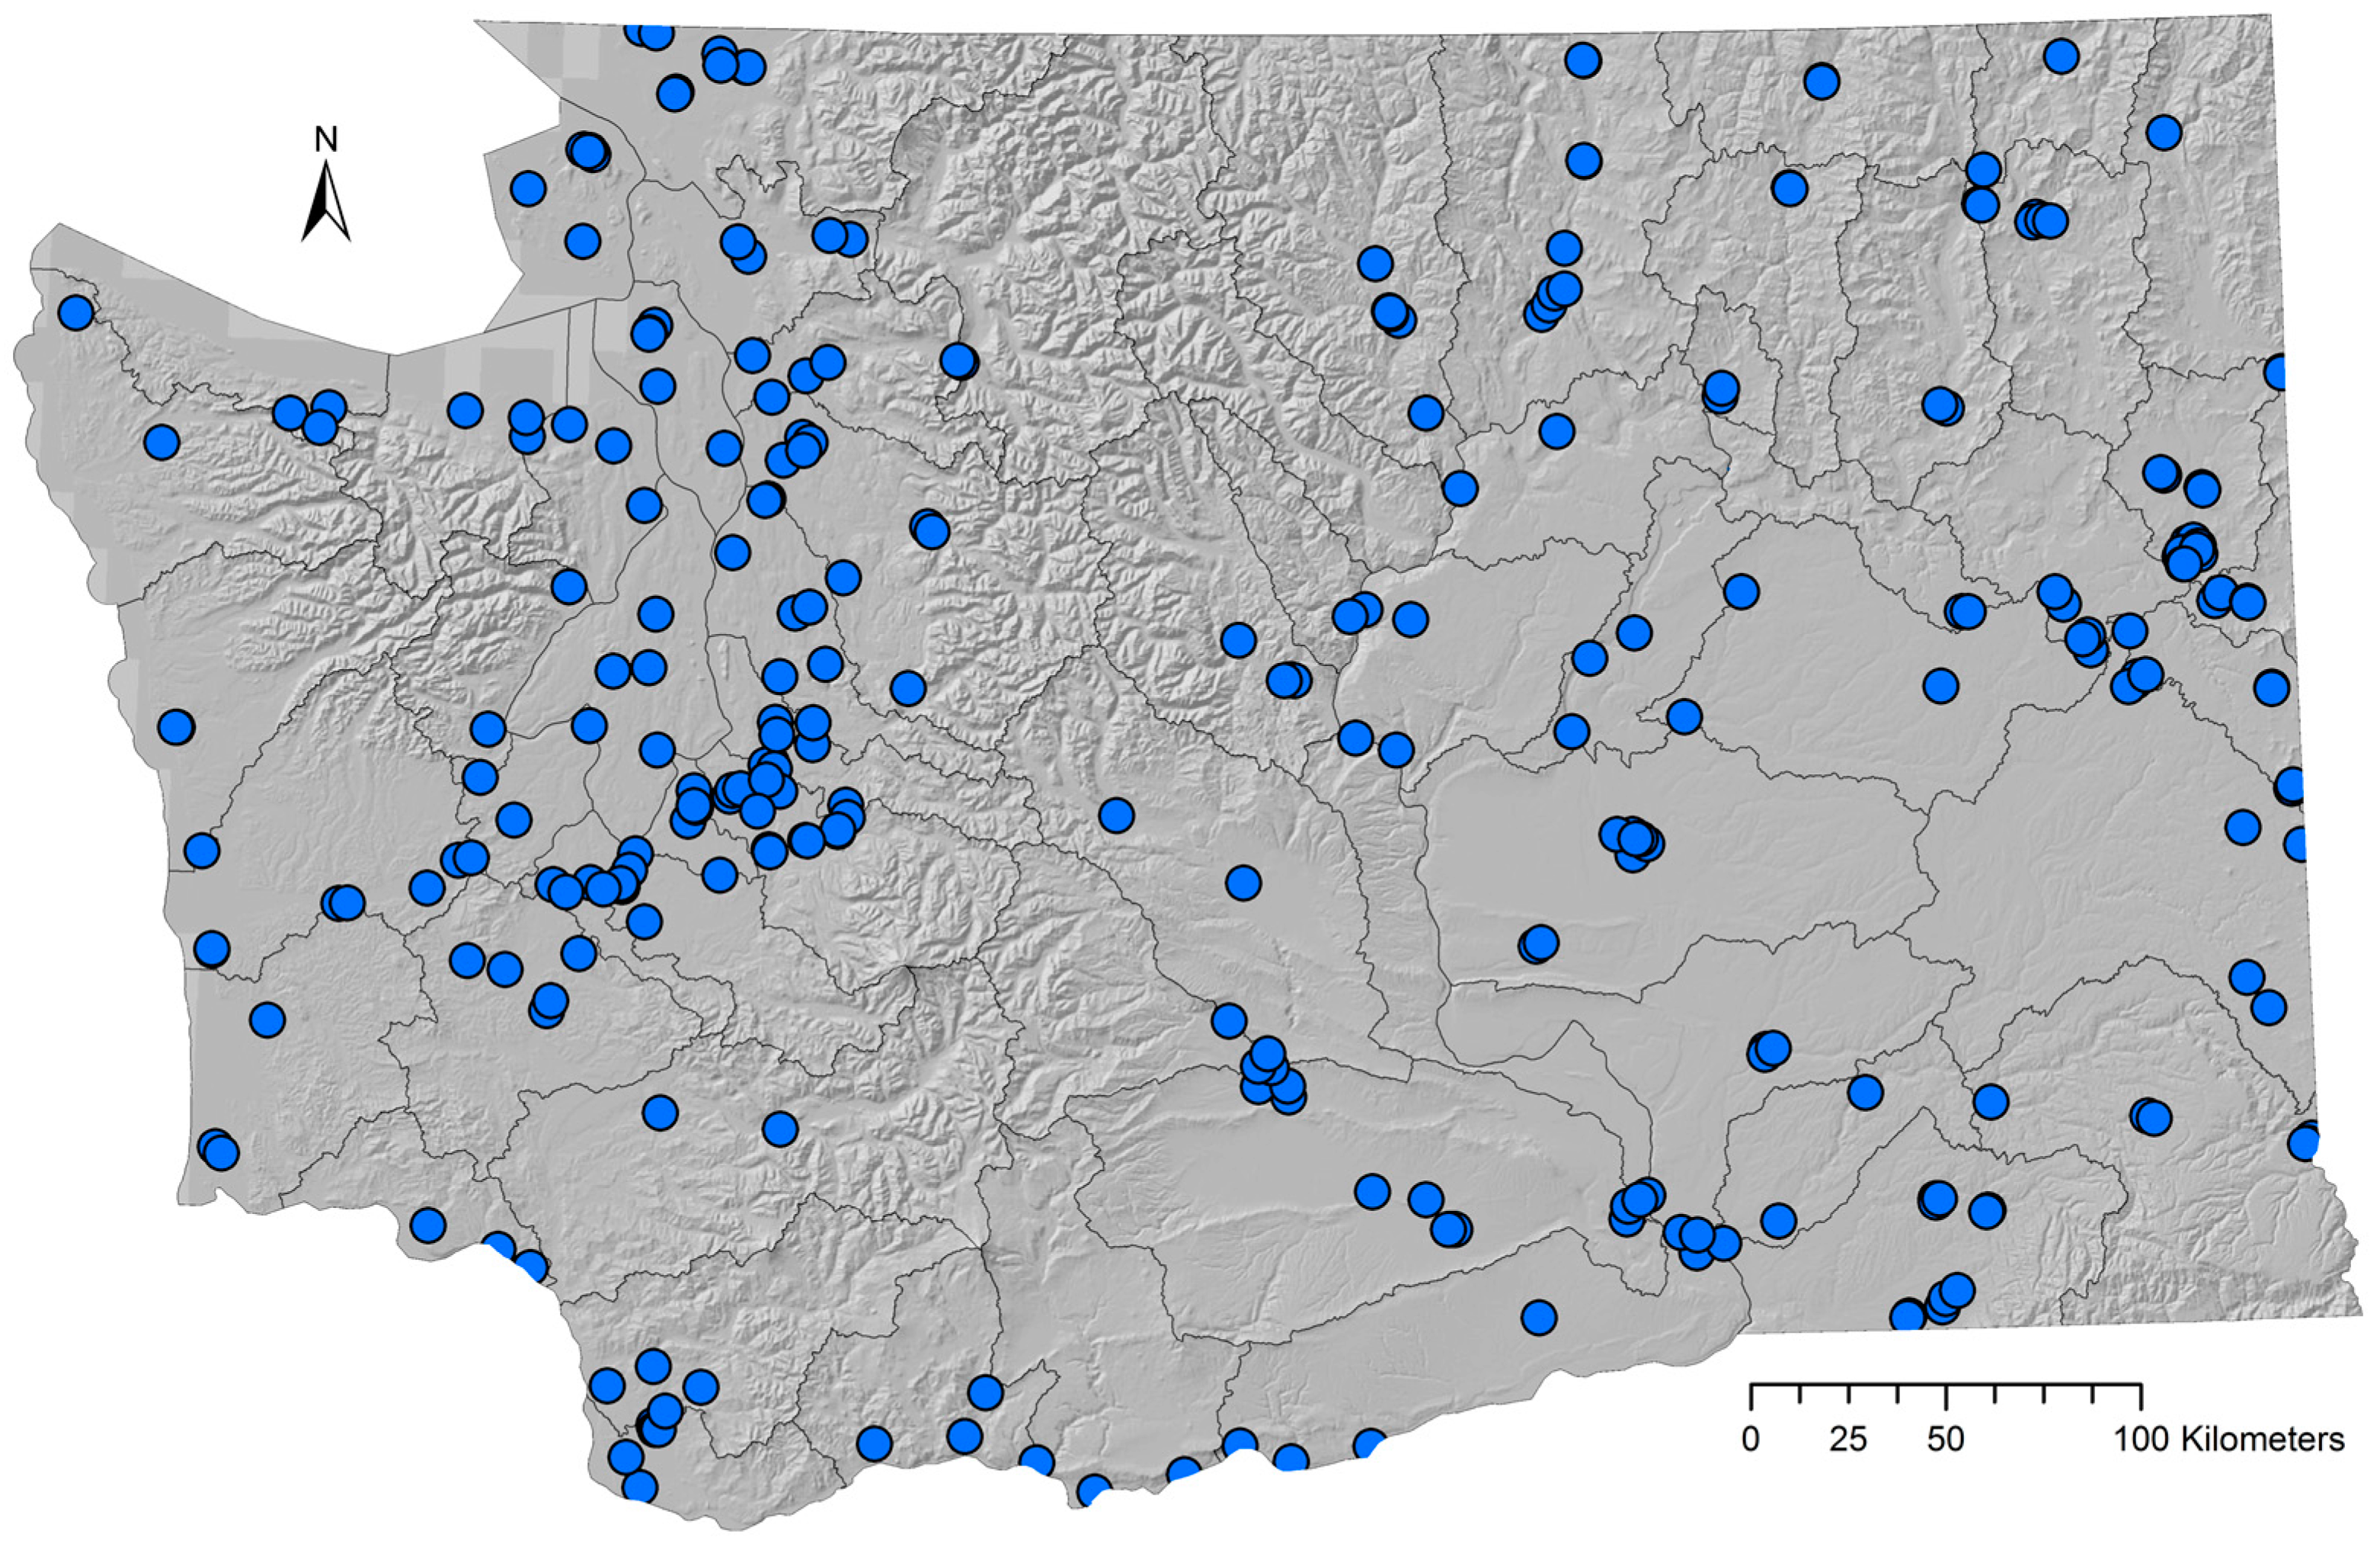
Figure 6.
Illustration of hydrogeologic properties used to represent the water well suitability equation. (a) is a pre-injection scenario for a representative water well. DSWL is the depth to static water level below ground surface, ho is the initial hydraulic head, hw is the hydraulic head undergoing injection, and Q is injection of water. Scenario (b) is unsuitable for ASR when a water well suitability of less than 1 is calculated, as the potentiometric surface has exceeded the ground surface. Scenario (c) is a suitable water well, since water well suitability is calculated at greater than or equal to 1.
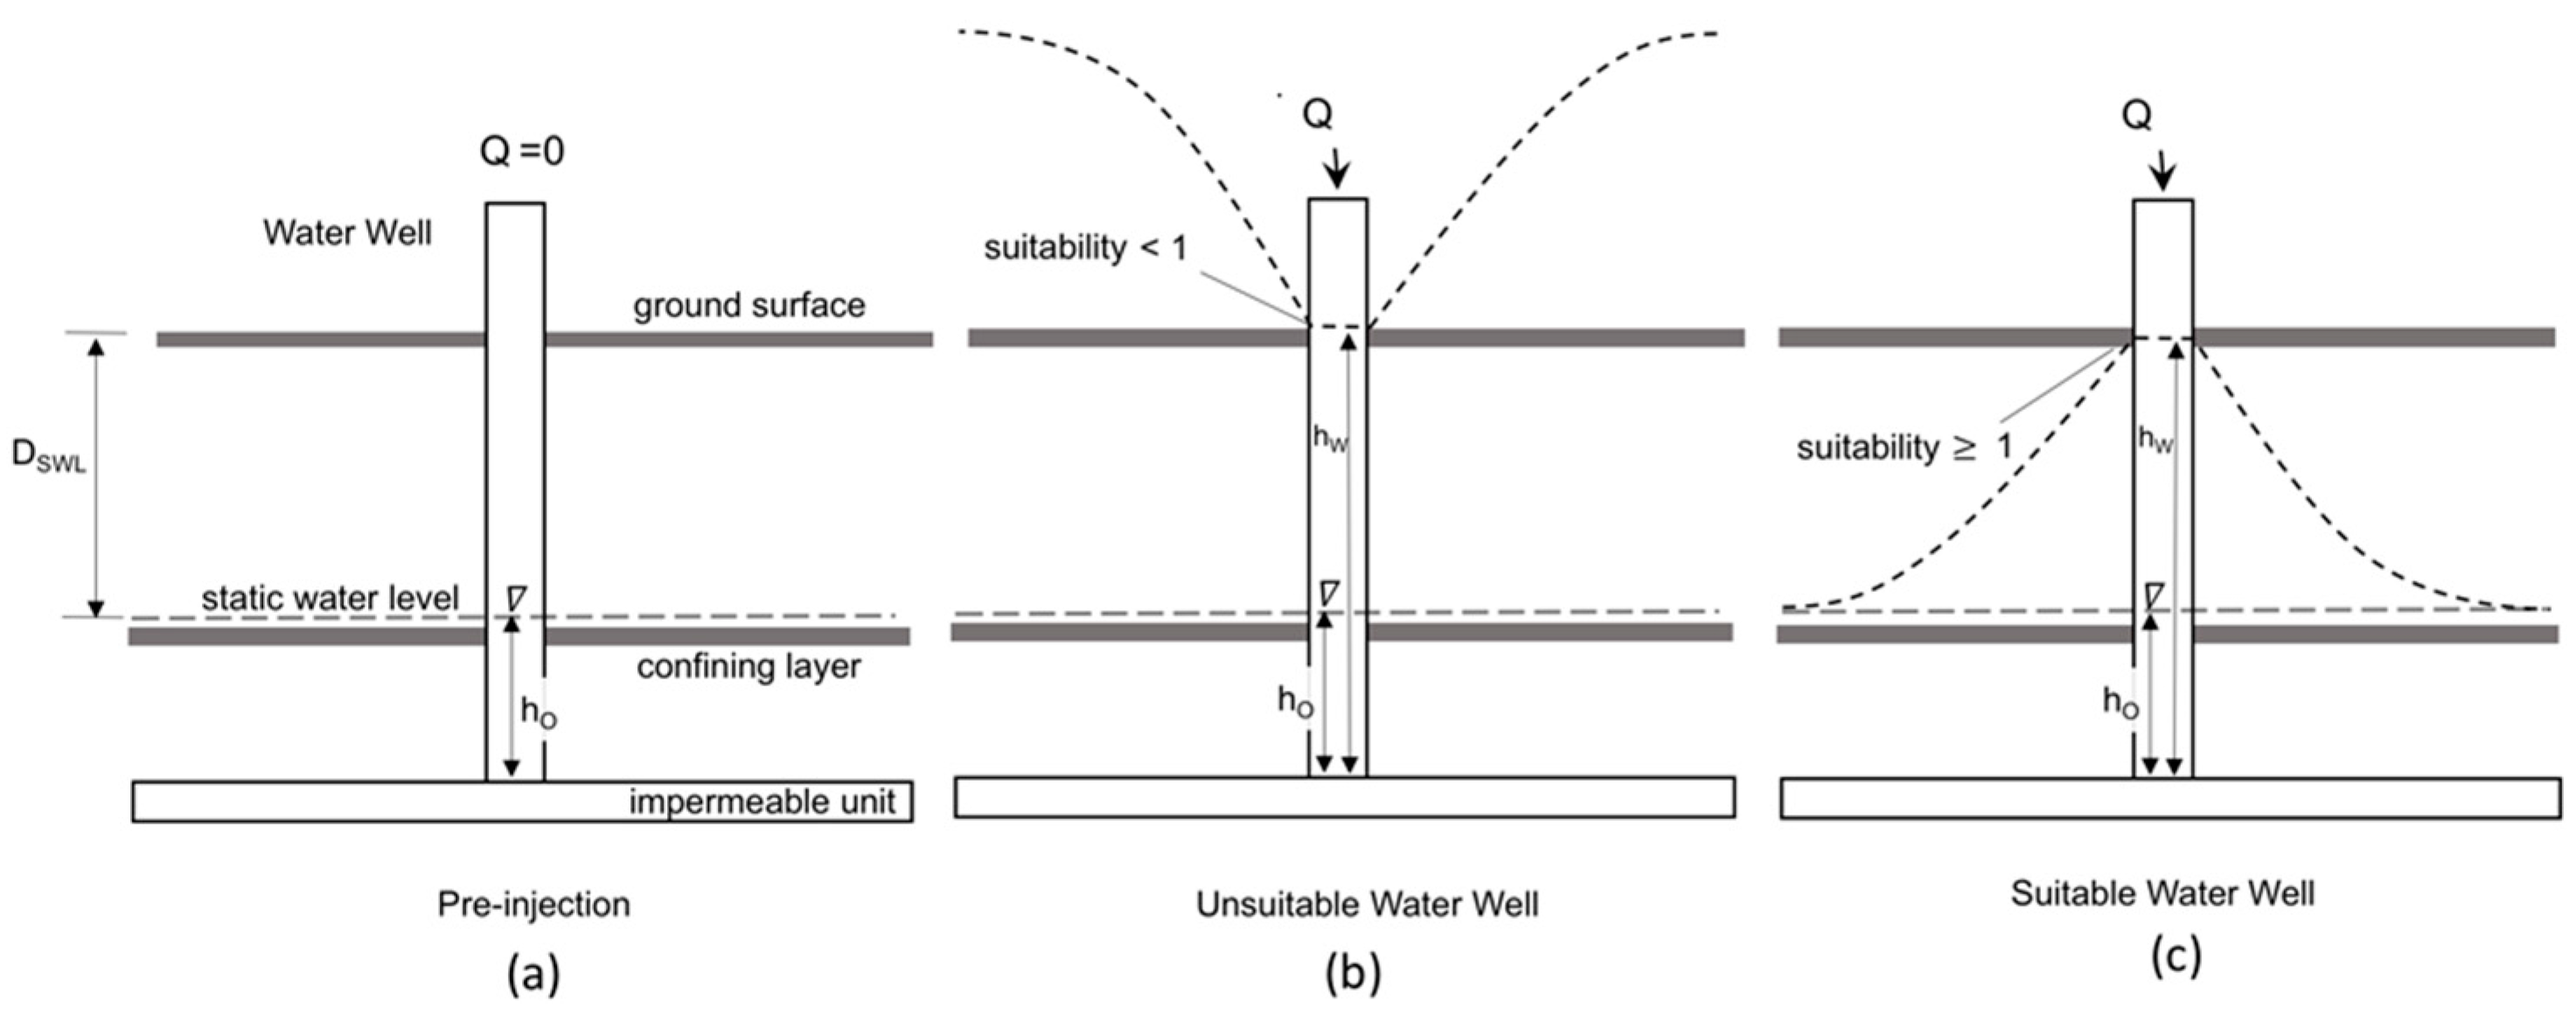
Figure 7.
Results from the Site Scoring System in Percent of Total ASR Suitability at each site.

Figure 8.
Site Scoring Scheme subcategory results.
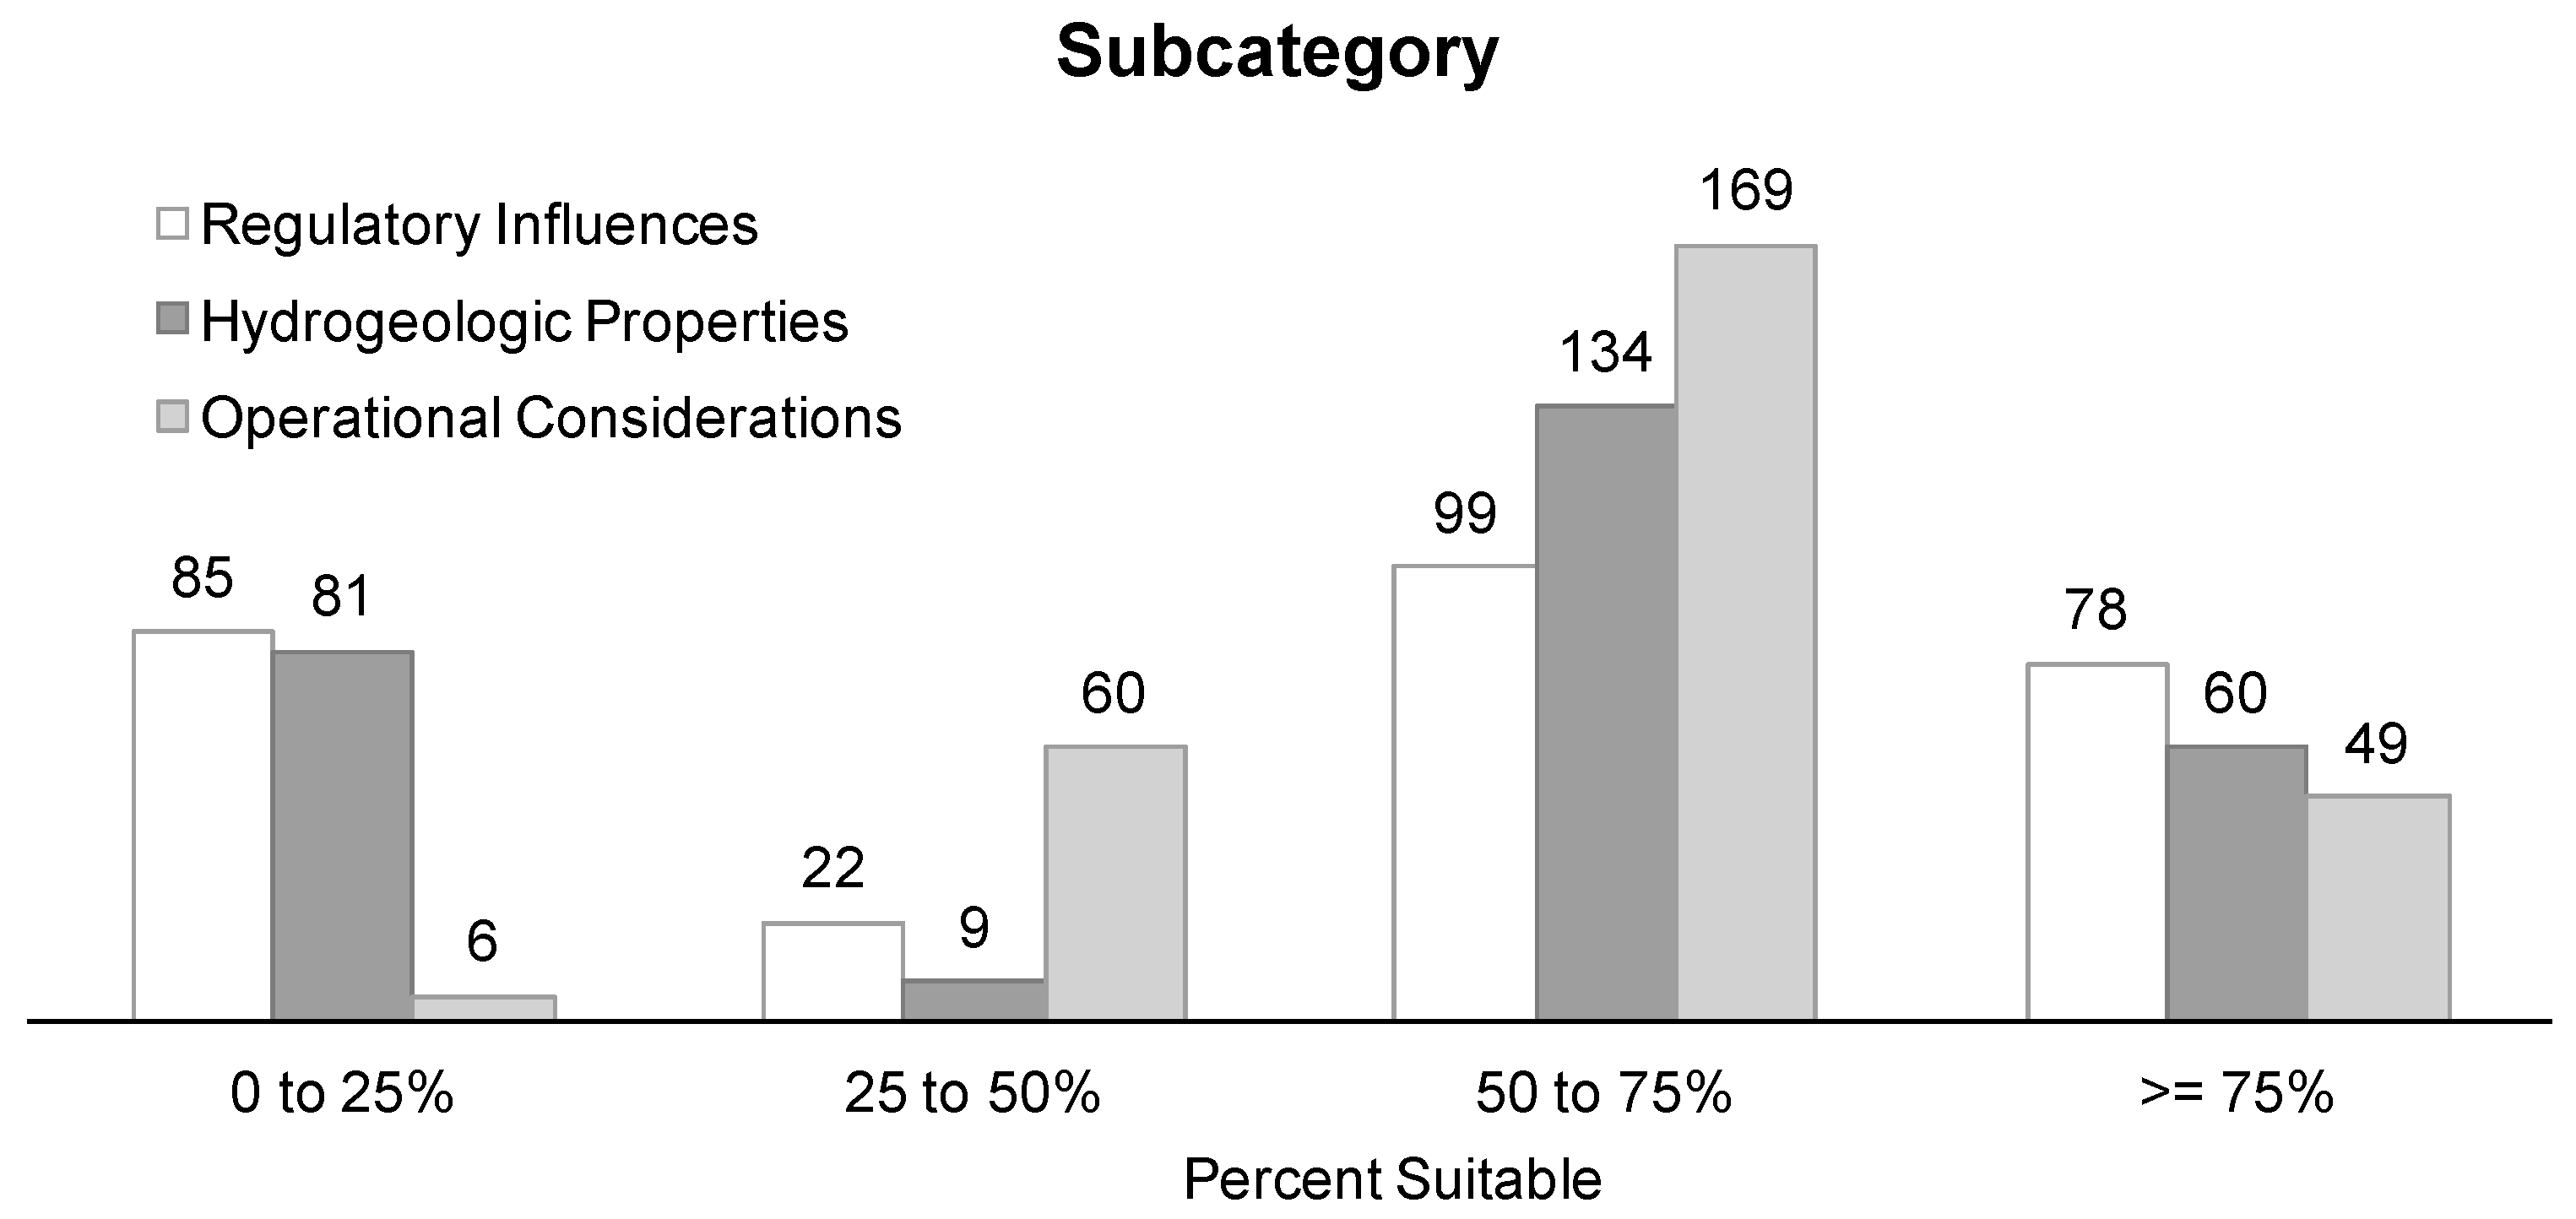
Figure 9.
Number of suitable water wells obtained from the water well suitability method and cumulative seasonal storage based on a range of designated injection rates.
Figure 9.
Number of suitable water wells obtained from the water well suitability method and cumulative seasonal storage based on a range of designated injection rates.
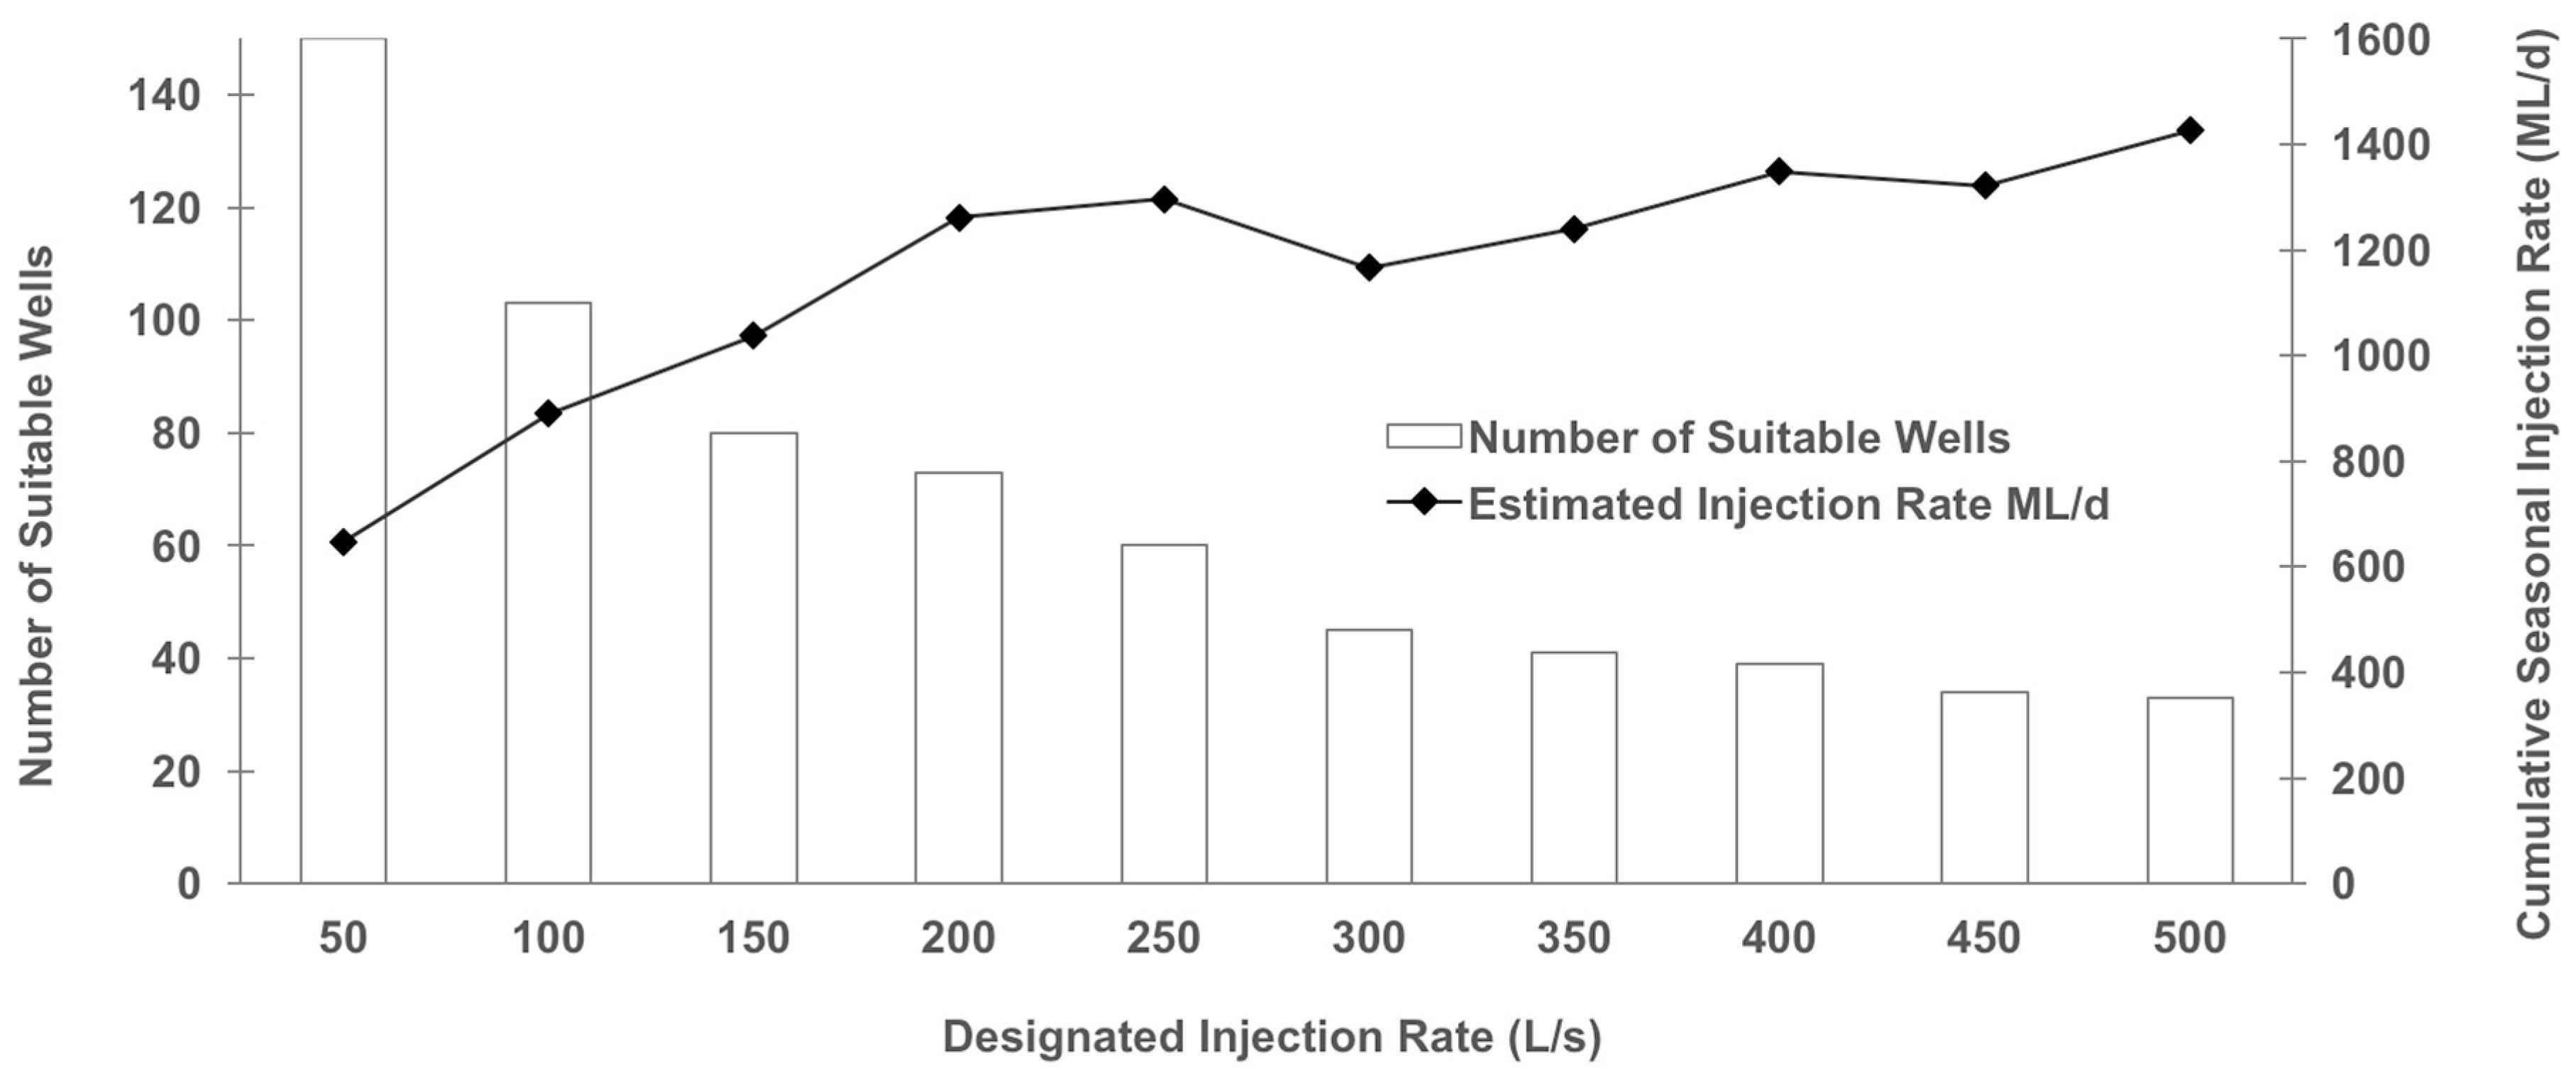
Figure 10.
Results of potential injection capacity per well.

Figure 11.
Results for WRIA 11.

© 2018 by the authors. Licensee MDPI, Basel, Switzerland. This article is an open access article distributed under the terms and conditions of the Creative Commons Attribution (CC BY) license (http://creativecommons.org/licenses/by/4.0/).
Share and Cite
MDPI and ACS Style
Gibson, M.T.; Campana, M.E.; Nazy, D. Estimating Aquifer Storage and Recovery (ASR) Regional and Local Suitability: A Case Study in Washington State, USA. Hydrology 2018, 5, 7. https://doi.org/10.3390/hydrology5010007
AMA Style
Gibson MT, Campana ME, Nazy D. Estimating Aquifer Storage and Recovery (ASR) Regional and Local Suitability: A Case Study in Washington State, USA. Hydrology. 2018; 5(1):7. https://doi.org/10.3390/hydrology5010007
Chicago/Turabian StyleGibson, Maria T., Michael E. Campana, and Dave Nazy. 2018. "Estimating Aquifer Storage and Recovery (ASR) Regional and Local Suitability: A Case Study in Washington State, USA" Hydrology 5, no. 1: 7. https://doi.org/10.3390/hydrology5010007
Note that from the first issue of 2016, this journal uses article numbers instead of page numbers. See further details here.