Physico-Mechanical, Dielectric, and Piezoelectric Properties of PVDF Electrospun Mats Containing Silver Nanoparticles
by
 , and
, and
Ahmed A. Issa
1, 
Mariam A. Al-Maadeed
1,2,
Adriaan S. Luyt
1,
Deepalekshmi Ponnamma
2 and
Mohammad K. Hassan
2,* 
1
Material Sciences and Technology Program, Qatar University, Doha, Qatar
2
Center of Advanced Materials, Qatar University, Doha, Qatar
*
Author to whom correspondence should be addressed.
C 2017, 3(4), 30; https://doi.org/10.3390/c3040030
Submission received: 21 August 2017
/
Revised: 26 September 2017
/
Accepted: 27 September 2017
/
Published: 16 October 2017
Abstract
:Poly(vinylidene fluoride) (PVDF) is a piezoelectric material with outstanding physical and mechanical properties. The piezoelectric properties depend on the β-phase content of this polymer, while the physical and mechanical properties depend on the morphology and degree of crystallinity of the material. Silver has antibacterial effects, and silver nanoparticles (Ag-NPs) have large surface areas rich in electrons. In this paper, we produced electrospun PVDF fibrous mats that contained different contents of Ag-NPs between 0% and 1.0%. The β-content in PVDF was found to increase by about 8% for Ag-NPs content of 0.4–0.6%. The electrospun fiber mats had a higher β-crystalline content, nano-pores were visible on the fiber surfaces, and the tensile strength and thermal stability were improved. Dielectric analysis indicated weak interfacial adhesion between the PVDF and Ag-NPs. Good piezoelectric response was observed in the electrospun fibers containing 0.4% AgNPs, which shows a good correlation between the β-crystalline phase content of the composites and its energy-harvesting application.
1. Introduction
Poly(vinylidene fluoride) (PVDF) is a semi-crystalline polymer that possesses outstanding mechanical and thermal properties as well as piezoelectric, pyroelectric, ferroelectric, and biocompatibility characteristics [1]. It is also a polymorphic material that may show up to five different crystalline phases, α-, β-, γ-, ε- and δ-phases. The most common conformations are the α-phase, which is a non-electroactive phase, the β-phase, which is an electroactive phase, and the γ-phase, which is electroactive, but less than the β-phase [1,2,3,4]. The electroactivity of PVDF therefore mostly depends on the β-phase content. There are different methods to increase the β-phase content, such as mechanical stretching, use of polar solvents to dissolve and re-crystallize PVDF, electrical poling, and addition of fillers [5,6,7,8]. An example is graphene oxide (GO), which increases the β-phase content via interaction of the polymer chain with the oxygen-rich groups on the surfaces of the GO layers [9,10], or cellulose, where the polymer interacts with the -OH groups [2,11]. In addition, electron clouds on the surfaces of the metal nanoparticles could interact with polymer chains resulting in enhancement of the β-phase content [12]. Finally, ferroelectric materials such as barium titanate were used to enhance the β-phase content as the ceramic nanoparticles act as nucleating agent for the crystallization of the PVDF matrix [13]. Other parameters such as polarity, surface area, particle size, and functionalization of the filler can were reported to control the β-phase content [11]. Electrospinning is another technique used to increase the β-phase content through shearing forces which results from forcing the solution through the spinneret, the coulombic force between the collector and the spinneret, and the mechanical force during the elongation of the fibers by using a rotating disk or drum [4,14].
Silver nanoparticles (AgNPs) can be used as a filler in PVDF to increase the β-phase content and as an anti-bacterial/anti-fouling agent in membrane filtration industry and in surgical mesh and sutures [15]. Shrivastava et al. [16] reported that 25 μg∙mL−1 will completely inhibit the bacteria, regardless of whether it is positive or negative, or it is antibiotic resistant or non-resistant. The AgNPs apparently attach to walls of the bacterial cells, penetrate them, and destroy the cell content, either as silver clusters or as silver ions [16,17].
Researchers used different methods to load the AgNPs and nanowires into the PVDF matrix. Methods include solution casting of silver nanowires (AgNWs) [18] or Ag@TiO2 core@shell nanoparticles [19], surface immobilization in presence of poly(acrylic acid) [20], and exothermic decomposition of silver trifluoroacetate at 240 °C in molten PVDF [21]. Electrons -rich AgNPs interact with fluorine atoms in the PVDF forcing its chains to be in the β-conformation, thus increasing the β-phase content. Such interactions were confirmed by using X-ray photoelectron spectroscopy (XPS) [12], and UV and FTIR spectroscopy [18].
The work reported in this paper is aimed at complementing work done by three other groups [12,17,18] in addition to investigating the piezoelectric response of the PVDF/AgNPs electrospun mats. The first group [17] used 5 nm prepared AgNPs to enhance the antifouling properties of PVDF membranes and reported that the produced nanocomposite fibers became smoother and finer with addition of silver. The second group [12] investigated the polymorphism and dielectric properties of PVDF/AgNPs electrospun mats. They first prepared PVDF fibers with silver nitrate salts, and then kept it in daylight for a week to convert the silver nitrate to AgNPs in the range of 20–50 nm. The diameter of the neat PVDF fibers was found to be about 250 nm, but with the silver particles, it increased to about 600 nm, and the thermal stability was enhanced after the addition of AgNPs. The third group [18] used AgNWs to enhance the sensitivity of pressure sensors. They reported that the fibers became rough with increasing the silver content, and the maximum β-phase content was observed for the 1.5% of AgNWs content. Another group, which investigated the physical properties of PVDF/AgNPs, but at high silver contents up to 90%, found that the thermal stability was slightly improved up to 20% AgNPs content, but higher silver contents facilitated the decomposition of PVDF [22].
In this paper, we looked at the morphologies of electrospun PVDF fibers and mats containing AgNPs at concentrations between 0 and 1.0 wt %, and at the influence of the presence and content of AgNPs on different thermal, mechanical and piezoelectric properties of the fiber mats.
2. Results and Discussion
2.1. Morphology
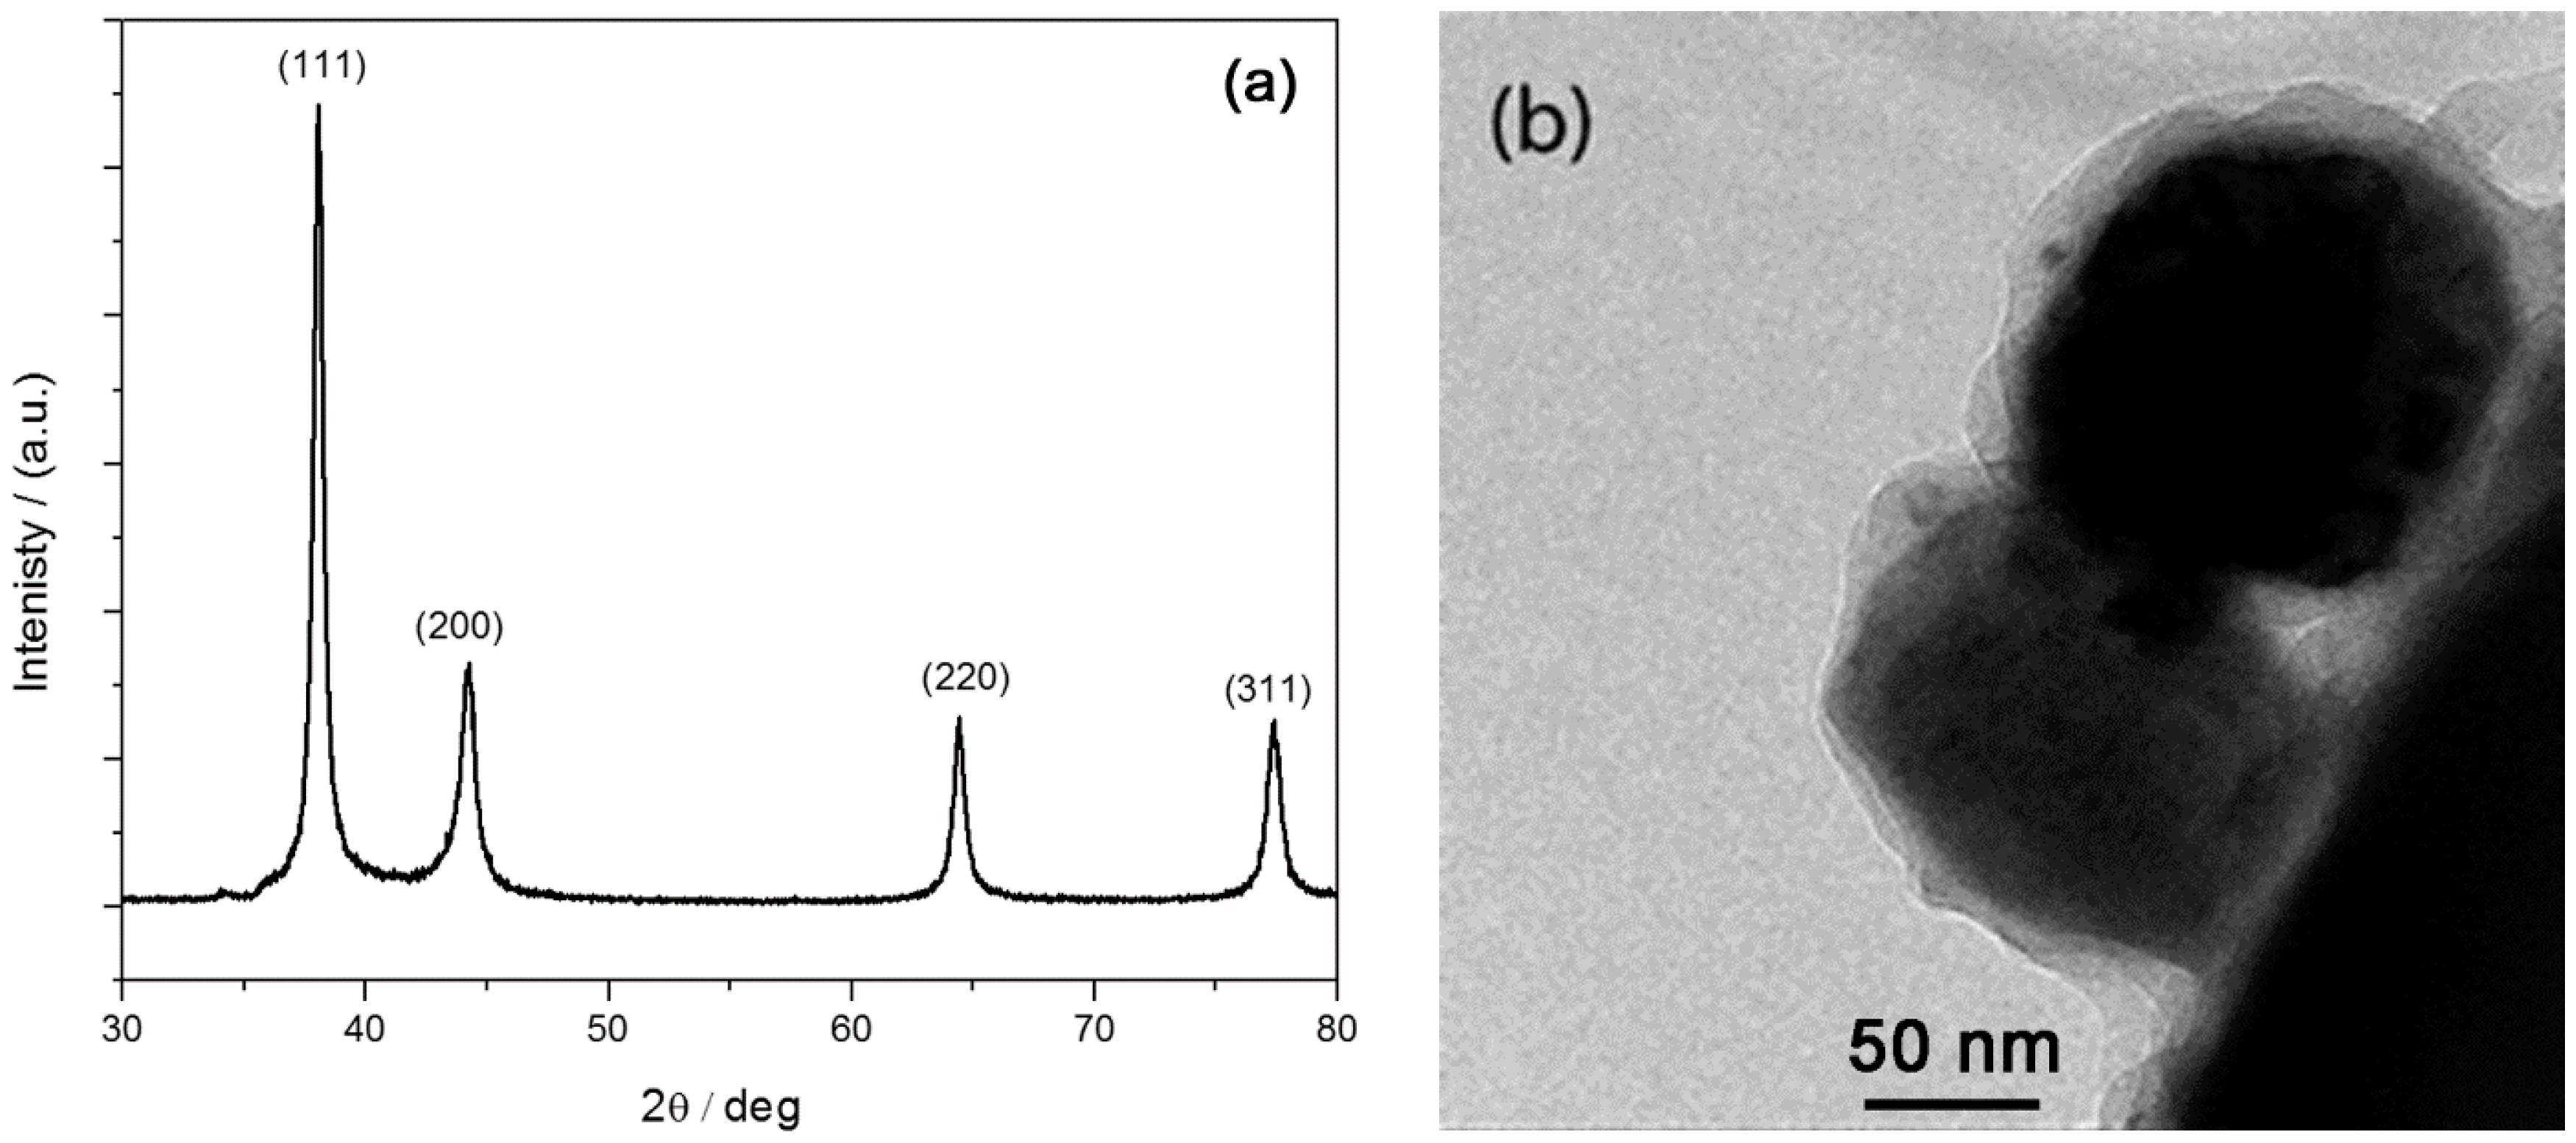
The morphologies of the AgNPs in DMF have been investigated through TEM and XRD. The TEM micrograph shows that the nanoparticles have spherical shapes (Figure 1b with diameters around 100 nm, while calculations from the XRD spectrum in Figure 1a using the Debye-Scherrer equation shows that the AgNPs had sizes in the range of 25–40 nm. This indicates some agglomeration when dispersed in the DMF solvent, which was confirmed through TEM analysis. The silver nanoparticle sizes were found to be in a range of 25–40 nm.
The viscosity of the solutions slightly decreased with the addition of silver nanoparticles and with increasing nanoparticle content (Table 1). The reason for this probably is that the polymer molecules were adsorbed on the surfaces of the AgNPs, leading to shrinkage in the volume of the polymer molecules and an increase in the mobility of the solvent molecules. There were small increases in viscosity at AgNPs contents of 0.4% and 0.6%, which could have been due to a change in solvent ratios brought about by different rates of acetone evaporation during the electrospinning of the different samples. The conductivity (Table 1) increased significantly after dissolution of the polymer, but only slightly in the presence of and with increasing content of AgNPs. This was probably due to the free fluoride and proton ions from the polymer.
One parameter that controls the diameter of the electrospun fibers is the ratio between the surface and volume charge densities at the tip of the Taylor cone [23]. The charged silver nanoparticles therefore play an important role in controlling the surface and volume charge density ratios at the tip of the Taylor cone during the splaying, and hence in determining the diameters of the produced fibers.
Our work shows that mats with fairly well aligned fibers were formed during the electrospinning of PVDF with different AgNPs contents between 0.2% and 1.0% (Figure 2a). The fibers also did not show a systematic variation in the fiber diameter (Table 2), which can be attributed to the fact that the collecting area of the rotating disk was very small, leading to diffusion of the wet fibers.
The fiber diameters generally ranged between 100 and 1600 nm, with a fair amount of large-diameter fibers (Figure 2b). Generally, the fibers showed fairly broad diameter distributions, except for the sample with 0.6% AgNPs. With increasing silver content, the fibers became well defined and dry, which we ascribe to the improved thermal conduction in the presence of the silver nanoparticles, and which contributed to improved solvent evaporation during the fly in the electrical field and after deposition on the rotating disk.
2.2. β-Phase Content in the PVDF/AgNPs Composites
The most commonly used techniques to investigate the polymorphism of PVDF are DSC, FTIR, and XRD. The α- and β-phases can be easily distinguished from the γ-phase in the DSC curves, but they cannot be distinguished from each other. The FTIR cannot differentiate between the β- and γ-phases, especially at 840 cm−1, so that the γ-phase is frequently incorrectly taken into account when calculating the β-phase content by using Equation (3).
where are the absorbance at 766 and 840 cm−1 corresponding to the α- and β-phases, respectively [1,24].
Most researchers used the FTIR peaks in Table 3 to monitor the presence and quantity of each phase. The vibration modes corresponding to these peaks were discussed in our previous work [25]. However, the conformation of the β-phase is similar to that of the γ-phase, which causes some confusion because most of the β-phase bands are very close to those of the γ-phase.
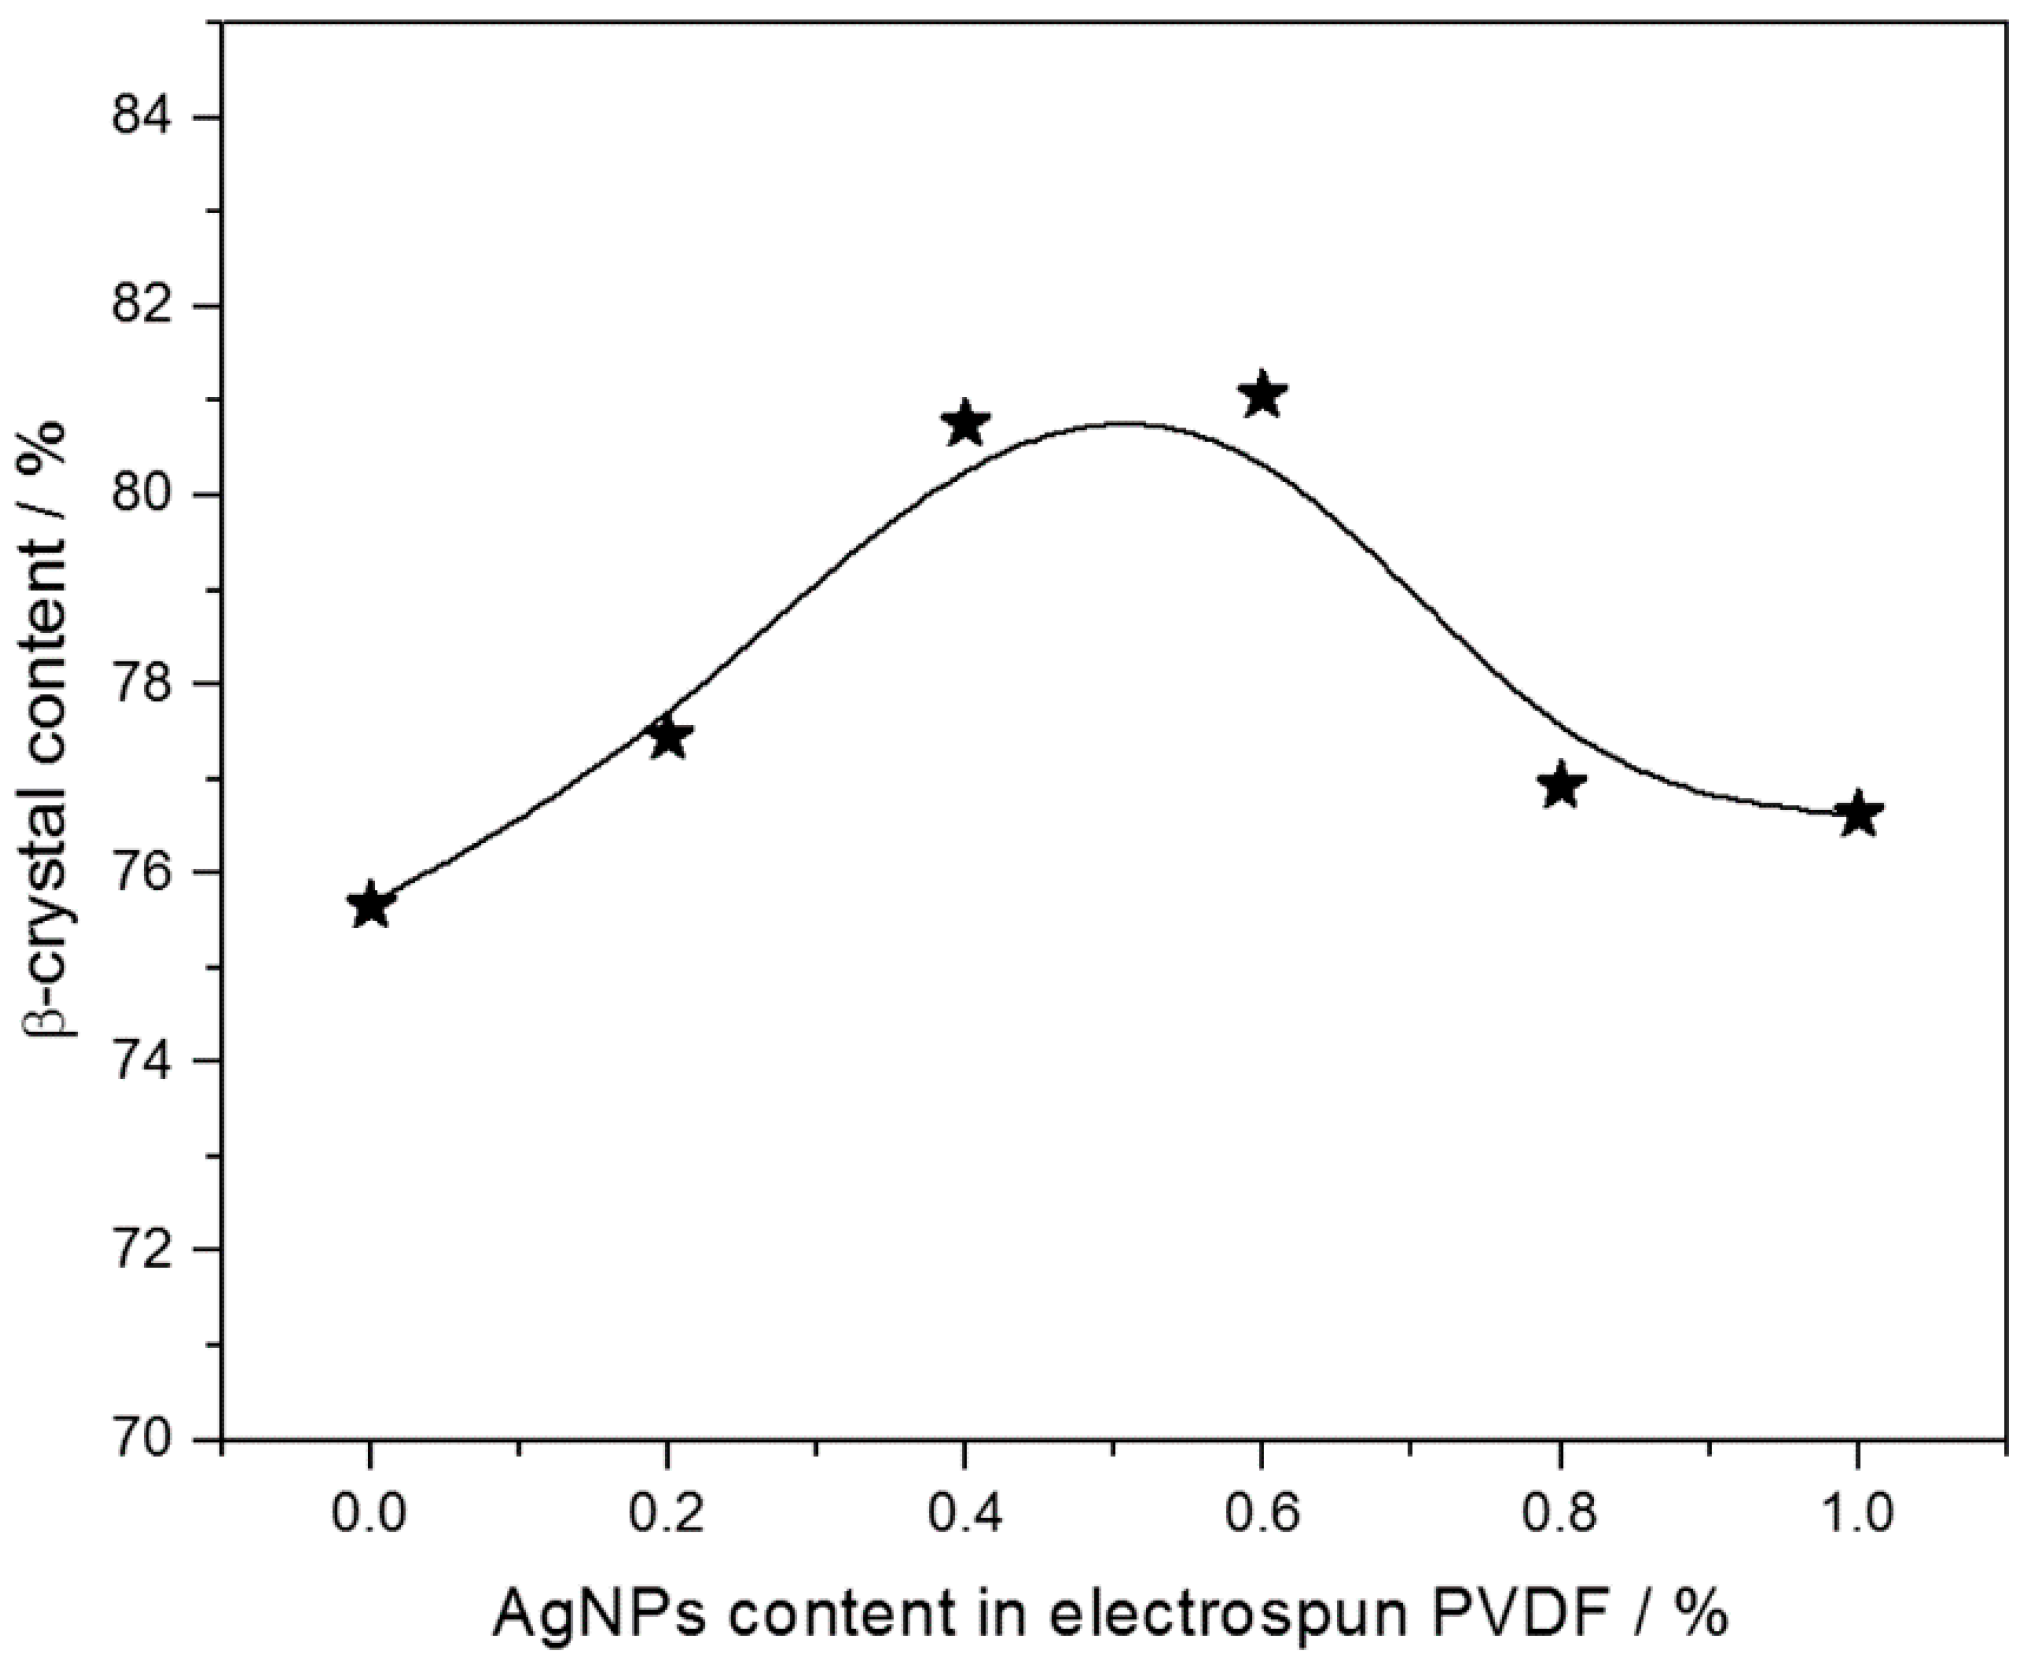
Previously, published work showed that the silver content to produce the highest β-phase content was 1.5% [18] and 10% [26]. Figure 3 shows the presence of β- and α-phases in the composites, and a clear reduction in the α-phase is observed with an increase in AgNPs content up to 0.4%, after which it again decreased. Neat PVDF shows the highest α-phase content. Equation (2) was used to calculate the percentage of the β-phase in the PVDF/AgNPs samples, and the results are shown in Figure 4. The β-content has a maximum value between 0.4% and 0.6% AgNPs content, after which it decreases with an increase in the AgNPs content.
2.3. Crystallinity
Fillers generally play an important role in polymer crystallization by (i) acting as nucleating sites for polymer crystallization, and (ii) immobilization of polymer chains. These are two opposing effects, because nucleation will increase the crystallinity, while chain immobilization will delay the crystallization process. In the case of the PVDF, the determination of crystallinity from DSC melting peaks is problematic, because the three crystalline phases of PVDF have significantly different ∆H0 values.
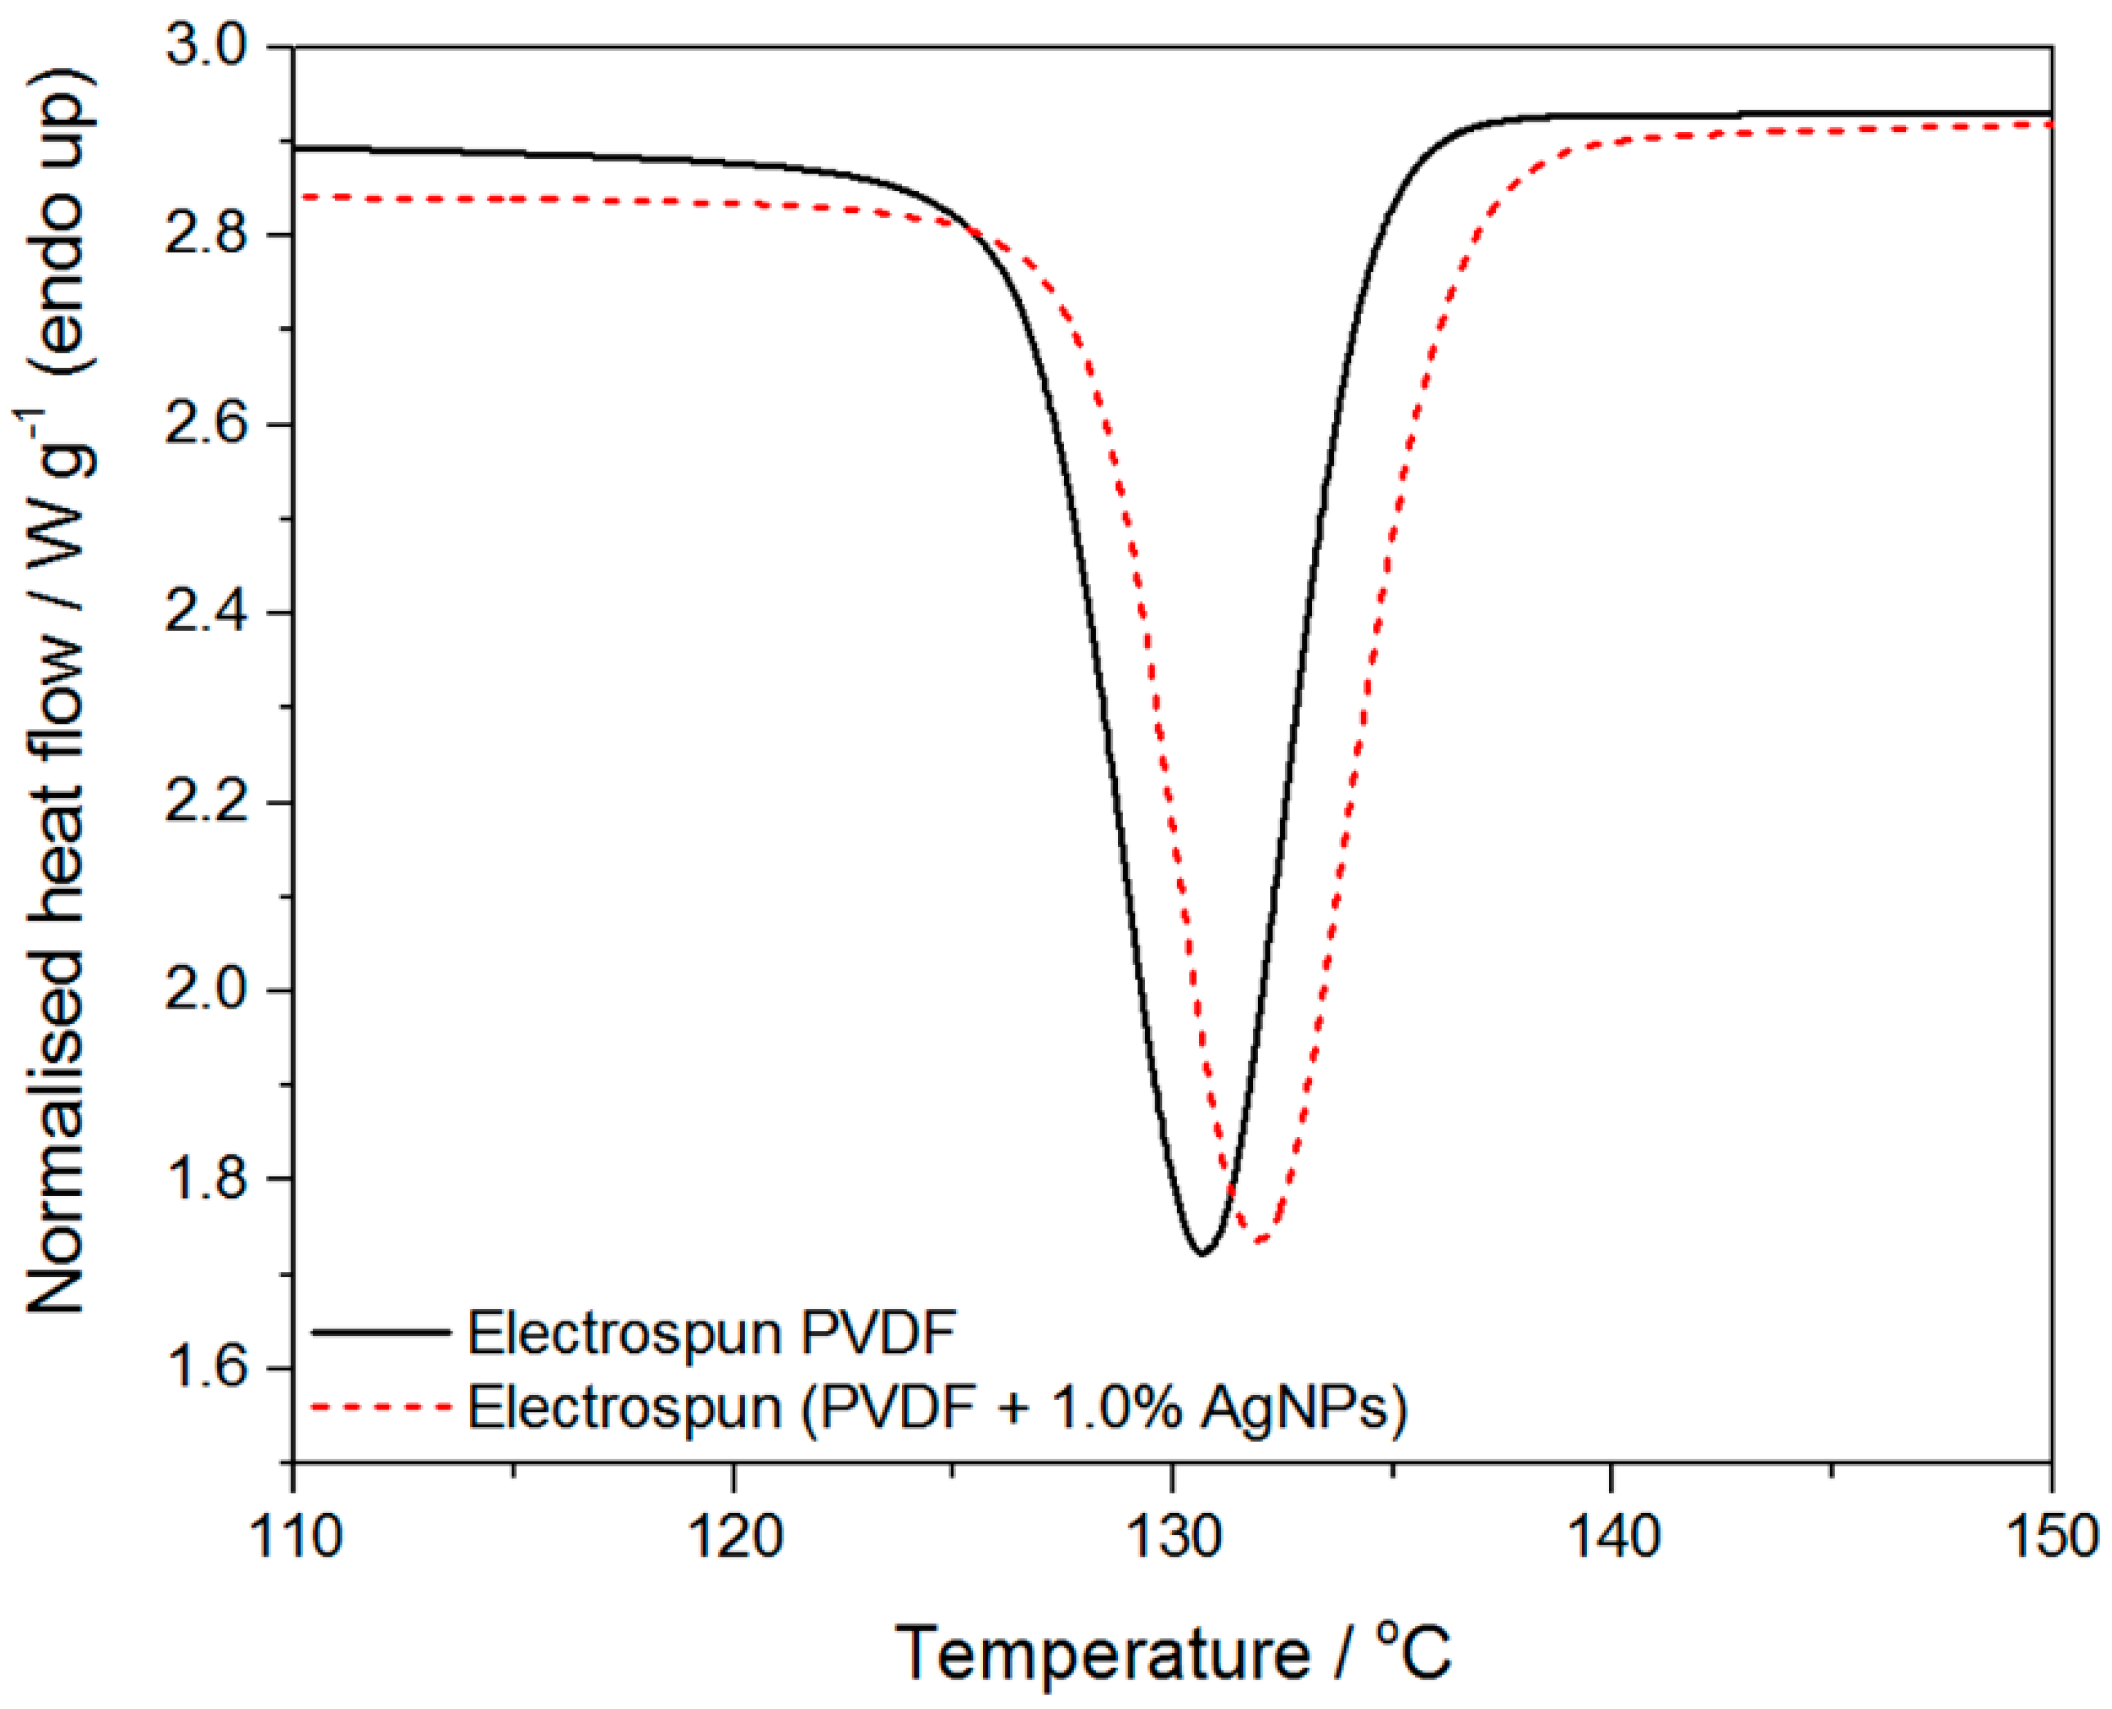
Figure 5 shows that the crystallization temperatures for the electrospun PVDF is lower than that of the electrospun (PVDF + 1.0% AgNPs), and the data in Table 4 show that the crystallinity (as indicated by the melting enthalpy) of the PVDF in the electrospun (PVDF + 1.0% AgNPs) was higher than that of the electrospun PVDF. This confirms that the AgNPs were well dispersed and exercised an observable nucleating effect on PVDF crystallization during electrospinning.
2.4. Thermal Degradation
The PVDF starts decomposing thermally by scissoring of the -C-H bond (410 kJ∙mol−1) followed by that of the -C-F bond (460 kJ∙mol−1) to form C-C double bonds. Hydrogen fluoride removal is then propagated along the polymer chains. The mass loss therefore occurs in two steps, elimination of HF and breaking down of the polymer chain, followed by the formation of tar. The PVDF crystalline morphology and degree of crystallinity have no influence on this process [27]. The process produces mainly three products: HF, tar, and char [28].
The thermal stability of the PVDF/AgNPs generally increased after the addition of AgNPs (Figure 6). This can be related to (i) the immobilization of the polymer and free radical chains through interaction with the AgNPs, and/or (ii) the interaction between the degradation volatiles and the AgNPs, which delayed the diffusion of these volatiles out of the polymer. One group made similar observations for PVDF with low AgNPs contents [12], while another group found that the AgNPs facilitated the thermal decomposition of PVDF at high silver nanoparticle contents, which they attributed to the high thermal conductivity of the silver [22]. Therefore, it can be claimed that the silver nanoparticles increase the thermal stability at low concentration due to preceding reasons. Meanwhile, they enhanced the thermal decomposition of PVDF at high concentration.
2.5. Tensile Properties
Figure 7 shows that the tensile strength of the nanocomposites generally increased with increasing AgNPs content. This is probably due to interactions between the polymer chains and the silver nanoparticles, which reinforced the electrospun fibers. These results show large standard deviations, because the tested samples were fiber mats with a non-uniform distribution of fiber thicknesses and defects knowing that four specimen were tested for each sample. Previous research also showed an increase in tensile strength up to 1% AgNPs, but a decrease at higher nanoparticle contents due to agglomeration of the AgNPs [22].
2.6. Broadband Dielectric Analysis
Many authors reported improvements in the dielectric constant of nanocomposites composed of PVDF, as well as other polymers, and various inorganic nanoparticle fillers [3,12,19,26,27,29,30,31,32,33,34,35,36,37]. Some of these studies reported on nanocomposites containing PVDF and silver nanoparticles [12,19,29,30,36].
The frequency dependence of the dielectric permittivity storage (ε′) and loss (ε″) at 20 °C for the AgNPs composites is shown in Figure 8. Values of ε′ monotonically increase with increasing the AgNPs content in the samples due to the conductivity of the AgNPs. The increase in permittivity is ascribed to the enhanced interfacial polarization associated with entrapment of free charges generated at the interfaces between the conducting AgNPs cores and the insulating polymer matrix. However, aggregation of the AgNPs would result in current leakage due to direct contact of Ag particles, and consequently, increase the dielectric loss (ε″) [19,36]. The SEM and TEM micrographs of our samples revealed such agglomerations of the AgNPs, as shown in Figure 1. Having conductive NPs, which are well dispersed and well isolated by the surrounding polymer matrix, is essential to acquire maximum ε′ and minimum ε″ for the nanocomposites.
Values of the ε′ at low f drop as f increases due to the Maxwell-Wagner-Sillars (MWS) interfacial polarization [38] and electrode polarization processes [39]. The drop in the ε′ values at higher f is due to the β-relaxation process, which will be discussed later in detail. Higher values of ε′ over ε″ suggests that the PVDF/AgNPs composites might be anticipated for energy storage media applications. To achieve the highest electrical energy storage capacity (Umax = ε′ Eb2/2), composites should enjoy both large ε′ and high dielectric breakdown strength (Eb) [34,35,36].
Shi et al. [12] reported the preparation of AgNO3/PVDF composite nanofiber by electrospinning. They reported values of the dielectric constant for their composites to be in the range of 80 to 140. These values are much higher than our results, which showed values of ε′ to be from 10 to 18. Many parameters could account for the lower dielectric constant values obtained for our samples. First, the content of the β-phase in our neat PVDF could be lower than that of the PVDF these authors used [7]. Increase in the β-polymorph, with all-trans chain conformation, in PVDF would make it more polarizable when the electric field is applied, as this phase is known to be piezoelectrically active [12,40]. The second reason would be related to the presence of porous fiber mats of different pore sizes in our samples compared to those reported in [12]. The air embedded in these pores have a lower dielectric constant than the surrounding polymer matrix or AgNPs, and thus different pore sizes would affect the overall ε′ values of the samples [29,41]. Li et al. [28] reported that the filling of the cavities between the core/shell Ag@SiO2 nanoparticles, with smaller size barium strontium titanate particles, caused the dielectric constant of the nanocomposite to improve.
The β-relaxation in the PVDF/AgNPs composites was analyzed using the commonly used to Havriliak Negami (HN) model, shown below [42,43], as depicted in Figure 9:
where ε′ and ε″ are the real and imaginary dielectric permittivities, respectively, and i2 = −1. Equation (2) has three relaxation terms in the sum and a term on the left accounts for dc conductivity. ε0 = vacuum permittivity and ω = 2πf. For each relaxation term k, the dielectric strength ∆εk = (εR − ε∞)k is the difference between ε′ at very low and very high frequencies, respectively. σdc is dc conductivity and the exponent N characterizes conduction in terms of nature of charge hopping pathways and charge mobility constraints. α and β characterize the breadth and degree of asymmetry, respectively, of ε″ vs. ω peaks.
The frequency at the ε″ peak maximum, fmax, for this relaxation increases with increasing temperature, reflecting faster segmental motions and shorter relaxation times, τmax = 1/2π fmax. The solid lines represent the HN model fits to the spectra of the different samples and they all seem to have very good fits to this model. The β-relaxation is thought by many researchers to represent the cooperative movement of the dipoles in the crystalline-amorphous interphase [44,45,46,47]. The spectra in Figure 9 indicate that the β-relaxation is very broad, especially in the low temperature region, which could be related to the microscopic heterogeneity in the amorphous packing [44]. τmax values of the β-relaxation spectra, fitted to the HN model, were extracted for all the samples at different temperatures. The values were then plotted against 1/T in Figure 10, showing non-Arrhenius behavior in accordance with the Vogel-Fulcher-Tammann-Hesse (VFTH) equation [48,49,50]:
where kB is the Boltzmann constant, τ0 is a hypothetical relaxation time at infinite temperature. Ea, have the units of energy but it is a ubiquitous quantity that it is not associated with an activated process in the common sense. TV, the Vogel temperature, is the temperature at which chain segments become frozen when the polymer is cooled quasi-statically from the rubbery state, in a hypothetical situation.
The curvature (vs. linearity) of the VFTH equation fit, dashed line in Figure 10, is unique for long-range motions in glass forming polymers. There is no significant difference between the relaxation time values for all the samples, indicating similar motions for the chain segments within the crystalline-amorphous interphase, even after AgNPs addition. One would expect the AgNPs to induce PVDF to crystallize in the β-conformation due to interactions of the -CF2 dipoles with the Ag nanoparticles, which would prompt the -CH2-CF2 units to adopt an all trans conformation [12,40]. Our results indicate an initial increase in the β-content with increasing the AgNPs in the composites (Figure 6). The β-relaxation is closely related to the extent of PVDF crystallization upon insertion of AgNPs, although it originates from the motions of the amorphous chain dipoles. Figure 10 reveals that the extent of β-content increase in our samples did not impose enough constraints on the dipole motions of the unconstrained amorphous phase or the chains moving in the proximity of the crystalline phase. Manna et al. [36] reported a similar result of slight increases in the motions of the PVDF relaxations, within the temperature range reported herein, upon addition of Ag nanoparticles.
2.7. Piezoelectric Studies
AgNPs were used to decorate carbon-based fillers like carbon nanotubes (CNT) and graphene to get outstanding energy-harvesting properties [51,52]. When AgNPs were used in addition to the CNTs, the piezoelectric coefficient of the PVDF composite became 54 pm/V compared to the CNT filled PVDF (35 pm/V) [51,52]. Sinha et al. [52] synthesized a graphene-Ag/PVDF nanocomposite by a one-pot method, which showed a 15% piezoelectric energy conversion efficiency in the dark. In visible light, the conversion efficiency was about 47% suggesting its application in self-powered optoelectronic smart sensors.
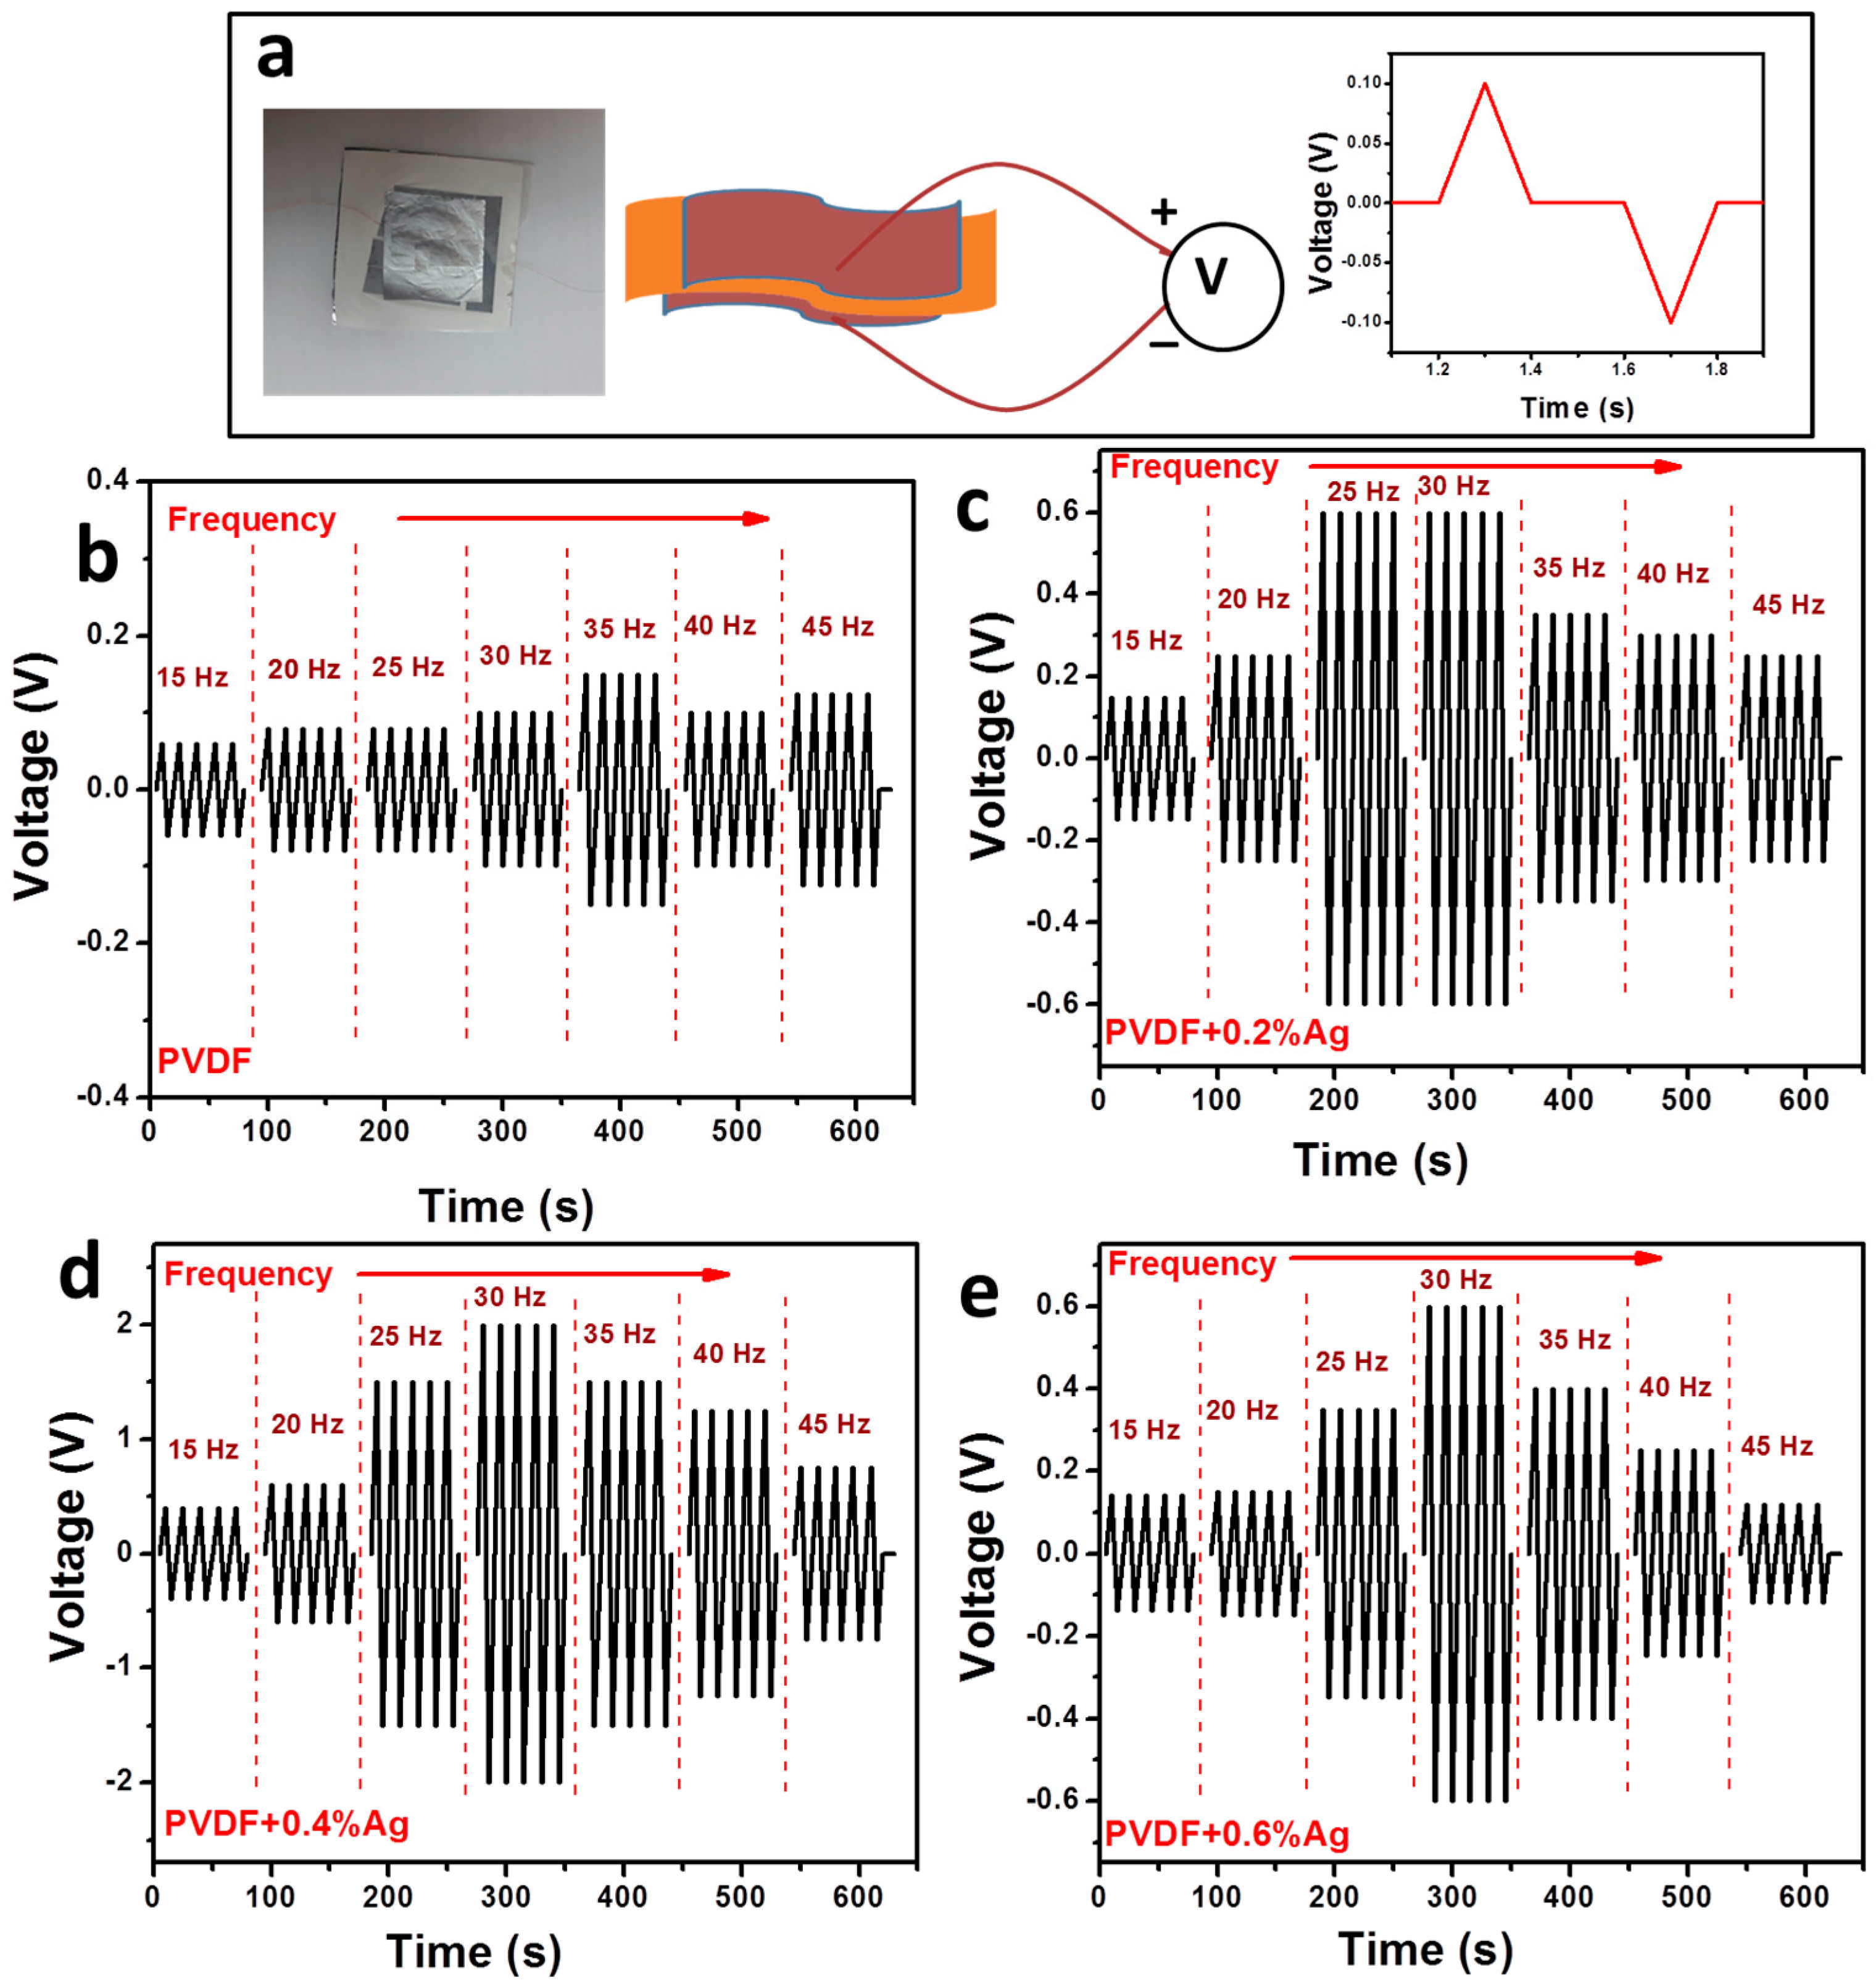
The piezoelectric responses for our samples were recorded as a variation in the generated voltage against the mechanical vibrations given to the sample. Figure 11a shows the sample used for the analysis along with a schematic representation of the setup. The surfaces of the sample were electroded for better contact, and the conducting wires were attached to a resistor box and the data acquisition system to monitor the voltage variations. The mechanical vibration creates a voltage signal, and the intensity of the signal varies with respect to the frequency of the vibrations. Figure 11b–e shows the variations in the generated voltage for all the samples studied with respect to mechanical vibrations. Pure PVDF showed a maximum voltage of 0.15 V at a 35 Hz vibrating frequency, and this frequency was observed as the resonance frequency for all the samples around which a maximum voltage was generated. When the filler concentration changed from 0.2% to 0.4%, the maximum generated voltage changed from 0.6 V to 2 V. However, at a higher filler concentration of 0.6%, the maximum voltage again dropped to 0.6 V. This result was in accordance with the β-crystalline phase analyzed by the DSC and FTIR studies shown earlier. The main reason behind the energy-harvesting property of PVDF composites is the aligned β-phase present in the sample. Here the electrospinning effectively oriented the β-crystalline phase of the PVDF nanocomposites, and the interaction between the Ag nanoparticles and the PVDF chains further enhanced the phase conformation and thus the piezoelectric property. This result also correlates well with the observed dielectric storage permittivity enhancement with increasing AgNPs content in the composites.
3. Materials and Methods
3.1. Materials
All the reagents and chemicals used in this study were obtained commercially. PVDF was in powder form (average molecular weight 534,000 amu, melting point 165 °C) from Sigma-Aldrich( St. Louis, MS, USA); acetone (ACS, >99.5%) from Alfa Aesar (Haverhill, MA, USA); dimethylformamide (DMF) (ACS, ≥99.8%) from Sigma Aldrich; silver nanoparticles (Ag-NPs, diameter from 20–100 nm) from Sigma Aldrich. The solvents were used without further purification.
3.2. Preparation of Nanofibre Mats
A 13% PVDF solution was prepared by mixing 40 g acetone, 60 g DMF and 15 g PVDF, and stirring under heating at 70 °C for 2 h until the solution became clear. The preparation of the PVDF/AgNPs composite fiber mats was based on previously reported methods [17,18]. PVDF/AgNPs solutions were prepared as follows: 0.0525 g of AgNPs was mixed with 20 g of the 13% PVDF solution to prepare a 2% PVDF/AgNPs stock solution. The working solutions were then prepared by dilution of the stock solution with pure PVDF solution. 1, 2, 3, 4 and 5 g of the stock solution were diluted to 10 g with pure PVDF solution to prepare the working solutions (0.2%, 0.4%, 0.6%, 0.8% and 1% AgNPs), which were continuously stirred until the electrospinning process. The solutions were sonicated for 10 min, then electrospun, under the conditions given in Table 5, by using an electrospinning machine NEU-01 with its accessories from NaBond, China. At least 4 mL of each PVDF/AgNPs solution was used to prepare the fibrous mats.
3.3. Characterization and Analysis Techniques
Scanning electron microscopy (SEM) analyses were done in an FEI Quanta 200, USA scanning electron microscope at an accelerating voltage of 3 kV. The particle sizes and fiber diameters were determined by using the ZEN imaging software from Zeiss.
Transmission electron microscopy (TEM) analyses were done in an FEI G2 TF20, USA transmission electron microscope at an accelerating voltage of 200 kV.
The β-phase content was determined by using Fourier-transform infrared (FTIR) spectroscopy (Perkin Elmer Spectrum 400 FTIR with an ATR detector) at a resolution of 4 cm−1 at a range of 400 to 4000 cm−1.
X-ray diffraction (XRD) analyses were done using a Rigaku Miniflex X-ray diffractometer with a Cu-Kα (1.5406 Å) source, applied voltage of 30 kV, current of 30 mA, and a scan rate of 3°∙min−1.
The viscosities of the solutions were measured by using a Cannon-Fenske 450 viscometer at 26 °C and with glycerol as a standard.
The electrical conductivities of the solutions were measured by using a Suntex Sc-170 conductivity meter at room temperature.
The crystallinity of the samples was determined by using a Perkin Elmer DSC4000 differential scanning calorimeter (DSC). The samples were heated, cooled and re-heated between 40 and 200 °C at 10 °C∙min−1 under nitrogen flow.
The thermal stability of the samples was determined by using a Perkin Elmer TGA4000 thermogravimetric analyzer (TGA). The samples were heated from 40 to 750 °C at 10 °C min−1 under nitrogen flow.
The tensile properties were determined in a Lloyd Instruments LF Plus universal tester. The samples had a length of 75 mm, a width of 5 mm, and a thickness ranging between 0.08 and 0.15 mm. The tests were conducted at a crosshead speed of 50 mm min−1 with a gauge length of 25 mm. Measurements were conducted on four specimen for each sample.
The dielectric analyses of the samples were done in a Novocontrol GmbH Concept 40 broadband dielectric spectrometer, and the data were collected over a frequency (f) range of 0.07 to 107 Hz at fixed temperatures in the range of −140 to 140 °C. The temperature stability of the instrument was within ± 0.2 °C. Sample discs of 2 cm diameter were sandwiched between two copper-coated with gold electrodes of 2 cm diameter, and transferred to the instrument for data collection.
The piezoelectric energy-harvesting efficiency of the composites was monitored using a homemade set up consists of a frequency generator, amplifier, vibrating shaker, resistor box and data acquisition system. The load resistance was made constant as 1 MΩ throughout the studies. Specific weights were kept on the electrode surface of the sample so that vibrations in the vertical direction are imposed on it. Frequencies were changed from 15 to 55 Hz and the voltage values were determined.
4. Conclusions
Electrospun PVDF fiber mats that contained different contents of AgNPs between 0 and 1.0% were produced in this research. The β-content in the PVDF was found to increase by about 8% for AgNPs content of 0.4–0.6%. The electrospun fibers had a higher β-crystalline content, nano-pores were visible on the fiber surfaces, and the total crystallinity, tensile strength and thermal stability were improved. The elastic modulus, as measured with dynamic mechanical analysis, increased significantly despite the apparent lack of interfacial adhesion between the PVDF and AgNPs. Broadband dielectric analysis of the PVDF/AgNPs composites revealed that the β-relaxation dynamics, assigned to the activity of chain segments in the vicinity of the crystalline-amorphous interphase, did not change with AgNPs addition. The dielectric storage permittivity increased with increasing AgNPs content in the composites due to the conductive nature of the silver nanoparticles. The increase in permittivity is attributed to the improved interfacial polarization due to entrapment of electrons at the interfaces between the silver nanoparticle surfaces and the insulating polymer matrix. Results showed higher values of ε′ over ε″ at room temperature for the composites, which suggest that they could be beneficial for energy storage applications such as supercapacitors. Good piezoelectric response of the nanocomposite at a fairly low AgNPs content of 0.4% further suggest its application in designing nano generators and self-powering devices.
Acknowledgments
This article was made possible by NPRP grant # NPRP6-282-2-119 from the Qatar National Research Fund (a member of Qatar Foundation). The statements made herein are solely the responsibility of the authors.
Author Contributions
Mohammad K. Hassan, Mariam A. Al-Maadeed, and Adriaan S. Luyt conceived and designed the experiments and revised the full manuscript of the article. Ahmed A. Issa and Deepalekshmi Ponnamma prepared the materials, performed the measurements, analyzed the data, and wrote portions of the paper.
Conflicts of Interest
The authors declare no conflict of interest.
References
- Martins, P.; Lopes, A.C.; Lanceros-Mendez, S. Electroactive phases of poly(vinylidene fluoride): Determination, processing and applications. Prog. Polym. Sci. 2014, 39, 683–706. [Google Scholar] [CrossRef]
- Rajesh, P.S.M.; Bodkh, S.; Kamle, S.; Verma, V. Enhancing β-Phase in PVDF through Physicochemical Modification of Cellulose. Electron. Mater. Lett. 2014, 10, 315–319. [Google Scholar] [CrossRef]
- Gonçalves, P.M.M.R.; Caparrós, C.; Martins, P.; Benelmekki, A.M.; Botelho, G.; Lanceros-Mendez, S.; Lasheras, D.A.; Gutiérrez, J.; Barandiarán, J.M. Nucleation of the electroactive β-phase, dielectric and magnetic response of poly(vinylidene fluoride) composites with Fe2O3 nanoparticles. J. Non-Cryst. Solids 2013, 361, 93–99. [Google Scholar] [CrossRef]
- Yee, W.A.; Kotaki, M.; Liu, Y.; Lu, X. Morphology, polymorphism behavior and molecular orientation of electrospun poly(vinylidene fluoride) fibers. Polymer 2007, 48, 512–521. [Google Scholar] [CrossRef]
- Salimi, A.; Yousefi, A.A. Analysis Method FTIR studies of β-phase crystal formation in stretched PVDF films. Polym. Test. 2003, 22, 699–704. [Google Scholar] [CrossRef]
- Kakimoto, K.-I.; Fukata, K.; Ogawab, H. Fabrication of fibrous BaTiO3-reinforced PVDF composite sheet for transducer application. Sens. Actuators A 2013, 200, 21–25. [Google Scholar] [CrossRef]
- Low, Y.K.A.; Tan, L.Y.; Tan, L.P.; Boey, F.Y.C.; Ng, K.W. Increasing solvent polarity and addition of salts promote β-phase poly(vinylidene fluoride) formation. J. Appl. Polym. Sci. 2013, 128, 2902–2910. [Google Scholar] [CrossRef]
- Chen, D.; Sharma, T.; Zhang, J.X.J. Mesoporous surface control of PVDF thin films for enhanced piezoelectric energy generation. Sens. Actuators A 2014, 216, 196–201. [Google Scholar] [CrossRef]
- Layek, R.K.; Das, A.K.; Park, M.J.; Kim, N.H.; Lee, J.H. Enhancement of physical, mechanical, and gas barrier properties in noncovalently functionalized graphene oxide/poly(vinylidene fluoride) composites. Carbon 2015, 81, 329–338. [Google Scholar] [CrossRef]
- An, N.; Liu, S.; Fang, C.; Yu, R.; Zhou, X.; Cheng, Y. Preparation and properties of β-phase graphene oxide/PVDF composite films. J. Appl. Polym. Sci. 2015, 132, 1–8. [Google Scholar] [CrossRef]
- Bodkhe, S.; Rajesh, P.S.M.; Kamle, S.; Verma, V. β-phase enhancement in polyvinylidene fluoride through filler addition: Comparing cellulose with carbon nanotubes and clay. J. Polym. Res. 2014, 21, 1–11. [Google Scholar] [CrossRef]
- Shi, N.; Duan, J.; Su, J.; Huang, F.; Xue, W.; Zheng, C.; Qian, Y.; Chen, S.; Xie, L.; Huang, W. Crystal polymorphism and enhanced dielectric performance of composite nanofibers of poly(vinylidene fluoride) with silver nanoparticles. J. Appl. Polym. Sci. 2013, 128, 1004–1010. [Google Scholar] [CrossRef]
- Chiolerio, A.; Lombardi, M.; Guerriero, A.; Canavese, G.; Stassi, S.; Gazia, R.; Cauda, V.; Manfredi, D.; Chiodoni, A.; Verna, A.; et al. Effect of the fabrication method on the functional properties of BaTiO3:PVDF nanocomposites. J. Mater. Sci. 2013, 48, 6943–6951. [Google Scholar] [CrossRef]
- Matabola, K.P.; Moutloali, R.M. The influence of electrospinning parameters on the morphology and diameter of poly(vinyledene fluoride) nanofibers—Effect of sodium chloride. J. Mater. Sci. 2013, 48, 5475–5482. [Google Scholar] [CrossRef]
- Lafrance, C.-P.; Prud’homme, R.E.; Guidoin, R. Identification and quantification of the crystalline structures of poly(vinylidene fluoride) sutures by wide-angle X-ray scattering and differential scanning calorimetry. J. Biomed. Mater. Res. 1998, 39, 184–189. [Google Scholar]
- Shrivastava, S.; Bera, T.; Roy, A.; Singh, G.; Ramachandrarao, P.; Dash, D. Characterization of enhanced antibacterial effects of novel silver nanoparticles. Nanotechnology 2007, 18, 225103–225112. [Google Scholar] [CrossRef]
- Yuan, J.; Geng, J.; Xing, Z.; Shen, J.; Kang, I.K.; Byun, H. Electrospinning of antibacterial poly(vinylidene fluoride) nanofibers containing silver nanoparticles. J. Appl. Polym. Sci. 2010, 116, 668–672. [Google Scholar] [CrossRef]
- Li, B.; Xu, C.; Zheng, J.; Xu, C. Sensitivity of Pressure Sensors Enhanced by Doping Silver Nanowires. Sensors 2014, 14, 9889–9899. [Google Scholar] [CrossRef] [PubMed]
- Dang, Z.-M.; You, S.-S.; Zha, J.-W.; Song, H.-T.; Li, S.-T. Effect of shell-layer thickness on dielectric properties in Ag@TiO2 core@shell nanoparticles filled ferroelectric poly(vinylidene fluoride) composites. Phys. Status Solidi 2010, 207, 739–742. [Google Scholar] [CrossRef]
- Li, J.H.; Shao, X.S.; Zhou, Q.; Li, M.Z.; Zhang, Q.Q. The double effects of silver nanoparticles on the PVDF membrane: Surface hydrophilicity and antifouling performance. Appl. Surf. Sci. 2013, 265, 663–670. [Google Scholar] [CrossRef]
- Compton, J.; Kranbuehl, D.; Martin, G.; Espuche, E.; David, L. In situ formation of a uniform distribution of silver nanoparticles in PVDF: Kinetics of formation and resulting properties. Macromol. Symp. 2007, 247, 182–189. [Google Scholar] [CrossRef]
- Chae, D.W.; Hwang, S.S.; Hong, S.M.; Hong, S.P.; Cho, B.G.; Kim, B.C. Influence of high contents of silver nanoparticles on the physical properties of poly(vinylidene fluoride). Mol. Cryst. Liq. Cryst. 2007, 464, 233–241. [Google Scholar] [CrossRef]
- Theron, S.A.; Zussman, E.; Yarin, A.L. Experimental investigation of the governing parameters in the electrospinning of polymer solutions. Polymer 2004, 45, 2017–2030. [Google Scholar] [CrossRef]
- Cui, Z.; Hassankiadeh, N.T.; Zhuang, Y.; Drioli, E.; Lee, Y.M. Crystalline polymorphism in poly(vinylidenefluoride) membranes. Prog. Polym. Sci. 2015, 51, 94–126. [Google Scholar] [CrossRef]
- Issa, A.A.; Al-Maadeed, M.; Luyt, A.S.; Mrlik, M.; Hassan, M.K. Investigation of the physico-mechanical properties of electrospun PVDF/cellulose (nano)fibers. J. Appl. Polym. Sci. 2016, 133, 43594. [Google Scholar] [CrossRef]
- Greco, T.; Wang, F.; Wegener, M. Multifunctional silver poly(vinylidene fluoride) nanocomposites: Nanoparticle synthesis, film processing, and structural characterization. Ferroelectrics 2010, 405, 85–91. [Google Scholar] [CrossRef]
- Botelho, G.; Lanceros-Mendez, S.; Gonçalves, A.M.; Sencadas, V.; Rocha, J.G. Relationship between processing conditions, defects and thermal degradation of poly(vinylidene fluoride) in the β-phase. J. Non-Cryst. Solids 2008, 354, 72–78. [Google Scholar] [CrossRef]
- Issa, A.A.; Al-Maadeed, M.A.A.S.; Mrlík, M.; Luyt, A.S. Electrospun PVDF graphene oxide composite fiber mats with tunable physical properties. J. Polym. Res. 2016, 23, 232. [Google Scholar] [CrossRef]
- Li, X.; Niitsoo, O.; Couzis, A. Electrostatically assisted fabrication of silver-dielectric core/shell nanoparticles thin film capacitor with uniform metal nanoparticle distribution and controlled spacing. J. Colloid Interface Sci. 2016, 465, 333–341. [Google Scholar] [CrossRef] [PubMed]
- Tawansi, A.; Oraby, A.H.; Badr, S.I.; Elashmawi, I.S. Physical properties and β-phase increment of AgNO3-filled poly(vinylidene fluoride) films. Polym. Int. 2004, 53, 370–377. [Google Scholar] [CrossRef]
- Zhang, Z.; Gu, Y.; Bi, J.; Wang, S.; Li, M.; Zhang, Z. Tunable BT@SiO2 core@shell filler reinforced polymer composite with high breakdown strength and release energy density. Compos. Part A Appl. Sci. Manuf. 2016, 85, 172–180. [Google Scholar] [CrossRef]
- Zhang, Y.; Wang, Y.; Deng, Y.; Li, M.; Bai, J. Enhanced dielectric properties of ferroelectric polymer composites induced by metal-semiconductor Zn-ZnO core-shell structure. ACS Appl. Mater. Interfaces 2012, 4, 65–68. [Google Scholar] [CrossRef] [PubMed]
- Mahendia, S.; Tomar, A.K.; Kumar, S. Electrical conductivity and dielectric spectroscopic studies of PVA-Ag nanocomposite films. J. Alloy Compd. 2010, 508, 406–411. [Google Scholar] [CrossRef]
- Yu, S.; Qin, F.; Wang, G. Improving the dielectric properties of poly(vinylidene fluoride) composites by using poly(vinyl pyrrolidone)-encapsulated polyaniline nanorods. J. Mater. Chem. C 2016, 4, 1504–1510. [Google Scholar] [CrossRef]
- Zhou, W.; Dong, L.; Sui, X.; Wang, Z.; Zuo, J.; Cai, H.; Chen, Q. High dielectric permittivity and low loss in PVDF filled by core-shell Zn@ZnO particles. J. Polym. Res. 2016, 23, 1–9. [Google Scholar] [CrossRef]
- Kuang, X.; Liu, Z.; Zhu, H. Dielectric properties of Ag@C/PVDF composites. J. Appl. Polym. Sci. 2013, 129, 3411–3416. [Google Scholar] [CrossRef]
- Paleo, A.J.; Martínez-Boubeta, C.; Balcells, L.; Costa, C.M.; Sencadas, V.; Lanceros-Mendez, S. Thermal, dielectrical and mechanical response of α and β-poly(vinilydene fluoride)/Co-MgO nanocomposites. Nanoscale Res. Lett. 2011, 6, 257. [Google Scholar] [CrossRef] [PubMed]
- Vasundhara, K.; Mandal, B.P.; Tyagi, A.K. Enhancement of dielectric permittivity and ferroelectricity of a modified cobalt nanoparticle and polyvinylidene fluoride based composite. RSC Adv. 2015, 5, 8591–8597. [Google Scholar] [CrossRef]
- Ahmed, H.M.; Hassan, M.K.; Mauritz, K.A.; Bunkley, S.L.; Buchanan, R.K.; Buchanan, J.P. Dielectric properties of C60 and Sc3N@C80 fullerenol containing polyurethane nanocomposites. J. Appl. Polym. Sci. 2014, 131, 40577. [Google Scholar] [CrossRef]
- Manna, S.; Batabyal, S.K.; Nandi, A.K. Preparation and characterization of silver-poly(vinylidene fluoride) nanocomposites: Formation of piezoelectric polymorph of poly(vinylidene fluoride). J. Phys. Chem. B 2006, 110, 12318–12326. [Google Scholar] [CrossRef] [PubMed]
- Li, Y.; Lu, X.; Liu, X.; Zhang, C.; Li, X.; Zhang, W.; Wang, C. Ultra-low dielectric performance of polymer electrospun nanofiber mats. Appl. Phys. A Mater. Sci. Process. 2010, 100, 207–212. [Google Scholar] [CrossRef]
- Havriliak, S.; Negami, S. A complex plane analysis of α-dispersions in some polymer systems. J. Polym. Sci. 1966, 14, 99–117. [Google Scholar] [CrossRef]
- Havriliak, S.; Negami, S. A complex plane representation of dielectric and mechanical relaxation processes in some polymers. Polymer 1967, 8, 161–210. [Google Scholar] [CrossRef]
- Sencadas, V.; Lanceros-Méndez, S.; Sabater, R.; Serra, I.; Balado, A.A.; Gómez, J.L. Ribelles Relaxation dynamics of poly(vinylidene fluoride) studied by dynamical mechanical measurements and dielectric spectroscopy. Eur. Phys. J. E 2012, 35, 41. [Google Scholar] [CrossRef] [PubMed]
- Gregorio, R., Jr.; Ueno, E.M. Effect of crystalline phase, orientation and temperature on the dielectric properties of poly (vinylidene fluoride) (PVDF). J. Mater. Sci. 1999, 34, 4489–4500. [Google Scholar] [CrossRef]
- Hahn, B.; Wendorff, J.; Yoon, D.Y. Dielectric relaxation of the crystal-amorphous interphase in poly(vinylidene fluoride) and its blends with poly(methyl methacrylate). Macromolecules 1985, 18, 718–721. [Google Scholar] [CrossRef]
- Ando, Y.; Hanada, T.; Saitoh, K. Quantitative confirmation of the crystal-amorphous interphase in semicrystalline poly(vinylidene fluoride) and poly(vinylidene fluoride)/poly(ethyl methacrylate) blends, Journal of Polymer Science. Part B Polym. Phys. 1994, 32, 179–185. [Google Scholar] [CrossRef]
- Vogel, H. The law of the relation between the viscosity of liquids and the temperature. Physik. Z. 1921, 22, 645–646. [Google Scholar]
- Fulcher, G.S. Analysis of recent measurements of the viscosity of glasses. J. Am. Ceram. Soc. 1925, 8, 339–355. [Google Scholar] [CrossRef]
- Tammann, G.; Hesse, W. Die Abhängigkeit der Viscosität von der Temperatur bie unterkühlten Flüssigkeiten. Z. Anorg. Allg. Chem. 1926, 156, 245–257. [Google Scholar] [CrossRef]
- Sharma, M.; Srinivas, V.; Madras, G.; Bose, S. Outstanding dielectric constant and piezoelectric coefficient in electrospun nanofiber mats of PVDF containing silver decorated multiwall carbon nanotubes: Assessing through piezoresponse force microscopy. RSC Adv. 2016, 6, 6251–6258. [Google Scholar] [CrossRef]
- Sinha, T.K.; Ghosh, S.K.; Maiti, R.; Jana, S.; Adhikari, B.; Mandal, D.; Ray, S.K. Graphene-silver-induced self-polarized PVDF-based flexible plasmonic nanogenerator toward the realization for new class of self powered optical sensor. ACS Appl. Mater. Interfaces 2016, 8, 14986–14993. [Google Scholar] [CrossRef] [PubMed]
Figure 1.
(a) XRD spectrum of AgNPs, and (b) TEM micrograph of AgNPs in DMF solvent.

Figure 2.
(a) SEM micrograph of a PVDF/AgNPs electrospun fiber mat with silver nanoparticles content 0.2%; (b) distribution of the fiber diameters.
Figure 2.
(a) SEM micrograph of a PVDF/AgNPs electrospun fiber mat with silver nanoparticles content 0.2%; (b) distribution of the fiber diameters.
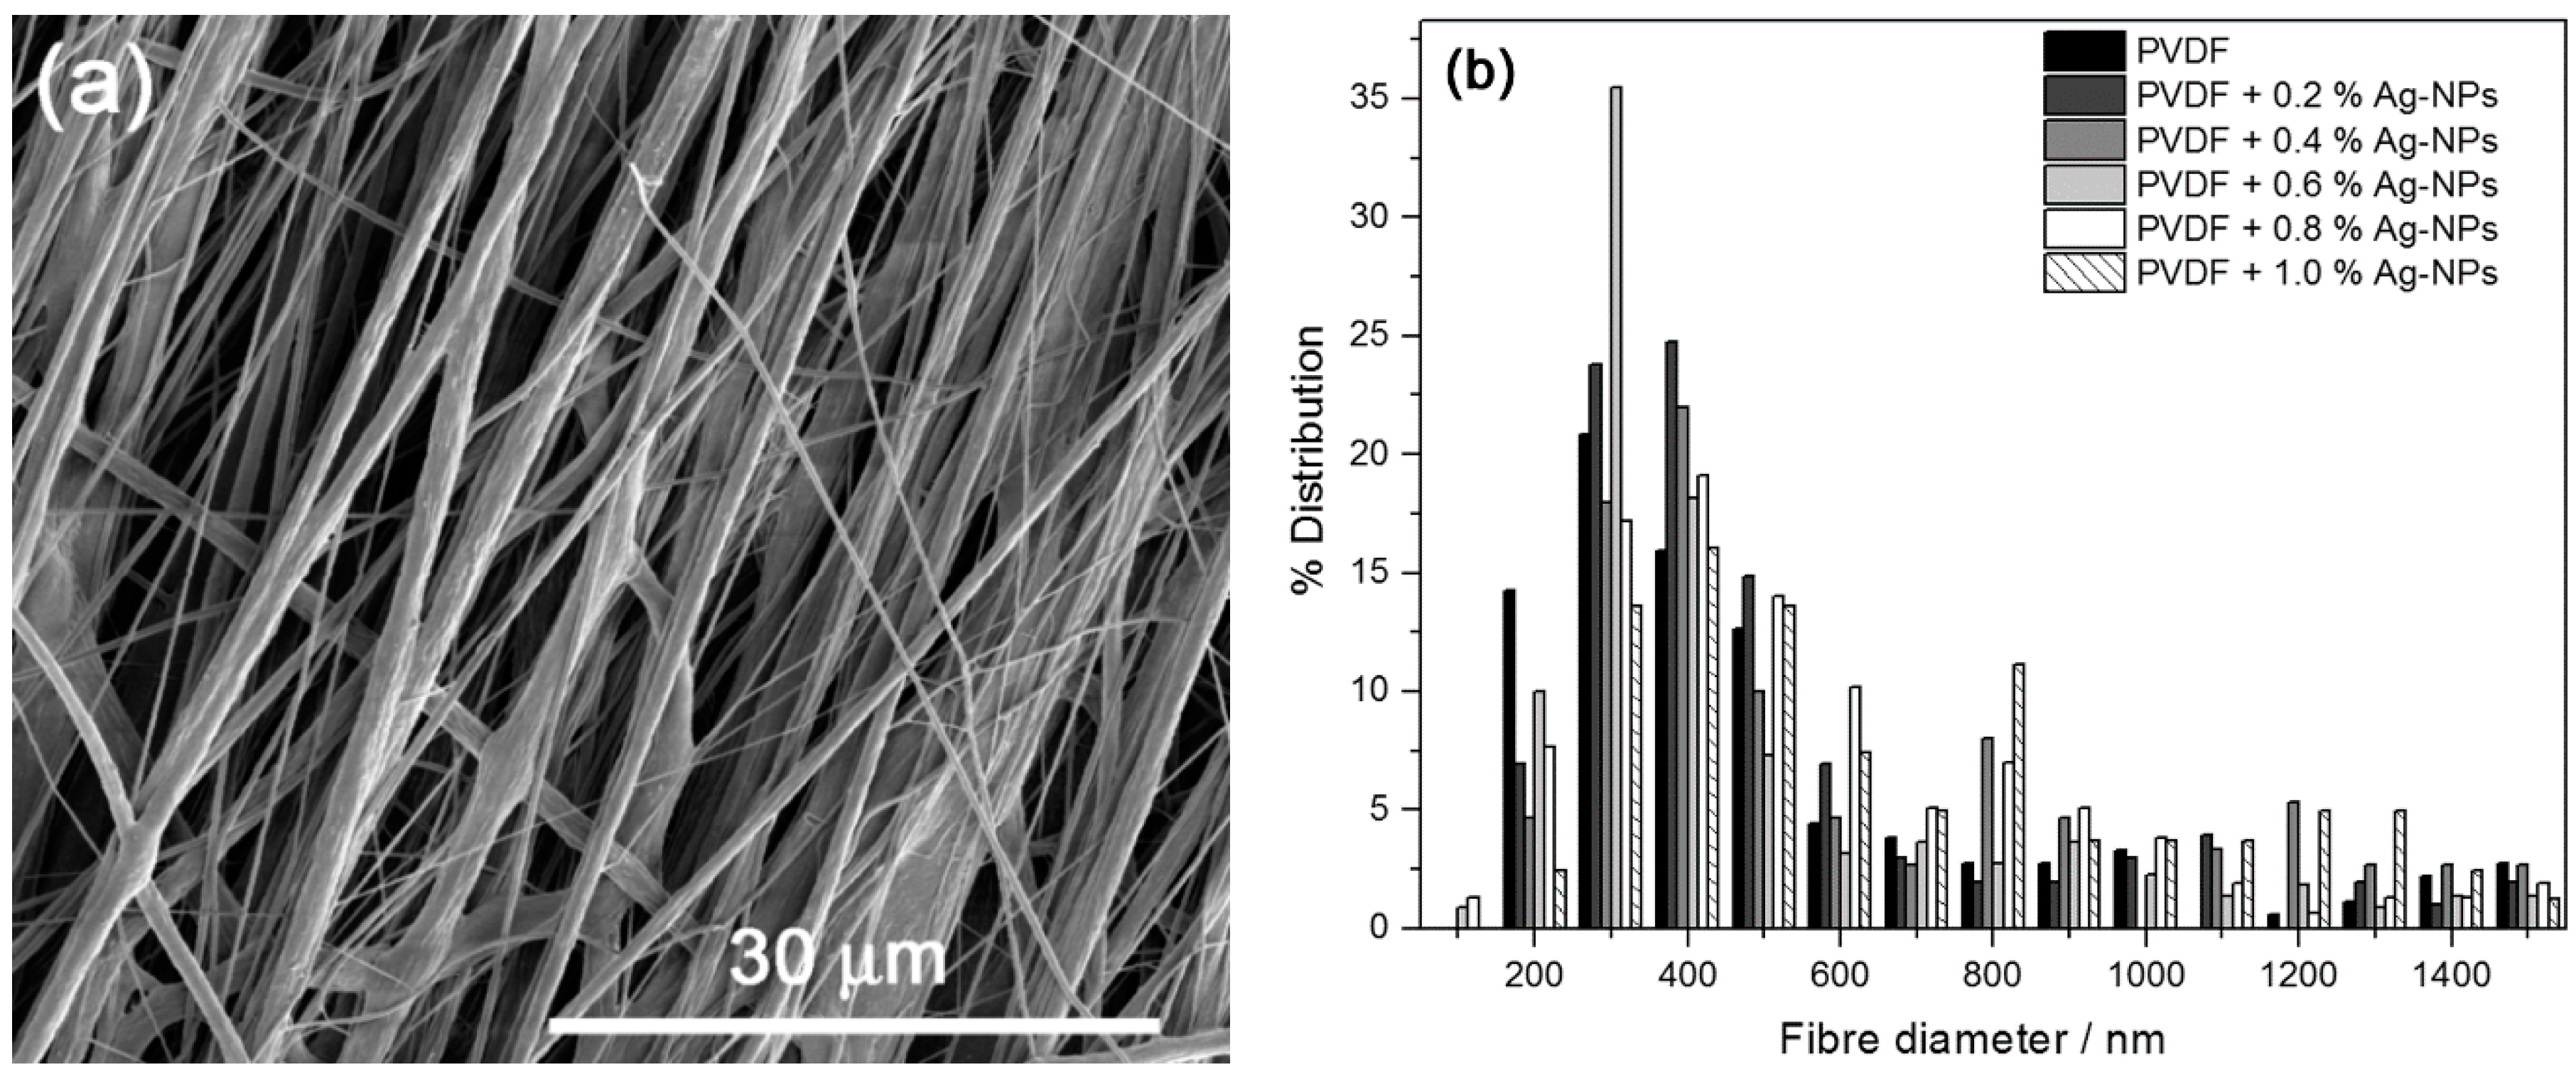
Figure 3.
FTIR spectra of the PVDF/AgNPs electrospun nanocomposite fibers prepared in this investigation.
Figure 3.
FTIR spectra of the PVDF/AgNPs electrospun nanocomposite fibers prepared in this investigation.
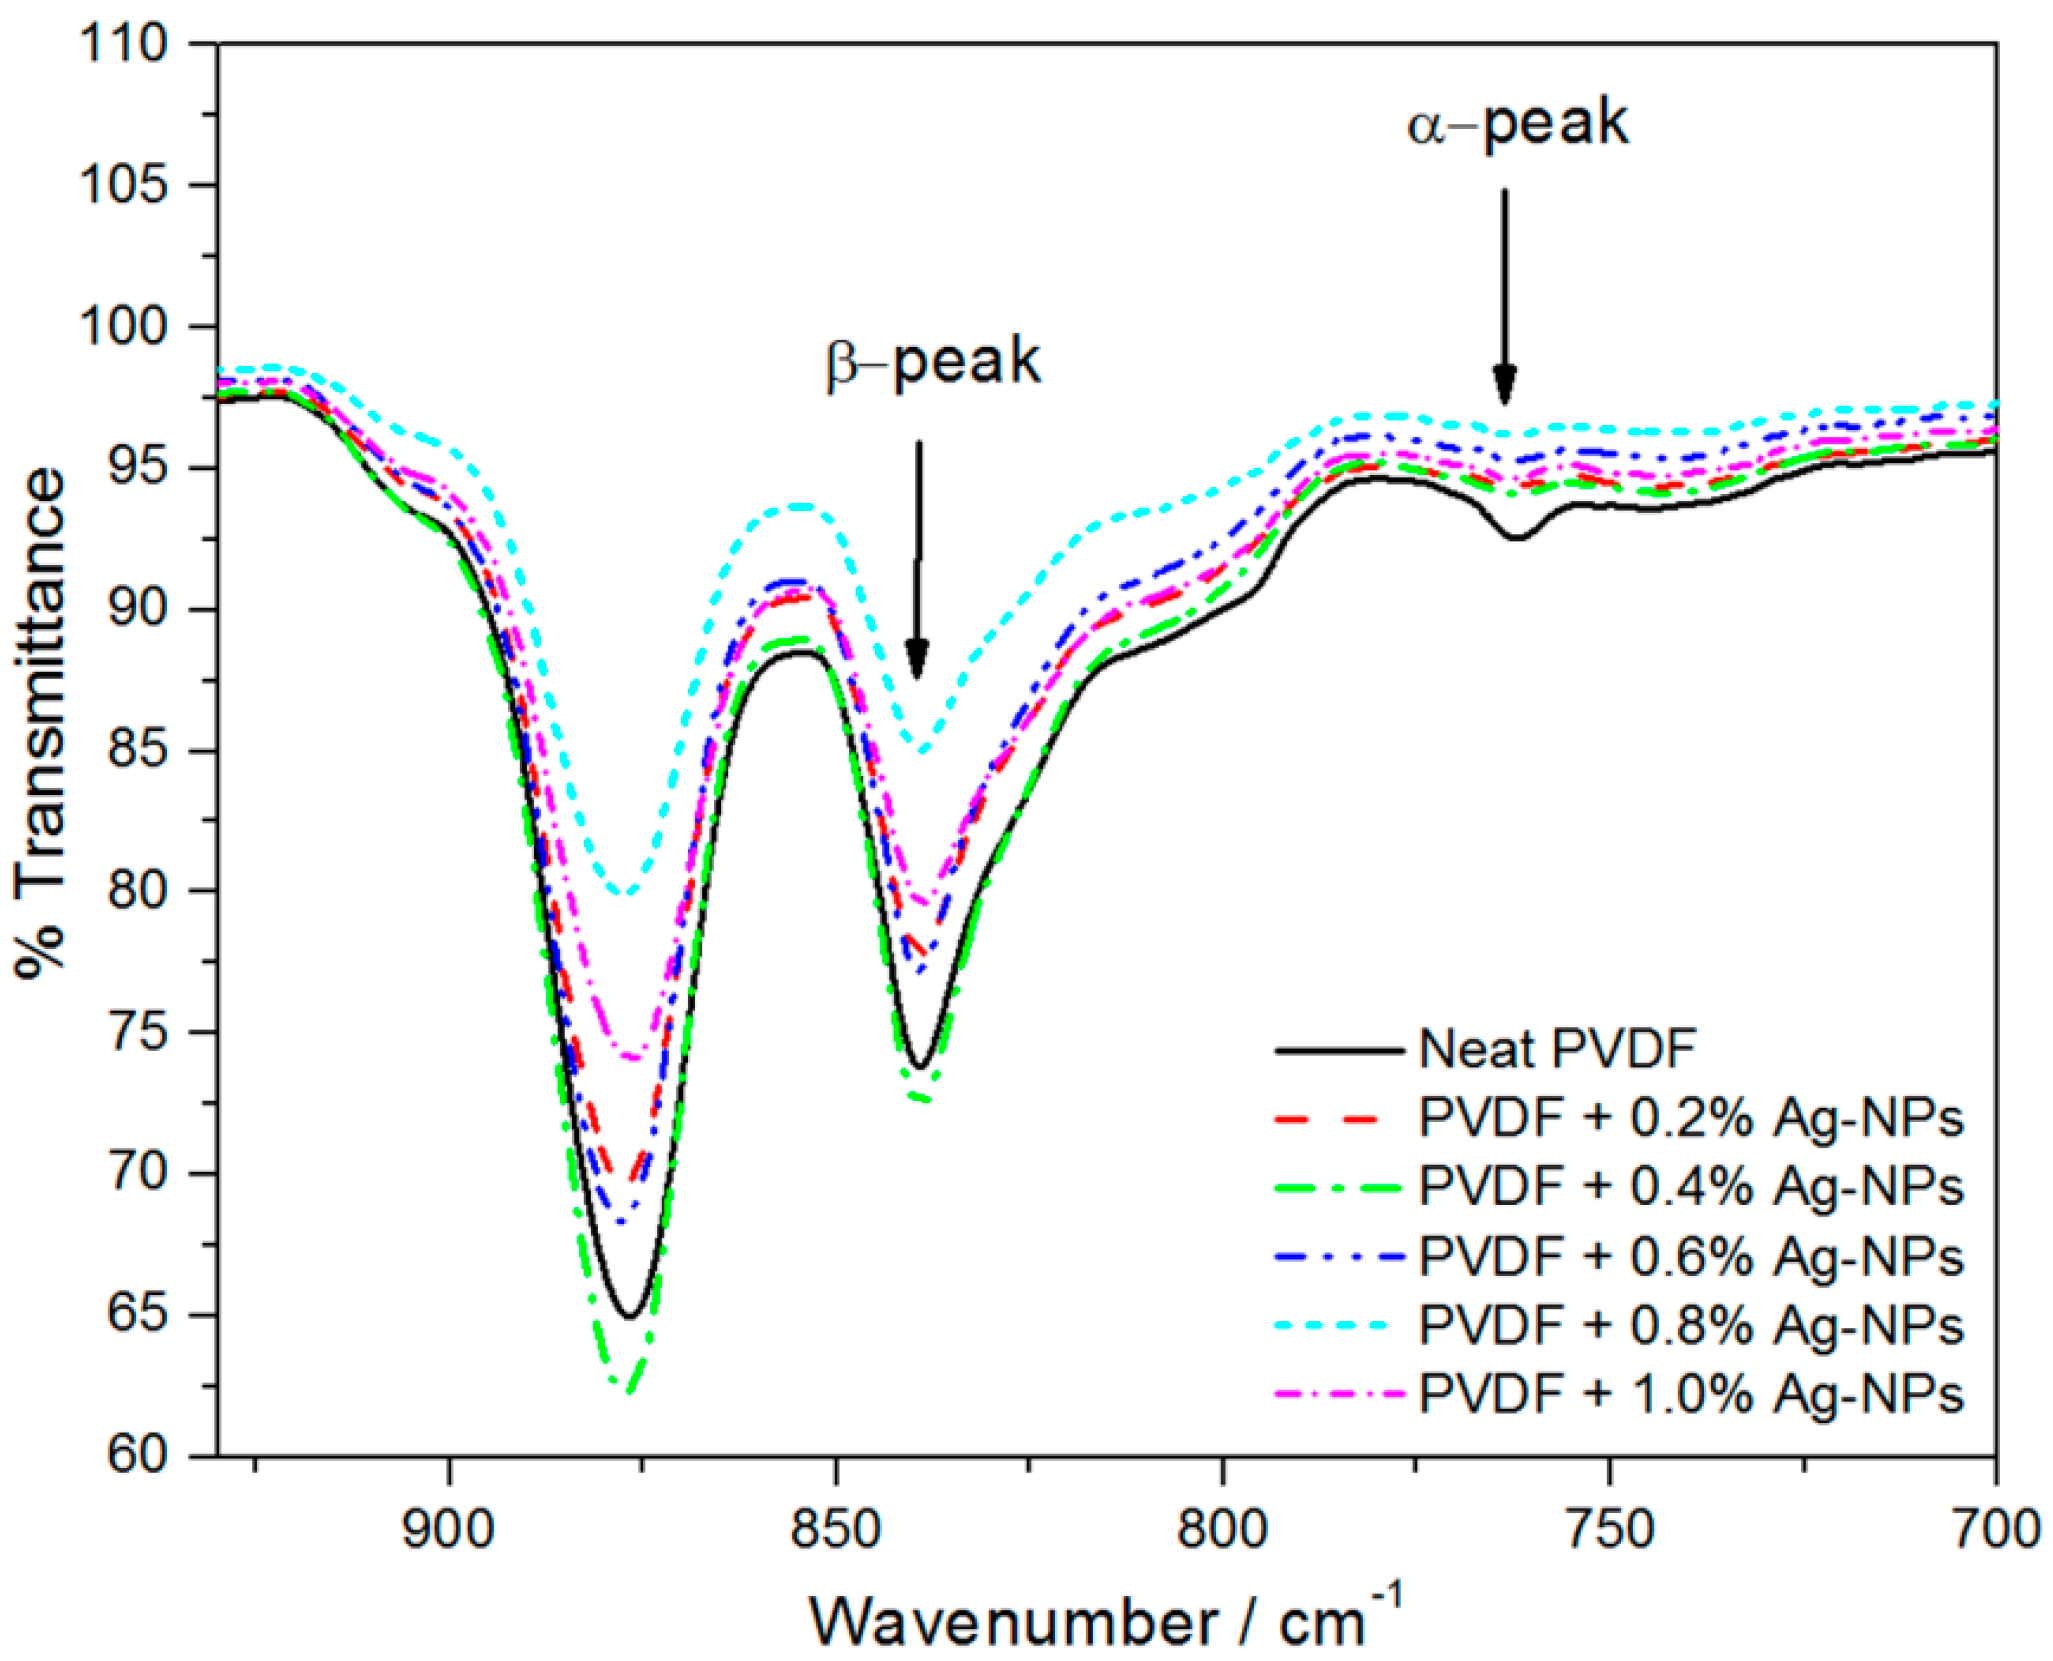
Figure 4.
β-phase content of PVDF in the PVDF/AgNPs composites (line added to guide the eye).

Figure 5.
DSC cooling curves for the electrospun PVDF, with and without 1.0% AgNPs.

Figure 6.
TGA curves of PVDF and the PVDF/AgNPs composites.
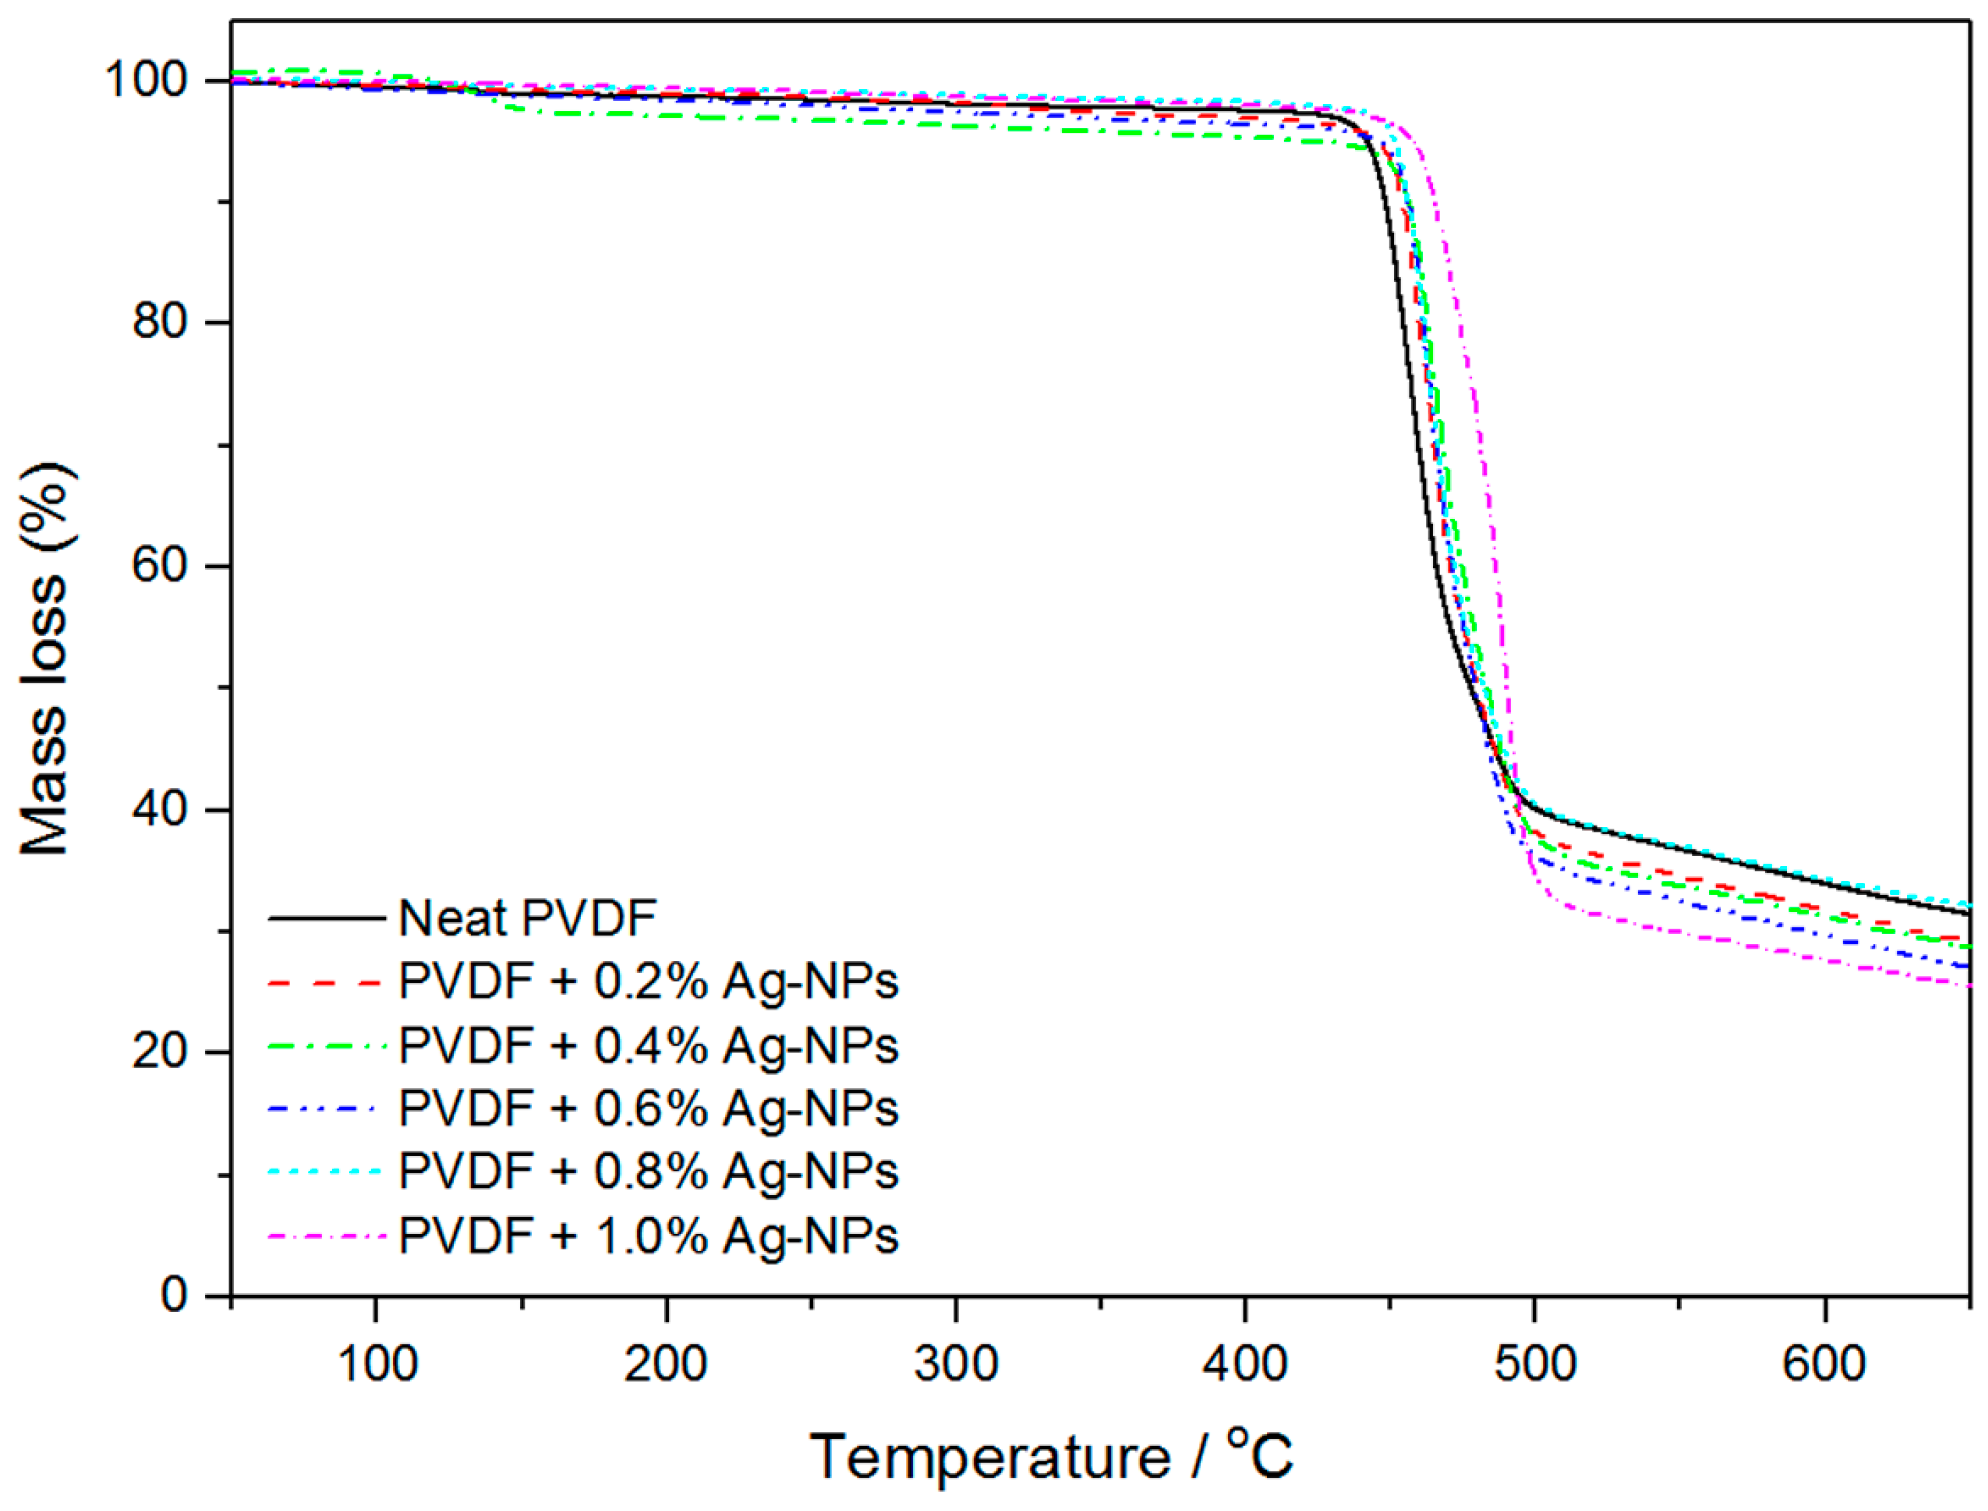
Figure 7.
Tensile strengths of PVDF/AgNPs composites as function of AgNPs content. Black squares represent the mean values of the tensile strength while lines represent the standard error of these values.
Figure 7.
Tensile strengths of PVDF/AgNPs composites as function of AgNPs content. Black squares represent the mean values of the tensile strength while lines represent the standard error of these values.
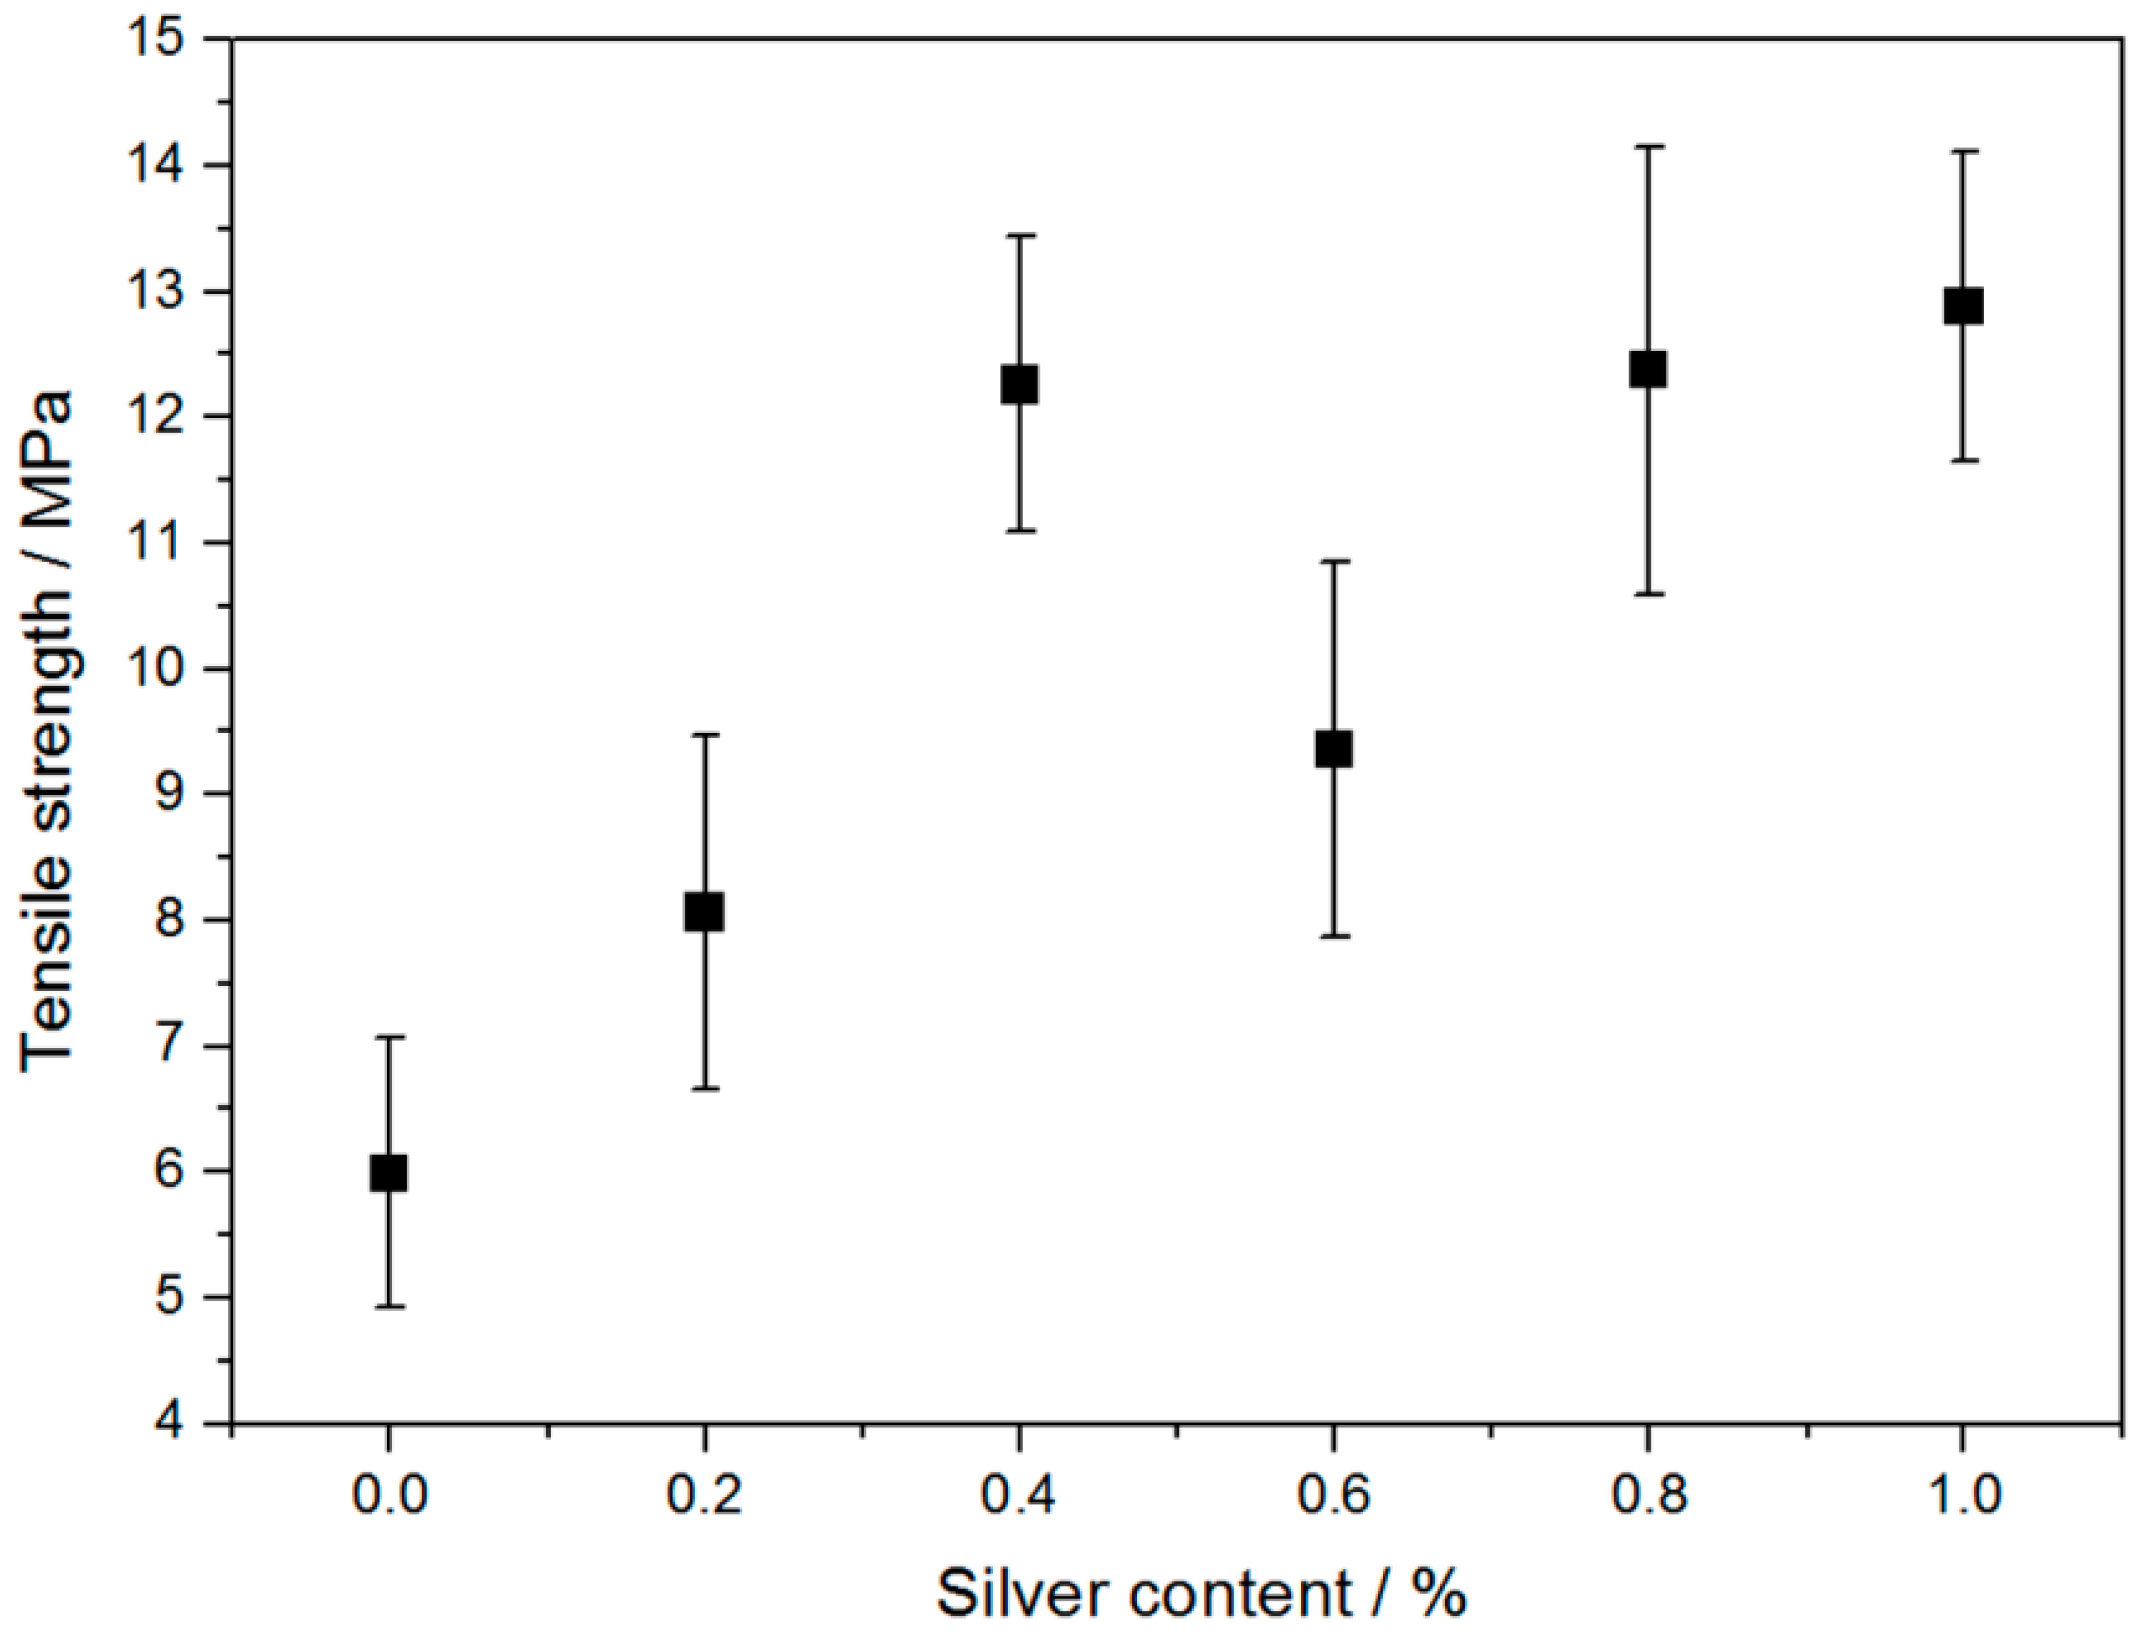
Figure 8.
Dielectric permittivity storage (ε′) (closed symbols) and loss (ε″) (open symbols) of the electrospun PVDF/AgNPs composite fiber mats having different compositions at 20 °C.
Figure 8.
Dielectric permittivity storage (ε′) (closed symbols) and loss (ε″) (open symbols) of the electrospun PVDF/AgNPs composite fiber mats having different compositions at 20 °C.
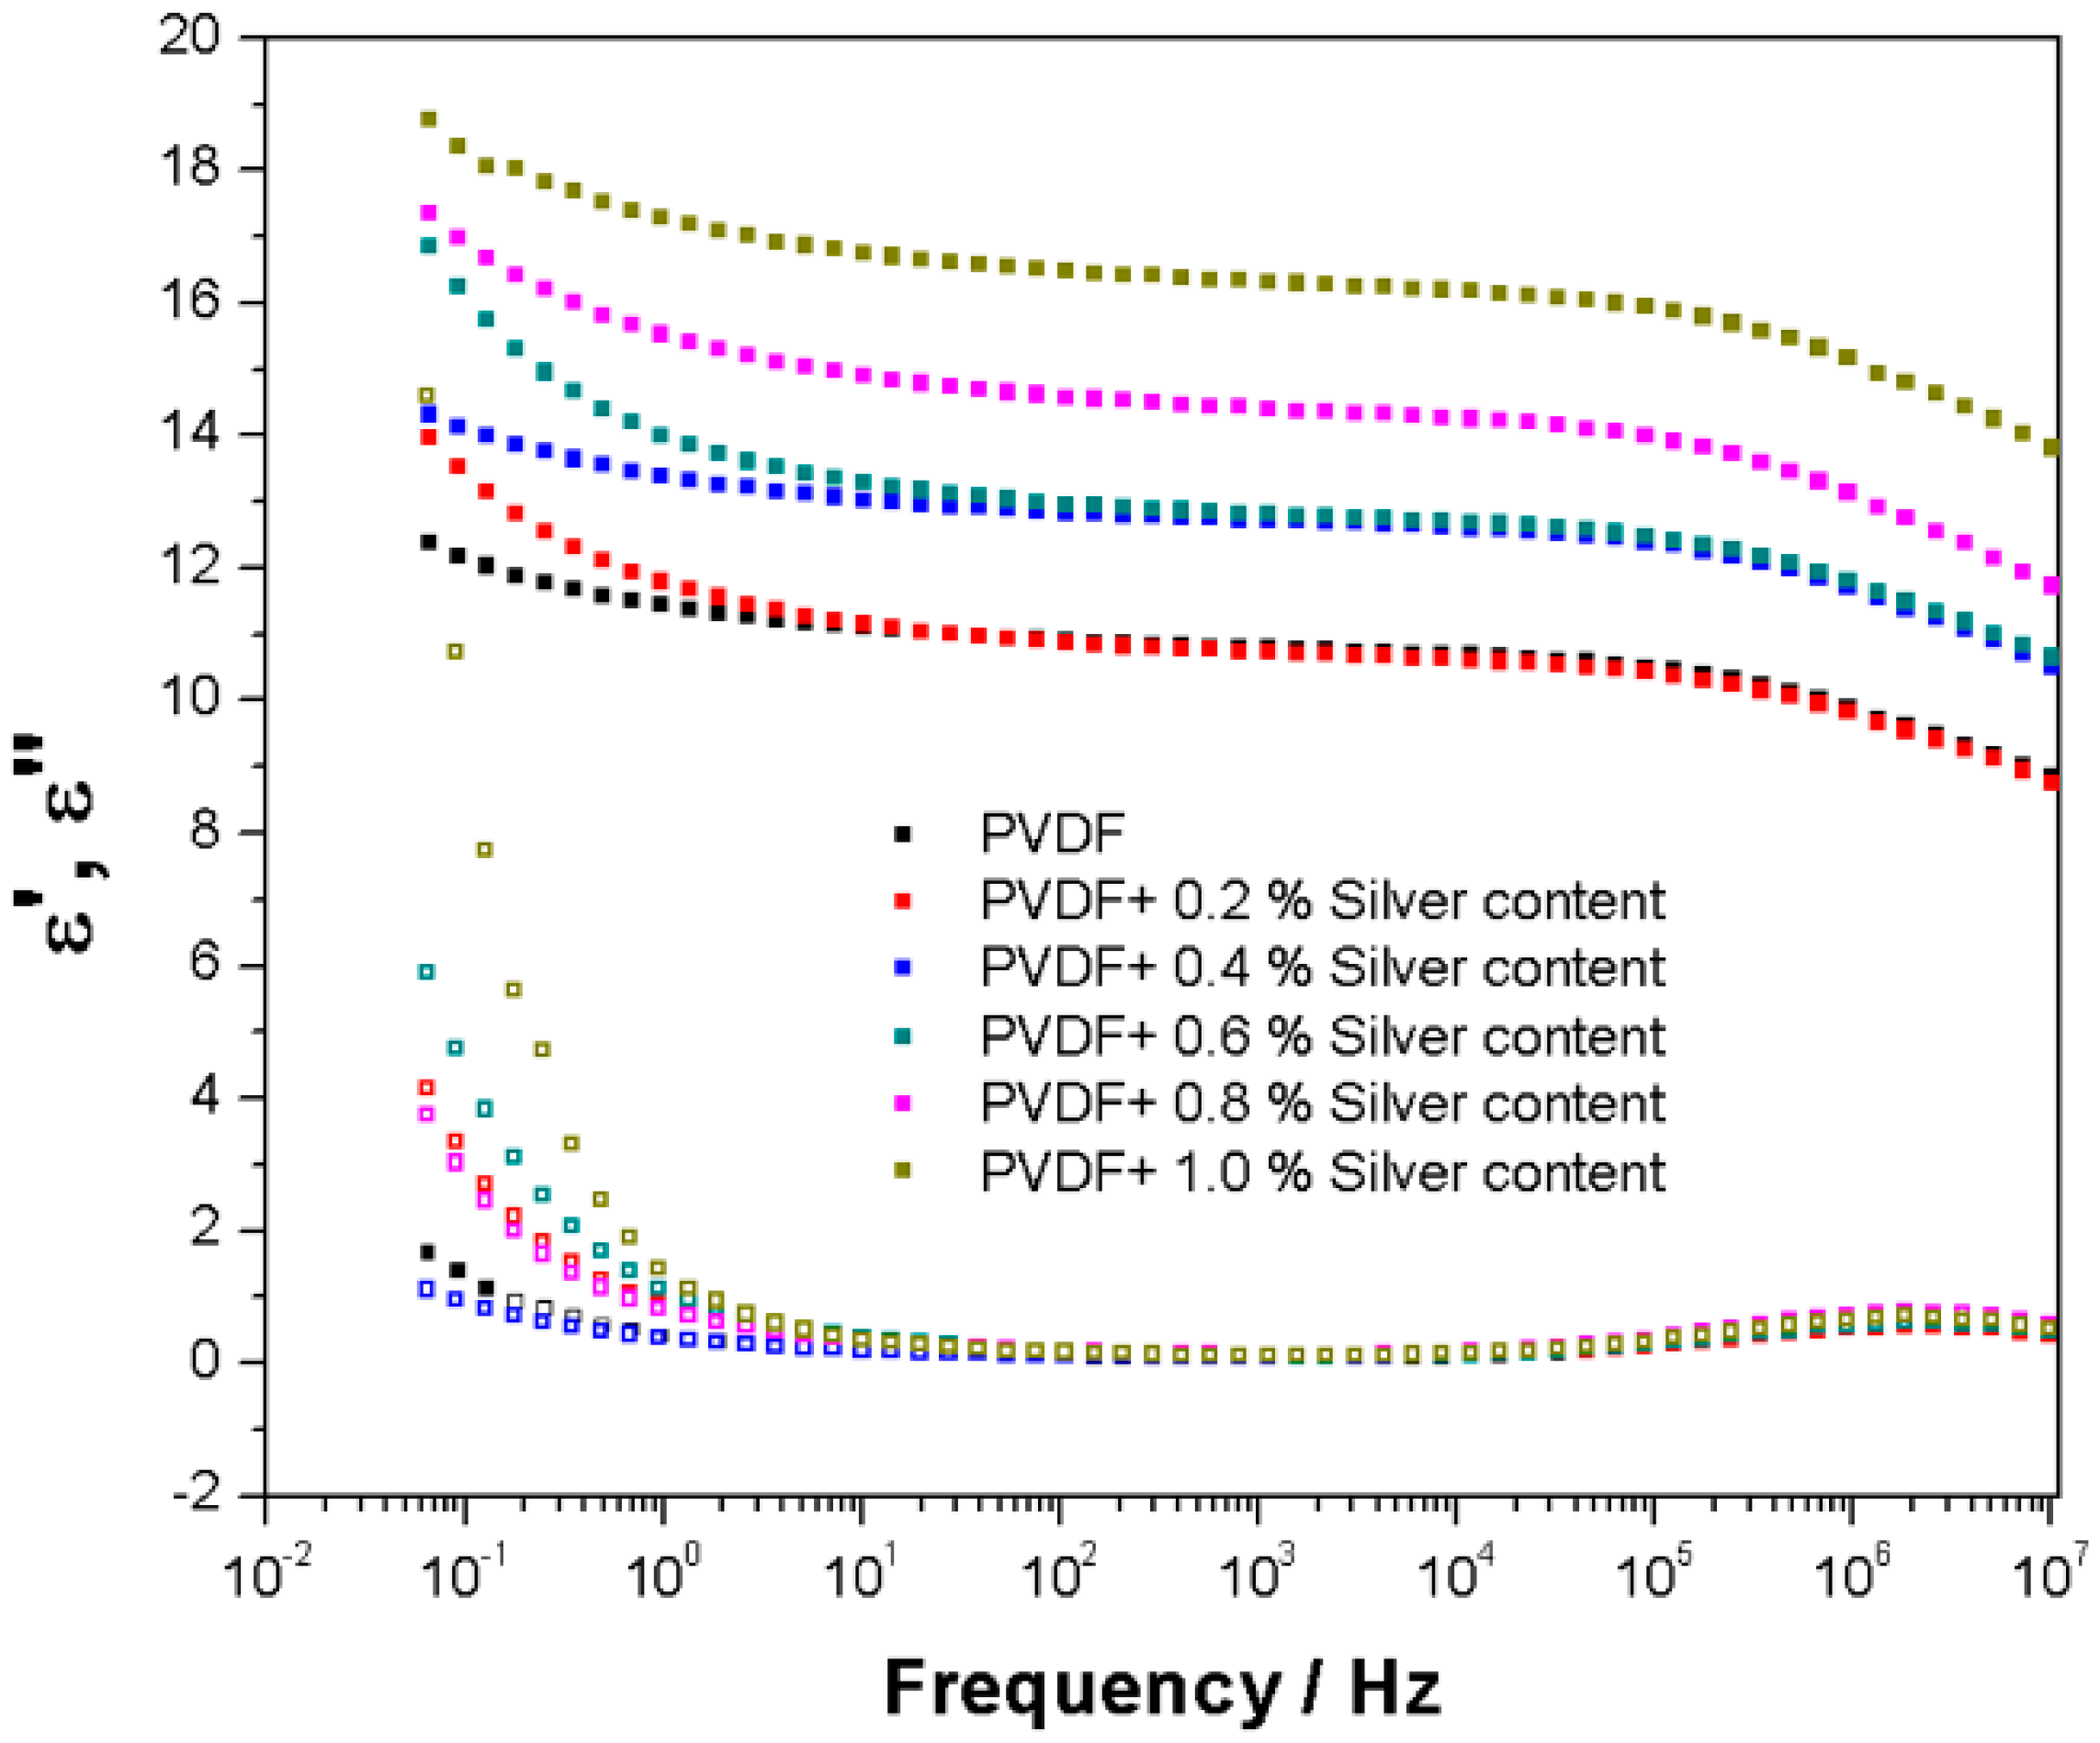
Figure 9.
ε” vs. logf spectra for the electrospun (a) PVDF and (b) PVDF/0.4% AgNPs samples within the β-relaxation temperature range. Lines represent the HN equation fits to the spectra.
Figure 9.
ε” vs. logf spectra for the electrospun (a) PVDF and (b) PVDF/0.4% AgNPs samples within the β-relaxation temperature range. Lines represent the HN equation fits to the spectra.
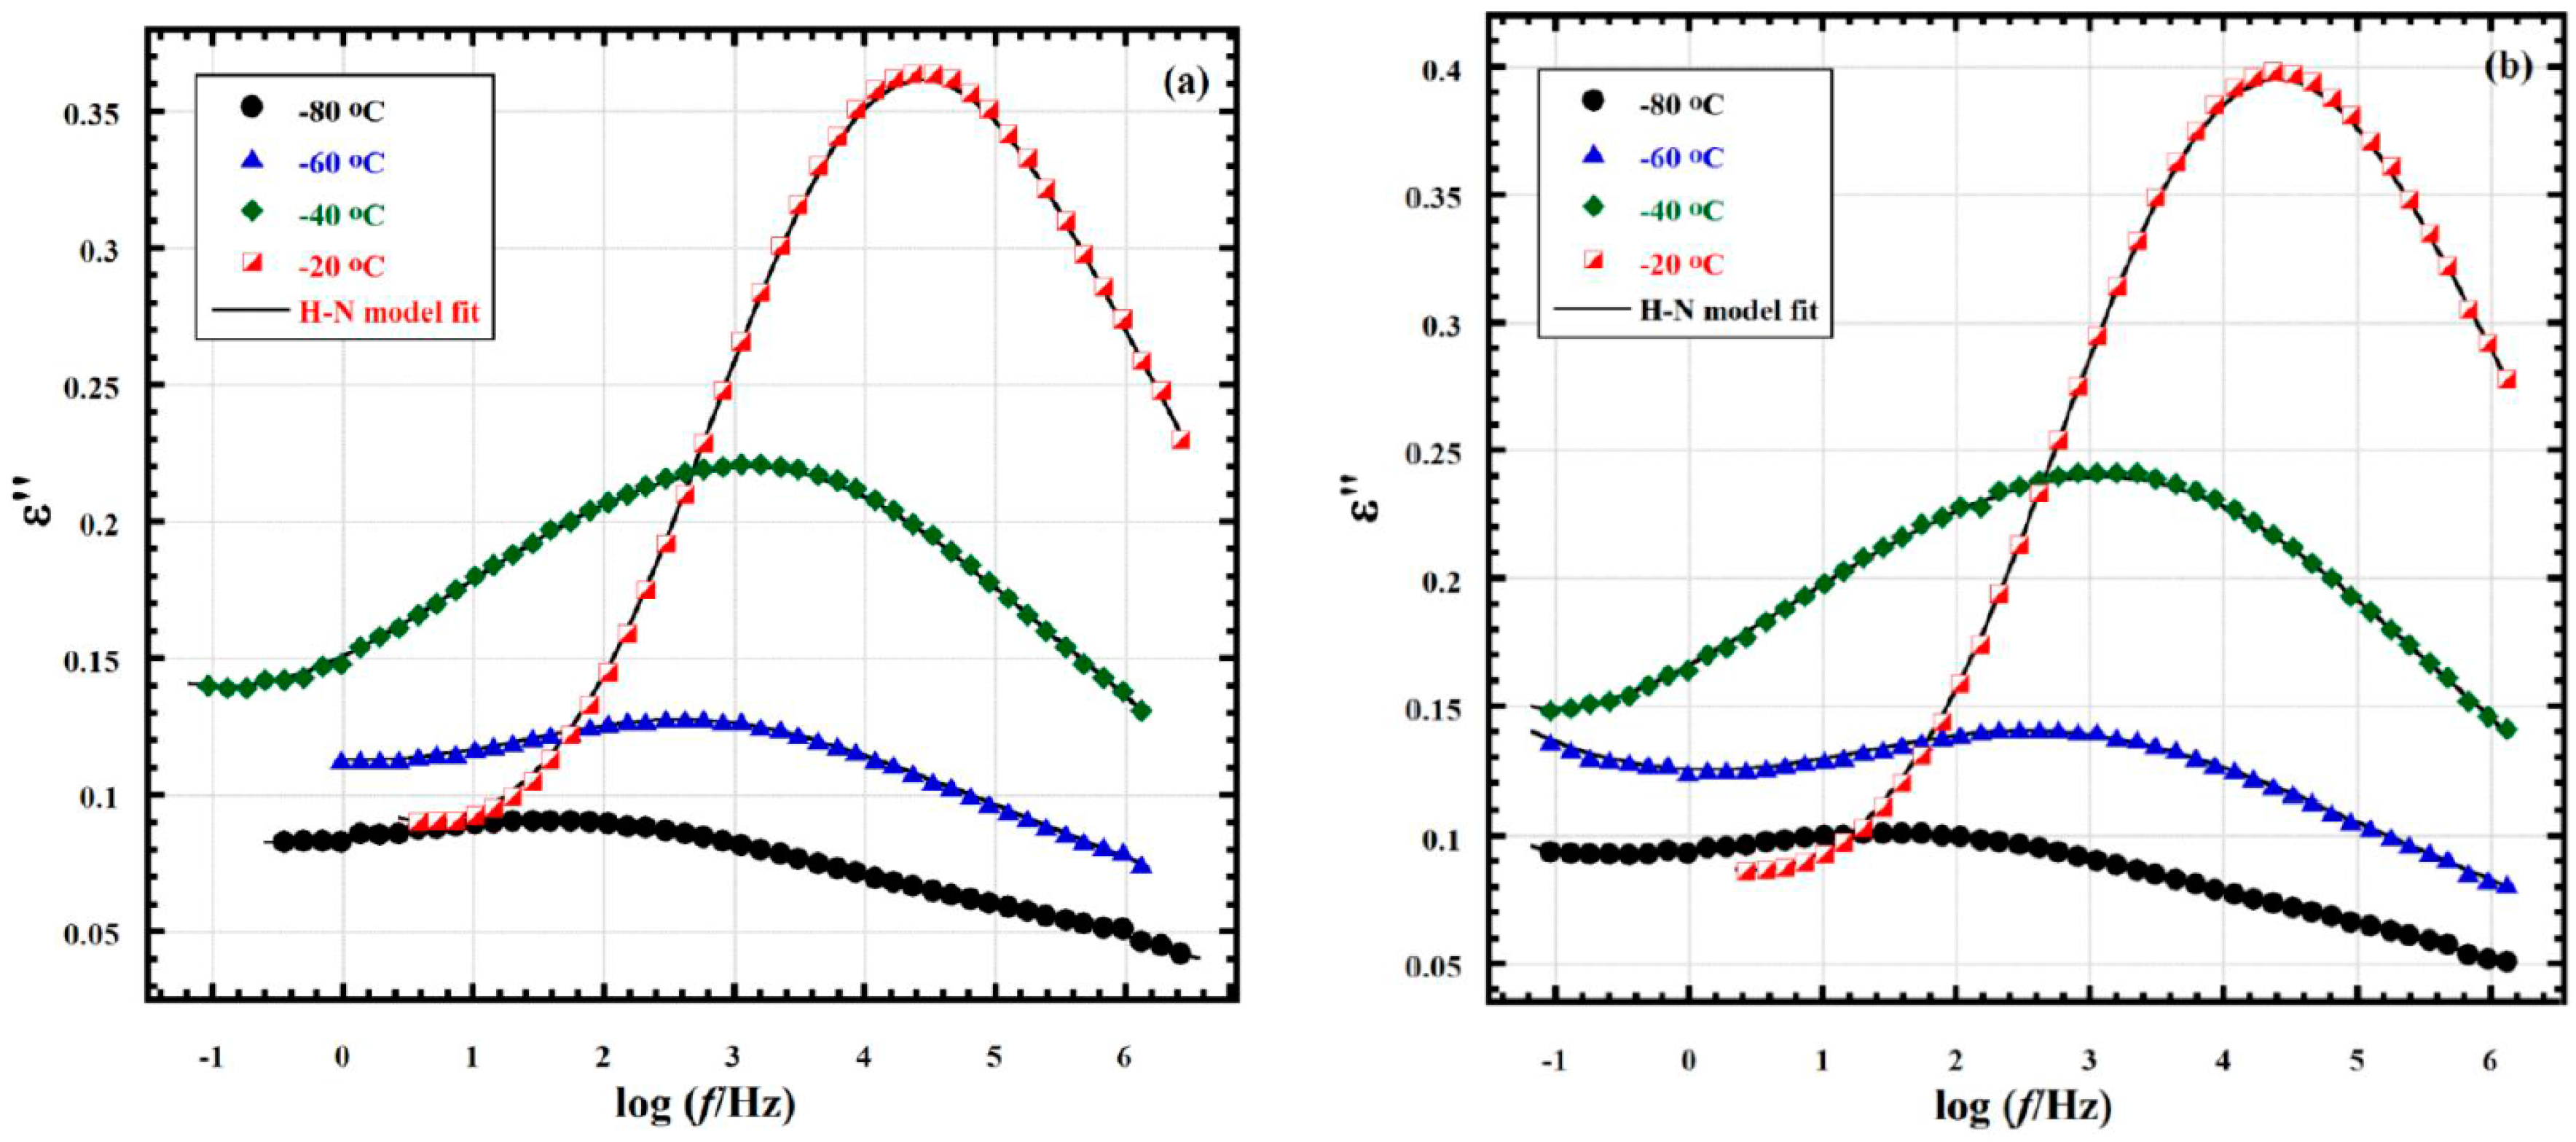
Figure 10.
VFTH plots for the β-relaxation of the electrospun PVDF/AgNPs composite fiber mats having different compositions. The dashed line represents the VFTH equation fit to the data for the PVDF + 0.6% AgNPs sample.
Figure 10.
VFTH plots for the β-relaxation of the electrospun PVDF/AgNPs composite fiber mats having different compositions. The dashed line represents the VFTH equation fit to the data for the PVDF + 0.6% AgNPs sample.
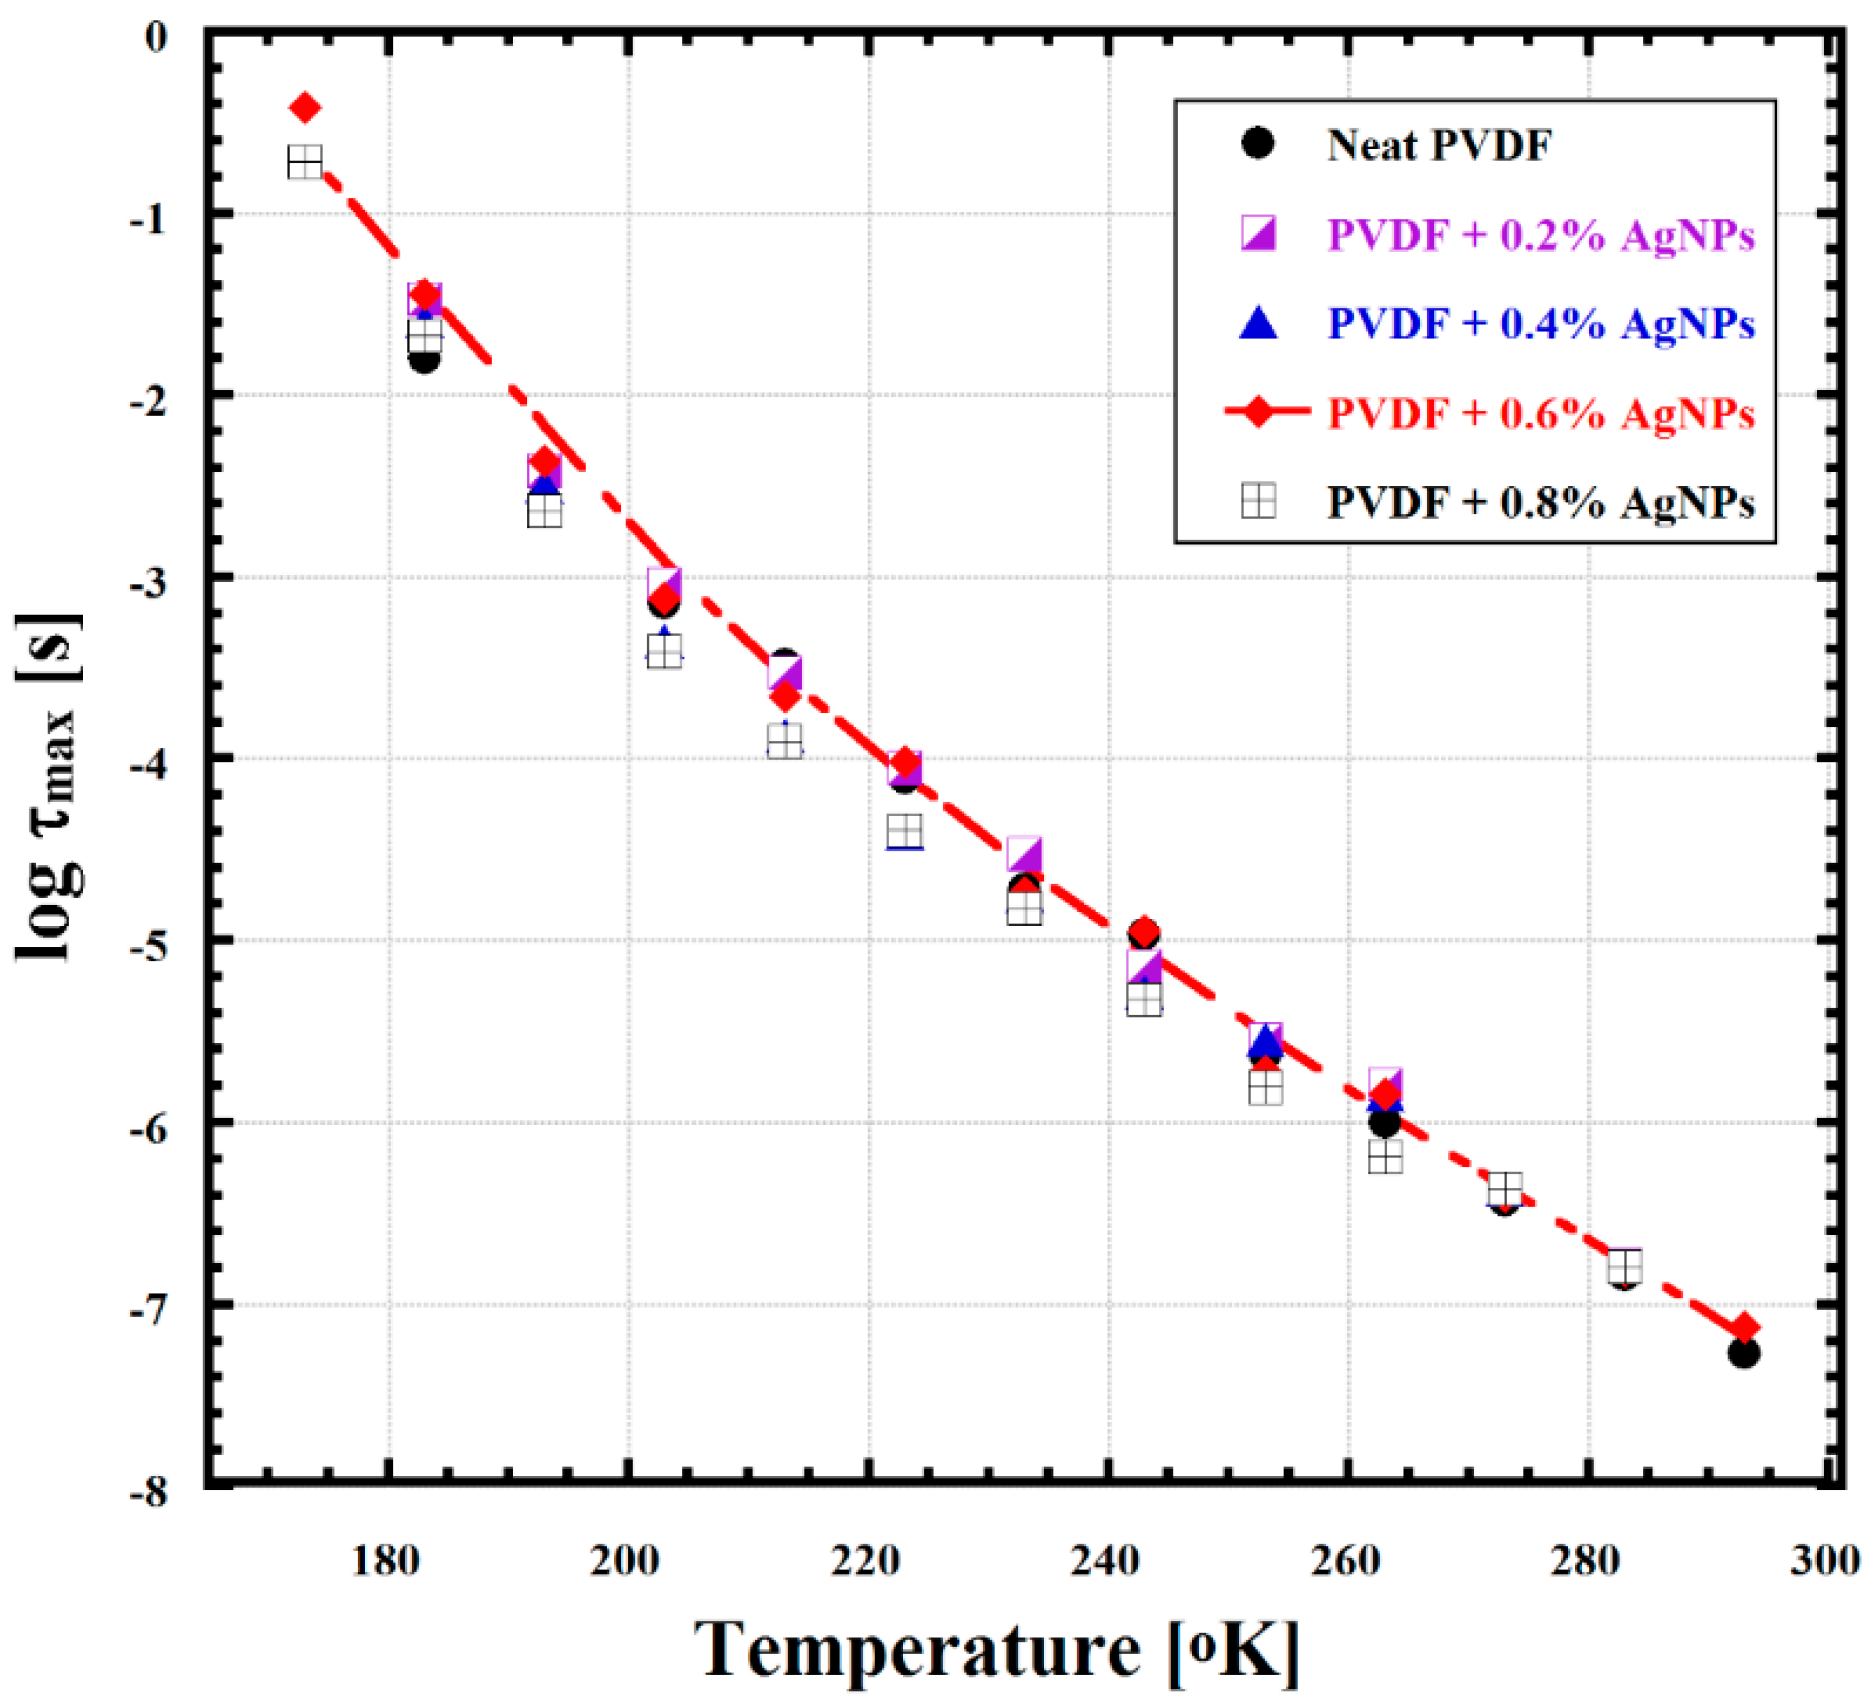
Figure 11.
(a) Sample used for the piezoelectric experiment and its schematic representation. Voltage versus time graphs at different vibrating frequencies (b) Pure PVDF; (c) PVDF + 0.2% Ag; (d) PVDF + 0.4% Ag; and (e) PVDF + 0.6% Ag nanocomposites.
Figure 11.
(a) Sample used for the piezoelectric experiment and its schematic representation. Voltage versus time graphs at different vibrating frequencies (b) Pure PVDF; (c) PVDF + 0.2% Ag; (d) PVDF + 0.4% Ag; and (e) PVDF + 0.6% Ag nanocomposites.

Table 1.
Viscosity and conductivity of PVDF composite solutions with different concentrations of AgNPs.
Table 1.
Viscosity and conductivity of PVDF composite solutions with different concentrations of AgNPs.
| Sample | Viscosity/cP | Conductivity/μS cm−1 |
|---|---|---|
| Solvent (60:40 DMF:acetone) | 0.45 | 2.1 |
| Solvent + PVDF | 361.1 | 12.4 |
| Solvent + PVDF + 0.2% AgNPs | 340.8 | 15.0 |
| Solvent + PVDF + 0.4% AgNPs | 350.9 | 15.0 |
| Solvent + PVDF + 0.6% AgNPs | 343.3 | 14.2 |
| Solvent + PVDF + 0.8% AgNPs | 338.2 | 15.8 |
| Solvent + PVDF + 1.0% AgNPs | 338.2 | 16.3 |
Table 2.
Statistical data for the produced fibers at different silver nanoparticle contents.
| Sample | Ntotal | Mean Diameter/nm | Standard Deviation/nm |
|---|---|---|---|
| PVDF | 166 | 506 | 393 |
| PVDF + 0.2% AgNPs | 97 | 470 | 302 |
| PVDF + 0.4% AgNPs | 138 | 576 | 374 |
| PVDF + 0.6% AgNPs | 208 | 432 | 312 |
| PVDF + 0.8% AgNPs | 153 | 508 | 302 |
| PVDF + 1.0% AgNPs | 78 | 648 | 372 |
Table 3.
The corresponding FTIR peaks related to each phase.
| Phase | α-Phase | β-Phase | γ-Phase | References |
|---|---|---|---|---|
| FTIR (corresponding wavenumbers/cm−1) | 408, 532, 614, 766, 795, 855, 976 | 440, 485, 510, 840, 1279 | 431, 512, 776, 812, 833, 840, 1234 | [1,9,10,25] |
Table 4.
Melting and crystallization temperatures and enthalpies of the PVDF and its composite.
| Sample | ∆Hm/J∙g−1 | Tm/°C | ∆Hc/J∙g−1 | Tc/°C |
|---|---|---|---|---|
| Electrospun PVDF | 42.8 | 160.1 | −35.2 | 130.7 |
| Electrospun PVDF + 1% AgNPs | 48.4 | 159.0 | −37.3 | 131.9 |
Table 5.
Electrospinning conditions for PVDF/AGNPs.
| Parameter | Value |
|---|---|
| Silver content | 0.2%, 0.4%, 0.6%, 0.8%, 1.0% |
| Flow rate | 2 mL∙h−1 |
| Voltage | 8.0 kV (adjusted *) |
| Distance | 10 cm |
| Collector/speed | Rotating disk/1700–1900 rpm |
| Spinneret (needle) | G22 |
* Because silver is a very good conductor, the conductivity of the PVDF/AgNPs solution increased with increasing amount of AgNPs, and therefore the applied voltage was decreased to avoid sparks.
© 2017 by the authors. Licensee MDPI, Basel, Switzerland. This article is an open access article distributed under the terms and conditions of the Creative Commons Attribution (CC BY) license (http://creativecommons.org/licenses/by/4.0/).
Share and Cite
MDPI and ACS Style
Issa, A.A.; Al-Maadeed, M.A.; Luyt, A.S.; Ponnamma, D.; Hassan, M.K. Physico-Mechanical, Dielectric, and Piezoelectric Properties of PVDF Electrospun Mats Containing Silver Nanoparticles. C 2017, 3, 30. https://doi.org/10.3390/c3040030
AMA Style
Issa AA, Al-Maadeed MA, Luyt AS, Ponnamma D, Hassan MK. Physico-Mechanical, Dielectric, and Piezoelectric Properties of PVDF Electrospun Mats Containing Silver Nanoparticles. C. 2017; 3(4):30. https://doi.org/10.3390/c3040030
Chicago/Turabian StyleIssa, Ahmed A., Mariam A. Al-Maadeed, Adriaan S. Luyt, Deepalekshmi Ponnamma, and Mohammad K. Hassan. 2017. "Physico-Mechanical, Dielectric, and Piezoelectric Properties of PVDF Electrospun Mats Containing Silver Nanoparticles" C 3, no. 4: 30. https://doi.org/10.3390/c3040030
Note that from the first issue of 2016, this journal uses article numbers instead of page numbers. See further details here.