Article

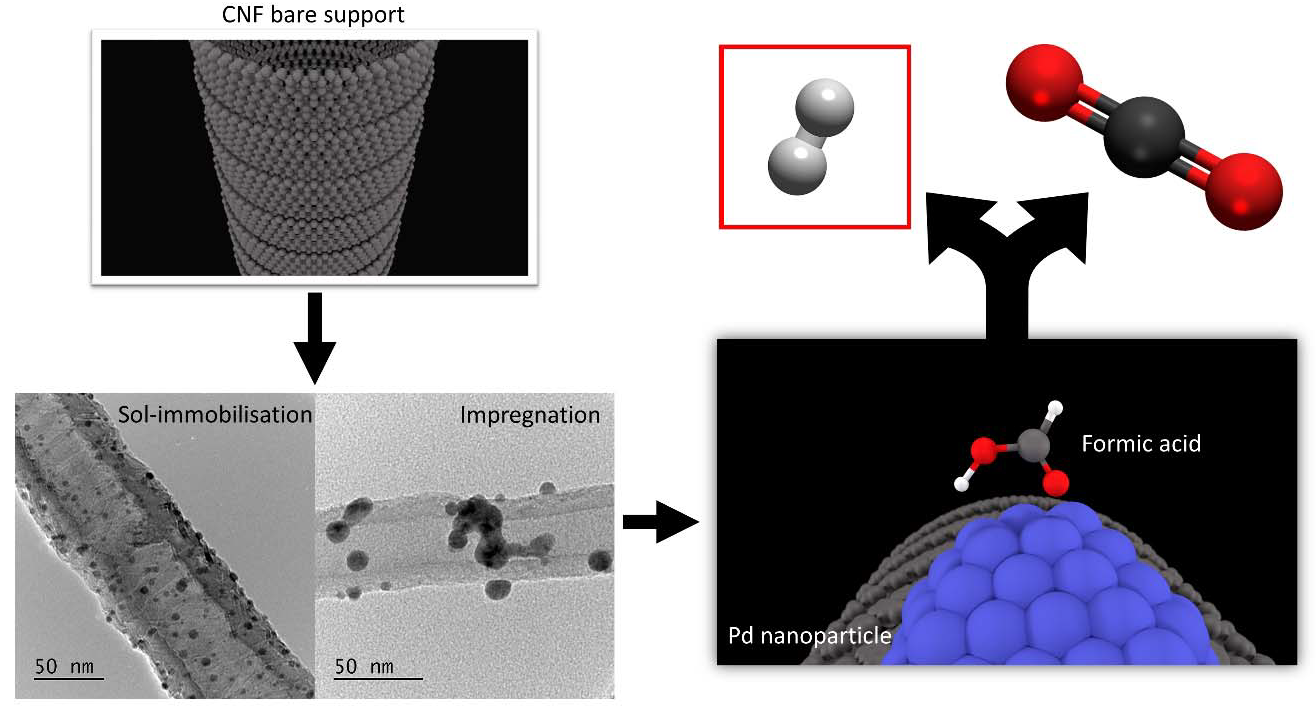
Investigation of the Catalytic Performance of Pd/CNFs for Hydrogen Evolution from Additive-Free Formic Acid Decomposition

1
Cardiff Catalysis Institute, School of Chemistry, Cardiff University, Main Building, Park Place, Cardiff CF10 3AT, UK
2
Dipartimento di Chimica Industriale “Toso Montanari”, Alma Mater Studiorum, University of Bologna, Viale Risorgimento 4, 40136, Bologna, Italy
3
Dipartimento di Chimica, Università degli Studi di Milano, via Golgi 19, 20133 Milano, Italy
*
Authors to whom correspondence should be addressed.
Submission received: 18 February 2018 / Revised: 3 April 2018 / Accepted: 7 April 2018 / Published: 1 May 2018
(This article belongs to the Special Issue Carbon-Based Catalyst)

Abstract

:
In recent years, research efforts have focused on the development of safe and efficient H2 generation/storage materials toward a fuel-cell-based H2 economy as a long-term solution in the near future. Herein, we report the development of Pd nanoparticles supported on carbon nanofibers (CNFs) via sol-immobilisation and impregnation techniques. Thorough characterisation has been carried out by means of XRD, XPS, SEM-EDX, TEM, and BET. The catalysts have been evaluated for the catalytic decomposition of formic acid (HCOOH), which has been identified as a safe and convenient H2 carrier under mild conditions. The influence of preparation method was investigated and catalysts prepared by the sol-immobilisation method showed higher catalytic performance (PdSI/CNF) than their analogues prepared by the impregnation method (PdIMP/CNF). A high turnover frequency (TOF) of 979 h−1 for PdSI/CNF and high selectivity (>99.99%) was obtained at 30 °C for the additive-free formic acid decomposition. Comparison with a Pd/AC (activated charcoal) catalyst synthesised with sol-immobilisation method using as a support activated charcoal (AC) showed an increase of catalytic activity by a factor of four, demonstrating the improved performance by choosing CNFs as the preferred choice of support for the deposition of preformed colloidal Pd nanoparticles.

Graphical Abstract

1. Introduction

Alternative energy sources have been considered to solve the increasing energy demand without further damage to the environment. Hydrogen is considered as one of the most promising energy sources in the near future. It is a versatile fuel since conversion to electricity or heat is likely through electrochemical and catalytic processes [1]. However, the general utilisation for realising a hydrogen-powered society is limited due to technical obstacles for controlling in a facile way the storage and release of hydrogen. For the aforementioned reasons, research has been focused on exploring and finding storage materials able to fulfil these requirements.
Either physical or chemical storage of hydrogen are considered as alternative solutions. Physical storage of hydrogen has been widely investigated. In this approach, hydrogen is adsorbed into a porous network such as carbon materials [2], metal-organic frameworks [3], zeolites [4], clathrate hydrates [5], and organic polymers [6]. Alternatively, chemical hydrogen storage has been proposed as a feasible and sustainable approach, in which a hydrogen-rich material is subjected to a decomposition process and can take place in solid or liquid phase. Possible solid phase compounds as ammonia borane [7], amines [8], or sodium borohydride [9] have been investigated but they present several disadvantages that limit their potential applications [10]. Liquid-phase carriers such as alcohols [11], hydrazine [12], or formic acid (HCOOH), present important advantages as facile transport and safe handling.
Formic acid, a major product formed: (i) during biomass processing and (ii) by the direct hydrogenation of CO2, has been recently proposed and explored as a safe and convenient liquid storage material for hydrogen production under mild conditions. Due to properties such as high stability, liquid at room temperature, high volumetric hydrogen content (4.4 wt. %), environmental benignity, and non-toxicity, it has become, in the last few years, one of the most studied and promising liquid hydrogen carriers according to the U.S. Department of Energy. The decomposition of formic acid can proceed following two main pathways, namely dehydrogenation (HCOOH → CO2 + H2, ∆G= −48.4 kJmol−1) and dehydration (HCOOH → CO + H2O, ∆G= −28.5 kJmol−1), with the dehydration pathway usually to be facilitated by acidity or heating. Ultrapure hydrogen is necessary since fuel cells are poisoned by CO, (typically the desired level of CO should be preferably below 20 ppm) resulting in a degraded long-term performance. Utilisation of mild conditions is of central importance since these fuel cells are expected to supply energy to portable devices which require a low heat management profile.
Formic acid has been thoroughly investigated for hydrogen generation by either homogeneous or heterogeneous catalytically decomposition approaches, nevertheless, several issues such as the use of organic solvents and separation problems prevent the use of homogeneous catalysts for formic acid fuel cells since practical difficulties appear in the device fabrication [13,14]. Consequently, heterogeneous catalysts have received much attention in the past few years for hydrogen production. Noble metals nanocatalysts, such as Pd, Au, or Ag and their alloys have been widely studied [3,13,15,16,17,18,19,20,21,22,23,24,25,26]. Numerous types of materials have been used as catalyst supports of the aforementioned metals for formic acid decomposition, i.e., activated carbon [19,20,21], zeolites [22], macroreticular resin [23], amines [24], and metal organic frameworks (MOFs) [3,25,26]. Recently, carbon nanofibers (CNFs) and carbon nanotubes (CNTs) have been successfully used as supports for the synthesis of supported metal functionalised nanoparticles for a wide range of important catalytic applications such as alcohols oxidation [27,28], nitrite reduction [29], and hydrogen generation [30,31].
When compared with other supports, CNFs present several advantages, such as, ability to tailor the microstructures of CNFs by selecting growing techniques, high degree of controlling the surface chemistry of the support by surface modification (acidic and basic properties) using chemical and thermal treatments, and finally, facile recovery of the metal by burning off the support [30]. On the contrary to activated charcoal (AC), where there is a high degree of inaccessible active sites, CNFs are advantageous supports since most of the metal nanoparticles are accessible to reactants. For example, Pd/CNFs catalysts showed higher activity than Pd/AC in Heck and Suzuki reactions [32], hydrogenation of aldehydes [33], and alcohol oxidation [27]. Moreover, the carbon nanofibers used in this work are produced in a large scale, have similar morphology to multi-wall carbon nanotubes (MWCNT), are less expensive than MWCNTs, and have applications in industry such as increasing thermal and electrical conductivity [34,35] or improving mechanical properties [36].
In the present work, the catalytic performance of Pd nanoparticles supported on CNFs was evaluated using liquid phase formic acid decomposition as the model reaction for hydrogen production at mild reaction conditions. We report the comparison of two preparation methods for the synthesis and deposition of metal nanoparticles on CNFs supports, namely the sol immobilisation method (SI, using polyvinylalcohol (PVA) as stabiliser and NaBH4 as reducing agent) and wet impregnation method (IMP). By comparing with activated carbon, Zhang et al. reported a 1 wt. % Pd/AC prepared by impregnation reaching a turnover frequency (TOF) of 228.3 h−1 which we have improved by a factor of more than four [20]. A similar TOF of 240 h−1 was reached by our group when using activated charcoal as support instead of CNFs. Latest reported results on undoped CNFs supported Pd reported a TOF of approximately 500 h−1 [37] in agreement with our results. The characterisation of these catalysts series was thoroughly investigated by means of X-ray diffraction (XRD), X-ray photoelectron spectroscopy (XPS), transmission electron microscopy (TEM), scanning electron microscopy (SEM) with energy dispersive X-ray (EDX), and BET (Brunauer–Emmett–Teller) surface area. The performance of the catalysts toward aqueous formic acid decomposition was carried out in a batch reactor and after an initial catalytic screening the two most active catalysts were systematically studied by varying a set of reaction parameters, such as substrate/metal molar ratio, stirrer speed, temperature, and concentration of formic acid.

2. Materials and Methods

Formic acid (≥95%, Cat. W248703) was obtained from Fischer Scientific. Succinic acid (99%) from Sigma Aldrich (Cat. S3674-100G) (Milan, Italy). NaBH4 (granular, 99.99% purity) and polyvinyl alcohol (PVA, Mw = 9000–10,000, 80% hydrolyzed) from Sigma-Aldrich were used for the catalysts preparation. K2PdCl4 and Na2PdCl4 were purchased from Sigma-Aldrich (99.999% purity) and used as metal precursors. Deionised water was used as reaction solvent. Activated Charcoal (AC), catalogue number (C/4010/60) and CNFs PR24-HHT (High Heat Treated carbon nanofiber) were purchased from Fisher Scientific (Pittsburgh, PA, USA) and Applied Science Company (Cedarville, OH, USA), respectively. CNFs consists of tubular fibers with an average diameter of 80 ± 30 nm and a specific surface area of around 50 m2/g. Schlӧgl and co-workers carried out a detailed characterisation of this material [38]. HHT grade is produced by treating the fiber at 3000 °C converting the fiber to a fully graphitised form [39].

2.1. Catalysts Preparation

Immobilisation method of Pd sol: the following experimental protocol was used for the synthesis of Pd supported nanoparticles. Na2PdCl4·2H2O (Pd: 0.094 mmol) and freshly prepared PVA solution (1 wt. %) were added (PVA/Pd (w/w) = 0.25) to 100 mL of H2O. After 3 min, a freshly prepared aqueous solution of NaBH4 (0.1 M, NaBH4/Pd (mol/mol) = 8) was added to the yellow-brown solution under vigorous magnetic stirring. The brown Pd0 sol was immediately formed. An UV-visible spectrum of the palladium sol was recorded for ensuring the complete reduction of PdII. Within few minutes from its generation, the suspension was acidified at pH 2 by sulphuric acid and the support (1 g) was added under vigorous stirring. The catalyst was filtered and washed for several times with distilled water (2 L). The sample was dried at 80 °C for two hours under static air. The amount of support was calculated to obtain a final metal loading of 1 wt. %. The obtained catalyst was labelled as PdSI/CNF.
Impregnation followed by chemical reduction using sodium borohydride as reducing agent: Na2PdCl4·2H2O (Pd: 0.094 mmol) diluted in 100 mL of H2O was added to the support (1 g) and stirred vigorously. After 6 h, a freshly prepared aqueous solution of NaBH4 (0.1 M, NaBH4/Pd (mol/mol) = 8) was added and stirred for six more hours. The catalyst was filtered and washed for several times with distilled water (2 L) to ensure the removal of the material arising from the reduction treatment. The sample was dried at 80 °C for two hours under static air. The amount of support was calculated to obtain a final metal loading of 1 wt. %. The obtained catalyst was labelled as PdIMP/CNF.
Immobilisation method of Pd sol: K2PdCl4·2H2O was used in this case as precursor. A freshly prepared PVA solution (1 wt. %) was added (PVA/Pd (w/w) = 0.65) to 400 mL of H2O. As in the previous method, after 3 min, a freshly prepared aqueous solution of NaBH4 (0.1 M, NaBH4/Pd (mol/mol) = 5) was added to the yellow-brown solution under vigorous magnetic stirring. The brown Pd0 sol was immediately formed. After 30 min of sol generation, the colloid was immobilised by adding the desired support (activated charcoal, (AC)) and acidified at pH 1 by sulfuric acid (95 wt. %, 17.83 M) under vigorous stirring. After 1 h, the slurry was filtered and washed for several times with distilled water (2 L) to remove all the dissolvable species, (such as K+ or Cl, neutral mother liquors). The sample was dried at 110 °C for 16 h under static air. The amount of support was calculated to obtain a final metal loading of 1 wt. %. The obtained catalyst was labelled as PdSI/AC.

2.2. Characterisation of the Pd/CNF Series Catalysts

X-Ray diffraction (XRD) data were collected at ambient temperature with PANanalytical X’PertPRO X-ray diffractometer (Almelo, The Netherlands) using Cu Kα radiation and operated at 40 kV and 30 mA. X-ray diffraction patterns were recorded between 10–80° 2θ at a step size of 0.017°. X-ray photoelectron spectroscopy (XPS) was performed on a Thermo Scientific K-alpha+ spectrometer (Waltham, MA, USA). Samples were analysed using a monochromatic Al X-ray source operating at 72 W (6 mA × 12 kV), with the signal averaged over an oval-shaped area of approximately 600 × 400 microns. Data was recorded at pass energies of 150 eV for survey scans and 40 eV for high resolution scan with a 1 eV and 0.1 eV step size respectively. Charge neutralisation of the sample was achieved using a combination of both low energy electrons and argon ions (less than 1 eV) which gave a C (1 s) binding energy of 284.8 eV. All data were analysed using CasaXPS (v2.3.17 PR1.1, Teignmouth, UK) using Scofield sensitivity factors and an energy exponent of −0.6. Particle size distributions and mean particle size were obtained by means of transmission electron microscopy (TEM) using a JEOL JEM 2100 TEM (Peabody, MA, USA) operating at 200 kV. Samples for examination were prepared by dispersing the catalyst in high purity ethanol. A drop of the suspension was allowed to evaporate on a holey carbon film supported by a 300-mesh copper TEM grid. Samples were subjected to bright field diffraction contrast imaging experiments. Mean particle sizes and particle size distributions were determined by measuring the size of over 200 particles from different selected areas. Scanning electron microscope (SEM) images were taken on Hitachi TM3030PLUS equipped (Tokyo, Japan) with a Quantax70 energy-dispersive X-ray spectroscope (EDX) in order to study the morphology and determine the palladium content of the samples (fresh and used catalysts). BET surface area was determined from the N2 adsorption-desorption at liquid nitrogen at 77 K using a Quantachrome NOVA 2200e instrument (Boynton Beach, FL, USA). Samples were outgassed for 3 h under vacuum at 227 °C. Total surface area was determined using the BET (Brunauer–Emmett–Teller) equation and the multi-point method. Metal content was verified by atomic absorption spectroscopy (AAS) using a Perkin Elmer 3100 (Waltham, MA, USA). After filtration of the solid catalyst during immobilisation step, the filtrated solution was analyzed by AAS to detect residual Pd, without dilution. Calibration was performed using authentic samples.

2.3. Catalytic Decomposition of Formic Acid and Analytical Methods

Liquid-phase formic acid decomposition was conducted in a two-necked 100 ml round-bottom flask placed in an oil bath with a reflux condenser and a magnetic stirrer at a pre-set temperature of (30–60 °C). The typical experimental procedure was the following: 10 ml of aqueous HCOOH solution (0.5 M) was placed in the reactor. Once the solution reached the desired temperature, the chosen amount of the catalyst was added, and the reaction was initiated by stirring. Each reaction was performed at least twice or three times in order to ensure the reproducibility of the data. TOF (turnover frequency number: moles of reactant converted per mole of metal per time) was used for evaluating and comparing initial activity and reaction rates of different catalyst after 5 min of reaction.
An approximation of the reaction order was estimated representing the rate of gas formation vs the concentration of formic acid and fitting to a power-law model equation:
r = k Cn,
where r is the reaction rate, k is the kinetic coefficient, C is the initial formic acid concentration and n is the reaction order.

2.4. Product Analysis

HPLC (high-performance liquid chromatography) was used to calculate the concentration of formic acid and therefore conversion of formic acid during reaction progress. Liquid samples of the reaction mixture were withdrawn periodically, diluted 1:100 volumetric ratio with deionised water and analysed by HPLC model Agilent 1220 Infinity LC using a column MetaCarb 87H 250 × 4.6 mm, Agilent (Santa Clara, CA, USA), at 60 °C and a flow rate of 0.4 mL min−1. The instrument is equipped with a Variable Wavelength (VW) Detector pre-set at 210 nm. The eluent was an aqueous solution of phosphoric acid (0.1 wt. %). Succinic acid was used as external standard for the quantification of formic acid.

2.5. Gas Analysis

Using a gas burette as in the water displacement method, gas evolved from formic acid decomposition was collected. The gas evolved is measured simply by tracking the volume of water displaced from an inverted water-filled measuring burette. Analysis for the detection of H2 was carried out by using a Varian GC-TCD (gas chromatography-thermal conductivity detector CP-3380) (Palo Alto, CA, USA) with a column Porapak Q 6 m × 1/8” 2.0 mm 80/100 SS using Ar as a carrier gas. CO and CO2 were quantified using a Varian 450-GC (Palo Alto, CA, USA) fitted with a CP-Sil 5CB capillary column (50 m length, 0.32 mm diameter, carrier gas: He), a methanator unit and both FID and TCD detectors with a detection limit of CO below 5 ppm. The gases were quantified using calibration curves constructed from commercial standards (BOC gases). At 30 °C, between 50,000 and 60,000 ppm of CO2 were found for both PdIMP/CNF and PdSI/CNF, and 15 and 11 ppm of CO for PdIMP/CNF and PdSI/CNF, respectively, presenting high selectivity toward H2 (> 99.99%), suggesting that the reaction mainly follows the desired route (to hydrogen and carbon dioxide). Once both H2 and CO2 were quantified, H2/CO2 ratios were calculated. The typical ratios were from 0.94 to 1.09 for the catalytic decomposition of formic acid. This deviation could be due to a difference in solubility of CO2 and H2 or a consumption and adsorption of H2 by PdO as previously reported [21].

3. Results

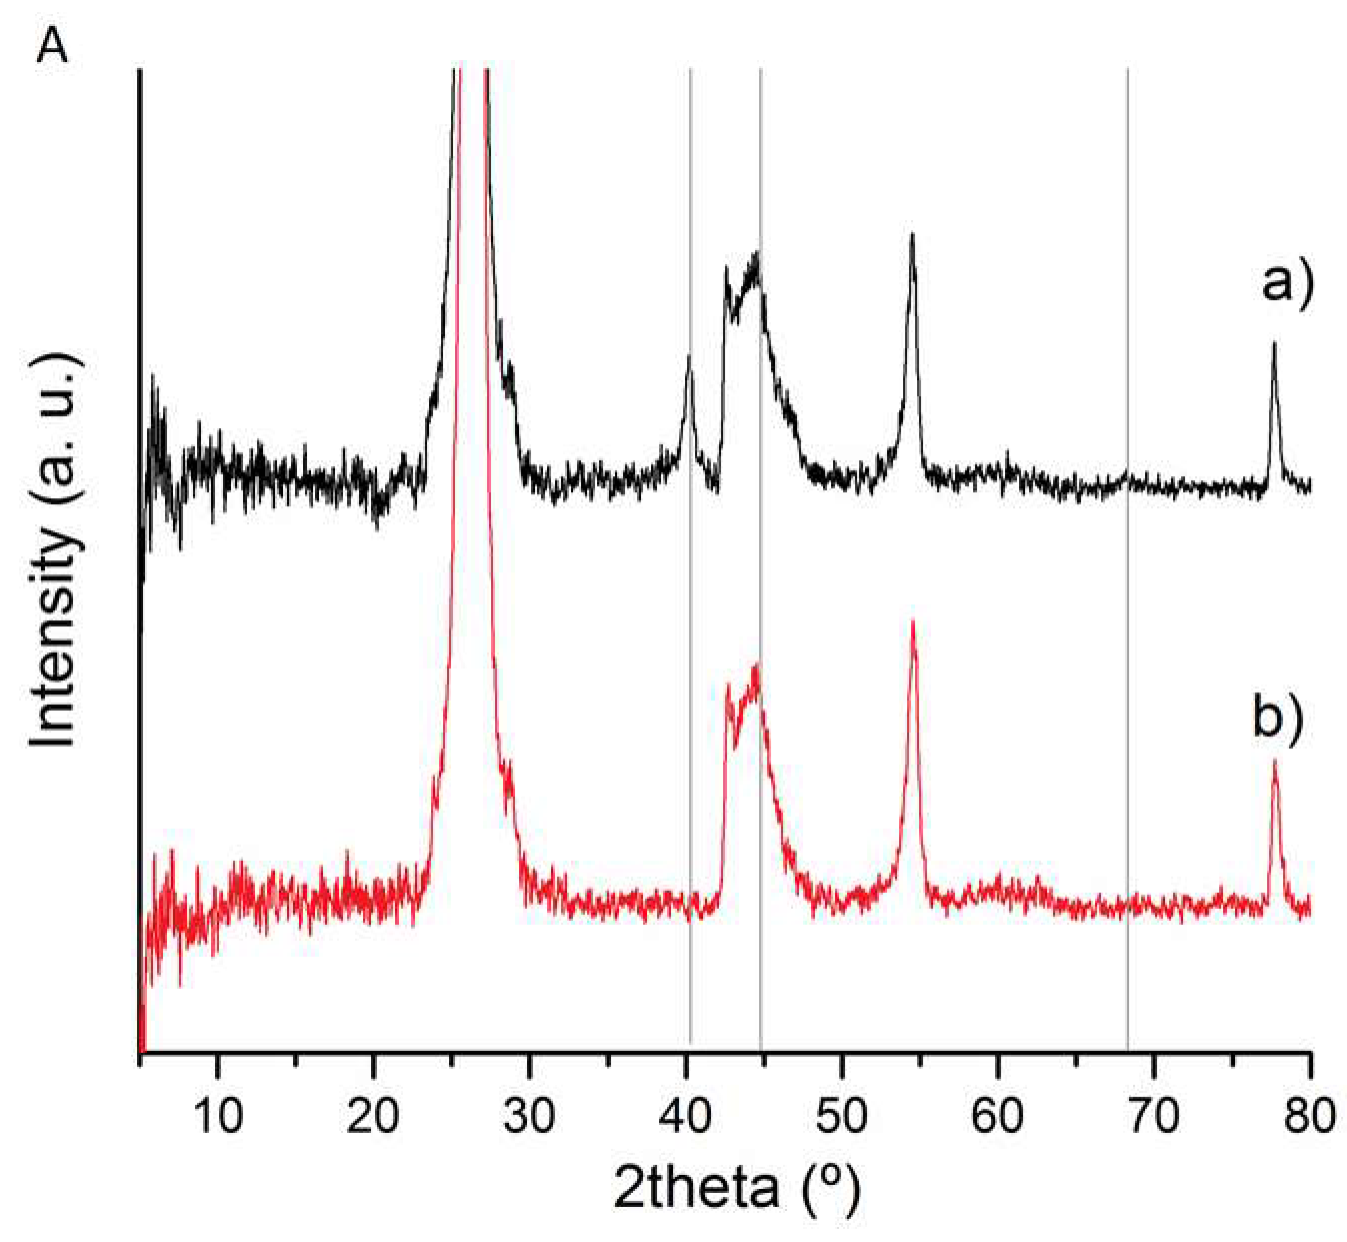
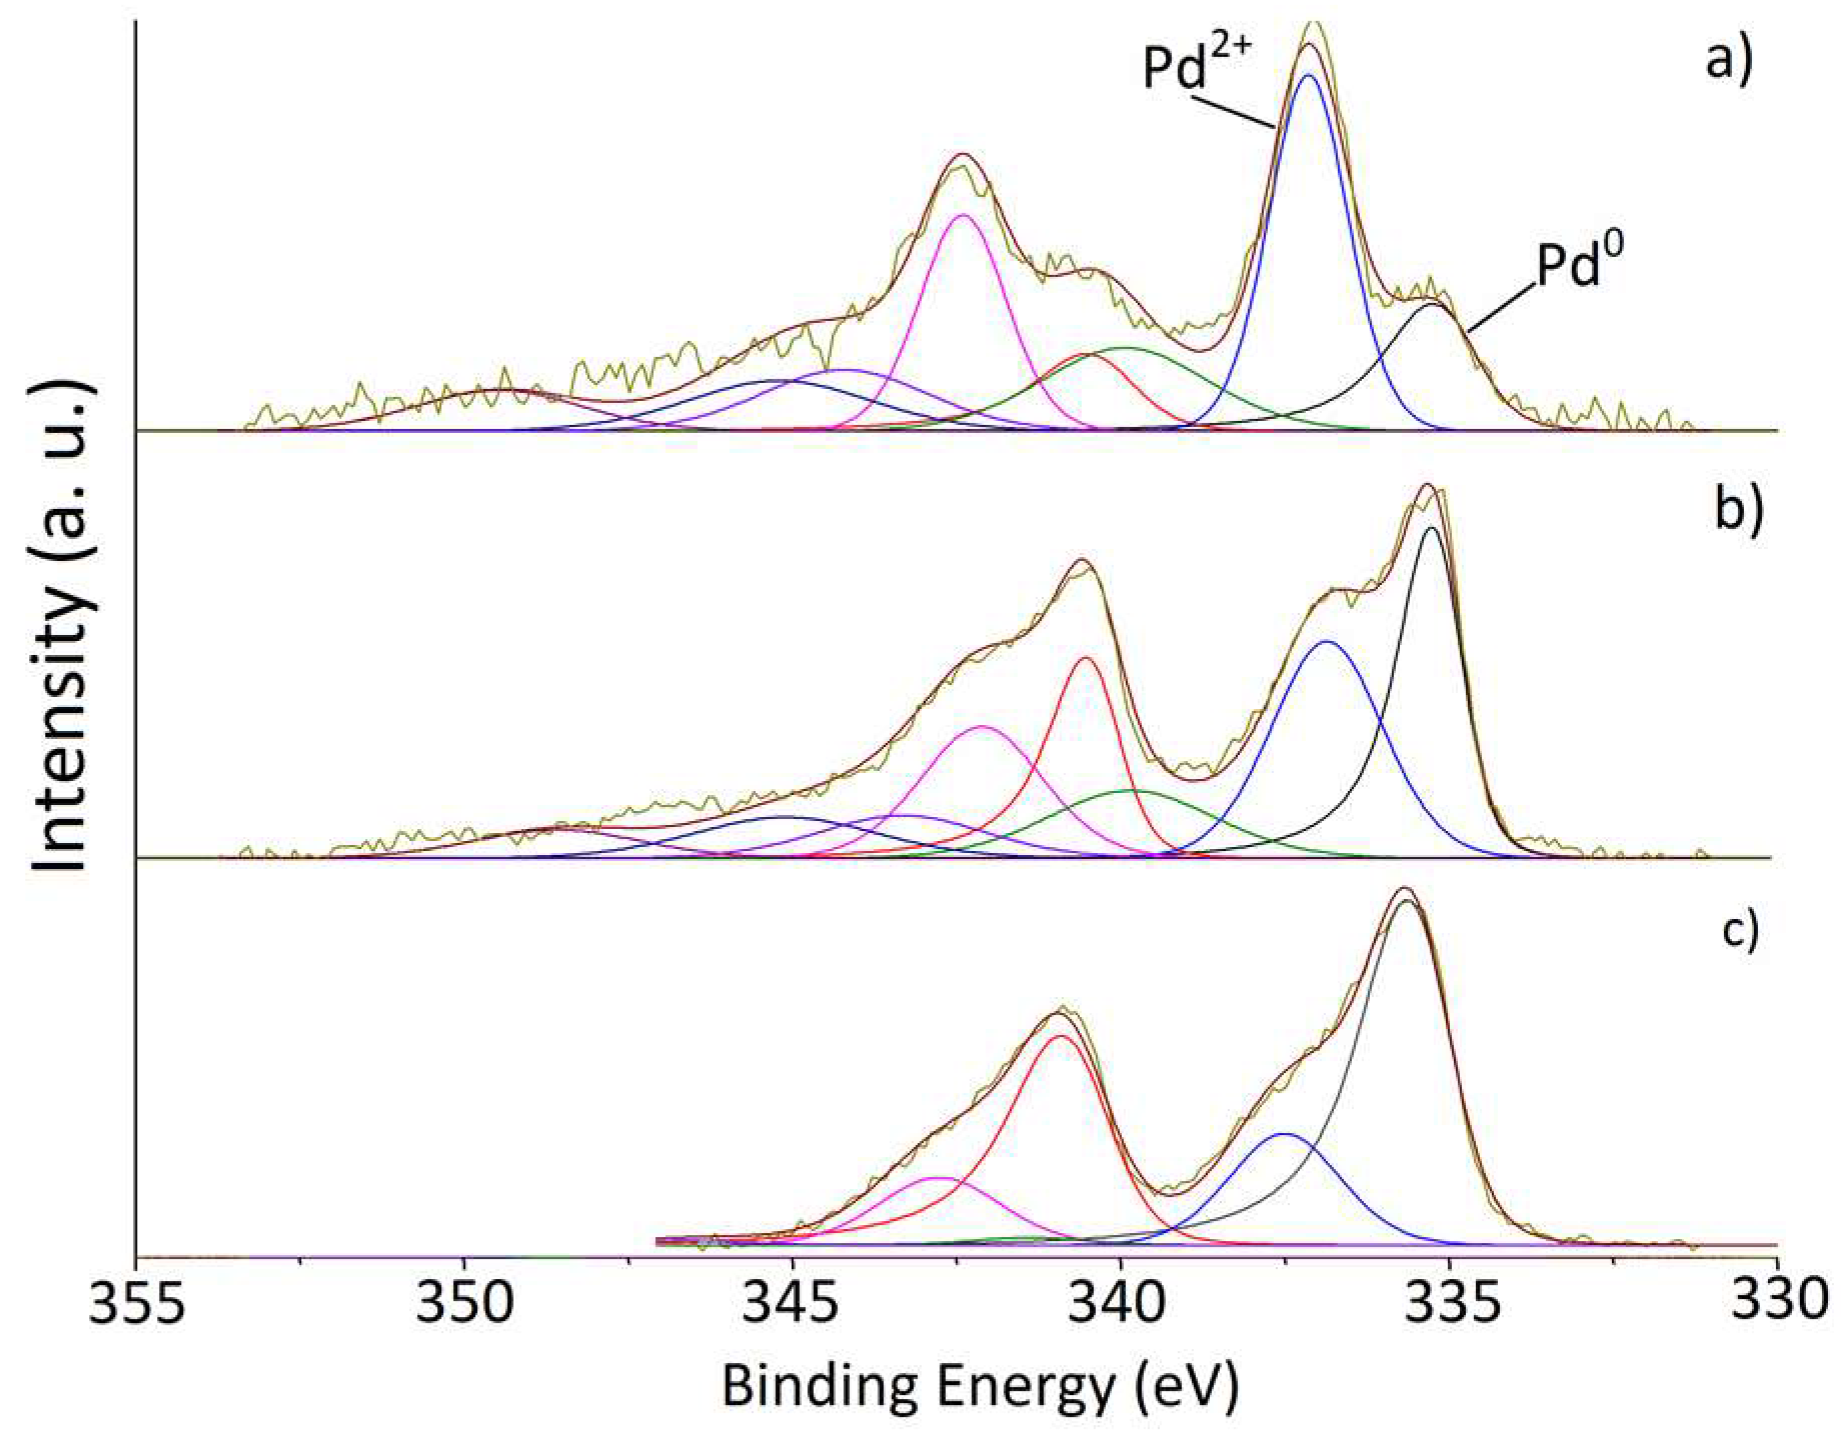
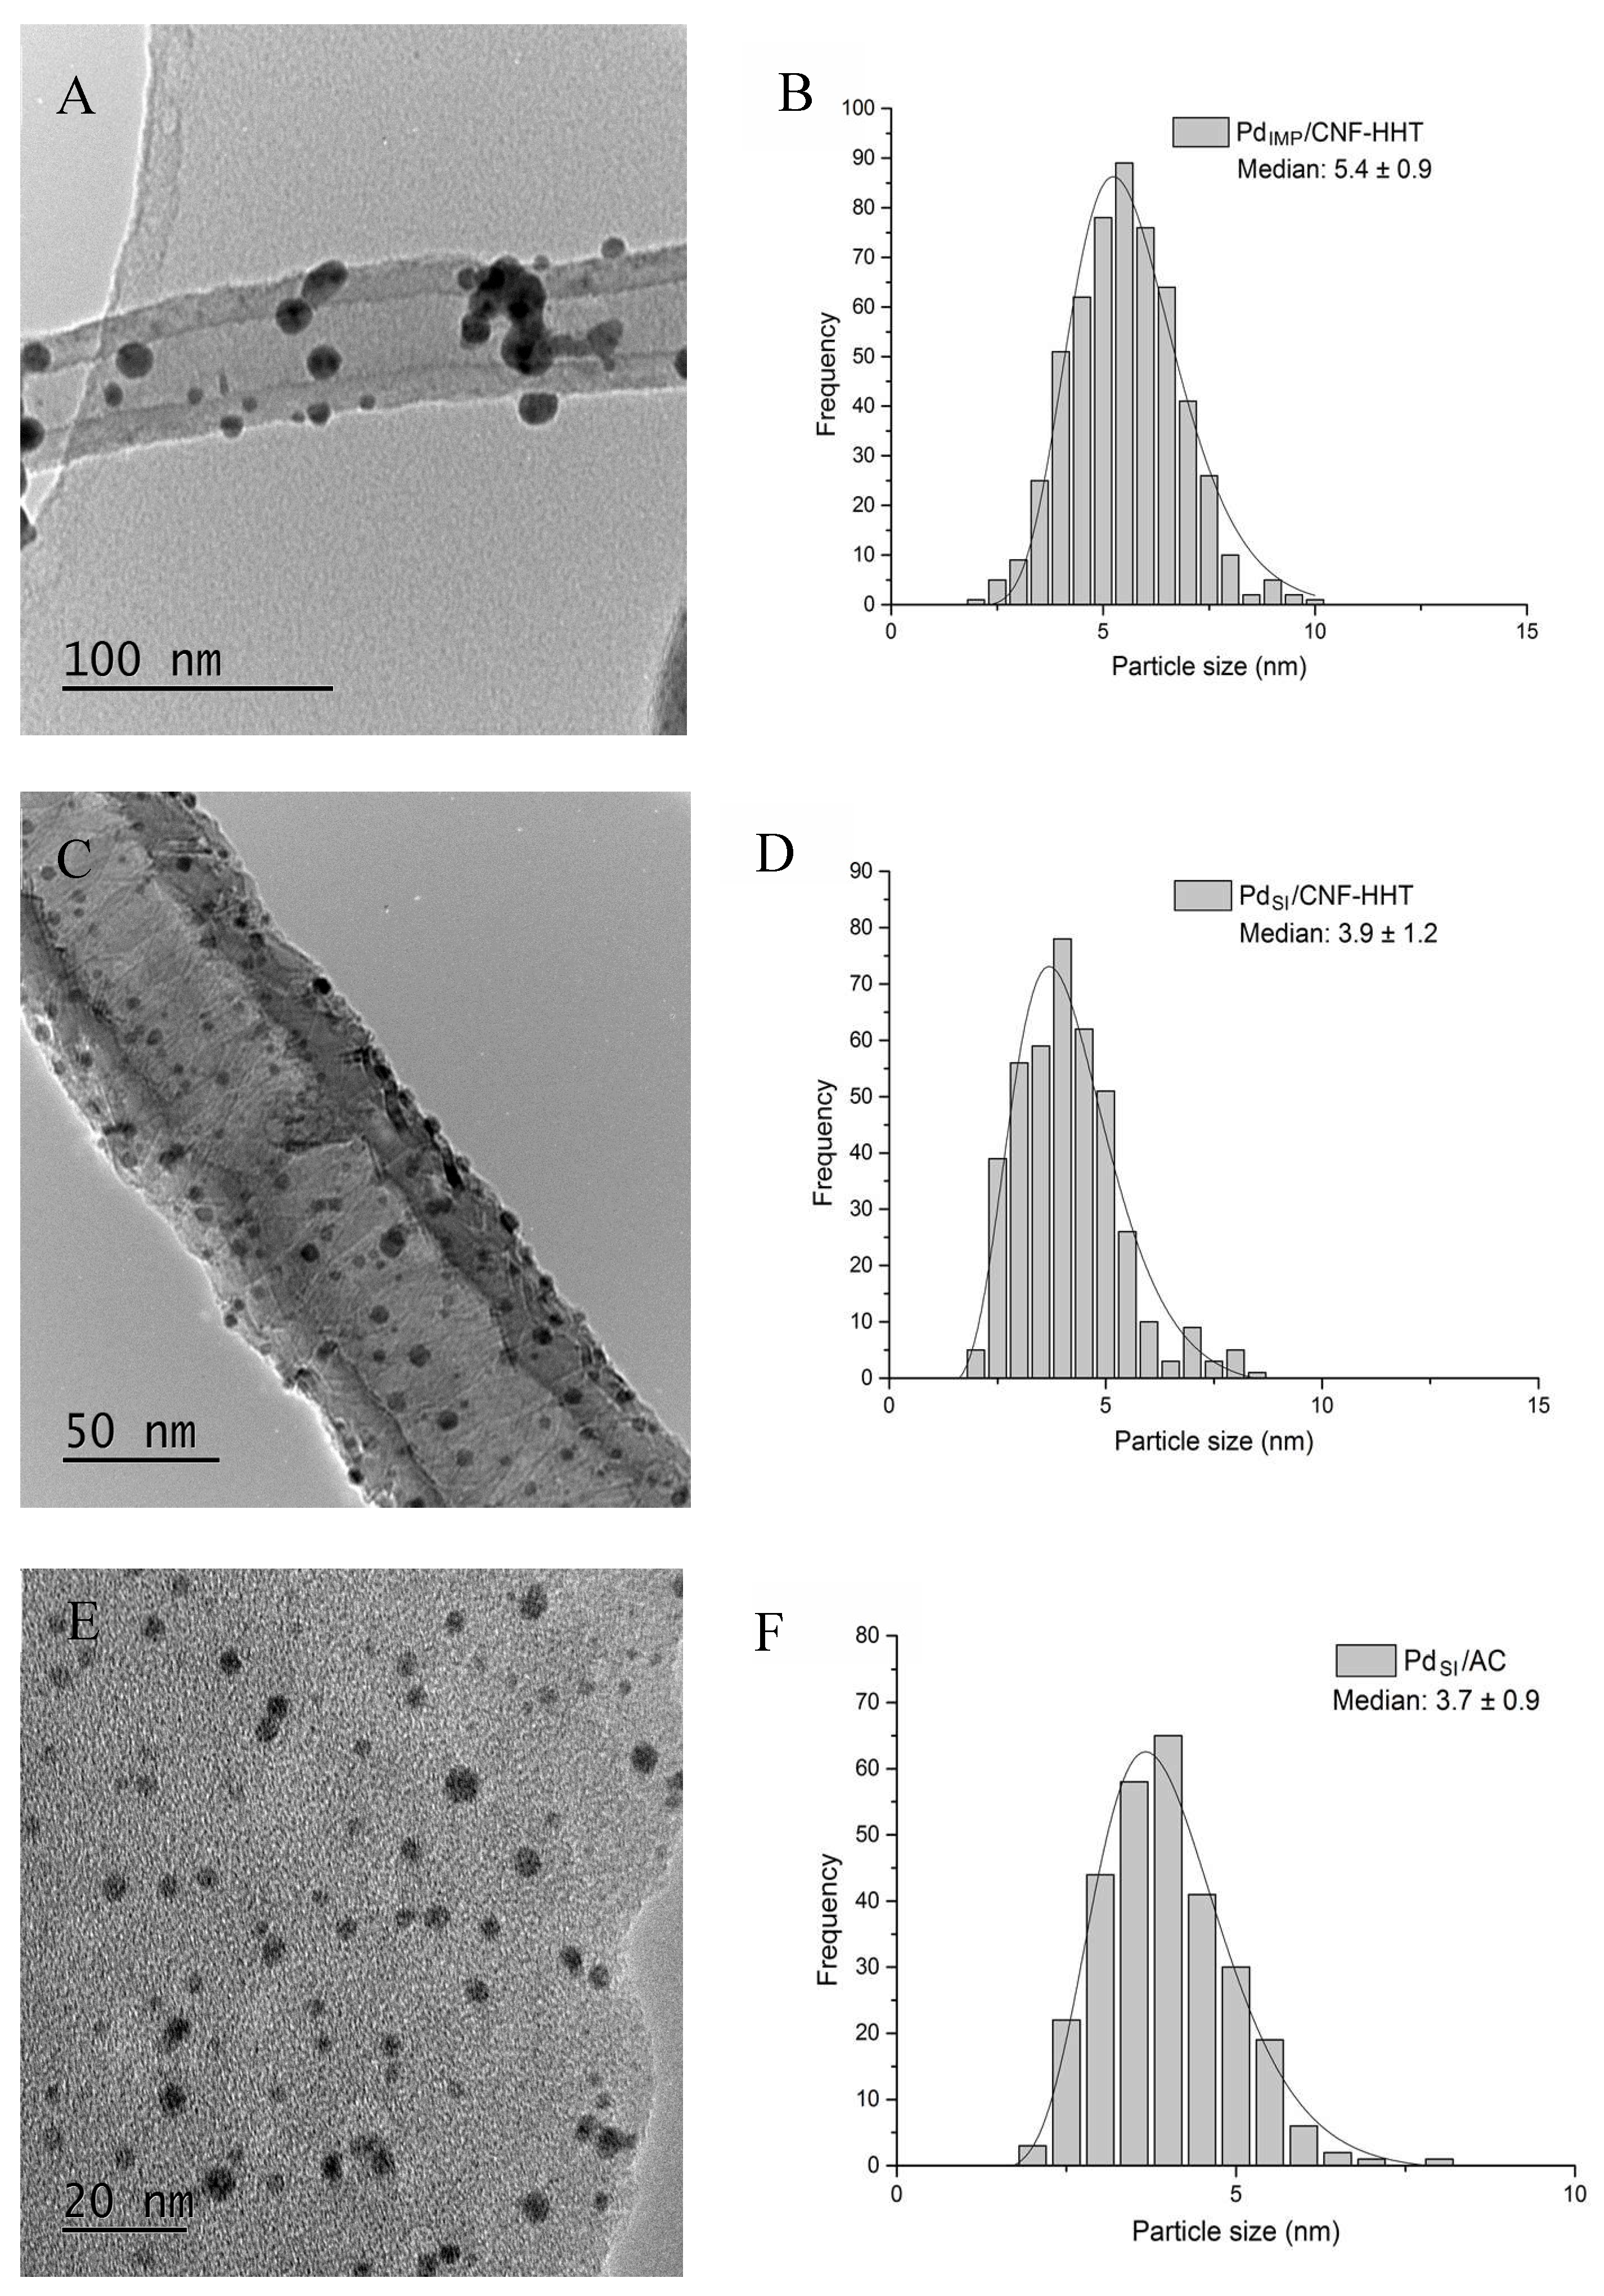
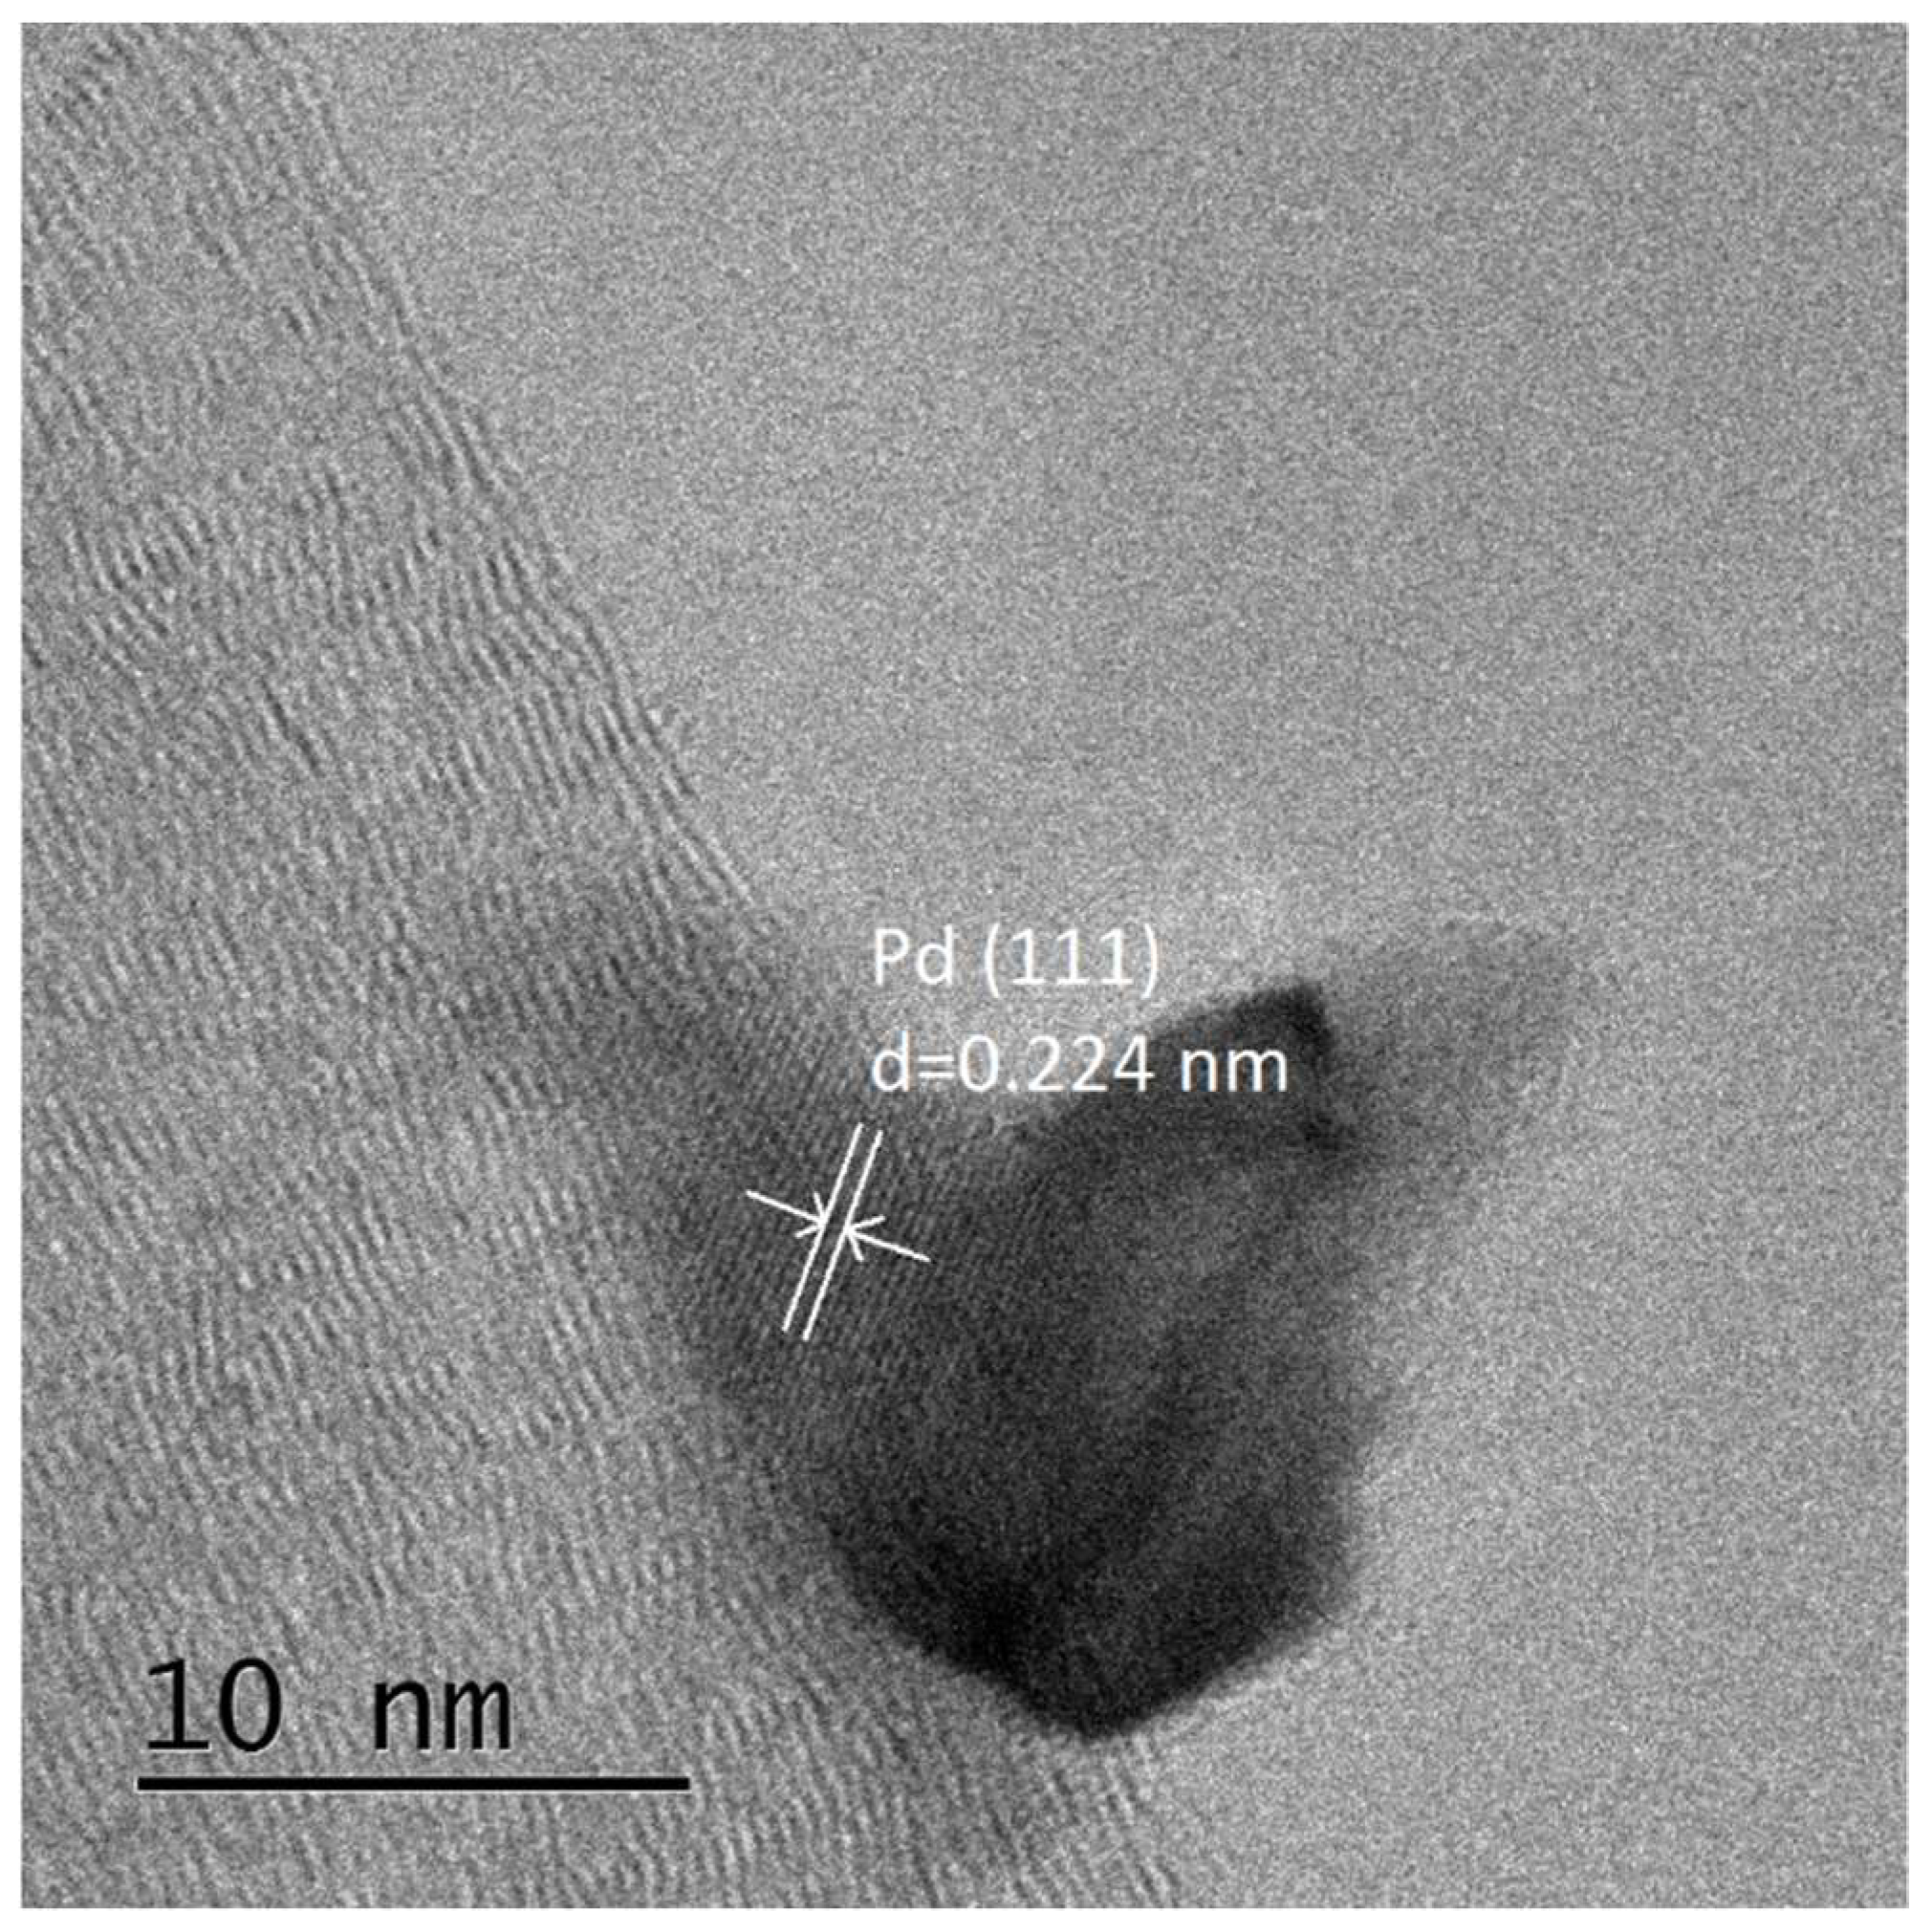
3.1. Catalysts Characterisation

X-ray diffraction patterns of the catalysts are shown in Figure 1. The most visible feature for all the samples is the diffraction peak at 26°, assigned to the presence of graphitic carbon particularly to the (002) plane [38]. The region between 42° and 46° forms a broad peak that could be attributed to the (100) and (101) planes of C but it is difficult to specifically assign since both hexagonal and rhombohedral graphite peaks are present in this region [38]. Both CNFs samples present as intense and sharp diffraction peaks at 54° and 78°. The diffraction peaks at 78° correspond to the graphitic carbon (110) plane confirming the presence of rhombohedral graphite [38]. The assignment of the diffraction peak at 54° is not straight forward since both graphite (004) and PdO (112) planes could be assigned for the same position [38,40]. In order to verify this hypothesis, XRD patterns of the bare supports were analysed and are shown in Figure S1. It confirms the presence of graphite (004) plane, however, this peak shows a slightly lower intensity compared with the XRD pattern of the corresponding catalysts. Therefore, we can presume that PdO (112) plane is overlaid by graphite (004) plane and these results indicate the presence of PdO species. The characteristic planes (111), (200), and (220) of face-centered cubic structure of Pd [40,41] are assigned to the reflections at 2θ = 40.4°, 44.9°, and 68.3° (grey lines in Figure 1) and are present only in some catalysts as it is evident from the XRD patterns. It is well known that one of the limitations of the XRD technique is the crystallite size, being approximately 5 nm, the detectability limit of the apparatus [31]. The higher intensity of the diffraction peak at 2θ = 40.4° for the PdIMP/CNF indicates the presence of larger Pd nanoparticles (above 5 nm), which is in agreement with the TEM data, presented in the following sections. This has been further investigated by XPS studies calculating the atomic percent of Pd on the surface and proportion of Pd0.
XPS analysis of the as-synthesised samples were carried out to determine the oxidation states of Pd and the palladium, oxygen atomic contents. The XPS spectra of Pd(3d) of the as-synthesised catalysts are presented in Figure 2 for impregnation (a) and sol-immobilisation methods (b and c). Pd atomic content and percentage of Pd0 derived from XPS are shown in Table 1. Pd 3d5/2 component at 335 eV approximately was assigned to metallic Pd [42] and the component at approximately 337 eV, to PdII mainly present as PdO [43]. It should be noted that Binding Energy (BE) of Pd0 for Pd/CNFs (334.9 and 335.0 eV, for PdIMP/CNFs and PdSI/CNFs, respectively) is lower than in the case of PdSI/AC (335.6 eV). These results can suggest an electron donation from the functional groups present on CNFs surface to Pd. As presented in Table 1, the impregnated sample displays a lower Pd atomic content on the surface in contrast with the sol-immobilisation prepared sample as confirmed in Figure 2 in which the former catalysts series present lower spectral intensities. This feature has an effect on the catalyst activity as will be discussed later. It is necessary to emphasise that these atomic contents are calculated on the surface of the catalysts, existing differences with those percentages calculated by EDX since this technique is bulk sensitive in contrast with XPS which is surface sensitive, providing information on the state of the surface at a depth of 25–30 Å [44]. From Figure 2 and Table 1, we can conclude that the catalyst prepared by sol-immobilisation method display a higher percentage of Pd0 species. This can be explained by the presence of PVA. Probably, the ligand containing -OH groups, limits the oxidation of the Pd surface at ambient air. Nevertheless, by using PVA as the preferred stabiliser, a significant increase of Pd0 species by a factor of more than three has been accomplished.
When compared with the 1 wt. % PdSI/AC, a high Pd atomic content of 3.68 on the surface is obtained probably due to a small pore diameter as explained in following paragraphs. The percentage of metallic Pd for the 1 wt. % PdSI/AC was 74.2; this value is similar to the 1 wt. % PdSI/CNF prepared by the sol-immobilisation method (61.5%) even though the parameters during the preparation were slightly different. The total surface oxygen content was evaluated by XPS and it was increased from 0.94–2.72 at. % for the 1 wt. % Pd/CNF samples to 24.51 at. % for the PdSI/AC sample. Moreover, the relative concentration of sp3 and sp2 hybridisation type from the deconvolution of C1s has been measured. C1s XPS spectra of the catalysts studied is presented in Figure S3. Table S1 displays the concentration of sp3 and sp2 hybridisation and its ratio (sp2/sp3) since it determines structural properties of carbon materials that may have an important impact on final activity of the catalyst. The component appearing at approximately 284 eV is attributed to sp2 carbon and the component at 285 eV, to sp3-hybridised carbon species. As observed, both catalysts supported on carbon nanofibers present a high sp2 and ratio sp2/sp3 as a proof of graphitisation of the surface. On the contrary, sp2 hybridisation in the sample supported on activated carbon is very low, suggesting a significant presence of amorphous carbon on the surface. This significant difference between CNFs and activated carbon in terms of surface C and O atomic content could attribute to the observed trend in terms of catalytic activity. It has been reported by Gil et al. that carbonaceous supports with higher graphitization degree and lower oxygen content promote the activity of Au based catalysts in the case of the liquid phase oxidation of glycerol with a lower amount of structural defects led to Au particles strongly anchored to the orderly exposed graphite edges. In another case, M. Zacharska et al. has reported the high presence of oxygen functional groups is not desirable for improving catalytic activity in the liquid phase decomposition of formic acid [37].
In summary, the XPS analysis have shown that there are two types of Pd species present in the samples. The catalyst prepared by sol-immobilisation technique exhibit a higher surface Pd atomic content and, since PVA ligands tend to inhibit the oxidation of the Pd surface, a higher percentage of metallic Pd (Pd0= 61.5% for PdSI/CNF), compared to the catalyst prepared by impregnation (Pd0= 25.9% for PdIMP/CNF). Moreover, Pd/CNF samples possess higher degree of graphitization and lower oxygen content on the surface than the Pd/AC sample.
Mean particle size and particle size distributions of the catalysts were assessed from analysis of bright field TEM micrographs (Figure 3). PdIMP/CNF presents a particle size distribution in the 2.5–9 nm range, being approximately 5.4 nm the mean particle size, PdSI/CNF presents a narrower particle size distribution of 2–8 nm and a smaller mean particle size of 3.9 nm, and PdSI/AC presents a mean particle size of 3.7 nm and a particle size distribution of 2–8 nm. Table 2 shows the mean particle size of the as-synthesised catalysts. Regarding the catalysts supported on carbon nanofibers, TEM analysis provides evidence that the Pd nanoparticles were more evenly distributed on the catalyst prepared by sol-immobilisation in comparison with the impregnated sample.
For the catalyst supported on activated charcoal, the average pore diameter obtained is 3.77 nm. Since the mean particle size is very similar, penetration of the nanoparticles inside the pores might be impeded explaining the abnormally high Pd atomic content on the surface.
HRTEM image in Figure 4 for the PdSI/CNF is shown as a representative example of a typical metallic Pd nanoparticle showing a discrete lattice-fringe of the face centered cubic (fcc) Pd crystal with a d-spacing of 0.224 nm, which is in agreement with the lattice spacing of the (111) plane reported in literature [20,45].
The distribution and dispersion of Pd nanoparticles within the CNFs was measured with SEM-EDX. Figure S2A displays a typical SEM image of the PdIMP/CNF. EDX analysis from an extensive area during the SEM observation was performed confirming the presence of Pd and its homogeneous distribution in the catalyst (Figure S2C). Total metal loading derived from EDX and from atomic absorption spectroscopy (AAS) analysis for the three catalysts is presented in Table 3. As shown, total metal loading of the as-synthesised CNFs catalysts is in good agreement to the nominal value of 1 wt. % and it is not considerably affected by the preparation method used in this work. A slight deviation is observed for the catalyst supported on activated charcoal. An average loading of 1.15 % is reached. Figure S2B,D display the SEM image and EDX analysis for the PdSI/AC showing as well, a good dispersion of the metal nanoparticles.
In Table S2, the total surface area determined from the BET equation is presented. For the CNFs bare support, it is 34 m2 g−1 and for the activated charcoal, 64 m2 g−1. For both Pd PdIMP/CNF and PdSI/CNF, the surface area was 37 and 36 m2 g−1, respectively. Finally, for the Pd/AC the surface area decreased to 32 m2 g−1.

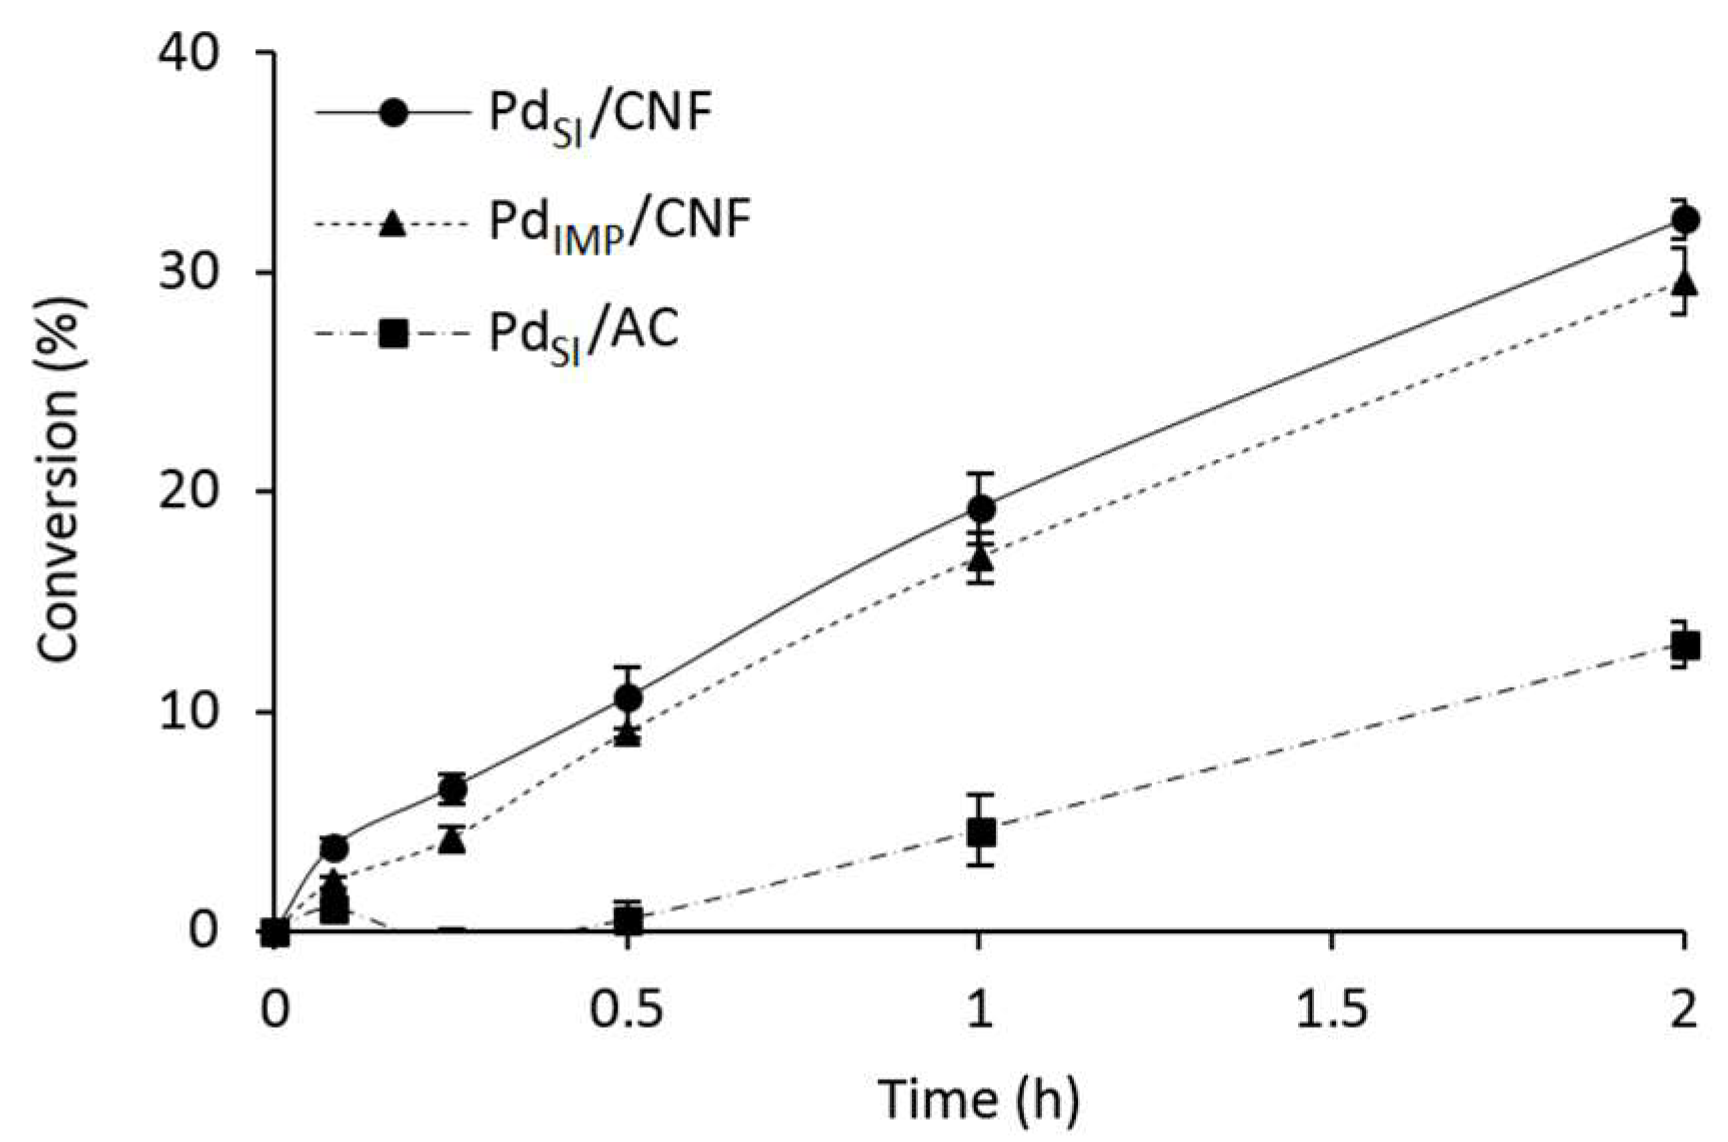
3.2. Catalytic Activity Comparison of the Pd/CNF Series Catalysts for the Formic Acid Dehydrogenation

The catalytic performance of 1 wt. % Pd nanoparticles supported on functionalised carbon nanofibers (1 wt. % Pd/CNFs) was evaluated in the liquid-phase decomposition of formic acid as a model reaction for hydrogen generation. Figure 5 presents the catalytic activity of the 1 wt. % Pd/CNFs prepared by impregnation and sol-immobilisation and 1 wt. % PdSI/AC. The catalytic performance of the catalysts was evaluated at 30 °C, 750 rpm, 0.5 M HCOOH, substrate/metal molar ratio of 2000, and 2 h reaction time. The TOFs obtained are presented in Table 4 and compared with previously reported data. The products detected in the gas phase were mainly CO2 and H2 with presence of CO in ppm levels (11 ppm for PdSI/CNF and 15 ppm for PdIMP/CNF). An improvement of 10 % is observed for the catalyst prepared by sol-immobilisation compared with the catalyst prepared by impregnation. Taking into account that EDX is a bulk sensitive technique, we observed a similar metal loading (around 1 wt. %) for both catalysts, therefore we dismiss as an important factor the effect of metal loading in the observed catalytic trend. XPS data in Table 1 showed that we obtained a higher Pd atomic percentage on the surface in the sol-immobilised samples by a factor of three, thus, we can confirm that, with the sol-immobilisation method Pd nanoparticles were preferentially deposited on the external surface of the nanofibers, whereas with the impregnation method Pd nanoparticles were deposited in the inner walls of the carbon nanofibers, besides the distribution on the surface in agreement with previous published results [46]. Graphitisation of the surface observed by means of XPS is suggested to be one of the main reasons of the differences in activity observed between the catalysts supported on carbon nanofibers and activated carbon. The higher metal percentage on the surface for the colloidal method can partially contribute to the higher catalytic activity. Another important contribution to the activity of the catalyst is the oxidation state of Pd (Figure 2). A higher percentage of Pd0 was observed for the catalysts prepared by the colloidal method, in agreement with our previous studies that metallic Pd is responsible for higher catalytic activity [47]. Finally, particle size of Pd plays an important role in terms of catalytic activity. TEM analysis confirmed a lower particle size of Pd for the sol-immobilisation samples: 3.9 nm, while for impregnation is 5.4 nm, therefore a lower particle size of Pd is expected to facilitate the enhancement of catalytic activity since number of edge and corner of Pd atoms will increase. Previous studies have shown that the decrease of Pd particle size has a positive influence for the effective decomposition of formic acid [48,49,50,51].
When compared with the catalyst supported on activated charcoal, a significant increase on the conversion by a factor of two is observed for both catalysts supported on CNFs confirming that this support leads to a significant improvement in catalyst activity. Furthermore, the structure sensitivity of the Pd nanoparticle catalysts have been further investigated by relating activity data to Pd nanoparticle size. TOF was calculated based on total number of surface atoms (TOFNs) as described in the supplementary information section. The TOF values normalized to Ns are expected to be independent of the Pd nanoparticle sizes, therefore excluding particle size effect. The order of activity (TOFNs) was the following: PdSI/CNF (TOFNs = 3172.6 h−1) > PdIMP/CNF (TOFNs = 2442.1 h−1) >> PdSI/AC (TOFNs = 744.2 h−1). As said before, slight differences in the parameters during the sol-immobilisation method when preparing the catalysts supported on CNF and AC could also have an effect on the activity but since in the presence of CNF the activity increases by a factor of two, we could hypothesise that the support is the main cause of this improvement.
In summary, higher catalytic activity was obtained for the CNFs supported Pd nanoparticles synthesised by sol-immobilisation method. The main reasons for the improved catalytic activity could be attributed to: (i) the higher Pd surface content; (ii) higher percentage of metallic Pd on the surface; and (iii) smaller Pd particle size.

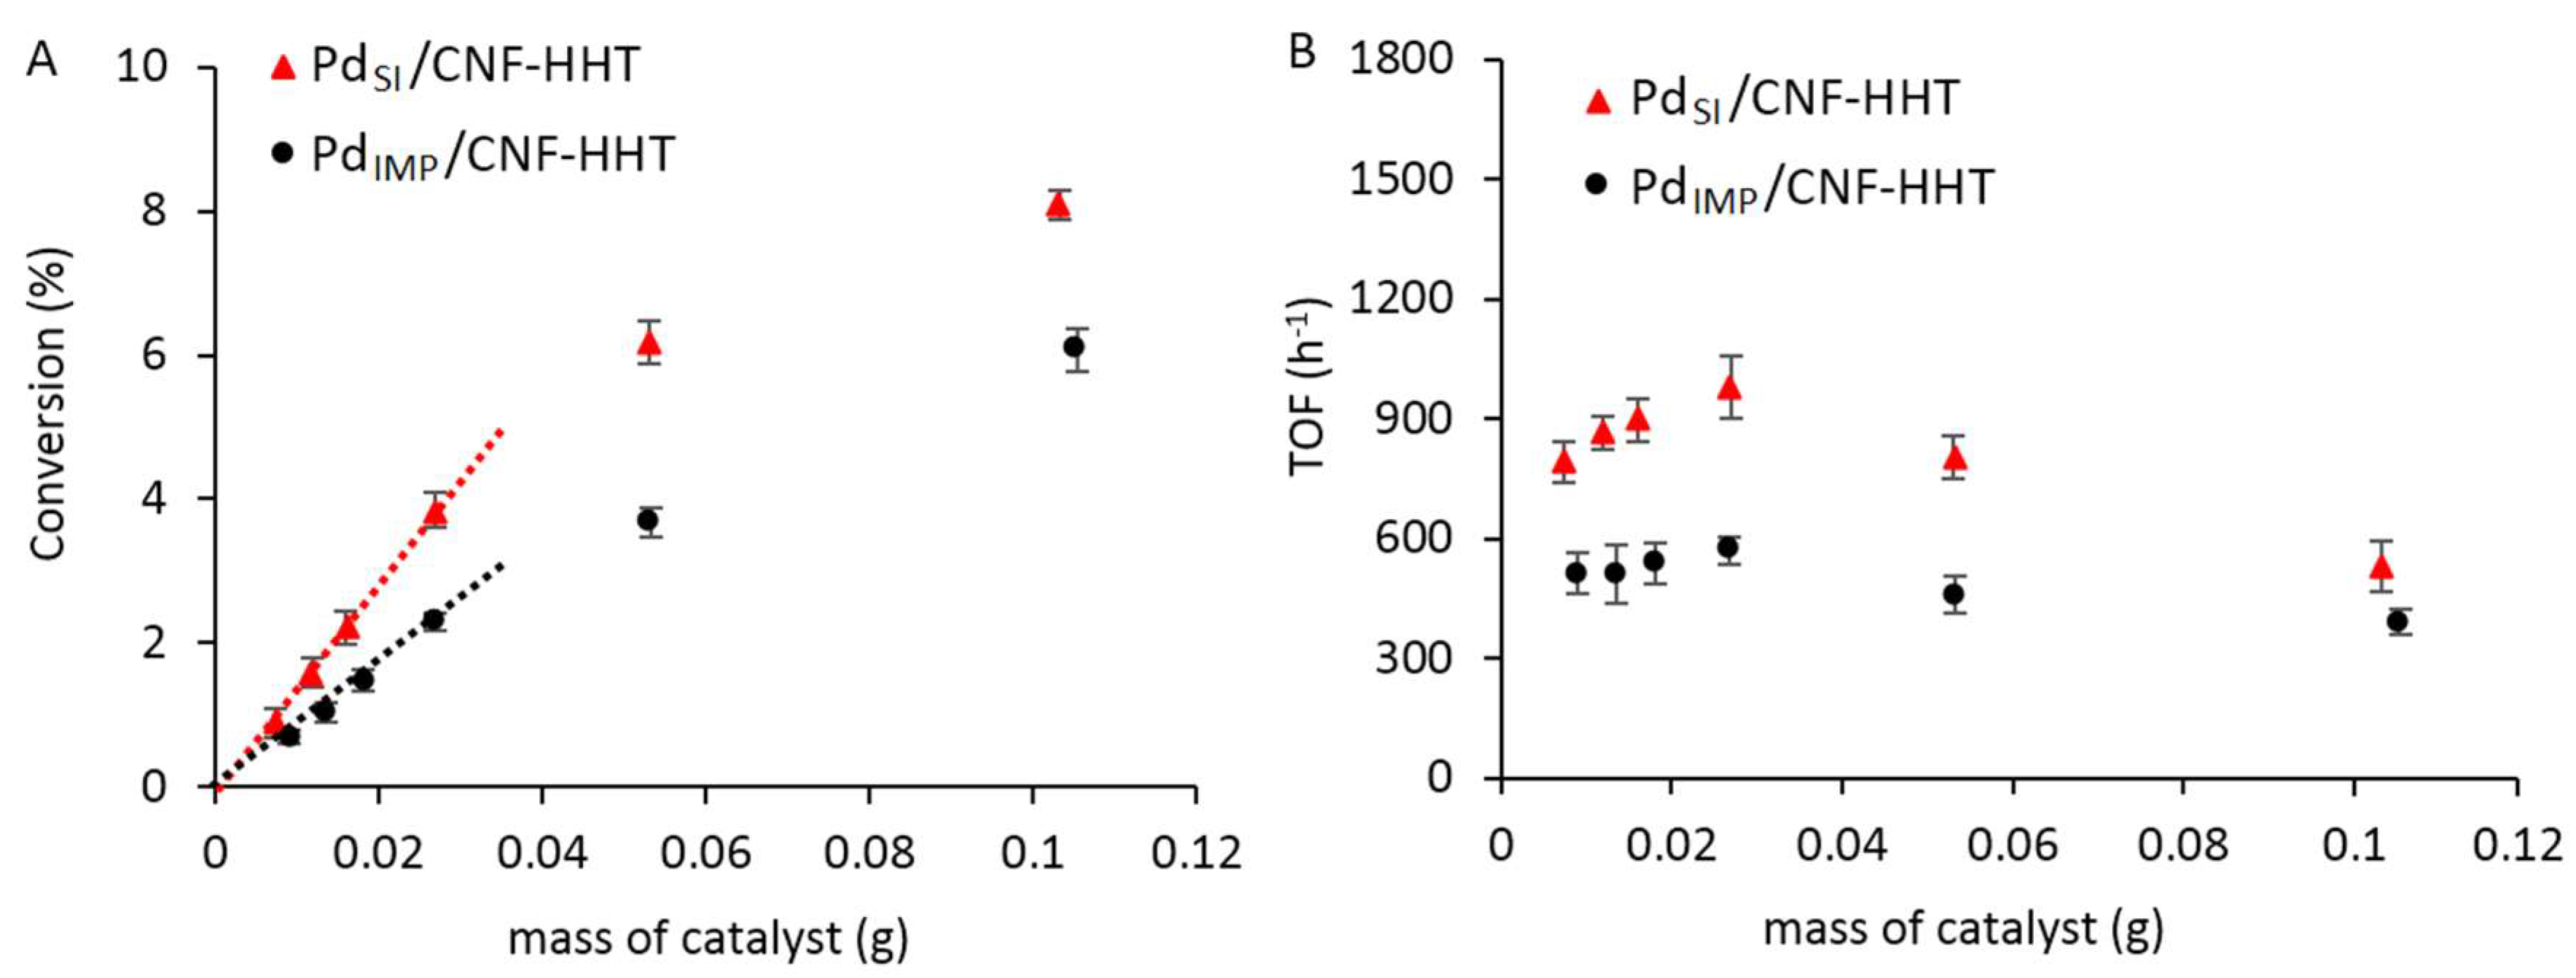
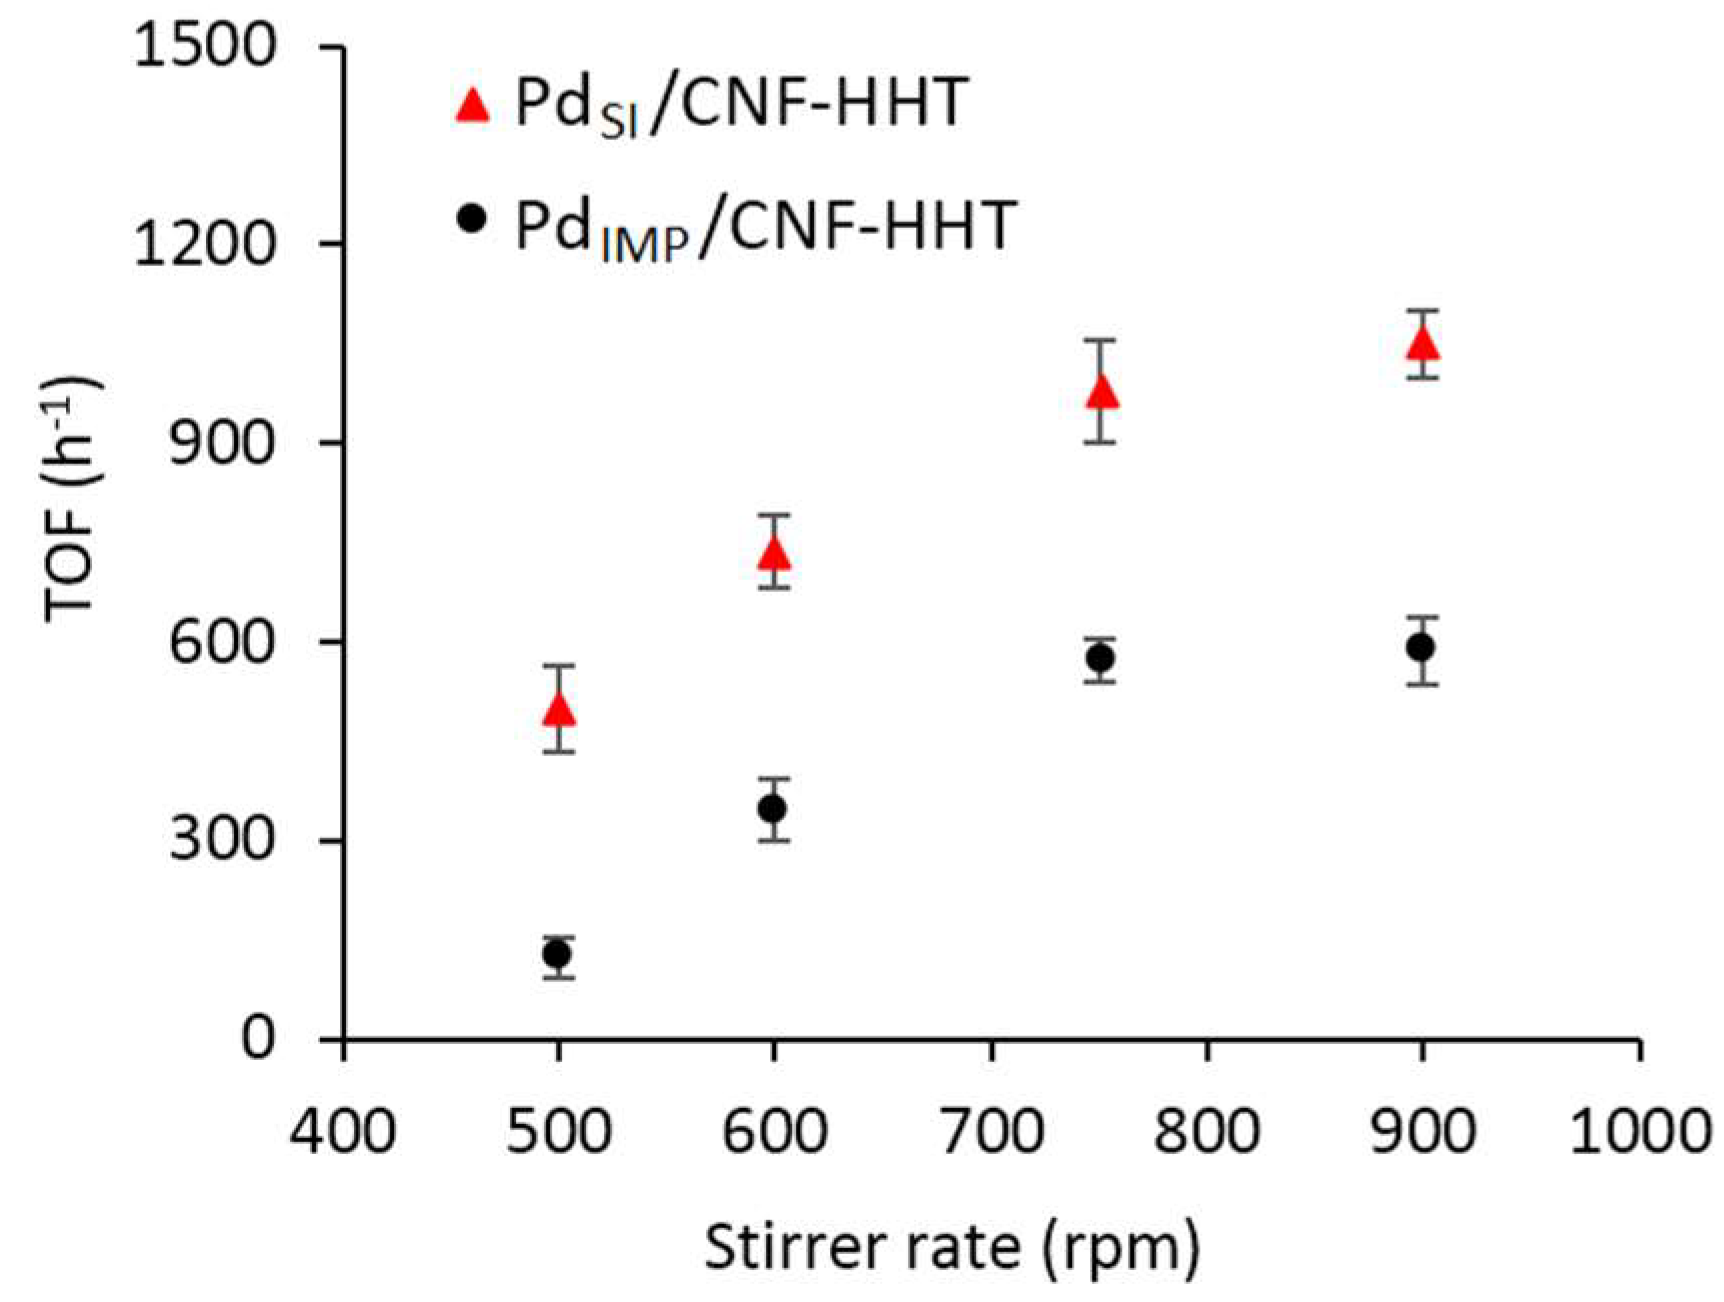
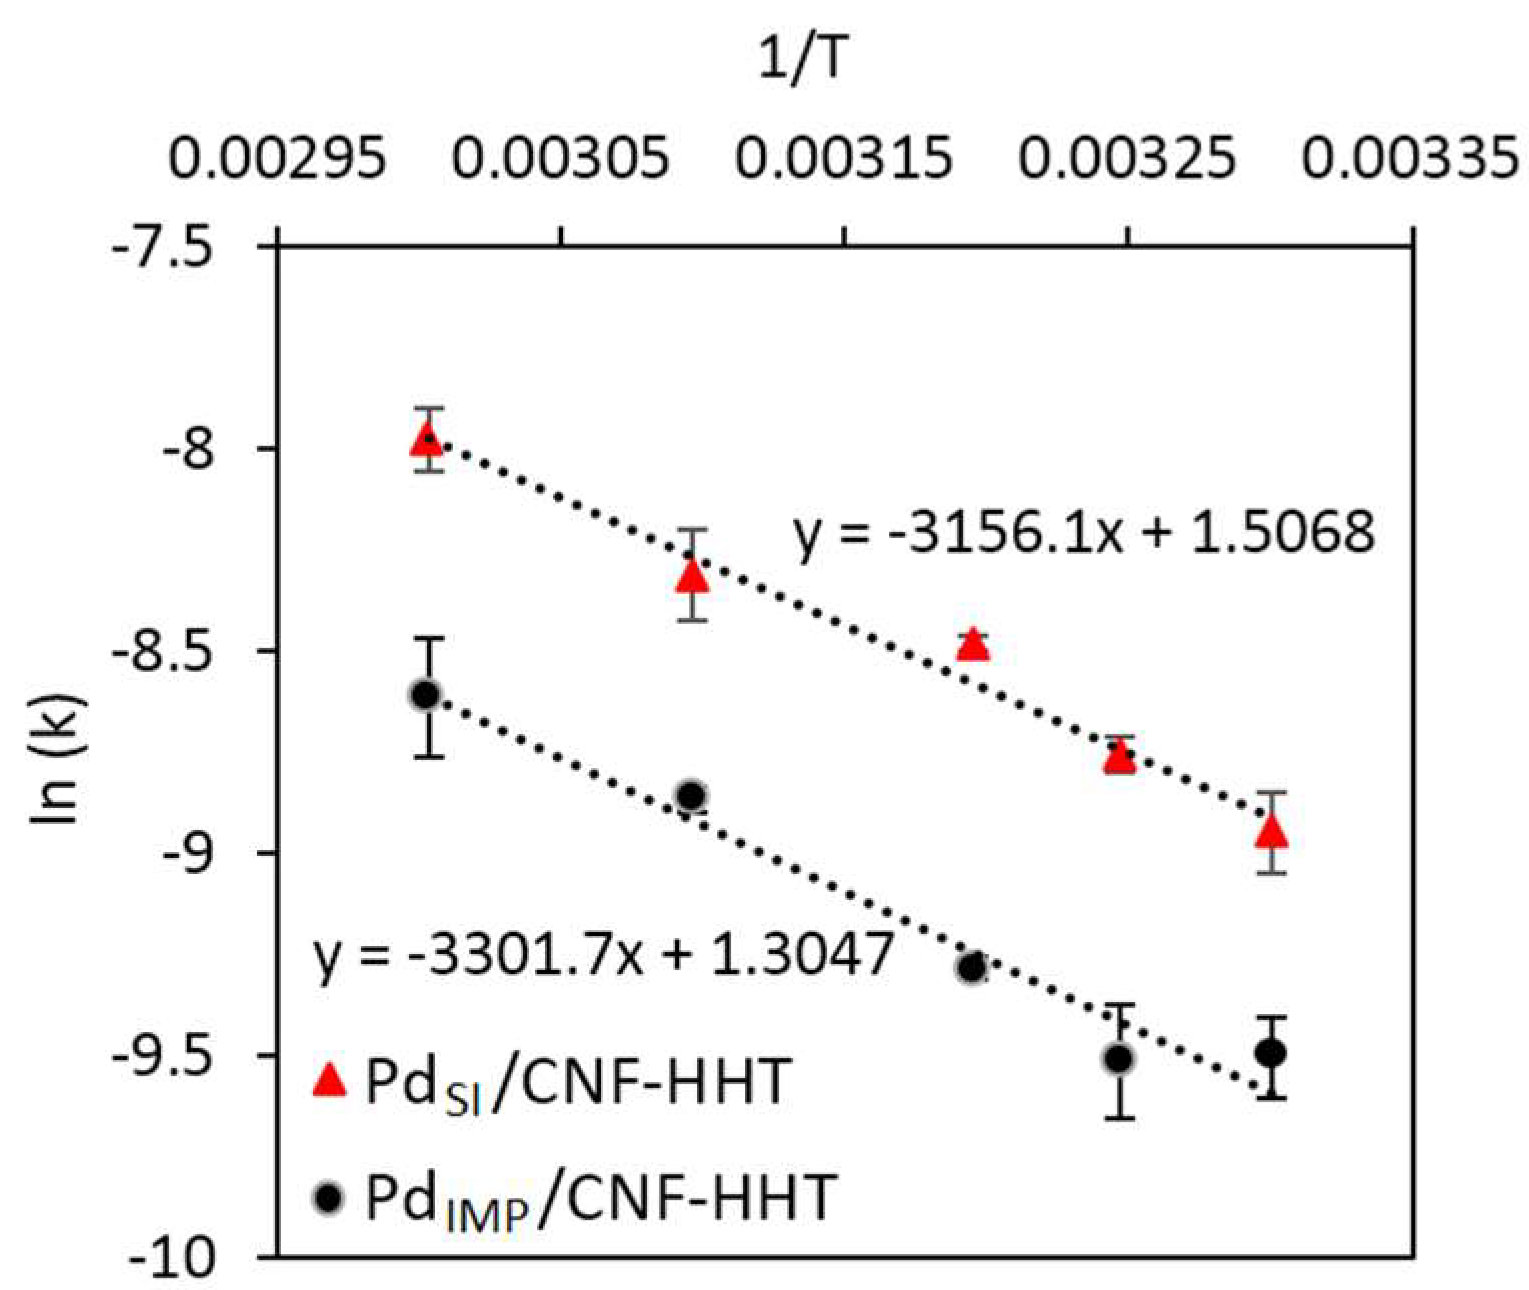
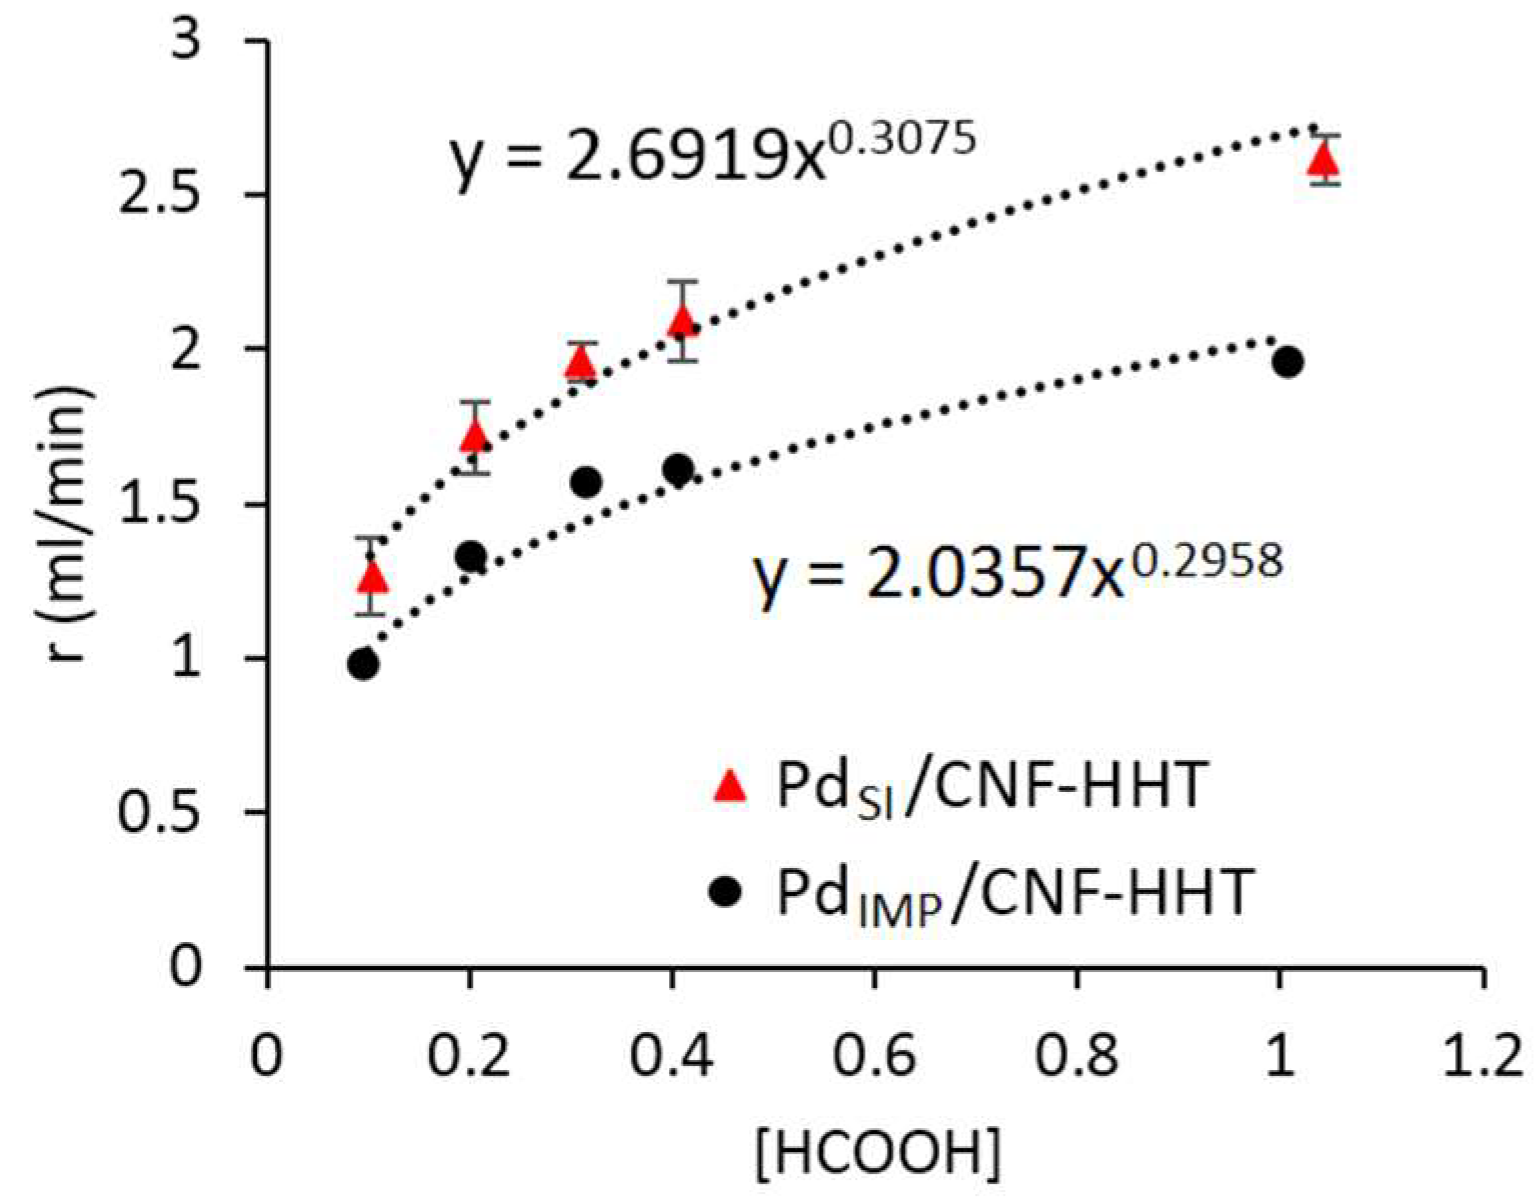
3.3. Kinetic Studies for Pd/CNF for Liquid Phase Formic Acid Decomposition

After the thoroughly characterisation and initial screening in the liquid-phase decomposition of formic acid, these catalysts have been used to investigate the effect of specific reaction conditions, such as, stirring speed, substrate/metal molar ratio, and temperature as we have previously reported for a commercial Pd catalyst [47]. We focused our studies at the aforementioned conditions (e.g., 30 °C) since one of the requirements for portable devices using formic acid fuel cells is the requirement of working at mild reaction conditions. In order to measure intrinsic kinetics, the experimental data have to be verified in the absence of external mass transfer limitations (chemical kinetics regime). Therefore, the occurrence of mass transfer limitations (external) was experimentally investigated. Initially, the effect of catalyst mass (substrate/metal molar ratio) was investigated at 30 °C, stirring rate of 750 rpm, and 2 h reaction time. Two reaction regimes were identified as shown in Figure 6A. In the first regime, the conversion followed a linear increase with increase of the catalyst mass up to 26.5 mg (Substrate/metal molar ratio of 2000:1), which indicates the reaction is not mass-transport limited. In the second regime, it is evident the presence of external diffusion limitations since the conversion did not follow a linear increase with mass of catalyst. Turnover frequency (TOF) remained constant (Figure 6B) indicating that in this range the reaction is kinetically limited. Increasing the catalyst mass above 26.5 mg, a decrease in TOF was observed, indicating that diffusion limitations were present. Therefore, a catalyst mass of 26.5 mg was used as the chosen experimental value in the following experiments.
We then investigated the effect of stirring rate, which varied in the range of 500 to 900 rpm at 30 °C and using substrate/metal molar ratio of 2000. The stirring rate is another parameter that can influence the presence of mass transfer limitations and to ensure perfect mixing and to avoid segregation of both fluid and solid catalyst. In the absence of external mass transfer limitations, the conversion or TOF should be independent of the catalyst mass. Increasing the stirring rate increased the reaction rate since the contact and collision between the reactant and the solid catalyst is higher (Figure 7). Increasing the stirring from 500 rpm (TOF 123 h−1 for PdIMP/CNF and TOF 500 h−1 for PdSI/CNF) to 750 rpm (TOF 572 h−1 for PdIMP/CNF and TOF 979 h−1 for PdSI/CNF), a substantial increment was observed in TOF indicating that the reaction is under diffusion regime. Above 750 rpm, the TOF increased slightly suggesting that the stirrer rate has a minor effect, hence the reaction is kinetically limited by eliminating external mass transfer limitations. 750 rpm was selected as the optimised value for the following studies.
We further studied the effect of temperature on the formic acid decomposition in the range 30 to 60 °C. Formic acid conversion was improved with increase of temperature as expected [52,53,55]. Further increase of the temperature was not investigated since mild conditions are necessary to operate fuel cells in portable devices and as previously reported, CO is evolved above 50 °C [15]. As presented before, at 30 °C, 15 and 11 ppm of CO were released for PdIMP/CNF and PdSI/CNF respectively, however, for PdSI/CNF catalyst, when increasing the temperature, as expected, CO concentration increased: at 40 °C, 29 ppm were released and at 70 °C, it remarkably increased to 876 ppm. Apparent activation energy (Eaapp) for H2 generation from formic acid decomposition was calculated by the slope of the Arrhenius plot (Figure 8) with a value of 27.5 kJ mol−1 and 26.2 kJ mol−1 for PdIMP/CNF and PdSI/CNF, respectively. In Table 4, a comparison of activation energy obtained in this investigation and those previously reported are shown.
The effect of formic acid concentration was investigated in order to determine the kinetic order of the reaction (Figure 9). A concentration range of formic acid from 0.1 M to 1 M was selected. As explained in the introduction, representing rate versus concentration, and fitting to the power-law equation model, a reaction order of 0.3 and 0.31 for PdIMP/CNF and PdSI/CNF, respectively, were obtained. In summary, at the optimised reaction conditions of substrate/metal molar ratio of 2000:1 and 750 rpm, 30 °C, and a formic acid concentration of 0.5 M, initial TOFs (based on TOF calculated on total mol of metal) of 572 h−1 for PdIMP/CNF and 979 h−1 for PdSI/CNF were obtained showing high catalytic activities and promising result for Pd supported nanoparticles on functionalised carbon nanofibers (Table 4).

4. Conclusions

Monometallic Pd nanoparticles supported on carbon nanofibers (CNFs) were synthesised and the catalytic performance was evaluated for the formic acid decomposition in liquid phase as model hydrogen storage chemical for the production of hydrogen under mild conditions. Sol-immobilisation and impregnation techniques were selected as model preparation methods for the synthesis and deposition of Pd nanoparticles.
The catalyst prepared by sol-immobilisation method exhibited higher catalytic activity when compared with the catalyst prepared by impregnation method due to the higher metal surface content, higher percentage of Pd0 and smaller Pd particle size. Sol-immobilisation technique tends to distribute Pd metal nanoparticles more on the surface of the nanofibers whereas, impregnation method leads to a higher degree of filling Pd nanoparticles within the inner walls of the nanofibers besides the distribution on the outer surface. As shown in XPS analysis, PVA ligand inhibits the oxidation of the Pd surface leading to a higher percentage of Pd0. Analysis by TEM showed a smaller Pd particle size for the samples prepared by sol-immobilisation. The observed different degree of surface graphitisation of the studied supports could play an important role in terms of catalyst activity and the increment in catalytic activity for the carbon nanofibers supported catalysts could be addressed to the observed surface modification. The aforementioned parameters could be the major reasons for the improved catalytic activity observed.
A TOF of 979 h−1 was produced by PdSI/CNF, the most active catalyst, with high selectivity (>99.99%) at low reaction temperature (30 °C). In future studies, we will focus on long-term catalytic performance on continuous flow processes.

Supplementary Materials

The following are available online at https://www.mdpi.com/2311-5629/4/2/26/s1, Figure S1: XRD pattern of the CNF support, Figure S2: (A) SEM image of PdIMP/CNF; (B) SEM image of PdSI/AC; (C) Mapping-EDX images of PdIMP/CNF (D) Mapping-EDX images of PdSI/AC, Figure S3: XPS spectra of: (a) PdIMP/CNF; (b) PdSI/CNF; and (c) PdSI/AC in the binding energy region of 281–295 eV corresponding to C1s, Table S1: Atomic content of sp2 and sp3 carbon and ratio sp2/sp3 from XPS for the catalysts subjected to different temperature treatments, Table S2: BET surface areas for the as-synthesised catalysts and supports. Calculation of the number of surface exposed atoms and TOF based on the surface atoms.

Author Contributions

Felipe Sanchez performed the catalytic tests, characterization, analysis, interpretation of the data and finally contributed to the writing of the article. Davide Motta performed XPS of PdSI/AC. Ludovica Bocelli performed the catalytic tests with PdSI/AC. Alberto Villa synthesised the catalysts and contributed to the writing and editing of the article. Nikolaos Dimitratos designed the experiments and contributed to the writing and editing of the article. Stefania Albonetti, Alberto Roldan and Ceri Hammond were involved in the writing and editing the manuscript.

Acknowledgments

The authors would like to thank the Engineering and Physical Sciences Research Council EPSRC for the financial support. The authors acknowledge Cardiff University for providing EM and XPS facilities. Felipe Sanchez thanks Cardiff University for the PhD studentship. Davide Motta wishes to thank the EPSRC Catalysis CDT (EP/L016443/1) for the PhD scholarship. Ceri Hammond is grateful to The Royal Society for provision of a University Research Fellowship (UF140207) and additional research grant funding (CH140207). Ludovica Bocelli thanks the Erasmus Programme Agreement between Bologna and Cardiff Universities. All data created during this research is openly available from the University of Cardiff Research Portal. Information about the data underpinning the results here, included how to access them, can be found in the Cardiff University data catalogue: http://doi.org/10.17035/d.2018.0043025579.

Conflicts of Interest

The authors declare no conflict of interest.

References

  1. Veziroǧlu, T.N.; Şahin, S. 21st Century’s energy: Hydrogen energy system. Energy Convers. Manag. 2008, 49, 1820–1831. [Google Scholar] [CrossRef]
  2. Yang, Z.; Xia, Y.; Mokaya, R. Enhanced hydrogen storage capacity of high surface area zeolite-like carbon materials. J. Am. Chem. Soc. 2007, 129, 1673–1679. [Google Scholar] [CrossRef] [PubMed]
  3. Dai, H.; Xia, B.; Wen, L.; Du, C.; Su, J.; Luo, W.; Cheng, G. Synergistic catalysis of AgPd@ZIF-8 on dehydrogenation of formic acid. Appl. Catal. B Environ. 2015, 165, 57–62. [Google Scholar] [CrossRef]
  4. Bae, D.; Park, H.; Kim, J.S.; Lee, J.B.; Kwon, O.Y.; Kim, K.Y.; Song, M.K.; No, K.T. Hydrogen adsorption in organic ion-exchanged zeolites. J. Phys. Chem. Solids 2008, 69, 1152–1154. [Google Scholar] [CrossRef]
  5. Veluswamy, H.P.; Kumar, R.; Linga, P. Hydrogen storage in clathrate hydrates: Current state of the art and future directions. Appl. Energy 2014, 122, 112–132. [Google Scholar] [CrossRef]
  6. Germain, J.; Fréchet, J.M.J.; Svec, F. Hypercrosslinked polyanilines with nanoporous structure and high surface area: Potential adsorbents for hydrogen storage. J. Mater. Chem. 2007, 17, 4989–4997. [Google Scholar] [CrossRef]
  7. Li, J.; Zhu, Q.-L.; Xu, Q. Highly active AuCo alloy nanoparticles encapsulated in the pores of metal-organic frameworks for hydrolytic dehydrogenation of ammonia borane. Catal. Sci. Technol. 2015, 5, 525–530. [Google Scholar] [CrossRef]
  8. Shen, J.; Yang, L.; Hu, K.; Luo, W.; Cheng, G. Rh nanoparticles supported on graphene as efficient catalyst for hydrolytic dehydrogenation of amine boranes for chemical hydrogen storage. Int. J. Hydrogen Energy 2015, 40, 1062–1070. [Google Scholar] [CrossRef]
  9. Manna, J.; Roy, B.; Sharma, P. Efficient hydrogen generation from sodium borohydride hydrolysis using silica sulfuric acid catalyst. J. Power Sources 2015, 275, 727–733. [Google Scholar] [CrossRef]
  10. Demirci, U.B.; Miele, P. Chemical hydrogen storage: “material” gravimetric capacity versus“system” gravimetric capacity. Energy Environ. Sci. 2011, 4, 3334–3341. [Google Scholar] [CrossRef]
  11. Rodríguez-Lugo, R.E.; Trincado, M.; Vogt, M.; Tewes, F.; Santiso-Quinones, G.; Grützmacher, H. A homogeneous transition metal complex for clean hydrogen production from methanol–water mixtures. Nat. Chem. 2013, 5, 342–347. [Google Scholar] [CrossRef] [PubMed]
  12. Zheng, M.; Cheng, R.; Chen, X.; Li, N.; Li, L.; Wang, X.; Zhang, T. A novel approach for CO-free H2 production via catalytic decomposition of hydrazine. Int. J. Hydrogen Energy 2005, 30, 1081–1089. [Google Scholar] [CrossRef]
  13. Metin, Ö.; Sun, X.; Sun, S. Monodisperse gold-palladium alloy nanoparticles and their composition-controlled catalysis in formic acid dehydrogenation under mild conditions. Nanoscale 2013, 5, 910–912. [Google Scholar] [CrossRef] [PubMed]
  14. Zhu, Q.-L.; Xu, Q. Liquid organic and inorganic chemical hydrides for high-capacity hydrogen storage. Energy Environ. Sci. 2015, 8, 478–512. [Google Scholar] [CrossRef]
  15. Tedsree, K.; Li, T.; Jones, S.; Chan, C.W.A.; Yu, K.M.K.; Bagot, P.A.J.; Marquis, E.A.; Smith, G.D.W.; Tsang, S.C.E. Hydrogen production from formic acid decomposition at room temperature using a Ag-Pd core-shell nanocatalyst. Nat. Nanotechnol. 2011, 6, 302–307. [Google Scholar] [CrossRef] [PubMed]
  16. Ojeda, M.; Iglesia, E. Formic acid dehydrogenation on au-based catalysts at near-ambient temperatures. Angew. Chem. Int. Ed. 2009, 48, 4800–4803. [Google Scholar] [CrossRef] [PubMed]
  17. Zhou, X.; Huang, Y.; Xing, W.; Liu, C.; Liao, J.; Lu, T. High-quality hydrogen from the catalyzed decomposition of formic acid by Pd-Au/C and Pd-Ag/C. Chem. Commun. 2008, 3540–3542. [Google Scholar] [CrossRef] [PubMed]
  18. Yang, L.; Hua, X.; Su, J.; Luo, W.; Chen, S.; Cheng, G. Highly efficient hydrogen generation from formic acid-sodium formate over monodisperse AgPd nanoparticles at room temperature. Appl. Catal. B Environ. 2015, 168–169, 423–428. [Google Scholar] [CrossRef]
  19. Lv, Q.; Feng, L.; Hu, C.; Liu, C.; Xing, W.; Wang, H.; Liu, Y.; Li, M.; Huang, H.; Xu, H.M.; et al. High-quality hydrogen generated from formic acid triggered by in situ prepared Pd/C catalyst for fuel cells. Catal. Sci. Technol. 2015, 5, 2581–2584. [Google Scholar] [CrossRef]
  20. Wang, X.; Qi, G.W.; Tan, C.H.; Li, Y.P.; Guo, J.; Pang, X.J.; Zhang, S.Y. Pd/C nanocatalyst with high turnover frequency for hydrogen generation from the formic acid-formate mixtures. Int. J. Hydrogen Energy 2014, 39, 837–843. [Google Scholar] [CrossRef]
  21. Hu, C.; Pulleri, J.K.; Ting, S.W.; Chan, K.Y. Activity of Pd/C for hydrogen generation in aqueous formic acid solution. Int. J. Hydrogen Energy 2014, 39, 381–390. [Google Scholar] [CrossRef]
  22. Navlani-García, M.; Martis, M.; Lozano-Castelló, D.; Cazorla-Amorós, D.; Mori, K.; Yamashita, H. Investigation of Pd nanoparticles supported on zeolites for hydrogen production from formic acid dehydrogenation. Catal. Sci. Technol. 2015, 5, 364–371. [Google Scholar] [CrossRef] [Green Version]
  23. Mori, K.; Dojo, M.; Yamashita, H. Pd and Pd − Ag Nanoparticles within a Macroreticular Basic Resin: An Effi cient Catalyst for Hydrogen Production from Formic Acid Decomposition. ACS Catal. 2013, 3, 1114–1119. [Google Scholar] [CrossRef]
  24. Sponholz, P.; Mellmann, D.; Junge, H.; Beller, M. Towards a practical setup for hydrogen production from formic acid. ChemSusChem 2013, 6, 1172–1176. [Google Scholar] [CrossRef] [PubMed]
  25. Dai, H.; Cao, N.; Yang, L.; Su, J.; Luo, W.; Cheng, G. AgPd nanoparticles supported on MIL-101 as high performance catalysts for catalytic dehydrogenation of formic acid. J. Mater. Chem. A 2014, 2, 11060–11064. [Google Scholar] [CrossRef]
  26. Gao, S.-T.; Liu, W.; Feng, C.; Shang, N.-Z.; Wang, C. A Ag–Pd alloy supported on an amine-functionalized UiO-66 as an efficient synergetic catalyst for the dehydrogenation of formic acid at room temperature. Catal. Sci. Technol. 2016, 6, 869–874. [Google Scholar] [CrossRef]
  27. Villa, A.; Wang, D.; Dimitratos, N.; Su, D.; Trevisan, V.; Prati, L. Pd on carbon nanotubes for liquid phase alcohol oxidation. Catal. Today 2010, 150, 8–15. [Google Scholar] [CrossRef]
  28. Villa, A.; Wang, D.; Spontoni, P.; Arrigo, R.; Su, D.; Prati, L. Nitrogen functionalized carbon nanostructures supported Pd and Au-Pd NPs as catalyst for alcohols oxidation. Catal. Today 2010, 157, 89–93. [Google Scholar] [CrossRef]
  29. Chinthaginjala, J.K.; Villa, A.; Su, D.S.; Mojet, B.L.; Lefferts, L. Nitrite reduction over Pd supported CNFs: Metal particle size effect on selectivity. Catal. Today 2012, 183. [Google Scholar] [CrossRef]
  30. Li, P.; Huang, Y.L.; Chen, D.; Zhu, J.; Zhao, T.J.; Zhou, X.G. CNFs-supported Pt catalyst for hydrogen evolution from decalin. Catal. Commun. 2009, 10, 815–818. [Google Scholar] [CrossRef]
  31. Lazaro, M.P.; Garcia-Bordeje, E.; Sebastian, D.; Lazaro, M.J.; Moliner, R. In situ hydrogen generation from cycloalkanes using a Pt/CNF catalyst. Catal. Today 2008, 138, 203–209. [Google Scholar] [CrossRef]
  32. Corma, A.; Garcia, H.; Leyva, A. Catalytic activity of palladium supported on single wall carbon nanotubes compared to palladium supported on activated carbon: Study of the Heck and Suzuki couplings, aerobic alcohol oxidation and selective hydrogenation. J. Mol. Catal. A Chem. 2005, 230, 97–105. [Google Scholar] [CrossRef]
  33. Karousis, N.; Tsotsou, G.-E.; Evangelista, F.; Rudolf, P.; Ragoussis, N.; Tagmatarchis, N. Carbon Nanotubes Decorated with Palladium Nanoparticles: Synthesis, Characterization, and Catalytic Activity. J. Phys. Chem. C 2008, 112, 13463–13469. [Google Scholar] [CrossRef]
  34. Baek, J.B.; Lyons, C.B.; Tan, L.S. Grafting of vapor-grown carbon nanofibers via in-situ polycondensation of 3-Phenoxybenzoic acid in poly(phosphoric acid). Macromolecules 2004, 37, 8278–8285. [Google Scholar] [CrossRef]
  35. Patton, R.D.; Pittman, C.U.; Wang, L.; Hill, J.R. Vapor grown carbon fiber composites with epoxy and poly(phenylene sulfide) matrices. Compos. Part A Appl. Sci. Manuf. 1999, 30, 1081–1091. [Google Scholar] [CrossRef]
  36. Finegan, I.C.; Tibbetts, G.G.; Glasgow, D.G.; Ting, J.-M.; Lake, M.L. Surface treatments for improving the mechanical properties of carbon nanofiber/thermoplastic. J. Mater. Sci. 2003, 38, 3485–3490. [Google Scholar] [CrossRef]
  37. Zacharska, M.; Bulusheva, L.G.; Lisitsyn, A.S.; Beloshapkin, S.; Guo, Y.; Chuvilin, A.L.; Shlyakhova, E.V.; Podyacheva, O.Y.; Leahy, J.J.; Okotrub, A.V.; et al. Factors Influencing the Performance of Pd/C Catalysts in the Green Production of Hydrogen from Formic Acid. ChemSusChem 2017, 10, 720–730. [Google Scholar] [CrossRef] [PubMed]
  38. Tessonnier, J.-P.; Rosenthal, D.; Hansen, T.W.; Hess, C.; Schuster, M.E.; Blume, R.; Girgsdies, F.; Pfänder, N.; Timpe, O.; Su, D.S.; et al. Analysis of the structure and chemical properties of some commercial carbon nanostructures. Carbon N. Y. 2009, 47, 1779–1798. [Google Scholar] [CrossRef]
  39. Pyrograf Products Inc. Available online: http://pyrografproducts.com/nanofiber.html (accessed on 16 January 2018).
  40. Huang, C.J.; Pan, F.M.; Tzeng, T.C.; Li, C.; Sheu, J.T. Growth and Field Emission of Reactive Sputtered Pd-PdO Core-Shell Nanoflakes on Platinum. J. Electrochem. Soc. 2009, 156, J28–J31. [Google Scholar] [CrossRef]
  41. Wang, Z.-L.; Yan, J.-M.; Wang, H.-L.; Ping, Y.; Jiang, Q. Pd/C Synthesized with Citric Acid: An Efficient Catalyst for Hydrogen Generation from Formic Acid/Sodium Formate. Sci. Rep. 2012, 2, 598–604. [Google Scholar] [CrossRef] [PubMed]
  42. Militello, M.C.; Simko, S.J. Elemental Palladium by XPS. Surf. Sci. Spectra 1994, 3, 387–394. [Google Scholar] [CrossRef]
  43. Militello, M.C. Palladium Oxide (PdO) by XPS. Surf. Sci. Spectra 1994, 3, 395. [Google Scholar] [CrossRef]
  44. Pattamakomsan, K.; Suriye, K.; Dokjampa, S.; Mongkolsiri, N. Effect of mixed Al2O3 structure between h-and a-Al2O3 on the properties of Pd/Al2O3 in the selective hydrogenation of 1,3-butadiene. Catal. Commun. 2010, 11, 311–316. [Google Scholar] [CrossRef]
  45. Lara, L.R.S.; Zottis, A.D.; Elias, W.C.; Faggion, D.; de Campos, C.E.M.; Acuña, J.J.S.; Domingos, J.B. The catalytic evaluation of in situ grown Pd nanoparticles on the surface of Fe3O4@dextran particles in the p-nitrophenol reduction reaction. RSC Adv. 2015, 5, 8289–8296. [Google Scholar] [CrossRef]
  46. Villa, A.; Wang, D.; Chan-Thaw, C.E.; Campisi, S.; Veith, G.M.; Prati, L. The confinement effect on the activity of Au NPs in polyol oxidation. Catal. Sci. Technol. 2016, 6, 598–601. [Google Scholar] [CrossRef]
  47. Sánchez, F.; Motta, D.; Roldan, A.; Hammond, C.; Villa, A.; Dimitratos, N. Hydrogen generation from additive-free formic acid decomposition under mild conditions by Pd/C: Experimental and DFT studies. Top. Catal. 2018, 61, 254–266. [Google Scholar] [CrossRef]
  48. Li, S.J.; Zhou, X.; Tian, W.Q. Theoretical mechanism investigations on the HCOOH catalyzed by Pd cluster. J. Phys. Chem. A 2012, 116, 11745–11752. [Google Scholar] [CrossRef] [PubMed]
  49. Wang, N.; Sun, Q.; Bai, R.; Li, X.; Guo, G.; Yu, J. In Situ Confinement of Ultrasmall Pd Clusters within Nanosized Silicalite-1 Zeolite for Highly Efficient Catalysis of Hydrogen Generation. J. Am. Chem. Soc. 2016, 138, 7484–7487. [Google Scholar] [CrossRef] [PubMed]
  50. Liu, D.; Gao, Z.Y.; Wang, X.C.; Zeng, J.; Li, Y.M. DFT study of hydrogen production from formic acid decomposition on Pd-Au alloy nanoclusters. Appl. Surf. Sci. 2017, 426, 194–205. [Google Scholar] [CrossRef]
  51. Bulushev, D.A.; Bulusheva, L.G.; Beloshapkin, S.; O’Connor, T.; Okotrub, A.V.; Ryan, K.M. Pd clusters supported on amorphous, low-porosity carbon spheres for hydrogen production from formic acid. ACS Appl. Mater. Interfaces 2015, 7, 8719–8726. [Google Scholar] [CrossRef] [PubMed]
  52. Zhang, S.; Metin, O.; Su, D.; Sun, S. Monodisperse AgPd alloy nanoparticles and their superior catalysis for the dehydrogenation of formic acid. Angew. Chem. Int. Ed. 2013, 52, 3681–3684. [Google Scholar] [CrossRef] [PubMed]
  53. Bulut, A.; Yurderi, M.; Karatas, Y.; Zahmakiran, M.; Kivrak, H.; Gulcan, M.; Kaya, M. Pd-MnOx nanoparticles dispersed on amine-grafted silica: Highly efficient nanocatalyst for hydrogen production from additive-free dehydrogenation of formic acid under mild conditions. Appl. Catal. B Environ. 2015, 164, 324–333. [Google Scholar] [CrossRef]
  54. Ho, S.F.; Mendoza-Garcia, A.; Guo, S.; He, K.; Su, D.; Liu, S.; Metin, O.; Sun, S. A facile route to monodisperse MPd (M = Co or Cu) alloy nanoparticles and their catalysis for electrooxidation of formic acid. Nano Lett. 2012, 12, 1102–1106. [Google Scholar] [CrossRef] [PubMed]
  55. Zhu, Q.-L.; Tsumori, N.; Xu, Q. Sodium hydroxide-assisted growth of uniform Pd nanoparticles on nanoporous carbon MSC-30 for efficient and complete dehydrogenation of formic acid under ambient conditions. Chem. Sci. 2014, 5, 195–199. [Google Scholar] [CrossRef]
Figure 1. X-ray diffraction (XRD) patterns of the catalysts: (a) PdIMP/CNF and (b) PdSI/CNF.
Carbon 04 00026 g001
Figure 2. X-ray photoelectron spectroscopy (XPS) spectra of (a) PdIMP/CNF, (b) PdSI/CNF, and (c) PdSI/AC.
Carbon 04 00026 g002
Figure 3. Bright field transmission electron microscopy (TEM) micrographs and corresponding histograms of the particle size distributions for the catalysts: PdIMP/CNF (A,B); PdSI/CNF (C,D); and PdSI/AC (E,F).
Carbon 04 00026 g003
Figure 4. Bright field HRTEM image of PdSI/CNF.
Carbon 04 00026 g004
Figure 5. Formic acid dehydrogenation reaction on Pd/CNF. Comparison of preparation method. Reaction conditions: 0.5 M HCOOH 26.5 mg of catalyst (Substrate/metal molar ratio: 2000:1); 30 °C; 750 rpm; and 2 h reaction time.
Carbon 04 00026 g005
Figure 6. Effect of catalyst mass on (A) Conversion of formic acid dehydrogenation, (B) TOF. Reaction conditions: 30 °C, 0.5 M HCOOH, 750 rpm, and 2 h reaction time.
Carbon 04 00026 g006
Figure 7. Effect of stirrer rate on TOF. Reaction conditions: 26.5 mg of catalyst (Substrate/metal molar ratio: 2000:1), 30 °C, 0.5 M HCOOH, and 2nd h reaction time.
Carbon 04 00026 g007
Figure 8. Arrhenius plot of 1 wt. % Pd/CNF prepared by sol-immobilisation and impregnation from 30 to 60 °C. Reaction conditions: 26.5 mg of catalyst (Substrate/metal molar ratio: 2000:1), 0.5 M HCOOH, 750 rpm, and 2 h reaction time.
Carbon 04 00026 g008
Figure 9. Effect of concentration of formic acid. Reaction conditions: 26.5 mg of catalyst (Substrate/metal molar ratio: 2000:1), 30 °C, 750 rpm, and 2 h reaction time.
Carbon 04 00026 g009
Table 1. Palladium, Oxygen atomic contents, and Pd oxidation state on the surface from XPS analysis.
Catalyst Pd3d5/2Pd Content (at. %)O Content (at. %)
Pd0Pd2+
PdIMP/CNFBE334.9336.50.250.94
%25.974.1
PdSI/CNFBE335.0336.40.772.72
%61.538.5
PdSI/ACBE335.6337.23.6824.51
%74.225.8
Table 2. Statistical mean and standard deviation of particle size analysis.
CatalystStatistical Median (nm)Standard Deviation
PdIMP/CNF5.40.9
PdSI/CNF3.91.2
PdSI/AC3.70.9
Table 3. Palladium loading from energy dispersive X-ray (EDX) and atomic absorption spectroscopy (AAS) data for the catalysts studied.
CatalystPd Loading (wt. %)
EDXAAS
PdIMP/CNF1.030.99
PdSI/CNF0.910.95
PdSI/AC1.151.10
Table 4. Comparative catalytic activity of various Pd-based catalysts for the liquid-phase formic acid dehydrogenation at mild conditions.
CatalystT (°C)ReagentTOF (h−1)Activation Energy (KJ/mol)Ref.
Initial2 h
PdIMP/CNF30Formic acid (0.5 M)563.2 27.5This work
PdSI/CNF30979.1 26.2
PdSI/AC30240.5
Pd/C21Formic acid (1.33 M)1815 a53.7[21]
304828 a
Pd/C (citric acid)25Formic acid 64 b [41]
Pd/C30Formic acid:Sodium formate 1:9 228.3 [20]
Au41Pd59/C50Formic acid (1 M)230 28 ± 2[13]
Ag@Pd (1:1)35Formic acid 156 c30[15]
50252 c
Ag/Pd alloy (1:1)20144 c
Ag42Pd5850Formic acid (1 M)382 22 ± 1[52]
Pd-MnOx/SiO2-NH220Formic acid (0.265 M)140 61.9[53]
501300
Ag0.1Pd0.9/rGO25Formic acid105 [54]
a TOF calculated after 50 min. b TOF calculated after 160 min. c TOF calculated based on the surface metal sites.

