Carbon Nanostructure Curvature Induced from the Rapid Release of Sulfur upon Laser Heating


The EMS Energy Institute & Department of Energy and Mineral Engineering, The Pennsylvania State University, University Park, PA 16802, USA
*
Author to whom correspondence should be addressed.
C 2018, 4(2), 33; https://doi.org/10.3390/c4020033
Submission received: 8 April 2018
/
Revised: 1 May 2018
/
Accepted: 17 May 2018
/
Published: 22 May 2018
(This article belongs to the Special Issue Transmission Electron Microscopy and Carbon Materials)
Abstract
:Laboratory-generated synthetic soot from benzene and benzene–thiophene was neodymium-doped yttrium aluminum garnet (Nd:YAG) laser and furnace annealed. Furnace annealing of sulfur doped synthetic soot resulted in the formation of micro-cracks due to the high pressures caused by explosive sulfur evolution at elevated temperature. The heteroatom sulfur affected the carbon nanostructure in a different way than oxygen. Sulfur is thermally stable in carbon up to ~1000 °C and thus, played little role in the initial low temperature (500 °C) carbonization. As such, it imparted a relatively unobservable impact on the nanostructure, but rather, acted to cause micro-cracks upon rapid release in the form of H2S and CS2 during subsequent traditional furnace heat treatment. In contrast, Nd:YAG laser heating of the sulfur doped sample acted to induce curvature in the carbon nanostructure. The observed curvature was the result of carbon annealing occurring simultaneously with sulfur evolution due to the rapid heating rate.
1. Introduction
The crystal structure of carbon black heat treated to temperatures in excess of 2000 °C has been known since at least the 1930–1940s, as gleaned from X-Ray diffraction [1,2]. The inherently thin nature of carbon black as well as its well-known crystal structure made it an ideal test specimen for transmission electron microscopy (TEM), with its use dating back to the 1940s [3,4]. The development of high resolution TEM in the late 1960s and early 1970s made direct imaging of the carbon nanostructure structure possible, adding greater understanding than interpretation based solely on diffraction patterns. High resolution is reserved for atomic layer plane resolution that is made possible by phase contrast, an interference pattern of the diffracted and transmitted electron beams, and primary image contrast, which is used to resolve detail below 1 nm. Although TEM is typically thought of as diffraction contrast imaging, phase contrast imaging is involved at lower magnifications as well. In 1968, Heidenreich et al. [5] successful used TEM to resolve the 3.4 Å layer plane spacing of heat treated carbon black and showed the now well-known multifaceted polyhedron structure. The lamellae of carbon black become constrained to join at high angles during heat treatment, forming closed shell polyhedrons. Carbon black, a commercial product, and laboratory synthetized carbon black (synthetic soot) are still useful test specimens today. Recently, carbon black with TEM characterization was used to study the rates and trajectories during the earliest stages of annealing via laser heating [6]. In this study, synthetic soot and sulfur doped synthetic soot are used to access the structural impact imparted on the carbons upon loss of sulfur at traditional heating rates (furnace) and during rapid heating via pulsed laser.
The effect of heteroatoms on carbon structure has mainly been focused on oxygen [7,8,9]. Oxygen is common in many non-graphitizing carbon precursors, such as, polyfurfuryl alcohol, phenolic resins, and sucrose. In 1951, Franklin used XRD to demonstrate that graphitizable carbons approach a d002 spacing of 3.35 Å and non-graphitizable carbons resist layer plane spacing reduction even when heated to 3000 °C [10,11]. Porosity was found in non-graphitizable carbons after carbonization. The porosity and tortuous nanostructure of non-graphitizable carbons is held in place by cross-linking. Cross-linking imparts a random orientation of the carbon lamellae [11,12]. Franklin suggested that cross-linking is favored in the presence of oxygen [11]. Cross-links and their structures remain debated; thus, non-graphitizing behavior is still not adequately explained [13]. The C60 fullerene, discovered in 1985 by Kroto et al. [14], provided a fresh viewpoint regarding carbon nanostructure and non-graphitizing carbons. It has been suggested that odd membered rings are the defects that are responsible for non-graphitizability [13,15,16,17,18]. Harris observed sucrose char after heat treatment to be comprised of fullerene-related nanoparticles [13]. Direct visualization of odd membered ring structures with TEM in chars prior to heat treatment is difficult as the material is amorphous and atomic resolution requires accessible, single, stable layers. Pentagon and heptagon carbon ring structures have been observed in chars after heat treatment with TEM, and micrographs resembling their presence pre-heat treatment have been reported [19,20].
During heat treatment of carbon, oxygen is mainly released in the forms of CO and CO2 and to a lesser extent, H2O and OH, depending on the hydrogen content. The radical left behind from the removal of a carbon atom from a six-member ring plays a role in non-graphitizability. For instance Vander Wal and collaborators have shown that the extent of soot curvature found from benzene-derived soot increases with partial premixing [21,22,23]. Partial oxidation of benzene was predicted to yield cyclopentadiene concentrations sufficient to realize visible curvature in soot nanostructure [21].
The heteroatom, sulfur, affects carbon structure differently than oxygen. Sulfur is thermally stable in carbon at up to ~1000 °C and thus, plays little role at the initial low temperature (500 °C) carbonization, whereas oxygen is released at temperatures as low as 300 °C [24,25]. Thus, oxygen removal impacts carbon at the earliest stages of carbon annealing [26,27]. The structural defects imparted on the carbon from oxygen removal set the stage for the trajectory of lamellae growth upon additional heat treatment, whereas in the case of sulfur, the lamellae are significantly annealed with trajectory set after heat treatment at 1000 °C. As such, sulfur imparts a relatively unobservable impact on the nanostructure, but rather, acts to cause micro-cracks upon release upon subsequent graphitization heat treatment, in the forms of H2S and CS2. The micro-cracks result in an observed volume increase, and therefore, the process has been termed puffing [28,29,30]. This is primarily a problem for the needle coke industry as needle coke is often used as the primary filler in the production of graphite electrodes and micro-cracks, acting to reduce the electrodes’ desired properties [28,29,30]. The added thermal stability of sulfur in carbon versus oxygen is understood by the enthalpy of formation of the leaving species. The ies of formation of CO and CO2 at standard temperature and pressure are −110.5 and −393.5 kJ/mol, respectively [31]. The enthalpy of formation of CS2 is 116.1 kJ/mol and carbon sulfide is not a vehicle for sulfur removal from carbon [32].
2. Materials and Methods
2.1. Synthetic Soot Production
Laboratory-generated synthetic soot samples were produced in a horizontal tube furnace. Carbon precursors were fed into the tube furnace as an aerosol suspended with an argon carrier gas flow. The furnace was operated at 1100 °C. Based on the flow rate and assuming laminar flow, the approximate residence time in the furnace was three seconds. Liquid carbon precursors were introduced to the furnace using a bubbler and argon carrier gas. Synthetic soot was collected at the exit on Whatman filter paper. Benzene and thiophene of 99% purity were used as soot precursors and purchased from Alfa Aesar (Tewksbury, MA, USA). Sulfur free soot was collected by feeding the furnace with pure benzene. Sulfur doped soot was produced by bubbling argon through a 1:1 blend on benzene–thiophene.
2.2. Heat Treatment
2.2.1. Furnace
Samples were heated to 2600 °C at a rate of 25 °C/min and held for 1 h in a Centorr Vacuum Industries (Nashua, NH, USA) series 45 graphitization furnace. The furnace was operated under an argon atmosphere.
2.2.2. Nd:YAG Laser
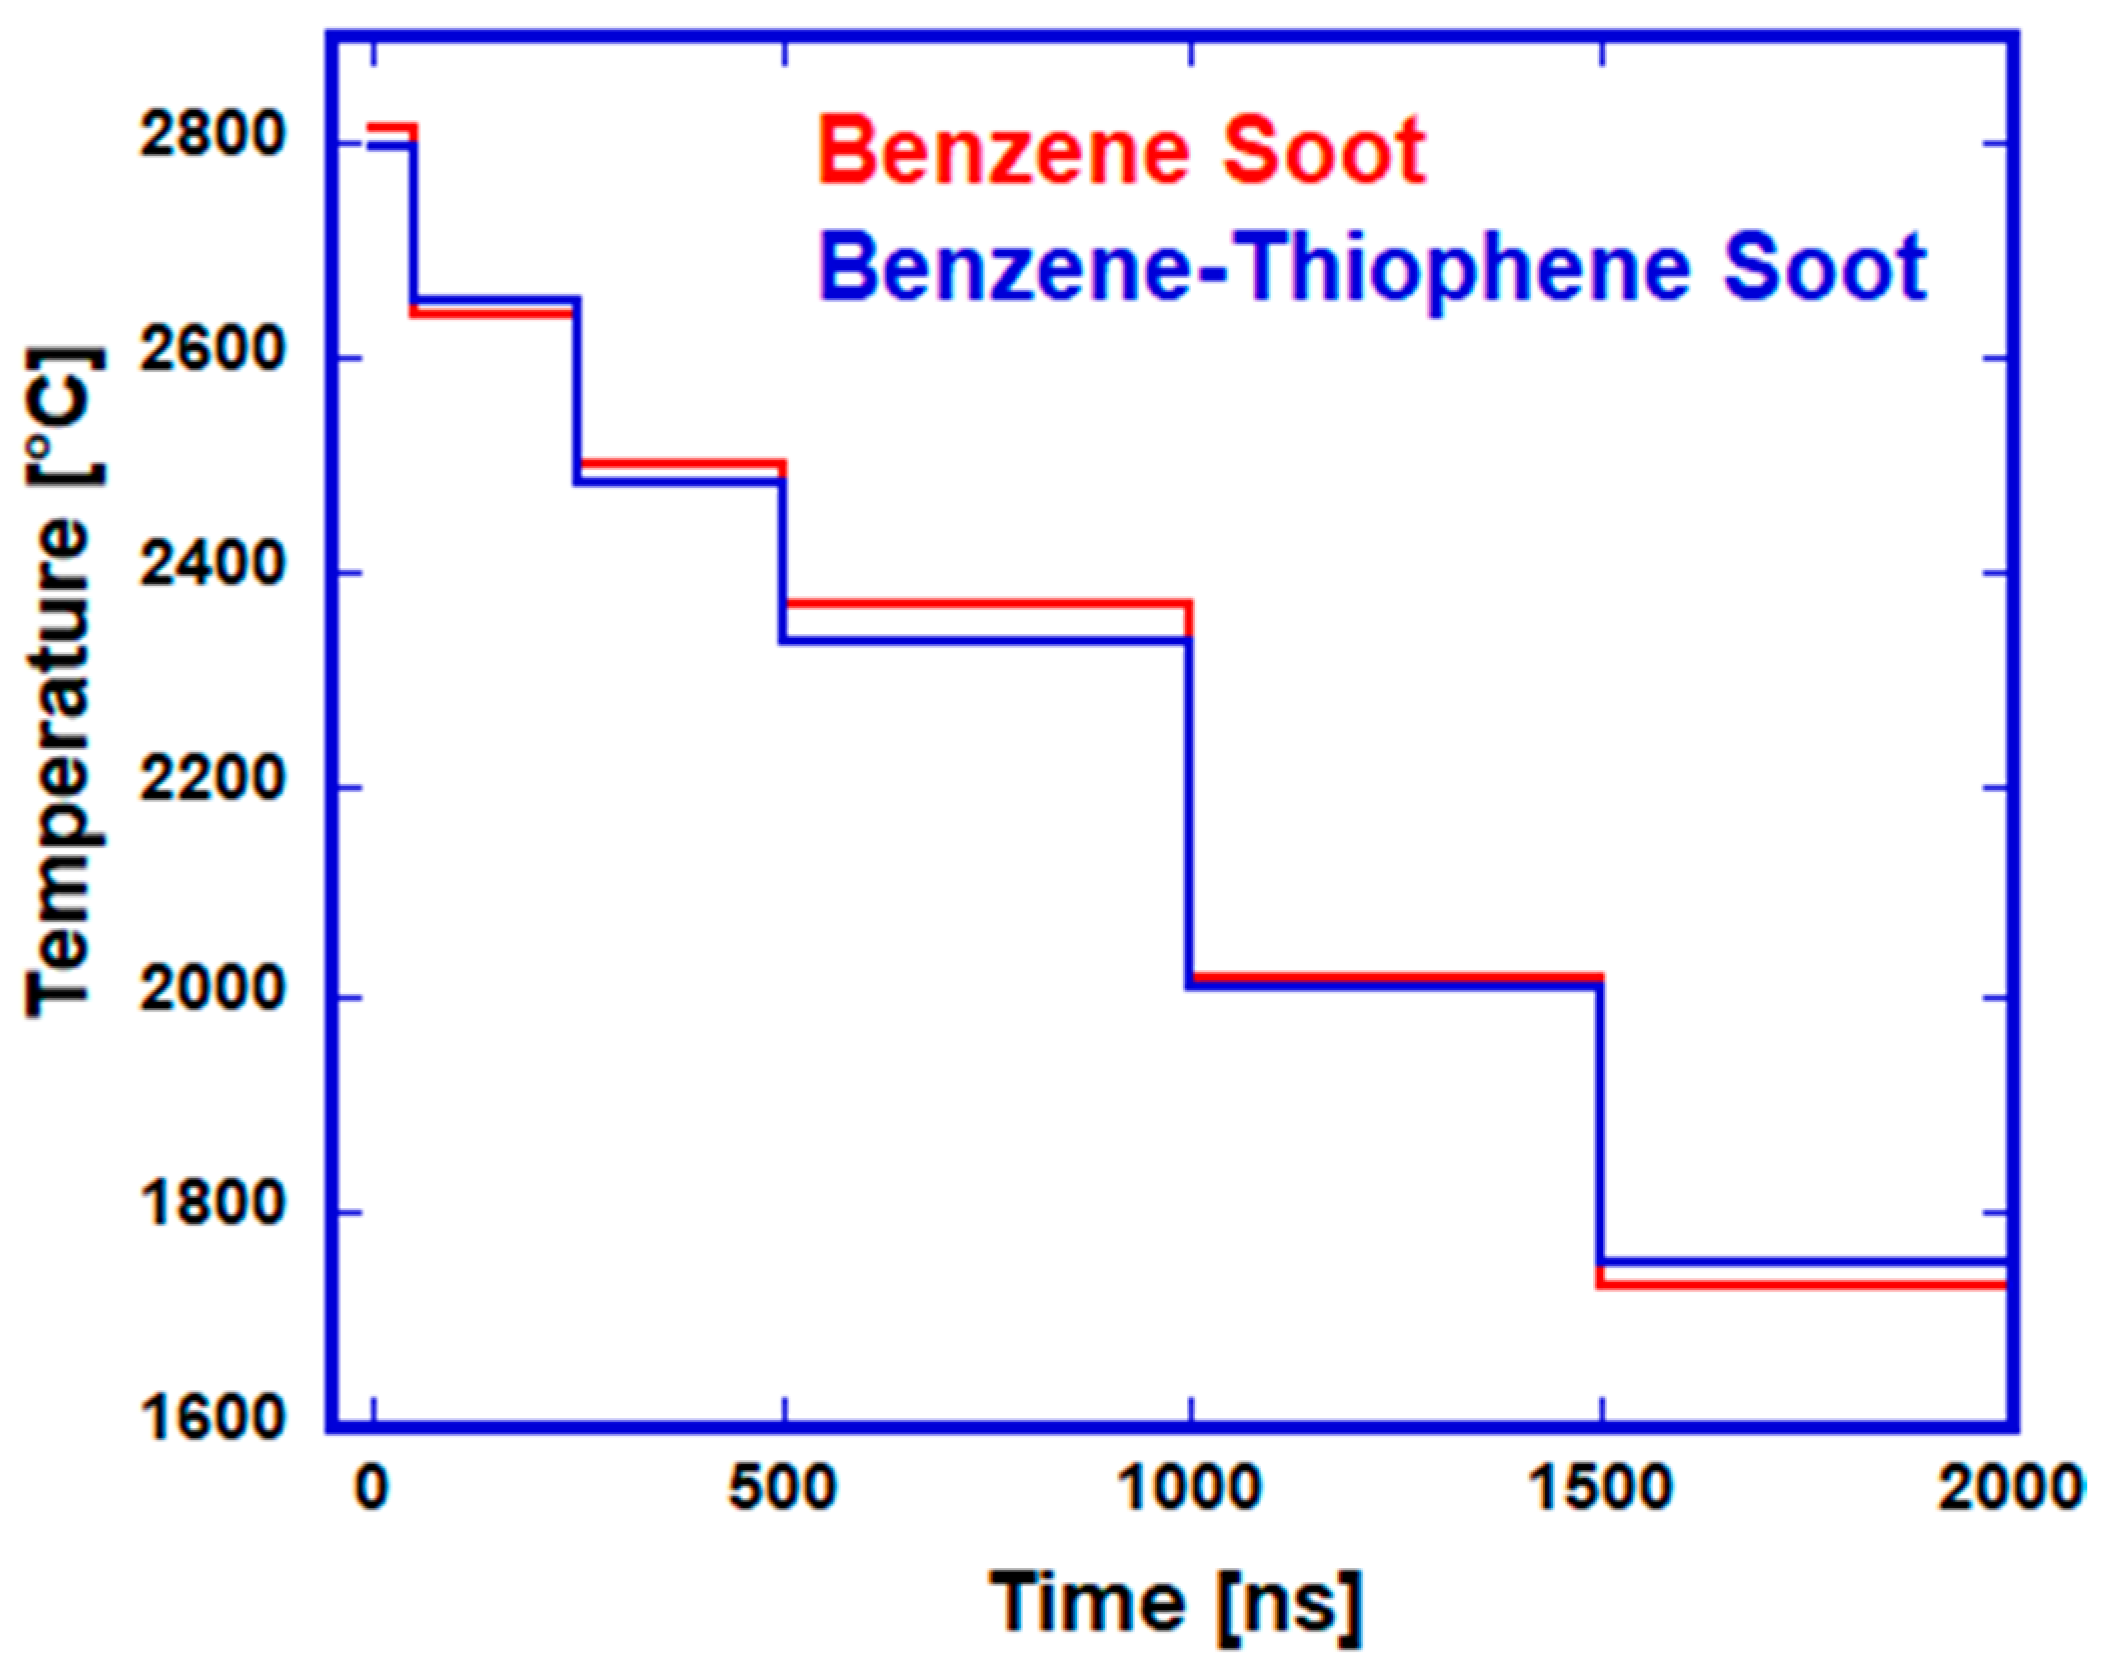
Pulsed laser heating was provided by a Surelite-III neodymium-doped yttrium aluminum garnet (Nd:YAG) laser purchased from Continuum (San Jose, CA, USA). Samples were irradiated with a single pulse of 1064 nm laser light. A laser fluence with an energy per unit area of the beam of 50 mJ/cm2 was used to heat the material directly on lacey carbon TEM grids. Samples were first sonicated in ethanol and drop deposited on TEM grids prior to laser heating. Multi-wavelength pyrometry was used to extract the time-temperature-history (TTH). The Nd:YAG laser setup and laser induced incandescence signal detection used for TTH determination have been reported previously [6]. The TTHs are provided in Figure 1. A peak temperature of ~2800 °C was measured from the integrated average temperature of the first 50 ns of incandescence signal. The 50 ns camera gate width used to collect the peak temperature was synched to the laser pulse and included the initial 8 ns long pulse. Heating occurred during the 8 ns laser pulse; thus, the heating rate was 3.5 × 10¹¹ °C/s. The laser-heated material rapidly cooled to below 1800 °C within 2 µs, at which point the material transformations were frozen in place.
2.3. Characterization
TEM was performed on a FEI Talos instrument operated at 200 keV. The nanostructure (lamellae observed as (002) fringes) was observed in bright field mode before and after heat treatment. Energy dispersive X-ray spectroscopy (EDS) was performed in scanning TEM (STEM) mode for the purpose of elemental analysis. The Talos was equipped with a Super-X EDS system that was comprised of four silicon drift detectors. The use of multiple detectors increases the signal to noise ratio. In STEM mode the region of interest was scanned with a fine probe with a diameter of 1.6 Å. Thus, STEM mode EDS provided a high spatial resolution. The resolution of EDS was limited to a few atomic% due to the background noise generated via Bremsstrahlung braking radiation. Elements lighter than Beryllium with a low fluorescence-yield (Li, He, H) are not detectable with EDS. The hydrogen content was measured using a carbon/hydrogen/nitrogen (CHN) analyzer, manufactured by LECO Corporation (St. Joseph, MI, USA).
3. Results
Sulfur is thermally stable in carbon at up to ~1000 °C and therefore, plays little role in the initial low temperature (500 °C) carbonization. As such, sulfur imparts a relatively unobservable impact on the nanostructure, but rather acts to cause micro-cracks upon rapid evolution in the form of H2S and CS2 upon subsequent graphitization heat treatment. The micro-cracks result in an observed volume increase, and therefore, the process has been termed puffing [28,29,30]. Puffing has been evaluated on the micro- and macro-length scales. Rapid sulfur release (puffing) has not been evaluated at the nanometer scale. The term nanostructure is used here to refer to the graphene layer plane dimensions, their tortuosity and their relative orientation, as observed in the TEM images. Synthetic soot, with and without sulfur doping, were used to assess the impact of sulfur evolution on carbon structure. The defect sites formed upon sulfur release and their effects on the nanostructure are not readily apparent in bulk carbons like cokes [27]. Rearrangements in soot are isolated by primary particles, and thus, changes are readily observable. Soot primary particles possess a semi-separated nature that enables easy observation of material transformation; as such, change is restricted to the primary particles’ interiors.
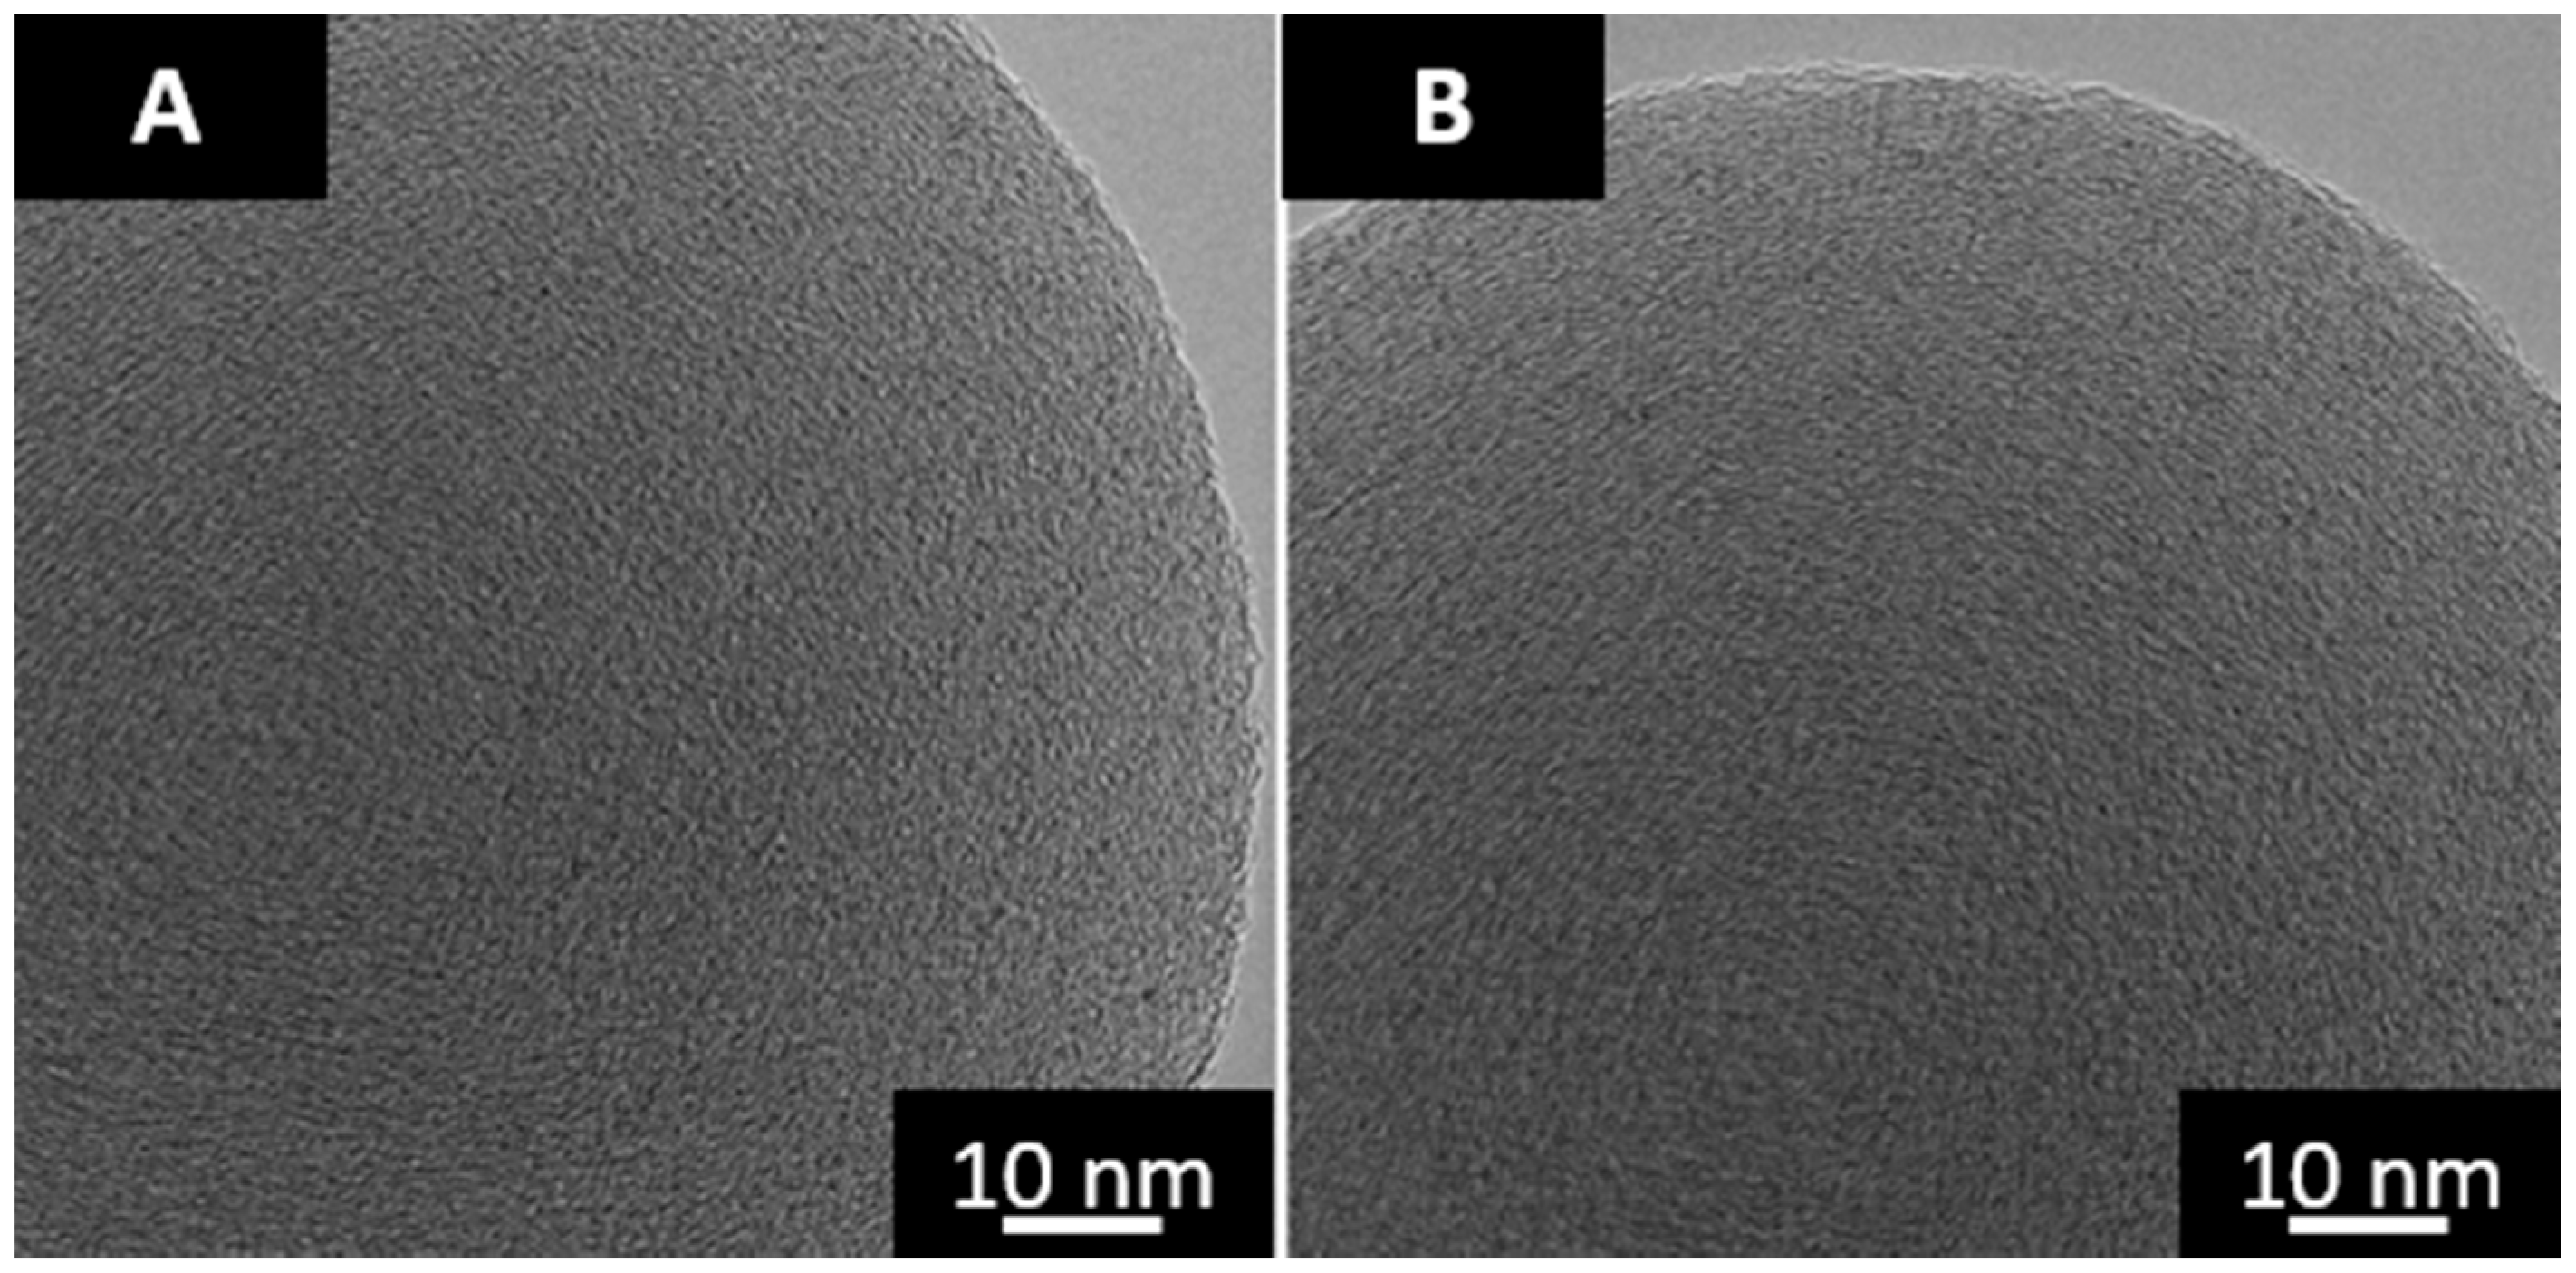
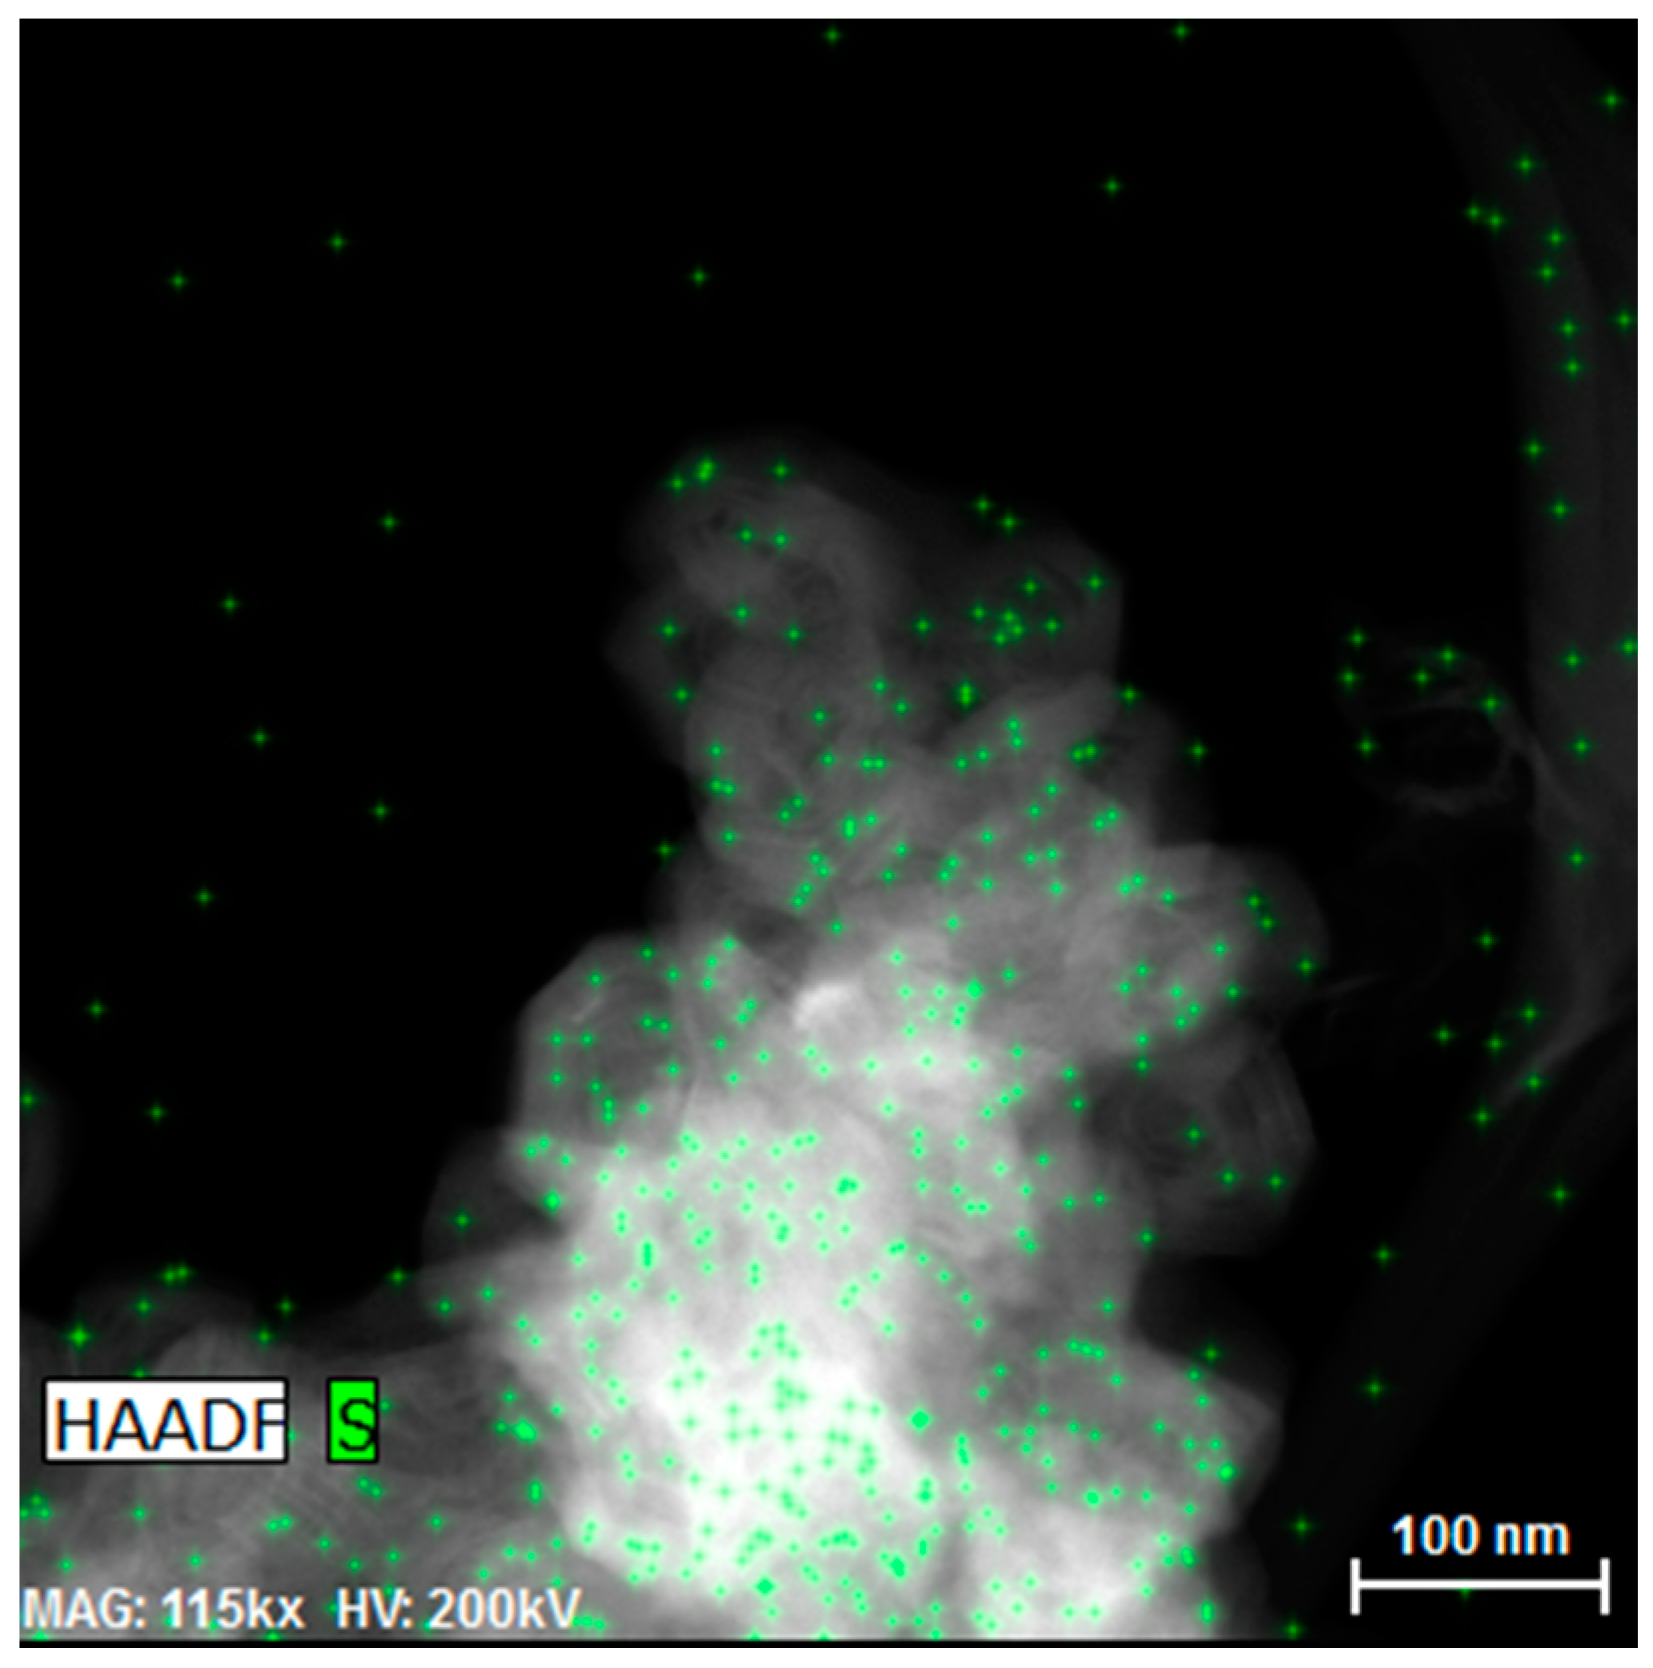
The two nascent (as prepared) materials were visually equivalent, as seen in the TEM micrographs in Figure 2. The initial hydrogen wt % as measured with a CHN analyzer was 1.15 for both materials. The sulfur doping level was measured with EDS and is shown in the EDS map in Figure 3B; a high angle annular dark field (HAADF) image is provided in Figure 3A. As shown in the EDS map, the sulfur was uniformly dispersed throughout the material.
The measured sulfur content was 7.6 wt %. Accounting for the 1.15 wt % hydrogen that is undetectable with EDS, the wt % of sulfur was 7.5.
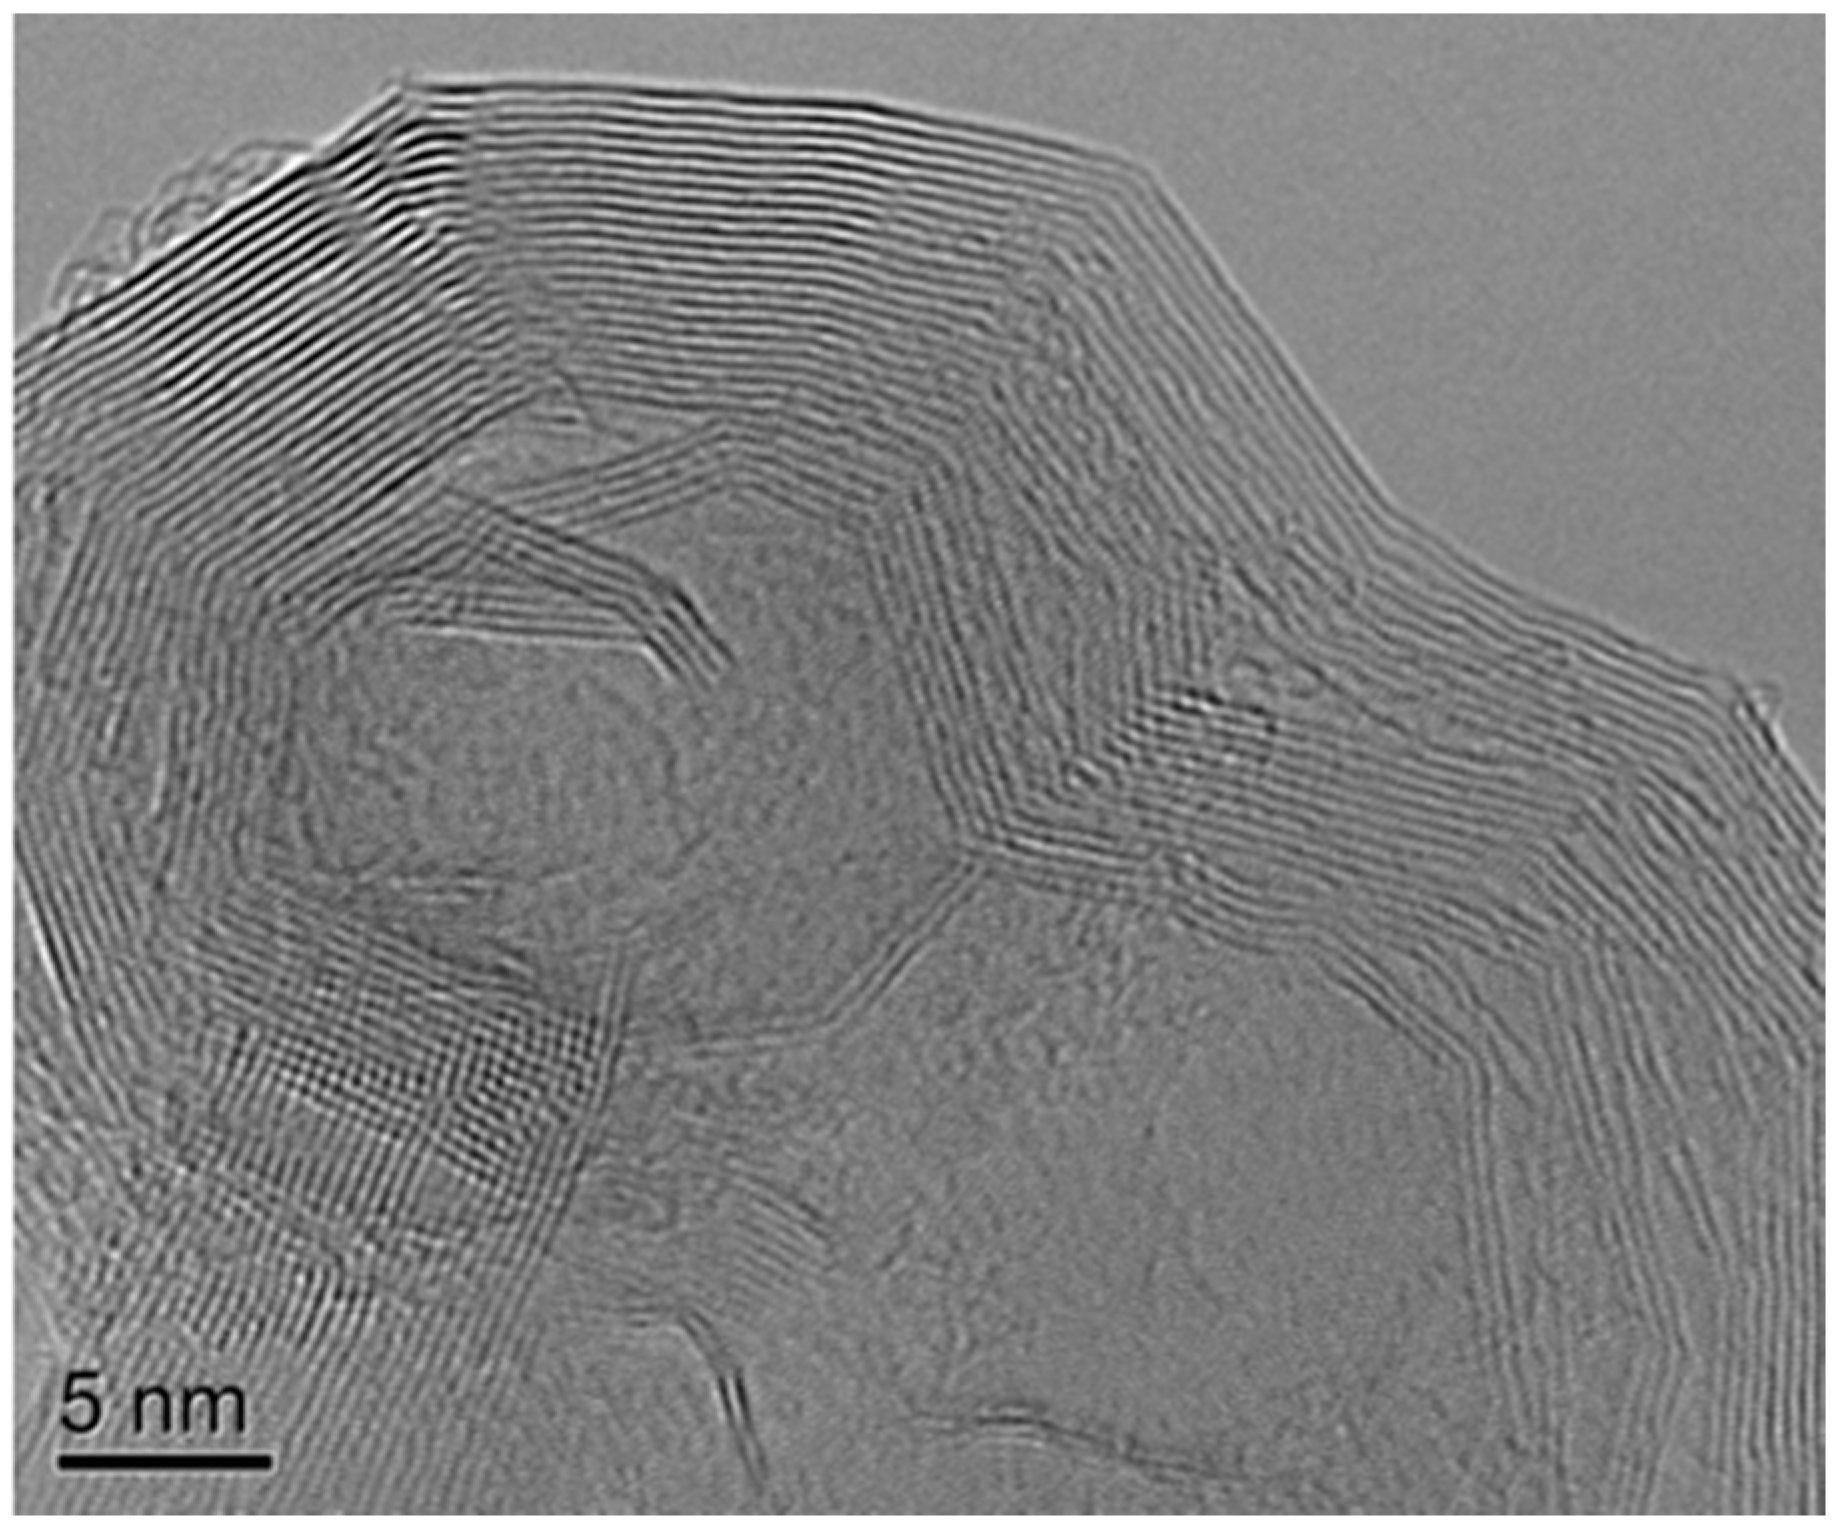
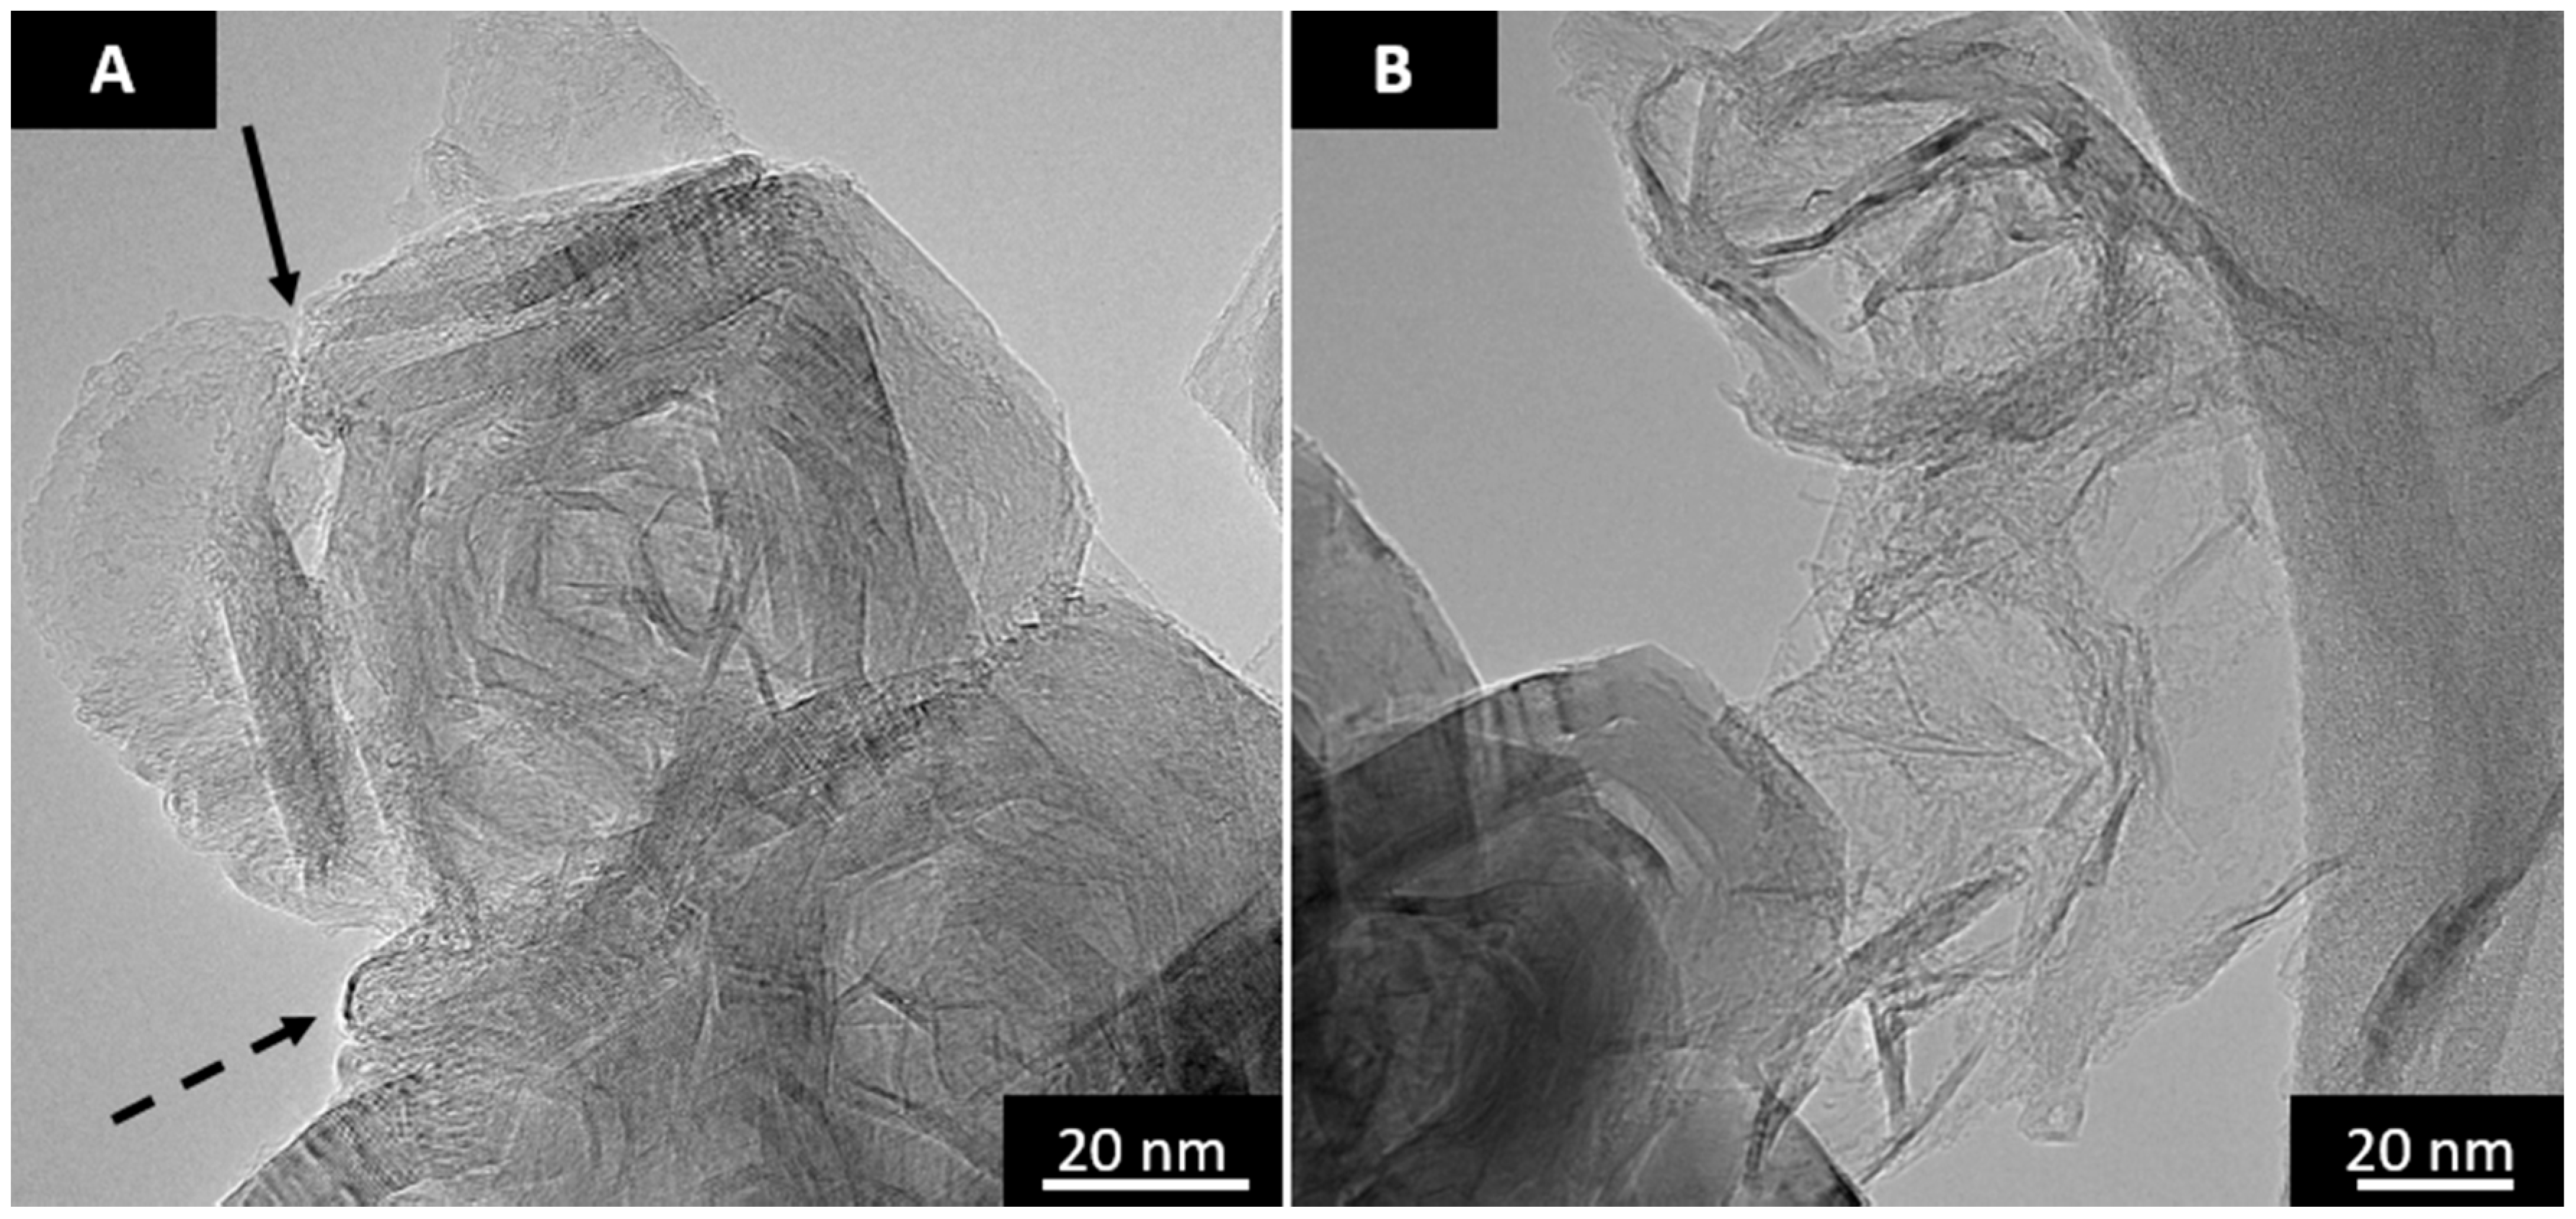
Samples of both materials were annealed with either a single Nd:YAG laser pulse of 50 mJ/cm2 or in a furnace at 2600 °C for a duration of 1 h. A laser fluence of 50 mJ/cm2 was selected because it has been demonstrated that a single pulse at this energy acts to anneal carbon black and does not ablate or vaporize the material [6]. The sulfur evolution during conventional furnace annealing occurred after the carbon had partially annealed. Rapid laser heating resulted in simultaneous annealing and sulfur evolution. The structure of the pure benzene synthetic soot after traditional graphitization heat treatment is the closed shell polyhedral, shown in Figure 4. Furnace annealing of the benzene–thiophene sample resulted in a similar polyhedral structure. However, some (~10%) of the primary particles suffered significant damage from the explosive release of sulfur species, as shown in Figure 5.
The dashed arrow in Figure 5A shows a sulfur gas species exit point that has self-healed and closed. This point may have acted as the sulfur exit point for a few of the neighboring particles and thus, would explain why not all the particles showed obvious damage. The solid arrow in A shows a region where the facets did not rejoin after bursting open under the high pressure induced by the release of sulfur. The micrograph in Figure 5B shows an exploded particle. The result is similar to the micro-crack formation found in coke [27]. The cracks in synthetic soot were manifested in primary particles as the escaping gases must break free from already partially annealed primary particle in order to escape. The sulfur content of the furnace annealed sample was below the EDS detection limit. When the EDS signal is below the noise level, the background noise can be seen in the vacuum, like in Figure 6. This signal mapped to the sample potentially arises from remaining trace sulfur and/or noise.
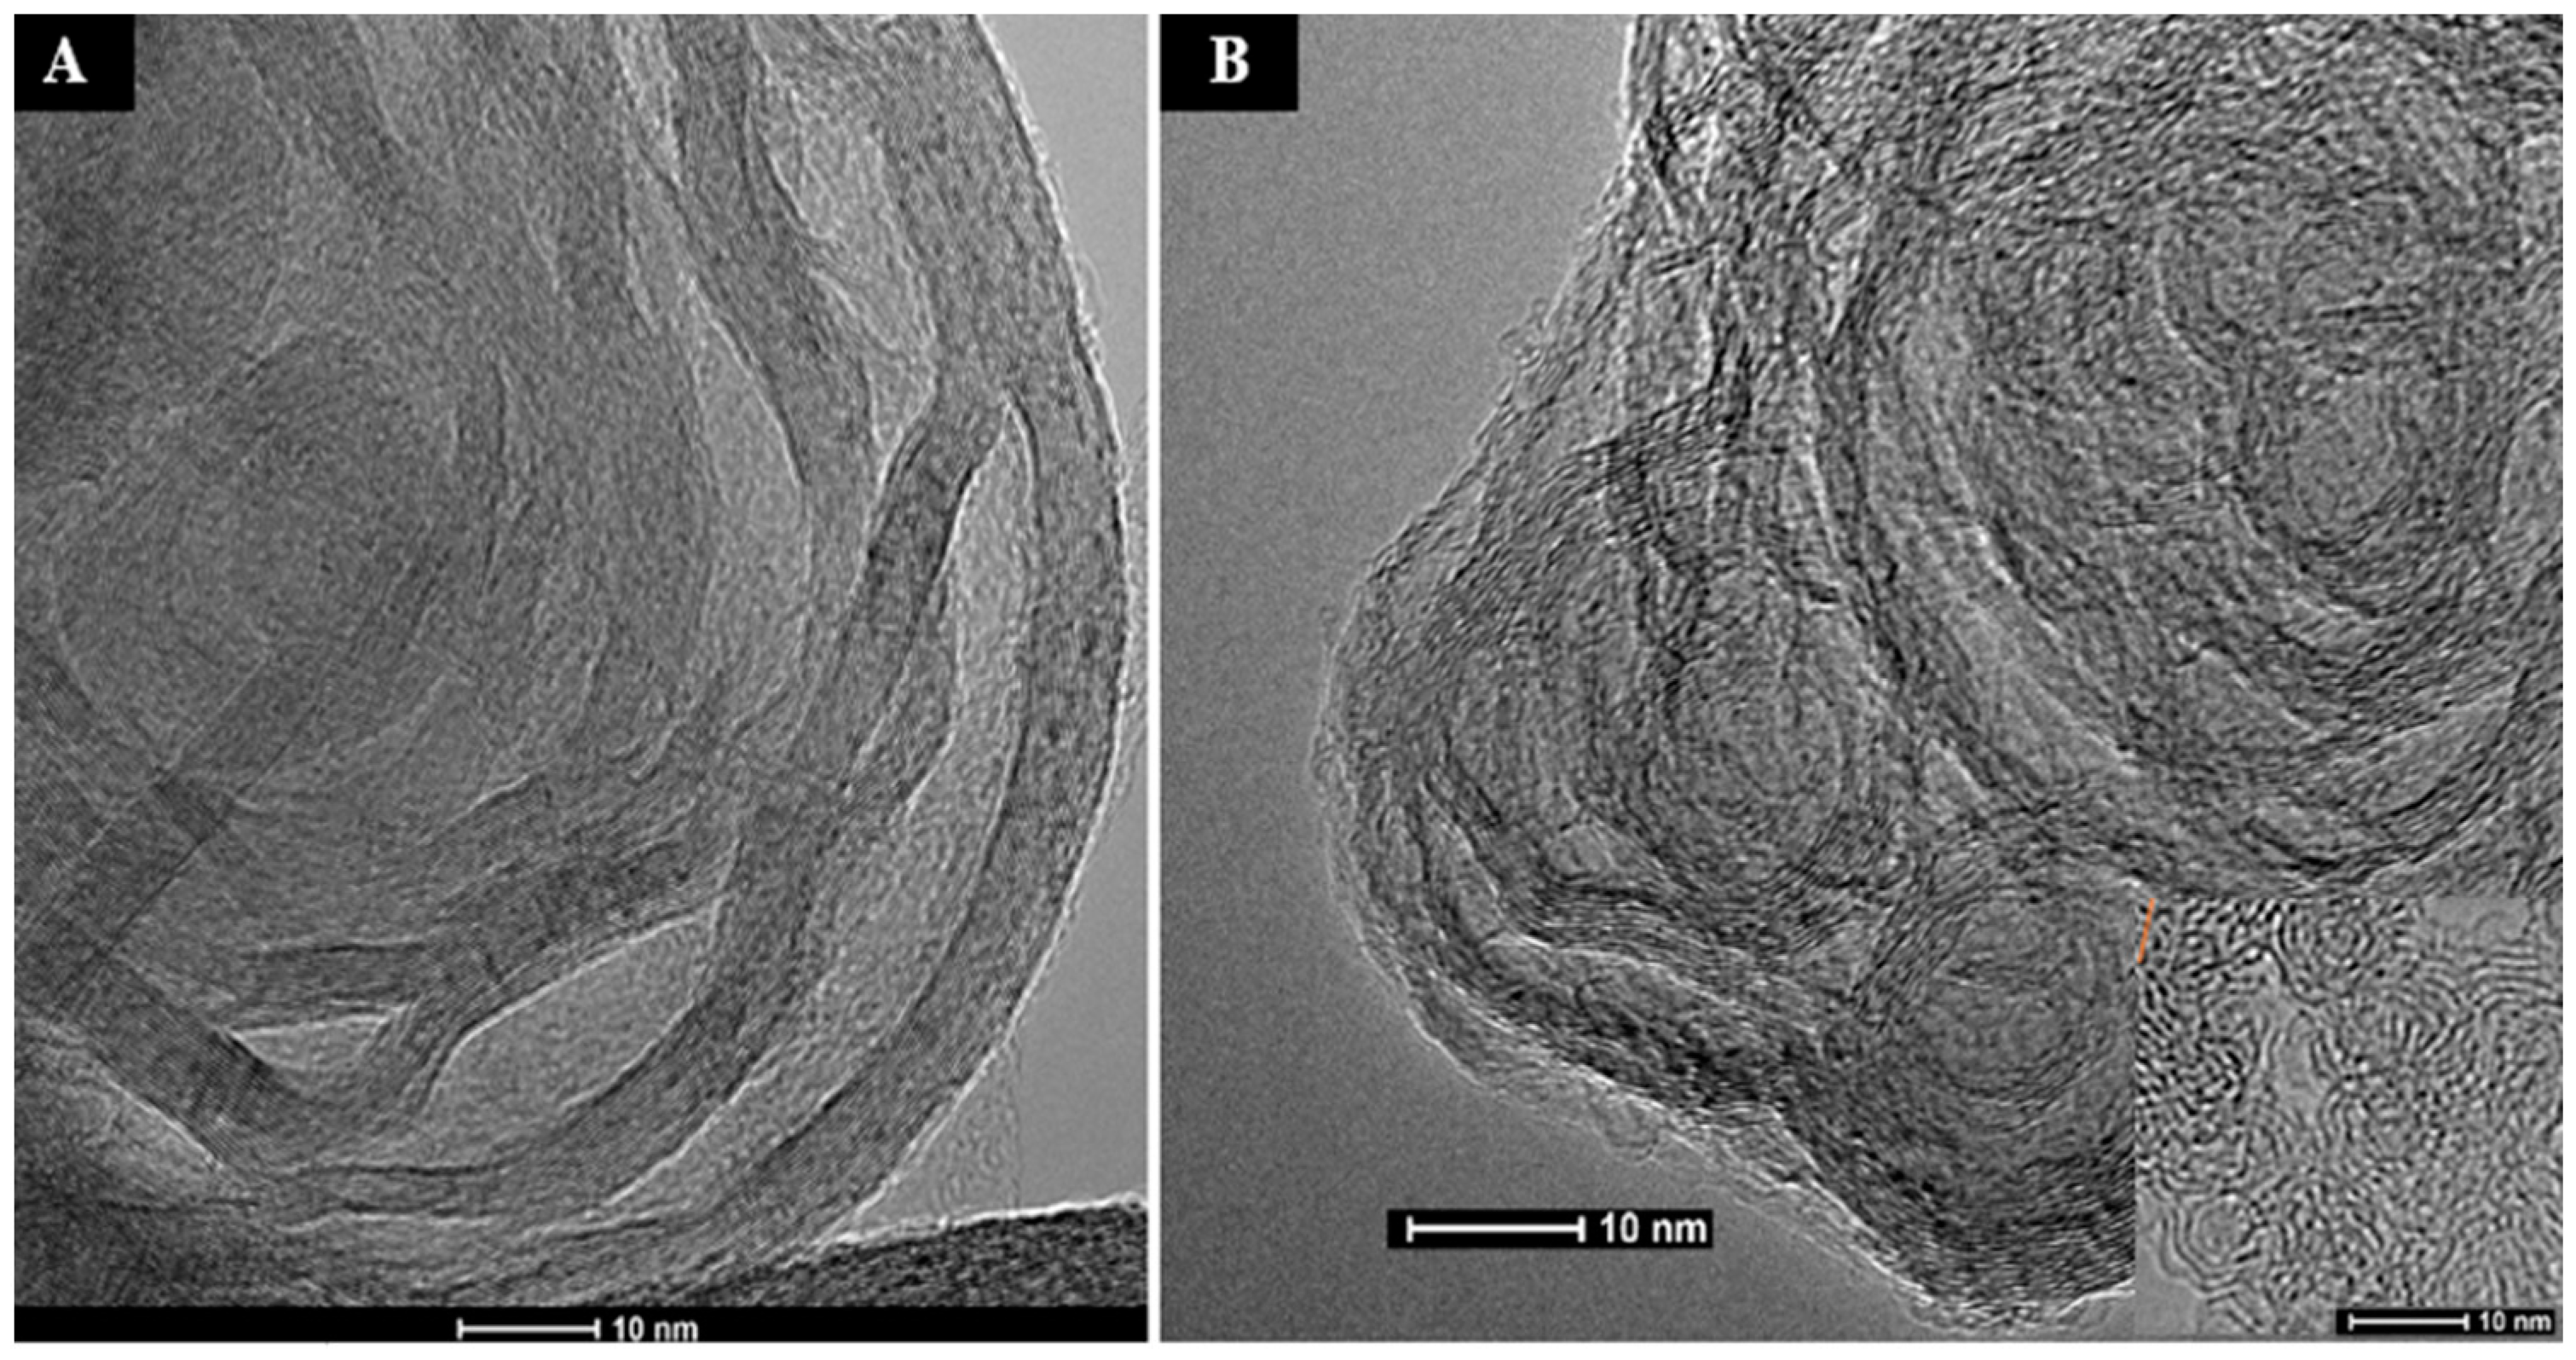
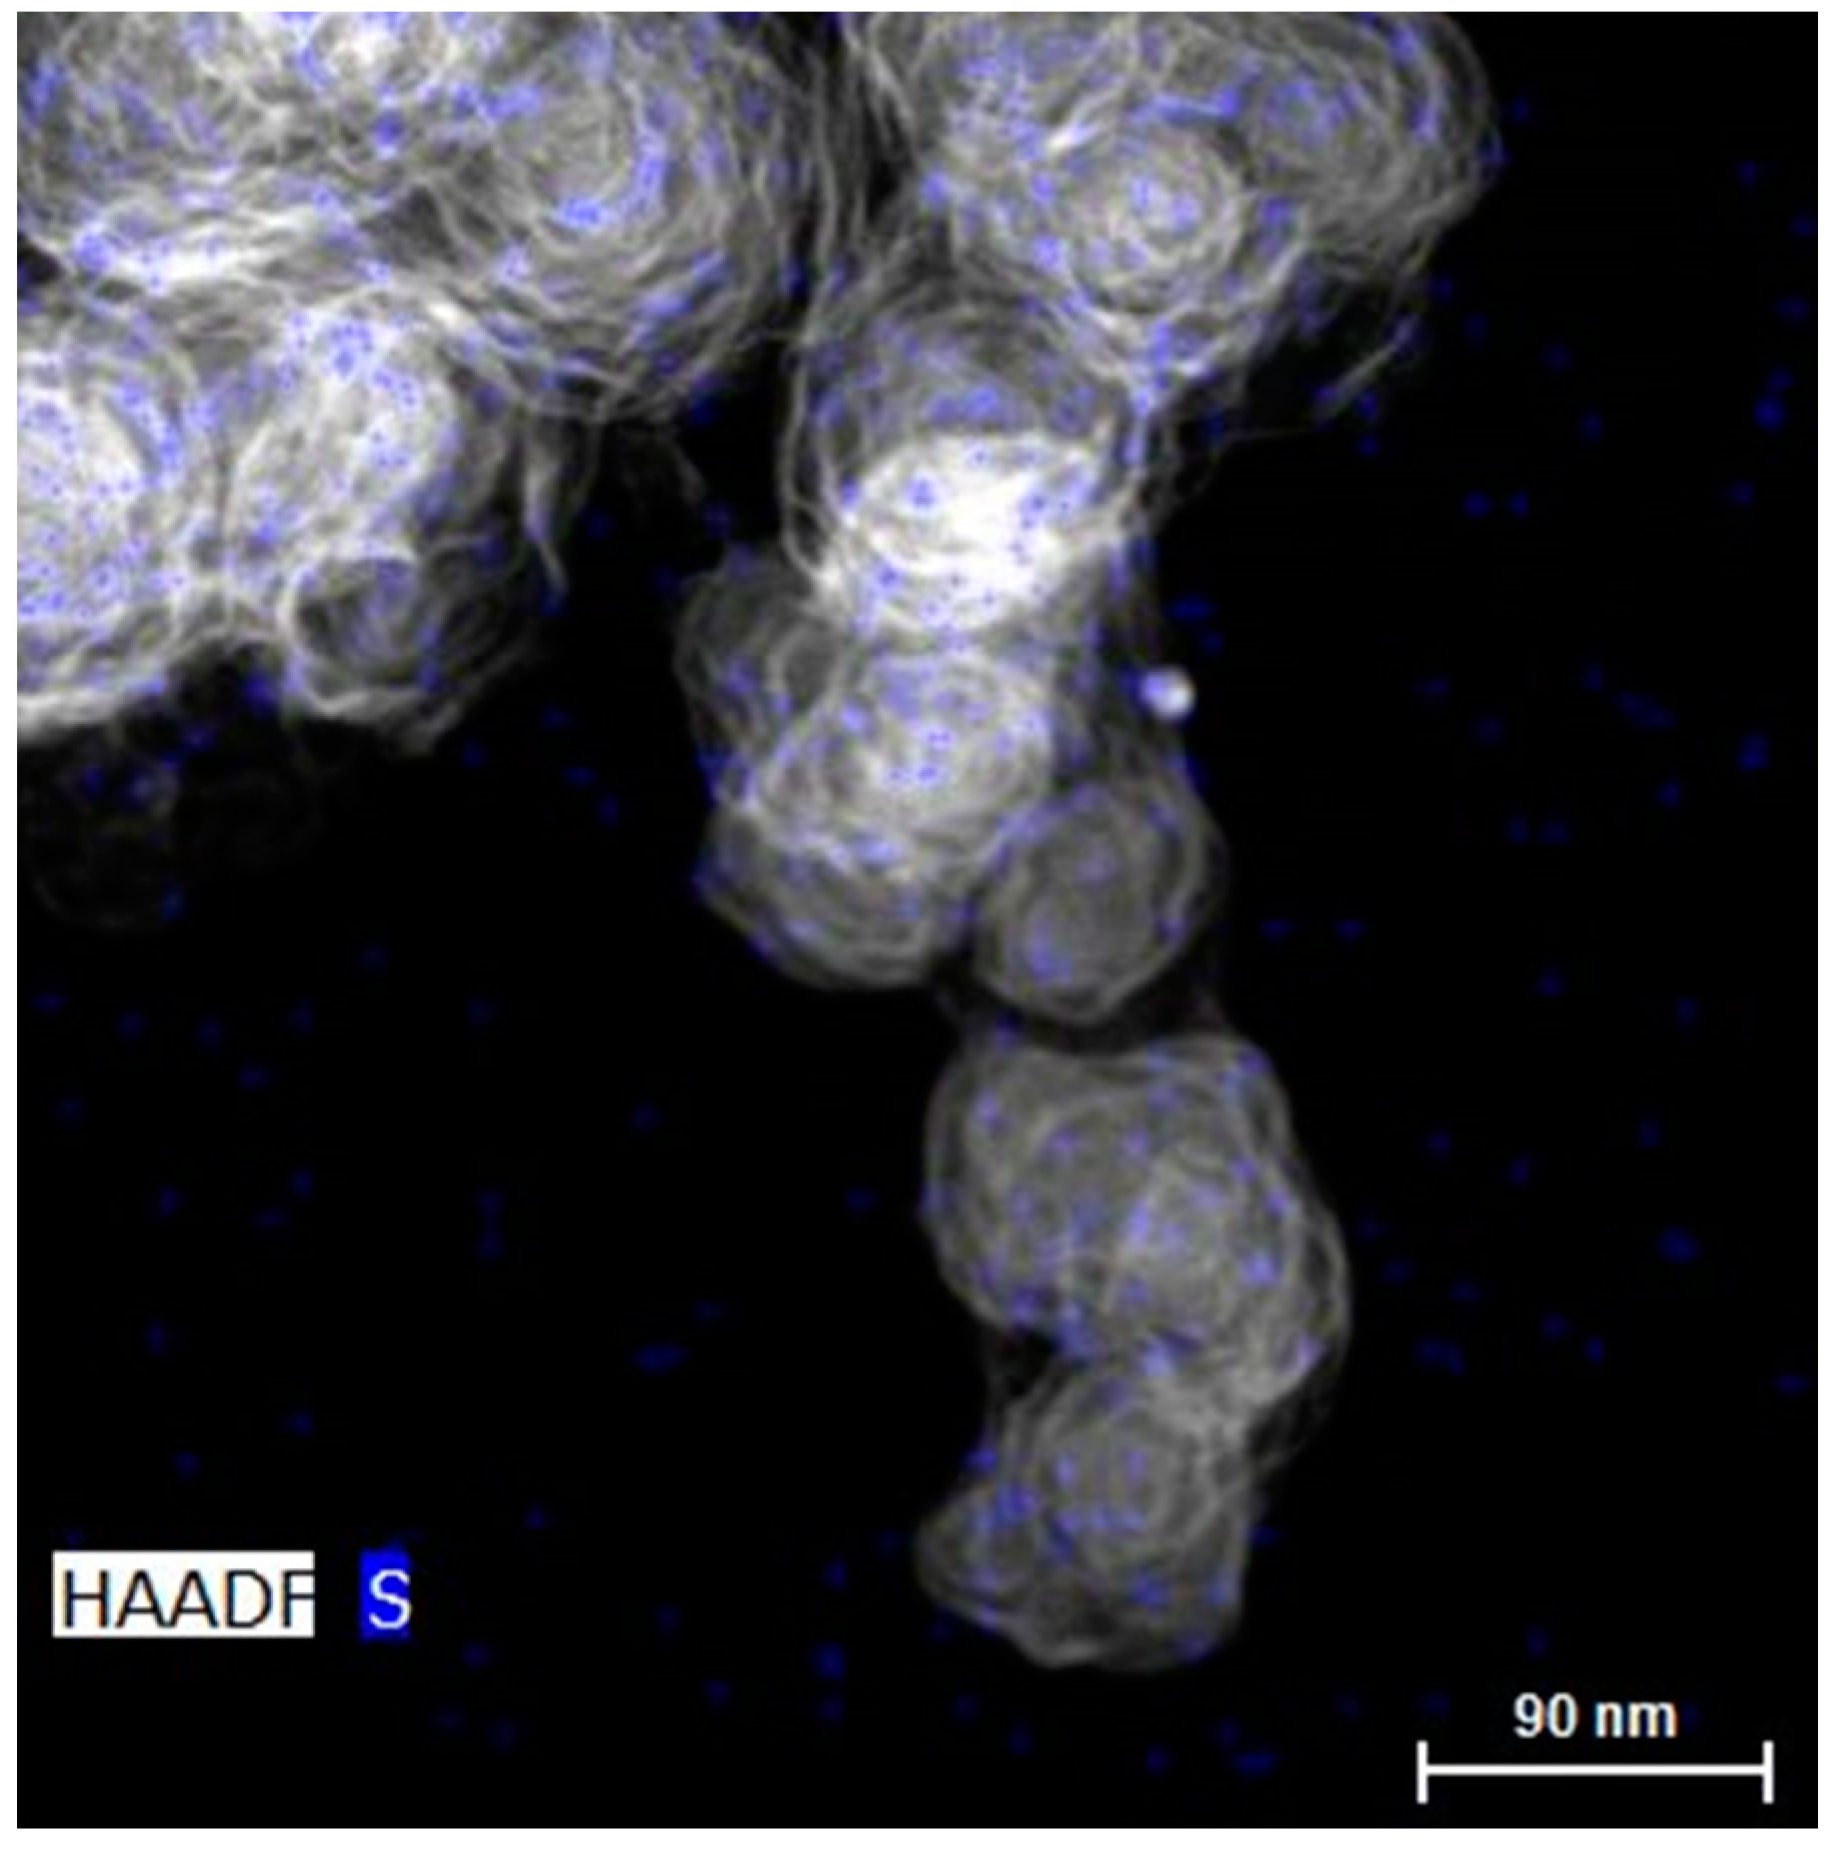
As seen from traditional furnace (slow ramp rates) heating, carbon is able to sufficiently anneal prior to the onslaught of sulfur evolution, and thus, explosive pressure builds up the carbon walls. With Nd:YAG laser annealing, the annealing and sulfur evolution occur at the same time. Therefore, the defect left behind after sulfur evolution impacts the yet evolving carbon nanostructure. TEM micrographs of both benzene and benzene–thiophene synthetic soot after Nd:YAG laser heating are given in Figure 7. The straight benzene sample annealed in a similar fashion to that observed with the commercial carbon black heated with 50 mJ/cm2 [6]. The transformation found after laser heating in the sulfur doped sample was drastically different. The material comprised highly curved structures (see insert in Figure 7B taken from the interior of a primary particle). The extent of annealing was also lower, as observed by the disordered wavy lamellae along the perimeter. The sulfur content found in the laser-heated sample was below detection limits, as displayed in the EDS map in Figure 8. The EDS map is an HAADF micrograph that is also useful for assessing thickness. Obvious void spaces between the carbon ribbons were seen as compared to the homogenous thickness in the nascent material (Figure 3A).
4. Discussion
The curvature found in the laser-heated sulfur doped sample is an effect of overlap between the early annealing steps with sulfur evolution. When sulfur is released, a defect is left behind, and this defect may lead to the formation of curvature, inducing odd membered rings. By rapidly heating the carbon material, sulfur has much the same effect that oxygen does during low temperature carbonization. This curvature-inducing behavior is not observed with traditional furnace heating as the sulfur release occurs after the carbon lamellae have begun to anneal. The fullerene-related nanostructure found after laser heating sulfur doped synthetic soot may like be due to the presence of odd membered carbon rings formed upon sulfur release.
Author Contributions
Joseph P. Abrahamson and Randy L. Vander Wal conceived and designed the experiments; Joseph P. Abrahamson performed the work and wrote the paper.
Funding
This research was funded by NSF CBET grant number 1236757.
Conflicts of Interest
The authors declare no conflict of interest.
References
- Warren, B.E. X-ray diffraction study of carbon black. J. Chem. Phys. 1934, 2, 551–555. [Google Scholar] [CrossRef]
- Biscoe, J.; Warren, B.E. An X-Ray Study of Carbon Black. J. Appl. Phys. 1942, 13, 364–371. [Google Scholar] [CrossRef]
- Hall, C.E. Dark-field electron microscopy: II. Studies of colloidal carbon. J. Appl. Phys. 1948, 19, 271–277. [Google Scholar] [CrossRef]
- Harris, P. Transmission electron microscopy of carbon: A brief history. C J. Carbon Res. 2018, 4, 4. [Google Scholar] [CrossRef]
- Heidenreich, R.D.; Hess, W.M.; Ban, L.L. A test object and criteria for high resolution electron microscopy. J. Appl. Crystallogr. 1968, 1, 1–19. [Google Scholar] [CrossRef]
- Abrahamson, J.P.; Madhu, S.; Mathews, J.P.; Vander Wal, R.L. Pulsed laser annealing of carbon black. Carbon 2017, 124, 380–390. [Google Scholar] [CrossRef]
- Rouzaud, J.N.; Oberlin, A. Structure, microtexture, and optical properties of anthracene and saccharose-based carbons. Carbon 1989, 27, 517–529. [Google Scholar] [CrossRef]
- McDonald-Wharry, J.S.; Manley-Harris, M.; Pickering, K.L. Reviewing, combining, and updating the models for the nanostructure of non-graphitizing carbons produced from oxygen-containing precursors. Energy Fuels 2016, 30, 7811–7826. [Google Scholar] [CrossRef]
- Rhim, Y.; Zhang, D.; Fairbrother, D.H.; Wepasnick, K.A.; Livi, K.J.; Bodnar, R.J.; Nagle, D.C. Changes in electrical and microstructural properties of microcrystalline cellulose as function of carbonization temperature. Carbon 2010, 48, 1012–1024. [Google Scholar] [CrossRef]
- Franklin, R.E. The interpretation of diffuse X-ray diagrams of carbon. Acta Crystallogr. 1950, 3, 107–121. [Google Scholar] [CrossRef]
- Franklin, R.E. Crystallite growth in graphitizing and non-graphitizing carbons. Proc. R. Soc. A Math. Phys. Eng. Sci. 1951, 209, 196–218. [Google Scholar] [CrossRef]
- Emmerich, F.G. Evolution with heat treatment of crystallinity in carbons. Carbon 1995, 33, 1709–1715. [Google Scholar] [CrossRef]
- Harris, P.J.F. New perspectives on the structure of graphitic carbons. Crit. Rev. Solid State Mater. Sci. 2005, 30, 235–253. [Google Scholar] [CrossRef]
- Kroto, S.H.W.; Heath, J.R.; O’Brien, S.C.; Curl, R.F.; Smalley, R.E. C60: Buckminsterfullerene. Nature 1985, 318, 162–163. [Google Scholar] [CrossRef]
- Harris, P.J.F.; Tsang, S.C. High-resolution electron microscopy studies of non-graphitizing carbons. Philos. Mag. A 1997, 76, 667–677. [Google Scholar] [CrossRef]
- Harris, P.J.F. Impact of fullerenes on carbon science. In Chemistry and Physics of Carbon; Radovic, L.R., Ed.; Marcel Dekker, Inc.: New York, NY, USA, 2003; pp. 1–36. [Google Scholar]
- Harris, P.J.F. Fullerene-related structure of commercial glassy carbons. Philos. Mag. 2004, 84, 3159–3167. [Google Scholar] [CrossRef]
- Harris, P.J.F. Structure of non-graphitising carbons. Int. Mater. Rev. 1997, 42, 206–218. [Google Scholar] [CrossRef]
- Guo, J.; Morris, J.R.; Ihm, Y.; Contescu, C.I.; Gallego, N.C.; Duscher, G.; Pennycook, S.J.; Chisholm, M.F. Topological defects: Origin of nanopores and enhanced adsorption performance in nanoporous carbon. Small 2012, 8, 3283–3288. [Google Scholar] [CrossRef] [PubMed]
- Harris, P.J.F.; Liu, Z.; Suenaga, K. Imaging the atomic structure of activatedcarbon. J. Phys. Condens. Matter 2008, 20, 362201. [Google Scholar] [CrossRef]
- Huang, C.-H.; Vander Wal, R.L. Partial premixing effects upon soot nanostructure. Combust. Flame 2016, 168, 403–408. [Google Scholar] [CrossRef]
- Hung, C.-H. Soot Nanostructure Evolution from Gas Turbine Engine, Premixed and Diffusion Flame: Equivalence Ratio, Flame Temperature, and Fuel Dependencies. Ph.D. Thesis, Penn State, State College, PA, USA, 2014. [Google Scholar]
- Vander Wal, R.L.; Strzelec, A.; Toops, T.J.; Stuart Daw, C.; Genzale, C.L. Forensics of soot: C5-related nanostructure as a diagnostic of in-cylinder chemistry. Fuel 2013, 113, 522–526. [Google Scholar] [CrossRef]
- Aso, H.; Matsuoka, K.; Sharma, A.; Tomita, A. Structural analysis of PVC and PFA carbons prepared at 500–1000 °C based on elemental composition, XRD, and HRTEM. Carbon 2004, 42, 2963–2973. [Google Scholar] [CrossRef]
- Fitzer, E.; Schäfer, W. The effect of crosslinking on the formation of glasslike carbons from thermosetting resins. Carbon 1970, 8, 353–364. [Google Scholar] [CrossRef]
- Abrahamson, J.P.; Jain, A.; van Duin, A.C.T.; Vander Wal, R.L. Carbon structure and resulting graphitizability upon oxygen evolution. Carbon 2018, 135, 171–179. [Google Scholar] [CrossRef]
- Abrahamson, J.P. Pulsed Laser Annealing of Carbon. Ph.D. Thesis, Penn State, State College, PA, USA, 2017. [Google Scholar]
- Abrahamson, J.P.; Wincek, R.T.; Eser, S. Scheme for Hydrotreatment of Fluid Catalytic Cracking Decant Oil with Reduced Hydrogen Consumption and High Needle Coke Yield upon Carbonization. Energy Fuels 2016, 30, 8150–8155. [Google Scholar] [CrossRef]
- Wincek, R.T.; Abrahamson, J.P.; Eser, S. Hydrodesulfurization of fluid catalytic cracking decant oils in a laboratory flow reactor and effect of hydrodesulfurization on subsequent coking. Energy Fuels 2016, 30, 6281–6289. [Google Scholar] [CrossRef]
- Abrahamson, J.P.; Wincek, R.T.; Eser, S. Effects of catalyst properties on hydrodesulfurization activity for sulfur removal from fluid catalytic cracking decant oils. Energy Fuels 2016, 30, 7173–7179. [Google Scholar] [CrossRef]
- Cox, J.D.; Wagman, D.D.; Medvedev, V.A. Codata Key Values for Thermodynamics, 1st ed.; Hemisphere Publishing Corp.: New York, NY, USA, 1989. [Google Scholar]
- Seidell, A. Solubilities of Organic Compounds, 3rd ed.; Van Nostrand Company: New York, NY, USA, 1941. [Google Scholar]
Figure 1.
Time-temperature histories of synthetic soot heated with a 50 mJ/cm2 Nd:YAG laser pulse.

Figure 2.
TEM micrographs of synthetic soot derived from (A) benzene (B) and benzene–thiophene produced at 1100 °C in a furnace.
Figure 2.
TEM micrographs of synthetic soot derived from (A) benzene (B) and benzene–thiophene produced at 1100 °C in a furnace.

Figure 3.
(A) High angle annular dark field (HAADF) micrograph (B) and energy dispersive X-ray spectroscopy (EDS) map of benzene–thiophene synthetic soot.
Figure 3.
(A) High angle annular dark field (HAADF) micrograph (B) and energy dispersive X-ray spectroscopy (EDS) map of benzene–thiophene synthetic soot.

Figure 4.
TEM micrograph of benzene synthetic soot after furnace heat treatment −2600 °C for 1 h.

Figure 5.
(A,B) TEM micrographs of furnace annealed benzene–thiophene synthetic soot.

Figure 6.
EDS map of furnace annealed benzene–thiophene synthetic soot.

Figure 7.
(A) TEM micrographs of benzene (B) and benzene–thiophene synthetic soot after Nd:YAG laser annealing with 50 mJ/cm2.
Figure 7.
(A) TEM micrographs of benzene (B) and benzene–thiophene synthetic soot after Nd:YAG laser annealing with 50 mJ/cm2.

Figure 8.
EDS map of laser annealed benzene–thiophene synthetic soot.

© 2018 by the authors. Licensee MDPI, Basel, Switzerland. This article is an open access article distributed under the terms and conditions of the Creative Commons Attribution (CC BY) license (http://creativecommons.org/licenses/by/4.0/).
Share and Cite
MDPI and ACS Style
Abrahamson, J.P.; Vander Wal, R.L. Carbon Nanostructure Curvature Induced from the Rapid Release of Sulfur upon Laser Heating. C 2018, 4, 33. https://doi.org/10.3390/c4020033
AMA Style
Abrahamson JP, Vander Wal RL. Carbon Nanostructure Curvature Induced from the Rapid Release of Sulfur upon Laser Heating. C. 2018; 4(2):33. https://doi.org/10.3390/c4020033
Chicago/Turabian StyleAbrahamson, Joseph P., and Randy L. Vander Wal. 2018. "Carbon Nanostructure Curvature Induced from the Rapid Release of Sulfur upon Laser Heating" C 4, no. 2: 33. https://doi.org/10.3390/c4020033
Note that from the first issue of 2016, this journal uses article numbers instead of page numbers. See further details here.