Article

Evaluating the Efficiency of Wicking Bed Irrigation Systems for Small-Scale Urban Agriculture

by
Niranjani P. K. Semananda
*,
James D. Ward
and
Baden R. Myers
School of Natural and Built Environments, University of South Australia, Mawson Lakes Campus, Adelaide 5095, Australia
*
Author to whom correspondence should be addressed.
Horticulturae 2016, 2(4), 13; https://doi.org/10.3390/horticulturae2040013
Submission received: 5 July 2016 / Revised: 6 August 2016 / Accepted: 9 August 2016 / Published: 26 September 2016

Abstract

:
A wicking bed (WB) is a plant driven system where plants receive water through capillary rise from a self-contained coarse material-filled subsoil reservoir. WBs have been widely promoted as a water-efficient irrigation solution for small-scale and urban food gardens. However, little published research exists to support popular claims about their effectiveness. In this study, the performance of WBs was compared with best-practice, precision surface irrigation in terms of water use efficiency (WUE), fruit yield, fruit quality and labour input, using tomato (Solanum lycopersicum) as the experimental crop. The influence of WB design variables (reservoir depths and soil bed depths) was tested. Results showed that WBs performed as well or better than precision surface irrigated pots, showing statistically significant improvement in WUE, yield and fruit quality. The results also suggest an optimum design exists for soil depth (where 300 mm outperformed 600 mm) but not reservoir depth (no difference between 150 and 300 mm). The WBs were more labour efficient, requiring significantly less frequent watering to achieve the same or better WUE. WBs are inherently low-tech and scalable and appear well-suited to a variety of urban agriculture settings.

1. Introduction

More than a half of the world’s population lives in urban and peri-urban areas, and this proportion can be up to 90% in developed countries [1,2]. However, land available for crop production within cities is considerable [3]. In the UK, about 87% of households have access to a private garden and these contribute between 22% and 36% of the total urban area [4]. In Australia, more than half of households are growing some of their own food [5]. A wide acceptance and expansion of urban agriculture can be seen even in densely populated cities like New York, USA, as a measure towards sustainable use of land, and in the pursuit of economic and food security [6,7]. There is an increasing trend towards growing crops (especially organic products) in household and community gardens in urban areas. This is due to many factors, including concerns over the side effects of herbicides, insecticides and fertilizers in commercial agriculture [8,9]. Urban gardens also provide a significant contribution to urban green infrastructure, providing benefits to the urban ecosystem. Such benefits include reduced urban heat island impacts, improved human health and well-being, and improved aesthetics [2,10,11]. Urban agriculture can also provide a source of food or additional income for households in developing countries [12].
The growing interest in urban food production adds pressure to municipal water supplies. Municipal treated water is the main water supply used to irrigate urban gardens, and in Australia, about 34% of household water consumption is used to irrigate residential gardens [13]. In addition to supply constraints, the water used for irrigation in urban settings is extremely expensive compared to rural water supplies for commercial horticulture [14,15]. There is therefore a great interest in the development of efficient irrigation systems which can secure urban water resources and provide urban gardeners with an economically efficient means of irrigation that is not technologically complex [16,17,18].
Although improved practices exist for efficient crop irrigation in commercial farm management, there has been limited adoption of these techniques in urban areas due to the barriers of cost and knowledge to maintain them [18]. In urban gardens, the issues principally revolve around determining when and how much water needs to be applied to crops. For example, precision irrigation scheduling has been widely applied for efficient irrigation of large-scale monoculture crops. At the domestic and community garden scale, however, plants tend to be mixed and irrigation cannot be optimally scheduled to meet the needs of multiple crop water use patterns [19,20]. As a result, homeowners frequently apply more water than necessary, which leads to water loss as subsoil drainage [21]. Another major problem for urban growers is the labour invested in watering which may conflict with other activities [22]. In some regions, those interested in growing crops are not able to do so due to the presence of legacy contamination [23] or a shallow water table [24].
Capillary wick irrigation has been investigated for some years as a method to deliver water to plants in container gardens [25]. Existing approaches include wicking mats, self-watering pots, and sub-irrigated planters [24,26]. The more recent “wicking bed” (WB) [27] has been characterized by a saturated media-filled reservoir beneath an unsaturated soil (root zone). Water is delivered by capillary action to the root zone in response to the water requirement of the plant by allowing individual plants to uptake water according to their demand.
In principle, in a WB, each plant should get precisely the right amount of water at a particular time, making the system a possible solution to the urban irrigation issues identified above. Indeed, WBs are gaining popularity among the gardening community because they are relatively simple and scalable, and informal recommendations abound as to their construction details. A review of grey literature, including garden magazines and websites, reveals claims that WBs can save up to 90% of water compared to traditional surface irrigation [28]. Despite increasing enthusiasm for, and claims about, WB performance, there is no comprehensive study to investigate the performance of these systems in terms of crop growth, water use efficiency (WUE) or labour needs. Moreover, while recent research [24] on a sub-irrigated planter design (akin to, though not labelled, a WB) indicated that the system may have higher yield and lower maintenance than other container gardening approaches, it did not explicitly investigate the water use or labour efficiency of the irrigation system, and recommended further research into these areas.
A substantial knowledge gap exists relating to the engineering design of WBs, specifically the depth of both soil and saturated reservoir. We were unable to find any published research supporting design recommendations for these depths. It has long been understood that the capillary rise of water in soil reaches a maximum height, with moisture content decreasing with distance above the saturated water level [29,30]. It follows that in a WB reservoir, especially when the media used is coarse (e.g., gravel), there is a critical depth beyond which wicking into the soil will not occur, rendering the additional depth of storage useless. Meanwhile, insufficient soil may lead to evaporation from the surface, and excess soil may limit the rate of water delivery to the root zone. Thus, it is reasonable to expect an optimum soil bed height for a given plant rooting habit, which would balance water delivery and crop yield against minimal soil evaporation.
The objective of this study was therefore to evaluate, for the first time, the performance of WB systems relative to equivalent best-practice conventional surface irrigation techniques, with a focus on WUE, fruit yield, fruit quality, dry matter production and irrigation labour (indicated by the number of irrigation events required). The study also compared the effect of different reservoir and soil bed depths to better inform the design of WBs for maximum WUE. The outcomes of this research are of high significance in the context of water consumption and efficiency in urban agriculture, and should be of specific interest to decision-makers, practitioners and proponents of WBs as a water-efficient irrigation technology.

2. Materials and Methods

2.1. Experimental Conditions

The experiment was conducted in a glasshouse at the University of South Australia, Mawson Lakes campus in Adelaide, Australia (34.81°S, 138.61°E). The glasshouse provided a protected environment in which to compare WB and surface irrigation efficiency without the influence of rainfall. The growing period was during spring and summer 2014–2015. Soil temperature, indoor air temperature and relative humidity were recorded at hourly intervals during the crop growing period. Soil temperature was measured in a single replicate of each treatment by installing TR 10 temperature data loggers at two depths—10 and 15 cm from the soil surface. Temperature was assumed not to vary significantly across the plots within the greenhouse (area 5 m × 3 m). Indoor air temperature (±1 °C) and relative humidity (±3%) were recorded using a USB temperature/humidity data logger (LCD—QP6014, Jaycar electronics, Sydney, Australia).
One of the most common varieties of tomato (Solanum lycopersicum), cv. “Mighty Red”, was obtained from a local plant nursery in Virginia, South Australia. The experimental soil was purchased from a local supplier, and was a type especially developed for gardening, so was taken as representative of urban garden soils. The soil was a poorly graded sandy soil, according to the unified soil classification system (USCS) (90% sand and <5% fines). It had a field capacity of 30%, porosity of 49%, dry bulk density of 1.33 g/cm3, organic matter of 4.5%, and pH of 7.7.

2.2. Experimental Design and Treatments

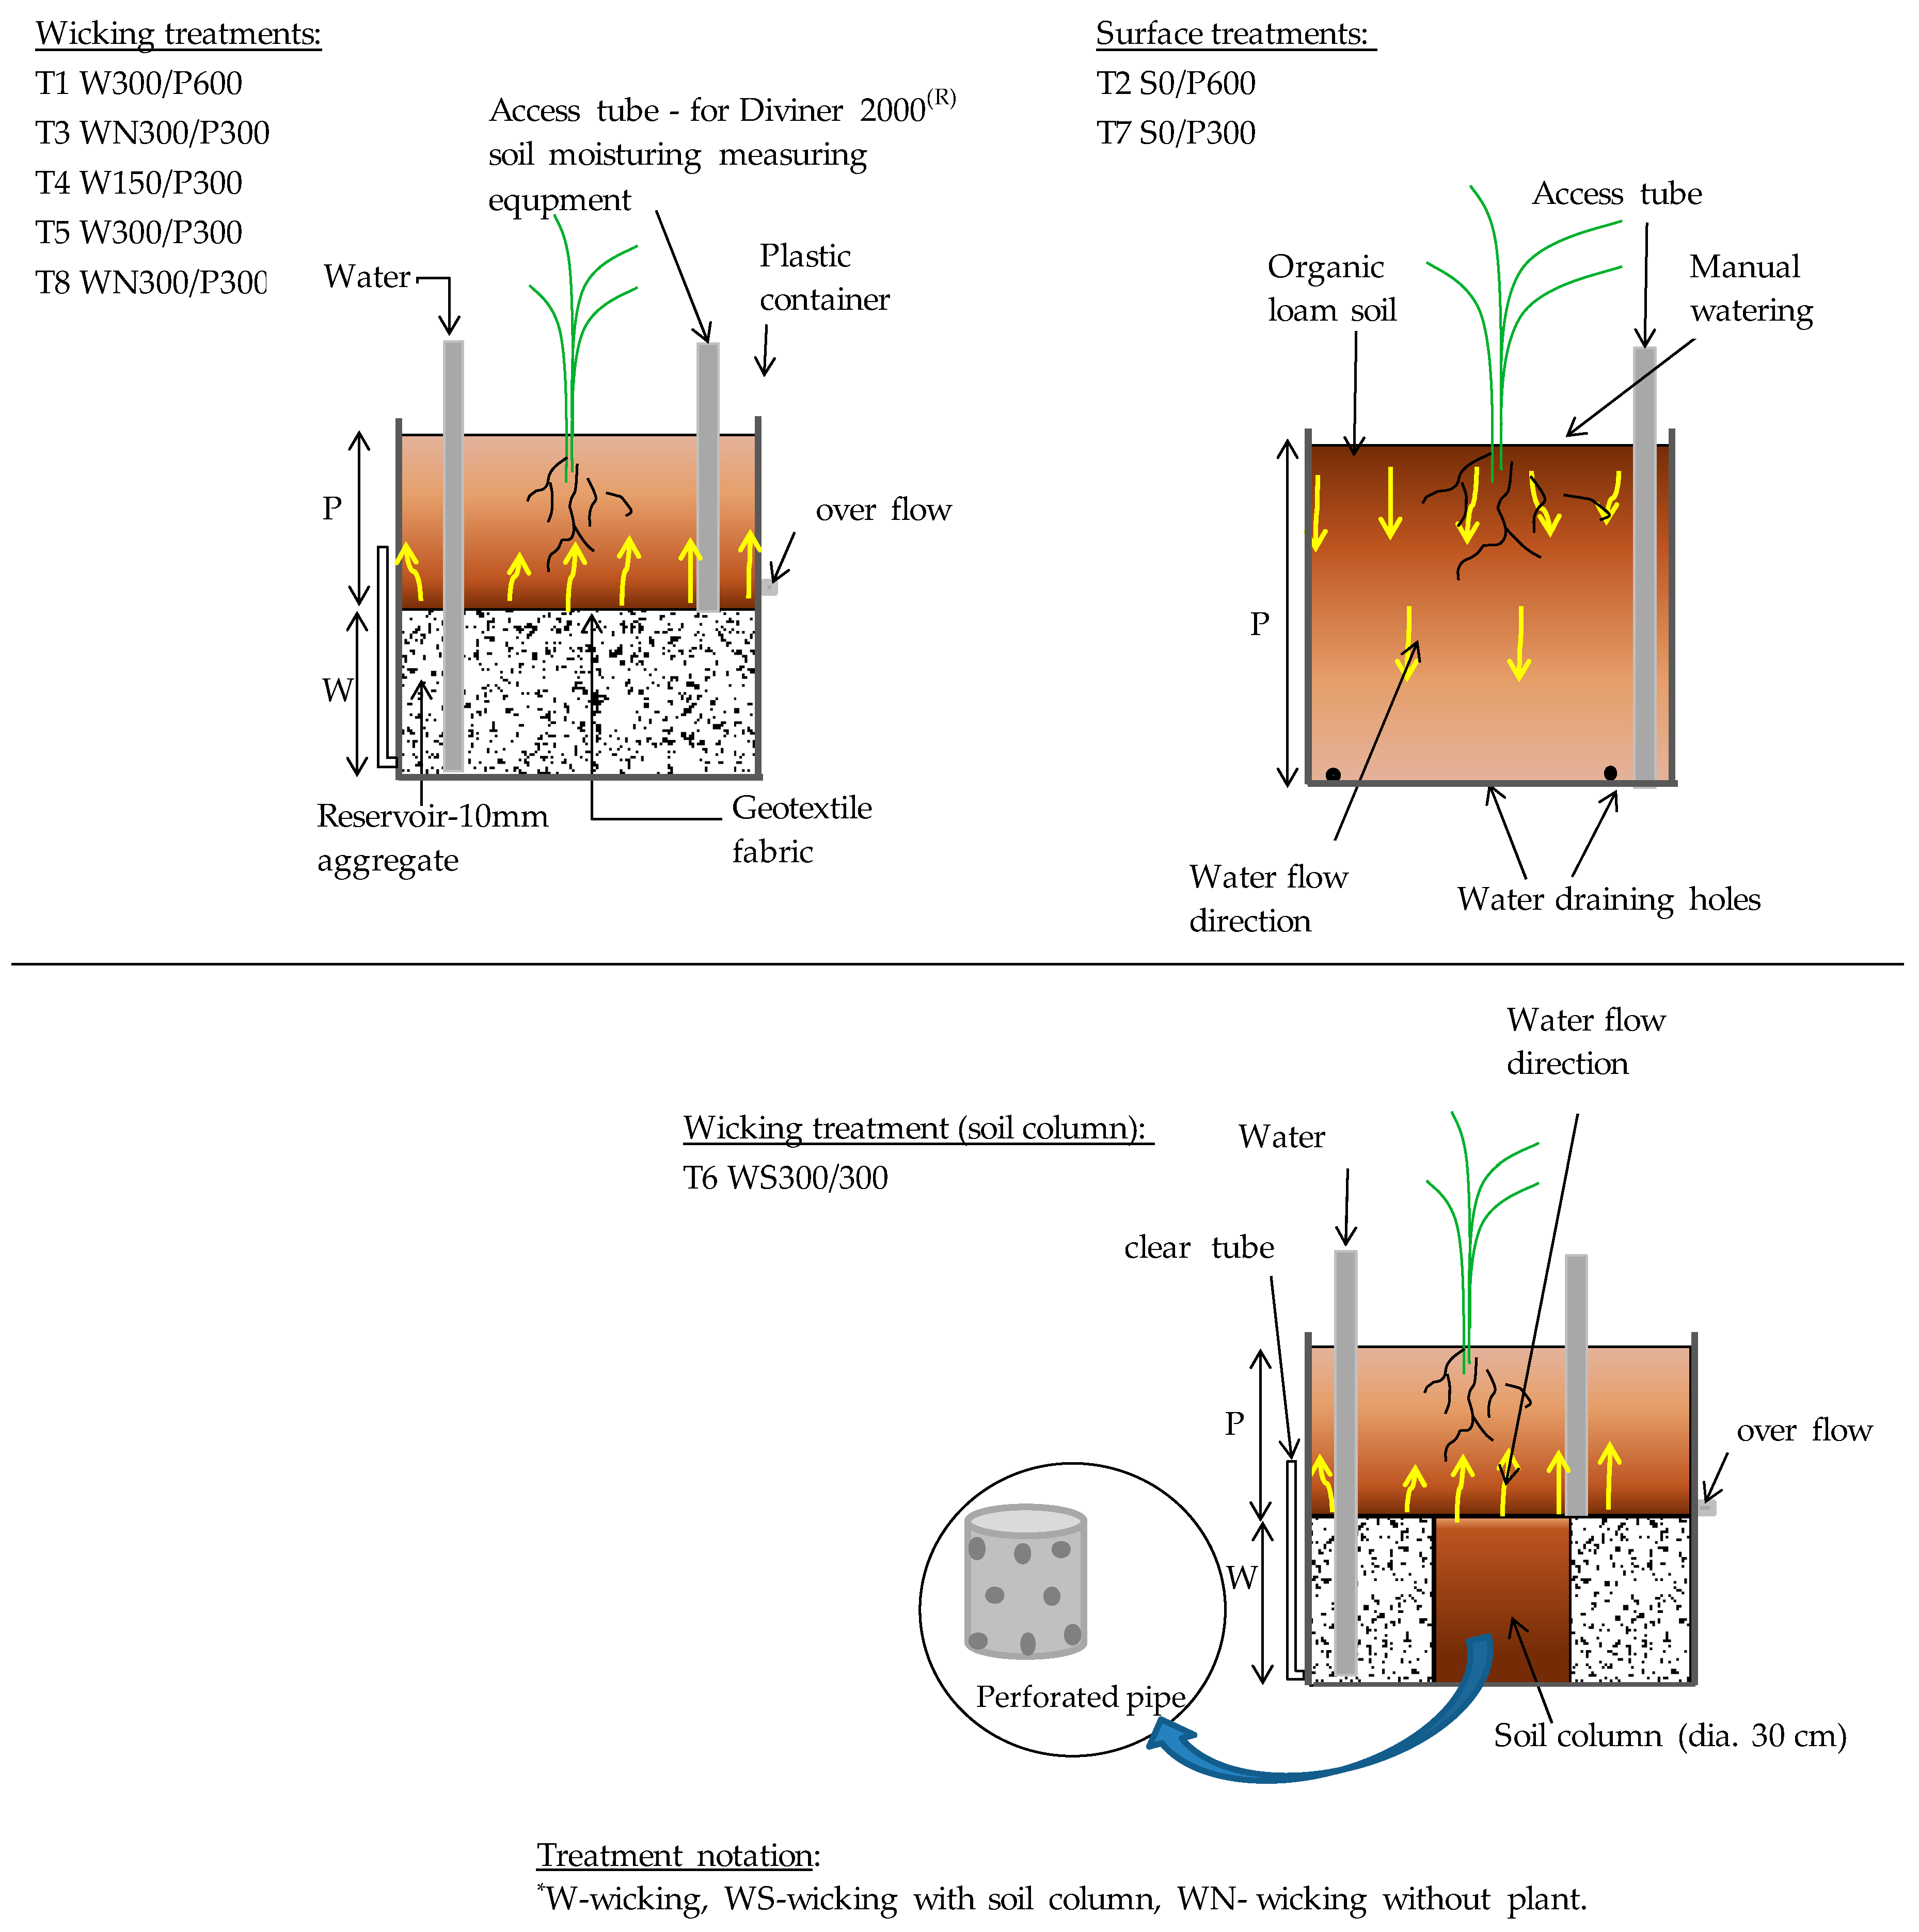
The main features of a WB are the reservoir, separation material, vertical pipe and overflow pipe. All beds were prepared using opaque plastic containers with an internal diameter of 56 cm and 100 cm initial height, which were cut down to provide the required soil plus reservoir depth. Different pots were built to compare the WUE of standard surface irrigation, conventional wicking beds, and wicking beds with a soil column, each with two soil bed heights (300, 600 mm) and two WB reservoir depths (150, 300 mm). A coarse-grained material (quartzite gravel) was used to fill the reservoir. The use of gravel adds strength to the WB to support the soil weight, conforms to the size and shape of the container, and creates a medium that is both porous and permeable so that it both holds a substantial volume of water and is fast to fill. A soil column within the reservoir and underneath the main soil body (Figure 1) to improve wicking consisted of a perforated polyvinyl chloride (PVC) pipe of 30 cm diameter, sealed at the base, and wrapped with a geotextile fabric. To measure evaporation solely from the soil surface, two pots with different soil bed heights (300 and 600 mm) were used without plants. Accordingly, there were eight treatments in total and each treatment was in triplicate. Treatments were labelled as treatment number (T1 to T8), followed by the irrigation method including depth of reservoir and soil bed in mm (Figure 1).
A transparent, flexible tube was fixed to the side of each wicking treatment as a manometer to view the water level in the reservoir. A vertical tube was placed in the reservoir through which water was added to the WB. A PVC access tube sealed at the base was installed into each pot to facilitate access by the soil moisture probe as shown in Figure 1 (this is not a part of typical WB). Aggregate (10 mm Quartzite) was then placed as the reservoir material and a geotextile fabric was laid over the aggregate. Soil was placed into pots in 10 cm layers, each layer being lightly compacted. Granulated slow-release fertilizer (20% N, 6.1% P, 11% K as w/w), was added in equal amounts to all pots (30 g/plant), and mixed into the soil layer from 10 to 20 cm below surface. The same plastic containers were used for the surface irrigated pots but with several holes drilled in the base to drain any surplus water. All pots were arranged inside the glasshouse with treatments in a randomized complete block design. The reservoirs were filled with water three days before the seedlings were transplanted. One tomato seedling, 4-weeks old, was transplanted into the centre of each bed.

2.3. Application of Irrigation

Pots were manually irrigated with small irrigation volumes immediately after each seedling was transplanted, and thereafter every fourth day during the crop establishment period to support early root growth (10.25 L for shallow beds and 26.25 L for deep beds in total). This period lasted about 14 days after transplanting (DAT) for wicking beds with a 300 mm soil bed depth and 21 DAT for 600 mm deep beds. The volume of water applied to each pot was manually recorded. Following the crop establishment period, irrigation scheduling and volume were determined based on the soil-water balance method outlined below.
The volumetric soil moisture content (VMC, v/v%) in each pot was monitored every day at 10 cm intervals using a portable Diviner 2000® soil moisture monitoring probe (Sentek Sensor Technol., Stepney, SA, Australia) [31]. The Diviner 2000® probe was calibrated gravimetrically for the experimental soil during the progress of the experiment. The summation of volumetric moisture content (VMC) in each layer was calculated and a decision on whether to irrigate the crops was made based when the total VMC in each treatment had decreased to 75% of the moisture content field capacity (FC) (Equation (1)):
I f   T o t a l   V M C   = i = 1 n ( θ i ) > i n [ 0.75 ( θ F C ) ] ,   t h e n   n o   w a t e r i n g
where θ = volumetric moisture content (%), θi = volumetric soil moisture content (%) in layer i, n = number of soil layers, and FC = volumetric moisture content at field capacity.
The surface irrigation volume was determined according to Equation (2), which aimed to reach the FC in the upper layers and 75% of FC in the bottom layer, as:
I r r i g a t i o n   w a t e r   ( m m 3 ) = i = 1 n 1 ( θ F C θ i ) · A + i = n ( 0.75 θ F C θ n ) · A
where θi = soil moisture content in layer i, n = number of soil layers, FC = volumetric moisture content at field capacity, and A = pot area (mm2).
The soil moisture data were collected until the end of the cropping period. A summation of daily moisture content depletion was used to determine the ET in all treatments. Evapotranspiration over the total growing period (ETc) was calculated by summing up the ET values for each data recording period using Equation (3) below.
ET = I + i = 1 n ( θ i ,   t 1 θ i ,   t ) 100 . ( D i )
where ET = evapotranspiration (mm), I = irrigation volume (surface treatment) or water added to the reservoir (wicking treatment) (mm), n = number of soil layers in each pot, θi,t−1 = volumetric moisture content (%) in the ith layer on the previous day, θi,t = volumetric moisture content (%) in the ith layer on the current day, and Di = depth of the ith layer (mm).

2.4. Plant Performance and Water Use Efficiency

The total crop growing period was divided into four stages according to experimental observations for each treatment. These stages were the seedling stage (Stage I, from transplant to first flowering), flowering stage (Stage II, from first flowering to first fruit set), fruit development stage (Stage III, from first fruit set to the first harvest) and fruit maturity and harvesting stage (Stage IV, from first harvest to end of the experiment). The average length of each stage was 14.7 ± 4.8, 18.2 ± 0.8, 39.9 ± 3.3 and 67.2 ± 2.8 days, respectively. First fruit was harvested about 72.8 ± 2.8 DAT. All plants were trained to one stem by pruning all side shoots and by topping plants at the end of the crop, taken as the point when each plant had formed 5 fruit bearing clusters [32]. Tomato fruits were harvested when more than 90% of the fruit were red in colour. The experiment was carried out for a period of 140 DAT.
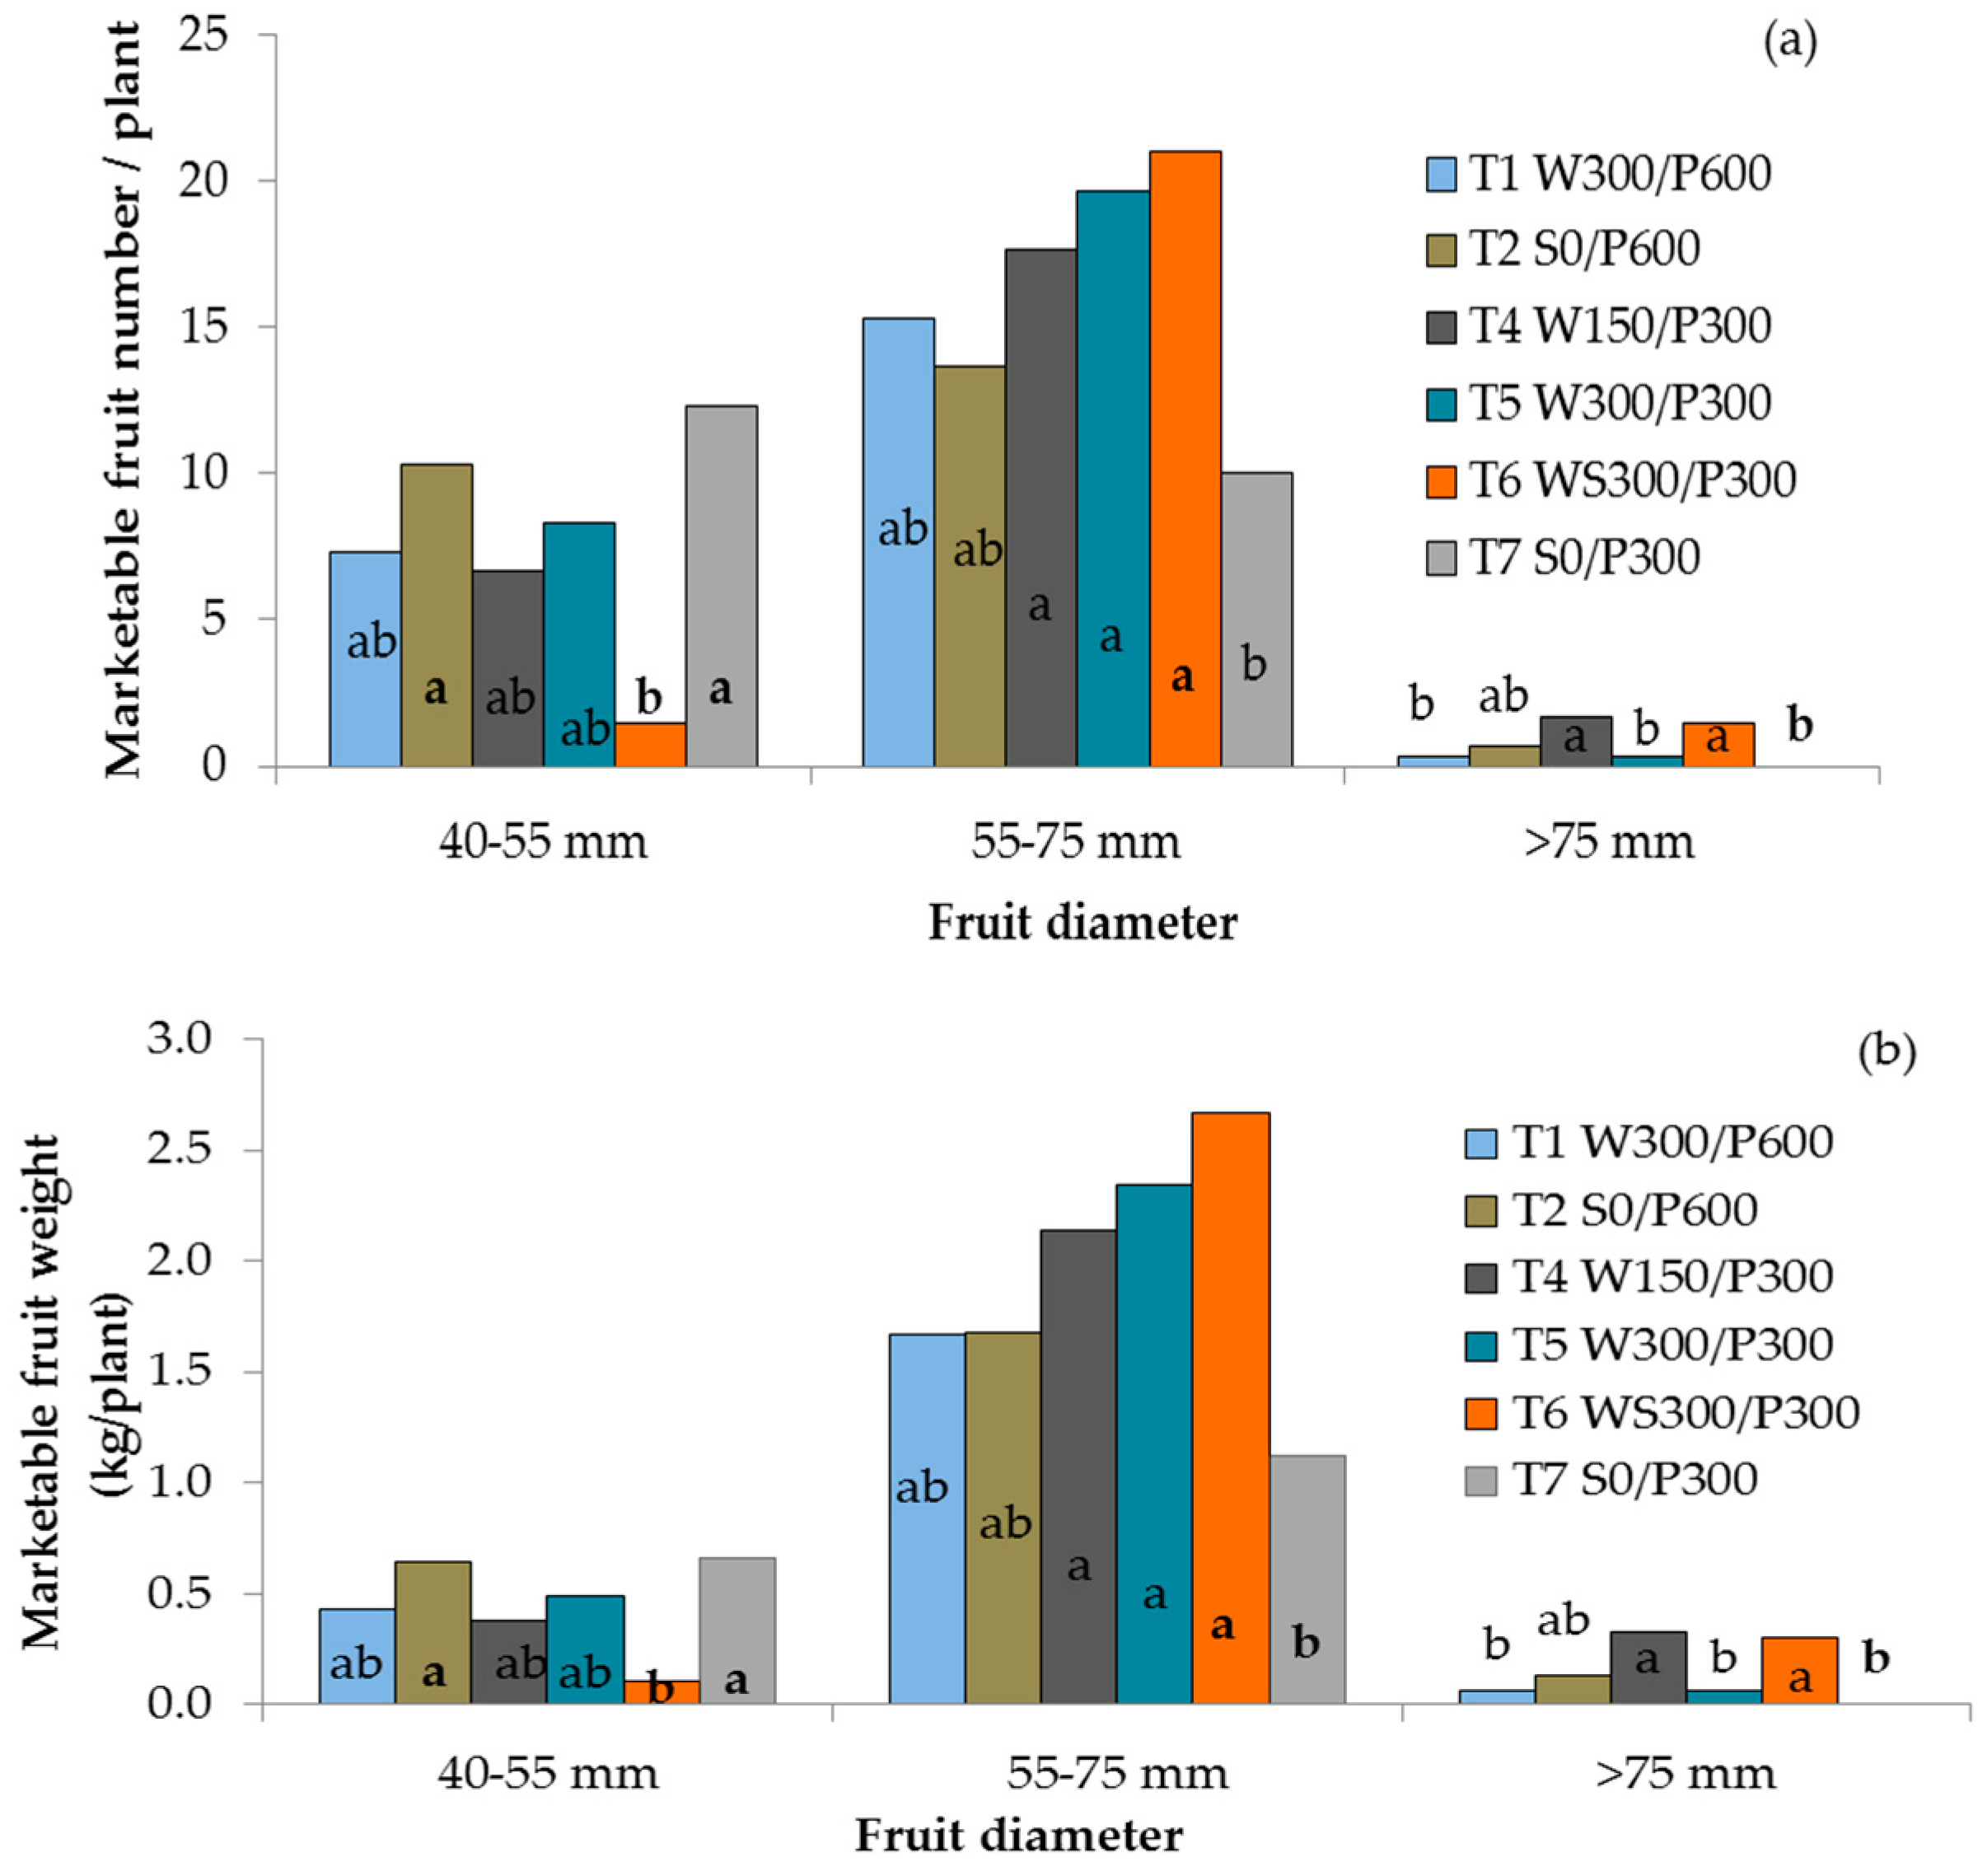
The size of the tomato fruit was measured using two parameters: fruit weight and diameter. The fruit were weighed using a digital balance with an accuracy of ±0.01 g, and individual fruit length and crosswise diameter were recorded using a Vernier calliper. All harvested fruit were graded into various marketable and non-marketable grades according to Ontario commercial standard [33]. Marketable tomatoes had three grades based on diameter: small (40 to 50 mm), large (55 to 75 mm), and extra large (>75 mm). Unmarketable fruit were graded as culls which included the fruit that did not fit into the marketable grades above, and damaged or diseased fruit (blossom end rot or other visible marks or injury). Each fruit was cut into thin slices (~5 mm) and dried in a dehydrator at 55 °C to obtain the dry fruit weight.
Plant growth and performance were evaluated by measuring plant height and stem diameter and counting the number of leaves at 14 day intervals. The plant height was recorded from the soil surface to the apex, while the stem diameter was measured 5 cm above the soil surface. At the end of the experiment, the stem and foliage weight of each plant were weighed separately, and then were dried in a forced air oven at 55 °C for subsequent dry weight determination. The total biomass accumulation was calculated as the dry weight of each vegetative part plus the dry mass of fruit.
Water use efficiency was calculated as the ratio of total marketable fruit yield to either the amount of water used by the plants (WUE) or that was applied through irrigation (iWUE). WUE and iWUE were calculated using Equations (4) and (5) below [34]:
WUE = Y/ETc
iWUE = Y/I
where Y = total marketable fruit yield (g), I = irrigation water volume (L), and ETc = total crop evapotranspiration (L). ETc values were obtained by multiplying Equation (3) above with the area of the pot (A).

2.5. Root Sampling and Analysis

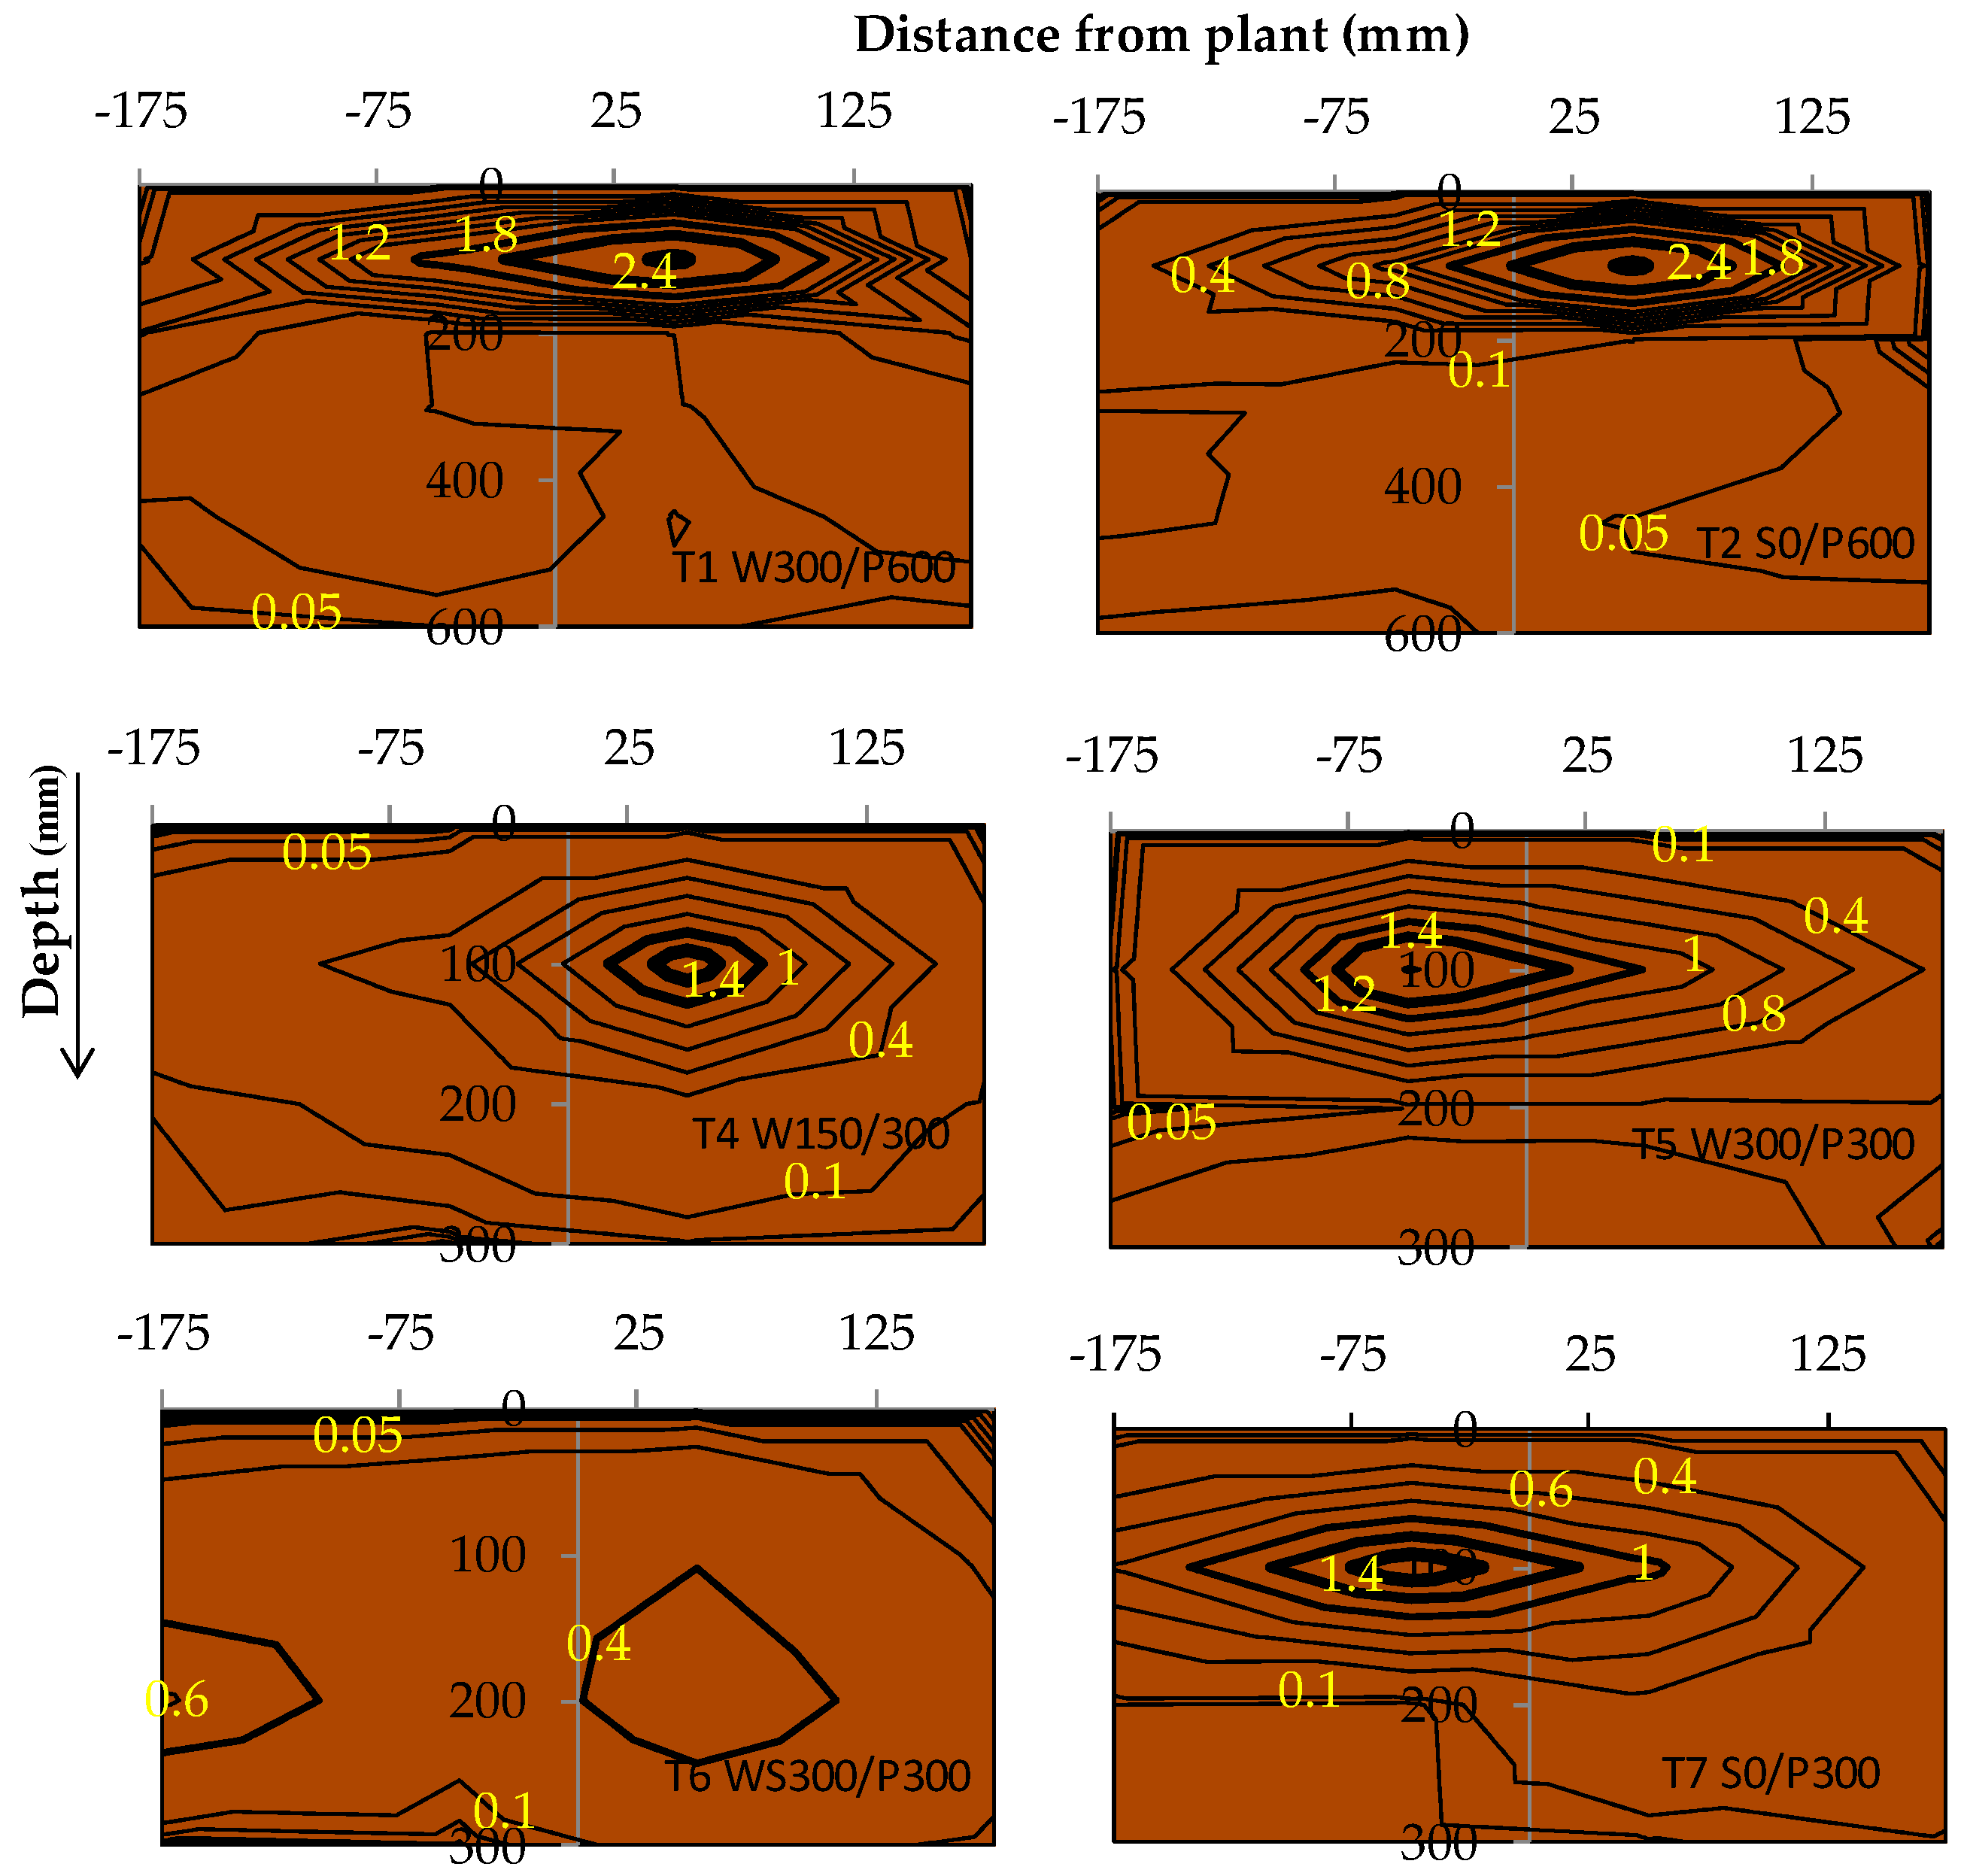
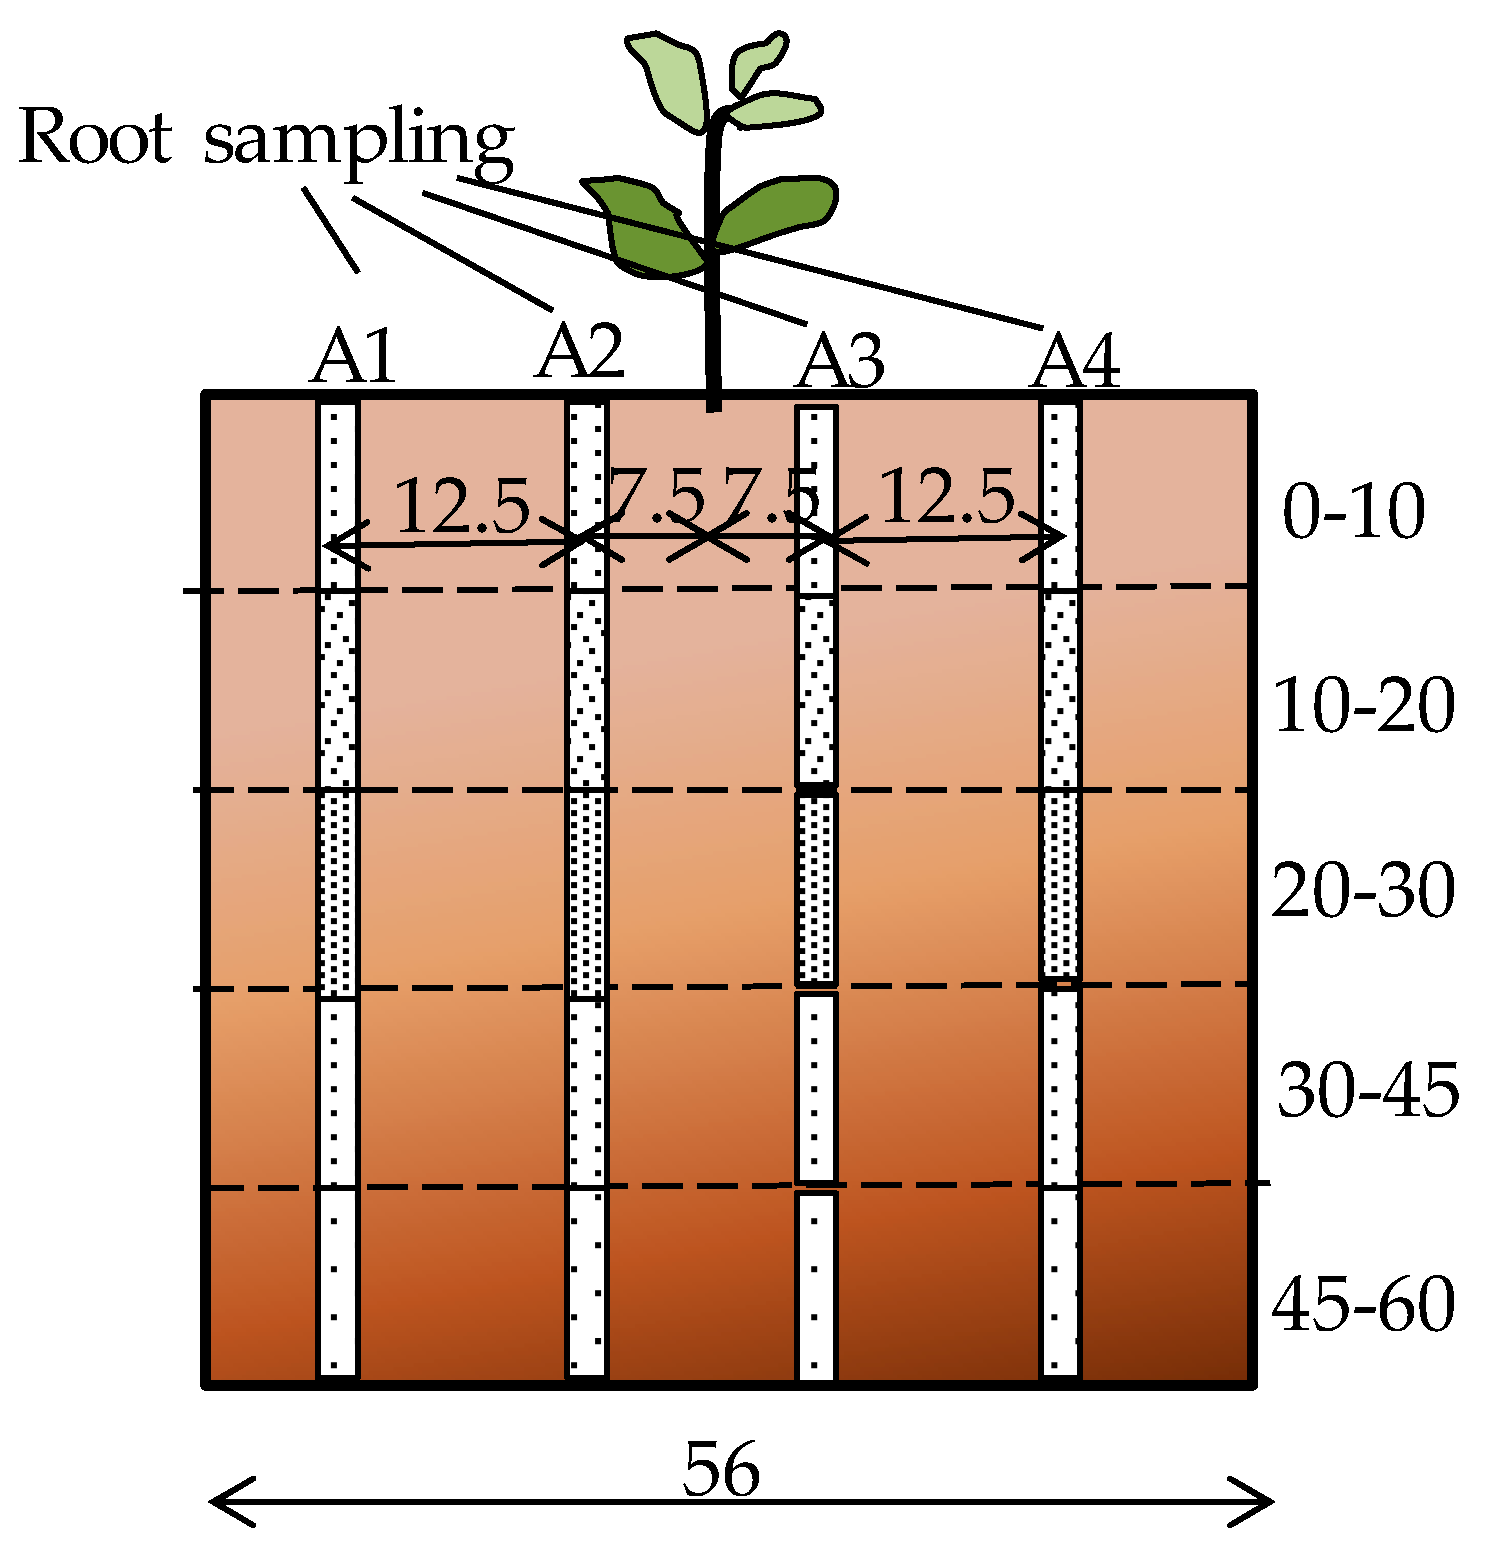
The root distribution pattern of each treatment was investigated at the end of the experiment. Root samples were collected at the end of the cropping period from one representative plant per treatment. Soil cores were extracted using a 6 cm diameter soil auger at three different depths (0–10, 10–20, and 20–30 cm) for 30 cm soil beds and five depths (0 to 10, 10 to 20, 20 to 30, 30 to 45, and 45 to 60 cm) for the 60 cm soil beds. Cores were removed at eight different surface locations, along two perpendicular transects through the middle of the circular pot (Figure 2). Roots were separated from the soil by manually rinsing and sieving using the method of Smit et al. [35]. The root mass contained in each 10 cm soil core was measured with a precision of 10−5 g and used to calculate the root mass density (RMD) (g of root per L of soil). The average RMD in each layer was compared along the soil depth. RMD contour maps were plotted using the online “EZplot®” Excel contour plotting tool [36] to observe the root distribution pattern within the soil bed.

2.6. Statistical Analysis

Statistical analyses were performed using the one-way analysis of variance (One-Way ANOVA) procedure, computed using SPSS version 22 (IBM Corp., New York, NY, USA). The procedure was used to compare treatments with respect to total plant biomass accumulation, fruit yield, ETc and WUE. Dixon’s Q-test was used to decide whether suspected outliers between replicates could be legitimately rejected or not, with a confidence level of 95%. The test of homogeneity of variances was carried out to evaluate the confidence level of accepting the null hypothesis (i.e., variances are equal) and whether the homogeneity of variance assumption had been met. When the F value was statistically significant, Post-hoc multiple comparisons were performed using Fisher’s Least Significant Difference (LSD) test at P ≤ 0.05 to determine if treatment means were significantly different.

3. Results

3.1. Relative Humidity, Air and Soil Temperature

Soil temperature is an important parameter contributing to healthy plant growth. Figure 3 shows the variation in relative humidity (RH), indoor air temperature and soil temperature at 50 and 150 mm depths for 5 consecutive days during the fruit development stage (Stage III). The soil temperatures shown are only for treatments T2 S0/P600 and T5 W300/P300. The soil temperature of each soil depth followed the same trend as indoor air temperature but with a lag of about 4 to 6 h.
The difference in soil temperature between the two treatments was large when the air temperature was high—the wicking treatment T5 had a consistently lower maximum temperature than the surface treatment T2. This is most likely due to the greater thermal mass in the volume of water contained in the reservoir and saturated soil layers of T5. The difference decreased at lower temperatures. In both treatments, the highest soil temperature was typically recorded at 1500 h and the lowest was around 0800 h for the shallow soil bed at a depth of 50 mm. At the 150 mm depth, temperature maxima and minima lagged behind the shallower temperatures by about 2–3 h (Figure 4). The RH varied in the opposite direction to the air temperature, i.e., RH was high at low temperature, and vice versa (Figure 3).

3.2. Effect of Irrigation Treatment on Plant Growth, Yield and Fruit Quality

At 70 DAT, there was no significant difference among treatments for crop height, stem diameter and number of leaves. The crop height ranged from 137.7 ± 16.6 to 146.7 ± 14.6 cm. At the completion of the study period, the total and marketable fruit yields were higher for the WB treatments T4, T5, and T6 than for the surface-irrigated treatment T7, and marketable yield of T6 was greater than T1 and T7, with all other treatments at intermediate values. The highest number of marketable fruits was recorded from the WB treatment with no soil column (T5 W300/P300, 28.3 ± 1.5 fruit) and the lowest was with a surface treatment (T7 S0/P300, 22 ± 3.1 fruit).
The diameter of red, ripe fruit ranged from 22 to 83 mm, and fruit weight ranged from 18 to 249 g across treatments. All WB treatments with the 300 mm soil bed produced more large-sized fruit than the surface treatment with the same soil depth (Figure 5a). Plants in the deep soil pots (600 mm) with surface or wick irrigation did not differ from the other treatments. More small fruit were produced by both surface irrigated treatments than the treatment with wick irrigation and a soil column (T6 WS300/P300). While yields of small and extra-large fruit were considerably lower than yields of large fruit, WB treatments T4, T5, and T6 produced greater marketable yields of large fruit than surface irrigated treatment T7 (Figure 5b). The wicking treatment with 150 mm reservoir depth (T4 W150/P300) produced more extra large fruit and greater marketable yield than wicking treatments T1 W300/P600 and T5 W300/P300 as well as the surface irrigated T7 S0/P300 treatment.
The percentage of unmarketable yield of each treatment was calculated as a proportion of the total harvested yield using the data in Table 1. It varied widely across the treatments, with no discernible pattern. The lowest values were 0.60% ± 0.55% and 1.1% ± 1.9% unmarketable fruit in WBs with a 150 mm reservoir (T4 W150/P300) and wicking with a soil column (T6 WS300/P300), respectively. The wicking treatment with a 300 mm reservoir had 5.2% ± 3.2% rejected fruits, while the deep soil bed (both wicking and surface) had 7.6% ± 6.5 and 9.8% ± 3.8% rejected, respectively. The greatest value was 16.8% ± 7.2% unmarketable fruit for the shallow soil surface treatments (T7 S0/P300).

3.3. Effect of Irrigation Treatment on Water Use Efficiency

Neither WUE or iWUE were significantly different between the WB and surface treatments with 600 mm soil bed depths, T1 and T2, respectively (Table 1). However, there was a significant difference within the 300 mm soil bed depths where both WUE and iWUE were higher in WBs than the surface treatment, T4, T5, and T6 versus T7. The maximum ETc value was by T2 S0/P600, a significantly higher value than all other treatments. The number of irrigation events over the growing period included water added at the surface (to all treatments) during the crop establishment period. Surface treatments needed 40 to 50 irrigation events (watering once every 2 to 3 days), compared with less than 26 for WB treatments (Figure 6). Table 2 compares the plausible water saving by WBs with respect to the corresponding surface treatment. A yield increase of 62 to 73% was obtained for shallow soil WBs, with water use varying from a 6% loss to a 9% savings relative to surface irrigated plots. In contrast, the deeper WBs had a higher water saving (22%), but with an 11% loss of yield; hence, the lack of significant difference in WUE for these treatments.

3.4. Effect of Irrigation Treatments on Fruit and Shoot Dry Matter

The dry weight of fruit, stems, and foliage are presented in Table 3. There was no significant difference in dry stem weight between the treatments. The dry foliage weight of surface treatments (both 300 and 600 mm soil bed depths) was significantly higher than that of WB treatments. However, overall dry biomass accumulation (stem, foliage and fruit) of T2 S0/P600 was significantly greater than T1 W300/P600 and T5W 300/P300. Generally, the higher the water consumption, the higher the biomass and foliage weight. Supporting this, results showed that the total dry biomass weight was linearly related to the amount of water applied in all other treatments (R2 > 0.99, P < 0.05), excluding treatments T1 W300/P600 and T5 W300/P300. The lower foliage or biomass dry weight (in wicking treatments T1W300/600 and T5 W300/P300) may be due to less water availability and uptake by the plant in the former case, and lateral root growth and elongation observed in subsurface layers in the latter case (Figure 5 and Figure 6, discussed later).
The distribution of soil-water content in different layers during the fruit maturity and development stage (Stage IV, 74 to 134 days) is presented in Figure 7. In surface treatments (T2 S0/P600 and T7 S0/P300), a frequent fluctuation of moisture content was observed at the top (0 to 10 cm) layer, as would be expected due to the frequent irrigation events. In WB treatments, the soil water content was more stable and was driest at the top (0 to 10 cm). However, there was no clear pattern among the different WB treatments.
In contrast to the surface treatments, the moisture content increased substantially with depth in the wicking treatments, as may be reasonably expected given that the source of water was at the bottom of the soil. In the second layer (10 to 20 cm), the difference in moisture content among different WB treatments was greater than in the first layer. A high moisture content was recorded for treatment T6 WS300/P300 followed by T5 W300/P300, T4 W150/P300 and T1 W300/P600 (for treatments with plants). The moisture content gradually decreased over time in this layer of the wicking treatments until the reservoir was refilled. For both surface treatments (deep and shallow), the moisture content in this layer corresponded to the lower end of the range of moisture content in the WBs. In WBs, the soil moisture content at the bottom layer was close to saturation, increasing when water was added and drying in the interim.
A vertical distribution of moisture content at the end of the experiment is shown in Figure 8. All treatments had a similar distribution pattern (moisture content increasing with depth). WBs of reservoir depths 150 and 300 mm and the WB with soil column had the same distribution pattern, with the soil column having a marginally (about 2%) higher moisture content. A higher moisture content at the surface level was recorded in the shallow wicking treatment without a plant, possibly due to the lack of interception and uptake of capillary water by roots, allowing more water to reach the surface.

3.5. Root Mass Density

The root mass density (RMD) for each treatment revealed a possible difference in rooting patterns among irrigation treatments (Figure 9). A large concentration of roots was generally found in the top layer (0 to 10 cm), except in treatment T6 WS300/P300. A higher RMD was observed near the surface for surface irrigated compared with WB treatments, with roots decreasing approximately exponentially with the soil depth. A contour plot of RMD across the bed showed that the RMD was preferentially concentrated near the plant and within the top 0 to 20 cm layer (Figure 10). Interestingly, no discernible differences or trends could be observed in RMD between the surface and wicking treatments, except that the wicking bed with soil column exhibited a more uniform, and generally lower, RMD compared to all other treatments. Although these results are therefore inconclusive, previous studies have indicated that a lower RMD was produced when there was more water available [37] near the water table, which may have been the case for the WB with soil column which had a higher water demand.

4. Discussion

The results showed that there was a significant difference between the wicking and surface treatments for total biomass, yield and water use efficiency. The total water use was significantly different between surface and wicking treatments in the two deep soil bed depths (600 mm); however, the difference was not significant between the treatments for the 300 mm soil bed depth or between the two reservoir depths. An average irrigation amount of approximately 122 L/plant was the optimum amount of water for maximizing the WUE for tomatoes in these study conditions. This optimum WUE occurred in the 150 mm reservoir wicking bed (T4 W150/P300). The average amount of water needed per plant was about 0.9 L/plant/day in this WB treatment, depending on the growth stage and the season. In comparison, Snyder [38] recommended about 50 mL/day for newly transplanted crops and 2.7 L/plant/day at maturity on sunny days for glasshouse-grown tomatoes. Water requirements for drip irrigated tomatoes grown in greenhouse conditions in the tropics were reported to range from 0.3 to 0.4 L/plant/day, a figure derived from a pot area of 706.50 cm2, similar to this study [39]. For context, the water requirement for an average field-grown tomato cultivar is 100 to 150 L/plant (a 400 to 600 mm irrigation rate) for a 90 to 120 day growth period (FAO, 2015).
Despite the application of larger irrigation volumes in surface treatments, yield and WUE were significantly greater in wicking treatments. The highest marketable yield of 3.1 kg/plant was obtained in the soil column WB (T6 WS300/300), while the lowest (1.8 kg/plant) occurred in the shallow soil (300 mm) surface irrigated treatment (T7 S0/P300). To place the yields in this experiment in some context, the FAO (2015) stated that a good commercial yield under irrigation was 1.1 to 1.6 kg/plant for field-grown tomatoes, while well-managed greenhouse-grown tomatoes in a soil-free culture should yield 3.3 to 6 kg/plant [40,41].
The deep soil bed wicking treatment (T1 W300/P600) had a lower yield than its corresponding surface treatment, and was also lower than the shallower wicking treatments. The reason for the low yield and WUE in T1 W300/P600 was initially considered to be insufficient supply of water to the root zone, due to the greater height and the resultant difficulty in maintaining water supply to the roots by capillary rise (noting that the amount of capillary water present in soil decreased with distance above the water table). In support of this theory, soil evaporation observed in the unplanted deep wicking treatment (T3 WN300/P600) was low when compared with the 300 mm WB T8 WN300/P300 treatment (Table 1), suggesting that less water was able to reach the surface by capillary rise. However, the ETc in the deep soil WBs was not significantly different from the ETc in the shallower wicking treatments, suggesting that a similar amount of water must have been delivered to the plant, despite the greater soil depth. Although there was about a 22% water reduction in T1 W300/P600 relative to the surface treatment (T2 S0/P600) which had an equivalent soil depth (Table 2), the wicking treatment delivered lower yields and thus failed to produce a significant improvement in WUE. It should be noted that the percentage of unmarketable fruits was lower in WBs compared to surface treatments for the shallow soil plots, but not for the deep soil treatments. On this basis, it is inferred that the use of wicking irrigation to grow tomatoes with a 600 mm soil depth was not effective. This depth of wicking bed may, however, be suitable for deeper rooted plants. It should be noted that the main reason for discarding fruit was blossom end rot. Previous studies have mentioned that insufficient calcium, or either too much or too little water, can cause blossom end rot in tomatoes [38,42]. It is therefore possible that the soil chemistry, the irrigation method, and/or the irrigation volume may have affected the reliability of fruit production in the experiment, and inferences drawn from these results (especially for the shallow 300 mm soil treatments) should be moderated accordingly.
The wicking bed with a soil column had a higher ETc compared to other shallow wicking treatments. However, to compensate, it also had the highest yield, plant height and vegetative mass. Studies have shown that water moves upward slowly and over long distances in fine textured soils, but not so for coarse grained soils [43]. This may provide a plausible explanation for the improved performance as the soil column in the reservoir potentially carried more capillary water to the soil surface by maintaining a connection of saturated soil, thus allowing plants to consume more water than other treatments. This may be the reason for higher yield, plant vegetative mass, and water consumption (Table 1 and Table 2). The yield was highest in T6 WS300/P300 but, perhaps due to the increased vegetative mass, the WUE was not as high as the other wicking treatments. However, there was no significant difference in the crop water use with respect to yield among shallow WBs. As such, a wicking bed with a soil column would appear to be a better option for areas where there is little concern about water availability (Table 1). Nevertheless, we may expect a better result by optimizing this system design further. For example, changes could be made to the size of the soil column, the frequency of irrigation events or by the application of mulch to the soil surface.
There was no significant difference in WUE between the 150 mm and 300 mm reservoir depths. This finding has implications for design of cost-effective wicking beds, i.e., there was little gain from a deeper reservoir. Based on having a smaller reservoir depth and achieving an equal maximum WUE, treatment T4 W150/P300 may be considered the most economically efficient wicking bed system tested in this study. Overall, shallow wicking treatments were the more favourable treatments in terms of WUE and yield. This may be related to the relatively shallow (medium) rooting depth of tomatoes.
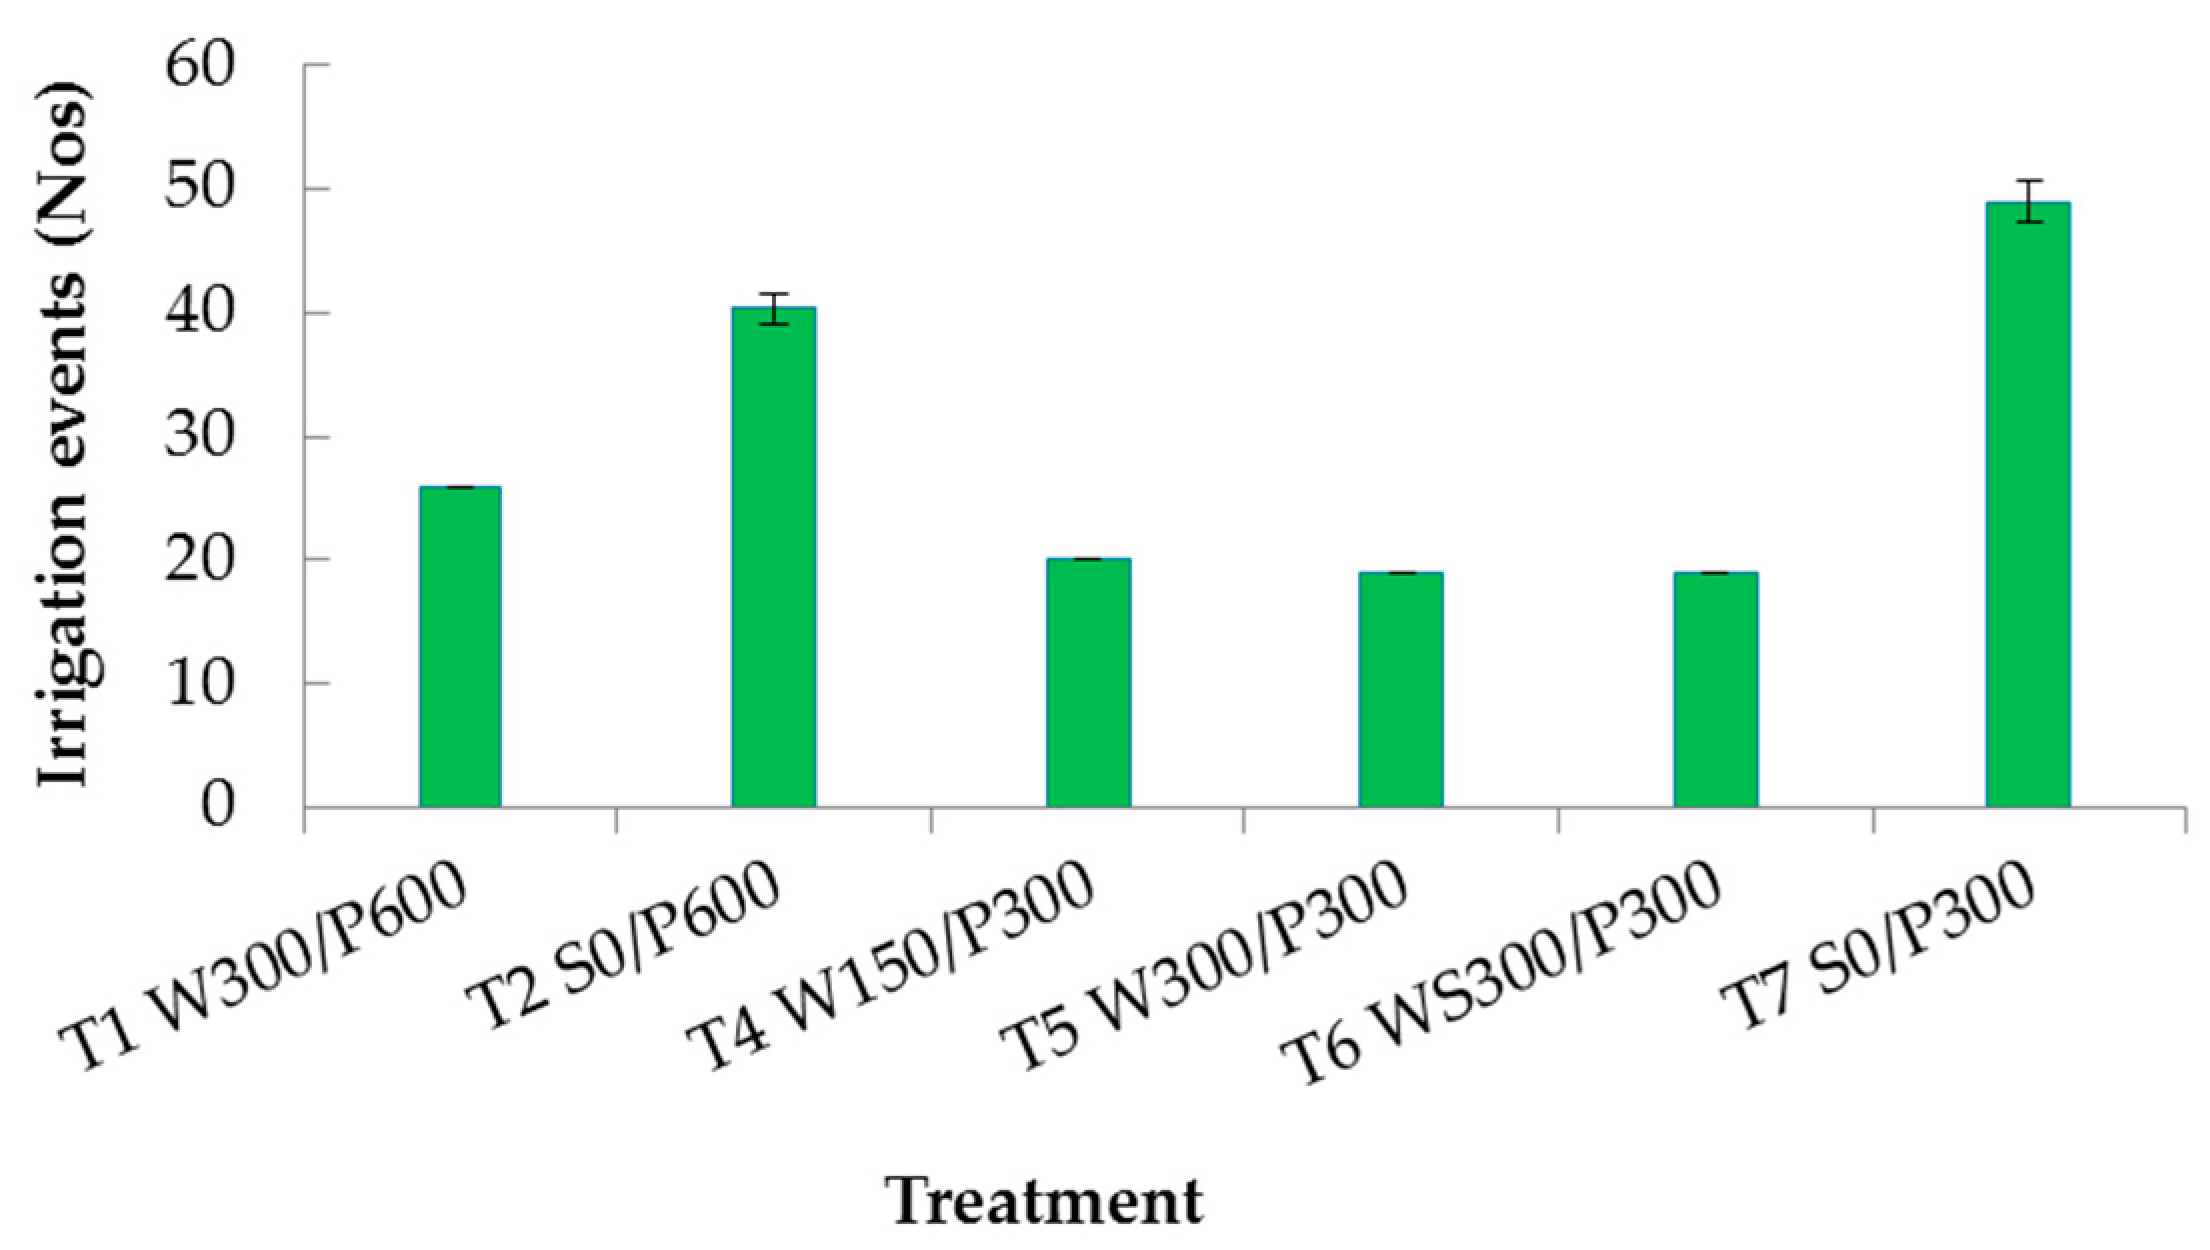
The labour efficiency of each treatment was evaluated by counting number of irrigation events over the growing period of each replicate and averaged. Surface treatments needed frequent watering at approximately 3 day intervals. In contrast, the wicking treatment pots lasted up to 4 weeks without watering during the developing stage (after the initial two weeks of surface watering to establish the plant), and from 1 to 2 weeks during the maturity stage. These results indicated that WBs reduced manual watering requirements. Most importantly, the WBs eliminated the problem of deciding when and how much water to irrigate. Efficient surface irrigation depended on precise soil moisture measurements and water balance calculations which may not be available to non-commercial growers. In practice, of course, the extent of the labour-savings will depend on the size of the pot, soil bed height and reservoir volume, and the type of crop or root behaviour of the plant selected.
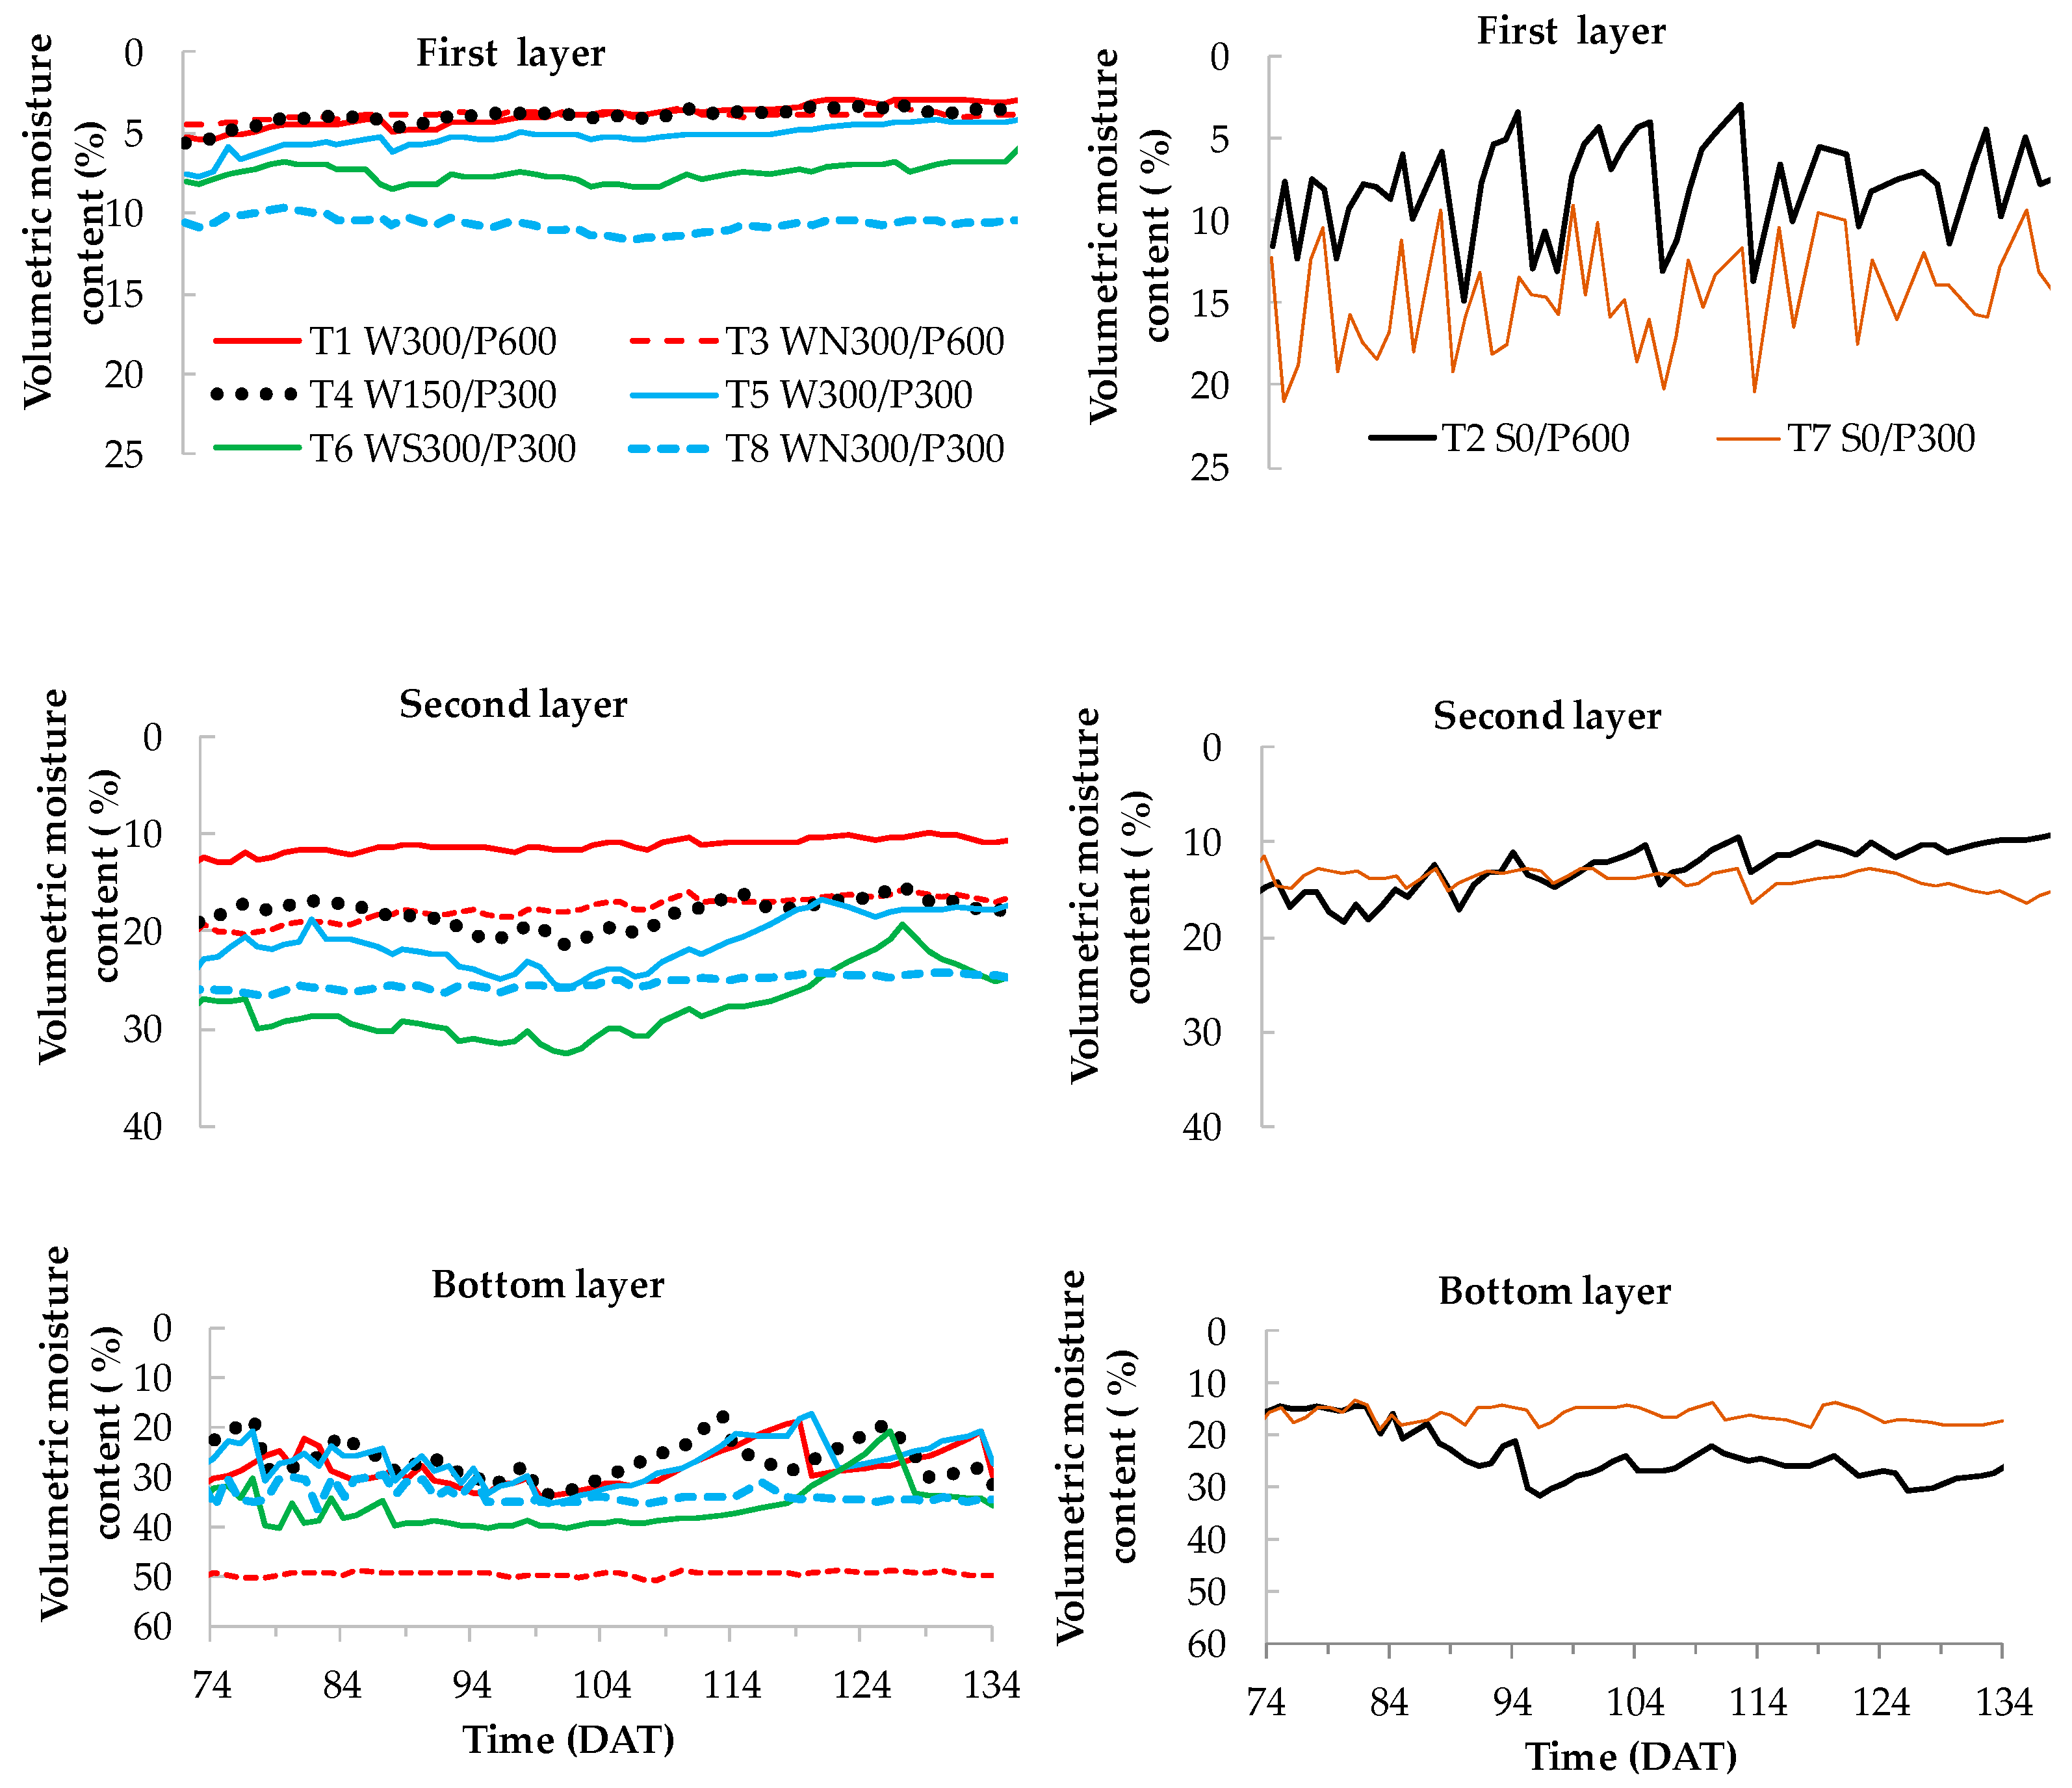
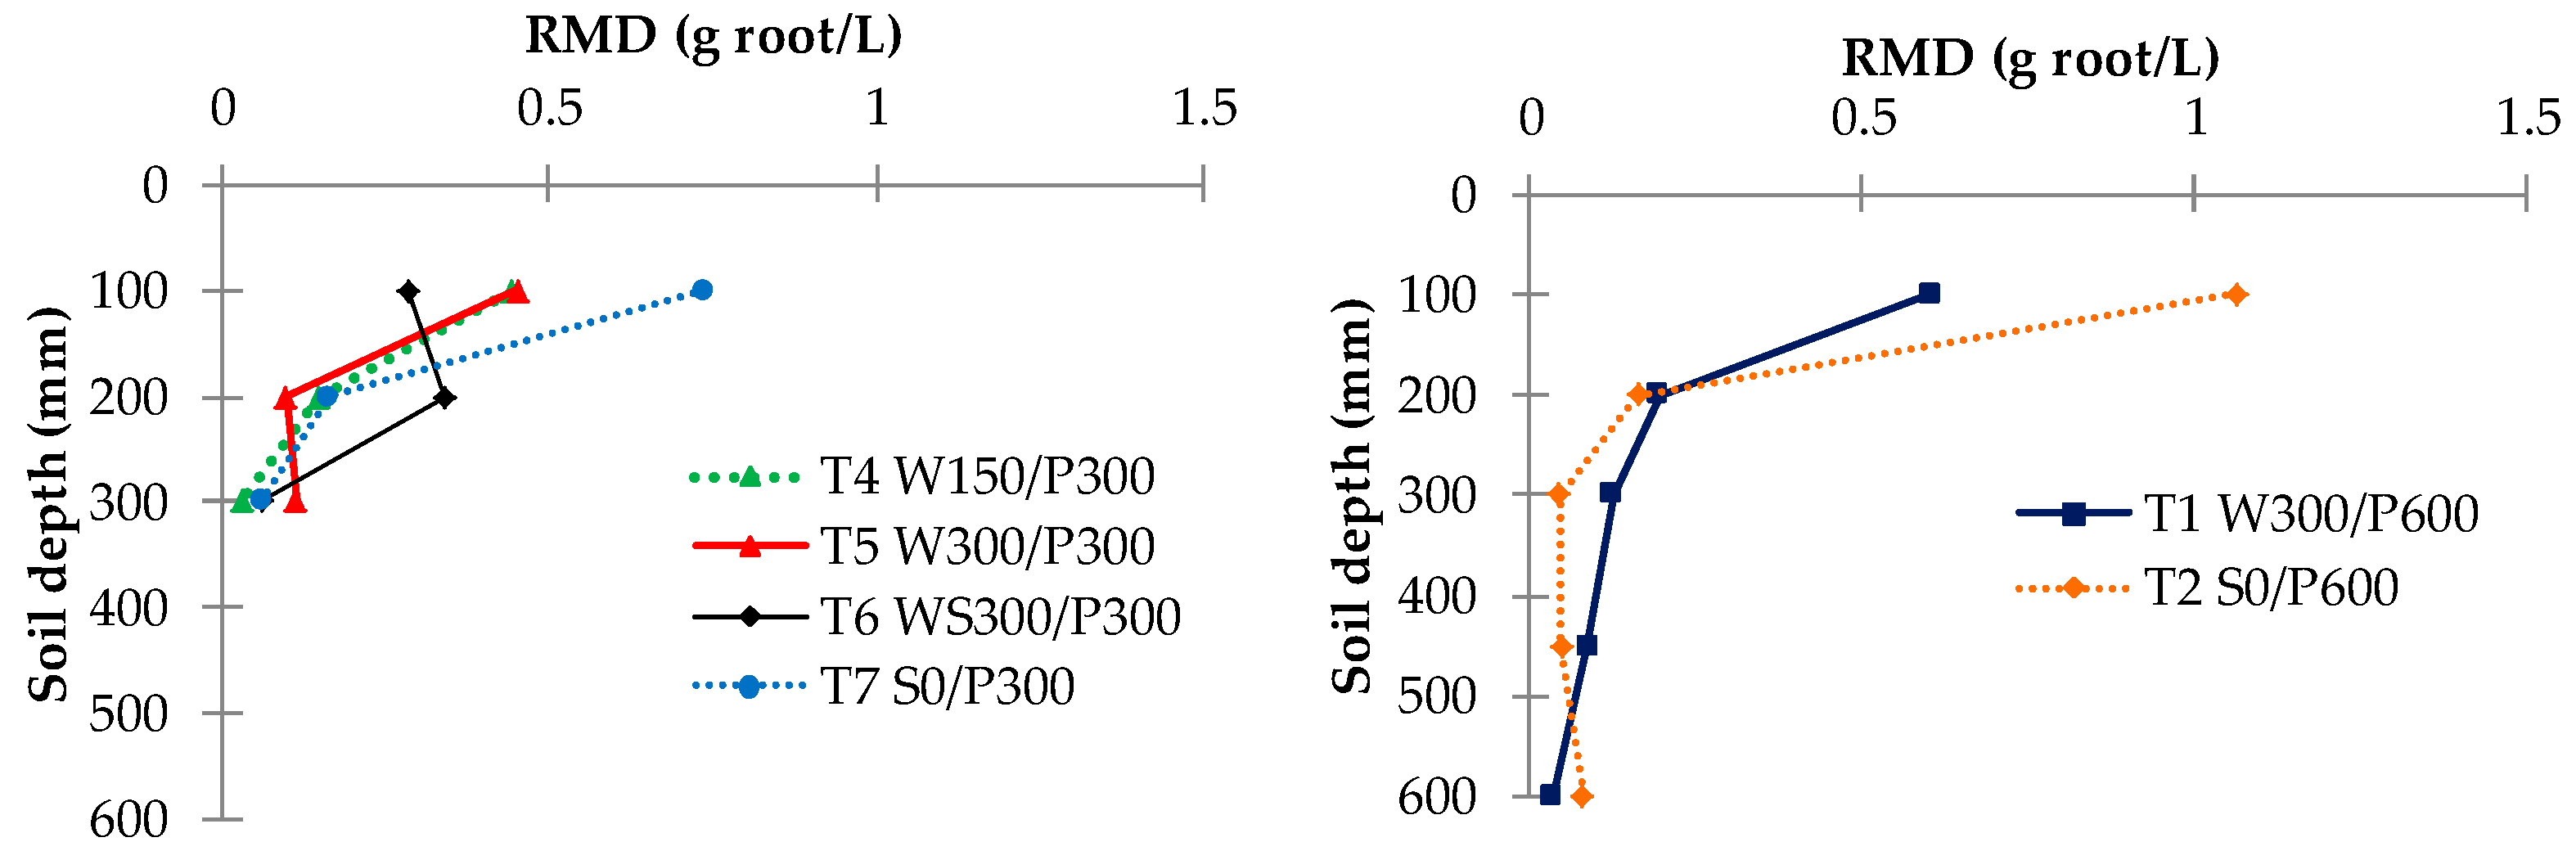
The low soil moisture content in the top layer of all replicates was likely due to increased water evaporation from the soil surface along with transpiration, as the root density was highest at the upper soil layer (Figure 9 and Figure 10). Moreover, the moisture content in the upper layer was higher in the treatment with no plants than that of corresponding plant treatments (Figure 7). This suggests that transpiration was responsible for a significant amount of moisture depletion in the soil, and that the combined effect of evaporation and transpiration was responsible for lowering the moisture content in the soil.
A regular pattern of soil moisture content distribution was observed in wicking treatments without plants (T3 WN300/P600 and T8 WN300/P300) (Figure 7). The total water consumption of these pots may be assumed to be due to soil water evaporation. Soil moisture content of the first and second layer of treatment T3 WN300/P600 was always lower than that of treatment T8 WN300/P300. This was likely due to a decrease in matric potential (i.e., becoming more negative) when the soil bed depth increased (600 mm as opposed to 300 mm). Interestingly, this also led to reduced surface water evaporation (Table 1), as the evaporating water was likely not be replaced as quickly through the taller soil beds. As such, the bottom layer of treatment T3 WN300/P600 held a maximum moisture content, which was similar to the saturated moisture content of the soil.
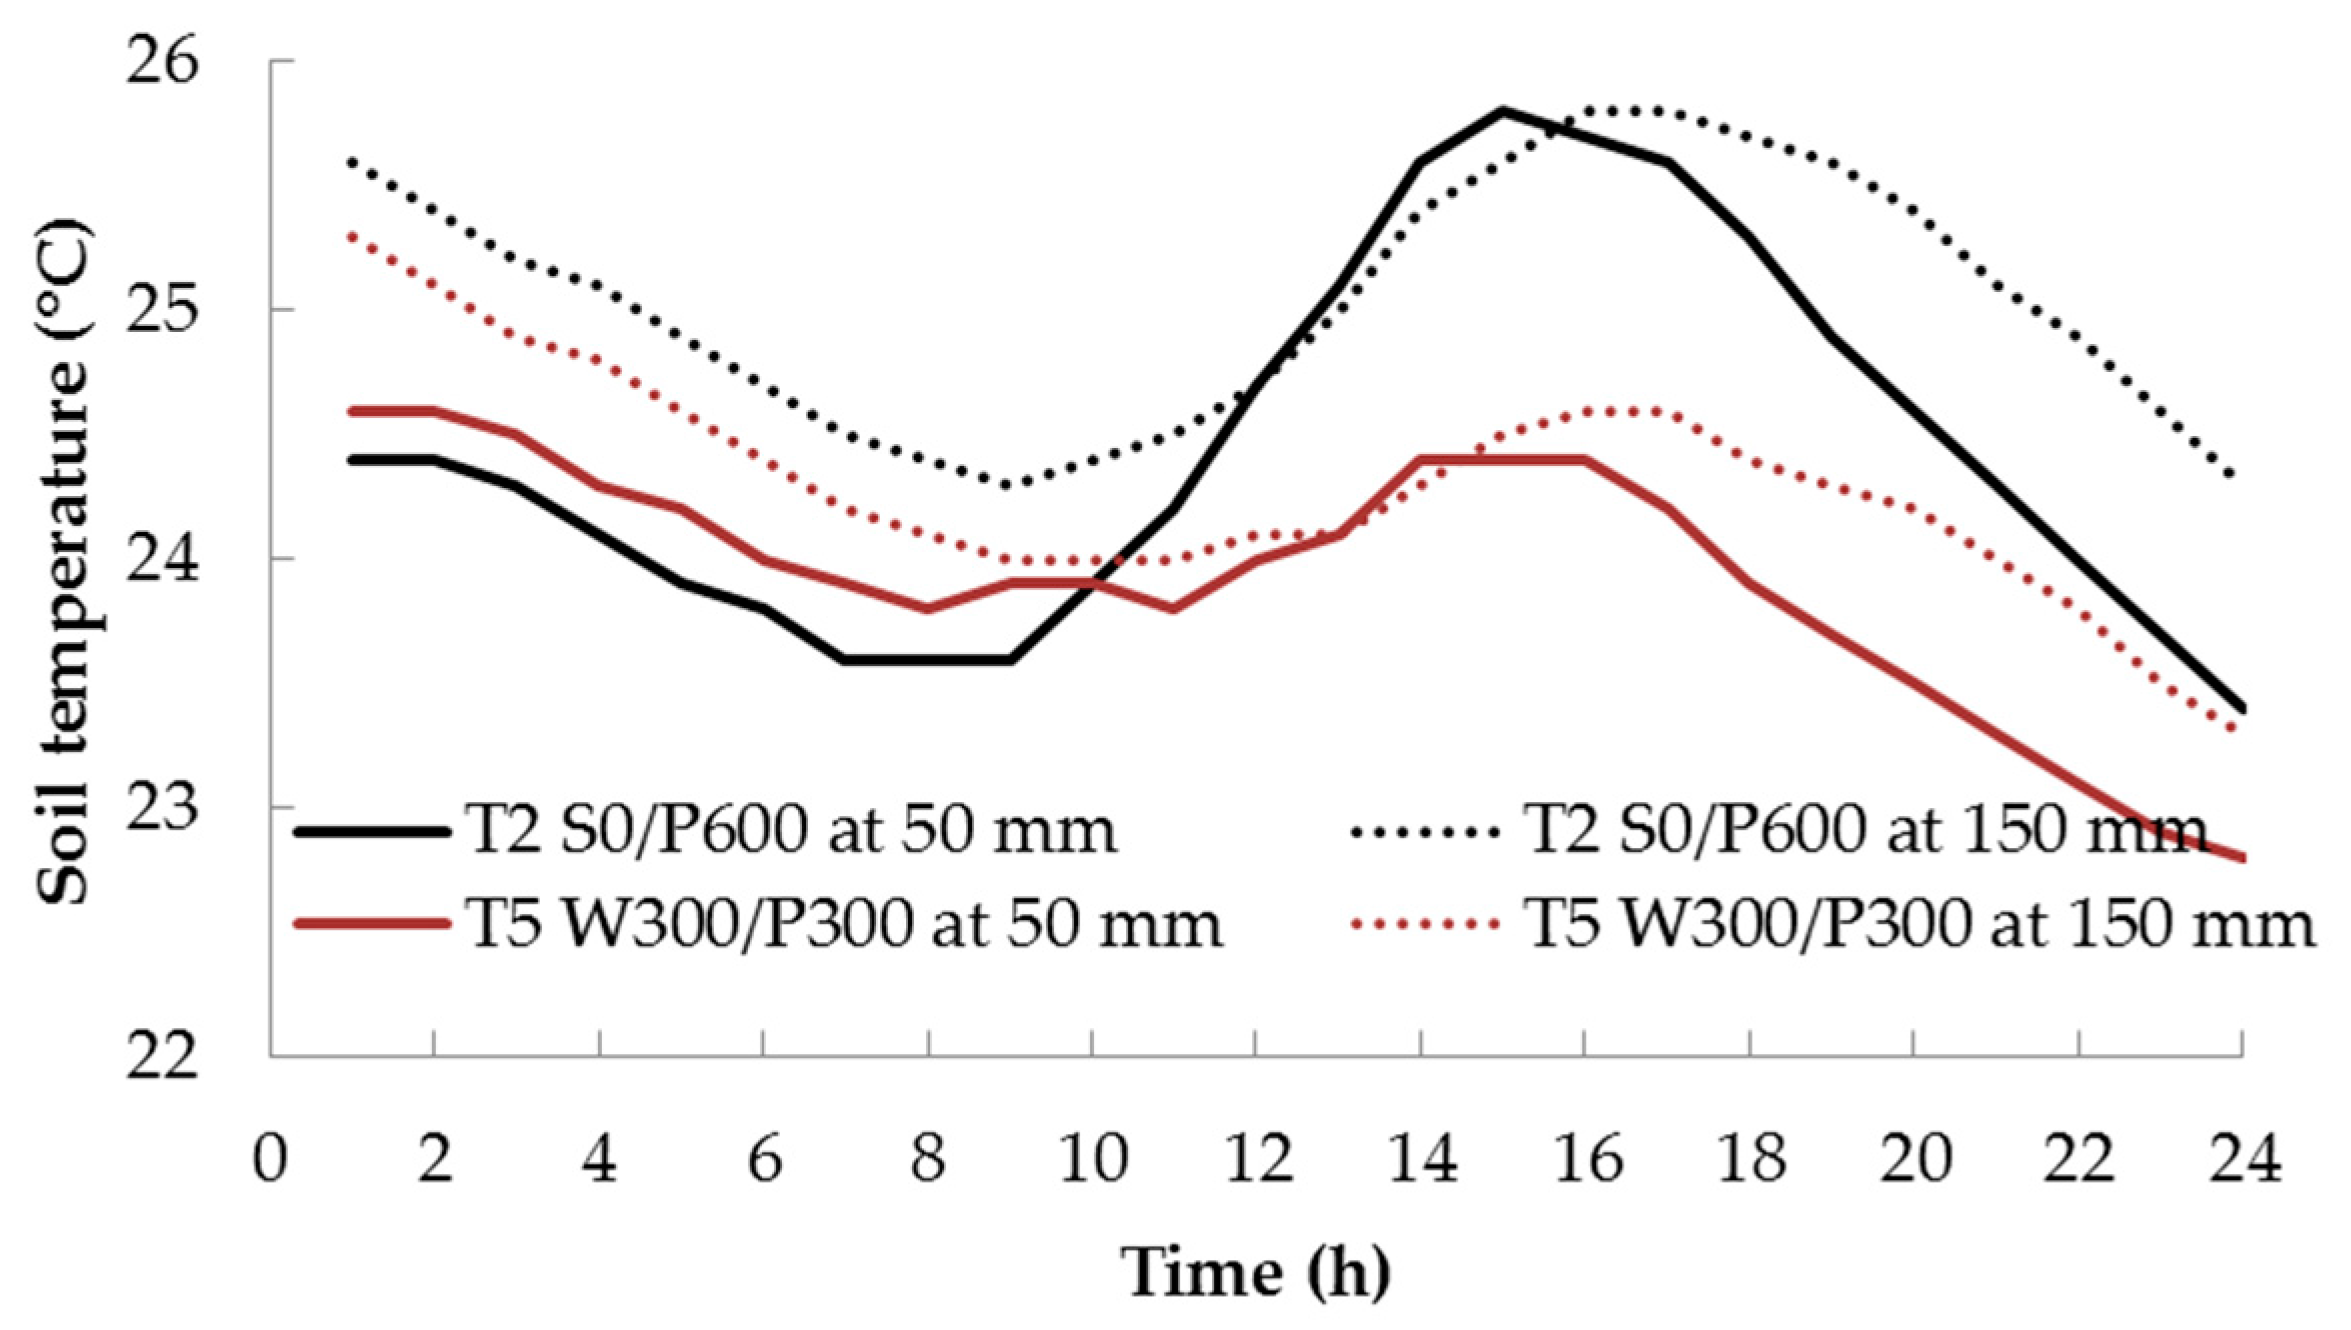
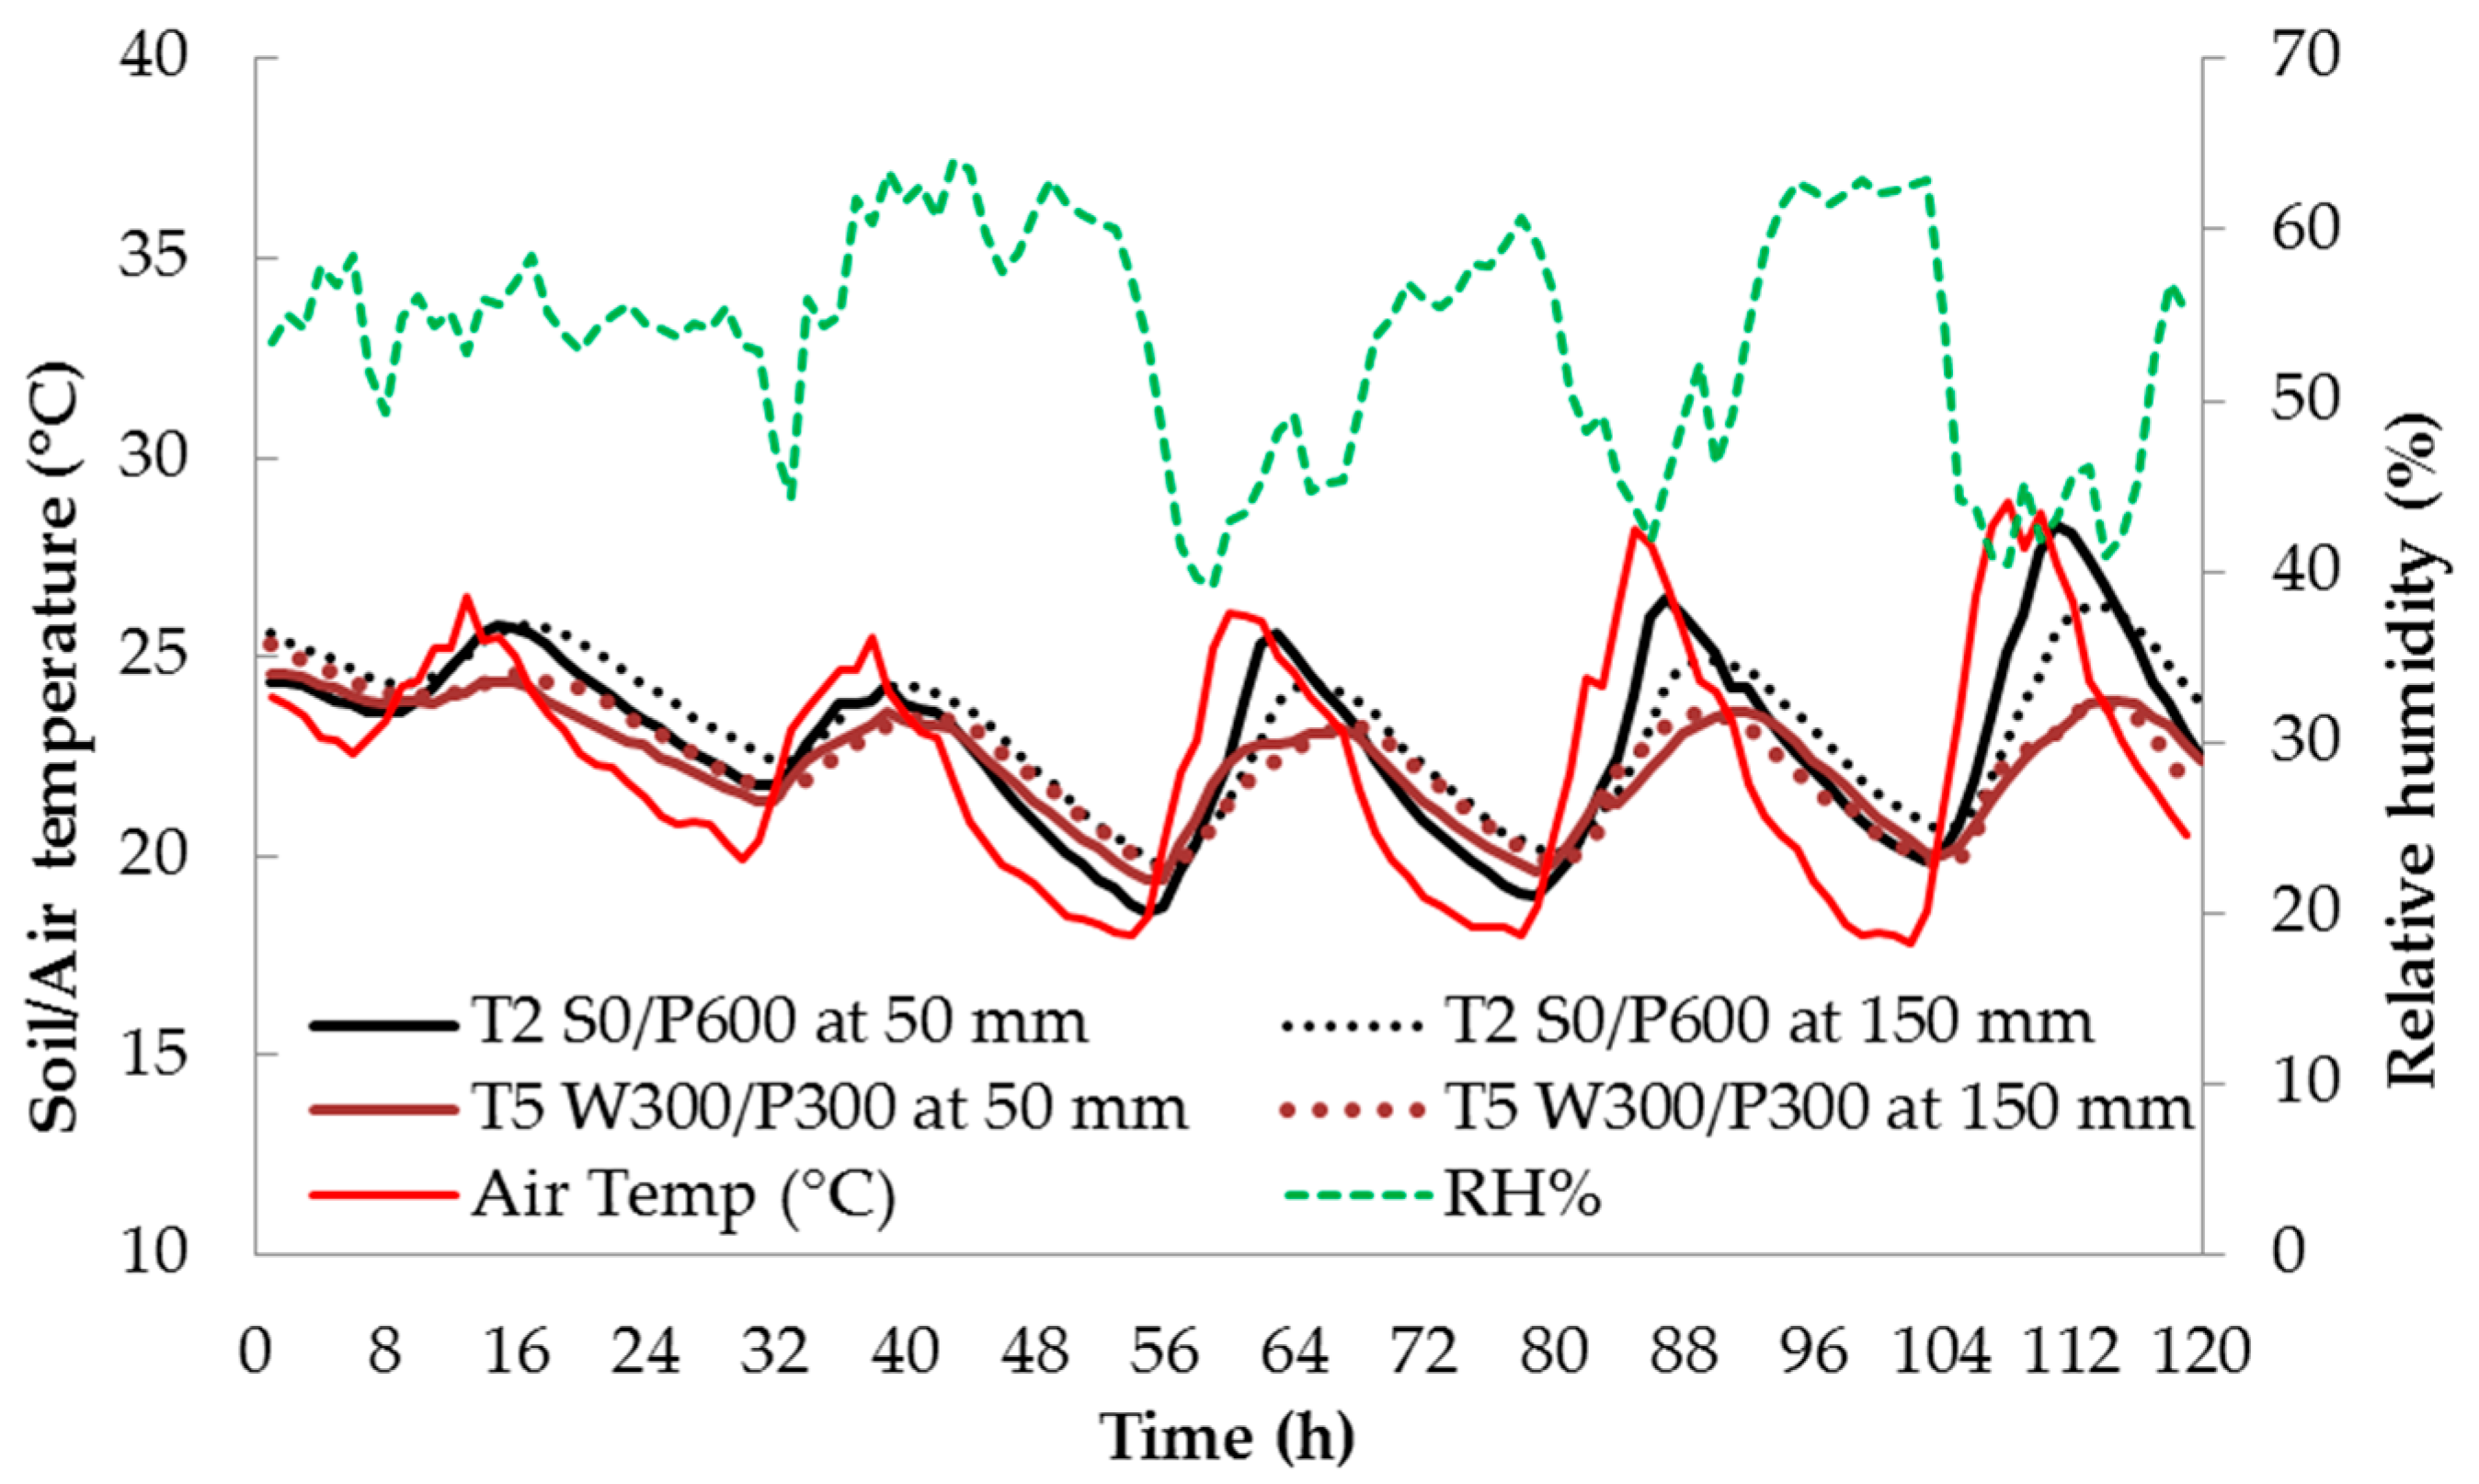
The surface layer accumulates heat more during the day due to solar radiation than the underlying layer, resulting in a temperature gradient in the soil [44]. The soil temperature was always greater in T2 S0/600 than in the T5 W300/300 at high temperatures. The frequent application of water in the surface treatment increased the soil moisture content in the upper layer compared to the wicking treatment. Counterintuitively, the higher moisture content in the top layer of surface treatments may be the reason for the higher temperature, due to an increase in the thermal conductivity and diffusivity of wet soil [44,45,46]. Roots survive and grow where adequate water, temperature and oxygen are present [47]. The observed maximum RMD in the second layer of treatment T6 WS300/P300 may have been due to sufficient moisture content and other suitable growing conditions (Figure 9). The moisture content was very high (approaching saturation) at the bottom layer of wicking treatments, and as such, high moisture content may have lowered the amount of oxygen trapped in the soil and restricted root growth. As such, the unfavourable environment may have lead the root system to develop horizontally rather than vertically [48].
It is understood that container-grown plants have different root growth patterns compared to field-grown crops. For instance, where a container restricts roots, this may result in fewer primary roots and an increase in lateral roots [49,50]. The large diameter of the pot may have produced a high concentration of lateral rather than vertical roots, in which case a different root pattern may occur if smaller diameter pots were used. It is also noteworthy that there is a potential for salt accumulation at the surface of wicking beds, a phenomenon which has been previously noted in sub-irrigated systems. Follow-up research is being undertaken to determine if this occurs in WBs.

5. Conclusions

Wicking beds (WBs) have been widely promoted and adopted as an efficient irrigation system for urban agriculture. However, there has been little published research to support popular claims about the effectiveness of WBs. This study rigorously tested the performance of WBs relative to best-practice, precision surface irrigation systems in terms of total water use, marketable yield, fruit quality, water use efficiency (WUE) and irrigation frequency. The suitability of WBs for growing tomatoes was compared using two soil bed depths (300 vs. 600 mm), two reservoir depths (150 vs. 300 mm), and introduced a soil column in the reservoir to improve wicking. The WB with a 150 mm reservoir and 300 mm soil bed was the most effective of all treatments tested, as it was cost-effective (requiring minimal material) with a high WUE.
Overall, the results of this study indicated that WBs matched (or exceeded) WUE and yield achieved with best-practice surface irrigation, and offered a potentially substantial labour saving for gardeners. Moreover, given that surface irrigation in urban agriculture is likely to fall well short of the precision irrigation method used for comparison in this study, the relative WUE improvement of WBs in practice is probably greater. As WBs can be made out of recycled (and recyclable) material, they may be a low-tech and low-cost system. This study therefore provides a much-needed scientific basis for the widespread adoption of WBs in urban agriculture.
There are opportunities to further improve the system to provide more benefit to cities, not only for saving water in gardens, but ultimately to help facilitate the other benefits of urban food production. For example, they may also provide an interesting glasshouse model for smaller-scale commercial producers. There is a possibility to connect multiple WB pots in series and parallel for glasshouse settings. The reservoir can be filled manually or automatically, making it even more practical. However, sustainable irrigation practices will always be site specific, which depends on local climate, soil, topography, and the quality of water. One limitation of this trial is that this is a single site and a single season. Further studies are intended to improve our understanding of the effectiveness of the WB irrigation system for different crop types and environmental settings, as well as soil salinity and sodicity with the use of recycled wastewater.

Acknowledgments

The authors would like to acknowledge that this research was conducted with the assistance of an Australian Government Endeavour Awards Scholarship. Funding was also provided by the Goyder Institute for Water Research, a partnership between the South Australian Government through the Department of Environment, Water and Natural Resources, CSIRO, Flinders University, the University of Adelaide, and the University of South Australia.

Author Contributions

N.P.K.S., J.D.W. and B.R.M. conceived and designed the experiments; N.P.K.S. performed the experiments and analysed the data; J.D.W. and B.R.M. contributed to the analysis process; N.P.K.S. wrote the paper; J.D.W. and B.R.M. contributed to the manuscript.

Conflicts of Interest

The authors declare no conflict of interest.

References

  1. Kadenyeka, M.V.; Omutimba, D.; Harriet, N. Urban agriculture livlihoods and household food security: A case of Eldoret, Kenya. J. Agric. Biol. Sci. 2013, 8, 90–96. [Google Scholar]
  2. Cameron, R.W.F.; Blanuša, T.; Taylor, J.E.; Salisbury, A.; Halstead, A.J.; Henricot, B.; Thompson, K. The domestic garden—Its contribution to urban green infrastructure. Urban For. Urban Green. 2012, 11, 129–137. [Google Scholar] [CrossRef]
  3. Grewal, S.S.; Grewal, P.S. Can cities become self-reliant in food? Cities 2012, 29, 1–11. [Google Scholar] [CrossRef]
  4. Gibbons, S.; Mourato, S.; Resende, G.M. The amenity value of English nature: A hedonic price approach. Environ. Resour. Econ. 2014, 57, 175–196. [Google Scholar] [CrossRef] [Green Version]
  5. The Australia Institute. Grow Your Own: The Potential Value and Impacts of Residential and Community Food Gardening; The Australia Institute: Canberra, Australia, 2014. [Google Scholar]
  6. Goldstein, M.; Bellis, J.; Morse, S.; Myers, A.; Ura, E. Urban Agriculture: A Sixteen City Survey of Urban Agriculture Practices across the Country; Turner Environmental Law Clinic: Atlanta, GA, USA, 2011. [Google Scholar]
  7. Lovell, S.T. Multifunctional urban agriculture for sustainable land use planning in the United States. Sustainability 2010, 2, 2499–2522. [Google Scholar] [CrossRef]
  8. Forget, G. Balancing the need for pesticides with the risk to human health. In Impact of Pesticide Use on Health in Developing Countries; Forget, G., Goodman, T., de Villiers, A., Eds.; International Development Resesrch Centre: Ottawa, ON, Canada, 1990. [Google Scholar]
  9. Pimentel, D.; Culliney, T.W.; Bashore, T. Public Health Risks Associated with Pesticides and Natural Toxins in Foods. Available online: http://ipmworld.umn.edu/pimentel-public-health (accessed on 25 June 2016).
  10. Breuste, J.H.; Artmann, M. Allotment gardens contribute to urban ecosystem service: Case study Salzburg, Austria. J. Urban Plan. Dev. 2014. [Google Scholar] [CrossRef]
  11. Taylor, J.R.; Lovell, S.T. Urban home gardens in the global north: A mixed methods study of ethnic and migrant home gardens in Chicago, IL. Renew. Agric. Food Syst. 2015, 30, 22–32. [Google Scholar] [CrossRef]
  12. Poulsen, M.N.; McNab, P.R.; Clayton, M.L.; Neff, R.A. A systematic review of urban agriculture and food security impacts in low-income countries. Food Policy 2015, 55, 131–146. [Google Scholar] [CrossRef]
  13. Prime Minister’s Science, Engineering and Innovation Council (PMSEIC). Recycling Water for Our Cities; Prime Minister’s Science, Engineering and Innovation Council (PMSEIC): Canbera, Australia, 2003; p. 44.
  14. Dima, S.J.; Ogunmokun, A.A.; Nantanga, T. The Status of Urban and Peri-Urban Agriculture in Windhoek and Oshakati; Food and Agriculture Organisation (FAO): Windhoek, Nambia, 2002. [Google Scholar]
  15. Ward, J.D.; Ward, P.J.; Saint, C.P.; Mantzioris, E. The urban agriculture revolution: Implications for water use in cities. J. Aust. Water Assoc. 2014, 41, 69–74. [Google Scholar]
  16. Levidow, L.; Zaccaria, D.; Maia, R.; Vivas, E.; Todorovic, M.; Scardigno, A. Improving water-efficient irrigation: Prospects and difficulties of innovative practices. Agric. Water Manag. 2014, 146, 84–94. [Google Scholar] [CrossRef]
  17. Liu, F. Irrigation strategies for sustainable environmental and influence on human health. In Encyclopedia of Environmental Health; Nriagu, J.O., Ed.; Elsevier: Burlington, NY, USA, 2011; pp. 297–303. [Google Scholar]
  18. Russo, T.; Alfredo, K.; Fisher, J. Sustainable water management in urban, agricultural, and natural systems. Water 2014, 6, 3934–3956. [Google Scholar] [CrossRef]
  19. Jones, K.S.; Costello, L.R. Irrigating the Home Landscape; University of California Cooperative: Half Moon Bay, CA, USA, 2003. [Google Scholar]
  20. Peters, T. Drip Irrigation for the Yard and Garden; Washington State University: Pullman, WA, USA, 2011; p. 7. [Google Scholar]
  21. Hayden, L.; Cadenasso, M.L.; Haver, D.; Oki, L.R. Residential landscape aesthetics and water conservation best management practices: Homeowner perceptions and preferences. Landsc. Urban Plan. 2015, 144, 1–9. [Google Scholar] [CrossRef]
  22. Langellotto, G.A. What Are the Economic Costs and Benefits of Home Vegetable gardens? Available online: http://www.joe.org/joe/2014april/rb5.php (accessed on 2 June 2016).
  23. Kessler, R. Urban gardening: Managing the risks of contaminated soil. Environ. Health Perspect. 2013. [Google Scholar] [CrossRef] [PubMed]
  24. Sullivan, C.; Hallaran, T.; Sogorka, G.; Weinkle, K. An evaluation of conventional and subirrigated planters for urban agriculture: Supporting evidence. Renew. Agric. Food Syst. 2015, 30, 55–63. [Google Scholar] [CrossRef]
  25. Kirkham, M.; Gabriels, D. Water and nutrient uptake of wick-grown plants. Hortic. Res. 1979, 19, 3–13. [Google Scholar]
  26. Schuch, U.K.; Kelly, J.J. Capillary mats for irrigating plants in the retail nursery—And saving water. Southwest Hortic. 2006, 23, 24–25. [Google Scholar]
  27. Austin, C. Wicking Bed—A New Technology for Adapting to Climate Change. Available online: http://www.waterright.com.au/ (accessed on 20 October 2015).
  28. ModBOX © Modbox Raised Garden Beds. Available online: http://www.modbox.com.au/wicking-garden-beds/ (accessed on 10 June 2016).
  29. Lane, K.S.; Washburn, D.E. Capillarity tests by capillarimeter and by soil filled tubes. In Highway Research Board Proceedings; Highway Research Board: Washington, DC, USA, 1947; Volume 26, pp. 460–473. [Google Scholar]
  30. Li, X.; Zhang, L.M.; Fredlund, D.G. Wetting front advancing column test for measuring unsaturated hydraulic conductivity. Can. Geotech. J. 2009, 46, 1431–1445. [Google Scholar] [CrossRef]
  31. Sentek Pty Ltd. User Guide: Diviner 2000, version 1.2; Sentek Pty Ltd.: Stepney, South Australia, Australia, 2003; p. 66. [Google Scholar]
  32. Peet, M.; Welles, G. Greenhouse tomato production. In Tomatoes (Crop production science in Horticulture); Heuvelink, E., Ed.; CAB International: Oxfordshire, UK, 2005; pp. 257–304. [Google Scholar]
  33. Saha, U.K.; Papadopoulos, A.P.; Hao, X.; Khosla, S. Irrigation strategies for greenhouse tomato production on rockwool. HortScience 2008, 43, 484–493. [Google Scholar]
  34. Abuarab, M.; Mostafa, E.; Ibrahim, M. Effect of air injection under subsurface drip irrigation on yield and water use efficiency of corn in a sandy clay loam soil. J. Adv. Res. 2013, 4, 493–499. [Google Scholar] [CrossRef] [PubMed]
  35. Smit, A.L.; Bengough, A.G.; Engels, C.; Noordwijk, M.; Pellerin, S.; Geijn, S.C. Root Methods: A Handbook; Springer: Berlin/Heidelberg, Germany, 2000; pp. 177–182. [Google Scholar]
  36. Office Expander EZplot for Excel. Available online: http://www.officeexpander.com/ (accessed on 12 July 2015).
  37. Sorenson, S.K.; Dileanis, P.D.; Branson, F.A. Soil Water and Vegetation Responses to Precipitation and Changes in Depth to Ground Water in Owens Valley, California; United States Geological Survey Water-Supply (USGPO): Washington, DC, USA, 1991.
  38. Snyder, R.G. Greenhouse Tomato Handbook; Mississippi State University: Starkville, MS, USA, 2010. [Google Scholar]
  39. Salokhe, V.; Babel, M.; Tantau, H. Water requirement of drip irrigated tomatoes grown in greenhouse in tropical environment. Agric. Water Manag. 2005, 71, 225–242. [Google Scholar]
  40. Maboko, M.; Du Plooy, C.; Bertling, I. Comparative performance of tomato cultivars cultivated in two hydroponic production systems. S. Afr. J. Plant Soil 2011, 28, 97–102. [Google Scholar] [CrossRef]
  41. Rodriguez, J.C.; Cantliffe, D.J.; Shaw, N. Performance of greenhouse tomato cultivars grown in soilless culture in North Central Florida. Proc. Fla. State Hortic. Soc. 2001, 114, 303–306. [Google Scholar]
  42. Whiting, D.; O’Meara, C.; Wilson, C. Water Conservation in the Vegetable Garden; Colorado State University: Fort Collins, CO, USA, 2015. [Google Scholar]
  43. Kuo, J. Practical Design Calculations for Groundwater and Soil Remediation, 2nd ed.; Taylor and Francis: Hoboken, NJ, USA, 2014. [Google Scholar]
  44. Chacko, T.P.; Renuka, G. Temperature mapping, thermal diffusivity and subsoil heat flux at Kariavattom of Kerala. J. Earth Syst. Sci. 2002, 111, 79–85. [Google Scholar] [CrossRef]
  45. Ismail, S.M.; Ozawa, K.; Khondaker, N.A. Influence of single and multiple water application timings on yield and water use efficiency in tomato (var. First Power). Agric. Water Manag. 2008, 95, 116–122. [Google Scholar] [CrossRef]
  46. Roxy, M.S.; Sumithranand, V.B.; Renuka, G. Estimation of soil moisture and its effect on soil thermal characteristics at Astronomical Observatory, Thiruvananthapuram, South Kerala. J. Earth Syst. Sci. 2014, 123, 1793–1807. [Google Scholar] [CrossRef]
  47. Phillips, L. Read about Root Development. Available online: http://gibneyce.com/1-read-about-root-development.html (accessed on 15 July 2015).
  48. Stokes, A. The Supporting Roots of Trees and Woody Plants: Form, Function and Physiology; Springer: Dordrecht, The Netherlands, 2000. [Google Scholar]
  49. Nesmith, D.S.; Duval, J.R. The effect of container size. HortTechnology 1998, 8, 495–498. [Google Scholar]
  50. Peterson, T.A.; Reinsel, M.D.; Krizek, D.T. Tomato (Lycopersicon esculentum mill, cv. “Better Bush”) plant response to root restriction. J. Exp. Bot. 1991, 42, 1233–1240. [Google Scholar] [CrossRef]
Figure 1. Treatment types and identification labels. The numbers following a letter for each irrigation method treatment indicate the depth of soil (P) or reservoir (W) in mm. S indicates surface irrigation.
Horticulturae 02 00013 g001
Figure 2. Root sampling diagram (all dimensions in cm).
Horticulturae 02 00013 g002
Figure 3. Daily relative humidity (%), indoor air temperature (°C) and soil temperature at 50 mm and 150 mm depth for five consecutive days in the fruit development stage (Stage III). See Figure 1 for treatment descriptions.
Horticulturae 02 00013 g003
Figure 4. Diurnal variation of soil temperature 48 days after transplanting for surface (T2) and wicking (T5) treatments. See Figure 1 for treatment descriptions.
Horticulturae 02 00013 g004
Figure 5. Number (a) and yield (b) of small, large and extra-large marketable tomato fruit as influenced by irrigation treatments. Columns within a group with different lower case letters are significantly different (P ≤ 0.05, LSD). W = wicking bed; S = surface irrigation; WS = wicking bed with soil column; WN = wicking bed without plant; P = soil bed. The numbers following a letter for each treatment indicate the depth of reservoir (W) and soil (P), respectively, in mm.
Horticulturae 02 00013 g005
Figure 6. Histogram of average total number of irrigation events throughout the experimental period. Vertical bars indicate standard error. W = wicking bed; S = surface irrigation; WS = wicking bed with soil column; WN = wicking bed without plant; P = soil bed. The numbers following a letter for each treatment indicate the depth of reservoir (W) and soil (P), respectively, in mm. Error bars indicate standard deviation.
Horticulturae 02 00013 g006
Figure 7. Average soil water content distribution (as % volumetric moisture content) at different soil depths during fruit maturity and harvest stage for wicking bed (left) and surface (right) treatments. W = wicking bed; S = surface irrigation; WS = wicking bed with soil column; WN = wicking bed without plant; P = soil bed. The numbers following a letter for each treatment indicate the depth of the reservoir (W) and soil (P), respectively, in mm. First layer—0 to 10 cm, second layer—10 to 20 cm, bottom layer—20 to 30 (300 mm bed) and 45 to 60 cm (600 mm bed).
Horticulturae 02 00013 g007
Figure 8. Average soil-water content distribution (as % volumetric moisture content) at the end of experiment for 600 mm soil bed depths (left) and 300 mm soil bed depths (right) treatments. W = wicking bed; S = surface irrigation; WS = wicking bed with soil column; WN = wicking bed without plant; P = soil bed. The numbers following a letter for each treatment indicate the depth of the reservoir (W) and soil (P), respectively, in mm.
Horticulturae 02 00013 g008
Figure 9. Root mass density (RMD) distribution for different treatments. W = wicking bed; S = surface irrigation; WS = wicking bed with soil column; WN = wicking bed without plant; P = soil bed. The numbers following a letter for each treatment indicate the depth of reservoir (W) and soil (P), respectively, in mm.
Horticulturae 02 00013 g009
Figure 10. Tomato root mass density (RMD) distribution (mg/cm3) as affected by soil depth and distance from the plant at the end of the experiment. Bolder contours indicated higher RMD. W = wicking bed; S = surface irrigation; WS = wicking bed with soil column; WN = wicking bed without plant; P = soil bed. The numbers following a letter for each treatment indicate the depth of reservoir (W) and soil (P), respectively, in mm.
Horticulturae 02 00013 g010
Table 1. ANOVA summary for total yield, marketable yield, total water, crop evapotranspiration (ETc), irrigation water use efficiency (iWUE) and water use efficiency (WUE) as affected by each irrigation treatment at the completion of the study.
TreatmentYield (kg/Plant)Total Water (L)Crop Water Use (L/kg)ETc (L)iWUE (g/L)WUE (g/L)
TotalMarketable
T1 W300/P600 z2.36 ab y2.18 b123.1 c0.06 ab123.9 bc17.8 bc17.6 bc
T2 S0/P6002.72 ab2.46 abc158.1 a0.06 ab160.6 a15.5 c15.3 c
T3 WN300/P600* x*32.2 d*18.5 d**
T4 W150/P3002.86 a2.85 ab121.7 c0.04 b118.8 c23.5 a24.0 a
T5 W300/P3003.06 a2.89 ab125.2 c0.04 b123.0 bc23.2 a23.6 a
T6 WS300/P3003.08 a3.08 a143.0 ab0.05 b136.2 bc21.5 ab22.6 ab
T7 S0/P3002.11 b1.78 c134.8 bc0.08 a137.4 b13.2 c13.0 c
T8 WN300/300**30.2 d*23.6 d**
z W = wicking bed; S = surface irrigation; WS = wicking bed with soil column; WN = wicking bed without plant; P = soil bed. The numbers following a letter for each treatment indicate the depth of reservoir (W) and soil (P), respectively, in mm; y Means within columns followed by different letters are significantly different for irrigation treatments (P ≤ 0.05, LSD); x An asterisk (*) indicates no data, or calculation was not possible as they relate to a treatment with no plant.
Table 2. Comparison of irrigation water reduction and tomato yield increase between wicking and surface treatments.
TreatmentIrrigation Water (L)Marketable Yield (kg)Water Reduction (S-W)/S %Yield Increase (W-S)/S %
T1 W300/P600 z123.1 y2.1822.1−11.2
T2 S0/P600158.12.46--
T4 W150/P300121.72.859.759.6
T5 W300/P300125.22.897.162.5
T6 WS300/P300143.03.08−6.172.8
T7 S0/P300134.81.78--
z Treatment types are labelled with treatment number followed by the irrigation method, reservoir depth and the soil bed height. W = wicking bed; S = surface irrigation; WS = wicking bed with soil column; WN = wicking bed without plant; P = soil bed. The numbers following a letter for each treatment indicate the depth of reservoir (W) and soil (P), respectively, in mm; y Statistical differences for Irrigation Water and Marketable Yield are shown in Table 1. Percentage Water Reduction and Yield Increase for W versus S were calculated separately for each soil bed height.
Table 3. Above-ground dry biomass as affected by irrigation treatment at the completion of the study.
TreatmentAbove-ground Average Dry Biomass Weight (g/Plant)
FruitsStemFoliageTotal
T1 W300/P600154.7 b50.3 a69.3 c274.4 b
T2 S0/P600203.6 ab56.0 a93.1 ab352.7 a
T4 W150/P300182.6 ab58.8 a75.9 bc317.2 ab
T5 W300/P300188.8 ab45.2 a61.0 c294.9 b
T6 WS300/P300204.6 a55.3 a77.6 bc337.5 ab
T7 S0/P300177.8 ab54.9 a99.2 a331.9 ab
W = wicking bed; S = surface irrigation; WS = wicking bed with soil column; WN = wicking bed without plant; P = soil bed. The numbers following a letter for each treatment indicate the depth of reservoir (W) and soil (P), respectively, in mm; Means within columns followed by different letters are significantly different for irrigation treatments (P ≤ 0.05, LSD).

