1. Introduction
Inverse magnetocaloric effect (MCE) inherent to Ni–Mn–(In, Sn, Sb) metamagnetic shape memory alloys (MMSMAs) relates to a peculiar magnetic entropy change (Δ
SM > 0) in the proximity of the first order thermoelastic martensitic phase transformation (MPT) [
1]. The Δ
SM change arises from the symmetry breaking concomitant with an abrupt magnetisation change upon MPT; this phenomenon is due to a unique coupling between the magnetic and structural degrees of freedom [
2]. Large magnetic entropy changes on the order of 18 J/kg·K under the magnetic field change of μ
0·Δ
H = 5 T, in addition to a large elastocaloric effect (Δ
Tad. = 4 K), have been recorded for the metamagnetic Ni–Mn–Sn system [
3,
4,
5], which, aside from other functionalities [
6,
7] makes it intriguing for solid state refrigeration [
8].
In order to maximise MCE and bring the working temperature (MPT) close to room temperature, the composition of MMSMAs is frequently modified. This approach relies on the sensitivity of the MPT temperature (
TM) and, to a lesser extent, the Curie temperature of austenite (
) to composition change in Ni–Mn based alloys; this sensitivity is often expressed in terms of the valence electron concentration (
e/a) [
9,
10]. In general, experimental findings for MMSMAs reveal a growing instability of the β-phase towards closed, packed martensite with incremental
e/
a, which sends
TM upwards [
10,
11,
12]. It has been consistently reported that, for instance, partial substitution of Mn by Cr in Ni
45Mn
44-xCr
xSn
11 at the level of
x = 1 and 2 at.% results in a decrease in
TM and simultaneously for
x = 1 at.% yields the maximum Δ
SM = 23.4 J/kg·K at 240 K under the low magnetic field change of 1 T [
13], which under μ
0·Δ
H = 5 T goes up to 35 J/kg·K [
14]. While promising, Cr for Mn substitution in metamagnetic Ni
50Mn
33In
17 and Ni
50Mn
37Sb
13 is found, conflictingly, to disobey monotonic
TM vs.
e/a dependence. Initially, with up to 2 at.% Cr for Mn substitution,
TM is observed to increase despite decreasing
e/
a; then, at higher Cr concentration
TM drastically decreases and is finally suppressed at >5 at.% Cr [
15,
16,
17,
18]. Simultaneously, already at low Cr concentrations (≤2 at.%), the Cr-rich precipitate phase is reported in Ni–Mn–In, indicating poor Cr solubility in this ternary system with an overall limiting influence on the magnitude of the Δ
SM [
17]. Although seemingly detrimental for MCE [
19], phase inhomogeneity is not always undesirable, e.g., in the sense of ductility enhancement in Co–Ni–(Ga, Al) due to the small volume of a precipitated γ phase [
20], while more recently inhomogeneity has been reported to add to the plethora of existing functionalities in Ni–Mn–(Sn, In) MMSMA in terms of core–shell ferromagnetism [
21]. Also regarding MCE inhomogeneity embodied by, e.g., a compositional gradient leading to a cascade of successive
TM or
TC A temperatures [
22] and/or supposedly a certain degree of atomic disorder [
23,
24] may, in accordance with recent findings, turn out somewhat advantageous for MCE, stemming from the extended temperature dependence of the Δ
SM [
25]. Thus, improving the efficiency of the Ericsson cycle, for example, due to the boost in the refrigerant capacity (RC), a critical parameter accounting for the effective cooling power (amount of heat transferred from the surrounding environment to the heat sink) of a prospective MMSMA refrigeration material.
Therefore, this paper examines the effect of a low amount of 0.5 and 1 at.% Cr for Mn substitution in the Ni48Mn39.5Sn12.5 system, its effect on microstructure evolution and characteristic thermomagnetic behaviour. The ΔSM and RC are computed and discussed in the context of a multi-phase microstructure and mixed magnetic correlations.
3. Results and Discussion
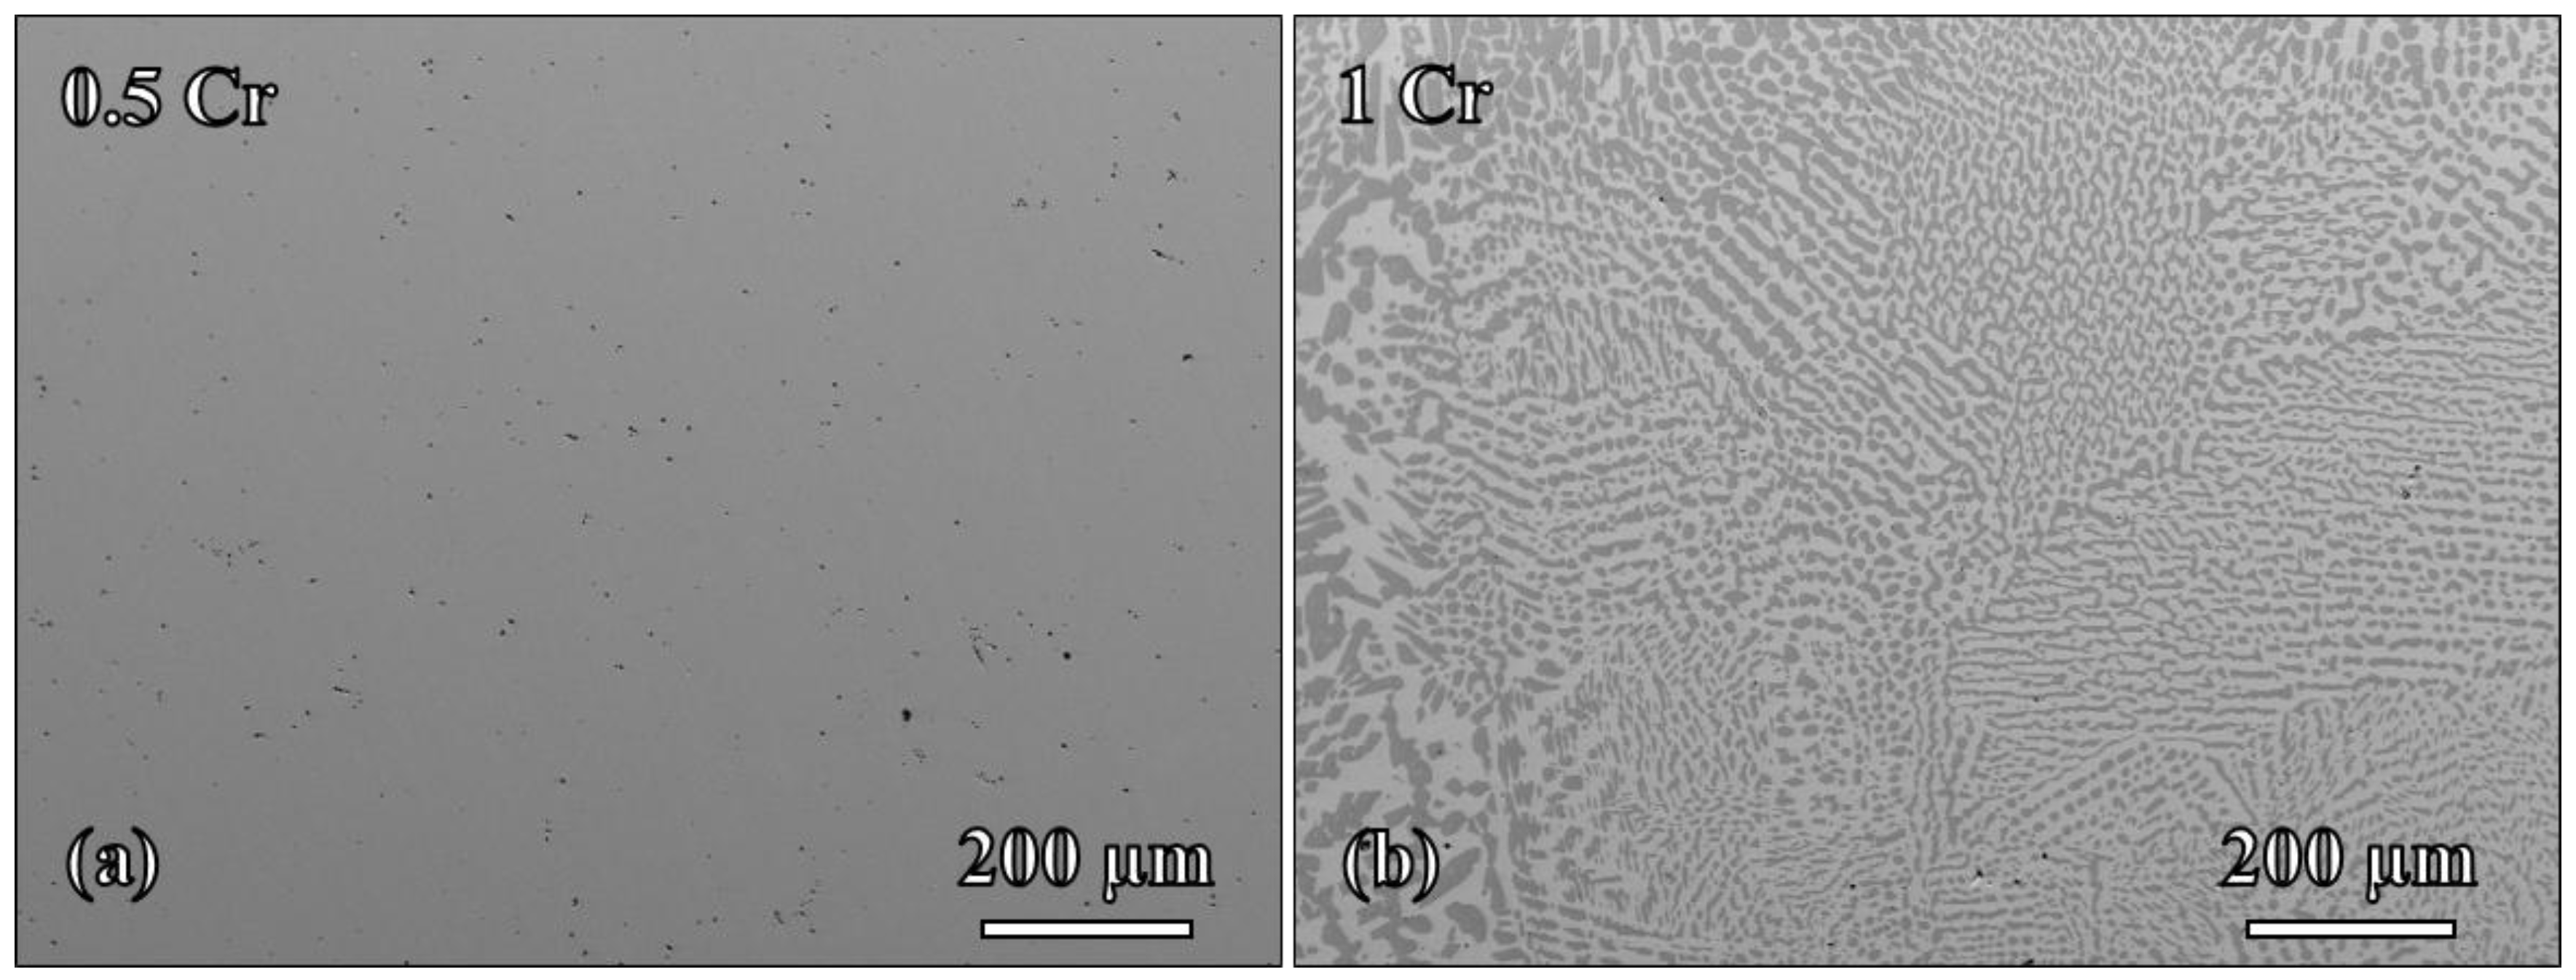
Room temperature (RT) microstructure of 0.5 Cr and 1 Cr alloys was examined by SEM. Representative backscattered electron images (BSE) are given in
Figure 1. In accordance with this figure, 0.5 Cr alloy (
Figure 1a) appears homogenous with a single phase microstructure. Small black spots in
Figure 1a are voids attributable to the casting process. On the other hand, the 1 Cr alloy (
Figure 1b) shows a dual phase, eutectic type microstructure with distinct BSE contrast between the matrix and the secondary phase. The chemical composition as verified by EDX for both alloys is given in
Table 1. The average Ni
49.6Mn
37.3Cr
0.7Sn
12.4 chemical composition of the 0.5 Cr alloy is found uniformly distributed within the sample and is closely related to the nominal composition. A little deviation in Mn content from nominal concentration, as frequently encountered, is ascribed to the weight loss during arc melting, due to the low vapour pressure of Mn. The calculated
e/a for 0.5 Cr is equal to 8.107. On the other hand, the chemical composition of the 1 Cr alloy is found to be more complex. In principle, one can distinguish three different phases here in terms of composition variation. Among them, the matrix phase shows up in a light grey colour in
Figure 1b, which is enriched in Sn, yet on average it internally differs in terms of Cr/Sn ratio as follows: Ni
52.7Mn
31Cr
0.7Sn
15.6 (
e/a = 8.107), Ni
52.1Mn
34.3Cr
1.3Sn
12.3 (
e/a = 8.179). The second Sn-lean Ni
63.7Mn
31.3Cr
2Sn
3 phase gives darker BSE contrast (
Figure 1b). The third phase (not shown in
Figure 1b) is abundant in Ni with little Mn and Sn concentration: Ni
90.3Mn
8Cr
0.2Sn
1.5. For the 1 Cr sample, one also notices more pronounced loss of Mn than in the case of the 0.5 Cr, due to the same reasons. On the whole, as evident from
Table 1, the Cr concentration in the identified phases increases with increasing Ni/Sn ratio.
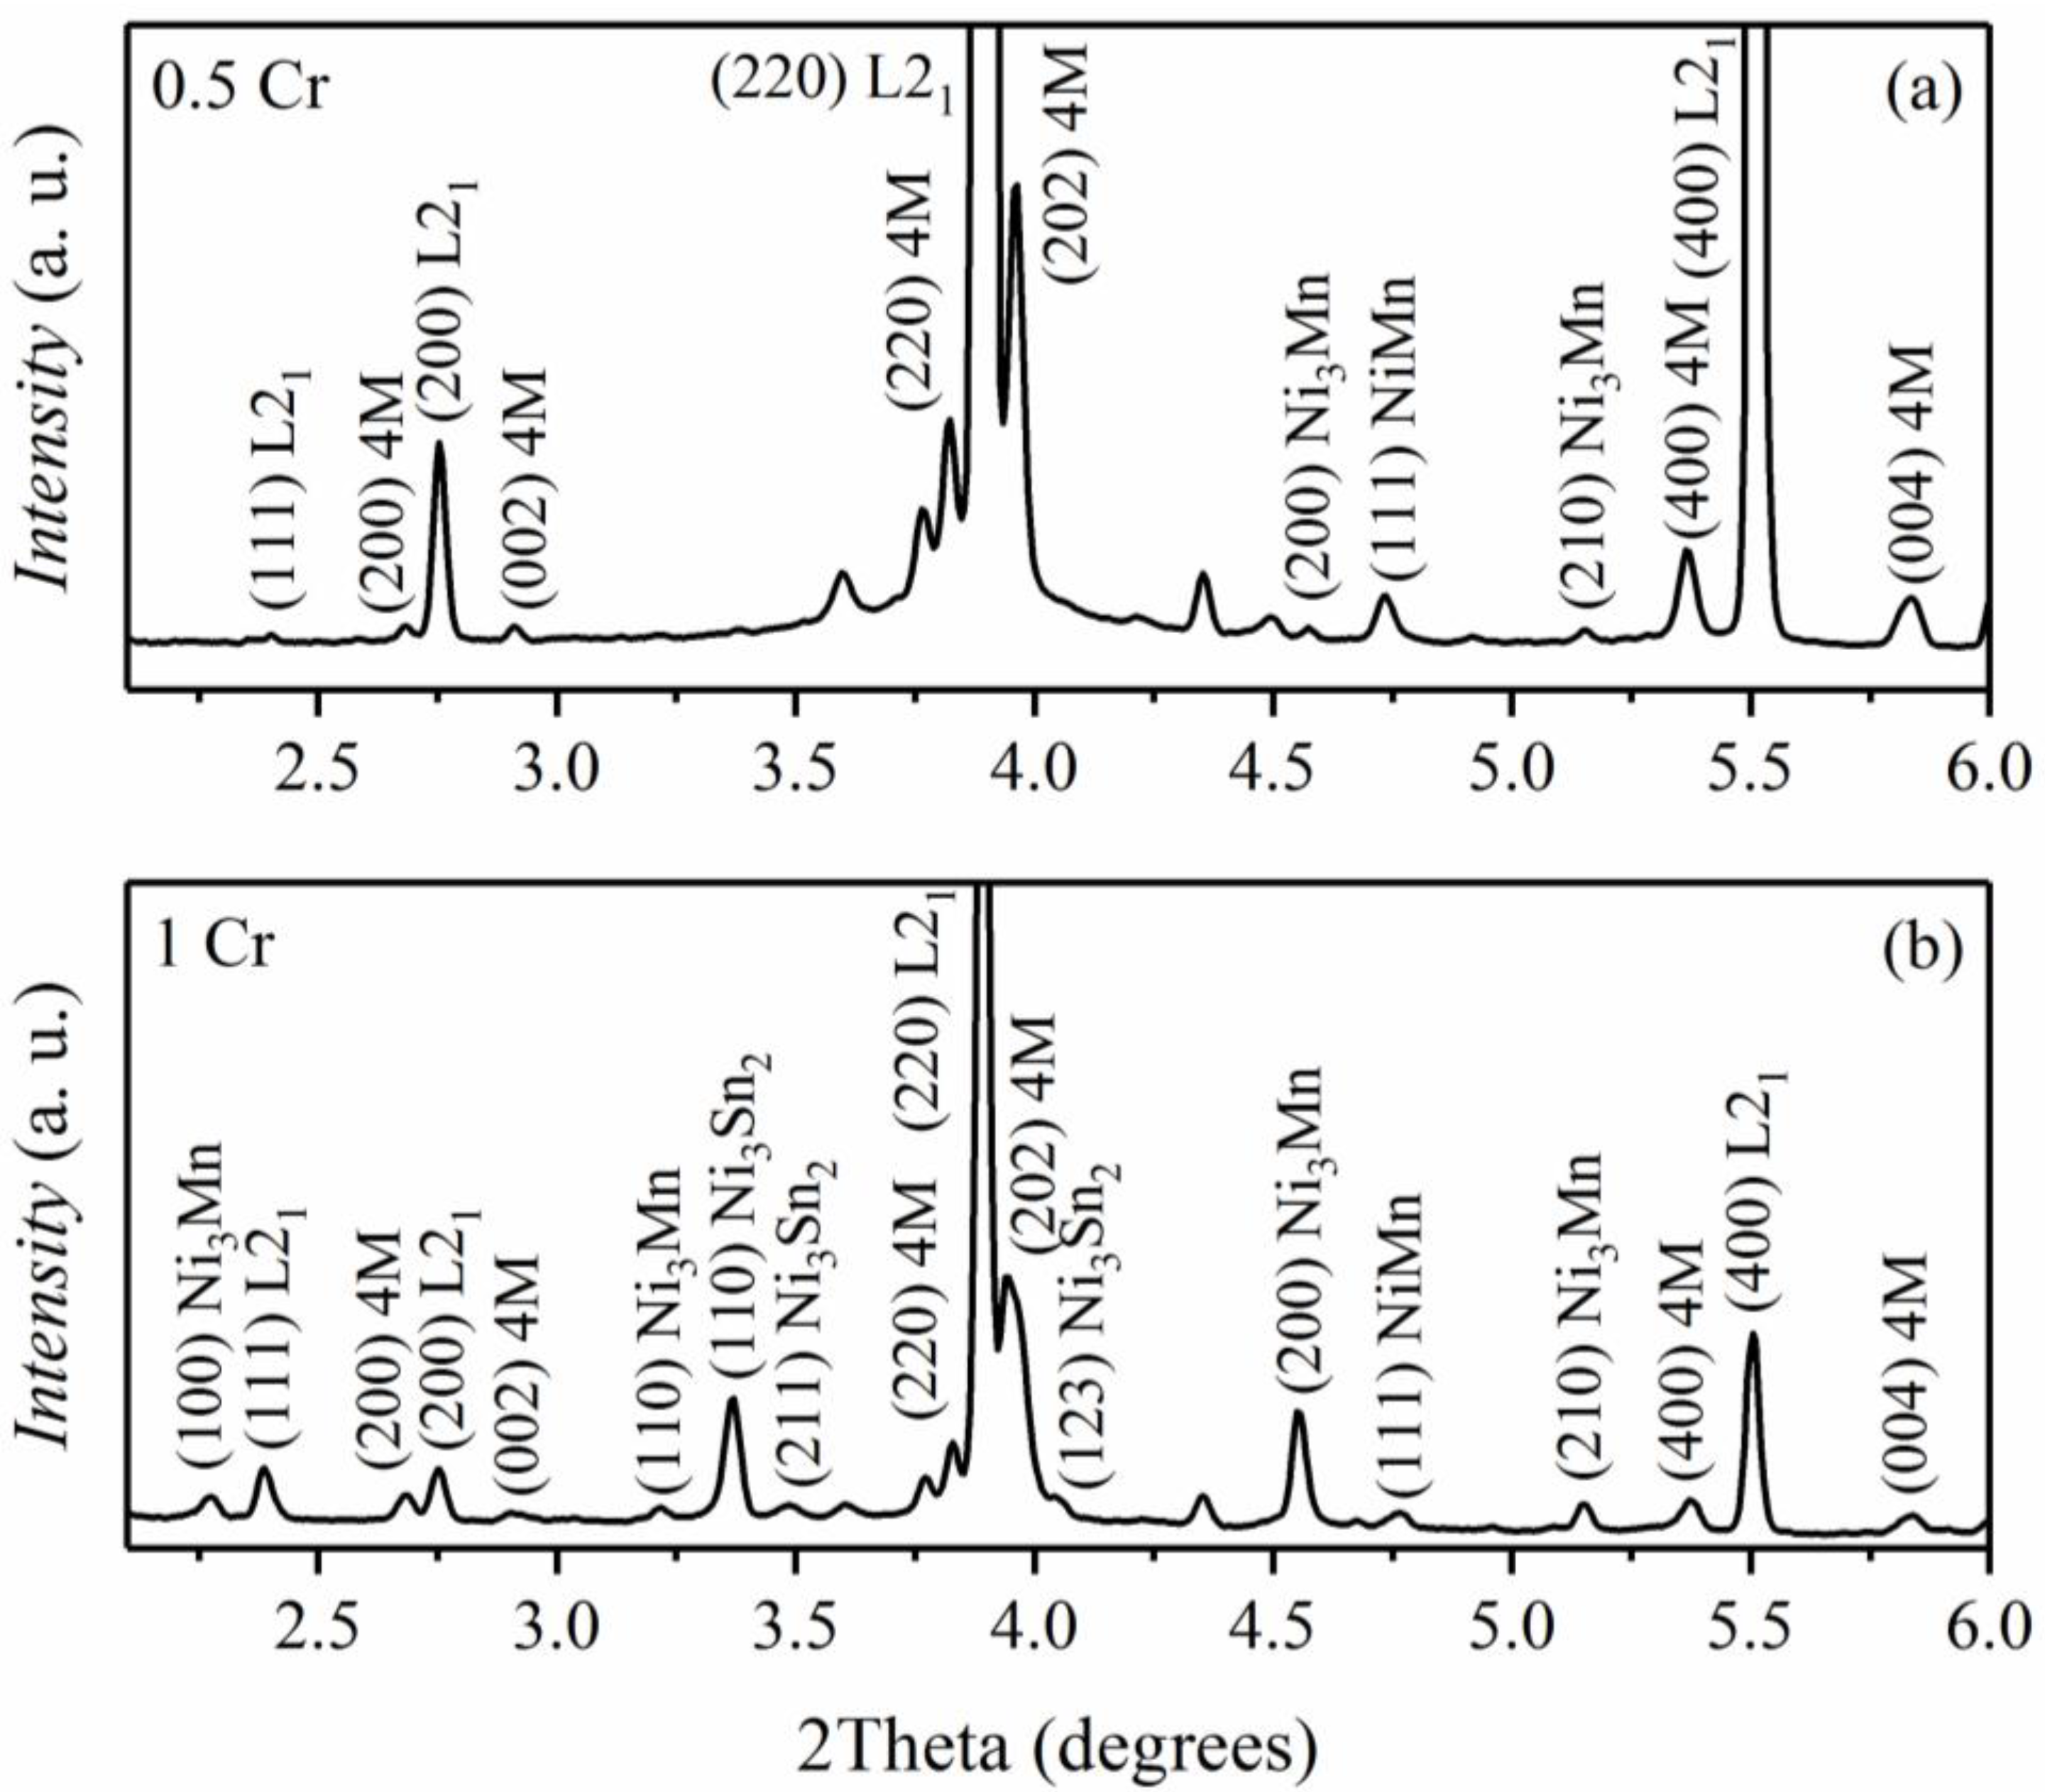
In order to support the preliminary SEM analysis, high energy synchrotron XRD experiments were conducted on the 0.5 Cr and 1 Cr samples at RT with the aim of gaining a deeper insight into the phase composition and phase structure of both alloys, owing to the superior synchrotron radiation resolution and improved grain statistics over more conventional X-ray sources. The results of theses studies in the form of integrated 2-Theta scans are presented in
Figure 2. It appears that the XRD pattern taken for the 0.5 Cr alloy (
Figure 2a) shows a pronounced intensity corresponding predominantly to the austenite phase with the L2
1 Heusler structure and to martensite with the 4M modulated structure with a small contribution from the (111) NiMn and even lower from (200) and (210) Ni
3Mn. The relative phase contribution between NiMn and Ni
3Mn is reversed in the case of the 1 Cr alloy (
Figure 2b), whose pattern can be indexed similarly according to the L2
1 and 4M phases. In addition, it receives some contribution from the Ni
3Sn
2. Since the synchrotron measurements were performed on the bulk coarse grained samples, the Rietveld refinement was carried out on powdered samples in order to discriminate the effect of texture. The martensite phase in both samples was confirmed with an orthorhombic structure and
Pmma space group and the lattice parameters, unit cell volume of the austenite phase and the relative volume fraction of austenite are prestented in
Table 2.
It can be seen (
Table 2) that the unit cell volume of the austenite phase in the 0.5 Cr sample is slightly larger than in the 1 Cr sample. The austenite phase is at the same time more abundant at room temperature in the 0.5 Cr relative to the 1 Cr sample. Overall, these results unambiguously confirm a considerable discrepancy in reference to phase composition between 0.5 Cr and 1 Cr alloys. This will inevitably be reflected in their thermomagnetic behaviour, discussed in the next paragraph.
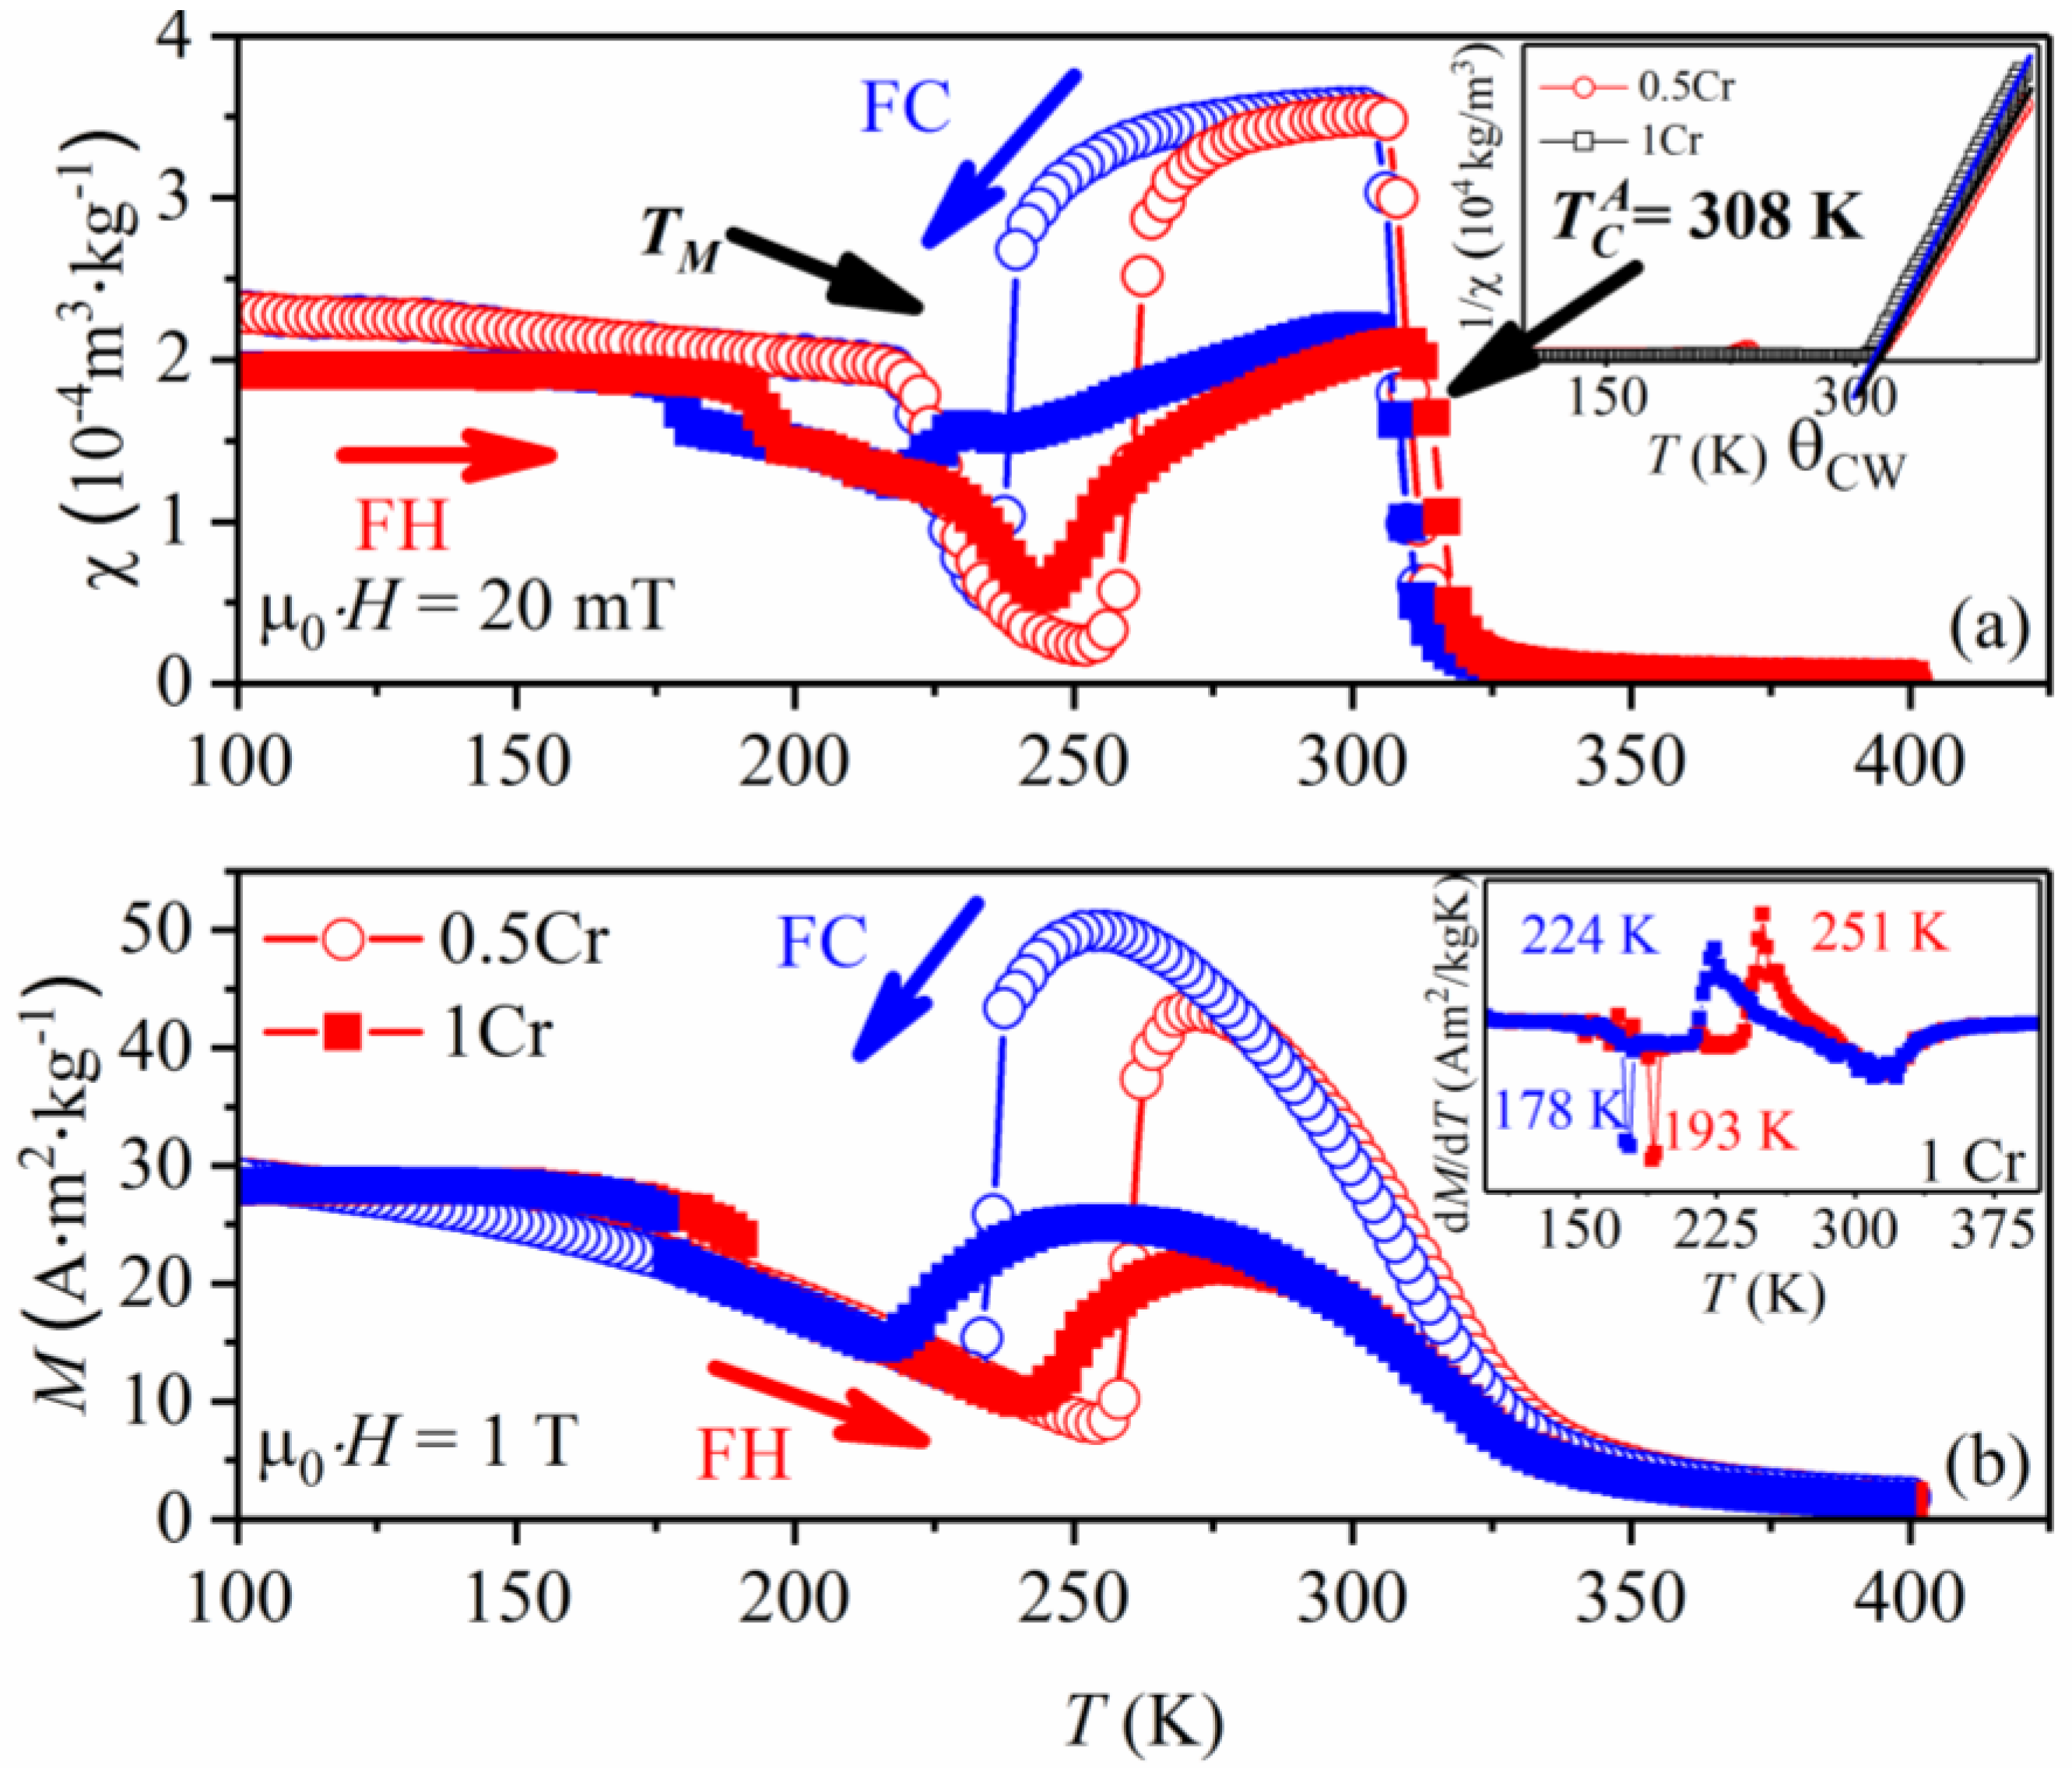
Temperature-dependent magnetic susceptibility (
) and magnetisation (
M) for the 0.5 Cr and 1 Cr alloys under the magnetic field of 2 mT (
Figure 3a) and 1 T (
Figure 3b) were recorded in the FC and FH mode within the 100–400 K temperature range. On cooling (
Figure 3a) from around 400 K, both alloys first showed a near-zero
indicating paramagnetic state, then around 308 K, magnetic susceptibility increases marking the
TC A. It then drops again at around
TM with a characteristic hysteretic splitting between the FC and FH modes, which is a fingerprint of the first order nature MPT. At the lower temperature,
begins to increase, since upon further cooling the system goes through the Curie temperature of the martensite phase (
TC M), however in the case of the 0.5 Cr alloy the low temperature
remains well below the values observed for the austenite within the
TM ≤
T ≤
TC A range. The characteristic forward (
TM A→M) and reverse (
TM M→A) MPT temperatures, as well as the
TC A and
TC M temperatures, have been determined from the corresponding inflection points on the FC and FH cures, respectively. They are collated in
Table 1. From the comparison between the thermomagnetic behavior of the 0.5 Cr and 1 Cr alloys, it is to be noted that the
TM A→M (239 K) of the former is 16 K above the
TM A→M (223 K) of the latter. On the contrary, the transformation temperature range given as Δ
Th =
TM A→M ‒
TM M→A for 1 Cr (30 K) alloy exceeds by 7 K the Δ
Th observed for the 0.5 Cr sample (23 K). This fact also manifests itself well in
Figure 3a by a relatively broad FC-FH hysteresis noticeable for the 1 Cr alloy. The magnetic transition temperatures show good agreement with the respective temperatures determined according to the Curie–Weiss Law χ (
T) =
C/(
T − θ
CW), where C is the Curie constant and θ
CW is the Curie–Weiss constant. The determined 1/
dependence (FC) is portrayed for both the 0.5 Cr (θ
CW = 312 K) and 1 Cr (θ
CW = 309 K) alloys near
TC A in the inset in
Figure 3a. The steeper slope of the 1/
vs.
T curve (inset
Figure 3a) noted for the 1 Cr alloy relative to the 0.5 Cr indicates the difference in the effective magnetic moment (
) between both alloys above 300 K. From the linear fits, the
in the paramagnetic state of either phase can be determined according to:
where
M is the molecular mass,
kB Boltzmann’s constant, μ
0 is the permeability of the vacuum,
NA Avogadro’s number and
bmass is the slope of the linear fit determined for both alloys within the 336 K and 400 K temperature range. The
for the 0.5 Cr alloys is equal to 2.8 μ
B (
= 7.6 μ
B), whereas for 1 Cr it is lower and amounts to 2.7 μ
B (
= 8.4 μ
B-matrix with the average composition). The disparity in the magnetic susceptibility below 300 K within the
TM ≤
T ≤
TC A temperature range for both alloys is also seen from the relative positions of the
vs.
T and
M vs.
T (
Figure 3a,b). At the lower temperature below
TC M the FC, and FH curves for the 0.5 Cr under 20 mT continue to rise above the corresponding curves recorded for the 1 Cr alloy, whereas at 1 T all curves merge. Interestingly, a small hysteresis appears within the 175–200 K range for 1 Cr at both 20 mT and 1 T, which may either be linked to some fraction of the austenite phase transforming directly to ferromagnetic rather than weakly magnetic martensite, since
T <
TC M, or alternatively this may be associated with a smeared Curie temperature or
TM due to the complex chemical composition, e.g., second MPT or intermartensitic transformation may be more plausible due to the presence of hysteresis. In fact, the inflection point
found on the FH curve for this temperature range is equal to 195 K, whereas that for the FC curve amounts to 180 K, which is a difference of 15 K; for this reason, it is difficult to reconcile with the second order nature magnetic transition (inset in
Figure 3b—d
M(FC, FH)/d
T vs.
T at 1 T). A similar effect for the same alloy is noted around the
TC A, where the temperatures determined from the FH (316 K) and FC (309 K) curves stray by 7 K. Higher magnetic field (2 T) has almost null effect on the forward and reverse
TM in both alloys (0.5 Cr at 2 T:
TM A→M = 236 K,
TM M→A = 260 K; 1 Cr at 2 T:
TM A→M = 223 K,
TM M→A = 250 K).
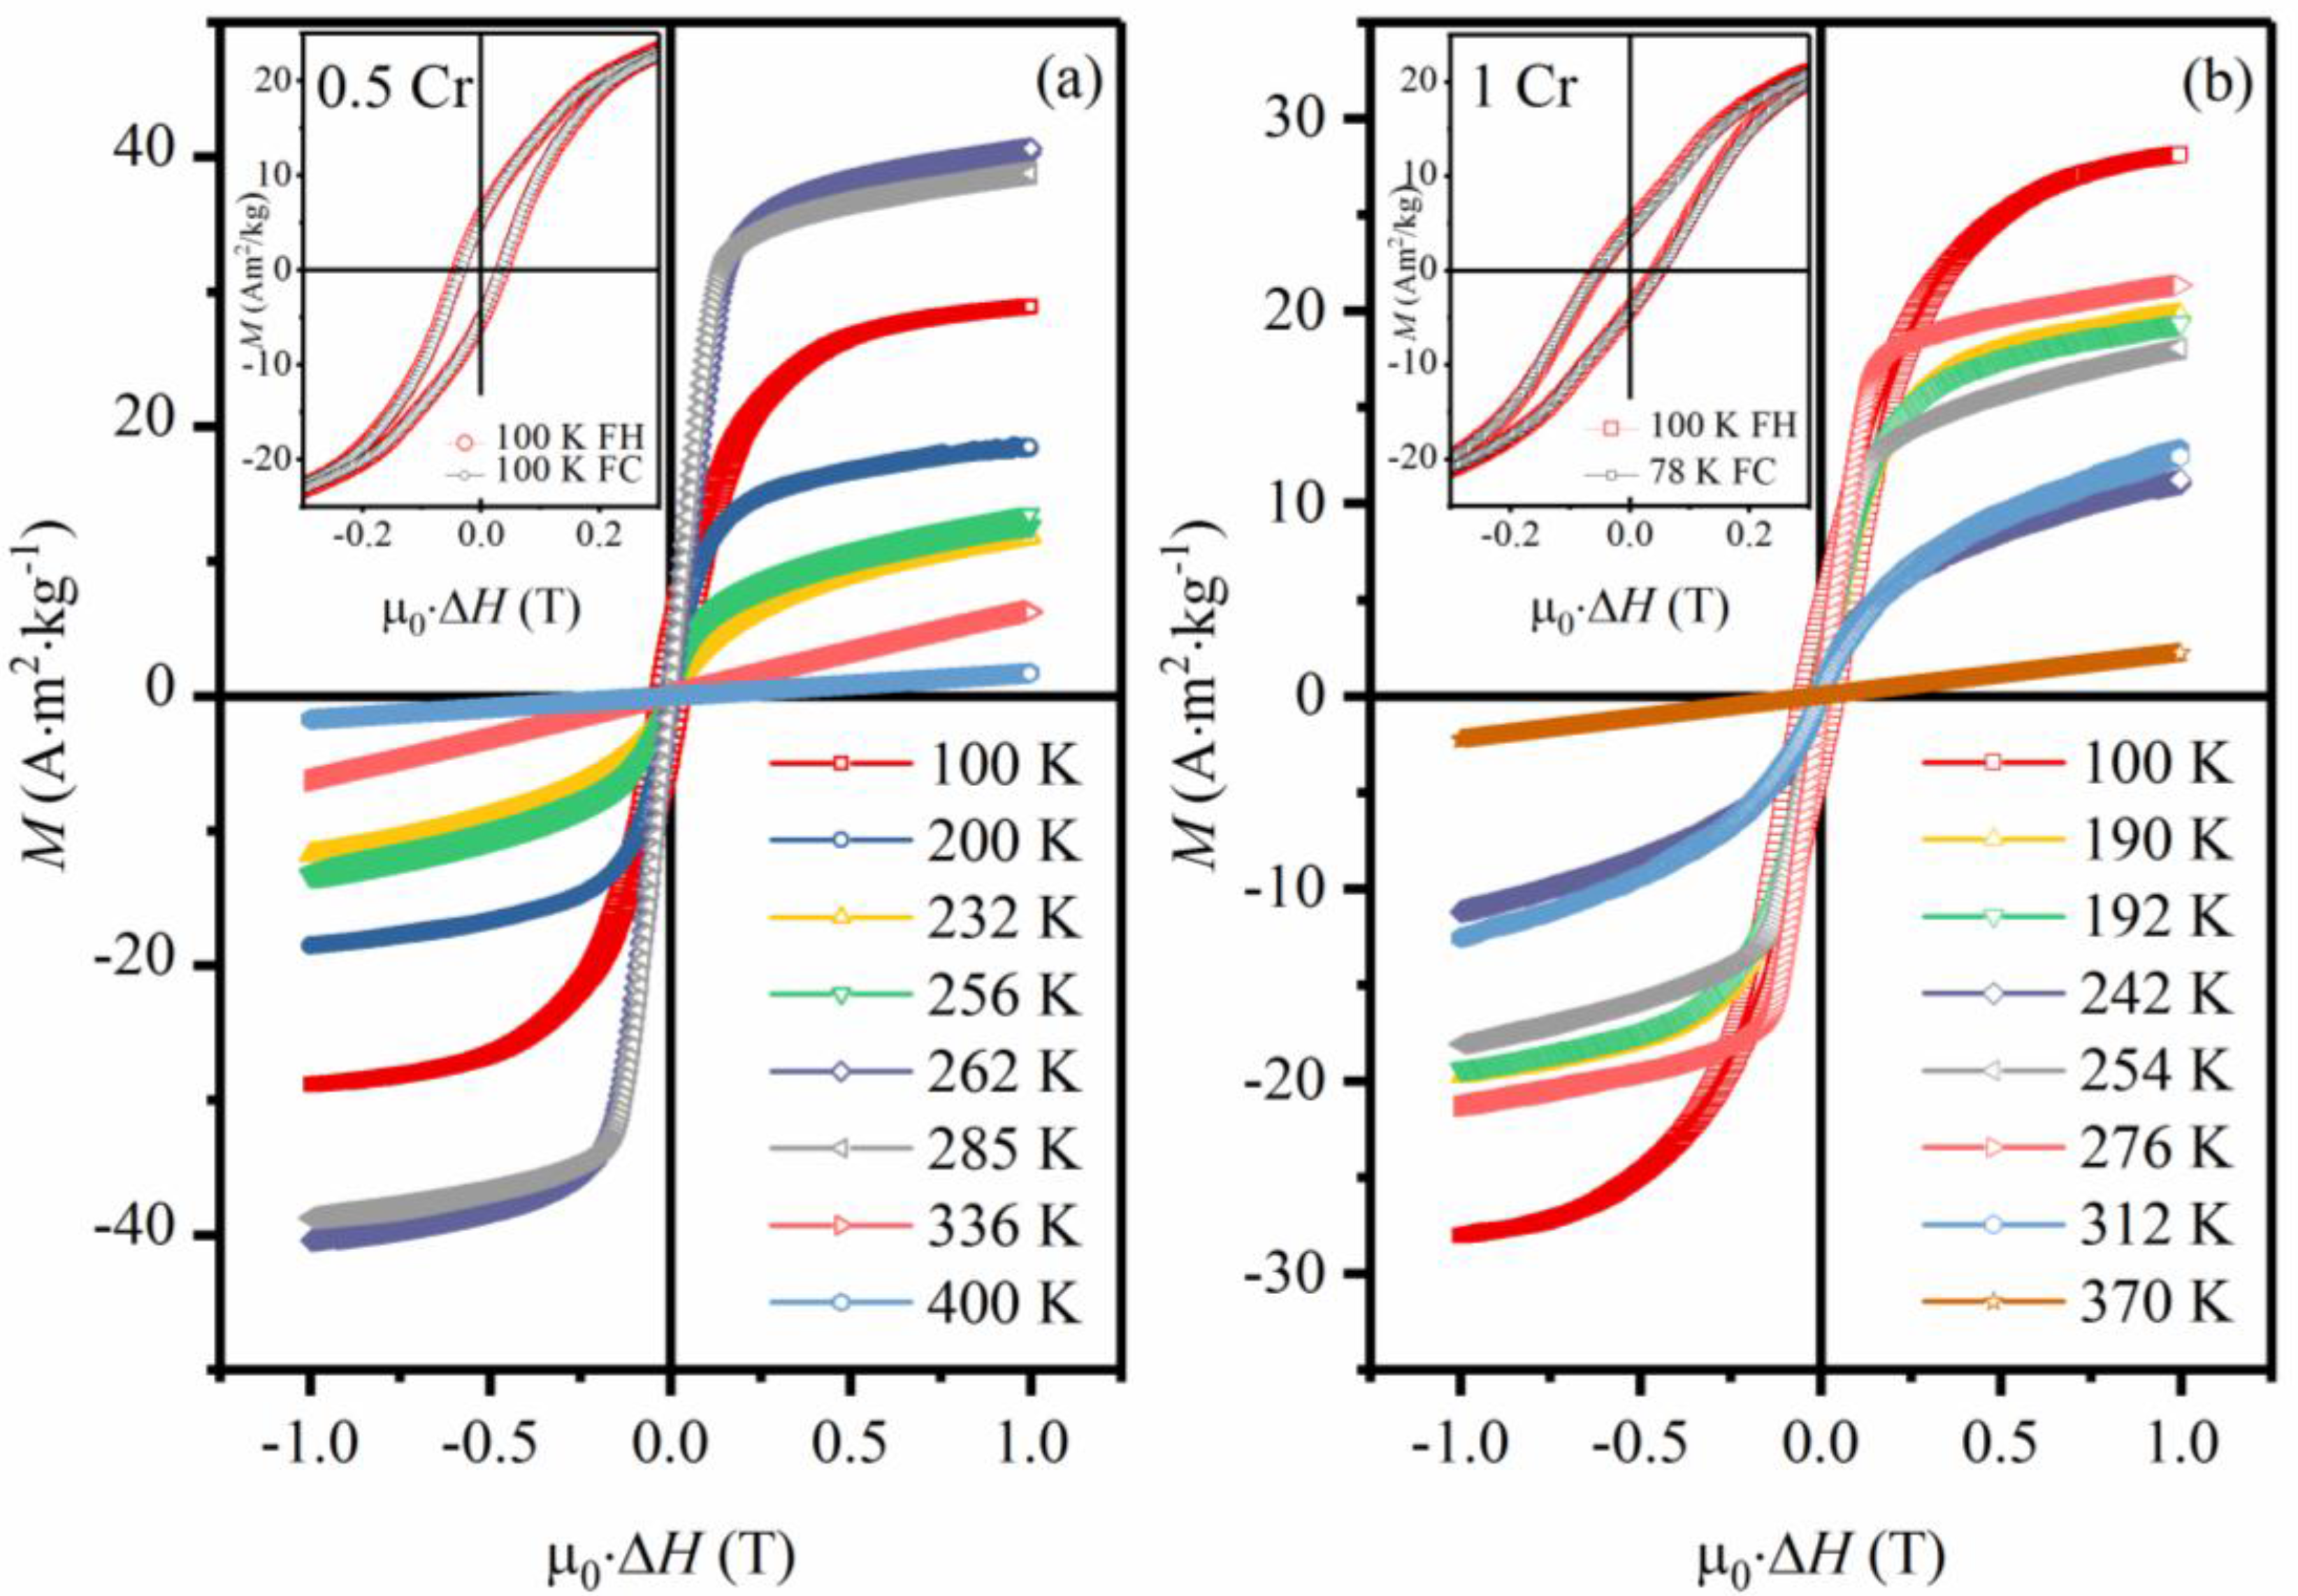
More detailed evaluation of magnetisation (FH) as a function of the magnetic field at selected temperatures within the 100–400 K range for the 0.5 Cr and 1 Cr alloys is given in
Figure 4. Consistent with
Figure 3, the magnetisation of the 0.5 Cr (
Figure 4a) at 100 K, the temperature at which martensite is expected to be in the stable phase, reaches ~28.7 A·m
2·kg
−1. The coercive field, following FC under μ
0·Δ
H = 1 T, at this temperature is equal to
HC = |
H1 −
H2|/2 = 338 Oe and simultaneously there is almost null exchange bias field
HE = −(
H1 +
H2)/2 = −1 Oe, where
H1 and
H2 denote the left and right coercive fields at zero magnetization. The magnetisation then gradually decreases with increasing temperature (FH) as the system approaches the
TC M followed by the
TM. Subsequently, at 262 K, just above
TM A→M,
M assumes the value of ~ 40.9 A·m
2·kg
−1, which is the highest in the investigated temperature range and is 12.2 A·m
2·kg
−1 above the magnetisation of martensite at 100 K. Further increase of the temperature brings the magnetisation down to the lowest of 1.8 A·m
2·kg
−1 at 400 K as the austenite phase becomes paramagnetic. On the other hand, for the 1 Cr alloy, the maximum magnetisation of 28 A·m
2·kg
−1 under μ
0·Δ
H = 1 T is reached at 100 K for the martensite state, and the
M value is comparable with the 0.5 Cr under the same conditions. After FC under the constant field (1 T),
HE = 11.5 Oe and
HC = 520 Oe at 78 K. Continued FH results in magnetization collapse, which settles at 18 A·m
2·kg
−1 at 254 K, just above the
TM M→A, and then higher up with temperature (276 K) at 21.4 A·m
2·kg
−1. Eventually,
M comes down to 12.4 A·m
2·kg
−1 (312 K) and finally 2.3 A·m
2·kg
−1 (370 K), as the system goes well above the
TC A.
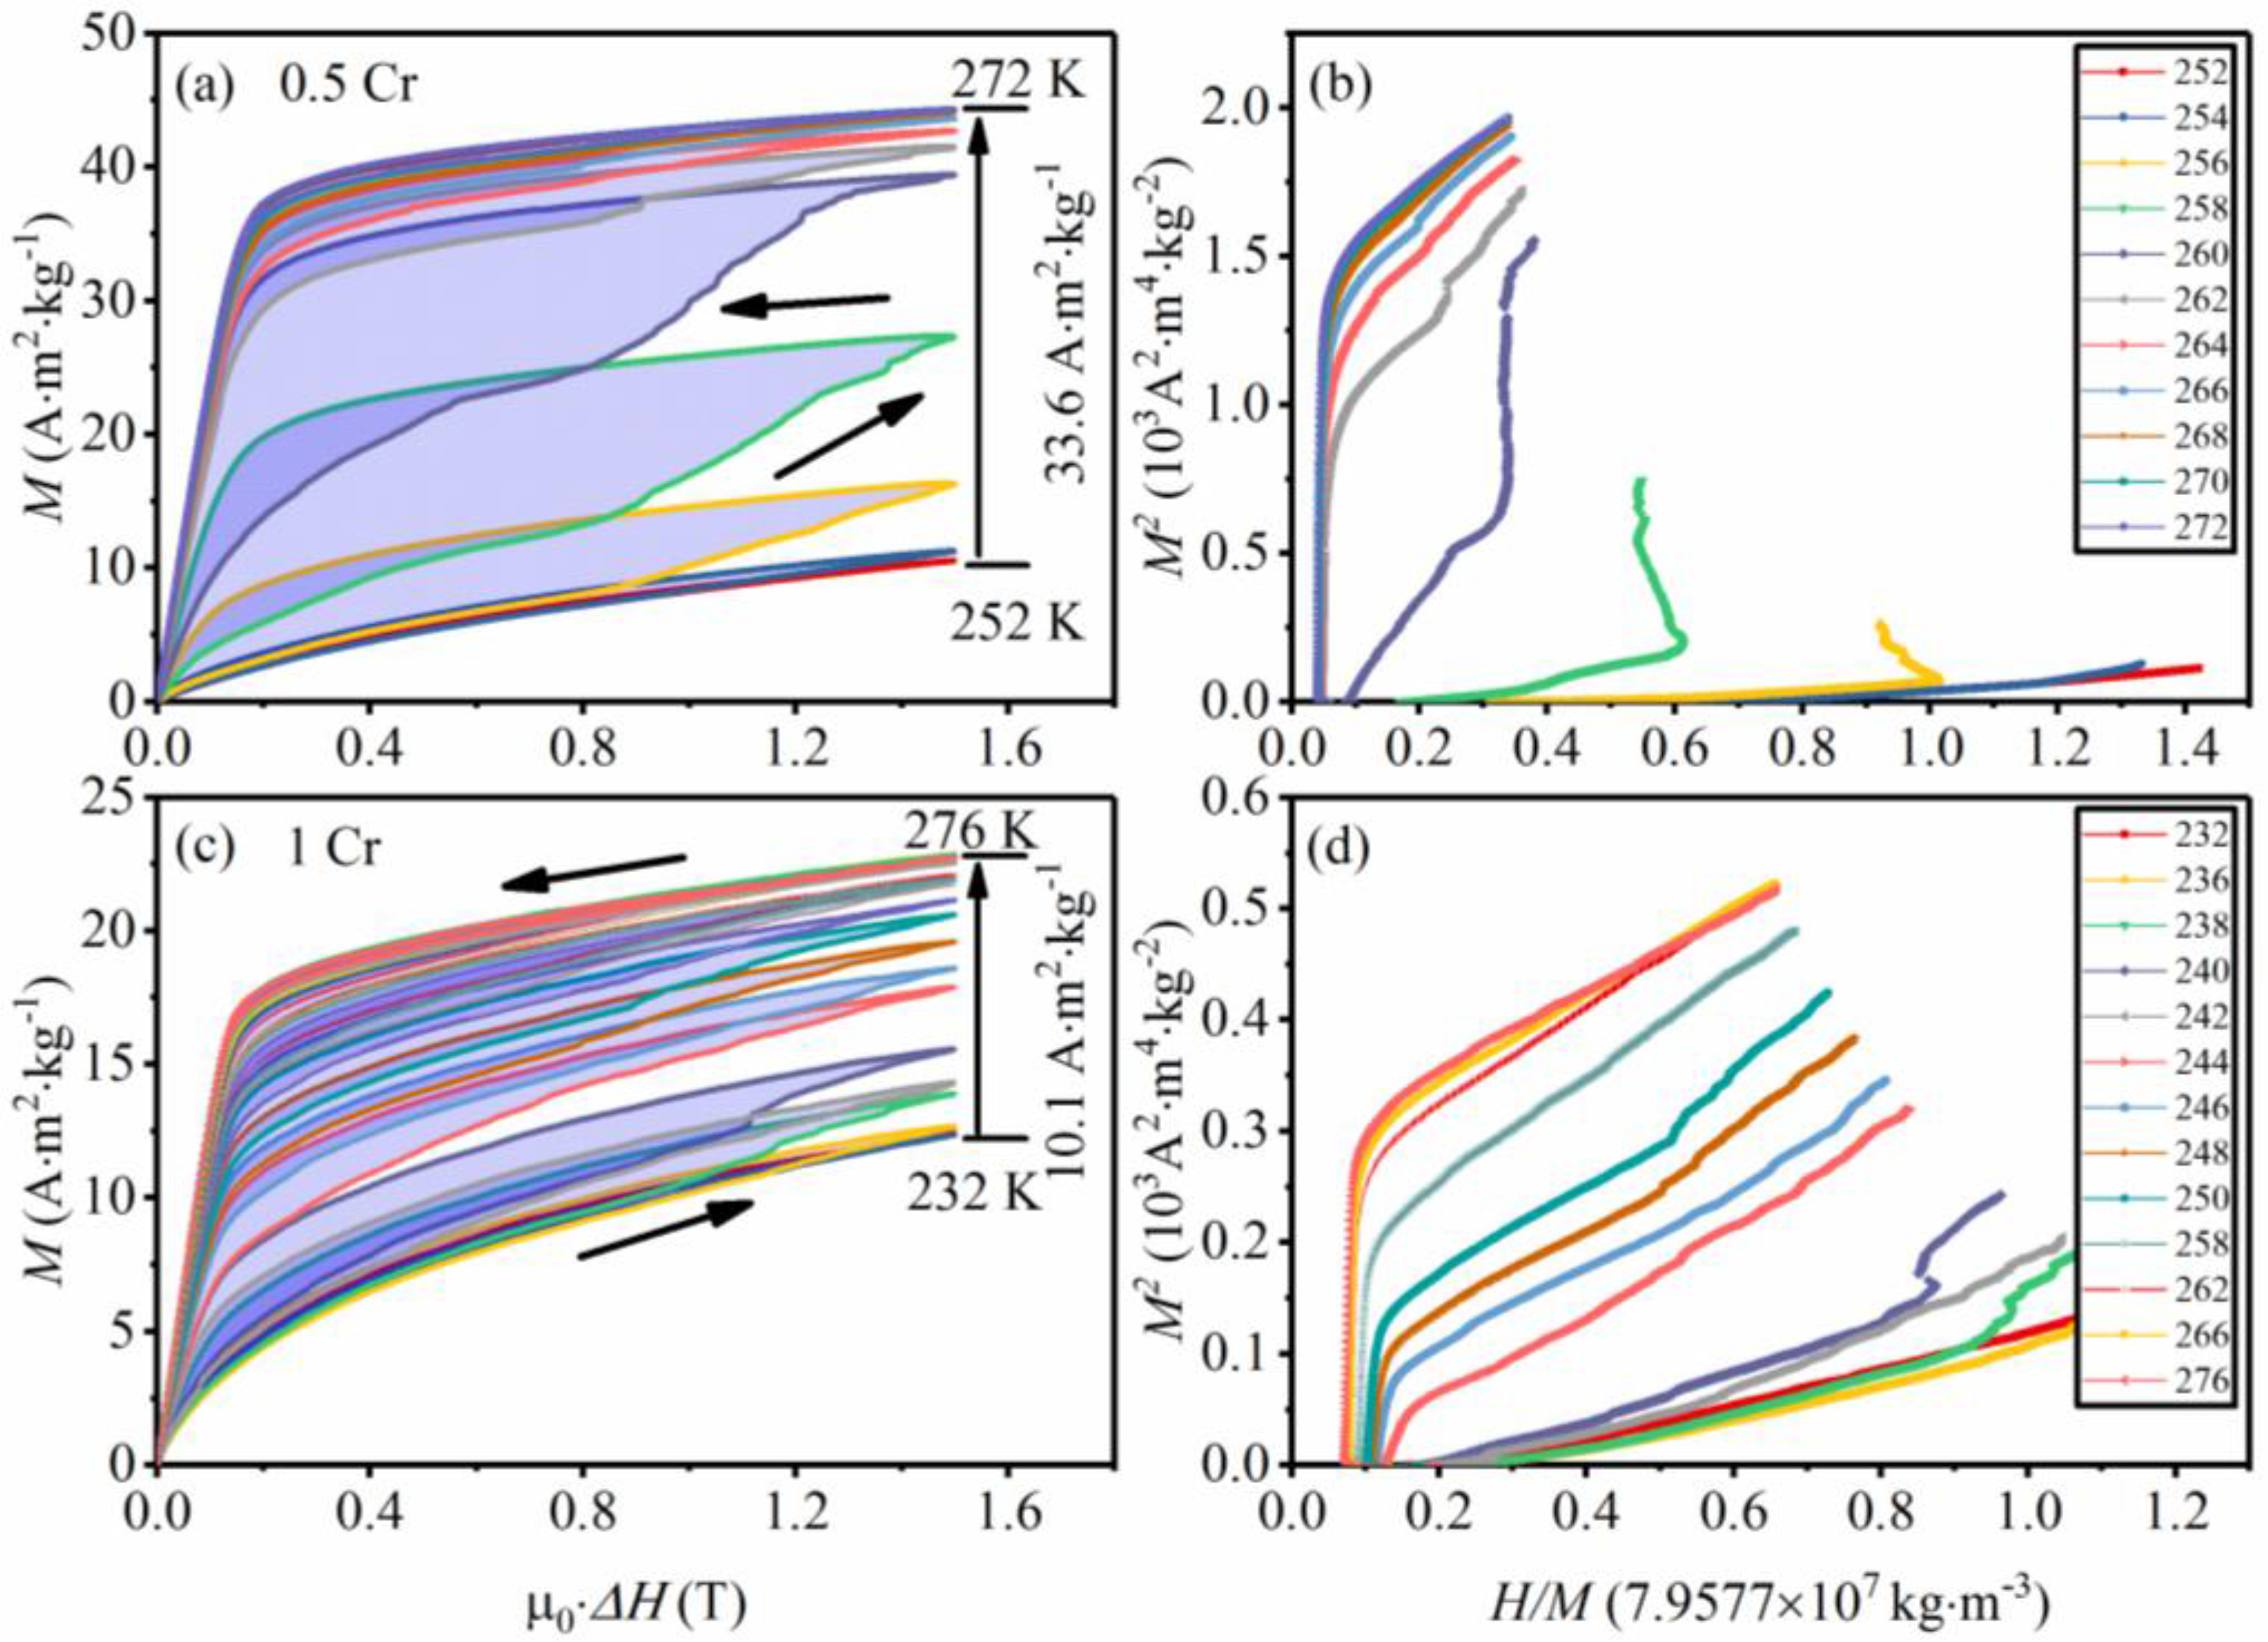
The magnetisation difference between martensite and austenite around
TM is well manifested in
Figure 5, which shows isothermal magnetisation curves
M (
H) for the 0.5 Cr and 1 Cr alloys across the MPT temperature range. The curves were measured by first cooling each sample to 150 K followed by 10 min isothermal pause, then the temperature was increased to the desired measuring temperature and the sample was again left for 10 min to stabilise. The
M (
H) isotherm was then recorded and the sample was subsequently cooled down to 150 K, where the cycle was repeated. The measurements revealed typical metamagnetic behaviour, which is clearly evidenced by
Figure 5a,c, i.e.,
M increases with increasing μ
0·Δ
H signifying the magnetic field induced reverse MPT. The corresponding Arrott plots for the 0.5 Cr (
Figure 5b) and 1 Cr (
Figure 5d) confirm the first order nature of the transformation, what is reflected in the S-shape like
M2 vs.
H/
M curves around
TM. The transformation hysteresis between field up and field down
M (
H) curves is highlighted with a light blue colour for both the 0.5 Cr and 1 Cr alloys and the computed hysteresis loss (
HL) vs.
T dependencies for both alloys are given in the insets in
Figure 6. The Δ
M for the 0.5 Cr alloy is 33.6 A·m
2·kg
−1 within the 252–272 K (Δ
T = 20 K) transition range, whereas that for the 1 Cr alloy is 10.1 A·m
2·kg
−1 within the broader 232–276 K (Δ
T = 44 K).
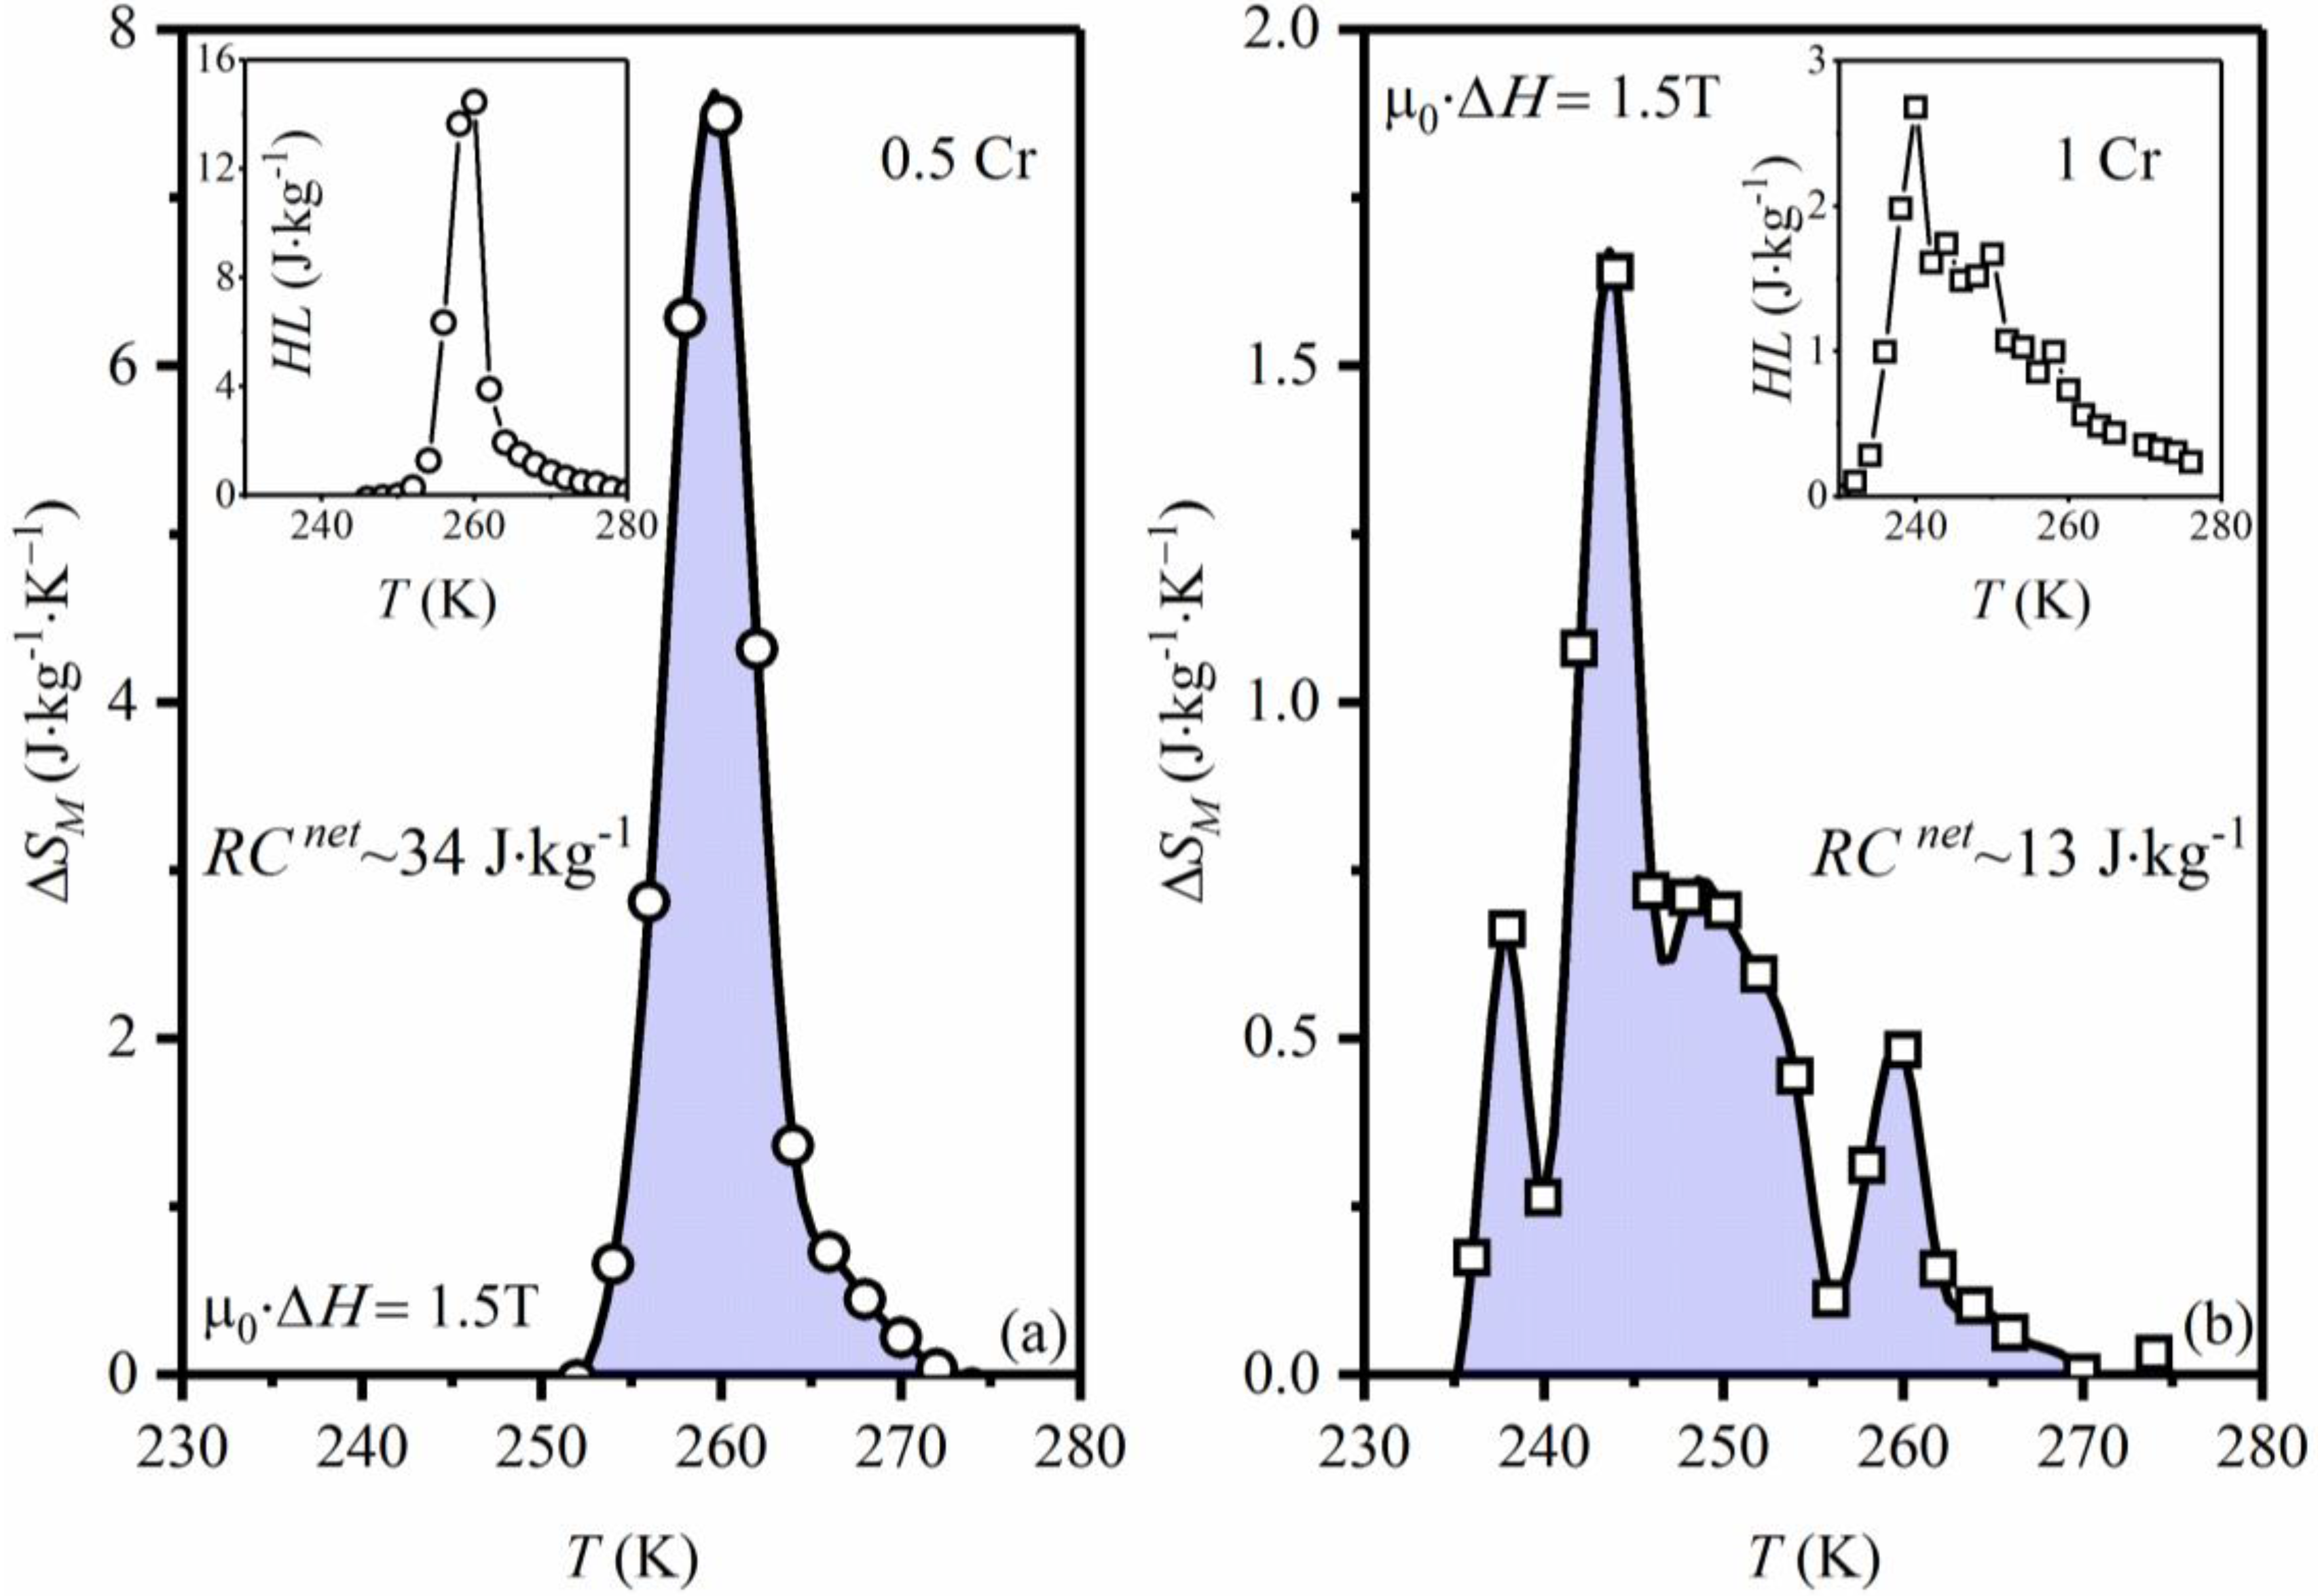
Based on the isothermal
M (
H) curves, the magnetic entropy change (Δ
SM) has been computed employing the Maxwell relation:
The temperature dependence of the Δ
SM in the magnetic field of μ
0·Δ
H = 1.5 T for both the 0.5 Cr and 1 Cr alloys is given in
Figure 6. The maximum Δ
SM max for the 0.5 Cr sample peaks at 260 K with 7.5 J/kg·K. The
HL (inset
Figure 6a) has been computed as:
The maximum HL under μ0·ΔH = 1.5 T at 260 K is equal to 14.5 J/kg. In order to compute the RC, the area under the ΔSM peak has been integrated and yielded 48.6 J/kg·K, which after subtraction of HL gives the effective RC net of around 34 J/kg under μ0·ΔH = 1.5 T. In the case of the 1 Cr sample, the maximum ΔSM max of 1.6 J/kg·K was determined at 244 K. The HL was estimated at 2.7 J/kg, whereas the peak area adds up to 16.2 J/kg, which gives RC net of 13 J/kg. It is worth noting that the ΔSM computed for the 1 Cr alloy is composed of four peaks and overall spreads over a broader temperature range, unlike the single peaked ΔSM max for the 0.5 Cr alloy.
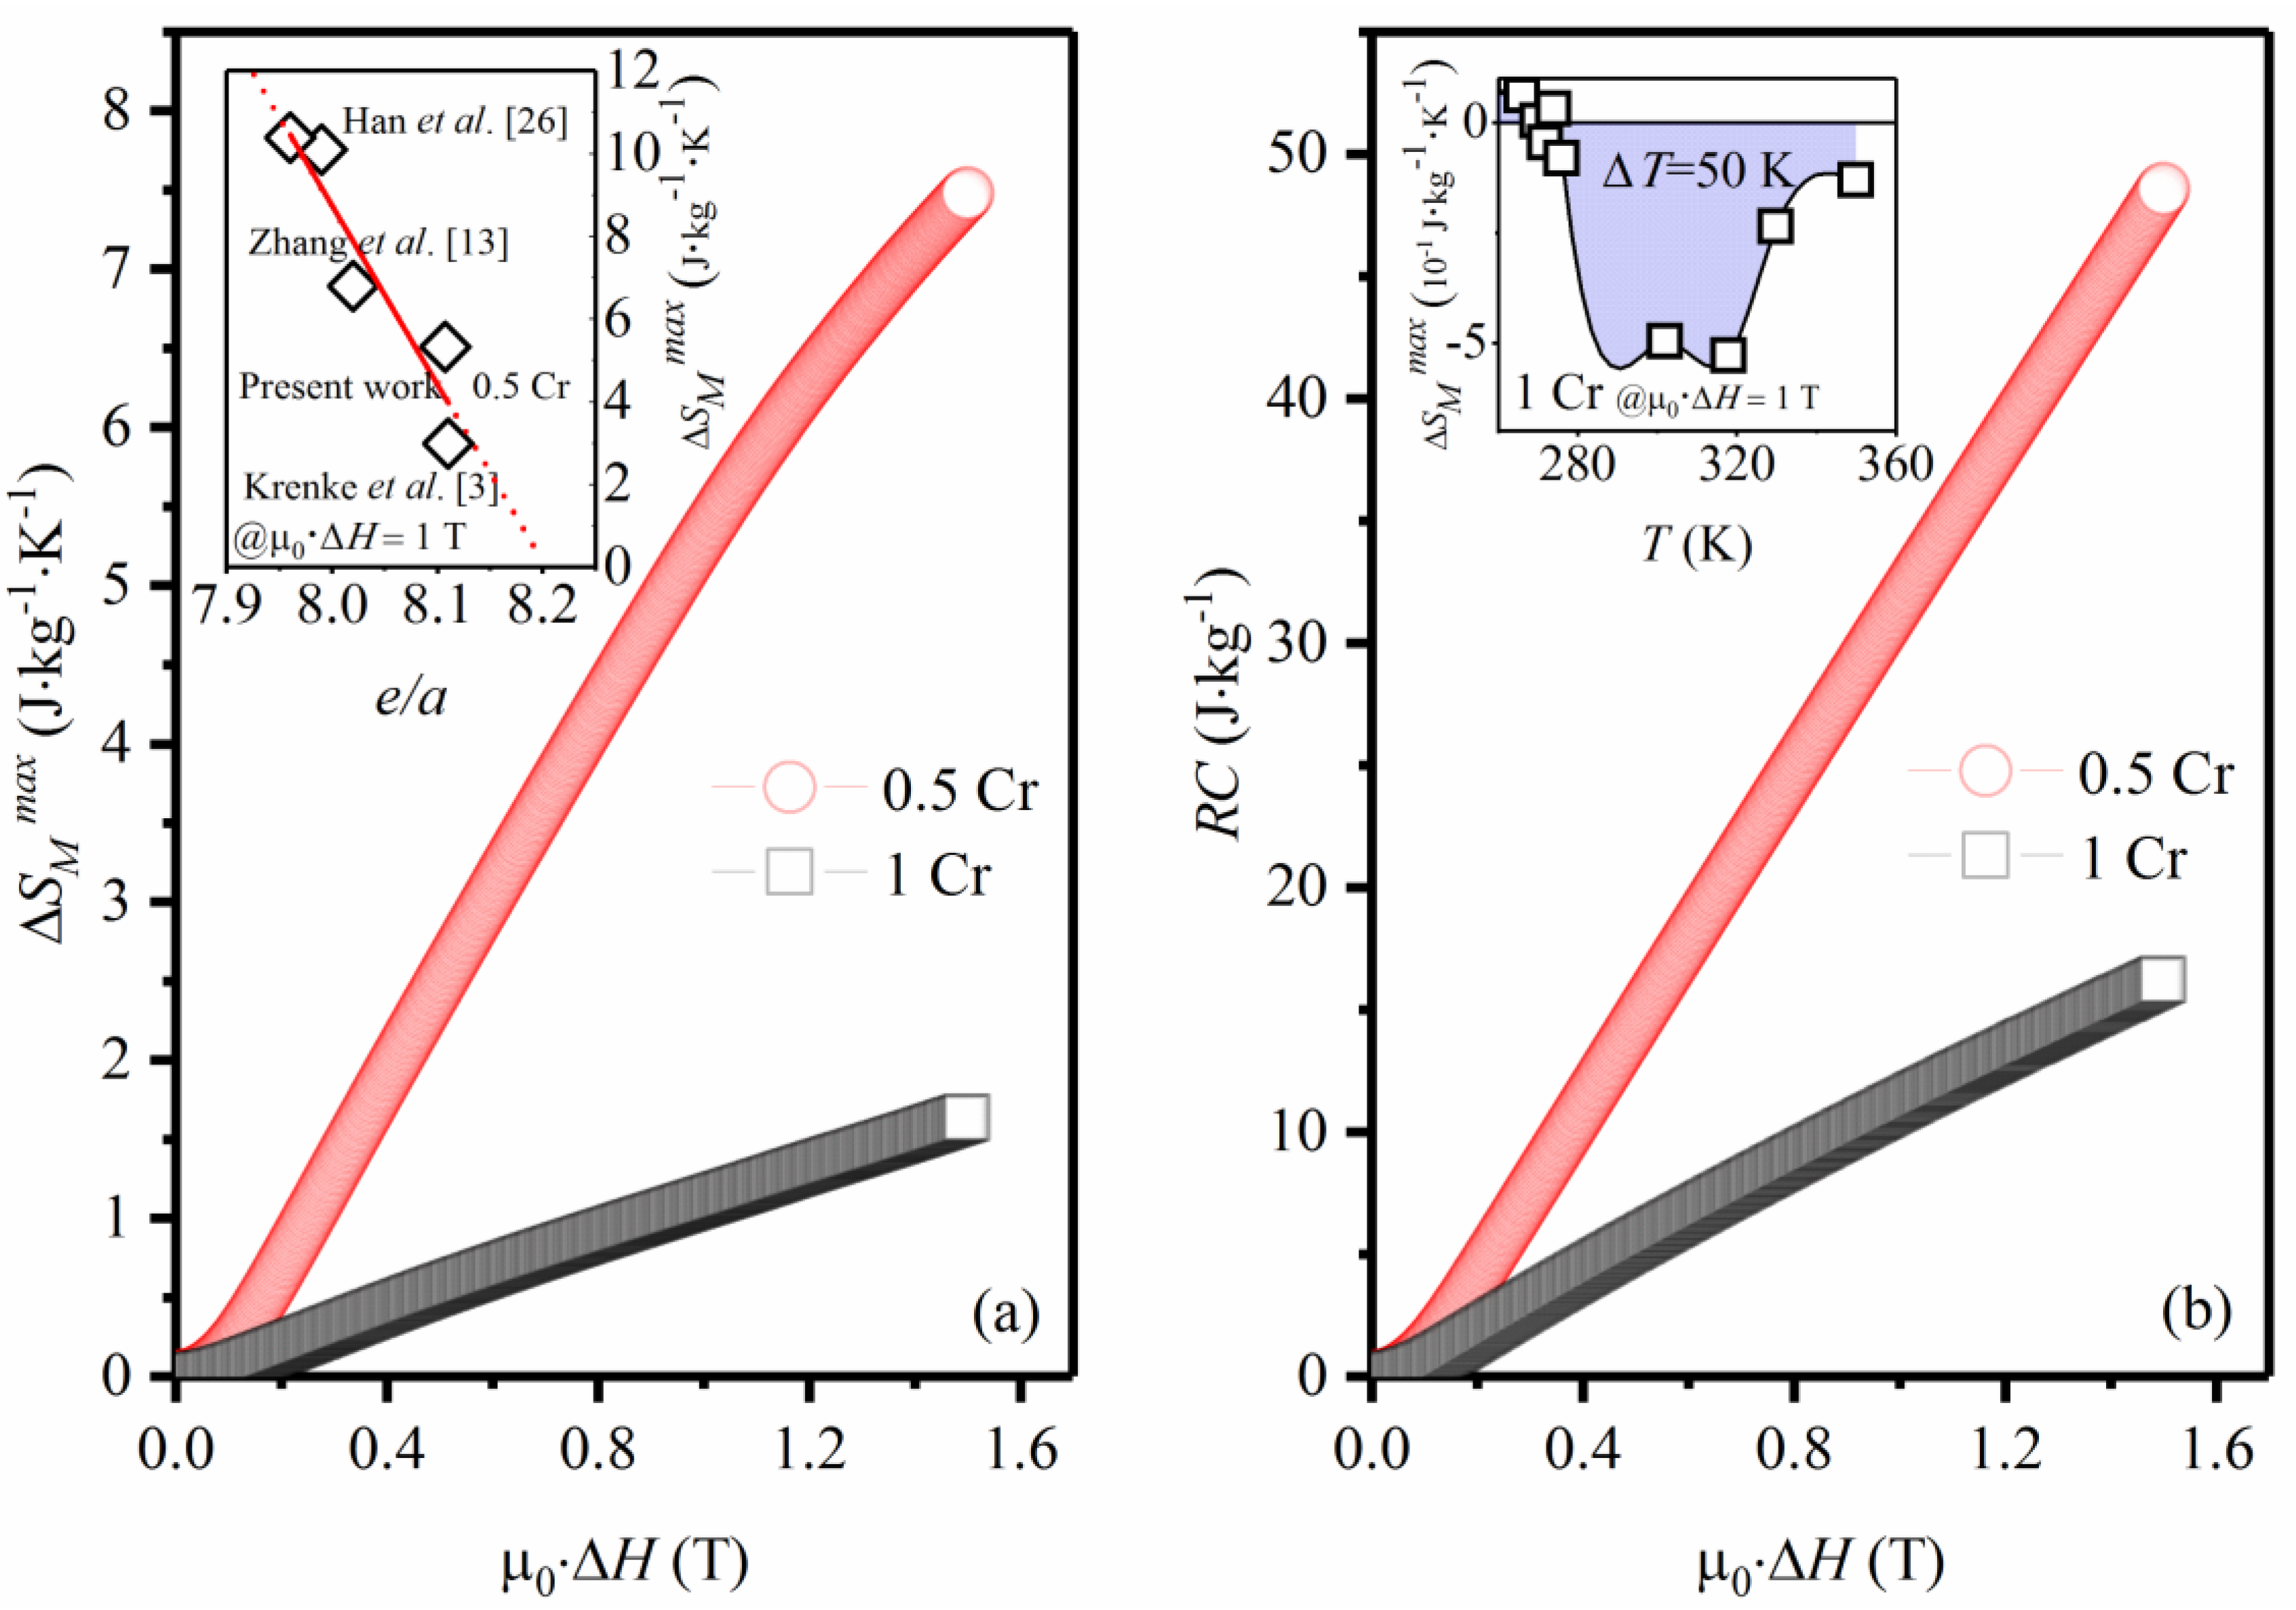
The comparison between Δ
SM max and
RC for both the 0.5 Cr and 1 Cr alloys as a function of the magnetic field change is given in
Figure 7. Both parameters increase with increasing magnetic field intensity to up 1.5 T. The
RC shows a linear dependence on the μ
0·Δ
H (
Figure 7b), whereas the Δ
SM max also initially increases linearly to around 1 T, then deviates from linear behaviour (
Figure 7a). The magnitude of the Δ
SM max determined for the 0.5 Cr is nearly five times larger than the Δ
SM max value obtained for the 1 Cr alloy. The
RC shown by the 0.5 Cr is three times the
RC obtained with the 1 Cr. The inset in
Figure 7a illustrates the dependence of the Δ
SM max on
e/a (literature values [
3,
13,
26]) under μ
0·Δ
H = 1 T for various Ni–Mn–Sn alloys, whose composition was modified by varying Ni/Mn and Mn/Sn ratio (Mn ≥ 37 at.%). The result determined for the 0.5 Cr alloy is also plotted for reference. It is seen from the inset that the Δ
SM max progressively decreases with increasing
e/a, which can be understood in relation to the
TM and
TC A dependence on the
e/
a.
On the whole, it is shown that the studied 0.5 Cr and 1 Cr alloys demonstrate significant differences in terms of their thermomagnetic behaviour and accompanying Δ
SM vs. temperature dependencies, which result from the changes in composition and the microstructure. On average, the 0.5 Cr alloy is identified with the single Ni
49.6Mn
37.3Cr
0.7Sn
12.4 phase (
e/a = 8.107), whereas the 1 Cr alloy displays a multiphase microstructure with the dominant matrix of average Ni
52.4Mn
32.7Cr
1Sn
14 composition (
e/a = 8.146). The 0.5 Cr alloy undergoes MPT at a higher temperature (
TM A→M = 239 K) relative to the 1 Cr alloy (
TM A→M = 223 K) despite the lower
e/a ratio (
Figure 3). This finding resonates with experimentally established evidence that Mn-rich Heusler systems do not always conform to the
e/a vs.
TM dependence [
11,
18]. Alternatively, the decrease in
TM might be justified by the weakening in hybridization states between Ni and Mn stemming from the lower Mn content in the 1 Cr alloy. This fits with the fact that
TM in Mn-rich Heusler alloys appears to suffer from Ni or Mn depletion, which points to the role of the extent of hybridization between the Ni 3d states and the 3d states of the excess Mn atoms at Sn sites (Mn
Sn) in driving the transition [
11,
27,
28]. In the present study, consistent with experimental findings,
TM is found to decrease with increased Ni/Mn ratio; the Ni/Mn for the 0.5 Cr is determined at 1.3, whereas that for 1 Cr is equal to 1.6. The average matrix composition of the 1 Cr alloy is therefore nearer to the stoichiometric Ni
2MnSn than the 0.5 Cr and, at stoichiometric composition, Ni–Mn–Sn does not undergo MPT [
29]. The stronger hybridization between Ni and Mn in the 1 Cr alloy might therefore in this light account for the strengthened covalent bond and, thus, a more stable L2
1 structure with lower
TM.
The Curie temperature for both alloys is found to be equal to 308 K, which confirms its poor sensitivity to composition change. The lower magnetisation of the 1 Cr alloy across the MPT compared to the 0.5 Cr alloy may be related to the lower fraction of ferromagnetic austenite undergoing the MPT in the former, which also accounts for the lower Δ
M (
Figure 4 and
Figure 5). Another factor reducing the ferromagnetic exchange in the austenite phase and, thus, Δ
M is the smaller contribution of Mn to the net magnetic moment due to diminished Mn concentration in the 1 Cr specimen; it is well established that the magnetic moment in Ni–Mn-based systems is chiefly confined to Mn atoms [
30]. On the contrary, the similar level of magnetisation between the samples at the lowest temperatures (100 K) may result from the stronger antiferromagnetic (AFM) exchange, typically setting in below 100 K in Mn-rich alloys [
6,
31] and, in this instance, also nurtured by higher Mn content in the 0.5 Cr: i.e., Mn
Sn antisites giving rise to stronger AFM coupling [
32]. Hence, although the martensite fraction is limited in the 1 Cr alloy, it nonetheless shows similarity to the 0.5 Cr ferromagnetic exchange, since more enhanced AFM exchange in the 0.5 Cr compromises the ferromagnetic interaction and in this way compensates for the lower martensite fraction in the 1 Cr sample.
Although the Δ
M within the MPT transition range is smaller in the 1 Cr alloy than in the 0.5 Cr, the MPT in the 1 Cr sample occurs over a broader temperature range, which is then mirrored in the more widespread temperature dependence of the Δ
SM (
Figure 6). The multi-peak shape of the Δ
SM vs.
T curve in the 1 Cr alloy, unlike in the case of 0.5 Cr, may suggest multistep transformation spurred on by smeared composition. This would then also justify the observed temperature hysteresis between the FC and FH curves around the
TC A and well below the
TM in the case of the 1 Cr alloy (
Figure 3) [
33]. The
HL under the action of a magnetic field is simultaneously reduced in the 1 Cr due to the smaller fraction of the transforming martensite phase at each given temperature within the MPT temperature range (
Figure 5). Even if the Δ
SM in the case of the 1 Cr alloy shows extended temperature dependence, the maximum Δ
SM value obtainable is lower than with the 0.5 Cr. This is ascribed to the lower Δ
M across the MPT and since, according to the Clausius–Clapeyron (magnetic) relation the change in the Δ
SM in response to the change in the magnetic field is given by
, with decreasing Δ
M the Δ
SM accordingly decreases. Lower Δ
SM in the 1 Cr results in the lower net
RC, regardless of the fact that it spreads over a broader temperature interval. This demonstrates that effective MCE engineering is based on a subtle balance between the magnitude of the Δ
SM and its temperature dependence, with the avoidance of a significant compromise of one at the expense of another.
These results fall in line with recent literature reports on Ni–Mn–Sn systems and it is shown that, in general, the Δ
SM decreases with increasing
e/
a (inset
Figure 7a). It again can be traced to the diminishing Δ
M due to the increasing contribution of the paramagnetic state on both sides of the transformation, since in general the
T =
TC A − TM temperature decreases with increasing
e/a [
10]. It is also worth pointing out the relatively broad temperature span accompanying the direct MCE around the
TC A (inset
Figure 7b). However limited the second order, magnetic transformation takes place over a wide temperature window ~50 K, which, provided that the Δ
SM (<0) was enhanced, could potentially increase the effective
RC, beneficial for the total MCE response.


