The NMR2 Method to Determine Rapidly the Structure of the Binding Pocket of a Protein–Ligand Complex with High Accuracy


Laboratorium für Physikalische Chemie, ETH Zürich, Vladimir-Prelog-Weg 2, 8093 Zürich, Switzerland
*
Author to whom correspondence should be addressed.
Magnetochemistry 2018, 4(1), 12; https://doi.org/10.3390/magnetochemistry4010012
Submission received: 22 November 2017
/
Revised: 25 December 2017
/
Accepted: 4 January 2018
/
Published: 22 January 2018
(This article belongs to the Special Issue Nuclear Magnetic Resonance Spectroscopy)
Abstract
:Structural characterization of complexes is crucial for a better understanding of biological processes and structure-based drug design. However, many protein–ligand structures are not solvable by X-ray crystallography, for example those with low affinity binders or dynamic binding sites. Such complexes are usually targeted by solution-state NMR spectroscopy. Unfortunately, structure calculation by NMR is very time consuming since all atoms in the complex need to be assigned to their respective chemical shifts. To circumvent this problem, we recently developed the Nuclear Magnetic Resonance Molecular Replacement (NMR2) method. NMR2 very quickly provides the complex structure of a binding pocket as measured by solution-state NMR. NMR2 circumvents the assignment of the protein by using previously determined structures and therefore speeds up the whole process from a couple of months to a couple of days. Here, we recall the main aspects of the method, show how to apply it, discuss its advantages over other methods and outline its limitations and future directions.
1. Introduction
1.1. Structure-Based Drug Design
Most biological processes rely on highly specific protein–protein or protein–ligand inter-molecular interactions. Understanding and manipulating these interactions is the ultimate goal of drug design. Drug research, as we know it today, dates back nearly 100 years with advances in chemistry, including Avogadro’s atomic hypothesis, the benzene theory, and the ability to isolate and purify active ingredients from pharmaceutical plants [1]. The finding of active components was initially a serendipitous accident; a famous example is the discovery of penicillin by Alexander Fleming. However, while the ligand was found to have a specific effect, the target receptor(s) remained unknown. The search for its target was very time consuming, and the idea of rational design emerged as a possible solution to speed up the process. Drug research based on the structure–activity relationship, where a molecule is designed to specifically inhibit or promote an interaction, was augmented when X-ray crystallography started to be used to derive protein structures; the protein whose structure was first determined by X-ray was myoglobin and led to a Nobel Prize in 1962. Nowadays, drug discovery commonly starts by screening large libraries of molecules or fragments against a carefully selected drug target, with identified binders further optimized by molecular refinement or fragment-based design approaches. This approach was enabled by advances in biology (e.g., biochemistry, molecular biology and genomics) that drive the search for better drug targets. Further, progress in chemistry and bioinformatics allowed for the synthesis and screening of enormous compound libraries. These methods, however, are very error prone and require validation, preferentially by a complex structure at atomic resolution. To obtain atomic-level structures, X-ray crystallography is still the most widely used method, followed by NMR spectroscopy and cryo-electron microscopy. The latter method is quickly developing (Nobel Prize in chemistry 2017) and shows great potential in drug discovery for large systems. Of particular interest are methods that combine several approaches, including the Nuclear Magnetic Resonance Molecular Replacement (NMR2) method (Figure 1).
1.2. The NMR2 Method
NMR spectroscopy is often the only method able to determine complex structures with ligands, which are typically either part of very dynamic interactions or in fast exchange. Unfortunately, NMR is rather slow in structure determination, since all atoms must be assigned to their respective chemical shifts, which requires long measurements and intensive analysis. However, most often the information in the binding site instead of the whole protein is of interest. In those cases, NMR2 represents a good alternative. NMR2 utilizes exact spatial information provided by solution-state NMR to locate and refine the binding pocket of the complex structure using an independent starting model of the receptor (e.g., X-ray structure of a homolog), and performs this analysis without the need for protein resonance assignment. NMR2 has successfully determined several structures of complexes very accurately (within 1 Å) with only a few days of measurement and calculation time.
1.3. The NMR2 Protocol
To successfully use NMR2, the following steps are required (Figure 2):
- (i)
- sample preparation for NMR measurements: uniformly 13C,15N labeled, or selective labeling schemes (e.g., isoleucine, leucine, and valine methyl labeling) can be used for the protein [2]. This can be achieved by recombinant expression, e.g., in E. coli [3]. Only one of the two molecules in the complex should be isotopically labeled. For strong binders, i.e., low µM and higher affinity (koff < ΔCS and koff < σ, where koff represents the dissociation rate, ΔCS the chemical shift difference of the bound and free states, and σ the cross-relaxation rate), an equimolar ligand to protein ratio is optimal; whereas for weak binders, i.e., high µM and lower affinity (koff > ΔCS), an excess of ligand is required to saturate the receptor as much as possible. This can be monitored by so-called chemical shift mapping experiments, where the ligand is titrated to the protein and binding is detected through perturbation of the backbone NH chemical shifts of the receptor in 1H,15N-HSQC or TROSY experiments [4,5,6,7]. Knowing the affinity of the small molecule for its receptor, the protein saturation can be calculated with the following formula:where PL, L, P and KD are the concentration of the complex, the concentration of the ligand, the concentration of the protein, and the affinity of the ligand for the protein. The subscript ‘tot’ stands for total concentration.
- (ii)
- Recording experiments to assign the ligand. Usually standard NMR spectra are sufficient to assign the compound in the bound state, e.g., any combination of 13C 1D, 1D DEPT-90, and 1D DEPT-135 spectra [8], 2D 13C,1H-HMQC [9], 2D 13C,1H-HMBC, 2D 1H,1H-DQF COSY [10,11], F1,F2-15N,13C-filtered 1H,1H-TOCSY, or 2D F1,F2-15N,13C-filtered 1H,1H-NOESY spectra [12,13,14,15,16,17,18,19,20,21].
- (iii)
- Measurement of the ligand intra- and ligand–protein inter-molecular distances. All distance restraints for NMR2 are derived from NOE (nuclear Overhauser enhancement) cross-peaks of F1-15N,13C-filtered 1H,1H-NOESY spectra [16,17,18,19,20,21]. These experiments suppress the intra-molecular NOEs peaks from the receptor and render the spectra easier to interpret. In theory, any moiety of the receptor can be analyzed, but to reduce the ambiguity of possible options, the NOEs should be assigned to methyls, amides, or aromatics with respect to their chemical shifts. Focusing only on distinct groups of resonances in the receptor helps to minimize the computational time of the structure calculation. Using methyl groups was so far successful for all complexes. In addition, the NOESY mixing times have to be chosen carefully. The optimal mixing times for the NOE build-ups depend on the correlation time of the complex. Too short of a mixing time would not allow for enough transfer of magnetization and inter-molecular NOE peaks will stay weak or below the noise level. Too long of a mixing time would increase spin diffusion and lead to large signal intensities, but these would require heavy calculations to translate into meaningful distances. In general, NOESY mixing times between 40 and 150 ms are reasonable for a 15–20 kDa protein, exhibiting a correlation time of approximately 10 ns.
The slope of the linear growth of the NOE build-up curve contains the information about inter-protons distances. Under the assumption of an isolated spin-pair system, the inter-molecular NOE cross-peak intensity, ΔMij(t), is
where ρi is the auto-relaxation rate of the proton i, ΔMii(0) the initial magnetization, σij the cross-relaxation rate, rij the proton(i)–proton(j) distance, μ0 the permeability of free space, ħ the reduced Planck constant, 𝛾H the gyromagnetic ratio of the proton and 𝜏c the rotational correlation time of the protein–ligand complex [22,23].
From Equations (1) and (2), we can derive σij given that fitting the decays of the ligand diagonal peaks provides the auto-relaxation rates and the initial magnetization. If the auto-relaxation rates of the protein groups are missing, because the protein diagonal peaks are suppressed from the F1-15N,13C-filtered 1H,1H-NOESY, the median of other groups is a good estimate. The fits can be made using general software such as matlab, python, and R or using the previously published eNORA software that contains an applet for fitting NOE build-up curves [24,25]. The influence of a slightly incorrect auto-relaxation rate on the inter-proton distance, rij, is negligible. However, the initial magnetization is crucial because it is directly multiplied with the cross-relaxation rate. After the fitting of all build-up and decay curves, we can derive a set of intra-ligand and inter-protein–ligand cross-relaxation rates that need to be converted into distances.
To convert cross-relaxation rates into distances, the following has to be kept in mind: in the case of a strong binder, slow exchange regime on the NMR time scale, the correlation time of the complex is the same as the one of the protein, since the influence of the small molecule on the tumbling of the protein can be neglected. In this case, Equations (1)–(6) can be readily used.
In the case of a weak binder, fast exchange regime on the NMR time scale, the effective cross-relaxation rate is the population average between the free and bound states of the ligand [26,27]:
Since the correlation time of the ligand is on the order of picoseconds, the first term can be neglected and, as mentioned above, the correlation time of the complex can be displayed as the correlation time of the protein. Consequently, the effective cross-relaxation rate is defined by the bound population of the ligand and the correlation time of the protein:
Finally, the correlation time of the protein can be determined by standard 15N relaxation experiments and used to convert the cross-relaxation rates to distances using Equations (4–6) [28].
A second way to derive distances from cross-relaxation rates is by using the known fixed intra-molecular distances within the ligand (e.g., protons in an aromatic ring) to calibrate the cross-relaxation rates and derive all other distances using Equation (4):
As a rule of thumb, the intra-ligand distances should be slightly shorter than the inter-molecular distances and the median value of all distance should be around ~4.0–4.2 Å, while the median distance of the intermolecular distances is around of 4.4 Å.
- (iv)
- Choosing the input structure. As an input structure, the protein in its apo form, with another bound ligand, or a homolog can be used to derive a starting model of the receptor. Either X-ray or NMR structures can be provided. In the current state of the program, the user should prepare the following input files: a CYANA-regularized protein PDB file, a ligand CYANA library file that can be generated with the program cylib [29], a sequence file containing the amino acid residues of the protein followed by sufficient linker residues (long enough so that the ligand can access all the protein surface) and the ligand residue name as defined in the ligand library file. All these files are needed to produce the starting structure of the complex where the protein structure is identical to the chosen receptor and the ligand is randomly positioned in space but attached to the protein by the linker. Further details can be found in the CYANA manual.
- (v)
- Running NMR2. The NMR2 program screens all possible assignment moieties (usually methyl groups) of the protein and calculates the complex structures for all options. However, it is crucial to diminish the number of options in order to complete the calculations in a reasonable amount of time. This is achieved primarily by using only a fraction of the inter-molecular distances in the first calculation cycle, where only around 3–4 methyl groups of the protein are taken into account. The use of an input structure, the previously derived network of inter-molecular distances, and the use of triangle or tetra angle smoothing to rule out most of the false assignment possibilities are equally important for a manageable calculation time. As of now, NMR2 is a CYANA-based program and calculates all structures using the standard simulated annealing protocol [30]. The results are scored with respect to the target function, which represents a measure of how well the calculated structure fulfills the data. CYANA is the most widely used NMR structure calculation program, which is solely based on experimental data and the repulsive part of the van der Waals potential modeling the atom radii. No other force field is used and therefore the electrostatic potential of the molecules is not modelled. Nonetheless, if specific interactions are known or determined by experiments they can be added following the program syntax [30]. Only the best structures are kept for the next calculation cycle where more methyl groups with their respective inter-molecular distances are included. The calculation is finished when all experimental data have been used.
- (vi)
- Analyzing the results. The final complex structures have to be analyzed carefully to detect potential errors. NMR2 requires a definition of the receptor flexibility; however, if there are no restraints on backbone and side chain atoms, the protein will freely move to fulfill the distance restraints, which could potentially yield false positives. Another source of false positives is when the ligand finds its binding site at the N- or C-terminus of the protein or where the protein atom density is the lowest. There, the ligand can freely adopt its position and orientation to fulfill the distance restraints because little or no steric inter-molecular interactions are present. One should keep in mind that this is happening only if the protein contains methyl groups at these sites.
Finally, the quantity and quality of inter-molecular distances are critical. While theoretical considerations indicate that a maximum of six distances should, in principle, be sufficient, practically we observe that ~12–15 distances are the minimum needed to calculate a NMR2 structure (vide infra).
The NMR spectra should have a high signal to noise ratio as well as good resolution. They should also be free from water suppression artifacts, e.g., so-called pulse trains water suppression ‘w5’ or excitation sculpting that strongly modify nearby peak intensities [31].
1.4. Current Applications of NMR2
NMR2 has been successfully applied to calculate complex structures containing ligands in fast and slow exchange (Figure 3) [32,33]. Structures containing strong binders where the ligand is a peptidomimetic (MDMX-comp2, Figure 3a) or a small compound (HDM2-pip, HDM2-nutlin complex, Figure 3b,c) have been determined with an accuracy relative to reference structure of 0.9–1.5 Å. Presently, the receptors were up to 32.1 kDa in size, exemplified by ABL kinase-destatinib (in silico data) where the NMR2-derived structure has a root-mean-square deviation (RMSD) of 1.1 Å to the previously published complex (Figure 3d). For ligands in fast exchange, so far two structures have been determined (MDMX-SJ212 and HDM2-#845, Figure 3e,f). The NMR2-derived SJ212-MDMX structure is consistent with the previously published complex structure with an RMSD of 1.35 Å. HDM2-#845 represents a new complex, where no previous structure existed. A thorough validation of the NMR2 structure was performed showing the correctness of the structure with 3D 15N,13C-resolved 1H,1H-NOESY, and F1- 13C,15N-filtered 3D N-resolved 1H,1H-NOESY-HSQC, Saturation Transfer Difference (STD) experiments and chemical shift perturbations [33].
How many distances are needed to successfully run NMR2 depends on the complex structure: How large and well defined is the binding pocket, how flexible is the ligand, etc. For the previously published complexes, the ligands in slow exchange contained 16–23 inter-molecular restraints or 29 in silico restraints (for the ABL kinase-destatinib), all of which comprise distances between methyl groups of the receptor and the ligand protons. For the weakly binding ligands, 14 and 21 inter-molecular distances between the ligand and the receptor were collected, with most distances involving methyl groups of the receptor. However, in the case of HDM2-#845, one distance was included in either an amide or aromatic group of the protein.
Choosing the right input structure for NMR2 is not very critical. In the example of HDMX in complex with cmpd2, it was shown that the input structure can be either the apo-protein or a structure with another ligand, or from a homolog. The input structures can also be determined by NMR or X-ray [32]. Remarkably, NMR2 also succeeded in finding the right complex structure of the binding site using an apo-protein as the input structure, wherein the ligand binding site was closed by one receptor helix. This case was very challenging, since the receptor undergoes an allosteric conformational change upon ligand binding, which moves the helix away from the binding site. During the NMR2 calculations, enough flexibility was given in the loops, with the helices and β-sheets being constrained by hydrogen bonds, and finally yielded to a NMR2 structure with an RMSD of 1.8 Å to the previously published structure.
1.5. NMR2 versus Other Methods for Rapid Structure Calculations of Protein–Ligand Complexes
Most complex structures are analyzed by X-ray crystallography due to its speed and high degree of automation. However, weak binders often do not crystalize well. Furthermore, X-ray does not contain information on dynamics, and crystal packing can lead to artifacts. The latter is demonstrated in the case of HDM2-nutlin where the NMR2 structure is different compared to previously published structures (PDB: 4hg7, 4e3j) that contain crystal packing artifacts, but matches perfectly the artifact-free structure, 5c5a [32]. In cases involving weak binders, NMR spectroscopy is currently the best method to provide high resolution structural data. Recently, attempts to derive structures and/or dynamics of protein–ligand complexes by NMR more efficiently, when compared to the traditional structure calculation protocol, have been proposed including the use of ambiguous restraints [38,39] (such as ambiguous NOEs), chemical shift perturbations [40,41,42,43,44], or saturation transfer experiments [45,46] in combination with computational methods such as docking and scoring [47,48,49]. Here, we describe the advantages and disadvantages of NMR2 over some of the most commonly used techniques to quickly determine complex structures by NMR. The methods can be divided into two main classes: the data are derived from chemical shift perturbation (CSP) or NOEs.
Methods using CSP usually record an 1H,15N-HSQC spectrum of the apo-receptor, where each peak corresponds to one amino acid of the backbone. The ligand is then titrated and residues in close proximity to the interaction site are perturbed. These shifts are remarkably large when caused by ring currents produced by aromatic moieties in the ligand. While CSP is difficult to quantitatively interpret, progress in simulations and correlating shifts with secondary and tertiary structure has made it possible to transfer chemical shifts into structural restraints [50,51,52]. This made a more quantitative interpretation of CSP possible [6,44,53,54,55,56,57,58]. One example of quantitative CSP is the J-surface-based method: it uses the finding that most of the drugs have aromatic rings involved in the binding (95% in one major drug design database [43]) and that the chemical shift difference due to ring current shift can be converted into a distance [59]. This information is used to construct a so-called J-surface, designed from spheres of the distances, where the ligand could be located. The intersection of the spheres from all of the shifted protons represents the ring location. Because of the complexity of the chemical shifts’ dependence with respect to the structure of the complex, the structure prediction initially requires a spatial sampling and scoring step to define the ligand binding site (high density region of the J-surface). This is subsequently followed by an experimentally restraint-based optimization of the ligand binding mode.
An advantage of CSP-based methods over NMR2 is that, in many cases, CSP is detectable even when no inter-nuclear NOEs are observable [53]. Poor solubility, low affinity, conformational variation of the ligand or few protons in the ligand are the most common difficulties that limit the detection of NOEs.
The disadvantages of CSP are that the protein backbone resonances have to be known for the free and the bound state, which can be very time consuming or sometimes not possible. The latter can occur when the protein undergoes chemical exchange in the intermediate regime, which leads to severe intensity loss of the amide resonances, like in the case of the apo-HDMX. Furthermore, chemical shifts are generally measured for the protein backbone atoms, but usually side chains (such as methyl groups) are primarily involved in binding of the ligand. Note, the CSP method works also on shifts on side chain atoms; however, this would require resonance assignment of the whole protein and is therefore usually not performed. Additionally, CSP works best for weak binders in fast exchange with the receptor (usually KD weaker than 1 µM) so that the resonances can be followed during a titration. Additionally, CSP will not be treated differently for ligands with slight chemical modifications. This is a clear drawback since often already small chemical modification in the ligand can induce a change in its orientation. Finally, the CSP-based methods also use a docking scoring protocol that relies on force fields or scoring function. The most popular program used in NMR is CSP-HADDOCK [40,47,60], which can make use of a large set of additional experimental restraints such as residual dipolar couplings or pseudocontact shifts [41,61,62]. Other docking programs are BiGGER [63], AutoDockFilter [64], SAMPLEX [65], and LIGDOCK [47].
The second class of protein–ligand structure determination methods involves the usage of NOEs or spin diffusion as experimental restraints. Example methods include SOS-NMR [45,47], NOE matching [49], INPHARMA [48,66,67], CORCEMA [46,68,69], or NMR2 [32,33]. Except for NMR2, these methods require a docking step prior to the experimentally based scoring of the found poses and eventually perform an experimentally based refinement step. For example, the NOE matching method generates trial ligand binding poses (e.g., from docking), uses them to back predict the 3D 13C-edited-13C,15N-filtered HSQC-NOESY spectrum and scores each complex with respect to how well its back predicted spectrum matches the measured data. This method has the same advantages as NMR2: there is no need for protein resonance assignment and one sample is sufficient for these studies. Similarly, as is the case for NMR2, NOE matching is applicable for ligands in fast and slow exchange. One limiting factor is the strong dependence on the input binding poses. The true binding poses have to be sampled in the first place in order to be found by the program.
SOS-NMR (structural information using Overhauser effects and selective labeling) utilizes STD NMR on many ligand–protein complexes where the receptor is labeled specifically on certain amino acid types while the rest of the receptor is deuterated. With this approach, STD shows the contacts to the specific amino acid types in the receptor and the NOEs derive the respective distances. SOS-NMR gives the amino acid composition of the ligand binding site and, if an input structure of the receptor is available, leads to the 3D structure of the complex. The advantages are that no protein resonance assignment is necessary, only a very little amount of protein (less than 1 mg) is needed, and it is applicable for high molecular weight targets since only the free ligand is detected. The disadvantages are that many samples are required using specific labeling schemes, which may be tedious and it needs a prior docking step of the ligand into the binding site, such as DOCK [70,71].
CORCEMA [46,68,69] and INPHARMA [48,67,72,73] are methods that back predict intra-ligand, intra-protein and protein–ligand NOEs or spin diffusion using the full relaxation matrix formalism. They are powerful tools that can also handle systems undergoing multistate conformational exchange and chemical exchange between the free and bound states. Protein resonance assignment is not required but input structures of the complex should be provided as well as the exchange rates and the correlation time of the complex. The INPHARMA method additionally requires two ligands that compete for the same binding site. As for the other methods, the back predicted data are compared to the experimental data to assess the quality of the docking poses.
To summarize, NMR2 is currently a purely NOE-based method and requires at least ~12–15 inter-molecular NOEs. This is a limiting factor, especially for low-affinity binders, which may lack enough or sufficiently strong inter-molecular NOEs. Furthermore, NMR2 is not applicable for completely unknown complexes or protein families, since it requires an input structure. NMR2 is applicable to most exchange regimes, the only limit being the case of severe exchange-broadening. The main advantages are that it does not need any protein resonance assignment, relies on simple and interpretable NMR experiments, requires only one sample, and performs standard NMR structure calculations instead of relying on docking poses. It provides the full structure of the complex of the binding site with high accuracy, since the distance restraints are based on accurate NOEs [24,74,75]. Additionally, it is applicable to weak and strong binders in fast or slow exchange and the method is fast.
2. Conclusions and Outlook
X-ray crystallography molecular replacement [76] is the prime method used to establish structure–activity relationships of relevant small molecules [77]. Such an approach was not feasible by NMR, as NMR structure determination relies on the assignment of the protein resonances, which can be extremely long and tedious [28]. In recent decades, various methods have been developed in order to derive protein–ligand complex structures faster than with the classical NMR structure calculation protocol, but these methods mostly rely on a preliminary docking step rather than on experimentally driven calculations. Moreover, sometimes partial resonance assignments of the receptor are required [39,40,41,42,43,44,45,47,49,72]. A complex structure calculation method that is based on defined and accurate NOEs [78,79,80] but also bypasses the long and tedious protein assignment step was missing. Therefore, the NMR molecular replacement method (NMR2), a new molecular replacement-like approach in NMR, allows for the fast determination of protein–ligand complex structures and fills an important gap in structural biology. NMR2 yielded the structures of ligand (peptide and small molecule)/protein complexes with an accuracy of 1 Å. It requires the measurement of few accurate inter-molecular distances and only a model of the protein receptor. It is a highly efficient way to determine protein/ligand complex structures, without the need to perform the tedious protein resonance assignment, and structures can be calculated within a couple of days. The method was demonstrated on several different complexes with strong or weak binders and will potentially compete with X-ray crystallography for rapid complex structure determination. Furthermore, the development of specific methyl labelling schemes and automatic methyl resonance assignment methods have opened an avenue toward the study of large molecular complexes [81,82,83]. Since our method strongly relies on sharp methyl NMR signals, the path to structure-based drug design on a large system, where classical NMR methods are limited, is wide open. We foresee great potential for our NMR Molecular Replacement method in drug discovery research where structural information is the gold standard for rational design of new active molecules.
Acknowledgments
We would like to thank Reid Alderson for proofreading this review. This work was supported by ETH Zürich. M.A.W. was supported by an Early Postdoc. Mobility Fellowship from the Swiss National Science Foundation.
Conflicts of Interest
The authors declare no conflict of interest.
References
- Drews, J. Drug discovery: A historical perspective. Science 2000, 287, 1960–1964. [Google Scholar] [CrossRef] [PubMed]
- Tugarinov, V.; Kay, L.E. Methyl groups as probes of structure and dynamics in nmr studies of high-molecular-weight proteins. Chembiochem 2005, 6, 1567–1577. [Google Scholar] [CrossRef] [PubMed]
- Mcintosh, L.P.; Dahlquist, F.W. Biosynthetic incorporation of n-15 and c-13 for assignment and interpretation of nuclear-magnetic-resonance spectra of proteins. Q. Rev. Biophys. 1990, 23, 1–38. [Google Scholar] [CrossRef] [PubMed]
- Pervushin, K.; Riek, R.; Wider, G.; Wuthrich, K. Attenuated t-2 relaxation by mutual cancellation of dipole-dipole coupling and chemical shift anisotropy indicates an avenue to nmr structures of very large biological macromolecules in solution. Proc. Natl. Acad. Sci. USA 1997, 94, 12366–12371. [Google Scholar] [CrossRef] [PubMed]
- Ziarek, J.J.; Peterson, F.C.; Lytle, B.L.; Volkman, B.F. Binding site identification and structure determination of protein-ligand complexes by nmr: A semiautomated approach. Methods Enzymol. 2011, 493, 241–275. [Google Scholar] [PubMed]
- Williamson, M.P. Using chemical shift perturbation to characterise ligand binding. Prog. Nucl. Mag. Reson. Spectrosc. 2013, 73, 1–16. [Google Scholar] [CrossRef] [PubMed]
- Zuiderweg, E.R.P. Mapping protein-protein interactions in solution by nmr spectroscopy. Biochemistry 2002, 41, 1–7. [Google Scholar] [CrossRef] [PubMed]
- Bendall, M.R.; Doddrell, D.M.; Pegg, D.T. Editing of c-13 nmr-spectra—A pulse sequence for the generation of subspectra. J. Am. Chem. Soc. 1981, 103, 4603–4605. [Google Scholar] [CrossRef]
- Bax, A.; Griffey, R.H.; Hawkins, B.L. Correlation of proton and n-15 chemical-shifts by multiple quantum nmr. J. Magn. Reson. 1983, 55, 301–315. [Google Scholar] [CrossRef]
- Aue, W.P.; Bartholdi, E.; Ernst, R.R. 2-dimensional spectroscopy—Application to nuclear magnetic-resonance. J. Chem. Phys. 1976, 64, 2229–2246. [Google Scholar] [CrossRef]
- Piantini, U.; Sorensen, O.W.; Ernst, R.R. Multiple quantum filters for elucidating nmr coupling networks. J. Am. Chem. Soc. 1982, 104, 6800–6801. [Google Scholar] [CrossRef]
- Ni, F. Complete relaxation matrix analysis of transferred nuclear overhauser effects. J. Magn. Reson. 1992, 96, 651–656. [Google Scholar] [CrossRef]
- Ni, F. Recent developments in transferred noe methods. Prog. Nucl. Magn. Reson. Spectrosc. 1994, 26, 517–606. [Google Scholar] [CrossRef]
- Ni, F.; Zhu, Y. Accounting for ligand-protein interactions in the relaxation-matrix analysis of transferred nuclear overhauser effects. J. Magn. Reson. Ser. B 1994, 103, 180–184. [Google Scholar] [CrossRef]
- Berger, S.; Braun, S. 200 and More Nmr Experiments: A Practical Course; Wiley: Weinheim, Germany, 2004. [Google Scholar]
- Breeze, A.L. Isotope-filtered nmr methods for the study of biomolecular structure and interactions. Prog. Nucl. Magn. Reson. Spectrosc. 2000, 36, 323–372. [Google Scholar] [CrossRef]
- Iwahara, J.; Wojciak, J.M.; Clubb, R.T. Improved nmr spectra of a protein-DNA complex through rational mutagenesis and the application of a sensitivity optimized isotope-filtered noesy experiment. J. Biomol. NMR 2001, 19, 231–241. [Google Scholar] [CrossRef] [PubMed]
- Kogler, H.; Sorensen, O.W.; Bodenhausen, G.; Ernst, R.R. Low-pass j-filters—Suppression of neighbor peaks in heteronuclear relayed correlation spectra. J. Magn. Reson. 1983, 55, 157–163. [Google Scholar] [CrossRef]
- Ogura, K.; Terasawa, H.; Inagaki, F. An improved double-tuned and isotope-filtered pulse scheme based on a pulsed field gradient and a wide-band inversion shaped pulse. J. Biomol. NMR 1996, 8, 492–498. [Google Scholar] [CrossRef] [PubMed]
- Otting, G.; Wuthrich, K. Heteronuclear filters in 2-dimensional [h-1, h-1] nmr-spectroscopy—Combined use with isotope labeling for studies of macromolecular conformation and intermolecular interactions. Q. Rev. Biophys. 1990, 23, 39–96. [Google Scholar] [CrossRef] [PubMed]
- Zwahlen, C.; Legault, P.; Vincent, S.J.F.; Greenblatt, J.; Konrat, R.; Kay, L.E. Methods for measurement of intermolecular noes by multinuclear nmr spectroscopy: Application to a bacteriophage lambda n-peptide/boxb rna complex. J. Am. Chem. Soc. 1997, 119, 6711–6721. [Google Scholar] [CrossRef]
- Macura, S.; Ernst, R.R. Elucidation of cross relaxation in liquids by two-dimensional nmr-spectroscopy. Mol. Phys. 1980, 41, 95–117. [Google Scholar] [CrossRef]
- Solomon, I. Relaxation processes in a system of 2 spins. Phys. Rev. 1955, 99, 559–565. [Google Scholar] [CrossRef]
- Orts, J.; Vogeli, B.; Riek, R. Relaxation matrix analysis of spin diffusion for the nmr structure calculation with enoes. J. Chem. Theory Comput. 2012, 8, 3483–3492. [Google Scholar] [CrossRef] [PubMed]
- Strotz, D.; Orts, J.; Chi, C.N.; Riek, R.; Vogeli, B. Enora2 exact noe analysis program. J. Chem. Theory Comput. 2017, 13, 4336–4346. [Google Scholar] [CrossRef] [PubMed]
- Reuben, J.; Fiat, D. Nuclear magnetic resonance studies of solutions of rare-earth ions and their complexes. 4. Concentration and temperature dependence of oxygen-14 transverse relaxation in aqueous solutions. J. Chem. Phys. 1969, 51, 4918–4927. [Google Scholar] [CrossRef]
- Lippens, G.M.; Cerf, C.; Hallenga, K. Theory and experimental results of transfer-noe experiments. 1. The influence of the off rate versus cross-relaxation rates. J. Magn. Reson. 1992, 99, 268–281. [Google Scholar] [CrossRef]
- Cavanagh, J.; Fairbrother, W.J.; Palmer, A.G.; Rance, M.; Skelton, N.J. Protein nmr spectroscopy principles and practice second edition preface. In Protein Nmr Spectroscopy: Principles and Practice, 2nd ed.; Academic Press: Burlington, MA, USA, 2007; pp. V–VI. [Google Scholar]
- Yilmaz, E.M.; Guntert, P. Nmr structure calculation for all small molecule ligands and non-standard residues from the pdb chemical component dictionary. J. Biomol. NMR 2015, 63, 21–37. [Google Scholar] [CrossRef] [PubMed]
- Guntert, P.; Mumenthaler, C.; Wuthrich, K. Torsion angle dynamics for nmr structure calculation with the new program dyana. J. Mol. Biol. 1997, 273, 283–298. [Google Scholar] [CrossRef] [PubMed]
- Liu, M.L.; Mao, X.A.; Ye, C.H.; Huang, H.; Nicholson, J.K.; Lindon, J.C. Improved watergate pulse sequences for solvent suppression in nmr spectroscopy. J. Magn. Reson. 1998, 132, 125–129. [Google Scholar] [CrossRef]
- Orts, J.; Walti, M.A.; Marsh, M.; Vera, L.; Gossert, A.D.; Guntert, P.; Riek, R. Nmr-based determination of the 3d structure of the ligand-protein interaction site without protein resonance assignment. J. Am. Chem. Soc. 2016, 138, 4393–4400. [Google Scholar] [CrossRef] [PubMed]
- Walti, M.A.; Riek, R.; Orts, J. Fast nmr-based determination of the 3d structure of the binding site of protein-ligand complexes with weak affinity binders. Angew. Chem. Int. Ed. 2017, 56, 5208–5211. [Google Scholar] [CrossRef] [PubMed]
- Kallen, J.; Goepfert, A.; Blechschmidt, A.; Izaac, A.; Geiser, M.; Tavares, G.; Ramage, P.; Furet, P.; Masuya, K.; Lisztwan, J. Crystal structures of human mdmx (hdmx) in complex with p53 peptide analogues reveal surprising conformational changes. J. Biol. Chem. 2009, 284, 8803–8812. [Google Scholar] [CrossRef] [PubMed]
- Michelsen, K.; Jordan, J.B.; Lewis, J.; Long, A.M.; Yang, E.; Rew, Y.; Zhou, J.; Yakowec, P.; Schnier, P.D.; Huang, X.; et al. Ordering of the n-terminus of human mdm2 by small molecule inhibitors. J. Am. Chem. Soc. 2012, 134, 17059–17067. [Google Scholar] [CrossRef] [PubMed]
- Tokarski, J.S.; Newitt, J.A.; Chang, C.Y.J.; Cheng, J.D.; Wittekind, M.; Kiefer, S.E.; Kish, K.; Lee, F.Y.F.; Borzillerri, R.; Lombardo, L.J.; et al. The structure of dasatinib (bms-354825) bound to activated abl kinase domain elucidates its inhibitory activity against imatinib-resistant abl mutants. Cancer Res. 2006, 66, 5790–5797. [Google Scholar] [CrossRef] [PubMed]
- Grace, C.R.; Ban, D.; Min, J.; Mayasundari, A.; Min, L.; Finch, K.E.; Griffiths, L.; Bharatham, N.; Bashford, D.; Guy, R.K.; et al. Monitoring ligand-induced protein ordering in drug discovery. J. Mol. Biol. 2016, 428, 1290–1303. [Google Scholar] [CrossRef] [PubMed]
- Nilges, M.; Macias, M.J.; ODonoghue, S.I.; Oschkinat, H. Automated noesy interpretation with ambiguous distance restraints: The refined nmr solution structure of the pleckstrin homology domain from beta-spectrin. J. Mol. Biol. 1997, 269, 408–422. [Google Scholar] [CrossRef] [PubMed]
- Nilges, M.; O’Donoghue, S.I. Ambiguous noes and automated noe assignment. Prog. Nucl. Magn. Reson. Spectrosc. 1998, 32, 107–139. [Google Scholar] [CrossRef]
- Dominguez, C.; Boelens, R.; Bonvin, A.M.J.J. Haddock: A protein-protein docking approach based on biochemical or biophysical information. J. Am. Chem. Soc. 2003, 125, 1731–1737. [Google Scholar] [CrossRef] [PubMed]
- Clore, G.M.; Schwieters, C.D. Docking of protein-protein complexes on the basis of highly ambiguous intermolecular distance restraints derived from h-1(n)/n-15 chemical shift mapping and backbone n-15-h-1 residual dipolar couplings using conjoined rigid body/torsion angle dynamics. J. Am. Chem. Soc. 2003, 125, 2902–2912. [Google Scholar] [CrossRef] [PubMed]
- Wang, B.; Westerhoff, L.M.; Merz, K.M. A critical assessment of the performance of protein-ligand scoring functions based on nmr chemical shift perturbations. J. Med. Chem. 2007, 50, 5128–5134. [Google Scholar] [CrossRef] [PubMed]
- McCoy, M.A.; Wyss, D.F. Spatial localization of ligand binding sites from electron current density surfaces calculated from nmr chemical shift perturbations. J. Am. Chem. Soc. 2002, 124, 11758–11763. [Google Scholar] [CrossRef] [PubMed]
- Cioffi, M.; Hunter, C.A.; Packer, M.J.; Spitaleri, A. Determination of protein-ligand binding modes using complexation-induced changes in h-1 nmr chemical shift. J. Med. Chem. 2008, 51, 2512–2517. [Google Scholar] [CrossRef] [PubMed]
- Hajduk, P.J.; Mack, J.C.; Olejniczak, E.T.; Park, C.; Dandliker, P.J.; Beutel, B.A. Sos-nmr: A saturation transfer nmr-based method for determining the structures of protein-ligand complexes. J. Am. Chem. Soc. 2004, 126, 2390–2398. [Google Scholar] [CrossRef] [PubMed]
- Jayalakshmi, V.; Krishna, N.R. Corcema refinement of the bound ligand conformation within the protein binding pocket in reversibly forming weak complexes using std-nmr intensities. J. Magn. Reson. 2004, 168, 36–45. [Google Scholar] [CrossRef] [PubMed]
- Schieborr, U.; Vogtherr, M.; Elshorst, B.; Betz, M.; Grimme, S.; Pescatore, B.; Langer, T.; Saxena, K.; Schwalbe, H. How much nmr data is required to determine a protein-ligand complex structure? Chembiochem 2005, 6, 1891–1898. [Google Scholar] [CrossRef] [PubMed]
- Orts, J.; Bartoschek, S.; Griesinger, C.; Monecke, P.; Carlomagno, T. An nmr-based scoring function improves the accuracy of binding pose predictions by docking by two orders of magnitude. J. Biomol. NMR 2012, 52, 23–30. [Google Scholar] [CrossRef] [PubMed]
- Constantine, K.L.; Davis, M.E.; Metzler, W.J.; Mueller, L.; Claus, B.L. Protein-ligand noe matching: A high-throughput method for binding pose evaluation that does not require protein nmr resonance assignments. J. Am. Chem. Soc. 2006, 128, 7252–7263. [Google Scholar] [CrossRef] [PubMed]
- Wishart, D.S.; Sykes, B.D. The c-13 chemical-shift index—A simple method for the identification of protein secondary structure using c-13 chemical-shift data. J. Biomol. NMR 1994, 4, 171–180. [Google Scholar] [CrossRef] [PubMed]
- Williamson, M.P.; Kikuchi, J.; Asakura, T. Application of h-1-nmr chemical-shifts to measure the quality of protein structures. J. Mol. Biol. 1995, 247, 541–546. [Google Scholar] [CrossRef]
- Wishart, D.S.; Watson, M.S.; Boyko, R.F.; Sykes, B.D. Automated h-1 and c-13 chemical shift prediction using the biomagresbank. J. Biomol. NMR 1997, 10, 329–336. [Google Scholar] [CrossRef] [PubMed]
- McCoy, M.A.; Wyss, D.F. Alignment of weakly interacting molecules to protein surfaces using simulations of chemical shift perturbations. J. Biomol. NMR 2000, 18, 189–198. [Google Scholar] [CrossRef] [PubMed]
- Cioffi, M.; Hunter, C.A.; Packer, M.J.; Pandya, M.J.; Williamson, M.P. Use of quantitative (1)h nmr chemical shift changes for ligand docking into barnase. J. Biomol. NMR 2009, 43, 11–19. [Google Scholar] [CrossRef] [PubMed]
- Shuker, S.B.; Hajduk, P.J.; Meadows, R.P.; Fesik, S.W. Discovering high-affinity ligands for proteins: Sar by nmr. Science 1996, 274, 1531–1534. [Google Scholar] [CrossRef] [PubMed]
- Farmer, B.T. Localizing the nadp(+) binding site on the murb enzyme by nmr. Nat. Struct. Biol. 1996, 3, 995–997. [Google Scholar] [CrossRef] [PubMed]
- Rajagopal, P.; Waygood, E.B.; Reizer, J.; Saier, M.H.; Klevit, R.E. Demonstration of protein-protein interaction specificity by nmr chemical shift mapping. Protein Sci. 1997, 6, 2624–2627. [Google Scholar] [CrossRef] [PubMed]
- Schmiedeskamp, M.; Rajagopal, P.; Klevit, R.E. Nmr chemical shift perturbation mapping of DNA binding by a zinc-finger domain from the yeast transcription factor adr1. Protein Sci. 1997, 6, 1835–1848. [Google Scholar] [CrossRef] [PubMed]
- McCoy, M.A.; Wyss, D.F. Structures of protein-protein complexes are docked using only nmr restraints from residual dipolar coupling and chemical shift perturbations. J. Am. Chem. Soc. 2002, 124, 2104–2105. [Google Scholar] [CrossRef] [PubMed]
- Trellet, M.; Melquiond, A.S.J.; Bonvin, A.M.J.J. A unified conformational selection and induced fit approach to protein-peptide docking. PLoS ONE 2013, 8, e58769. [Google Scholar] [CrossRef] [PubMed]
- Arnesano, F.; Banci, L.; Piccioli, M. Nmr structures of paramagnetic metalloproteins. Q. Rev. Biophys. 2005, 38, 167–219. [Google Scholar] [CrossRef] [PubMed]
- Otting, G. Prospects for lanthanides in structural biology by nmr. J. Biomol. NMR 2008, 42, 1–9. [Google Scholar] [CrossRef] [PubMed]
- Palma, P.N.; Krippahl, L.; Wampler, J.E.; Moura, J.J.G. Bigger: A new (soft) docking algorithm for predicting protein interactions. Proteins 2000, 39, 372–384. [Google Scholar] [CrossRef]
- Stark, J.; Powers, R. Rapid protein-ligand costructures using chemical shift perturbations. J. Am. Chem. Soc. 2008, 130, 535–545. [Google Scholar] [CrossRef] [PubMed]
- Krzeminski, M.; Loth, K.; Boelens, R.; Bonvin, A.M.J.J. Samplex: Automatic mapping of perturbed and unperturbed regions of proteins and complexes. BMC Bioinform. 2010, 11, 51. [Google Scholar] [CrossRef] [PubMed]
- Sanchez-Pedregal, V.M.; Reese, M.; Meiler, J.; Blommers, M.J.J.; Griesinger, C.; Carlomagno, T. The inpharma method: Protein-mediated interligand noes for pharmacophore mapping. Angew. Chem. Int. Ed. 2005, 44, 4172–4175. [Google Scholar] [CrossRef] [PubMed]
- Stauch, B.; Orts, J.; Carlomagno, T. The description of protein internal motions aids selection of ligand binding poses by the inpharma method. J. Biomol. NMR 2012, 54, 245–256. [Google Scholar] [CrossRef] [PubMed]
- Curto, E.V.; Moseley, H.N.B.; Krishna, N.R. Corcema evaluation of the potential role of intermolecular transferred noesy in the characterization of ligand-receptor complexes. J. Comput. Aided Mol. Des. 1996, 10, 361–371. [Google Scholar] [CrossRef] [PubMed]
- Moseley, H.N.B.; Curto, E.V.; Krishna, N.R. Complete relaxation and conformational exchange matrix (corcema) analysis of noesy spectra of interacting systems—2-dimensional transferred noesy. J. Magn. Reson. Ser. B 1995, 108, 243–261. [Google Scholar] [CrossRef]
- Kuntz, I.D.; Blaney, J.M.; Oatley, S.J.; Langridge, R.; Ferrin, T.E. A geometric approach to macromolecule-ligand interactions. J. Mol. Biol. 1982, 161, 269–288. [Google Scholar] [CrossRef]
- Kuntz, I.D.; Meng, E.C.; Shoichet, B.K. Structure-based molecular design. Accounts Chem. Res. 1994, 27, 117–123. [Google Scholar] [CrossRef]
- Orts, J.; Grimm, S.K.; Griesinger, C.; Wendt, K.U.; Bartoschek, S.; Carlomagno, T. Specific methyl group protonation for the measurement of pharmacophore-specific interligand noe interactions. Chem. Eur. J. 2008, 14, 7517–7520. [Google Scholar] [CrossRef] [PubMed]
- Orts, J.; Tuma, J.; Reese, M.; Grimm, S.K.; Monecke, P.; Bartoschek, S.; Schiffer, A.; Wendt, K.U.; Griesinger, C.; Carlomagno, T. Crystallography-independent determination of ligand binding modes. Angew. Chem. Int. Ed. 2008, 47, 7736–7740. [Google Scholar] [CrossRef] [PubMed]
- Vogeli, B.; Segawa, T.F.; Leitz, D.; Sobol, A.; Choutko, A.; Trzesniak, D.; van Gunsteren, W.; Riek, R. Exact distances and internal dynamics of perdeuterated ubiquitin from noe buildups. J. Am. Chem. Soc. 2009, 131, 17215–17225. [Google Scholar] [CrossRef] [PubMed]
- Vogeli, B.; Orts, J.; Strotz, D.; Chi, C.; Minges, M.; Walti, M.A.; Guntert, P.; Riek, R. Towards a true protein movie: A perspective on the potential impact of the ensemble-based structure determination using exact noes. J. Magn. Reson. 2014, 241, 53–59. [Google Scholar] [CrossRef] [PubMed]
- Rossmann, M.G.; Blow, D.M. Detection of sub-units within crystallographic asymmetric unit. Acta Crystallogr. 1962, 15, 24–31. [Google Scholar] [CrossRef]
- Hillisch, A.; Pineda, L.F.; Hilgenfeld, R. Utility of homology models in the drug discovery process. Drug Discov. Today 2004, 9, 659–669. [Google Scholar] [CrossRef]
- Schirmer, R.E.; Noggle, J.H. Quantitative application of nuclear overhauser effect to determination of molecular structure. J. Am. Chem. Soc. 1972, 94, 2947–2952. [Google Scholar] [CrossRef]
- Balaram, P.; Bothnerb, A.; Breslow, E. Localization of tyrosine at binding-site of neurophysin ii by negative nuclear overhauser effects. J. Am. Chem. Soc. 1972, 94, 4017–4018. [Google Scholar] [CrossRef]
- Kaiser, R. Intermolecular nuclear overhauser effect in liquid solutions. J. Chem. Phys. 1965, 42, 1838–1839. [Google Scholar] [CrossRef]
- Pritisanac, I.; Degiacomi, M.T.; Alderson, T.R.; Carneiro, M.G.; Eiso, A.B.; Siegal, G.; Baldwin, A.J. Automatic assignment of methyl-nmr spectra of supramolecular machines using graph theory. J. Am. Chem. Soc. 2017, 139, 9523–9533. [Google Scholar] [CrossRef] [PubMed]
- Chao, F.A.; Kim, J.; Xia, Y.; Milligan, M.; Rowe, N.; Veglia, G. Flamengo 2.0: An enhanced fuzzy logic algorithm for structure-based assignment of methyl group resonances. J. Magn. Reson. 2014, 245, 17–23. [Google Scholar] [CrossRef] [PubMed]
- Xu, Y.; Matthews, S. Map-xsii: An improved program for the automatic assignment of methyl resonances in large proteins. J. Biomol. NMR 2013, 55, 179–187. [Google Scholar] [CrossRef] [PubMed]
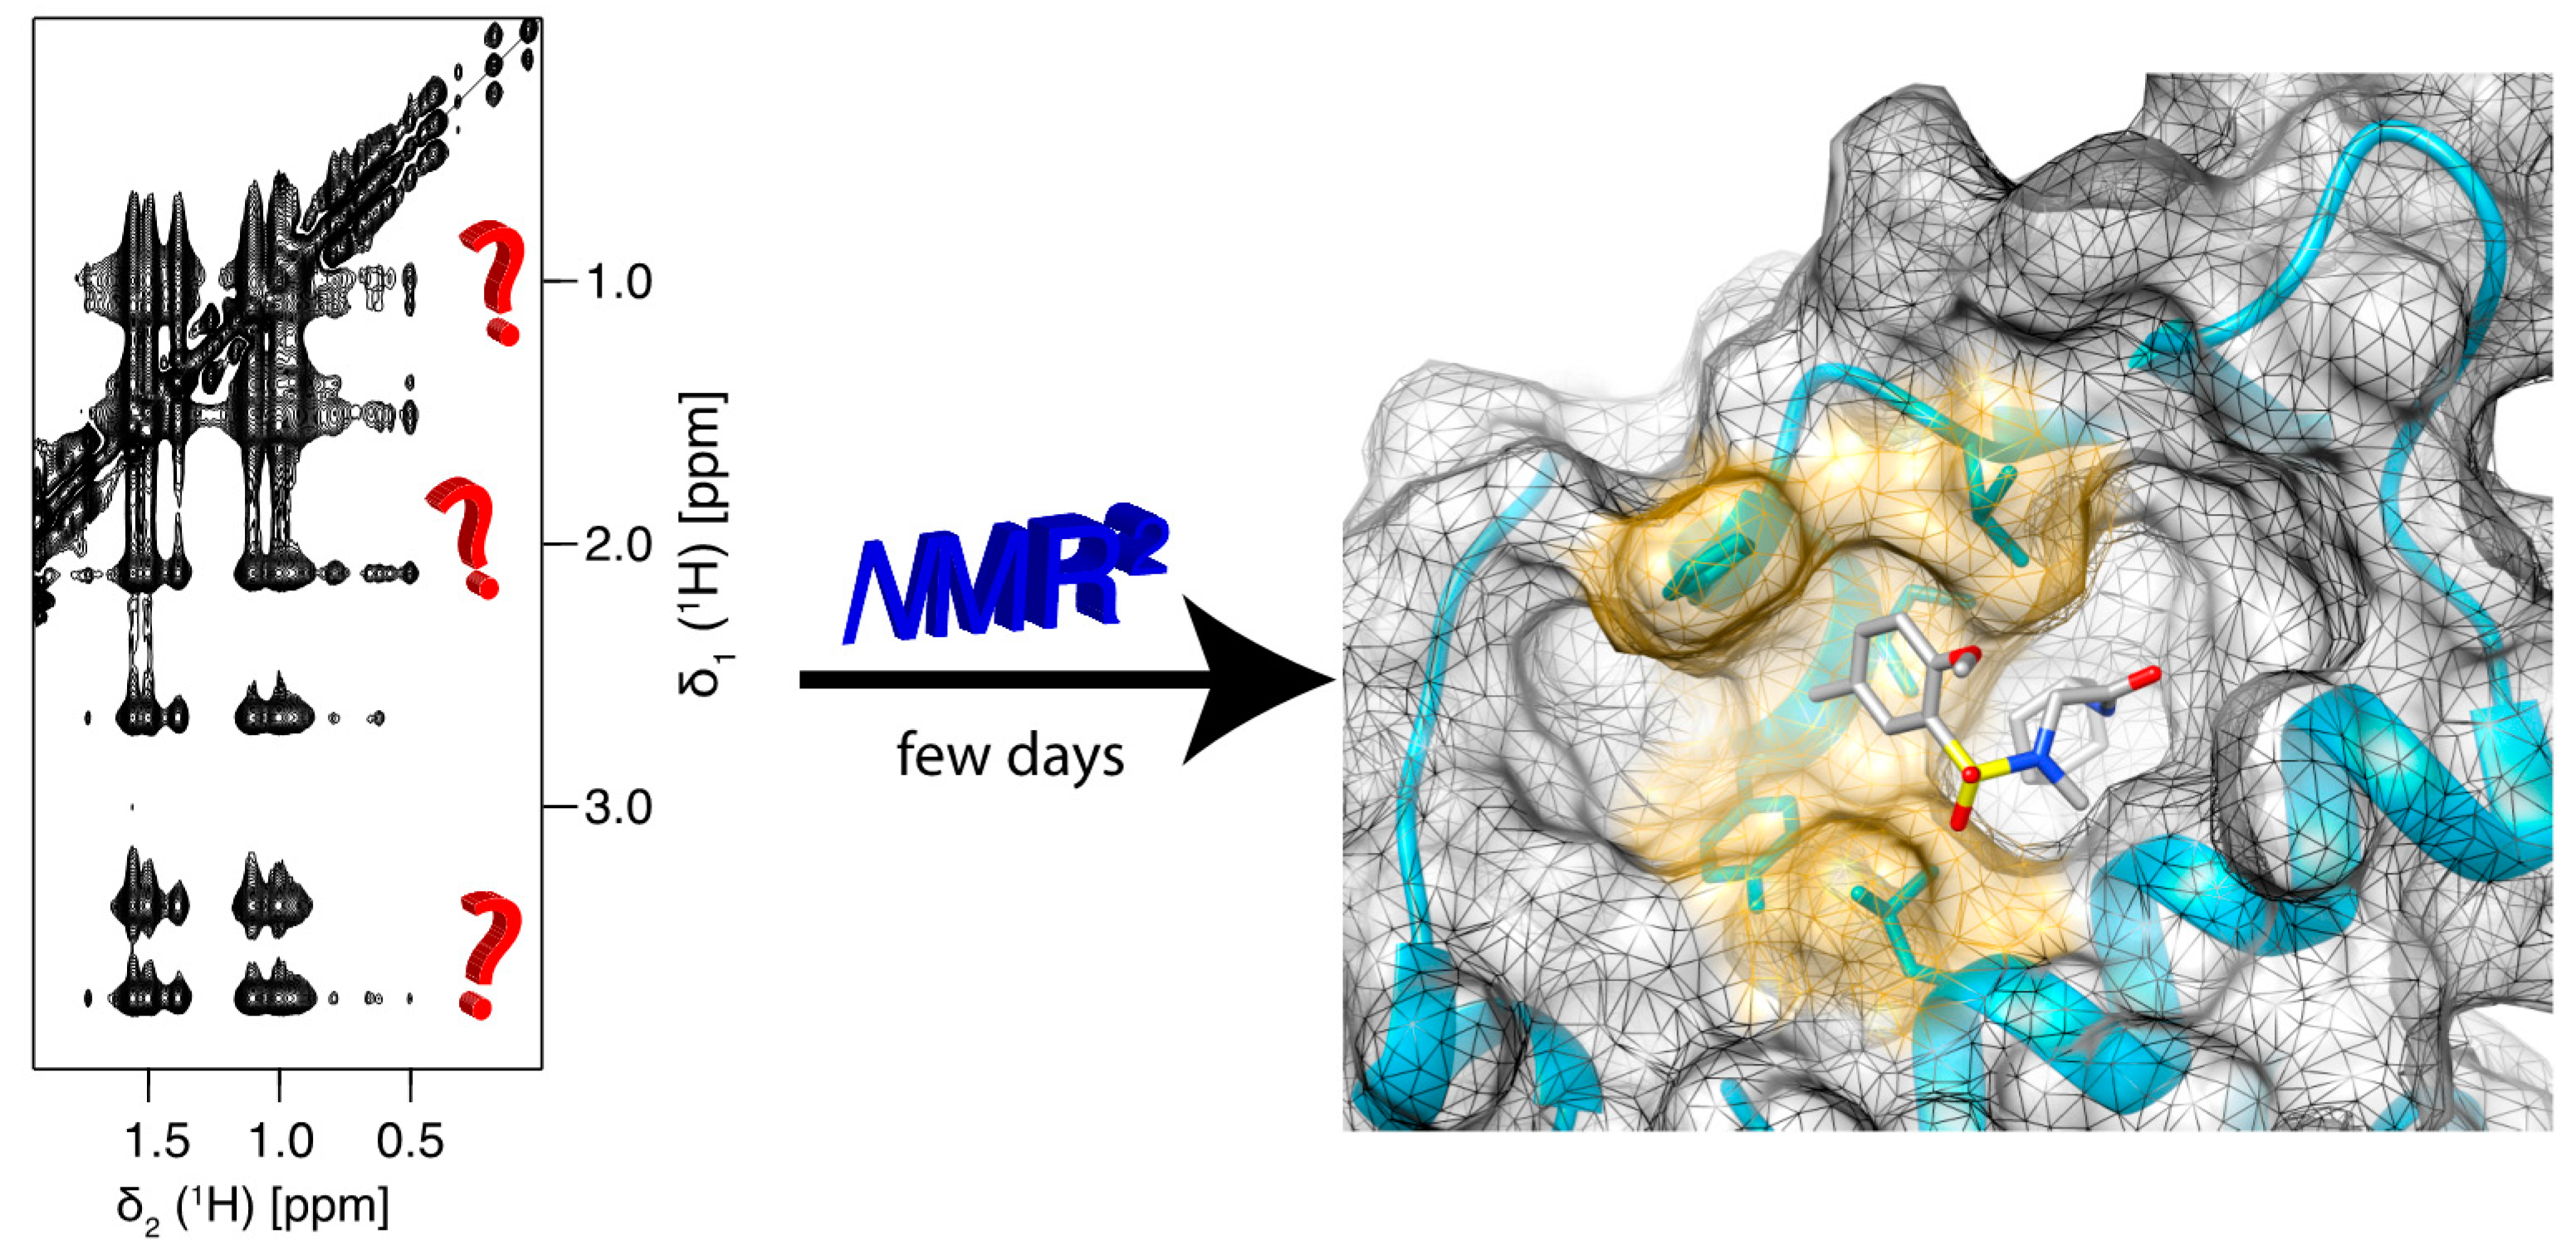
Figure 1.
Nuclear Magnetic Resonance Molecular Replacement (NMR2) derives the complex structure of the binding site within a few days without protein resonance assignment and using only standard 2D NMR experiments.
Figure 1.
Nuclear Magnetic Resonance Molecular Replacement (NMR2) derives the complex structure of the binding site within a few days without protein resonance assignment and using only standard 2D NMR experiments.

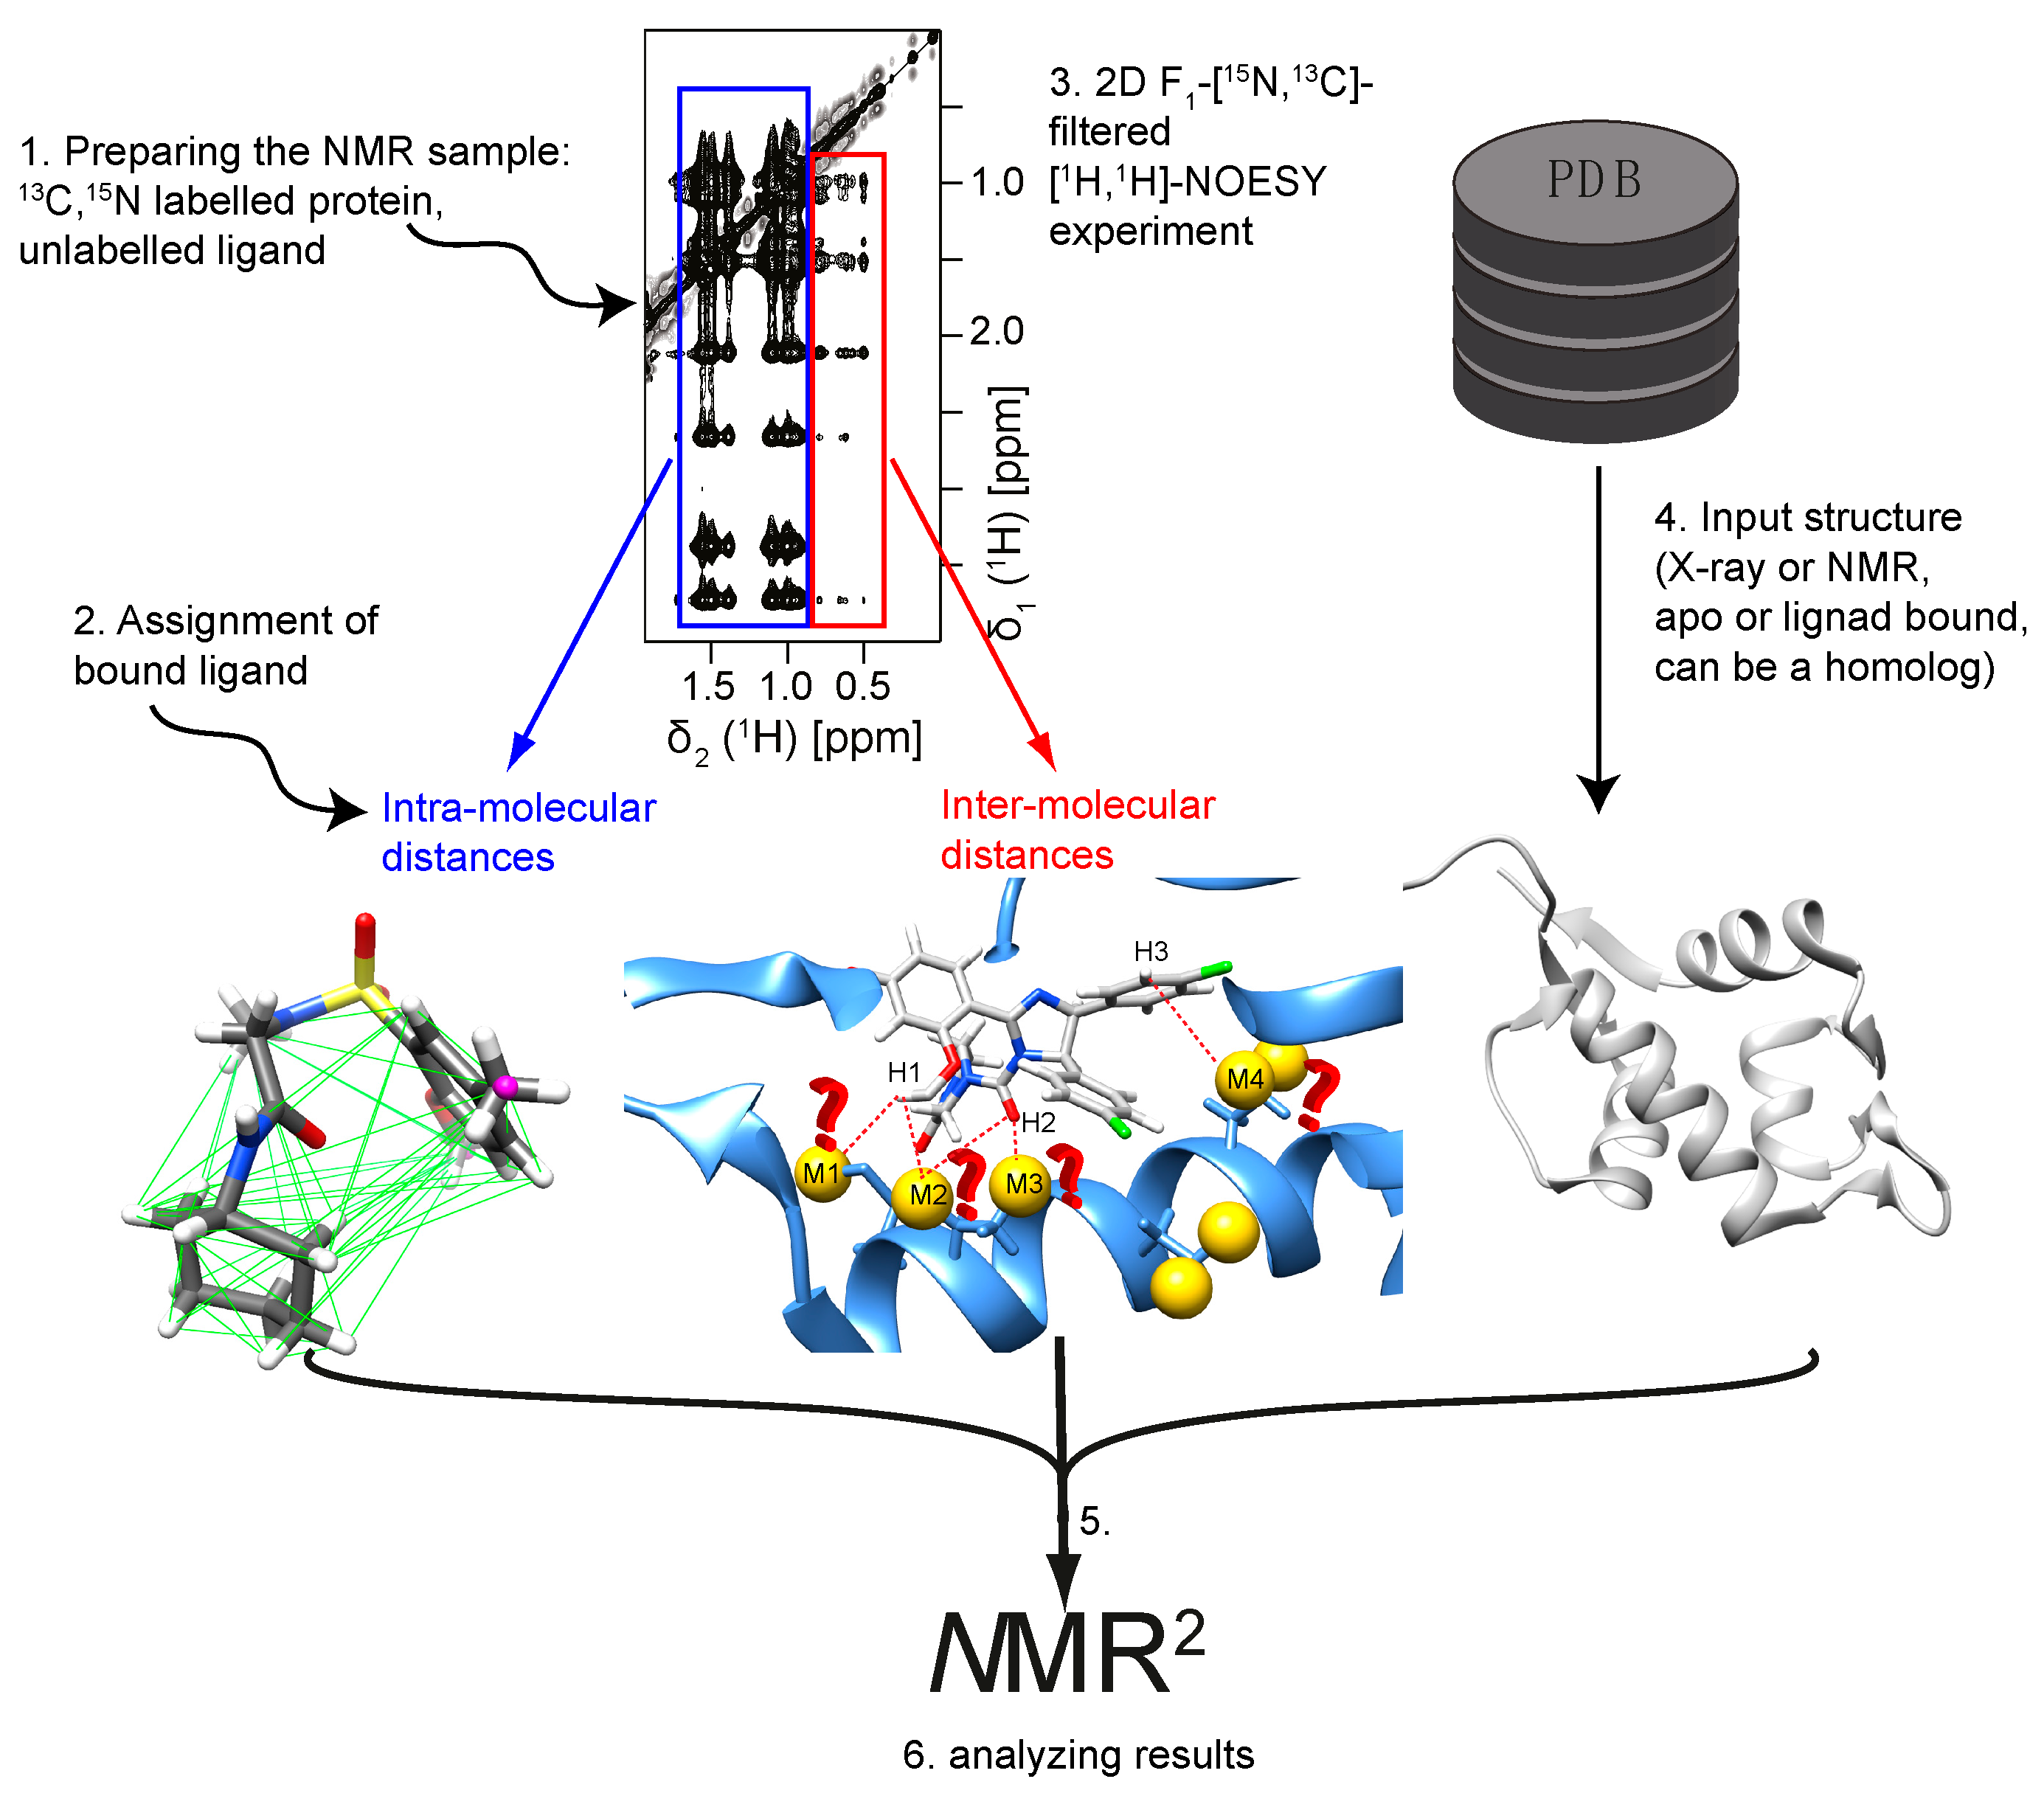
Figure 2.
Overview of the NMR2 method. The following steps are required for NMR2 to determine the complex structure of the binding pocket: (i) Sample preparation for NMR measurements; (ii) Recording experiments to assign the ligand; (iii) Measurement of the ligand intra- and ligand–protein inter-molecular distances; (iv) Choosing the input structure; (v) Running NMR2; (vi) Analyzing the results.

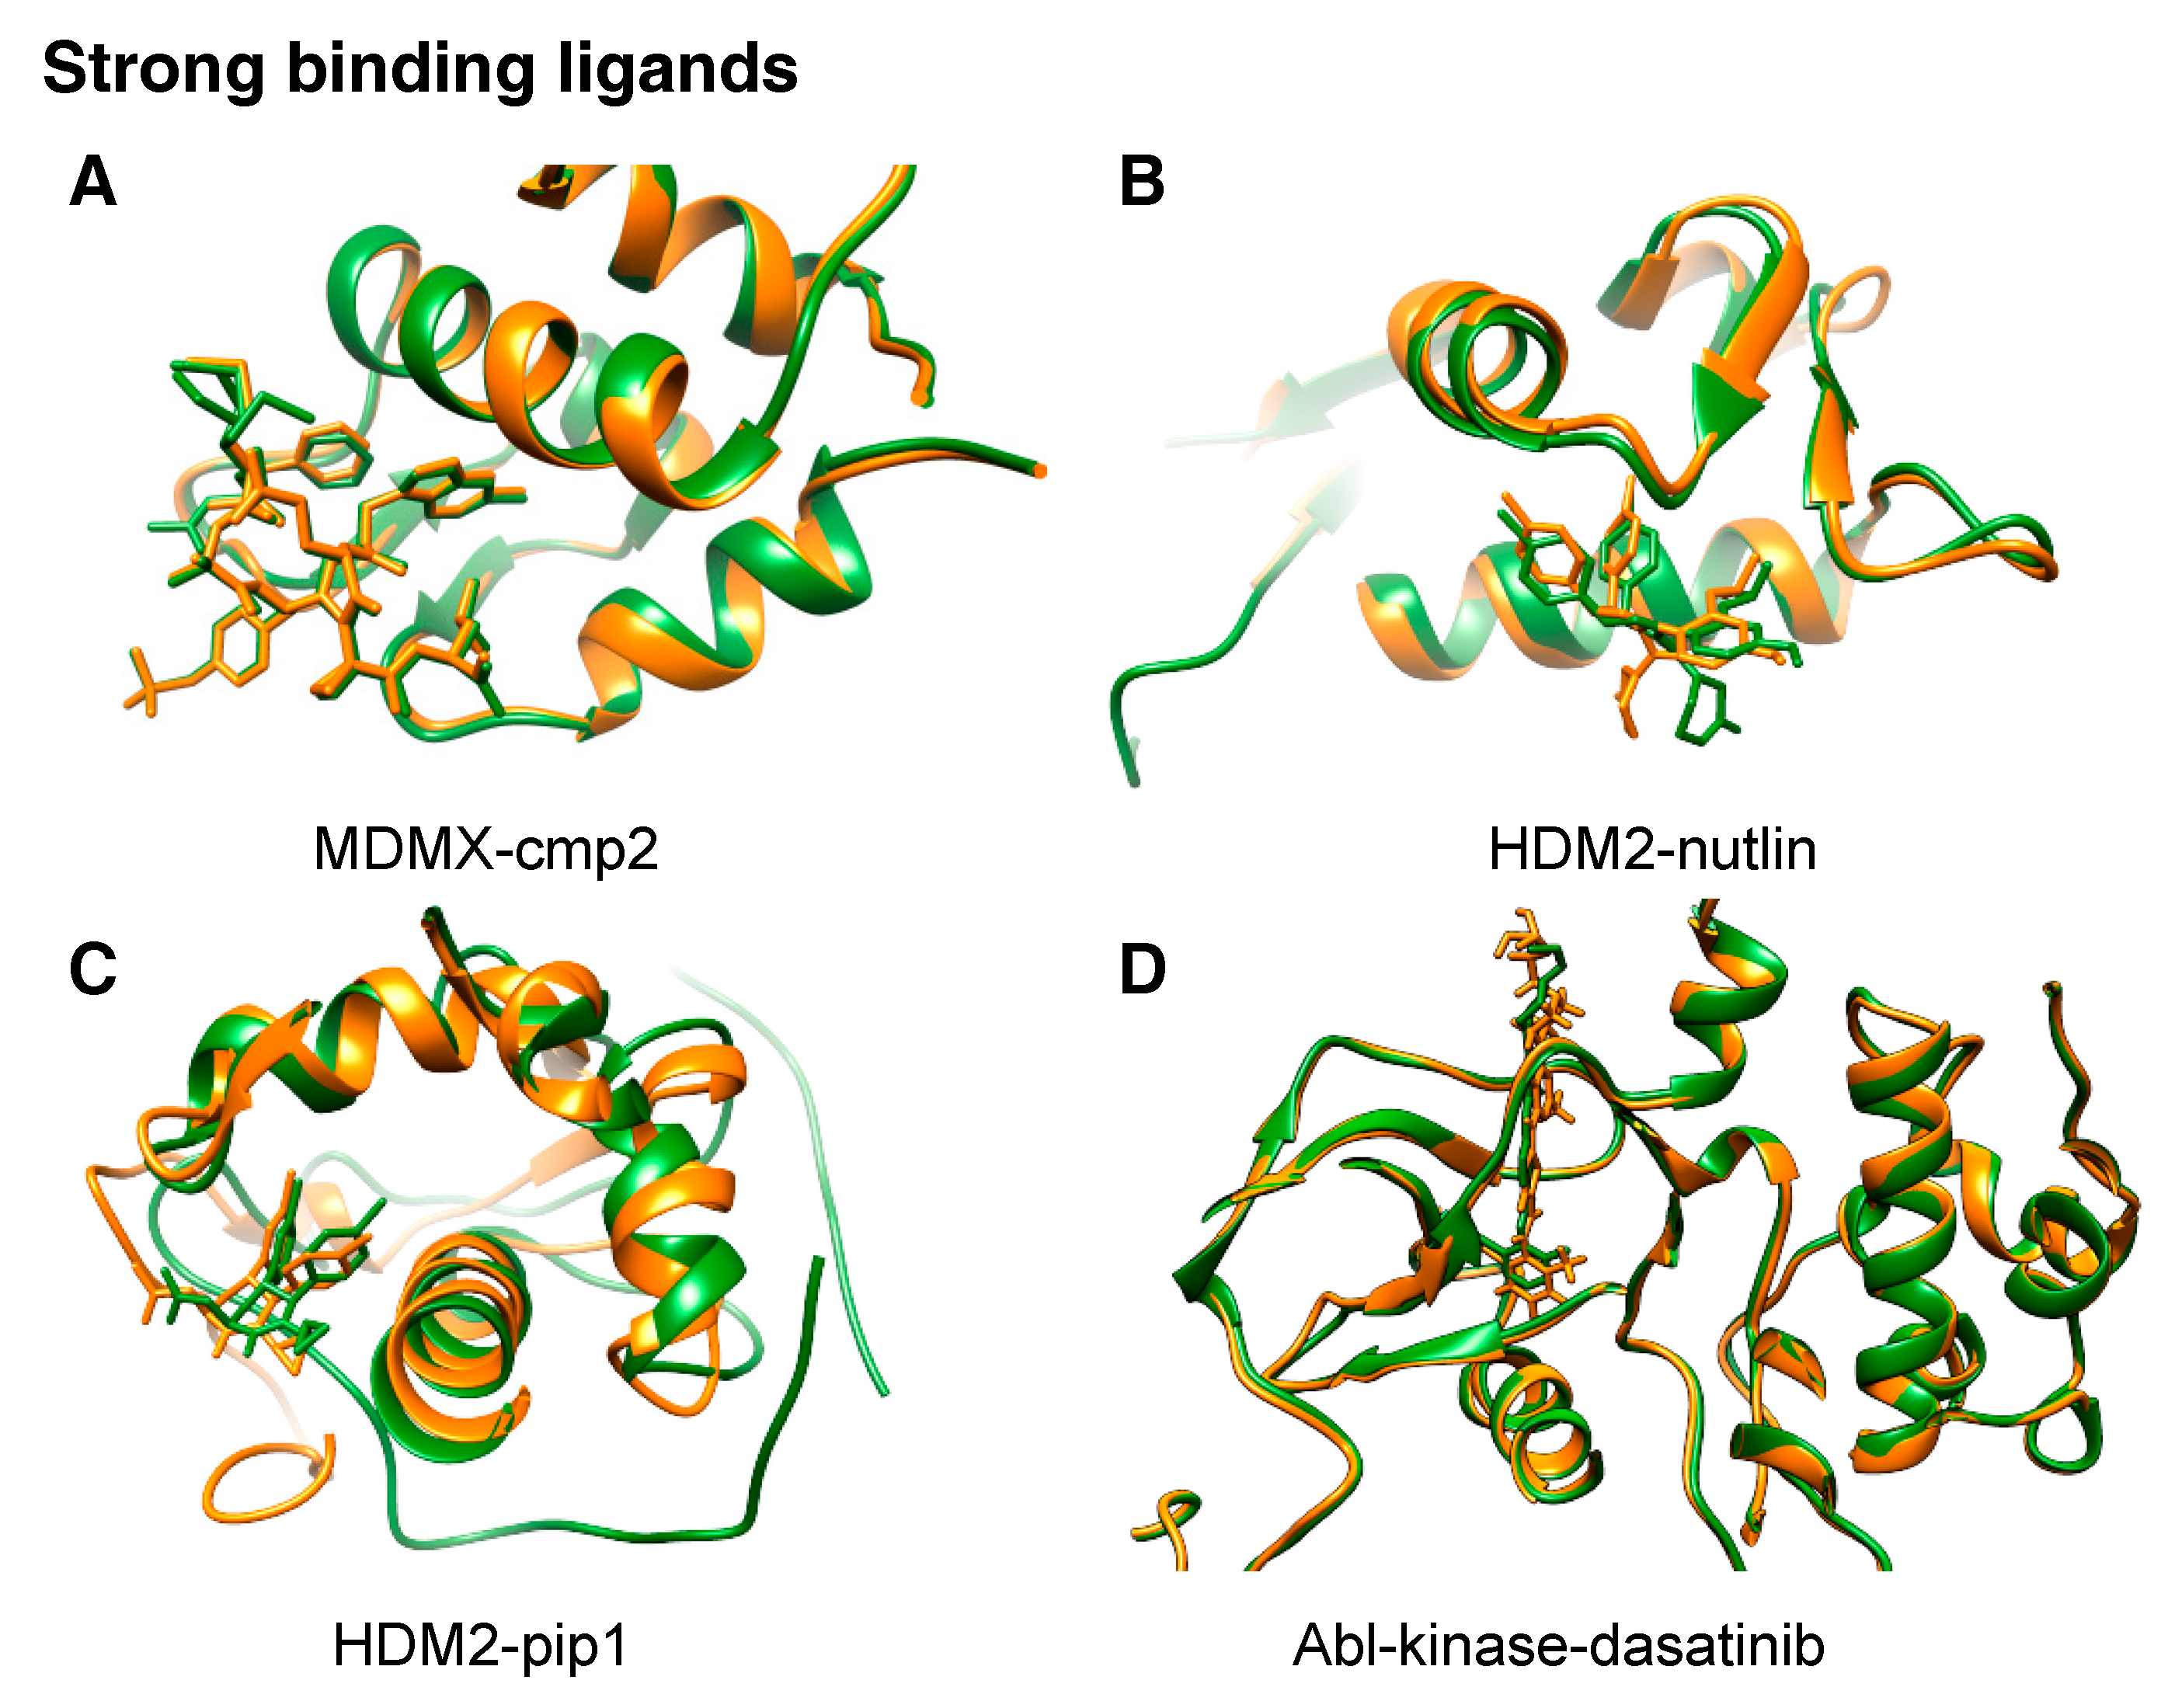
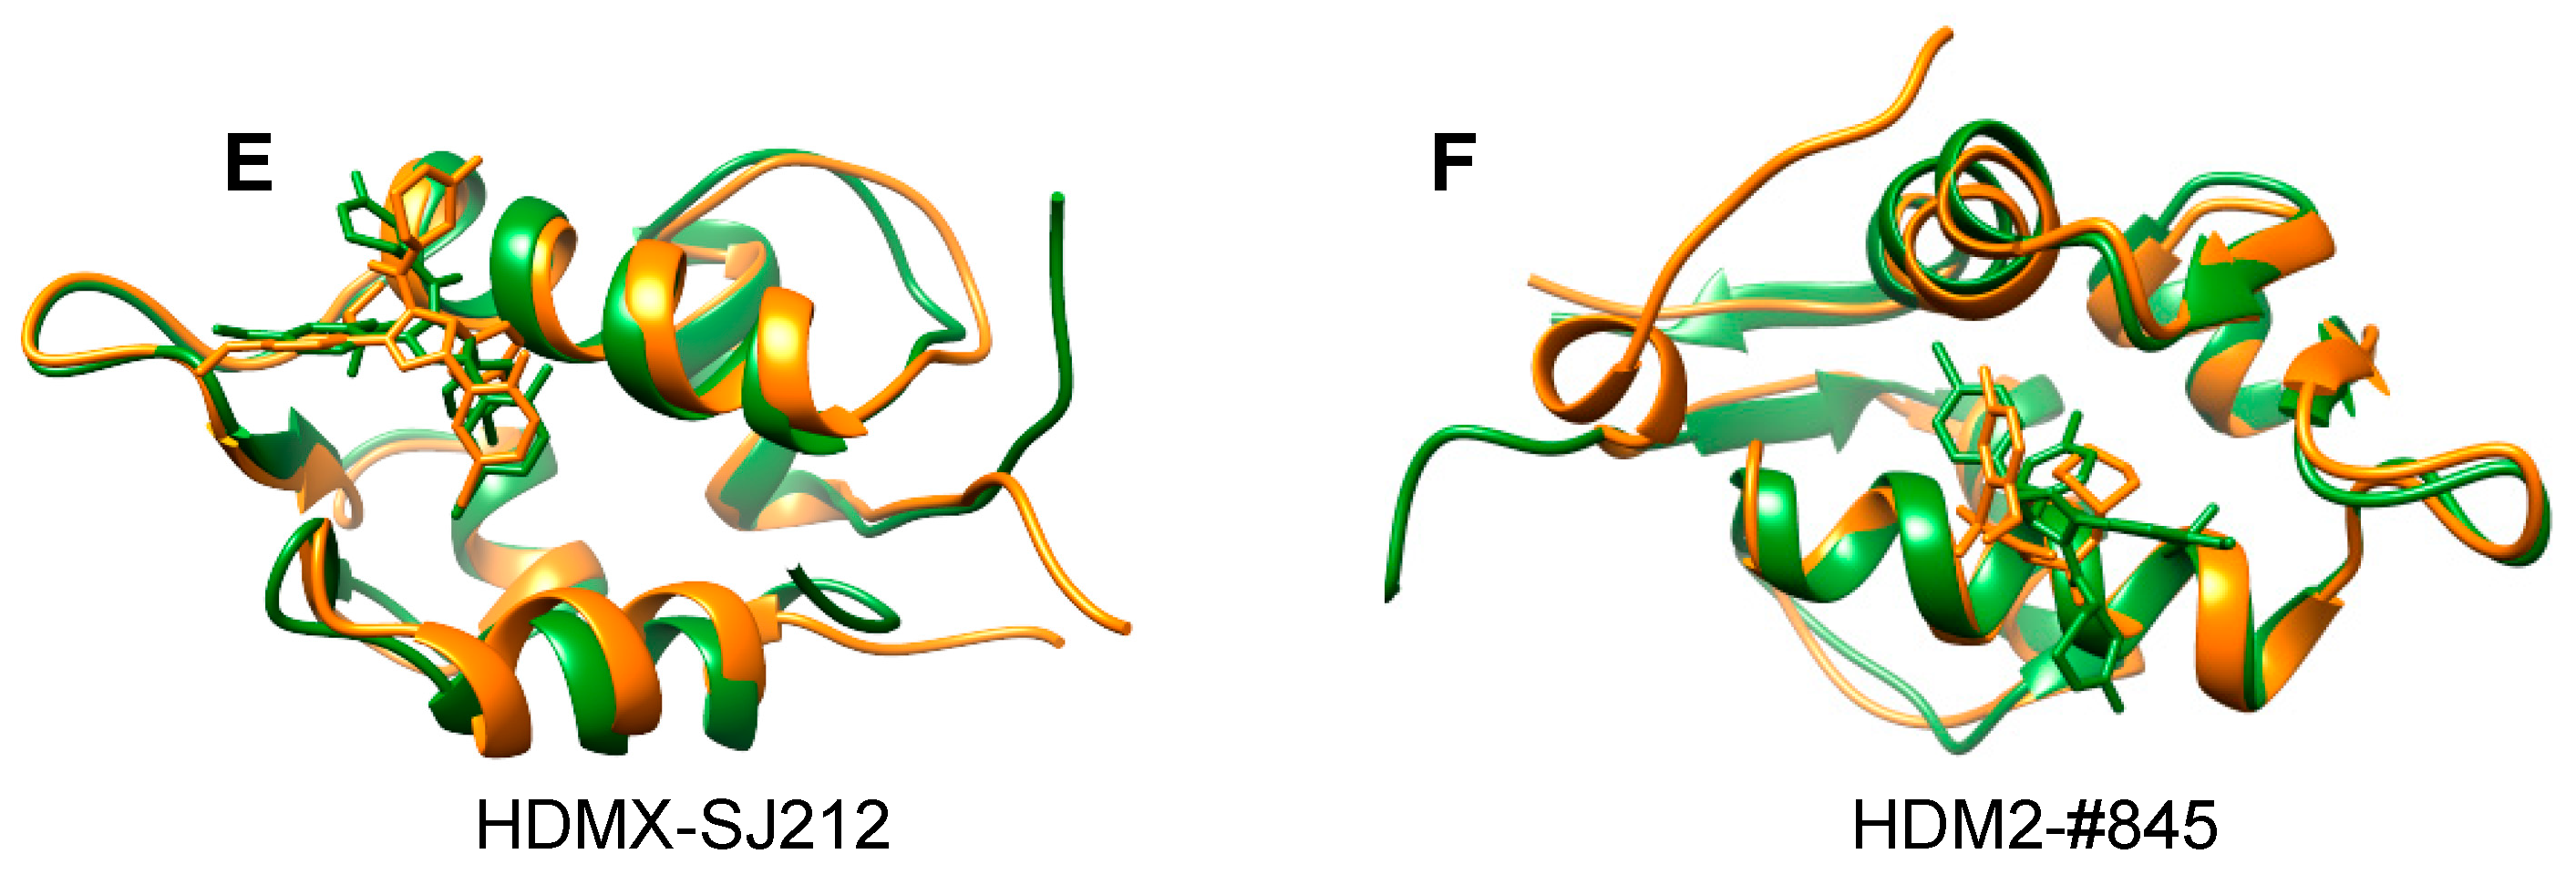
Figure 3.
All complex structures so far solved by NMR2. They consist of four high-affinity ligands (a–d) and two low-affinity ones (e,f), all of which are consistent with previously published structures (a) 3fea [34] with an RMSD of 1.1 Å, (b) 5c5a [32] with an RMSD of 0.9 Å, (c) 2lzg [35] with an RMSD of 1.5 Å, (d) 2gqg [36] with an RMSD of 1.1 Å (in silico data), and (e) 2n0w [37] with an RMSD of 1.35; (f) represents a complex with a ligand having a new scaffold, where no other structural data were known, and therefore it is compared to the complex structure with nutlin (5c5a). In orange are the NMR2-derived structures and in green the reference structures.


© 2018 by the authors. Licensee MDPI, Basel, Switzerland. This article is an open access article distributed under the terms and conditions of the Creative Commons Attribution (CC BY) license (http://creativecommons.org/licenses/by/4.0/).
Share and Cite
MDPI and ACS Style
Wälti, M.A.; Orts, J. The NMR2 Method to Determine Rapidly the Structure of the Binding Pocket of a Protein–Ligand Complex with High Accuracy. Magnetochemistry 2018, 4, 12. https://doi.org/10.3390/magnetochemistry4010012
AMA Style
Wälti MA, Orts J. The NMR2 Method to Determine Rapidly the Structure of the Binding Pocket of a Protein–Ligand Complex with High Accuracy. Magnetochemistry. 2018; 4(1):12. https://doi.org/10.3390/magnetochemistry4010012
Chicago/Turabian StyleWälti, Marielle Aulikki, and Julien Orts. 2018. "The NMR2 Method to Determine Rapidly the Structure of the Binding Pocket of a Protein–Ligand Complex with High Accuracy" Magnetochemistry 4, no. 1: 12. https://doi.org/10.3390/magnetochemistry4010012
Note that from the first issue of 2016, this journal uses article numbers instead of page numbers. See further details here.