Article

An Ecological Visual Exploration Tool to Support the Analysis of Visual Processing Pathways in Children with Autism Spectrum Disorders

1
Interdisciplinary Centre for Security Reliability and Trust (SnT), University of Luxembourg, 29, Avenue JF Kennedy, L-1855 Luxembourg, Luxembourg
2
Institute of Applied Sciences and Intelligence Systems—CNR, 73100 Lecce, Italy
3
Department of Clinical Physiology, CNR Pisa, 56124 Pisa, Italy
4
Institute of Applied Sciences and Intelligence Systems—CNR, 98164 Messina, Italy
5
Universidad Nacional del Sur, 8000 Bahía Blanca, Argentina
*
Author to whom correspondence should be addressed.
J. Imaging 2018, 4(1), 9; https://doi.org/10.3390/jimaging4010009
Submission received: 6 November 2017 / Revised: 12 December 2017 / Accepted: 19 December 2017 / Published: 29 December 2017

Abstract

:
Recent improvements in the field of assistive technologies have led to innovative solutions aiming at increasing the capabilities of people with disability, helping them in daily activities with applications that span from cognitive impairments to developmental disabilities. In particular, in the case of Autism Spectrum Disorder (ASD), the need to obtain active feedback in order to extract subsequently meaningful data becomes of fundamental importance. In this work, a study about the possibility of understanding the visual exploration in children with ASD is presented. In order to obtain an automatic evaluation, an algorithm for free (i.e., without constraints, nor using additional hardware, infrared (IR) light sources or other intrusive methods) gaze estimation is employed. Furthermore, no initial calibration is required. It allows the user to freely rotate the head in the field of view of the sensor, and it is insensitive to the presence of eyeglasses, hats or particular hairstyles. These relaxations of the constraints make this technique particularly suitable to be used in the critical context of autism, where the child is certainly not inclined to employ invasive devices, nor to collaborate during calibration procedures.The evaluation of children’s gaze trajectories through the proposed solution is presented for the purpose of an Early Start Denver Model (ESDM) program built on the child’s spontaneous interests and game choice delivered in a natural setting.

1. Introduction

Recent improvements in the field of assistive technologies have led to innovative solutions aiming at increasing the capabilities of people with disability, helping them in daily activities with applications that span from cognitive impairments to developmental disabilities [1,2]. Autism is characterized by developmental difficulties in communication, social interaction and behavioral flexibility, alongside highly repetitive stereotypical behaviors and/or restricted interests [3]. Identifying effective, community-based specialized interventions for young children with autism spectrum disorder is an international clinical and research priority [4]. There exists considerable phenotypic variation of ASD involving the pace of language development, the presence of epilepsy and the range of cognitive ability. What does appear to be common to individuals across the spectrum are atypical behavioral responses to sensory information. Thus, sensory processing concerns have been a key feature of ASD clinical diagnosis and clinical description (assessment) [5]. In particular, there is mounting evidence for disruption of visual processing pathways. Individuals with Autism Spectrum Disorder (ASD) often display enhanced attention to details and exhibit restricted and repetitive behaviors. Anyway, this is a still debated clinical issue given the mixed experimental results, the variety of stimuli used and the different experimental procedures [6]. Moreover, due to a lack of comprehensive eye-movement modeling techniques, it is currently unknown whether these behavioral effects are also evident during scene viewing [7]. For this reason, there is a thriving scientific activity aimed at defining methods to analyze eye-tracking time-course data, enabling detailed characterization of viewing strategies. These methods range from manual annotation to advanced devices based on automatic eye-tracking strategies [8] that are based on the reflection of near-infrared light from the cornea and the pupil. On the one hand, this technology assures high accuracy (precision <1 visual degree, sampling rate 50–300 Hz), but on the other hand, it can be obtrusive (if it makes use of helmets or glasses), unsuitable for the analysis in social contexts since it is integrated within a display monitor (e.g., Tobii Technology Models TX300, T60XL or T120, Tobiipro, Danderyd, Stockholm, Sweden) or may require more manual adjustments as table-top versions do (e.g., Tobii Technology TX300, X120, Tobiipro, Danderyd, Stockholm, Sweden; Applied Science Laboratories Model D6 Optics, Applied Science Laboratories, Bedford, MA, USA; SR Research Model EyeLink 1000, SR Research Ltd., Ottawa, Ontario, Canada) [9].These technological drawbacks lead to a series of difficulties in the implementation of visual behavioral studies in young children with ASD, especially in non-verbal ones. It follows that perceptive exploration in children with ASD has not been deeply studied yet, even if it is well known that this is a central topic of research, especially for the early diagnosis considering that signs of autism (that are not reliably present at birth) surface between the ages of 6 and 12 months [10].
In 2008, a case study reported by Vismara and Rogers showed a reduction in autistic symptoms thanks to a novel paradigm for treatment of autism based on a early intervention: the Early Start Denver Model (ESDM) [11], whose effectiveness has been proven in [12]. The work in [13] illustrates the efficacy of the ESDM for children with autism in improving cognitive and adaptive behaviors and reducing severity of ASD diagnosis, while the role of children’s motivation in treatment with the ESDM is emphasized in [14]. In order to motivate children, the authors recommend putting participants in a situation where there are many age-appropriate toys and then to observe what children do. In such a situation, children will probably watch toys that are more interesting to them, although the absence of protodeclarative gestures in children with autism [15,16] can represent a problem for the therapist. In addition, the possibility of providing a choice between activities or materials for completion of activities in the on-task behavior to people with autism spectrum disorders shows higher levels of on-task behavior than in the no-choice condition [17]. In general, intervention and support should be individualized and, if appropriate, multidimensional and multidisciplinary [18]. Unfortunately, as a matter of fact, without technological devices, it is difficult to understand whether an object is attracting or not the attention of autistic children since they can use gestures or vocalization to express their needs by protoimperative gestures, but usually they do not communicate about objects of shared interest by protodeclarative gestures [15,16].
In light of the above, there is a strong motivation for investigating technological alternatives to solve the problem of analyzing visual exploration for individuals affected by ASD [19]. Computer vision technology has a unique opportunity to impact the study of children’s behavior, by providing a means to automatically capture behavioral data in a non-invasive manner and analyze behavioral interactions. Computational sensing and modeling techniques can play an important role in the capture, measurement, analysis and understanding of human behavior; this research area is called “behavior imaging”. The ability to automatically measure behavioral variables using computer vision-based sensing could be valuable in enabling the collection of behavioral data on a large scale without requiring substantial human effort. Behavior imaging technology can play several roles in support of a screening instrument. It can provide cost-effective tools for managing large collections of video and other data sources recorded during screening sessions. In particular, it can enable summarization, content-based retrieval, visualization and comparison of observational data across populations and over time, to an extent that is not feasible using conventional manual methods [20].
In this work, a study about the possibility to understand the visual exploration in children with ASD is presented. In order to obtain an automatic evaluation, an algorithm for free (i.e., without constraints, nor using additional hardware, IR light sources or other intrusive methods) gaze estimation is employed. Furthermore, no initial calibration is required. It allows the user to freely rotate the head in the field of view of the sensor, and it is insensitive to the presence of eyeglasses, hats or particular hairstyles. These relaxations of the constraints make this technique particularly suitable to be used in the critical context of autism, where the child is certainly not inclined to employ invasive devices, nor to collaborate during calibration procedures. The evaluation of children’s gaze trajectory through the proposed solution is presented for the purpose of an ESDM program built on the child’s spontaneous interests and game choice delivered in a natural setting. In particular, the technique is used in a scenario where a closet containing specific toys, which are neatly disposed by the therapist, is opened to the child. After a brief environment exploration, the child freely chooses the desired toy that will be subsequently used during therapy. The video acquisition has been accomplished by an RGBD sensor, in particular a Microsoft Kinect, hidden in the closet in order to obtain a depth image that can be processed by the estimation algorithm, therefore computing gaze tracks by intersection with data coming from the well-known initial disposition of toys. The rest of the manuscript is organized as follows: In Section 2, the main contributions of the proposed approach are highlighted with reference to the related works in the state of the art. In Section 3, the proposed method is described, while the experimental setups together with both quantitative and qualitative evaluations are described and discussed in Section 4. Finally, Section 5 concludes the paper.

2. Main Contributions and Related Works

From a medical perspective, the subject of this paper relies on the experimental evidence of the relationship between gestures and diagnosis/assessment of ASD. The work in [21] demonstrated that, also in preverbal children, the absence of protodeclarative gestures is considered a discriminating item between infants who had later been diagnosed with autism and typically developing infants. The work in [22] showed that the absence of protodeclarative pointing, gaze-monitoring and demand to play in children 18 months old, in 83.3% of cases, predicts a future diagnosis of autism. In [23], protodeclarative gestures are considered a key behavior. People with autism show atypically gaze behaviors: in real social situations, they show reduced salience of eyes and increased salience of mouths, bodies and objects [24,25] and look significantly less at the partner in dyadic interactions, unlike typically developing children [26]. In artificial social situations (for example, when they see a cartoon or a movie with social actors, or in static photos, or in virtual reality, etc.), people with autism attend to characters’ faces for less time than typically developing people [27,28], and in the experiment presented in [29], they looked less at the center of subjects’ faces compared to the control group.
Visual atypical behaviors also affect the way in which individuals with ASD observe the scene; in [25], it is shown that children with ASD, compared to typically developing people, are more attracted by background objects. Many studies show an abnormal exploration of object stimuli [30]; the work in [31], for example, showed that, compared with typically developing people, people with ASD are more perseverative in their fixations of the details of images and that their fixations are more detail-oriented, while in [32], it is shown that infants later diagnosed with ASD are more attentive to non-social stimuli during interactions with an unfamiliar experimenter and that they shift attention among visual targets less frequently than high and low-risk typically developing children. By a simple preferential looking task, the authors of [33] showed that 40% of the autistic cross sample spent greater than 50% of the viewing time fixating on dynamic geometric images rather than dynamic social images.
Several experimental protocols for the diagnosis and understanding of developmental disorders make use of video footage analysis to measure such elements as response time, attention changes and social interaction [34]. Many approaches to technology-enhanced intervention rely on educational methods shown to result in good outcomes and can be used to specify design principles needed for engineering successful technology-enhanced intervention tools [35]. Concerning the technological issues faced in this paper, several works have introduced the usage of eye-tracking to investigate gaze behavior in individuals with disorders on the autism spectrum. Such studies typically focus on the processing of socially-salient stimuli, suggesting that eye-tracking techniques have the potential to offer insight into the downstream difficulties in everyday social interaction that such individuals experience [36,37]. These works involve video clips of people engaged in social interaction [24] or images of human faces [38,39]; typical tasks are the study of the fixation patterns and the evaluation of the capacity of people with autism to recognize different emotions [40,41]. Other works have investigated the attentional bias for people with autism to follow others’ gaze/head-turn direction [42], since several studies suggested that the ability to follow the gaze of another person is impaired in the case of autism [43,44].
Anyhow, it is interesting to note how the majority of eye-tracking studies in ASD are built on the analysis of the macro-structure of gaze behaviors (i.e., the proportion of time a participant looks at a specific region of the scene over the whole trial duration) [45], by using, again, video clips [46] or by analyzing the gaze patterns and visual motion of the child while watching a specific event [47,48]. In any case, the aforementioned systems rely on active and invasive eye-tracking technologies (which despite their popularity, suffer from the limitation of all pupil-based eye trackers, i.e., that changes in pupil size introduce deviations in the estimated direction of gaze [49]). The main disadvantage is that participants are passive, and the scenes usually depict a restricted and static field-of-view. Works that try to overcome these limitations rely on head-mounted eye-tracking systems [50,51]. In particular, the last one has been successfully employed for investigating gaze patterns in the case of autism [26], but in many cases, the autistic children could be strongly reluctant to their usage, even with the risk to acquire “contaminated” data and to invalidate the experiments.
Considering this well-known difficulty in interacting with autistic people, natural environments that rely on non-invasive sensing technologies have spread in the last few years [52]. The possibility to monitor a child and to analyze his/her behavior without any invasive device improves the reliability of the experiments and provides new perspectives about the understanding of his/her visual exploration. Despite this, to the best of our knowledge, no work has investigated yet the visual exploration of a closet containing toys to be used in therapy in the case of children with autism spectrum disorder.
From a technical perspective, the employed solution is based on the work of [53], and it works by processing depth and RGB images extracted from a range sensor, e.g., Microsoft Kinect (www.microsoft.com/en-us/kinectforwindows/) and ASUS Xtion Pro Live (www.asus.com/Multimedia/). The subject is related to those papers describing systems aiming at understanding processes underlying visual perception. Such systems generally fall into two categories, i.e., remote tracking systems, where the subject is recorded with an external camera (as this paper does), and head-mounted eye trackers (unsuitable for use in the application context addressed in this paper). The main challenges that have to be faced in remote eye tracking are the robust detection of face and eyes of the subjects [54]. Several techniques have been proposed, but a few of them can be effectively exploited in natural environments [55], unless depth information is included for detailed facial tracking. This is still an open challenge, and a detailed and up-to-date review can be found in [56].
The contributions of the work under consideration are the following:
  • it proposes an unobtrusive technique to estimate the gaze ray;
  • the proposed technique was quantitatively evaluated on both adults and children;
  • qualitative evaluation was then performed on children with ASD in a treatment room equipped with a closet containing toys properly disposed by the therapists; the children were asked to explore the closet’s content and to pick up a toy that would be used during the subsequent therapeutic session;
  • the system supplies gaze-tracks, hit-maps and overall statistics that can be exploited by the therapist to better perform the behavioral analysis of the individuals;
  • the system is low-cost, and it makes use of commercial depth sensors;
  • no calibration, nor training phases are required;
  • privacy principles in the field of ubiquitous computing and ambient intelligence are complied with, according to [57,58].

3. Proposed Free Gaze Estimation Method

The acquired data are processed by a multistage approach performing, at first, head pose estimation using both depth and color streams. The head pose estimation algorithm computes the exact position of the head with regards to the sensor, in terms of yaw, pitch and roll angles. Unfortunately, any gaze estimation that does not take into account the localization of the eye centers is highly inaccurate [59], especially for some kinds of applications. For this reason, the proposed approach, as a second step, computes pupil localization over the RGB data. This additional information is then used to improve the initial gaze estimation by means of the computation of a correction factor for the angles of the 3D model. Figure 1 gives an overview of the proposed solution, whereas the following subsections describe in detail each computational step.

3.1. Head Pose Estimation

In this step, the detection of the human face and the estimation of its pose are performed: input data are RGB and depth streams, which are the inputs to the following algorithmic steps. First of all, face detection is performed on the RGB images by matching the appearance with predetermined models. After the first detection, it is then possible to track the detected face over time, reducing in this way the computational load needed to process the input streams. Detection of the characteristic points of the face and their temporal tracking are based on the Active Appearance Model (AAM) [60]. The subsequent step consists of building a 3D model of the detected face by the Iterative Closest Point (ICP) [61] technique by which a 3D point cloud model is iteratively aligned with the available 2D facial features (target). The used 3D face model is the Candide-3 [62], a parametrized mask specifically developed for model-based coding of human faces. This model has been chosen since it provides more detailed information than classical methods like the Cylinder Head Model (CHM) [63] or the elliptical one [64]. In particular, using Candide-3 model, it is possible to get the positions of the eye centers that will be used in Section 3.3. The 3D head pose is finally estimated in terms of pitch, yaw and roll angles, hereinafter denoted as ω x , ω y and ω z , respectively.
Figure 2 shows a block diagram of the head pose estimation module, while Figure 3 shows the visual outcomes of this phase for two different acquired frames.

3.2. Pupil Detection

In this step, the RGB stream is processed in order to detect the pupils of the eyes. The proposed solution operates on periocular images automatically cropped from facial regions. The rough positions of the left and right eye regions are initially estimated using anthropometric relations. In fact, pupils are always contained within two regions starting from 20 % × 30 % (left eye) and 60 % × 30 % (right eye) of the detected face region, with dimensions of 25 % × 20 % of the latter. In other words, the boundaries of left and right eyes are defined as:
l x = 0.20 × W f
r x = 0.60 × W f
l y = r y = 0.30 × H f
W l = W r = 0.25 × W f
H l = H r = 0.2 × H f
where W f and H f are the width and height of the facial region, W l and H l are the width and height of the left eye region, W r and H r are the width and height of the right eye region and l x , l y , r x , r y define the top-left points of the left and right region, respectively. To better understand this step, please refer to Figure 4.
The cropped patches are the inputs of the algorithmic procedure aiming at detecting the precise locations of the eye pupils. A schematic representation of the involved algorithmic procedure is shown in Figure 5.
For each input image, on the one hand, the self-similarity scores are computed in each pixel and, on the other, the differential analysis of the intensity levels is performed. The outcomes of these preliminary steps are then normalized and integrated in a joint representation. The resulting accumulation space is then convolved with a Gaussian kernel in order to allow the areas with the highest average score (on a neighborhood defined by the sigma of the kernel) to excel over those having some occasional large value mainly due to some noise. In particular, the sigma value can be chosen equal to the value of the most likely pupil radius emerging from self-similarity and differential analysis, which, of course, are performed along different scales in order to make the whole procedure independent of the distance between the face and the acquisition device. Finally, the peak in the achieved data structure is found, and it is assumed to correspond to the center of the eye.

3.3. Gaze Estimation

In this final step, the information about head pose and pupil locations is merged in order to get a fine gaze estimation. The merging process starts by computing the 3D coordinates of the eye center points taken from the facial mask placed as described in Section 3.1. In the developed solution, only the gaze track passing through one eye is considered since taking into account both eyes would require additional knowledge about how, for each specific person, the eyes are aligned and, moreover, a mutual error compensation scheme should be introduced. The method works in two stages: in the first stage, a coarse gaze is estimated by head pose information and 3D position of the eye center, while in the second stage, the whole 3D position of the pupil is integrated in the scheme in order to get a more accurate gaze vector. In the first stage, the gaze track is computed and its intersection with a vertical plane with regard to the ground and passing from the center of the sensor is calculated. Note that with this method, it is possible to achieve also the intersection point with every plane parallel to the considered one, just adding a translation parameter k that will be algebraically added to the depth information, then using the exposed procedure.
The intersection point is computed separately for each angle and using the same method, and the euclidean distance from the sensor can hereafter be computed. The procedure is shown for one angle in Figure 6 and described in the following. The following equations are stated based on a right-handed coordinate system (with the origin at the sensor location, z axis pointing towards the user and y axis pointing up). The depth sensor is able to give the information about the length of the segment A C ¯ as the component t z of the translation vector T. It follows that, knowing a side and an angle, the right-angled triangle A B C ^ can be completely solved. In particular, A B ¯ = A C ¯ cos ω y and B C ¯ = A B ¯ 2 A C ¯ 2 . Using the same coordinate system, it is possible to compute also the Cartesian equation of the gaze ray as the straight line passing for points A = ( x A , y A , z A ) and B = ( x B , y B , z B ) expressed as:
r : x x A x B x A = y y A y B y A y y A y B y A = z z A z B z A
with z A = 0 for the particular plane under consideration.
In case of translations on the x and y axes, the vector can be algebraically summed up with the computed value, in order to translate the gaze vector to the right position.
To accomplish the appropriate correction, the 3D geometric model of the eye proposed by [65] has been considered. It must be noticed indeed that the eye is not shaped like a perfect sphere, rather like a fused two-piece unit. Anyway, the usage of a perfect sphere with an estimated radius of 12 mm [66] is suitable to adequately modelthe eye, considering the available information extractable from a consumer depth sensor and Kinect maximum camera resolution. In light of this, the following three parameters can be introduced to completely solve the problem of gaze estimation (for one eye):
  • Eye center: the 3D coordinates of the center of the eye, on the eye sphere surface; their values are extracted from the 3D overlapped mask, denoted by:
    EyeCtr = ( x EyeCtr , y EyeCtr , z EyeCtr ) ;
  • Pupil center: the 3D coordinates of the center of the eye’s pupil; their values are derived from the pupil detection module, denoted by:
    EyePupCtr = ( x EyePupCtr , y EyePupCtr , z EyePupCtr ) ;
  • Eyeball center: the 3D coordinates of the center of the sphere that models the eye; it is a variable that is not visible and whose position can only be estimated, denoted by:
    EyeBallCtr = ( x EyeBallCtr , y EyeBallCtr , z EyeBallCtr ) ;
At a first step, the parameter EyeBallCtr must be computed; it can be estimated as the point that lies 12 mm behind the eye center, in the direction (meant as the straight line) previously computed. Indicating with Radius EB this value, it follows that:
EyeBallCtr = x = x EyeCtr   ±   | Radius EB cos ω x sin ω y | y = y EyeCtr   ±   | Radius EB cos ω y sin ω x | z = Radius EB cos ω x cos ω y + z EyeCtr
where the sign ± depends on a, respectively, negative or positive pitch (yaw) angle of the specified coordinate system.
This 3D point represents the center of the sphere of the considered eye. From this point, it is possible to compute the straight line that passes through EyePupCtr and EyeBallCtr with Equation (1). Thus, the x I P and y I P coordinates on the image plane (with z = 0 ) can be computed by using Equation (3).
x I P = z EyeBallCtr z EyeBallCtr z EyePupCtr ( x EyePupCtr x EyeBallCtr ) + x EyeBallCtr y I P = z EyeBallCtr z EyeBallCtr z EyePupCtr ( y EyePupCtr y EyeBallCtr ) + y EyeBallCtr
Figure 7 gives an overview of the proposed method (viewed from above): the straight line r (replicated with the parallel straight line r passing through the nose, for clarity to the reader, as well as for the angle ω y ) represents a rough estimation by using head pose information only. Anyway, this information or, more precisely, the corresponding vector unit (from this view, only the angle ω y is visible) is used to estimate the 3D coordinates of EyeBallCtr and, thus, to use the new gaze ray to infer the user’s point of view. Note that all the key parameters of the method have voluntarily been enlarged in the figure, for the sake of clarity. The corrected gaze track has been colored in red, in order to distinguish it from the rough estimation.
Finally, in order to represent the real intersection point with the environment and to realize experimental tests, coordinates are normalized to image plane coordinates with the generic formula, valid for both coordinates x and y of the image plane:
c n o r m = c bound low bound up bound low · size ( I )
where bound up and bound low are the two bounds, in meters, of the space, and size ( I ) is the width (or height, depending on the coordinate in exam), expressed in pixels.

4. Experimental Results and Discussion

Two different experimental phases were carried out. In the first one, a quantitative evaluation of the accuracy of the proposed gaze estimator was carried out by considering a specific experimental setting and involving both adults and children. The description of the experimental setup and outcomes is reported and discussed in Section 4.1. In the second phase, the proposed method to estimate the gaze ray was put into operation and qualitatively evaluated in a real scenario for the treatment of children with ASD. The related experimental setup and the pertinent data acquisition protocols are detailed in Section 4.2.

4.1. Evaluation of the System Accuracy

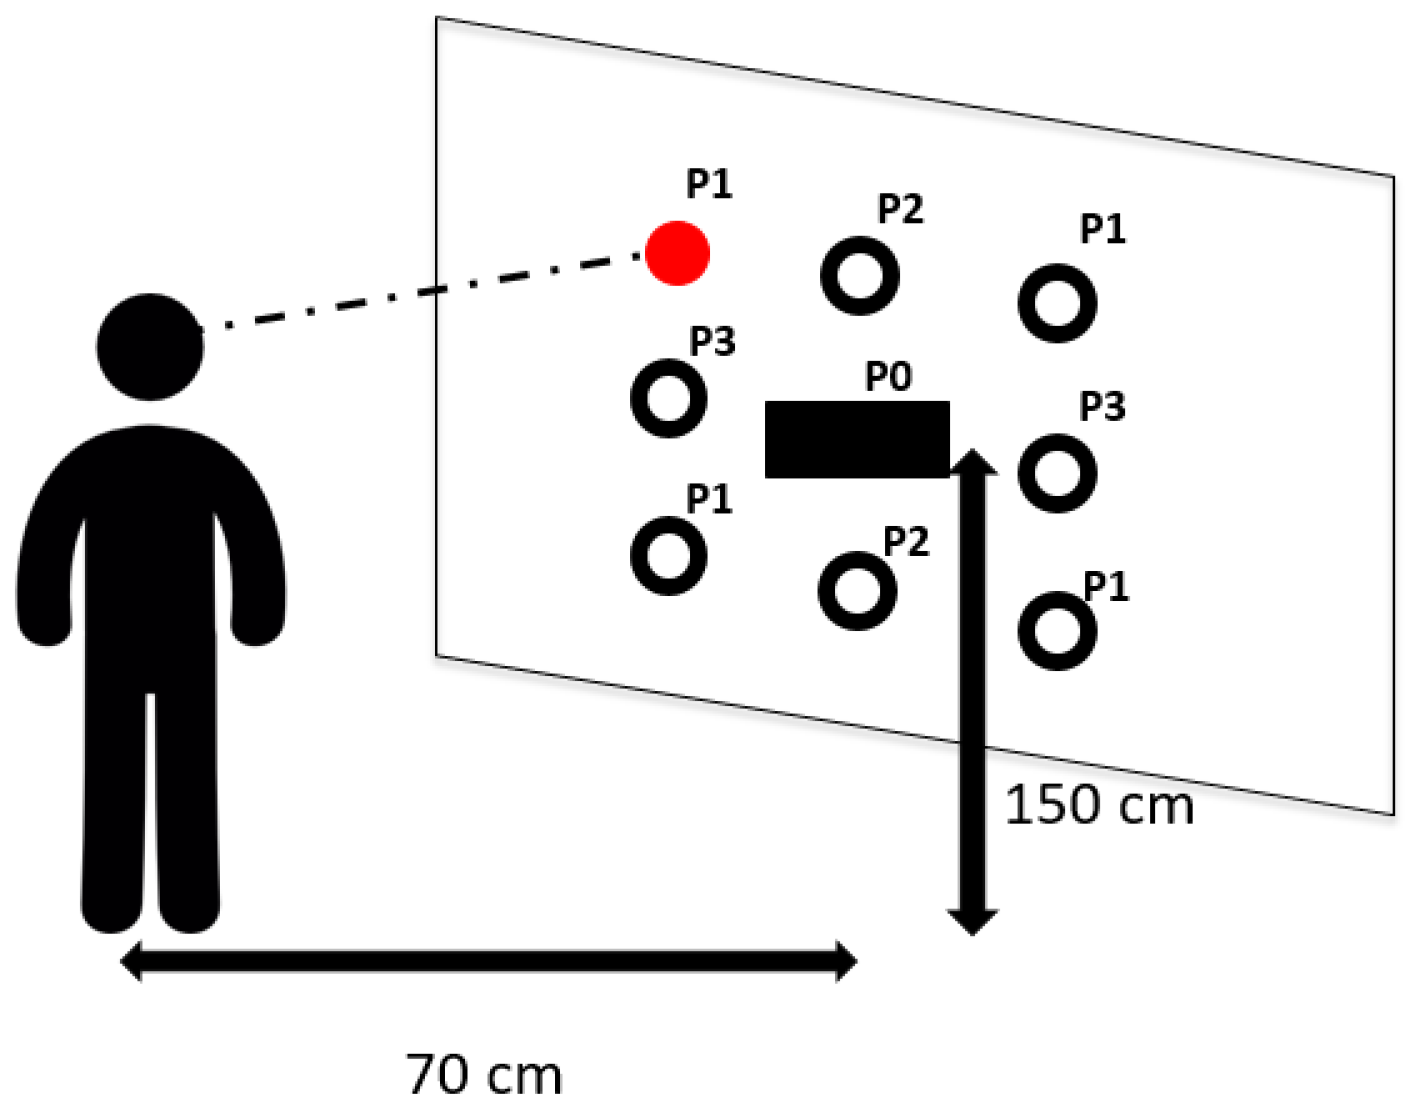
In this experimental phase, a Microsoft Kinect device, positioned at a height of 150 cm from the ground, was used as the depth sensor. A square (2 m per side) panel, with nine circular markers stuck on it, was placed behind the sensor. The circular markers were distributed on three rows, three markers on each row, with a distance of 50 cm from each other. The technical setup is described in Figure 8 where it is possible also to observe that the markers were divided into three subsets. This breakdown was done in order to group together points that presented the same distance from the sensor in terms of x, y or both axes, from P1–P3, while P0 corresponds to the depth sensor position. For example, P3 are the points with a distance of 50 cm from the sensor along the x axis and aligned along y axis; P2 are the points with a distance of 50 cm from the sensor along the y axis and aligned along x axis, and so on. This differentiation has been kept in order to ensure a more complete evaluation that takes into account x and y axes in both separate and joint configurations.
The experiments in this phase were carried-out as follows: eight different typically-developed participants (four adults and four children) were asked to stand at a distance of about 70 cm from the panel and to look at each of the markers on the panel, in a predefined order. Note that neither a training nor a calibration phase were performed. For each marker, oral feedback from the participant confirmed that the markers were in their requisite positions, and this was the trigger to collect the pertinent gaze direction estimated by the system. The estimated gaze direction was then projected onto the panel and then compared with ground truth data (known since the topology of the markers on the panel was fixed and known a priori). In order to simulate different lighting conditions, a lamp was used and placed in three different positions with respect to the participants. Table 1 reports the average errors experienced during the performed trials under three different lighting conditions (artificial light source positioned in front of, on the right and on the left, respectively) for the four adults involved. Table 2 reports the average errors experienced during the trials (which ran in the same way as for adults) for the four children involved (age range (60–78) months). Reported errors (expressed in degrees) were computed as the spatial distances between the marker and the point determined as the intersection between the estimated gaze ray and the panel. Errors are averaged on nine different rounds of acquisition that were carried out for each participant (three for each different lighting condition). From Table 1 and Table 2, it is possible to assert that the gathered gaze estimation performances slightly depend on lighting conditions. Although some errors occurred in the estimation of gaze directions, they remained in a limited range of degrees that may be tolerated in a behavioral analysis application context, considering that real-world objects have a consistent visual size. Besides, it is very important to have found that the errors remained low also when experiments involved children whose faces have different morphological features than adults’ faces. In particular, the overall average error considering both axes and configurations (children and adults) is 2.88 .
Note that the results tend to be distinct for each group of markers, as a consequence of the different estimated head position, which becomes more sensitive as the yaw and pitch angles grow, and for the same difficulty in detecting eyes in near-frontal poses. In general, note also that the system shows better accuracy on the x axis. This is also a consequence of a better precision in the eye detection stage along this axis due to a more evident circularity. It is quite common indeed that the upper and lower parts of the border between the pupil and the sclera result in being occluded when the eye is not wide open.
In the light of these encouraging accuracy results, it is relevant to point out the differences and the advantages of using the proposed method, especially in critical application contexts, with respect to the solutions currently available on the market. Commercial non-intrusive eye-trackers are mainly designed to be used while watching a screen, e.g., with a limited size of the observed area. Besides, they require an initial calibration performed for each user in a collaborative setting making use of calibration points shown on the screen through a specific procedure. As a further binding feature, they do not allow free head movements, but are constrained in a limited range (this is, for instance, the case of the Tobii products (https://www.tobii.com/), which is the leading company in this business area). In light of this, they are not suitable to be used in the operational setups (like the considered one) where the size of the area is larger than a screen and the calibration procedure cannot be easily designed and carried out (for example when children are involved, regardless of any neurological deficits that may be a further obstacle). Concerning the achieved accuracy, it is ineluctable that the commercial product based on detection of corneal reflection under infrared illumination performs very well. However, the performances achieved by the proposed approach are not very far from those. Actually, considering the central part of the panel, e.g., Point P0 (corresponding to the ideal conditions indicated by the commercial producers), the proposed approach achieved an accuracy of around one degree, as well (see Table 1). Finally, yet importantly, it should be kept in mind that the proposed approach has been designed for the specific task of helping the understanding of visual exploration in natural contexts, where usually the different areas of interest are not very close in space, and additionally, each of them has a dimension related to objects in the scene. This implies that a weak loss in accuracy (as actually experienced with respect to the commercial eye-tracker data sheet report) can only marginally affects the overall analysis of the visual exploration behavior. On the other side, the benefits of having a calibration-free system are quite remarkable in terms of technical setup since they make the system suitable for use with non-collaborative individuals (e.g., ASD children or, more generally, neurologically-impaired persons). Anyway, the practical and functional advantages of using the proposed method in a clinical context for the visual observation of the behavior will be better pointed out in the next subsection.

4.2. Exploitation of the System in a Real ASD Treatment Scenario

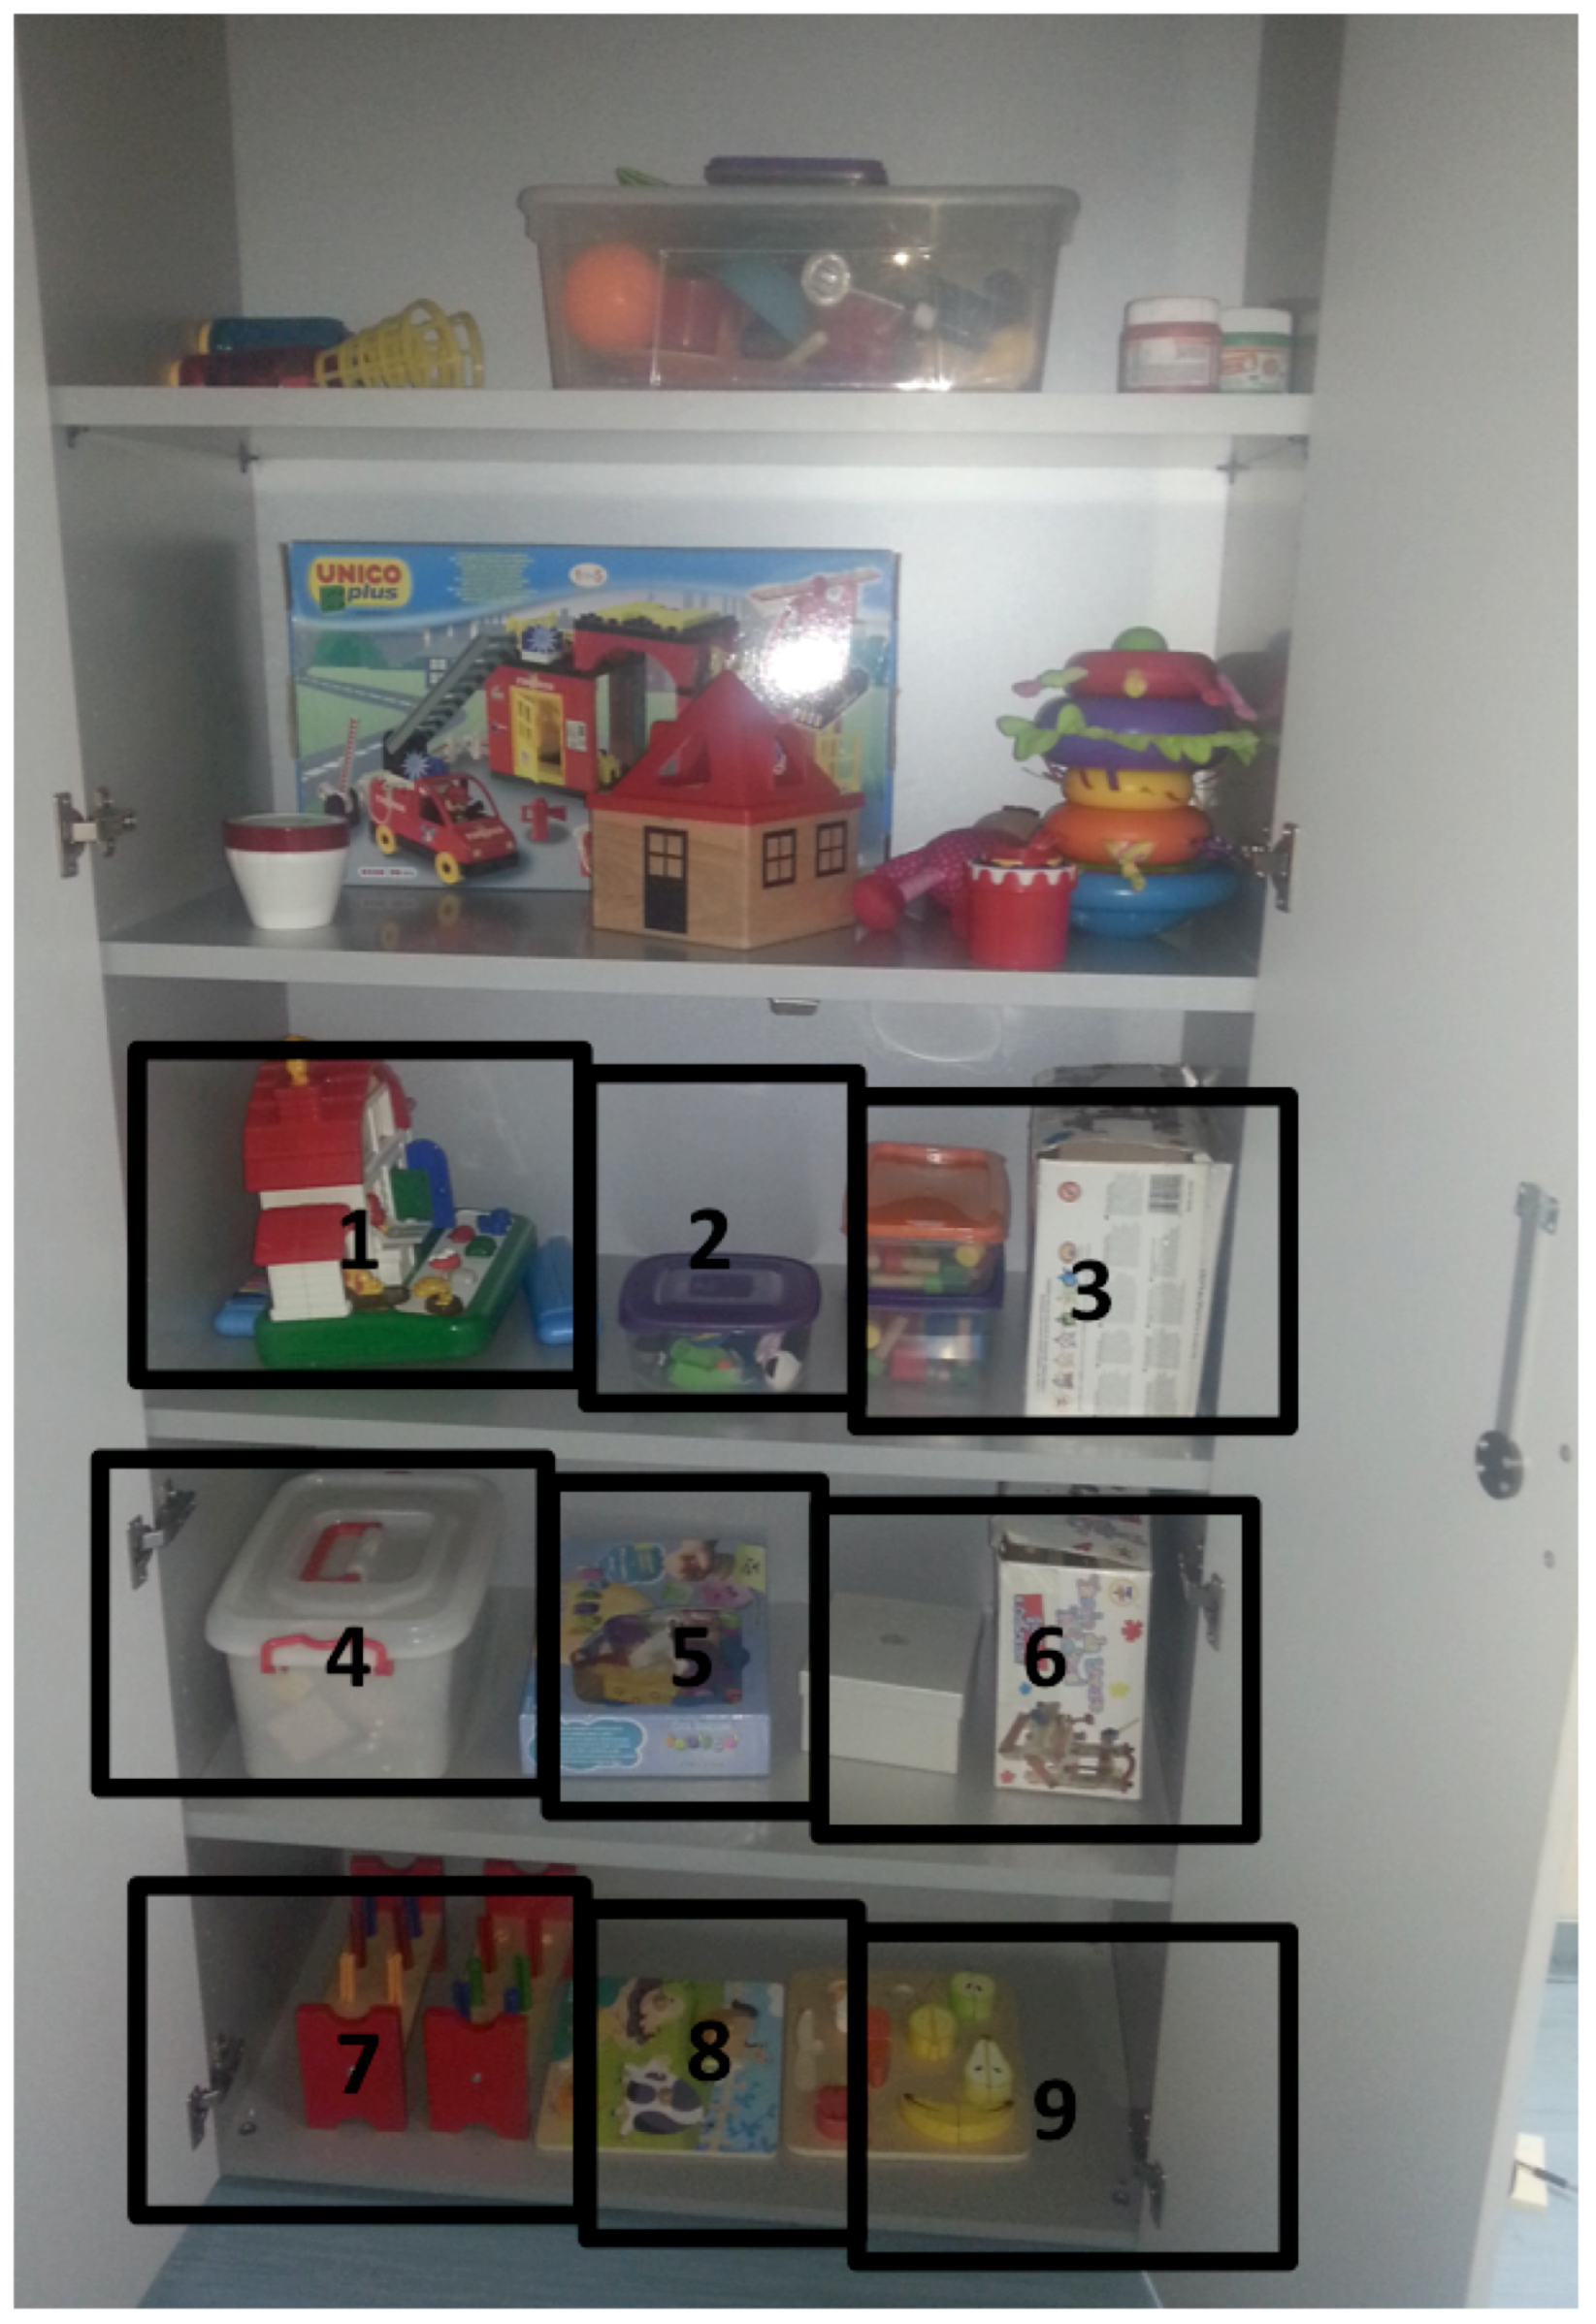
In this section, a demonstration trial of how the proposed gaze estimation system could be exploited in a real ASD treatment scenario is given. By exploiting its main features (no invasive equipment to wear, neither calibration nor training), it was possible to introduce the system and subsequently to collect its outcomes while therapies for treating ASD with the ESDM program were taking place. As explained in the introductory section, the ESDM program is built on the child’s spontaneous interests and game choice delivered in a natural setting. In the considered setup, a closet containing specific toys, which were neatly disposed by the therapist, is placed in the therapy room. When a child enters the room, he is helped by the therapist to open the closet and invited to choose a toy. It is important to highlight that in this specific task of the therapeutic program, only the use of an automatic system can allow caregivers to capture visual exploration details and, as a consequence, to better understand the behavior of the child in perception tasks. Indeed, on the one hand, health professionals have no chance to observe the child from a frontal point of view, and on the other hand, they have also to address practical issues, as leading the child to the closet and encouraging him/her to pick a toy. Figure 9 illustrates an example of the disposition of the toys in the closet. The closet has a size of 85 cm × 195 cm , but only three sectors (the bottom most ones) have been used, considering the age and the height of the involved children (see Table 3). Thus, the useful part has a size of 85 cm × 117 cm . The approximate distance between the eyes and the targets varies in the range 50 / 70 cm , and thus, the precision of the system can be assumed comparable with the one reported in Table 1 and Table 2. In Figure 9, the nine 2D-Areas Of Interest (AOI), corresponding to nine different portions of the closet where toys can be placed, are highlighted. The set of employed toys changes for each child, following the personal strategy and work methodology of the therapist. A Microsoft Kinect sensor was hidden in the area corresponding to Cell # 2 . In this area, a boxed toy was placed, as well; therefore, all nine cells represent assessable areas of interest. Furthermore, the green LED of the sensor has been darkened, to avoid attracting the child’s attention and then affecting his choice. When operating, the system collected gaze data as gaze hits on each AOI. Gaze hits were subsequently aggregated at different levels, resulting in a wealth of psycho-physical measures. In particular, the following parameters have been extracted from the system:
  • Fixation count: the number of fixations on a specific AOI. A fixation was accounted if at least 15 consecutive frames present a hit on the same AOI;
  • First fixation: the first AOI on which the system accounts a fixation after closet opening;
  • Sequence: the ordered list of AOIs observed by the child in terms of fixations;
  • Most viewed toy: the AOI with the highest number of hits.
For each session, extracted data were completed by the record of the AOI containing the chosen toy. This last datum was introduced into the system by the therapist.
Data acquired by the depth sensor were processed by the gaze estimation algorithm running on an Ultrabook Intel i3 CPU @ 1.8 GHz with 4 GB of RAM. With the aforementioned hardware and software configurations, on average, an estimate was available every 0.11 s, i.e., a frequency of 9.1 hits per second was achieved. The use of a notebook available on the mainstream market was done in order to experiment also with the feasibility of arranging temporary installations (since the notebook can be easily placed on the topmost shelf of the closet with a relatively straightforward concealment of cables). In order to not miss information about visual exploration (i.e., to process each acquired frame independently of the available computational resources), a large buffer was introduced. This way, all the acquired frames were processed, and the final outcome of the system was available with a variable delay depending on the duration of each acquisition session and on the processing resources, as well. This means that estimations of gaze hits are, in any case, temporarily deferred by about 30 ms (i.e., all frames, acquired at 30 fps, are processed). In light of this additional consideration and following the above definition, it is possible to state that a fixation occurs when the gaze track remains in the same AOI for about half a second (i.e., 500 ms). It is well known that normal fixations are about 200–300 ms, but we found several studies [67,68] stating that the duration of each fixation can range from a hundred to several thousand milliseconds since it is influenced by exogenous properties such as object movement and luminance, as well as by endogenous properties such as the participant’s processing speed, vigilance levels and interest in the information at the point fixated. Summing up the duration of each fixation depends on the complexity of the environment to be explored and on the mental functions and age of the individuals. Since the evaluation of the durations of fixations in the considered setup was not in the scope of the paper (it might be in the future), we decided to set the minimum fixation length to half a second, which is just a trade off between normal expected durations (suggested by the reviewer as well) and longer durations experienced in the aforementioned papers in the case of infants and even more if they are affected by ASD.
Data acquisition was carried out in accordance with the Code of Ethics of the World Medical Association (Declaration of Helsinki) [69]. Informed consent was obtained for experimentation with human subjects (from the children’s caregivers).
The sample consisted of three children (mean age: 75.66 months, range: 68–80 months), recruited at the Pervasive Healthcare Center of the Institute of Applied Sciences and Intelligent Systems of the National Research Council of Italy in Messina. The diagnostic assessment was based on the Autism Diagnostic Observation Schedule, Griffith’s Developmental Scale, Vineland Adaptive Scale, McArtur Language Test and Child Behavior Checklist (CBCL). Table 3 shows gender, age and Griffith’s Developmental Scale [70,71] for each child involved in the experimental phase.
Children #1 and #2 were involved only in one data acquisition session. Child #3 was instead involved in two different sessions: the first one took place the same day as for the remaining children, whereas the second one took place exactly two weeks later.
This additional data acquisition session was implemented with the aim of verifying in the field the ability of the proposed approach to objectively detect possible temporal variations in the clinical diagnosis of the involved child.
During sessions, data were continuously acquired: when the child opened the closet, his face was detected, and the subsequent algorithmic pipeline started. The child’s gaze track was then computed, projected on the image plane, and then, its intersection with the toys’ AOIs was computed. Thanks to the known geometry of the closet, it was possible to intersect these hits with regions that enclose toys, and then useful information about visual exploration was extracted and recorded for each child. Moreover, the achieved 2D visual exploration on the closet plane was tracked over time, and at the end, this information was related to the chosen toy by means of the corresponding AOI. After data acquisition started, data samples were immediately processed. Anyway, the proposed framework allows the users to perform also an afterward off-line analysis of acquired data. This operating mode was implemented for debugging purposes, but it was also exploited by the caregivers (traditionally reluctant about technological tools) who had in this way the possibility to vouch for the correspondence between the extracted data and the actual behavior of the child.
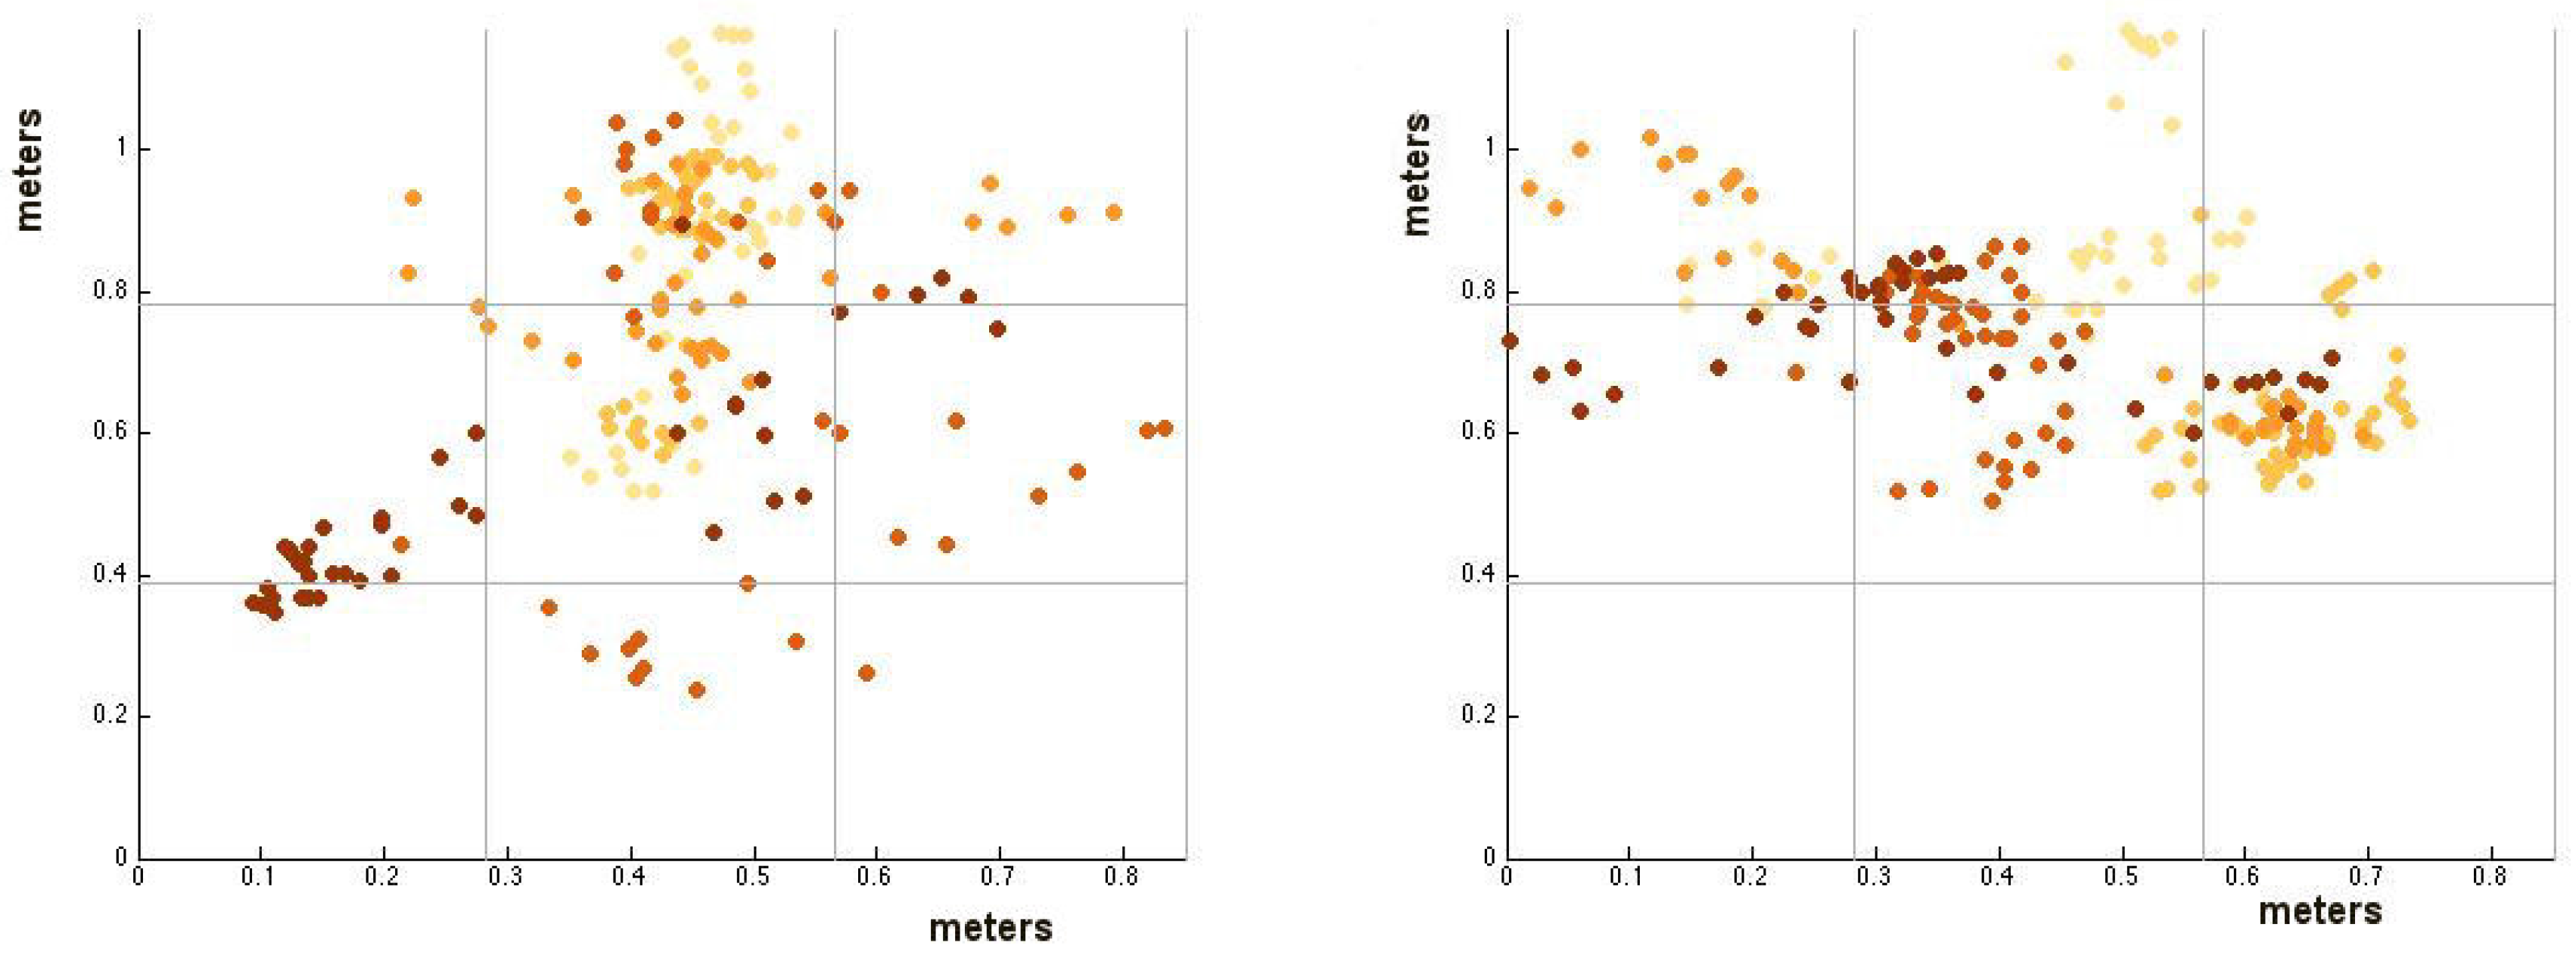
Figure 10 shows the computed hit-maps for Children #1 and #2 in Table 3. The color scale tracks the temporal occurrences of the hits: the lightest colors refer to the beginning of the visual exploratory session, whereas the darkest colors refer to the final part of the session.
The qualitative analysis of acquired gaze hits highlights that Child #1 selected a toy after a very quick exploration; his first fixation was in AOI 5, and the most viewed toy was in AOI 2. There were no relations between his visual exploration and the selected toy since he finally chose the one in AOI 7.
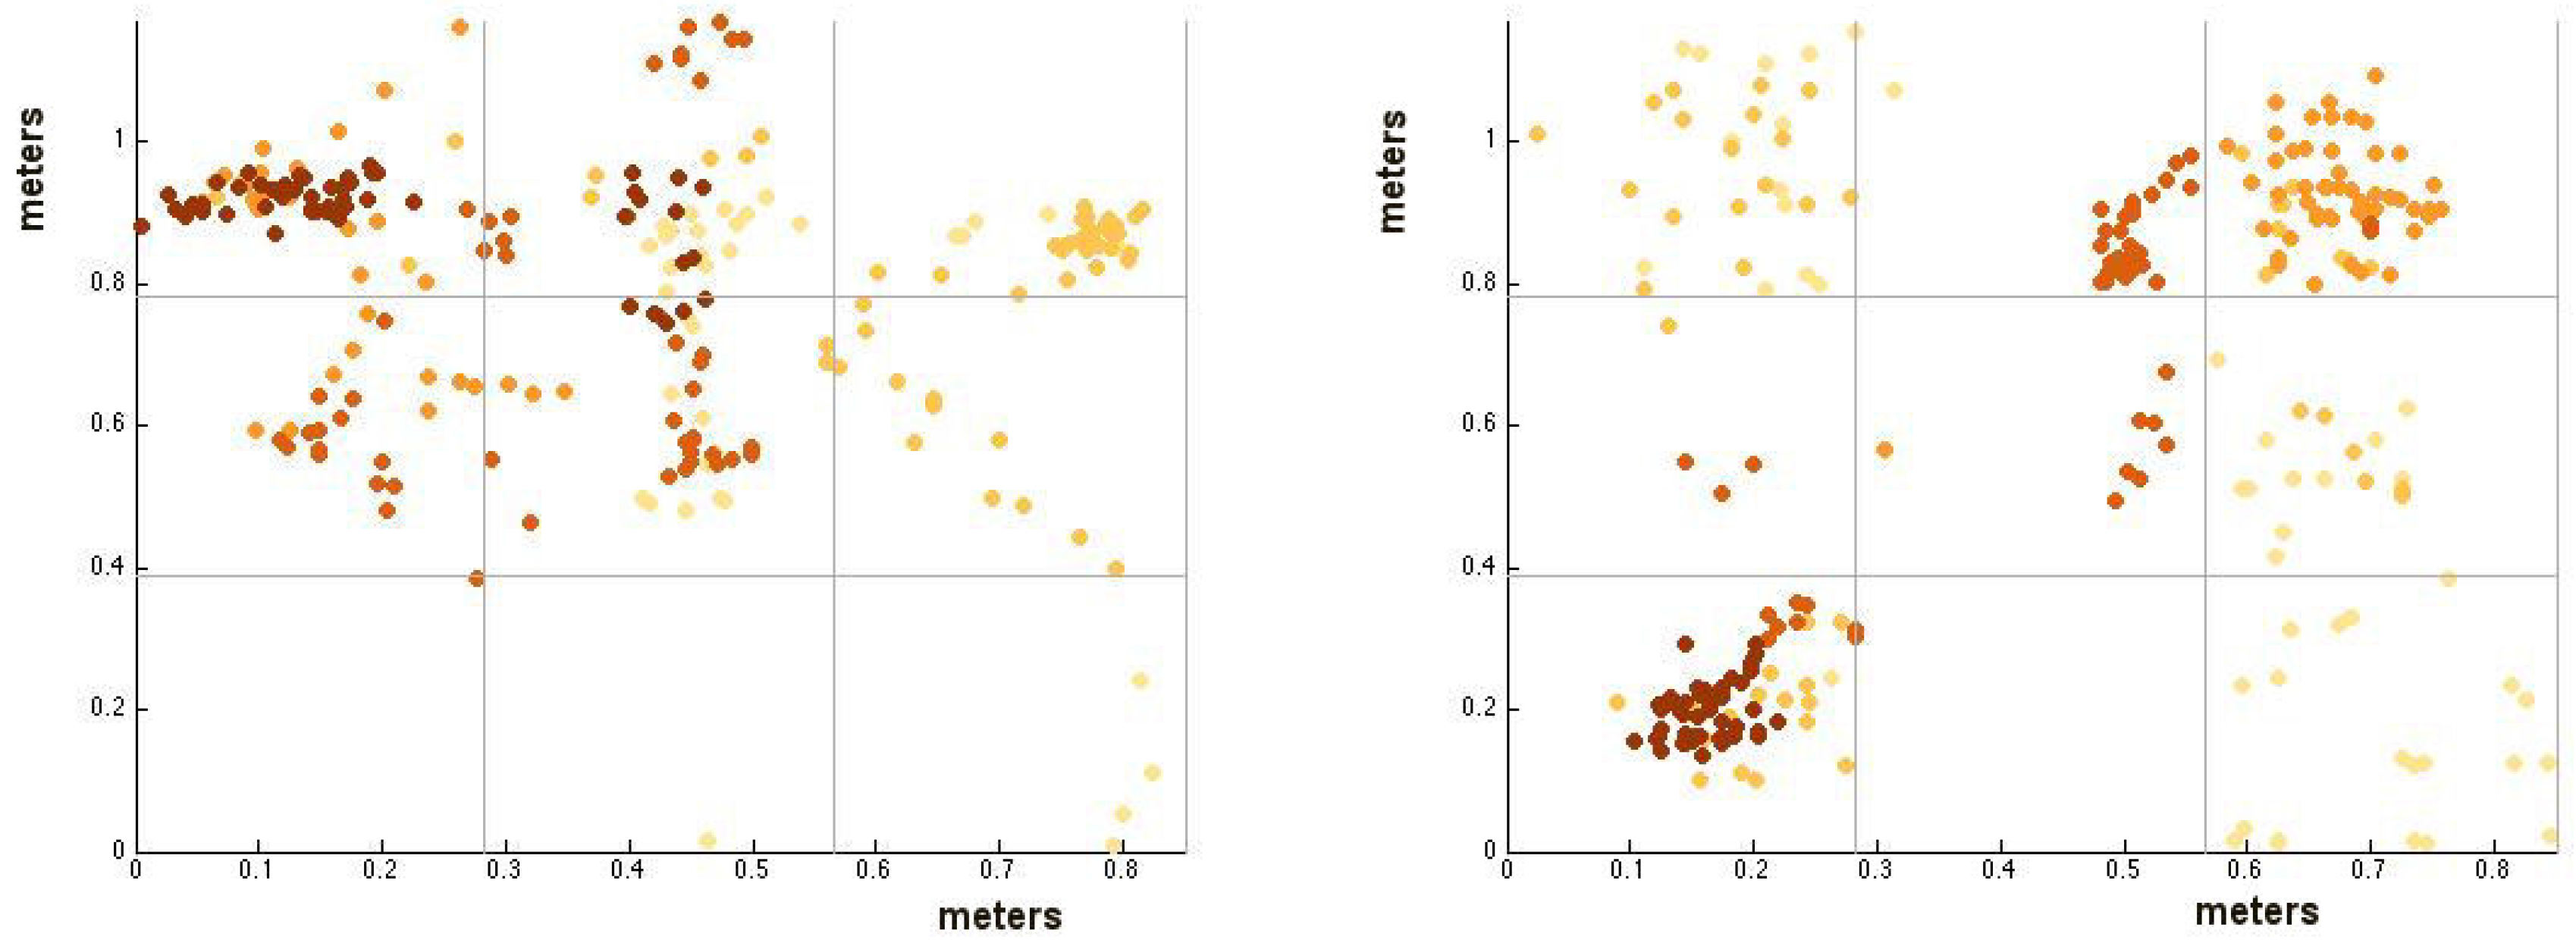
The second child performed a bigger number of gaze hits than the first one. At the end, he selected the last observed toy (in AOI 4). Finally, for the third child, two acquisition sessions (indicated as Sessions A and B), at a distance of two weeks, were carried out. The corresponding hit-maps automatically extracted by the system are reported in Figure 11.
In the first session, the system highlighted different behaviors during the child’s visual exploration phase: at the beginning, a long exploration of toys was observed, then the child focused on a specific point, and finally, he took the corresponding toy (in AOI 1). This child had, in general, a higher number of gaze hits than the former children. The selected toy was by far also the most observed, since he spent much time looking at it. In the second experimental session, the same child performed a very similar behavior: the session had a similar length to the previous one, and again, the choice of the toy matched the AOI with the highest number of gaze hits. The selected toy was also the last one observed before making the decision after a whole exploration of the closet content.
The number of hits on each area of interest of the closet (assuming the same labeling as in Figure 9) is reported in Table 4, where the most viewed toy in each experimental session is highlighted using bold characters. Taking into account also temporal information, it is possible to perform the more exhaustive behavioral analysis that is reported in Table 5 and that can be considered the final outcome of the proposed system. It follows that, through the analysis of the content of Table 5, the therapists involved in the clinical sessions can draw more objective conclusions about the diagnosis or assessment of the disease with respect to the approach without technological support. This is a considerable result considering that wearable or calibration-dependent devices (as commercial eye-trackers are) cannot be exploited in the case of children in the considered age group, which is the more relevant for a proper diagnosis or assessment of ASD.
For example, concerning Child #1, the collected data showed that the selected toy was not the most viewed one (AOI 2), but the last one viewed (AOI 7). This numerical evidence confirmed the expectations of the therapist since the child usually presented repetitive and stereotypical behaviors and, in addition, the grabbed toy was his preferred one considering that he already chose it in clinical sessions. However, the system made it possible to discover additional and unknown behavioral features: the child expressed a strong interest also in two other toys (corresponding to AOI 5 and AOI 2, respectively) that he never chose, even in the foregoing sessions. In light of this new acquired knowledge (that was not possible to get without the proposed system), the therapist could decide to modify the disposition of the toys, for example putting Toys #2 and #5 next to the preferred one trying, in this way, to produce different stimuli to the child, encouraging him to vary the way he plays, since it would represent a strong advancement for him in light of the well-known problem of repetitive behaviors that characterize autism [72].
The second child showed another typical behavior that characterizes autism, i.e., the tendency of taking unusual postures and showing overexciting behaviors [73], demonstrating also that he feels uncomfortable and agitated during social interactions. The use of the proposed system allowed healthcare personnel to understand the impact of this clinical profile on visual exploration behavior. From the the data extracted by the system, a series of large (horizontal) movements of the gaze direction and no correlation between observation and the final choice of the toy were evident.
The case of Child #3 is even more interesting, since this case-study showed the differences in visual exploration in two different sessions pointing out even better the huge potential of a system able to extract a quantitative evaluation of visual exploratory behaviors. In particular, the system reported that in the first session, the child performed a quite complete exploration of the closet before choosing the toy. In light of this, in order to better verify his exploration ability, in the second session, the therapist changed the whole set of toys. In other words, in the second session, the child dealt with a closet containing toys he never had seen before. The system supplied numerical evidence that, in this case, the child performed a different exploration behavior: he took more time to make a decision and looked at the same toy many times. The evidence of this visual exploration behavior demonstrated to the healthcare personnel that the child can successfully undertake a therapeutic path to improve his capability to interact with the surrounding environment.
It is indisputable that the above results are preliminary, but at the same time, they are irrefutable proof that the proposed system can represent an effective tool to obtain detailed information about the exploratory behaviors in children with ASD. As experienced in practice, this additional information can help to carry out more specific therapeutic paths (for example by incrementally optimizing the toy disposition in the closet), but also to better assess developmental disorders.
A final consideration is due to how the AOIs’ boundary areas have been handled. It is straightforward that making a discretization of the observed region (instead of modeling it as continuous through a regression scheme) can result in a loss of accuracy. In other words, we did not ignore the fact that the gaze estimation errors, computed in Section 4.1, can misplace some hits when they lie close to the borders of the AOIs.
In order to give measured data about the estimation of misplaced hits, the offline operation mode of the system (described in Section 4.2 and allowing the user to check frame-by-frame the system outcomes and to match them with the corresponding acquired images) was exploited, and the number of gaze hits lying in the uncertainty regions of the AOI was computed for each experimental session. An uncertainty region was formally defined as the portion of the AOI having a distance from the adjacent AOI that is less than the average estimated error on the observed plane. Please note that uncertainty regions took place only around vertical borders of the AOIs since the objects were placed on different shelves of the closet, and so, horizontal borders of the AOIs were never adjacent. The average linear misplacement error on the observing plane was estimated by the cord calculation formula:
E r r o r L i n e a r = 2 × D × s i n ( E r r o r a n g u l a r / 2 )
where D is the distance between the plane and the user and E r r o r a n g u l a r was set to 2.88 , i.e., the average angular error estimated during the preliminary tests reported in the previous subsection. This way, an area having a width of E r r o r L i n e a r = 3.5 cm was placed around each vertical border of the AOIs, and the gaze hits intersecting those areas were finally accounted for. This resulted in Table 6.
From the above table, it is possible to realize that the number of hits in the uncertainty regions is a very small portion of the total amount of counted hits (10.5% on average). Besides, since gaze hits were subsequently aggregated to get psycho-physical measures, the effects of the occurrences of misplaced hits are further reduced, and thus, it is possible to conclude that they can only very marginally affect the overall evaluation of the visual behavioral patterns. We are perfectly aware that if there were a need for greater granularity in the detection plan (that is, a larger number of targets and smaller ones), it would be necessary to model the areas of uncertainty in the process of visual image reconstruction. However, we believe that this is beyond the scope of this paper.

5. Conclusions

A study about the challenging task of understanding visual exploration in children with ASD has been proposed. It employs a low-cost, non-invasive, safe and calibration-free gaze estimation framework consisting of two main components performing user’s head pose estimation and eye pupil localization on data acquired by an RGBD device. The technique has been used in a scenario where a closet containing specific toys, which are neatly disposed by the therapist, is opened to the child, who freely chooses the desired toy that will be subsequently used during therapy. The system has been tested with children with ASD and during different sessions, allowing understanding of their choices and preferences, allowing one to optimize the toy disposition for cognitive-behavioral therapy. The motivation of this work is that the early detection of developmental disorders is key to child outcome, allowing interventions to be initiated that promote development and improve prognosis. Research on ASD suggests that behavioral markers can be observed late in the first year of life. Many studies have involved extensive frame-by-frame video observation and analysis of a child’s natural behavior. Although non-intrusive, these methods are extremely time-intensive, and they require a high level of observer training. With the goal of aiding and augmenting the visual analysis capabilities in the evaluation and developmental monitoring of ASD, a computer vision tool to observe specific behaviors related to ASD elicited during toy selection tasks, providing both new challenges and opportunities in video analysis, has been proposed. We are aware that identification of saccades, actually achievable only by employing a commercial eye tracker, is another fundamental parameter to be monitored in visual attention studies; anyway, it is important to highlight that the usage of the proposed system has a number of advantages with respect to simply putting into operation one of the eye trackers available on the market. First of all, it takes into account all the most relevant parameters of interest during a visual exploration of the participant: for example, it is possible to obtain a precise estimation of the number of gaze hits, the sequence of points of interest and where the attention goes first. In addition, it allows the participants to be monitored in a completely natural way, i.e., without requiring any initial calibration, nor constraints about their position. Moreover, the proposed system is considerably inexpensive compared to commercial eye tracker solutions. In light of the above and of the very encouraging experimental results, it is possible to assert that this study could provide a new pathway towards inexpensive and non-invasive techniques for evaluating the focus-of-attention in autistic children. Future developments will investigate the possibility to increase system performances in terms of accuracy in the estimation of gaze hits. This will allow testing it even in the case of setups with small and partially superimposed objects of interest. Moreover, the evaluation of the system on a larger number of therapeutic sessions will be addressed (involving other children even of different ages), in order to evaluate any possible correlation between different children when toy disposition varies, as well as to mark out behavioral changes of the same child.

Acknowledgments

This work has been partially supported by the EURICA (Enhancing University Relations by Investing in Cooperative Actions) Erasmus Mundus Action 2 scholarship and by the project “MUSA—Metodologie Ubiquitarie di inclusione sociale per l’Autismo” codice pratica VZC4TI4—“Aiuti a sostegno dei Cluster Tecnologici regionali per l’Innovazione” deliberazione della giunta regionale No. 1536 del 24/07/2014.

Author Contributions

Cosimo Distante and Giovanni Pioggia conceived of and designed the experiments. Marco Leo and Dario Cazzato performed the experiments and wrote the paper. Liliana Ruta and Giulia Crifaci analyzed the data. Giuseppe Massimo Bernava and Silvia M. Castro contributed materials and analysis tools.

Conflicts of Interest

The authors declare no conflict of interest.

References

  1. Leo, M.; Medioni, G.; Trivedi, M.; Kanade, T.; Farinella, G. Computer vision for assistive technologies. Comput. Vis. Image Underst. 2017, 154, 1–15. [Google Scholar] [CrossRef]
  2. D’orazio, T.; Leo, M.; Distante, A. Eye detection in face images for a driver vigilance system. In Proceedings of the Intelligent Vehicles Symposium, Parma, Italy, 14–17 June 2004; pp. 95–98. [Google Scholar]
  3. Baron-Cohen, S.; Auyeung, B.; Nørgaard-Pedersen, B.; Hougaard, D.M.; Abdallah, M.W.; Melgaard, L.; Cohen, A.S.; Chakrabarti, B.; Ruta, L.; Lombardo, M.V. Elevated fetal steroidogenic activity in autism. Mol. Psychiatry 2015, 20, 369–376. [Google Scholar] [CrossRef] [PubMed] [Green Version]
  4. Colombi, C.; Narzisi, A.; Ruta, L.; Cigala, V.; Gagliano, A.; Pioggia, G.; Siracusano, R.; Rogers, S.J.; Muratori, F.; Team, P.P. Implementation of the Early Start Denver Model in an Italian community. Autism 2016. [Google Scholar] [CrossRef] [PubMed]
  5. Marco, E.J.; Hinkley, L.B.; Hill, S.S.; Nagarajan, S.S. Sensory processing in autism: A review of neurophysiologic findings. Pediatr. Res. 2011, 69, 48R–54R. [Google Scholar] [CrossRef] [PubMed]
  6. Chita-Tegmark, M. Social attention in ASD: A review and meta-analysis of eye-tracking studies. Res. Dev. Disabil. 2016, 48, 79–93. [Google Scholar] [CrossRef] [PubMed]
  7. Heaton, T.J.; Freeth, M. Reduced visual exploration when viewing photographic scenes in individuals with autism spectrum disorder. J. Abnorm. Psychol. 2016, 125, 399. [Google Scholar] [CrossRef] [PubMed]
  8. Elison, J.T.; Sasson, N.J.; Turner-Brown, L.M.; Dichter, G.S.; Bodfish, J.W. Age trends in visual exploration of social and nonsocial information in children with autism. Res. Autism Spectr. Disord. 2012, 6, 842–851. [Google Scholar] [CrossRef] [PubMed]
  9. Sasson, N.J.; Elison, J.T. Eye tracking young children with autism. J. Vis. Exp. 2012. [Google Scholar] [CrossRef] [PubMed]
  10. Hochhauser, M.; Grynszpan, O. Methods Investigating How Individuals with Autism Spectrum Disorder Spontaneously Attend to Social Events. Rev. J. Autism Dev. Disord. 2016, 4, 82–93. [Google Scholar] [CrossRef]
  11. Vismara, L.A.; Rogers, S.J. The Early Start Denver Model: A case study of an innovative practice. J. Early Interv. 2008, 31, 91–108. [Google Scholar] [CrossRef]
  12. Vivanti, G.; Paynter, J.; Duncan, E.; Fothergill, H.; Dissanayake, C.; Rogers, S.J.; Victorian ASELCC Team. Effectiveness and feasibility of the Early Start Denver Model implemented in a group-based community childcare setting. J. Autism Dev. Disord. 2014, 44, 3140–3153. [Google Scholar] [CrossRef] [PubMed]
  13. Dawson, G.; Rogers, S.; Munson, J.; Smith, M.; Winter, J.; Greenson, J.; Donaldson, A.; Varley, J. Randomized, controlled trial of an intervention for toddlers with autism: The early start denver model. Pediatrics 2010, 125, e17–e23. [Google Scholar] [CrossRef] [PubMed]
  14. Rogers, S.J.; Dawson, G. Early Start Denver Model for Young Children with Autism: Promoting Language, Learning, and Engagement; Guilford Press: New York, NY, USA, 2010; p. 299. [Google Scholar]
  15. Baron-Cohen, S. Perceptual role taking and protodeclarative pointing in autism. Br. J. Dev. Psychol. 1989, 7, 113–127. [Google Scholar] [CrossRef]
  16. Curcio, F. Sensorimotor functioning and communication in mute autistic children. J. Autism Child. Schizophr. 1978, 8, 281–292. [Google Scholar] [CrossRef] [PubMed]
  17. Ulke-Kurkcuoglu, B.; Kircaali-Iftar, G. A comparison of the effects of providing activity and material choice to children with autism spectrum disorders. J. Appl. Behav. Anal. 2010, 43, 717–721. [Google Scholar] [CrossRef] [PubMed]
  18. Lai, M.C.; Lombardo, M.V.; Baron-Cohen, S. Autism. Lancet 2014, 383, 896–910. [Google Scholar] [CrossRef]
  19. Sivalingam, R.; Cherian, A.; Fasching, J.; Walczak, N.; Bird, N.; Morellas, V.; Murphy, B.; Cullen, K.; Lim, K.; Sapiro, G.; et al. A multi-sensor visual tracking system for behavior monitoring of at-risk children. In Proceedings of the 2012 IEEE International Conference on Robotics and Automation (ICRA), Saint Paul, MN, USA, 14–18 May 2012; pp. 1345–1350. [Google Scholar]
  20. Rehg, J.M. Behavior Imaging: Using Computer Vision to Study Autism. In Proceedings of the MVA 2011 IAPR Conference on Machine Vision Applications, Nara, Japan, 13–15 June 2011. [Google Scholar]
  21. Clifford, S.; Young, R.; Williamson, P. Assessing the early characteristics of autistic disorder using video analysis. J. Autism Dev. Disord. 2007, 37, 301–313. [Google Scholar] [CrossRef] [PubMed]
  22. Baron-Cohen, S.; Cox, A.; Baird, G.; Swettenham, J.; Nightingale, N.; Morgan, K.; Drew, A.; Charman, T. Psychological markers in the detection of autism in infancy in a large population. Br. J. Psychiatry 1996, 168, 158–163. [Google Scholar] [CrossRef] [PubMed]
  23. Robins, D.L.; Fein, D.; Barton, M. Modified Checklist for Autism in Toddlers, Revised, with Follow-Up (M-CHAT-R/F) TM. 2009. Available online: https://www.autismspeaks.org/sites/default/files/docs/sciencedocs/m-chat/m-chat-r_f.pdf?v=1 (accessed on 1 December 2017).
  24. Klin, A.; Jones, W.; Schultz, R.; Volkmar, F.; Cohen, D. Visual fixation patterns during viewing of naturalistic social situations as predictors of social competence in individuals with autism. Arch. Gen. Psychiatry 2002, 59, 809–816. [Google Scholar] [CrossRef] [PubMed]
  25. Shic, F.; Bradshaw, J.; Klin, A.; Scassellati, B.; Chawarska, K. Limited activity monitoring in toddlers with autism spectrum disorder. Brain Res. 2011, 1380, 246–254. [Google Scholar] [CrossRef] [PubMed]
  26. Noris, B.; Nadel, J.; Barker, M.; Hadjikhani, N.; Billard, A. Investigating gaze of children with ASD in naturalistic settings. PLoS ONE 2012, 7. [Google Scholar] [CrossRef] [PubMed]
  27. Riby, D.; Hancock, P.J. Looking at movies and cartoons: eye-tracking evidence from Williams syndrome and autism. J. Intellect. Disabil. Res. 2009, 53, 169–181. [Google Scholar] [CrossRef] [PubMed]
  28. Riby, D.M.; Hancock, P.J. Viewing it differently: Social scene perception in Williams syndrome and autism. Neuropsychologia 2008, 46, 2855–2860. [Google Scholar] [CrossRef] [PubMed]
  29. Trepagnier, C.; Sebrechts, M.M.; Peterson, R. Atypical face gaze in autism. Cyberpsychol. Behav. 2002, 5, 213–217. [Google Scholar] [CrossRef] [PubMed]
  30. Ozonoff, S.; Macari, S.; Young, G.S.; Goldring, S.; Thompson, M.; Rogers, S.J. Atypical object exploration at 12 months of age is associated with autism in a prospective sample. Autism 2008, 12, 457–472. [Google Scholar] [CrossRef] [PubMed]
  31. Sasson, N.J.; Turner-Brown, L.M.; Holtzclaw, T.N.; Lam, K.S.; Bodfish, J.W. Children with autism demonstrate circumscribed attention during passive viewing of complex social and nonsocial picture arrays. Autism Res. 2008, 1, 31–42. [Google Scholar] [CrossRef] [PubMed]
  32. Hutman, T.; Chela, M.K.; Gillespie-Lynch, K.; Sigman, M. Selective visual attention at twelve months: Signs of autism in early social interactions. J. Autism Dev. Disord. 2012, 42, 487–498. [Google Scholar] [CrossRef] [PubMed]
  33. Pierce, K.; Conant, D.; Hazin, R.; Stoner, R.; Desmond, J. Preference for geometric patterns early in life as a risk factor for autism. Arch. Gen. Psychiatry 2011, 68, 101–109. [Google Scholar] [CrossRef] [PubMed]
  34. Noris, B.; Benmachiche, K.; Meynet, J.; Thiran, J.P.; Billard, A.G. Analysis of head-mounted wireless camera videos for early diagnosis of autism. In Computer Recognition Systems 2; Springer: Berlin/Heidelberg, Germany, 2007; pp. 663–670. [Google Scholar]
  35. Tentori, M.; Hayes, G.R. Designing for interaction immediacy to enhance social skills of children with autism. In Proceedings of the 12th ACM international conference on Ubiquitous computing, Copenhagen, Denmark, 26–29 September 2010; pp. 51–60. [Google Scholar]
  36. Boraston, Z.; Blakemore, S.J. The application of eye-tracking technology in the study of autism. J. Physiol. 2007, 581, 893–898. [Google Scholar] [CrossRef] [PubMed]
  37. Lai, M.L.; Tsai, M.J.; Yang, F.Y.; Hsu, C.Y.; Liu, T.C.; Lee, S.W.Y.; Lee, M.H.; Chiou, G.L.; Liang, J.C.; Tsai, C.C. A review of using eye-tracking technology in exploring learning from 2000 to 2012. Educ. Res. Rev. 2013, 10, 90–115. [Google Scholar] [CrossRef]
  38. Wagner, J.B.; Hirsch, S.B.; Vogel-Farley, V.K.; Redcay, E.; Nelson, C.A. Eye-tracking, autonomic, and electrophysiological correlates of emotional face processing in adolescents with autism spectrum disorder. J. Autism Dev. Disord. 2013, 43, 188–199. [Google Scholar] [CrossRef] [PubMed]
  39. Dalton, K.M.; Nacewicz, B.M.; Johnstone, T.; Schaefer, H.S.; Gernsbacher, M.A.; Goldsmith, H.; Alexander, A.L.; Davidson, R.J. Gaze fixation and the neural circuitry of face processing in autism. Nat. Neurosci. 2005, 8, 519–526. [Google Scholar]
  40. Shic, F.; Chawarska, K.; Bradshaw, J.; Scassellati, B. Autism, eye-tracking, entropy. In Proceedings of the 2008 7th IEEE International Conference on Development and Learning, Monterey, CA, USA, 9–12 August 2008; pp. 73–78. [Google Scholar]
  41. Pelphrey, K.A.; Sasson, N.J.; Reznick, J.S.; Paul, G.; Goldman, B.D.; Piven, J. Visual scanning of faces in autism. J. Autism Dev. Disord. 2002, 32, 249–261. [Google Scholar] [CrossRef] [PubMed]
  42. Senju, A.; Csibra, G. Gaze following in human infants depends on communicative signals. Curr. Biol. 2008, 18, 668–671. [Google Scholar] [CrossRef] [PubMed]
  43. Yoder, P.; Stone, W.L.; Walden, T.; Malesa, E. Predicting social impairment and ASD diagnosis in younger siblings of children with autism spectrum disorder. J. Autism Dev. Disord. 2009, 39, 1381–1391. [Google Scholar] [CrossRef] [PubMed]
  44. Dawson, G.; Toth, K.; Abbott, R.; Osterling, J.; Munson, J.; Estes, A.; Liaw, J. Early social attention impairments in autism: Social orienting, joint attention, and attention to distress. Dev. Psychol. 2004, 40, 271. [Google Scholar] [CrossRef] [PubMed]
  45. Guillon, Q.; Hadjikhani, N.; Baduel, S.; Rogé, B. Visual social attention in autism spectrum disorder: Insights from eye tracking studies. Neurosci. Biobehav. Rev. 2014, 42, 279–297. [Google Scholar] [CrossRef] [PubMed]
  46. Nakano, T.; Tanaka, K.; Endo, Y.; Yamane, Y.; Yamamoto, T.; Nakano, Y.; Ohta, H.; Kato, N.; Kitazawa, S. Atypical gaze patterns in children and adults with autism spectrum disorders dissociated from developmental changes in gaze behaviour. Proc. R. Soc. Lond. B Biol. Sci. 2010. [Google Scholar] [CrossRef] [PubMed]
  47. Von Hofsten, C.; Uhlig, H.; Adell, M.; Kochukhova, O. How children with autism look at events. Res. Autism Spectr. Disord. 2009, 3, 556–569. [Google Scholar] [CrossRef]
  48. Falck-Ytter, T.; Fernell, E.; Gillberg, C.; Von Hofsten, C. Face scanning distinguishes social from communication impairments in autism. Dev. Sci. 2010, 13, 864–875. [Google Scholar] [CrossRef] [PubMed]
  49. Nyström, M.; Hooge, I.; Andersson, R. Pupil size influences the eye-tracker signal during saccades. Vis. Res. 2016, 121, 95–103. [Google Scholar] [CrossRef] [PubMed]
  50. Franchak, J.M.; Kretch, K.S.; Soska, K.C.; Adolph, K.E. Head-mounted eye tracking: A new method to describe infant looking. Child Dev. 2011, 82, 1738–1750. [Google Scholar] [CrossRef] [PubMed]
  51. Noris, B.; Keller, J.B.; Billard, A. A wearable gaze tracking system for children in unconstrained environments. Comput. Vis. Image Underst. 2011, 115, 476–486. [Google Scholar] [CrossRef]
  52. Parés, N.; Carreras, A.; Durany, J.; Ferrer, J.; Freixa, P.; Gómez, D.; Kruglanski, O.; Parés, R.; Ribas, J.I.; Soler, M.; et al. Promotion of creative activity in children with severe autism through visuals in an interactive multisensory environment. In Proceedings of the 2005 Conference on Interaction Design and Children, Boulder, CO, USA, 8–10 June 2005; pp. 110–116. [Google Scholar]
  53. Cazzato, D.; Evangelista, A.; Leo, M.; Carcagnì, P.; Distante, C. A low-cost and calibration-free gaze estimator for soft biometrics: An explorative study. Pattern Recognit. Lett. 2016, 82, 196–206. [Google Scholar] [CrossRef]
  54. Fuhl, W.; Tonsen, M.; Bulling, A.; Kasneci, E. Pupil detection for head-mounted eye tracking in the wild: An evaluation of the state of the art. Mach. Vis. Appl. 2016, 27, 1275–1288. [Google Scholar] [CrossRef]
  55. De Beugher, S.; Brône, G.; Goedemé, T. Automatic analysis of in-the-wild mobile eye-tracking experiments. In Proceedings of the First International Workshop on Egocentric Perception, Interaction and Computing, Amsterdam, The Netherlands, 9 October 2016; Volume 1. [Google Scholar]
  56. Wen, Q.; Xu, F.; Yong, J.H. Real-time 3D Eye Performance Reconstruction for RGBD Cameras. IEEE Trans. Vis. Comput. Graph. 2017, 23, 2586–2598. [Google Scholar] [CrossRef] [PubMed]
  57. Brey, P. Freedom and privacy in ambient intelligence. Ethics Inf. Technol. 2005, 7, 157–166. [Google Scholar] [CrossRef]
  58. Langheinrich, M. Privacy by design—Principles of privacy-aware ubiquitous systems. In Proceedings of the International Conference on Ubiquitous Computing, Atlanta, GA, USA, 30 September–2 October 2001; Springer: Berlin/Heidelberg, Germany, 2001; pp. 273–291. [Google Scholar]
  59. Stiefelhagen, R.; Zhu, J. Head orientation and gaze direction in meetings. In Proceedings of the CHI’02 Extended Abstracts on Human Factors in Computing Systems, Minneapolis, MN, USA, 20–25 April 2002; pp. 858–859. [Google Scholar]
  60. Cootes, T.F.; Edwards, G.J.; Taylor, C.J. Active appearance models. IEEE Trans. Pattern Anal. Mach. Intell. 2001, 23, 681–685. [Google Scholar] [CrossRef]
  61. Besl, P.J.; McKay, N.D. Method for registration of 3-D shapes. Robotics-DL Tentative; International Society for Optics and Photonics: Bellingham, WA, USA, 1992; pp. 586–606. [Google Scholar]
  62. Ahlberg, J. Candide-3-an updated parameterised face. Citeseer, January 2001; 1–16. [Google Scholar]
  63. Xiao, J.; Moriyama, T.; Kanade, T.; Cohn, J.F. Robust full-motion recovery of head by dynamic templates and re-registration techniques. Int. J. Imaging Syst. Technol. 2003, 13, 85–94. [Google Scholar] [CrossRef] [PubMed]
  64. Basu, S.; Essa, I.; Pentland, A. Motion regularization for model-based head tracking. In Proceedings of the 13th International Conference on Pattern Recognition, Vienna, Austria, 25–29 August 1996; Volume 3, pp. 611–616. [Google Scholar]
  65. Sun, L.; Liu, Z.; Sun, M.T. Real time gaze estimation with a consumer depth camera. Inf. Sci. 2015, 320, 346–360. [Google Scholar] [CrossRef]
  66. Xiong, X.; Cai, Q.; Liu, Z.; Zhang, Z. Eye gaze tracking using an RGBD camera: A comparison with a RGB solution. In Proceedings of the 2014 ACM International Joint Conference on Pervasive and Ubiquitous Computing: Adjunct Publication, Seattle, WA, USA, 13–17 September 2014; pp. 1113–1121. [Google Scholar]
  67. Wass, S.V.; Jones, E.J.; Gliga, T.; Smith, T.J.; Charman, T.; Johnson, M.H.; BASIS Team. Shorter spontaneous fixation durations in infants with later emerging autism. Sci. Rep. 2015, 5. [Google Scholar] [CrossRef] [PubMed] [Green Version]
  68. Richards, J.E. The development of attention to simple and complex visual stimuli in infants: Behavioral and psychophysiological measures. Dev. Rev. 2010, 30, 203–219. [Google Scholar] [CrossRef] [PubMed]
  69. Rickham, P. Human experimentation. Code of ethics of the world medical association: Declaration of Helsinki. Br. Med. J. 1964, 2, 177. [Google Scholar] [PubMed]
  70. Huntley, M. The Griffiths Mental Development Scales: From Birth to 2 Years; Association for Research in Infant and Child Development (ARICD): Oxford, UK, 1996. [Google Scholar]
  71. Luiz, D.; Foxcroft, C.; Stewart, R. The construct validity of the Griffiths Scales of Mental Development. Child Care Health Dev. 2001, 27, 73–83. [Google Scholar] [CrossRef] [PubMed]
  72. Boyd, B.A.; McDonough, S.G.; Bodfish, J.W. Evidence-based behavioral interventions for repetitive behaviors in autism. J. Autism Dev. Disord. 2012, 42, 1236–1248. [Google Scholar] [CrossRef] [PubMed]
  73. Adrien, J.; Perrot, A.; Hameury, L.; Martineau, J.; Roux, S.; Sauvage, D. Family home movies: Identification of early autistic signs in infants later diagnosed as autistics. Brain Dysfunct. 1991, 4, 355–362. [Google Scholar]
Figure 1. A block diagram of the gaze estimation method.
Jimaging 04 00009 g001
Figure 2. A schematic representation of the head pose estimation module.
Jimaging 04 00009 g002
Figure 3. Two outputs of the head pose estimation modules.
Jimaging 04 00009 g003
Figure 4. The rough localization of the eye regions. Labels are explained in the text.
Jimaging 04 00009 g004
Figure 5. Scheme of the pupil detection module.
Jimaging 04 00009 g005
Figure 6. Gaze estimation by head pose.
Jimaging 04 00009 g006
Figure 7. A schematic representation of the gaze correction.
Jimaging 04 00009 g007
Figure 8. The technical setup to evaluate the proposed gaze estimator. A person is standing in front of the panel where nine circular markers were stuck. The person is asked to look at each of the markers on the panel, in a predefined order, and then to confirm that the markers are in their requisite positions. In the example, the marker on the upper left of the panel is being observed.
Jimaging 04 00009 g008
Figure 9. An example of toys disposition in the closet.
Jimaging 04 00009 g009
Figure 10. The computed hit-map for Children #1 (left) and #2 (right).
Jimaging 04 00009 g010
Figure 11. The computed hit map for Child #3, Sessions A (left) and B (right).
Jimaging 04 00009 g011
Table 1. Experienced gaze estimation errors under varying lighting conditions (light source described in the second column) with 4 typically-developed adults. The headers of the columns Std x and Std y stand for standard deviation along x and y axes respectively.
Errors (deg)
xyStd xStd y
P0Frontal0.991.230.300.52
Left1.051.430.400.66
Right1.251.980.430.78
P1Frontal4.223.921.661.88
Left4.804.331.832.04
Right6.005.072.312.14
P2Frontal3.501.801.061.28
Left3.771.991.091.31
Right4.982.161.121.44
P3Frontal1.892.210.800.77
Left2.032.831.331.44
Right3.094.372.012.15
AverageFrontal2.462.290.951.11
Left2.912.001.161.36
Right3.833.391.461.60
Table 2. Experienced gaze estimation errors under varying lighting conditions (light source described in the second column) with 4 typically-developed children. The headers of the columns Std x and Std y stand for standard deviation along x and y axes respectively.
Errors (deg)
xyStd xStd y
P0Frontal1.041.270.380.60
Left1.111.420.480.71
Right1.311.990.470.82
P1Frontal4.343.951.681.90
Left5.044.631.861.99
Right6.355.182.412.44
P2Frontal3.571.891.061.31
Left4.012.051.191.34
Right5.002.191.191.47
P3Frontal2.102.290.880.79
Left2.012.881.391.50
Right3.174.432.132.18
AverageFrontal2.762.351.001.15
Left3.042.241.231.38
Right3.953.441.551.72
Table 3. Children gender, age and Griffith’s Developmental Scale.
ChildGenderAge (months)Griffith’s Developmental Scale
#1Male6892
#2Male8085
#3Male7986
Table 4. Account of visual hits for each experimental session.
SectorChild 1Child 2Child 3 AChild 3 B
#12266733
#282514430
#31083360
#42013234
#54647418
#610621217
#7170175
#89011
#910420
Table 5. Final outcomes of the proposed system.
MetricChild 1Child 2Child 3 AChild 3 B
Fixation Count4479
Sequence5-2-5-72-1-5-65-2-3-5-4-2-11-9-6-3-1-7-3-2-7
First Fixation Cell5251
Selected Toy7417
Most Viewed Toy2617
Table 6. Estimation of gaze hits in uncertainty regions.
Total Number of HitsHits in the Uncertainty RegionsUncertainty Ratio
Child 11972512%
Child 22072813%
Child 3A226229.7%
Child 3B248187.2%

