Article

A Rapid Screening Method for the Measurement of Neonatal Total Homocysteine in Dried Blood Spots by Liquid Chromatography-Tandem Mass Spectrometry

1
Metabolic Laboratory, Department of Laboratory Medicine & Pathology, Hamad Medical Corporation, P.O. Box 3050, Doha, Qatar
2
Biochemical Genetics Laboratory, Mayo Clinic College of Medicine, Rochester, MN 55905, USA
*
Author to whom correspondence should be addressed.
Current address: Reference Laboratory for Neonatal Screening, National Institute for Public Health and the Environment (RIVM), P.O. Box 1, 3720 BA Bilthoven, The Netherlands.
Int. J. Neonatal Screen. 2017, 3(4), 32; https://doi.org/10.3390/ijns3040032
Submission received: 23 October 2017 / Accepted: 3 November 2017 / Published: 1 December 2017

Abstract

:
Homocystinuria (HCU) due to cystathionine-β-synthase deficiency is generally regarded as a rare disease, but within the Qatari population has an incidence of 1 in 1800 live births. Most newborn screening methods for HCU using dried blood spots (DBS) rely on the detection of an elevated methionine level or a rapid screen for total homocysteine (tHCY). However, screening based on methionine levels alone lacks specificity and rapid liquid chromatography tandem mass spectrometry (LC-MS/MS) methods for tHCY exhibit variable results with high false positive rates. This report describes a LC-MS/MS method for detection of tHCY on DBS, with improved specificity. tHCY was extracted from DBS with a solution containing dithiothreitol and subsequently butylated with hydrochloric acid in n-butanol. The butyl esters were separated by liquid chromatography on a reverse-phase column and the homocysteine (HCY), detected by tandem mass spectrometry. The butyl ester of HCY eluted at 1.8 min. Total analysis time was 6.1 min per sample, including column flush and equilibration. This method allows for the quantification of tHCY over a linear range from 0.3 to 200 µM. Intraassay and interassay imprecision and recoveries were acceptable. Good concordance was observed with another LC-MS/MS method. Application of this method improves specificity and reduces false positive rates in screening for HCU.

1. Introduction

The worldwide incidence of cystathionine-β-synthase (CBS) deficiency has been estimated to be at least 1:335,000 live births, with a much higher incidence in specific populations [1]. For example, the incidence ranges between 1:6400 to 1:20,500 in European populations and between 1:1800 to 1:3000 in the Qatari population [2,3,4,5,6,7]. The true worldwide prevalence is likely underestimated because of undiagnosed cases [8]. More than 190 mutations have been reported in the CBS gene [9], but within the Qatari population, homocystinuria (HCU) is caused predominately by a single mutation c.1006C > T (p.R336C) [6]. In Qatar, the high incidence of CBS deficiency and availability of effective treatment justifies a primary screen for all neonates.
There are two forms of CBS deficiency: pyridoxine responsive and non-pyridoxine responsive HCU. The pyridoxine responsive form is usually treated with variable doses of pyridoxine [1]. Non-pyridoxine responsive HCU is more severe and is usually treated with a methionine restricted diet and cysteine enriched amino acid supplementation [10]. Children with HCU appear normal in early infancy, but the subsequent natural course of CBS deficiency is severe, with patients presenting with ectopia lentis and myopia, mental retardation, marfanoid habitus, osteoporosis, and thromboembolic events, as well as decreased IQ [1,11,12]. Milder forms may manifest later in adulthood [8]. However, if detected early and with compliance to treatment, HCU can be successfully treated, resulting in normal cognitive development and prevention of physical complications [13].
Biochemical consequences of CBS deficiency are highly elevated concentrations of plasma total homocysteine (tHCY), low plasma cystine or total cysteine, high normal to elevated methionine, low normal to decreased cystathionine, and an abnormal cystathionine/methionine ratio [14,15].
Although methionine and methionine/phenylalanine ratio are the most commonly used primary markers for CBS deficiency in newborn screening (NBS) with dried blood spots (DBS), specificity is poor since methionine blood concentrations also increase in other disorders. In addition, the sensitivity of methionine for pyridoxine non-responsive HCU is limited and inversely proportional to methionine concentration [13]. It has been shown that NBS programs using methionine as the primary marker for HCU most likely fail to detect the majority of patients with pyridoxine responsive disease [16]. However, a fivefold reduction in false positive rates can be achieved by quantifying tHCY in DBS as a second tier marker [17].

2. Materials and Methods

Unless otherwise specified all work was conducted in the Metabolic Laboratory, Hamad Medical Corporation (HMC), Doha, Qatar.

2.1. Reagents

The internal standard for the tHCY assay was a stable-isotope labeled homocystine (DL-homocystine-3,3,3’3’,4,4,4’,4’–d8), obtained from Cambridge Isotope Laboratories (Andover, MA, USA). DL-homocysteine, acetonitrile, and formic acid were purchased from Sigma-Aldrich (St. Louis, MO, USA). 1,4-Dithiothreitol (DTT) and 3 mol/L hydrochloric acid in n-butanol (HCl in n-butanol) were purchased from Roche Diagnostics (Indianapolis, IN, USA) and Regis Technologies (Morton Grove, IL, USA), respectively. All of the reagents were of the highest purity available, and were used without further purification.

2.2. Instrumentation

The prepared samples were analysed in positive ion mode using either an AB Sciex 4000 API Liquid Chromatography Tandem Mass Spectrometry (LC-MS/MS) System with an Agilent 1260 Liquid Chromatograph or a Waters Quattro Micro API LC-MS/MS System with a Waters 2759 Separations Module.

2.3. Dried Blood Spots

Leftover DBS (n = 1204) that were submitted to the laboratory for routine NBS were used for the validation of this method. Also included in the validation study, were NBS DBS specimens of confirmed cases with CBS deficiency (n = 17) and maternal vitamin B12 deficiency (n = 9).
DBS calibrators and controls were prepared in house for the purpose of generating calibration curves, monitoring quality control (QC), calculation of recovery, and measuring imprecision. Aliquots of whole blood collected in EDTA from healthy volunteers were spiked with homocysteine (HCY) to achieve added concentrations of 0, 2, 5, 10, 20, 50, 100, and 200 µmol/L for the calibrators and 3 µmol/L and 40 µmol/L for the low level and high level QC materials, respectively. The DBS for calibrators and controls were prepared by spotting 75 µL aliquots of whole blood onto filter paper (Whatman 903) and drying overnight at an ambient temperature. The spotted cards were transferred to a sealed plastic bag with desiccant and were stored at −20 °C.

2.4. Sample Extraction and Preparation

3.2 mm discs were punched out of the DBS into a 96-well filter plate. tHCY was extracted by adding a 170 µL volume of solution containing internal standard, d8-homocystine (0.7 µmol/L) in a solvent mixture of 70% acetonitrile and 30% water containing 0.5% Formic Acid and DTT (40 mmol/L). The filter plate was sealed and tHCY was extracted using a plate shaker at 120 rpm for 60 min. After extraction, the filter plate was placed on a collection microtiter plate and centrifuged at 3000 rpm for 3 min. The filtered extract was then dried at 60 °C using heated air. The HCY was converted to butyl esters by the addition of 70 µL of 3 mol/L HCl in n-butanol to the residues and incubated at 60 °C for 15 min. Following the butylation reaction, the excess butanol was evaporated to dryness at 60 °C using heated air and the samples reconstituted in 100 µL of water. The extracted and butylated specimens were stable for seven days under ambient conditions.
Each plate included a set of calibrators at the beginning of the plate and a set of both low level and high level controls at the beginning and at the end of the plate.

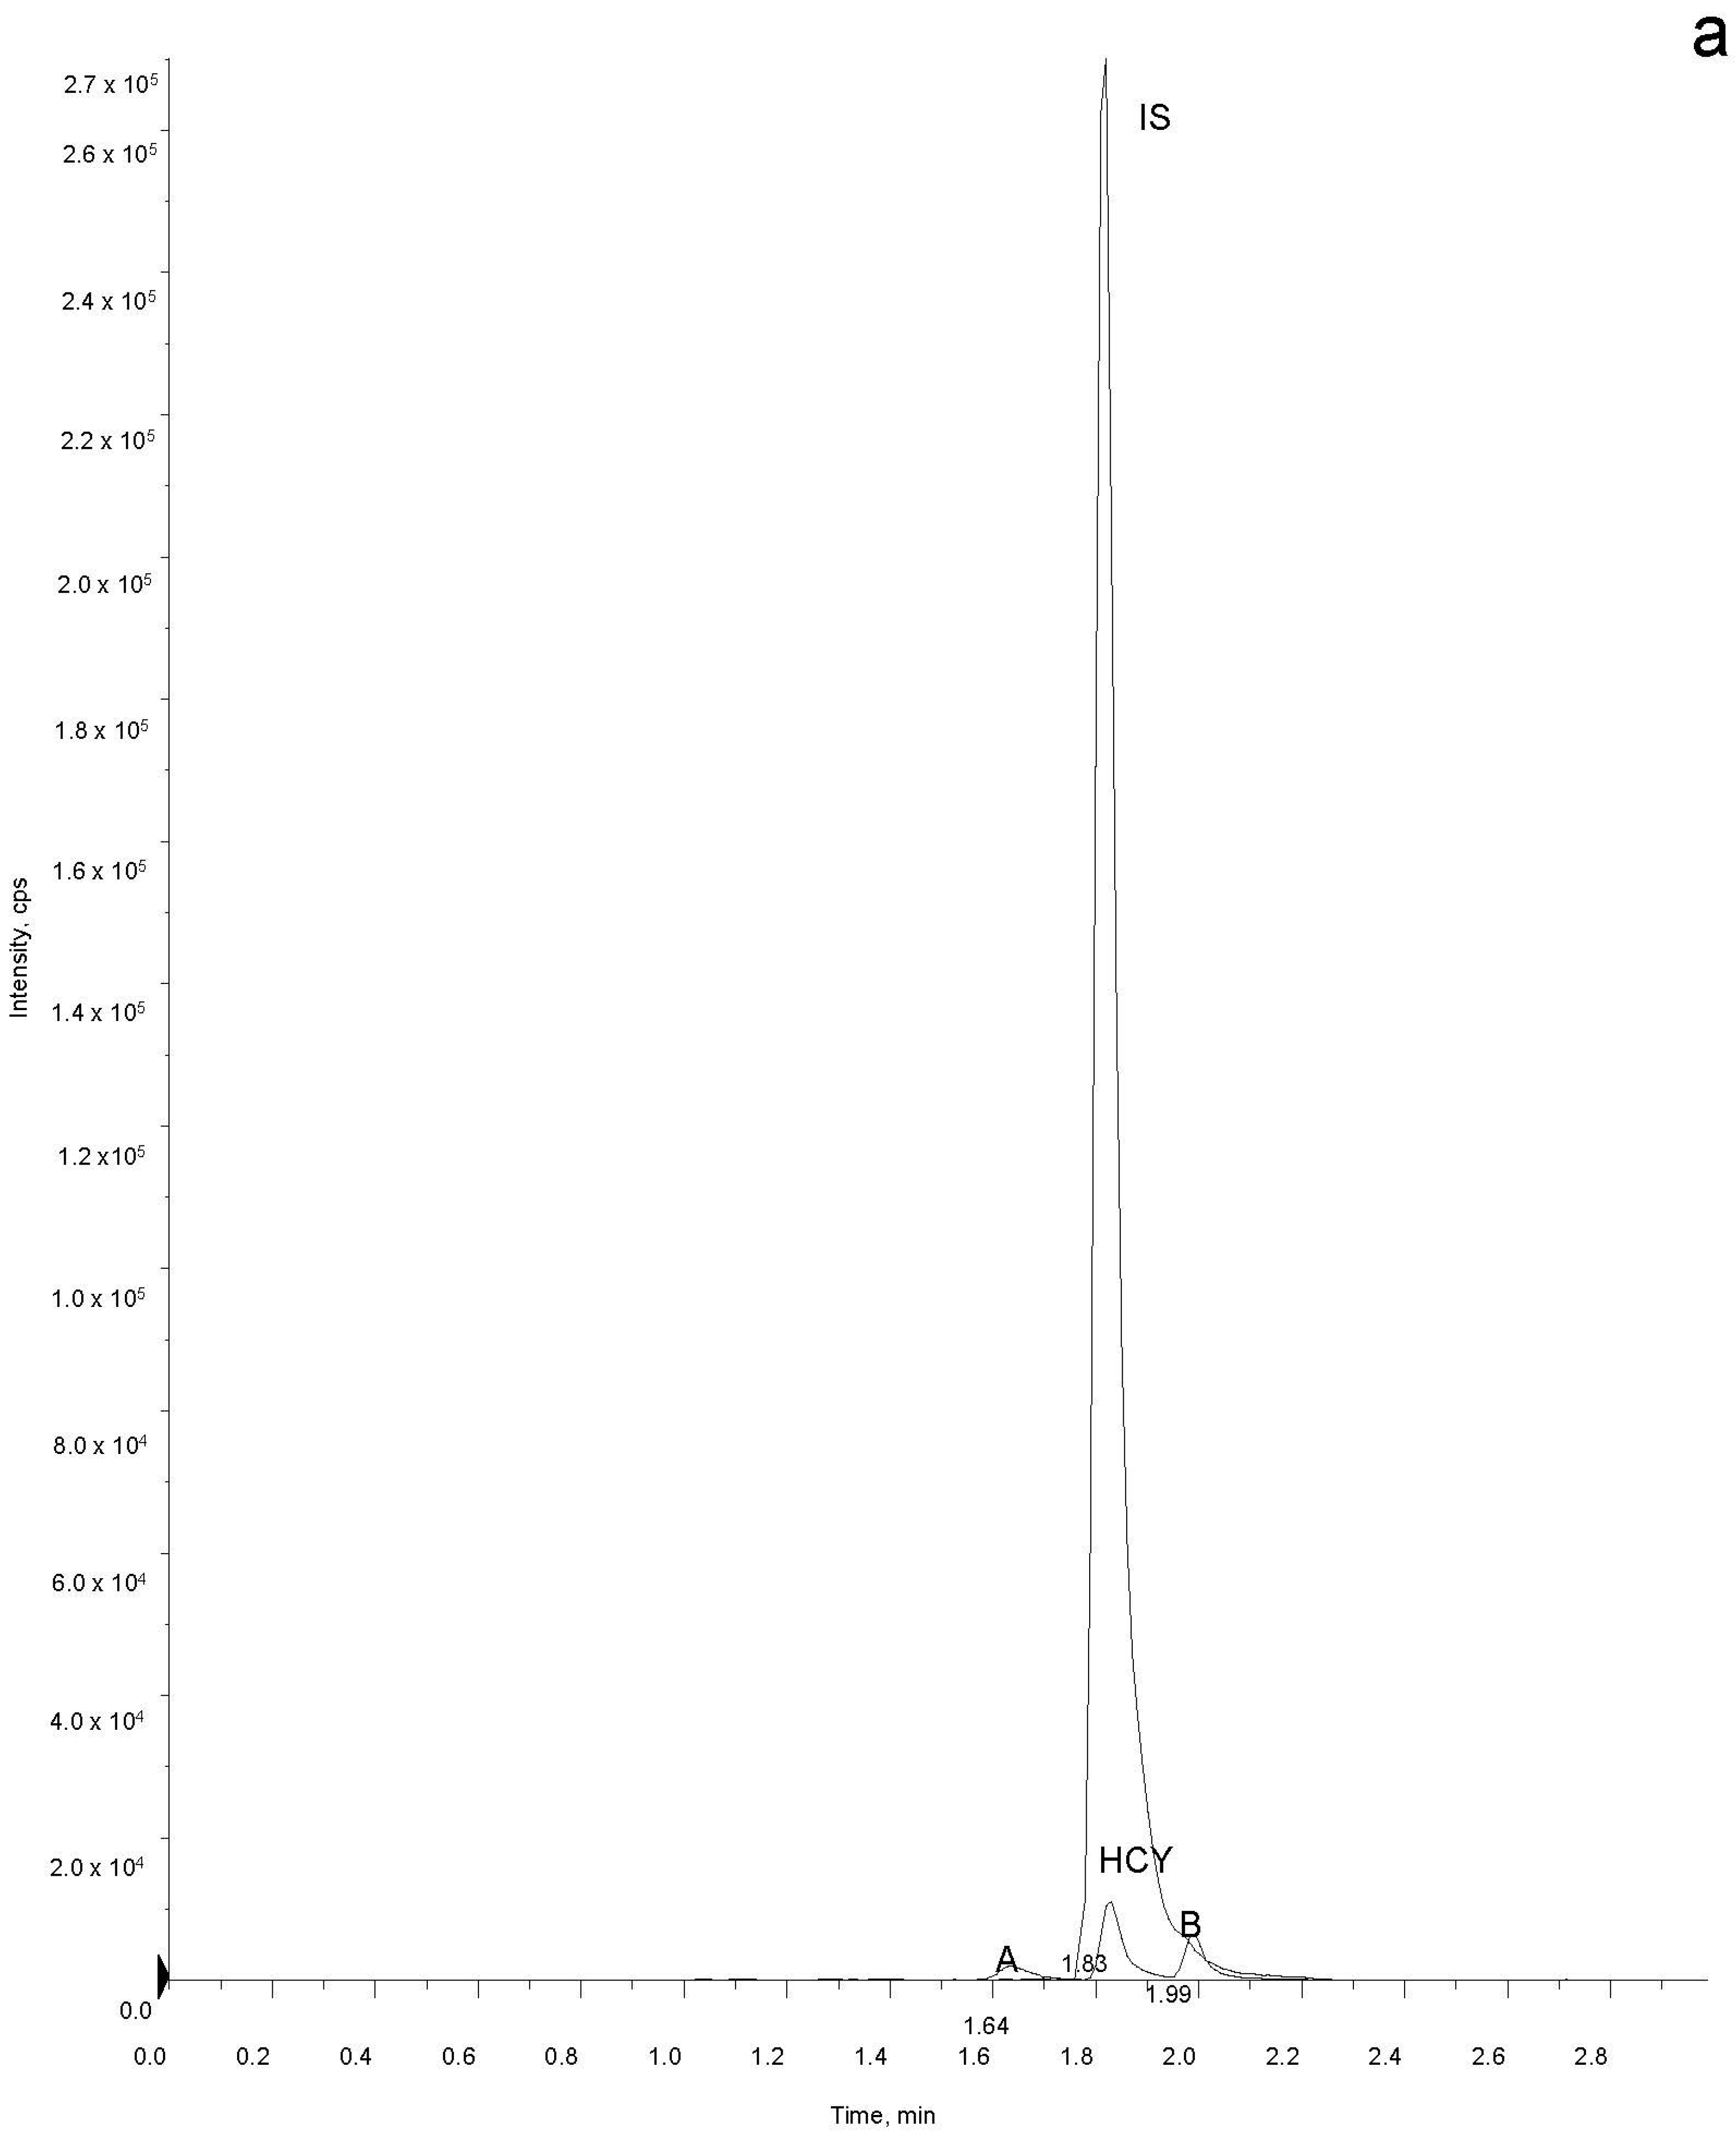
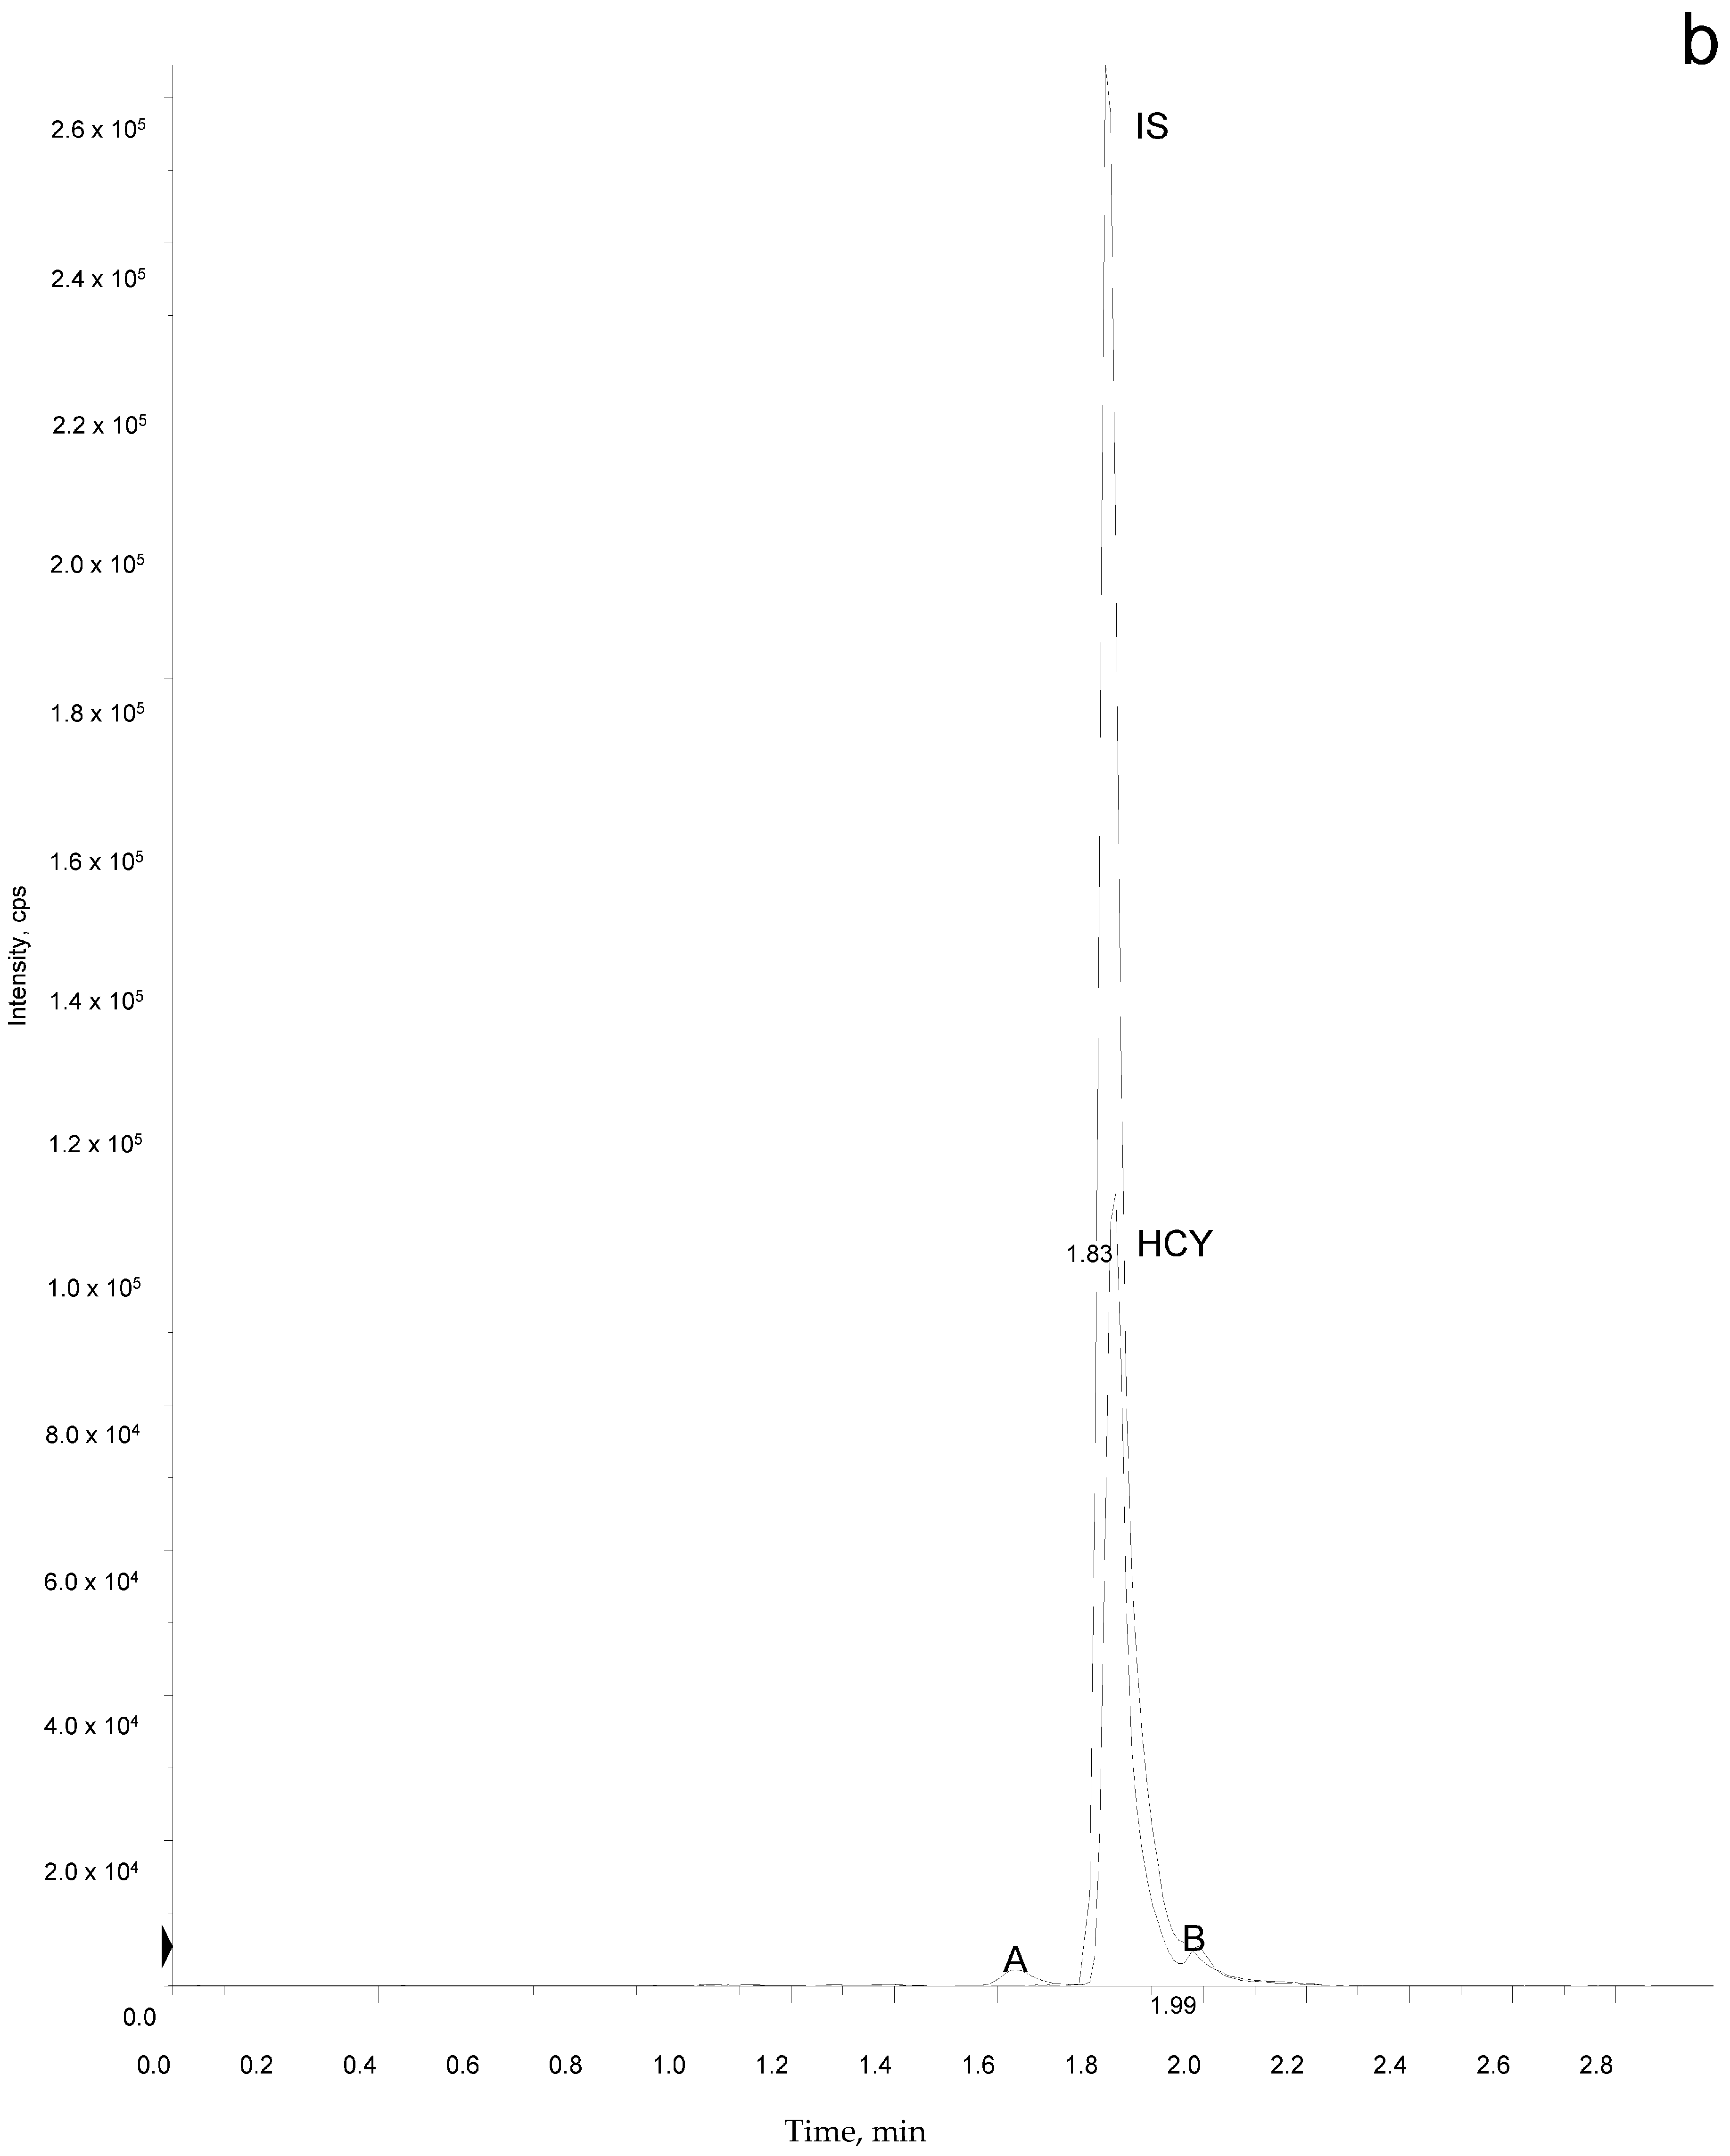
2.5. Sample Analysis

Samples were analyzed by LC-MS/MS on either an AB Sciex 4000 or Waters Quattro Micro. Sample injection volumes of 10 μL were used for all of the samples. Separation was achieved on a Waters Atlantis T3 Column (2.1 × 50 mm, 3.1 μm) at an ambient temperature with a binary gradient profile at a flow rate of 0.4 mL/min. The binary gradient consisted of mobile phase A (water with 0.1% formic acid) and mobile phase B (80% acetonitrile/20% water with 0.1% formic Acid). Prior to injection, the column was equilibrated with 21% mobile phase B. After injection, a linear gradient was initiated with 21% mobile phase B, increasing to 100% over 2 min, then holding 100% mobile phase B for 1 min, followed by a return of 100% mobile phase B to 21% in 0.1 min. The column was equilibrated for 3 min with mobile phase B prior to the next injection. The retention time of HCY was maintained between 1.70 to 1.95 min by adjusting the initial concentration of mobile phase B as necessary. The overall runtime between injections was 6.1 min. Two chromatograms exemplifying a normal DBS with a tHCY concentration of 4.4 µmol/L and an abnormal DBS with a tHCY concentration of 56 µmol/L are shown in Figure 1a,b, respectively.
HCY and stable isotope internal standard were detected by Multiple Reaction Monitoring of the following transitions: HCY: 192 > 90 and d4-HCY: 196 > 94. The analytes were quantified by first calculating the endogenous HCY in the “0” calibrator and readjusting the calibrator concentrations. Then, the concentrations of the QC materials and samples were calculated from the adjusted calibration curve.

3. Results

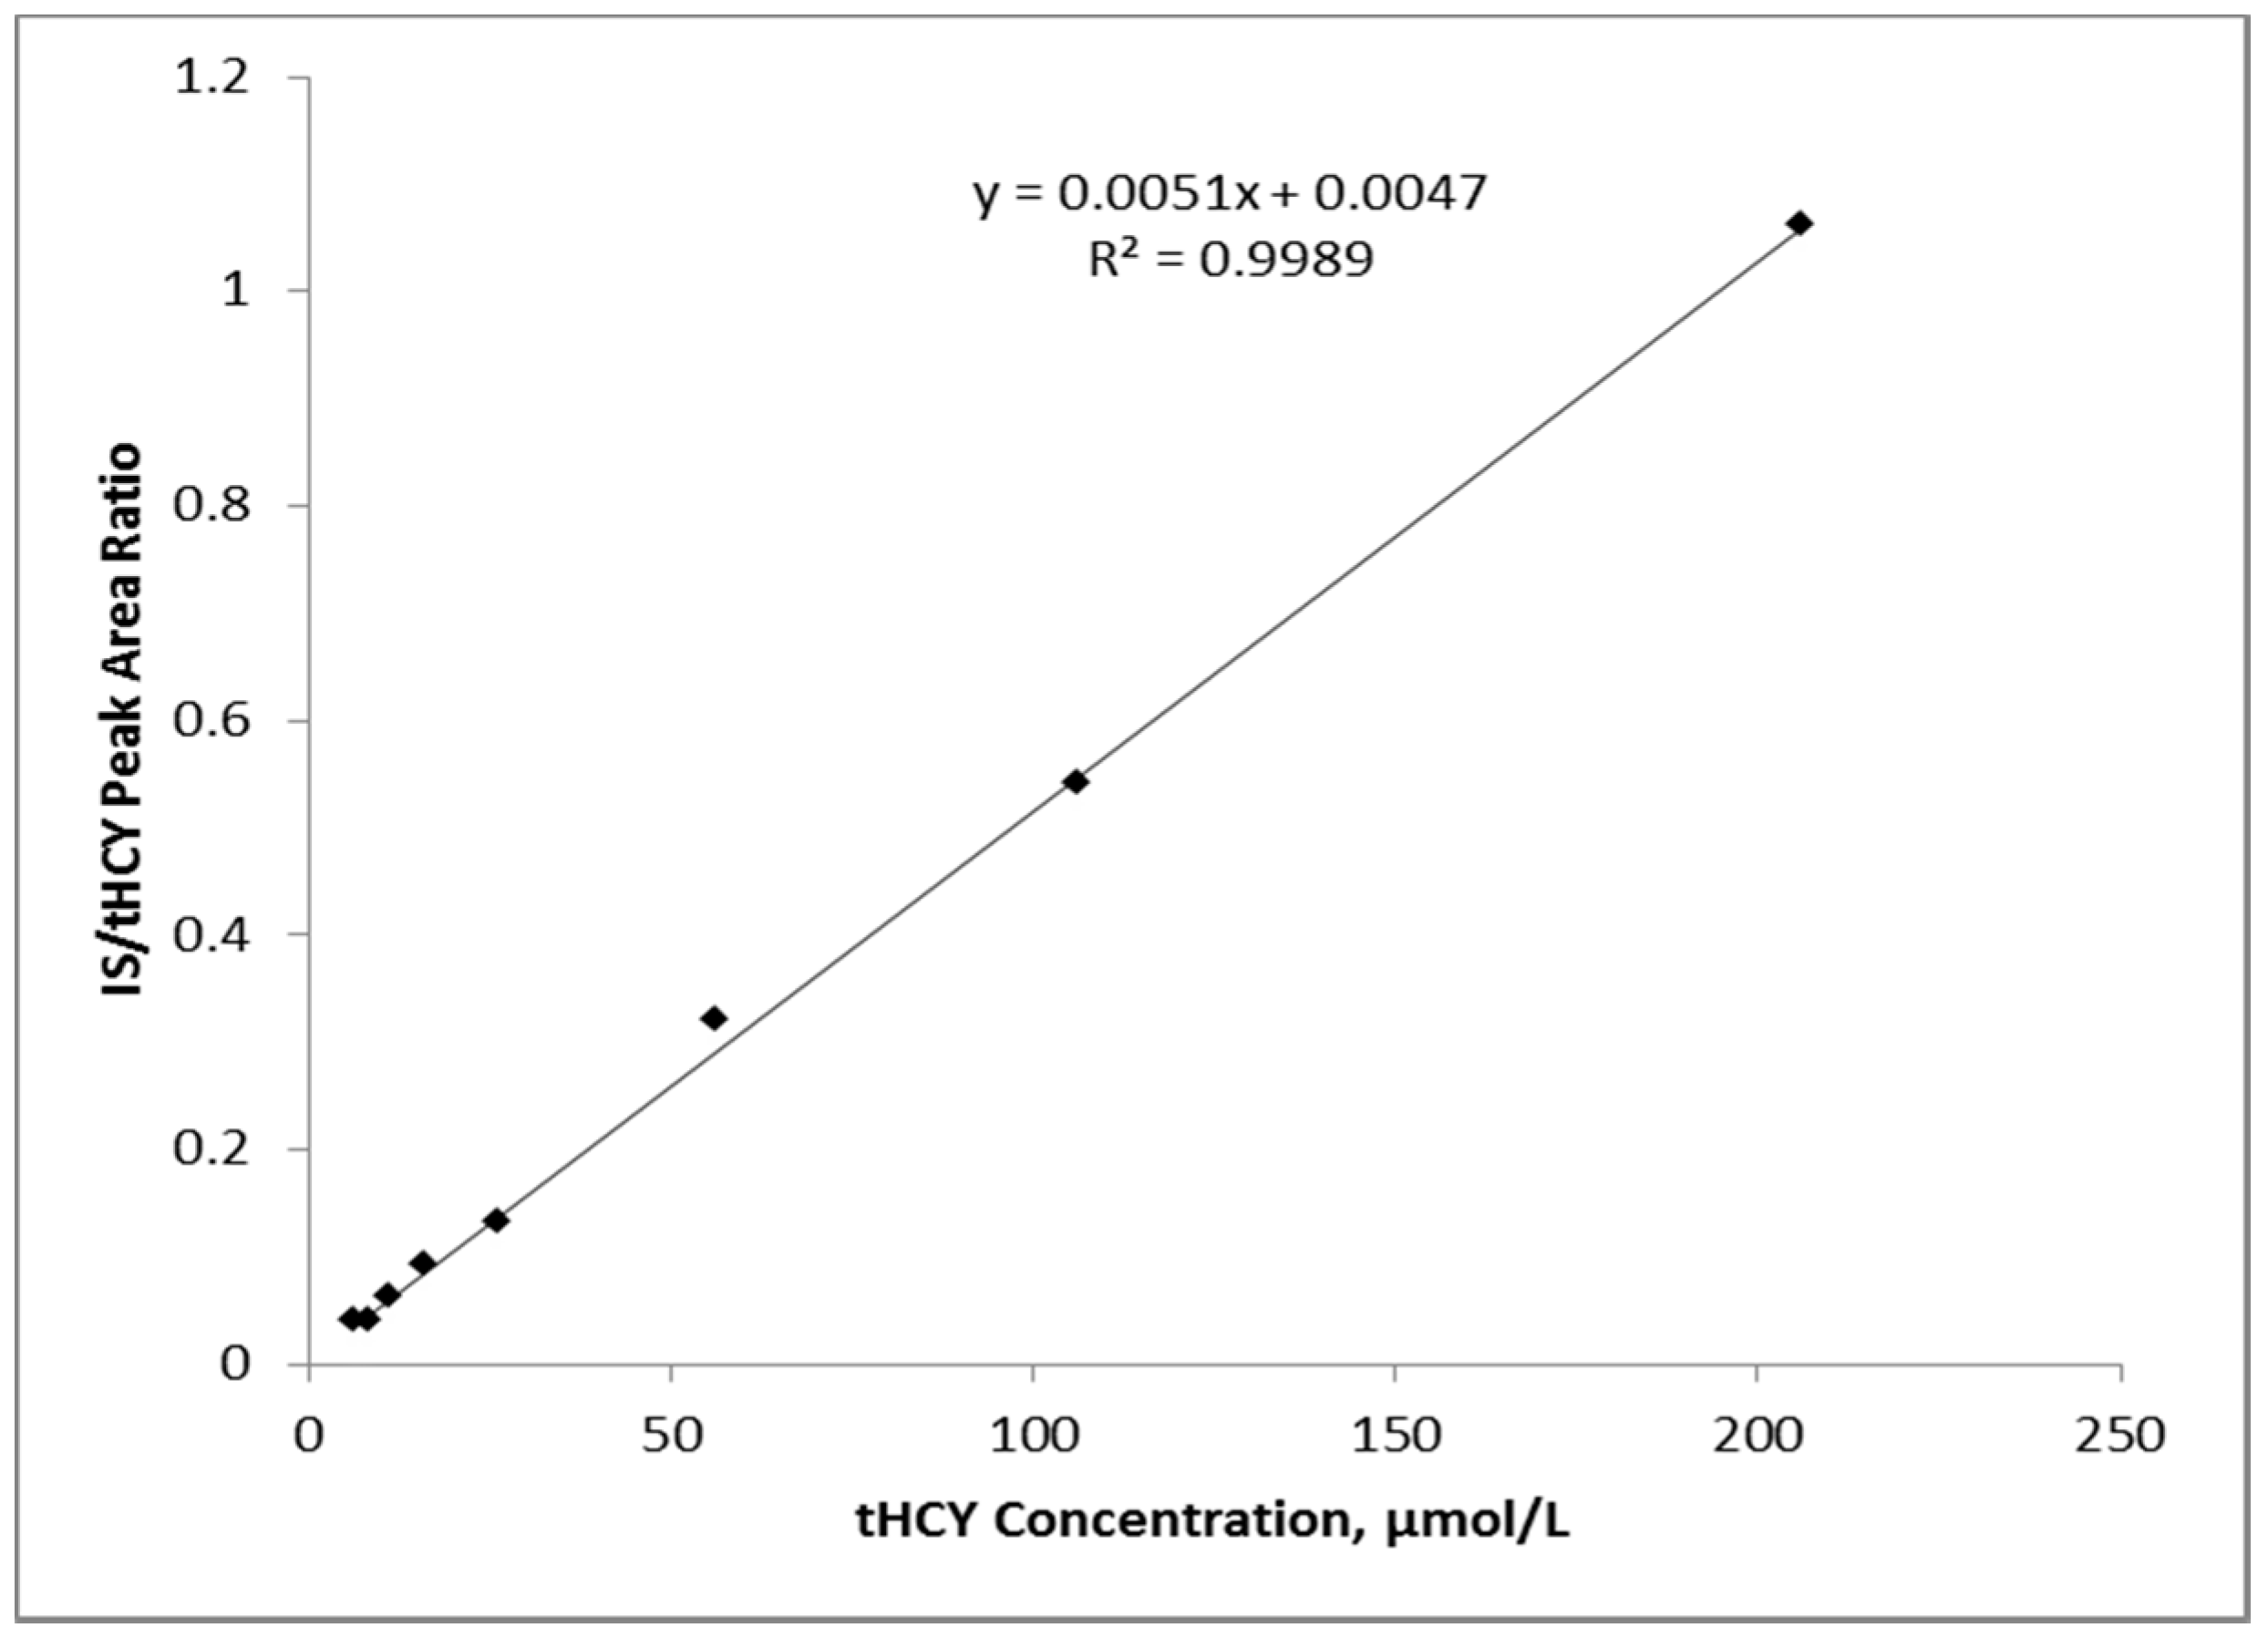
3.1. Linearity and Imprecision

The imprecision of the tHCY assay was determined on both an AB Sciex 4000 and a Quattro Micro LC-MS/MS. A total of 22 replicates were measured either over two days for intra-assay, or over 11 days for inter-assay impression. The results are summarized in Table 1. Both of the instruments produced reproducible results at normal (10 µmol/L) and abnormal (45 µmol/L) concentrations with coefficient of variation (CV)’s less than 8%.
Figure 2 is a typical calibration plot showing a linear response from 6 to 206 µmol/L with an intercept less than 0.01 µmol/L.

3.2. Sensitivity and Recovery
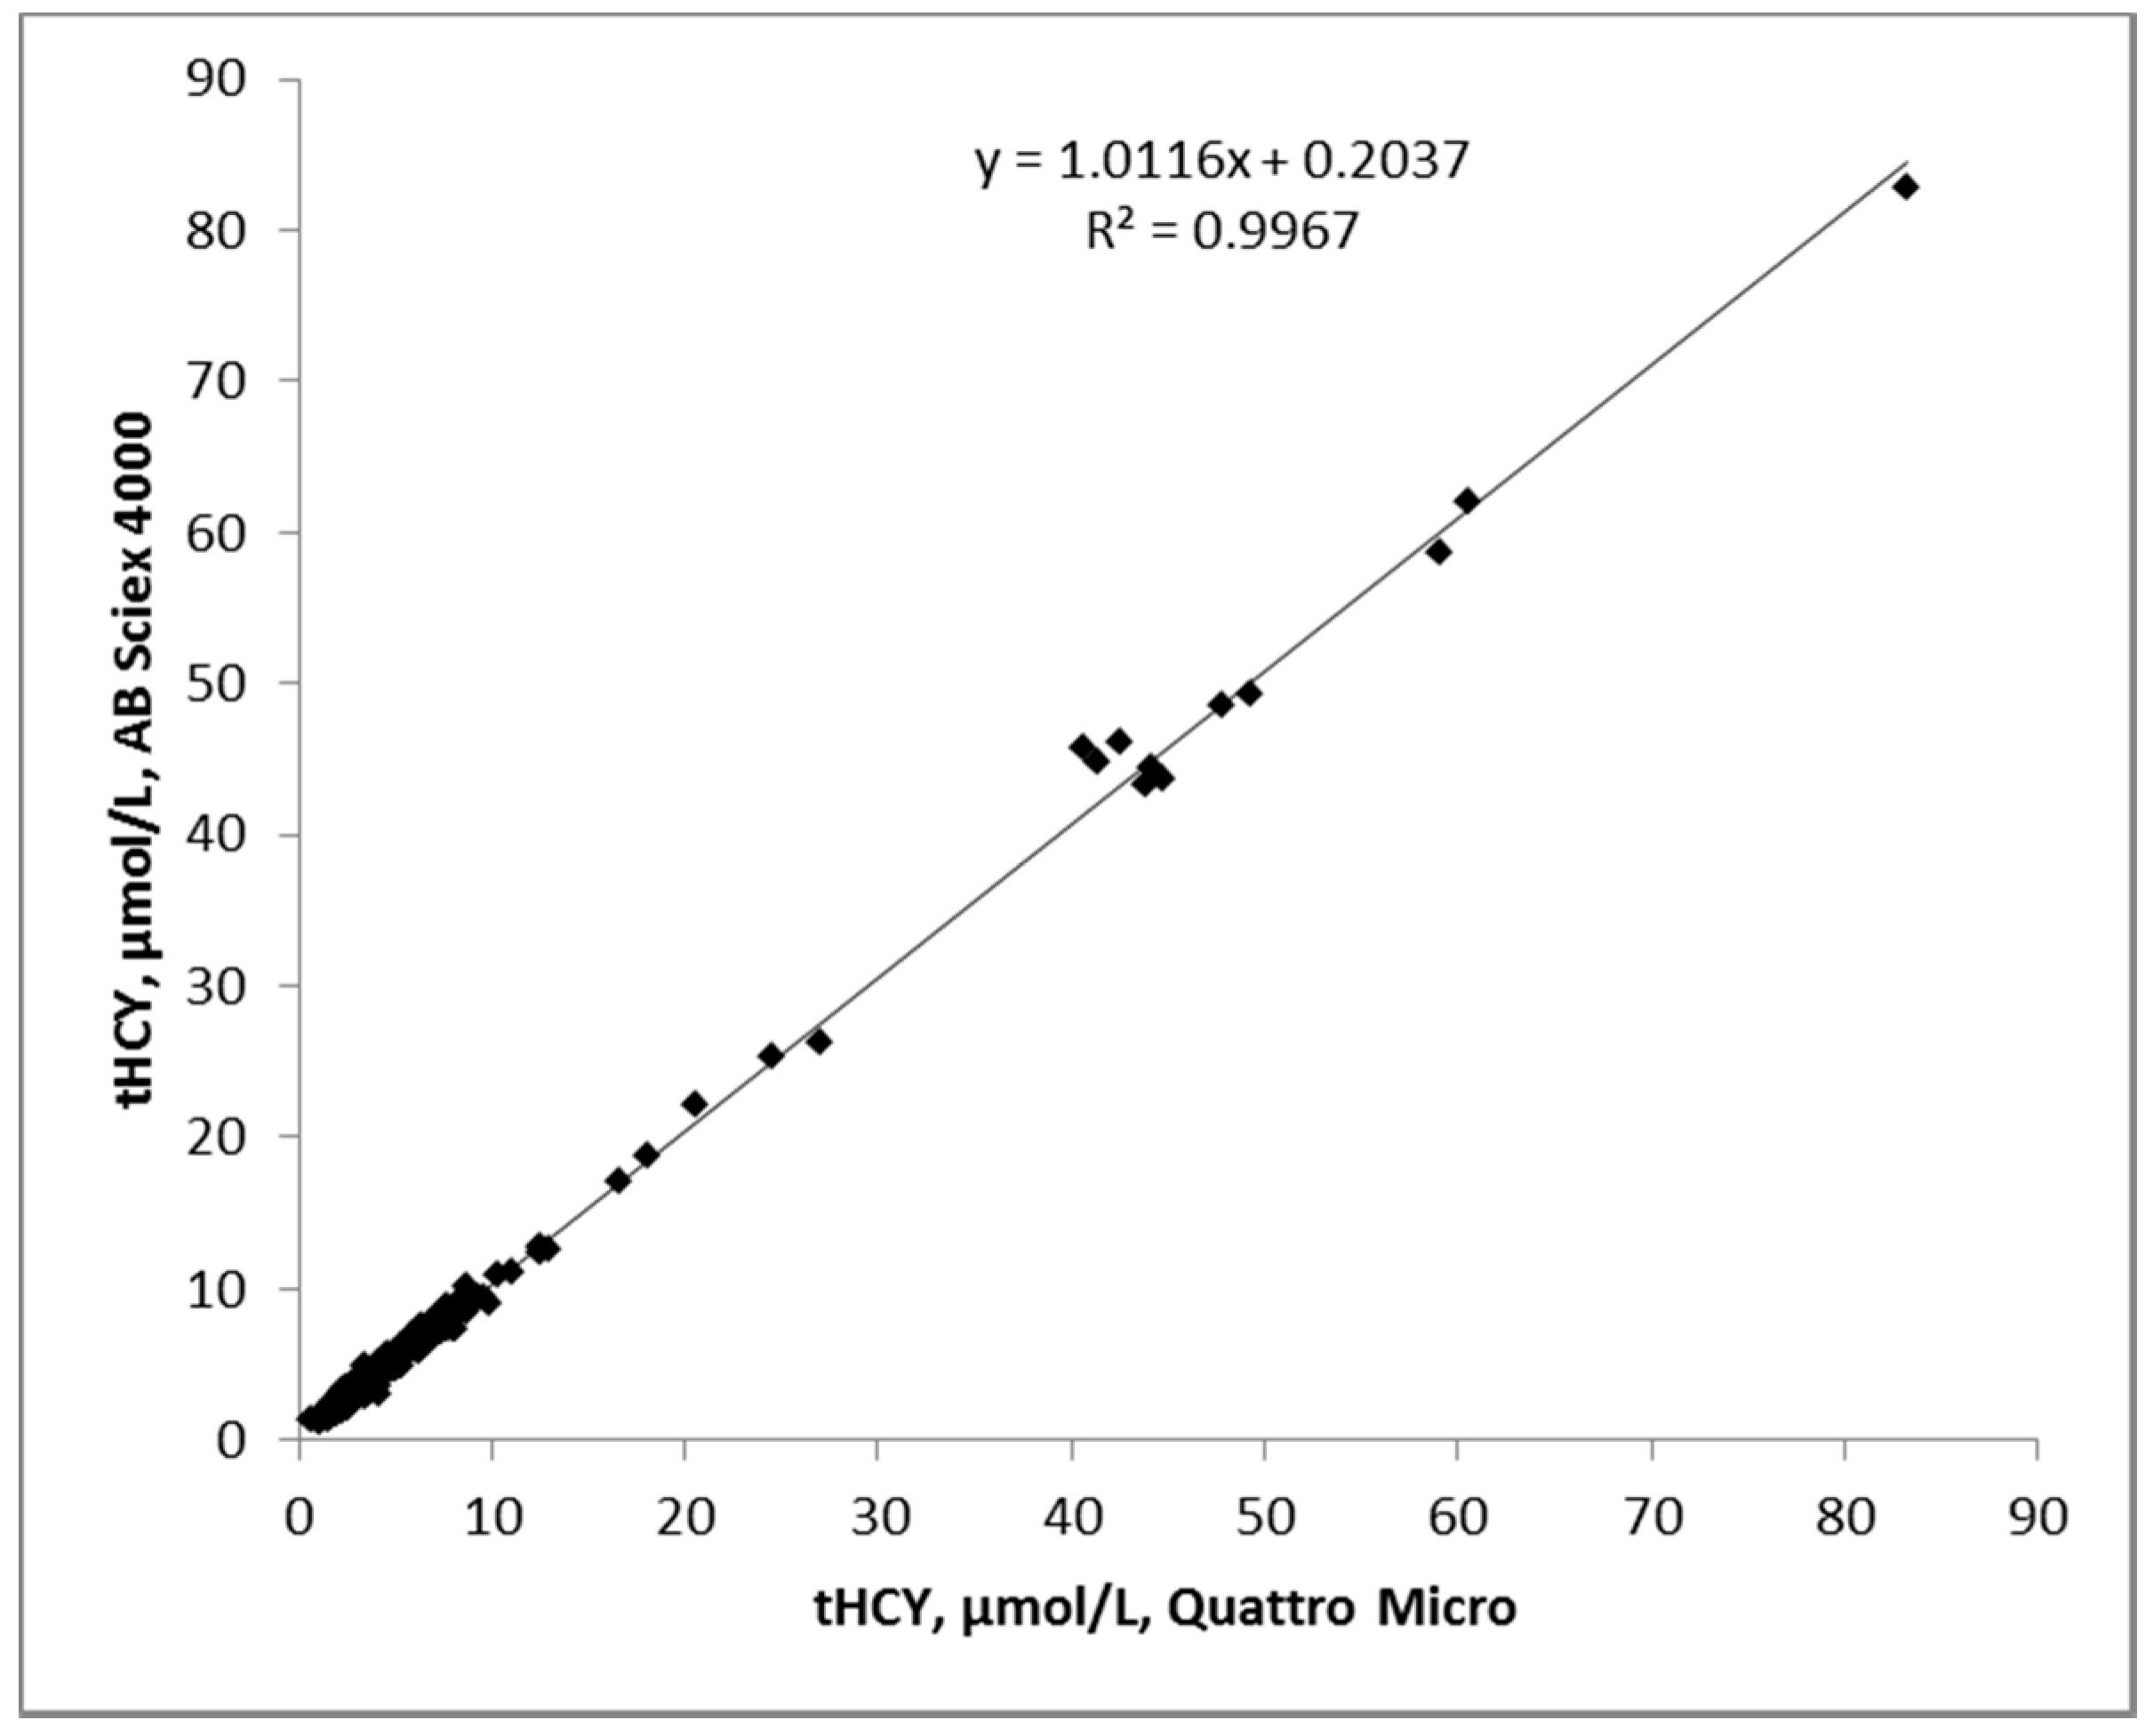
Sensitivity was estimated by measurement of an extracted and derivatized 5 µmol/L calibrator. The calibrator was serially diluted with water and analysed. The limit of detection was estimated when the CV of 10 replicate measurements exceeded 20%. For the Quattro Micro, the limit of detection was 1.3 µmol/L. The limit of detection for the AB Sciex 4000 was < 0.5 µmol/L, which was associated with a CV of 10.9%. Further dilutions were not measured for the AB Sciex 4000, since a lower limit of detection is not clinically relevant.
The recovery of additions of tHCY at concentrations of 10 and 100 µmol/L were calculated from isotope dilution measurements. The recovery of triplicate samples was 90% and 89%, respectively, for the additions of 10 and 100 µmol/L tHCY.

3.3. Accuracy

Figure 2 is a typical calibration plot that was obtained from analysis of DBS samples prepared from whole blood samples, with the addition of known amounts of homocystine.
The calibration plot was used in calculation of tHCY in DBS of controls and patient samples. As shown in Figure 3, the tHCY results obtained for the same samples run on the AB Sciex 4000 and Quattro Micro showed good correlation.
Further comparison of tHCY results from DBS analyzed on the Quattro Micro and the same DBS samples analyzed by a previously published method [18] showed good correlation (Figure 4).

3.4. Normal Population and Cutoff Level

The tHCY concentration of a normal population was determined by the analysis of 1204 DBS samples from patients with no evidence of HCU. The normal population was distributed with a 50th percentile of 4.4 µmol/L and a 99th percentile of 11.5 µmol/L. Measurement of the tHCY concentration in nine patients with HCU with confirmed CBS deficiency indicated elevated levels, distributed with a 1st percentile of 22.9 µmol/L and a 50th percentile of 41.9 µmol/L. In addition, measurement of the tHCY concentration in 15 patients with serum vitamin B12 levels < 133 pmol/L indicated mildly increased levels of tHCY with a 1st percentile of 14.8 µmol/L and a 50th percentile of 18.3 µmol/L. Table 2 compares the percentiles for the distribution of tHCY levels in the populations defined above. Based on the population measurements, a tHCY cutoff of 14.0 µmol/L was selected to optimize the detection of abnormal conditions and minimize false positive results.
Figure 5 illustrates the separation of the normal and affected populations with relation to the cutoff of 14.0 µmol/L.

4. Discussion

Population screening in the newborn period aims to detect specific disorders that benefit from early intervention, and which are otherwise unlikely to be detected until serious and irreversible symptoms develop. In order to be included in a NBS panel, an effective treatment for the disorder should be available and the process should be cost effective.
Over the past two decades, MS/MS analysis of DBS for the detection of genetic disorders in newborns was established in many academic health centers and public health laboratories worldwide. The technique is capable of rapidly detecting over 60 disorders within 2 min of analytical time. In addition, several laboratories have implemented a 2nd tier or reflex analysis on the same DBS by LC-MS/MS to measure more disease-specific biomarkers when the primary screening marker’s disease range overlaps with the normal range [18,19,20,21]. The Metabolic Laboratory at HMC serves as the national NBS laboratory for the State of Qatar, and aims to further improve NBS procedures by providing more rapid and accurate diagnostic testing procedures to benefit newborns in Qatar, as well as other NBS programs worldwide. The prevalence of HCU in Qatar is high when compared to other regions, underscoring the need to conduct a high quality NBS program that includes a high sensitivity for HCU. A number of NBS laboratories have successfully implemented tHCY screening on DBS, either as a primary screening test or as part of a two-tier screening approach. The 2nd tier tests are employed to improve diagnostic accuracy and to lower false positive rates. Such an approach has been applied by our laboratory where tHCY, methyl malonic acid (MMA) and methyl citric acid (MCA) are measured when the primary screen reveals abnormal concentrations of propionylcarnitine (C3) and/or methionine [18].
NBS programs that include HCU in their disease panel use methionine or tHCY as the primary marker of HCU [5,16,22,23]. The specificity of methionine is poor because it can be increased in other disorders of methionine metabolism, secondary to liver disease, or, most frequently, when neonates receive parenteral nutrition [24]. This overlap of methionine ranges in unaffected newborns and HCY patients is supported by the fact that programs miss 20–50% of pyridoxine non-responsive cases with different methionine cut-off values [5,25]. Peterschmitt et al., observed double the detection rate by lowering the methionine cut-off from 138 to 67 µmol/L, and cut-off values as low as 40 µmol/L have been proposed to improve sensitivity [26]. However, changing cut-offs to increase the diagnostic sensitivity will reduce specificity, resulting in an increased need of unnecessary follow-up [7,27]. Okun et al., recently proposed using methionine and methionine/phenylalanine ratio as a primary screens with tHCY as a secondary screen [7]. In the confirmed positive cases that are presented in this paper, two of the nine cases would have been missed if a 90th percentile of the normal population was applied as a cutoff for the methionine or the methionine/phenylalanine ratio. For the Qatar population that is affected by HCU, the measurement of tHCY as described in the paper, resulted in a 0.26% False Positive Rate and a 0% False Negative Rate. The high prevalence of HCU in Qatar and the poor sensitivity of methionine make tHCY a necessary component of the NBS program. Other regions with significantly lower prevalence or where other mutations that cause higher elevation of methionine are prevalent, may find other screening scenarios more cost effective. The rapid screening method for tHCY in neonate DBS presented in this report is suitable for population screening for HCU in Qatar with 28,000 to 30,000 screens per year. The method has sufficient precision and accuracy with a linear analytical range that covers typical normal and abnormal concentrations. The overall cycle time between injections is 6.1 min, allowing for over 200 DBS to be screened per day using one LC-MS/MS system. The overall cycle time includes timing for preinjection equilibration, run time, and flushing for each injection. The retention time was adjusted to 1.8 min to allow for significant chromatographic separation of HCY from interfering peaks A and B with retention times of 1.6 and 2.0 min, respectively, while keeping the cycle time as short as possible (Figure 1a,b). We have observed that interfering peaks A and B merge with tHCY as the retention time is shortened. Furthermore, the intensity of peaks A and B were variable from one patient sample to another. Methods with shorter retention times may produce less specific and inaccurate results that are caused by merging of neighboring interfering peaks with tHCY. Rapid LC-MS/MS methods using silica based and reversed phase columns for separation and quantitation of tHCY, as the free acid have been previously reported [5,7,28,29]. Our experience with chromatography of tHCY as both the free acid and as the butyl ester showed a significant improvement in peak symmetry and reproducibility of retention time and peak area for the latter: the butylation reduces the polarity and increases the interaction of the HCY with the column matrix. For example, the coefficient of variation for the retention time of HCY over 20 days to day consecutive batches was 2.07%. The intra-assay imprecision is reported in Table 1 for normal and abnormal ranges.
The cutoff value of 14.0 µmol/L was selected after a review of the population distributions of tHCY levels in the normal population, and those affected with HCU. Further biochemical investigation of suspected HCU patients with a tHCY of 14.0 µmol/L or greater led to the identification of 15 patients with a vitamin B12 deficiency. The tHCY levels that were associated with vitamin B12 deficiency are illustrated in Figure 5.
Vitamin B12 deficiency causes a decrease in methionine synthase and L-methylmalonyl-CoA mutase activity, resulting in the accumulation tHCY, MMA, and C3. These biochemical correlations have been clearly demonstrated in neonates [30,31]. However, whilst these studies relied on measurements of metabolites in serum, incidental evidence from this method suggest that mild elevations of tHCY measured in DBS may detect vitamin B12 deficiency, extending the clinical utility of this method further. Although tHCY has been proposed as a potential primary or secondary marker for vitamin B12 deficiency in neonates, the specificity of tHCY on DBS for detection of vitamin B12 deficiency remains to be determined. The distribution of tHCY concentration in the vitamin B12 deficient population and the overlap with the normal population has not been defined. However, since vitamin B12 is not currently measured as part of the routine newborn program in Qatar, this provides a means of detecting at least some cases of vitamin B12 deficiency that may otherwise go undiagnosed. In addition to HCU, elevations of tHCY can also be indicative of other primary inborn errors of metabolism, such as the cobalamin group of disorders, and possibly secondary dietary deficiencies of pyridoxine and folic acid [13,18,32].

Acknowledgments

We would like to acknowledge and thank the staff of the Endocrinology and the Molecular Genetics Sections of the Department of Laboratory Medicine and Pathology of Hamad Medical Corporation for assistance vitamin B12 measurements and confirmation of affected patients.

Author Contributions

Rose Maase, Victor Skrinska and Rola Mitri conceived and designed the experiments; Rose Maase, Noura Younes and Lubna Hassan performed the experiments; Rose Maase and Victor Skrinska analyzed the data and wrote the paper; Coleman Turgeon, Dietrich Matern and Piero Rinaldo provided support in the development, validation and review of this method.

Conflicts of Interest

The authors declare no conflict of interest.

References

  1. Sacharow, S.J.; Picker, J.D.; Levy, H.L. Homocystinuria Caused by Cystathionine Beta-Synthase Deficiency. In GeneReviews®; University of Washington: Seattle, WA, USA, 1993–2017. Available online: https://www.ncbi.nlm.nih.gov/books/NBK1524/ (accessed on 10 January 2017).
  2. Gaustadnes, M.; Ingerslev, J.; Rutiger, N. Prevalence of congenital homocystinuria in Denmark. N. Engl. J. Med. 1999, 340, 1513. [Google Scholar] [CrossRef] [PubMed]
  3. Refsum, H.; Fredriksen, A.; Meyer, K.; Ueland, P.M.; Kase, B.F. Birth prevalence of homocystinuria. J. Pediatr. 2004, 144, 830–832. [Google Scholar] [PubMed]
  4. Janosik, M.; Sokolova, J.; Janosikova, B.; Krijt, J.; Klatovska, V.; Kozich, V. Birth prevalence of homocystinuria in Central Europe: Frequency and patogenicity of mutation c.1105 > T (p.R369C) in the cystathionine beta-synthase gene. J. Pediatr. 2009, 154, 431–437. [Google Scholar] [CrossRef] [PubMed]
  5. Gan-Schreier, H.; Kebbewar, M.; Fang-Hoffmann, J.; Wilrich, J.; Abdoh, G.; Ben-Omran, T.; Shahbek, N.; Bener, A.; Al Rifai, H.; Al Khal, A.L.; et al. Newborn population screening for classic homocystinuria by determination of total homocysteine from Guthrie cards. J. Pediatr. 2010, 156, 427–432. [Google Scholar] [CrossRef] [PubMed]
  6. El-Said, M.F.; Badii, R.; Bessisso, M.S.; Shahbek, N.; El-Ali, M.G.; El-Marikhie, M.; El-Zyoid, M.; Salem, M.S.Z.; Bener, A.; Hoffmann, G.F.; et al. A common mutation in the CBS gene explains a high incidence of homocystinuria in the Qatari population. Hum. Mutat. 2006, 27, 719. [Google Scholar] [CrossRef] [PubMed]
  7. Okum, J.G.; Gan-Schreier, H.; Ben-Omran, T.; Schmidt, K.V.; Fang-Hoffmann, J.; Gamer, G.; Abdoh, G.; Shahbeck, N.; Al Rifai, H.; Al Khal, A.L.; et al. Newborn Screening for Vitamin B6 Non-responsive Clinical Homocytinuria: Systematical Evaluation of a Two-Tier Strategy. JIMD Rep. 2017, 32, 87–94. [Google Scholar]
  8. Skovby, F.; Gaustadnes, M.; Mudd, S.H. A revisit to the natural history of homocystinuria due to cyctathionine beta-synthase deficiency. Mol. Genet. Metab. 2010, 99, 1–3. [Google Scholar] [CrossRef] [PubMed]
  9. The Human Gene mutaton Database. Available online: http://www.hgmd.cf.ac.uk/ac/gene.php?gene=CBS (accessed on 22 October 2017).
  10. Adam, S.; Almeida, S.F.; Weber, E.C. Dietary practices in pyridoxine non- responsive homocystinuria: A European survey. Mol. Genet. Metab. 2013, 110, 454–459. [Google Scholar] [CrossRef] [PubMed]
  11. Walter, J.H.; Jahnke, N.; Remmington, T. Newborn screening for homocystinuria. Cochrane Database Syst. Rev. 2013. [Google Scholar] [CrossRef]
  12. Yap, S.; Boers, G.H.; Wilcken, B.; Wilcken, D.E.L.; Brenton, D.P.; Lee, P.J.; Walter, J.H.; Howard, P.M.; Naughten, E.R. Vascular outcome in patients with homocystinuria due to cystathionine beta-synthase deficiency treated chronically: A multicentre observational study. Arter. Thromb. Vasc. Biol. 2001, 21, 2080–2085. [Google Scholar] [CrossRef]
  13. Huemer, M.; Kozich, V.; Rinaldo, P.; Baumgartner, R.; Merinero, B.; Pasquini, E.; Ribes, A.; Blom, H. Newborn screening for homocystinurias and methylation disorders: Systematic review and proposed guidelines. J. Inherit. Metab. Dis. 2015, 38, 1007–1019. [Google Scholar] [CrossRef] [PubMed]
  14. Stabler, S.P.; Korson, M.; Jethva, R.; Allen, R.H.; Kraus, J.P.; Spector, E.B.; Wagner, C.; Mudd, H.S. Metabolic profiling of total homocysteine and related compounds in hyperhomocysteinemia: Utility and limitations in diagnosing the cause of puzzling thrombophilia in a family. JIMD Rep. 2013, 11, 149–163. [Google Scholar] [PubMed]
  15. Bartl, J.; Chrastina, P.; Krijt, J.; Hodik, J.; Peskova, K.; Kozich, V. Simultaneous determination of cystathionine, total homocysteine and methionine in dried blood spots by liquid chromatography/tandem mass spectrometry and its utility for the management of patients with homocystinuria. Clin. Chim. Acta 2014, 437, 211–217. [Google Scholar] [CrossRef] [PubMed]
  16. Mudd, S.H. Hypermethioninemias of genetic and non-genetic origin: A review. Am. J. Med. Genet. Part C Semin. Med. Genet. 2011, 157C, 3–32. [Google Scholar] [CrossRef] [PubMed]
  17. Bowron, A.; Barton, A.; Scott, J.; Stansbie, D. Blood spot homocysteine: A feasibility and stability study. Clin. Chem. 2005, 51, 257–258. [Google Scholar] [CrossRef] [PubMed]
  18. Turgeon, C.T.; Magera, M.J.; Cuthbert, C.D.; Loken, P.R.; Gavrilov, D.K.; Tortorelli, S.; Raymond, K.M.; Oglesbee, D.; Rinaldo, P.; Matern, D. Determination of total homocysteine, methylmalonic acid, and 2-methylcitric acid in dried blood spots by tandem mass spectrometry. Clin. Chem. 2010, 56, 1686–1695. [Google Scholar] [CrossRef] [PubMed]
  19. Matern, D.; Tortorelli, S.; Oglesbee, D.; Gavrilov, D.; Rinaldo, P. Reduction of the false positive rate in newborn screening by implementation of MS/MS-based second tier tests: The Mayo Clinic experience (2004–2007). J. Inherit. Metab. Dis. 2007, 30, 585–592. [Google Scholar] [CrossRef] [PubMed]
  20. Oglesbee, D.; Sanders, K.A.; Lacey, J.M.; Magera, M.J.; Casetta, B.; Strauss, K.A.; Tortorelli, S.; Rinaldo, P.; Matern, D. Second tier test for quantification of alloisoleucine and branched-chain amino acids in dried blood spots to improve newborn screening for maple syrup urine disease (MSUD). Clin. Chem. 2008, 54, 542–549. [Google Scholar] [CrossRef] [PubMed]
  21. Janzen, N.; Steuerwald, U.; Sander, S.; Terhardt, M.; Peter, M.; Sander, J. A UPLC-MS/MS analysis of C5-acylcarnitines in dried blood spots. Clin. Chim. Acta 2013, 421, 41–45. [Google Scholar] [CrossRef] [PubMed]
  22. Zschocke, J.; Kebbewar, M.; Gan-Schreier, H.; Fischer, C.; Fang-Hoffmann, J.; Wilrich, J.; Abdoh, G.; Ben-Omran, T.; Shahbek, N.; Linder, M.; et al. Molecular neonatal screening for homocystinuria in the Qatari population. Hum. Mutat. 2009, 30, 1021–1022. [Google Scholar] [CrossRef] [PubMed]
  23. Chace, D.H.; Hillman, S.L.; Millington, D.S.; Kahler, S.G.; Adam, B.W.; Levy, H.L. Rapid diagnosis of homocystinuria and other hypermethioninemias from newborns’ blood spots by tandem mass spectrometry. Clin. Chem. 1996, 42, 349–3522. [Google Scholar] [PubMed]
  24. Ten Hoedt, A.E.; van Kempen, A.A.; Boelen, A.; Duran, M.; Kemper-Proper, E.A.; Oey-Spauwen, M.J.; Wijburg, F.A.; Bosch, A.M. High incidence of hypermethioninaemeia in a single neonatal intensive care unit detected by a newly introduced neonatal screening programme. J. Inherit. Metab. Dis. 2007, 30, 978. [Google Scholar] [CrossRef] [PubMed]
  25. Naughten, E.R.; Yapp, S.; Mayne, P.D. Newborn screening for homocystinuria: Irish and world experience. Eur. J. Pediatr. 1998, 157 (Suppl. S2), S84–S97. [Google Scholar] [CrossRef] [PubMed]
  26. Peterschmitt, M.J.; Simmons, J.R.; Levy, H.L. Reduction of false negative results in screening of newborns for homocystinuria. N. Engl. J. Med. 1999, 341, 1572–1576. [Google Scholar] [CrossRef] [PubMed]
  27. McHugh, D.M.S.; Cameron, C.A.; Abdenur, J.E.; Abdulrahman, M.; Adair, O.; Al Nuaimi, S.A.; Åhlman, H.; Allen, J.J.; Antonozzi, I.; Archer, S.; et al. Clinical validation of cutoff target ranges in newborn screening of metabolic disorders by tandem mass spectrometry: A worldwide collaborative project. Genet. Med. 2011, 13, 230–254. [Google Scholar] [CrossRef] [PubMed]
  28. Alodaib, A.N.; Carpenter, K.; Wley, V.; Wotton, T.; Chistodoulou, J.; Wilcken, B. Homocysteine measurement n dried blood spot for neonatal detection of homocystinurias. JIMD Rep. 2011, 5, 1–6. [Google Scholar] [PubMed]
  29. Gempel, K.; Gerbitz, K.-D.; Casetta, B.; Bauer, M.F. Rapid determination of total homocysteine in blood spots by liquid chromatography-electrospray ionisation-tandem mass spectrometry. Clin. Chem. 2000, 46, 122–123. [Google Scholar] [PubMed]
  30. Minet, J.C.; Bisse, E.; Aebischer, C.P.; Beil, A.; Wieland, H.; Lutschg, J. Assessment of vitamin B12, folate and vitamin B-6 status and relation to sulfur amino acid metabolism in neonates. Am. J. Clin. Nutr. 2000, 72, 751–757. [Google Scholar] [PubMed]
  31. Monsen, A.B.; Ueland, P.M.; Vollset, S.E.; Guttormsen, A.B.; Markestad, T.; Solheim, E.; Refsum, H. Determinants of cobalamin status in newborns. Pediatrics 2001, 108, 624–630. [Google Scholar] [CrossRef]
  32. Wong, D.; Tortorelli, S.; Bishop, L.; Sellars, E.A.; Schimmenti, L.A.; Gallant, N.; Prada, C.E.; Hopkin, R.J.; Leslie, N.D.; Berry, S.A.; et al. Outcomes of four patients with homocysteine remethylation disorders detected by newborn screening. Genet. Med. 2016, 18, 162–167. [Google Scholar] [CrossRef] [PubMed]
Figure 1. (a) A chromatogram of a normal sample with a total homocysteine (tHCY) level of concentration of 4.4 µmol/L; (b) A chromatogram of a sample from a patient with a confirmed diagnosis of HCU with a tHCY concentration of 56 µmol/L. In both (a,b) peaks A and B are unknown substances of varying intensity that are present in most samples. IS is the internal standard, d8-homocystine.
Ijns 03 00032 g001aIjns 03 00032 g001b
Figure 2. Calibration of internal standard/tHCY peak area ratio with tHCY standards. A linear response was obtained with tHCY concentrations from 6 to 206 µmol/L.
Ijns 03 00032 g002
Figure 3. Comparison of tHCY results for dried blood spots (DBS) samples (n = 300) analyzed on Quattro Micro and AB Sciex 4000 instruments.
Ijns 03 00032 g003
Figure 4. Comparison of tHCY results (n = 63) obtained by the Hamad Medical Corporation (HMC) using the tHCY method described in this report and by Mayo Clinic’s Biochemical Genetics Laboratory using a previously published liquid chromatography tandem mass spectrometry (LC-MS/MS) method [18].
Ijns 03 00032 g004
Figure 5. Distribution of tHCY results in a normal population (Normal, n = 1204), classical homocystinuria patients (HCU, n = 9), and patients with vitamin B12 deficiency (B12 def, n = 15). The dashed line represents the cutoff at 14 µmol/L.
Ijns 03 00032 g005
Table 1. Intra-assay and inter-assay imprecision * of tHCY at normal and abnormal concentrations.
ConcentrationAB Sciex API 4000Waters Quattro Micro
Intra-AssayInter-AssayIntra-AssayInter-Assay
10 µmol/L6.67.27.87.9
45 µmol/L7.56.56.96.4
* Coefficient of variation expressed as a% for normal and abnormal concentrations. Intra-assay data were 22 replicates collected over 2 days and inter-assay data were 22 replicates collected over 11 days.
Table 2. The distribution * of tHCY, µmol/L, concentration of a normal population, classical homocystinuria patients, and patients with vitamin B12 deficiency expressed as population percentiles.
Percentile1%10%50%90%99%
Normal1.72.74.47.411.5
HCU22.929.341.985.8146.1
B12 Def14.815.518.323.825
* The normal population is defined by the analysis of DBS samples from patients (n = 1204) with no evidence of HCU. The HCU population is represented by patients (n = 9) with confirmed CBS deficiency. The vitamin B12 deficient population is represented by patients (n = 15) with confirmed serum vitamin B12 levels < 133 pmol/L.

