X-Ray Diffraction under Extreme Conditions at the Advanced Light Source


Lawrence Berkeley Lab, Berkeley, CA 94720, USA
*
Authors to whom correspondence should be addressed.
Quantum Beam Sci. 2018, 2(1), 4; https://doi.org/10.3390/qubs2010004
Submission received: 2 November 2017
/
Revised: 20 December 2017
/
Accepted: 15 January 2018
/
Published: 23 January 2018
(This article belongs to the Special Issue Selected Reviews in Quantum Beam Science)
Abstract
:The more than a century-old technique of X-ray diffraction in either angle or energy dispersive mode has been used to probe materials’ microstructure in a number of ways, including phase identification, stress measurements, structure solutions, and the determination of physical properties such as compressibility and phase transition boundaries. The study of high-pressure and high-temperature materials has strongly benefitted from this technique when combined with the high brilliance source provided by third generation synchrotron facilities, such as the Advanced Light Source (ALS) (Berkeley, CA, USA). Here we present a brief review of recent work at this facility in the field of X-ray diffraction under extreme conditions, including an overview of diamond anvil cells, X-ray diffraction, and a summary of three beamline capabilities conducting X-ray diffraction high-pressure research in the diamond anvil cell.
1. Introduction
X-ray diffraction experiments have been a mainstay of solid-state materials science, geoscience, and physics, for over a century since the invention of the technique. It is a technique whose value lies in the fact that the wavelength of X-rays is on the atomic size scale, which allows X-rays to be good probes for crystalline materials. Diffraction data thus provides information about atomic composition and arrangement. Importantly, it can be a non-destructive technique that can be performed in situ under various environmental or physical conditions, allowing real-time observation of changes in solid, crystalline systems. When combined with third-generation synchrotron facilities such as the Advanced Light Source (ALS) (Berkeley, CA, USA) several notable improvements have been achieved. Mainly, synchrotron sources provide both small beams (on the tens of microns to submicron order) and high flux. This in turn allows for experiments to be performed on very small samples, on poorly diffracting samples, or on samples that are encapsulated in an absorbing medium. All three of these cases apply when performing X-ray diffraction under extreme conditions, which usually refers to high pressure and high temperature conditions, for instance those that simulate those found at the center of the Earth and other planets in an effort to understand planetary physics. Today, high-pressure research encompasses a wide variety of topics, not all related to earth science. For instance, high pressure is also often used to synthetize new materials with unique properties such as ultra-hard materials. The tool of choice for obtaining static high pressure (1–300 GPa) is the diamond anvil cell (DAC). High temperature can be obtained either by resistive heating up to a temperature of ~1000 °C or by laser heating up to a temperature of ~6000 °C. At the ALS, there exist three beamlines where high-pressure experiments can be performed: the dedicated beamline 12.2.2, the chemical crystallography beamline 11.3.1 (soon to be 12.2.1), and the microdiffraction beamline 12.3.2. Here we will discuss beamline capabilities and the types of experiments performed in recent years at the ALS employing joint synchrotron X-ray sources and DACs. We hope that this review will serve as an introduction to high-pressure and diffraction research performed at the ALS.
2. Synchrotron Facilities
There are many advantages to performing high-pressure experiments at synchrotron facilities rather than on a traditional laboratory source. Synchrotron X-rays tend to be highly focused, with spot sizes only several microns wide. The brightness and flux are several orders of magnitude higher than a laboratory source, which allows for faster data collection as more photons are able to diffract. Furthermore, synchrotrons also provide a continuous spectrum of wavelengths going from the infrared to the hard X-ray regime. The resulting wavelength tunability allows the execution of experiments not usually possible at lab sources, such as X-ray spectroscopy. Many beamlines, including at the ALS, have tunable monochromators, which enables the selection of different wavelengths. Tunability can also allow the user to access different 2θ ranges, thus enabling the collection of different portions of the diffracted beam. Additionally, the synchrotron beam is inherently pulsed, and depending on the time structure, time-resolved experiments such as pump-probe experiments where the source of excitation can be synchronized with the synchrotron storage ring time structure, allowing measurements in the femtosecond range, can be performed.
A summary of synchrotrons around the world where static high-pressure techniques are used is presented in Table A1 [1,2,3,4,5,6,7,8,9,10,11]. For high-pressure work done at the ALS, a superconducting bending magnet is used to generate hard X-rays, with between 5–40 keV accessible energy range (depending on the beamline). The X-rays are harvested by end stations, referred to as beamlines, positioned tangentially to the ring. Each beamline has its own optics and instrumental setup, which allows different experiments to be performed. High-pressure beamline capabilities are discussed in further detail below.
3. Beamline Design and Capabilities at the Advanced Light Source
The ALS has three beamlines capable of performing high-pressure experiments in the DAC. These have different setups and capabilities, and thus their applications vary immensely. High-pressure experiments require hard X-rays in order to provide enough penetration through either the diamond anvils or the gasket material and to account for the limited angular range available to collect the diffraction patterns (see Appendix B for more details about DAC setup). All high-pressure work at the ALS is or will be performed in ALS sector 12, which has as its source a 6T superconducting bending magnet inserted into the lattice of the 1.9 GeV ALS storage ring at sector 12. This provides inboard and outboard pairs of tangent points with field strengths of 4.37 T and 5.29 T, providing a critical energy of 10.5 keV and 12.7 keV respectively [12,13,14,15,16]. However, the remaining optics and end-station design vary from beamline to beamline. Here, we will describe their layouts and specific applications.
3.1. Beamline 12.2.2
Beamline 12.2.2 was designed specifically for high-pressure DAC experimentation, and was the first hard X-ray beamline with this capability at the ALS. Since its inception in 2004, it has undergone several upgrades, expanding the experimental capability of the station. A detailed description of the beamline front end optics can be found in Kunz et al. [12].
3.1.1. Instrumentation
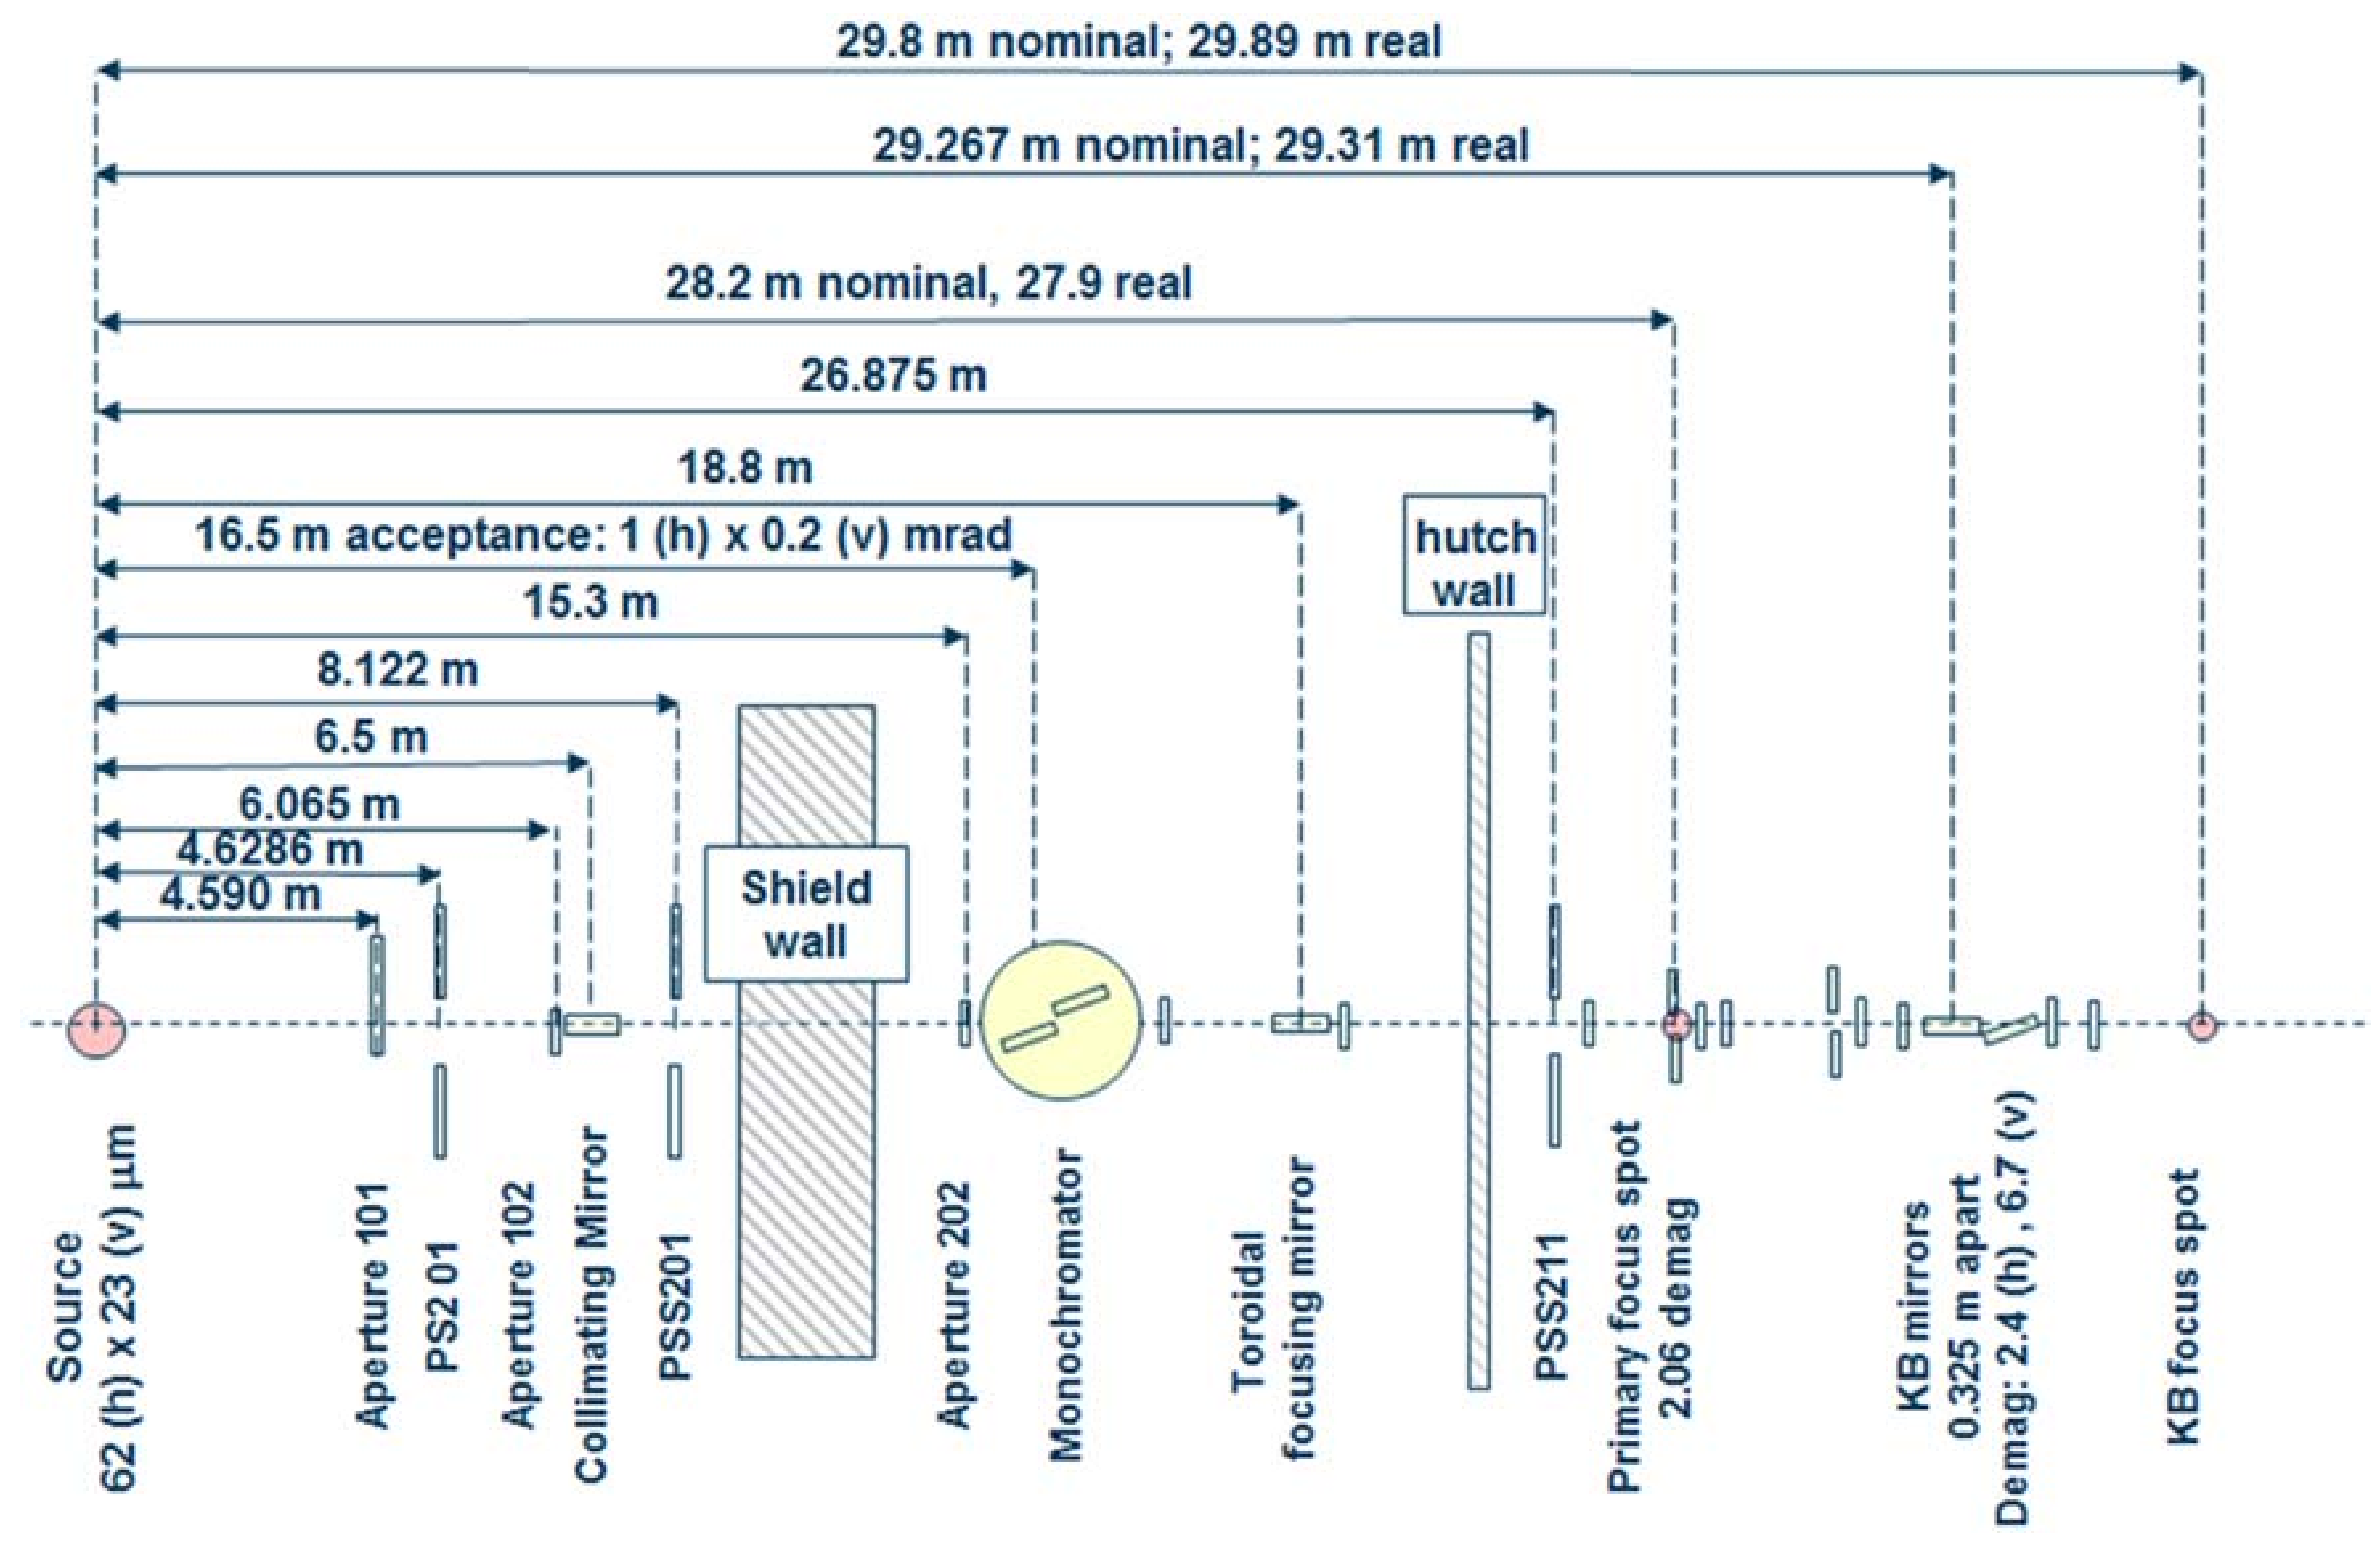
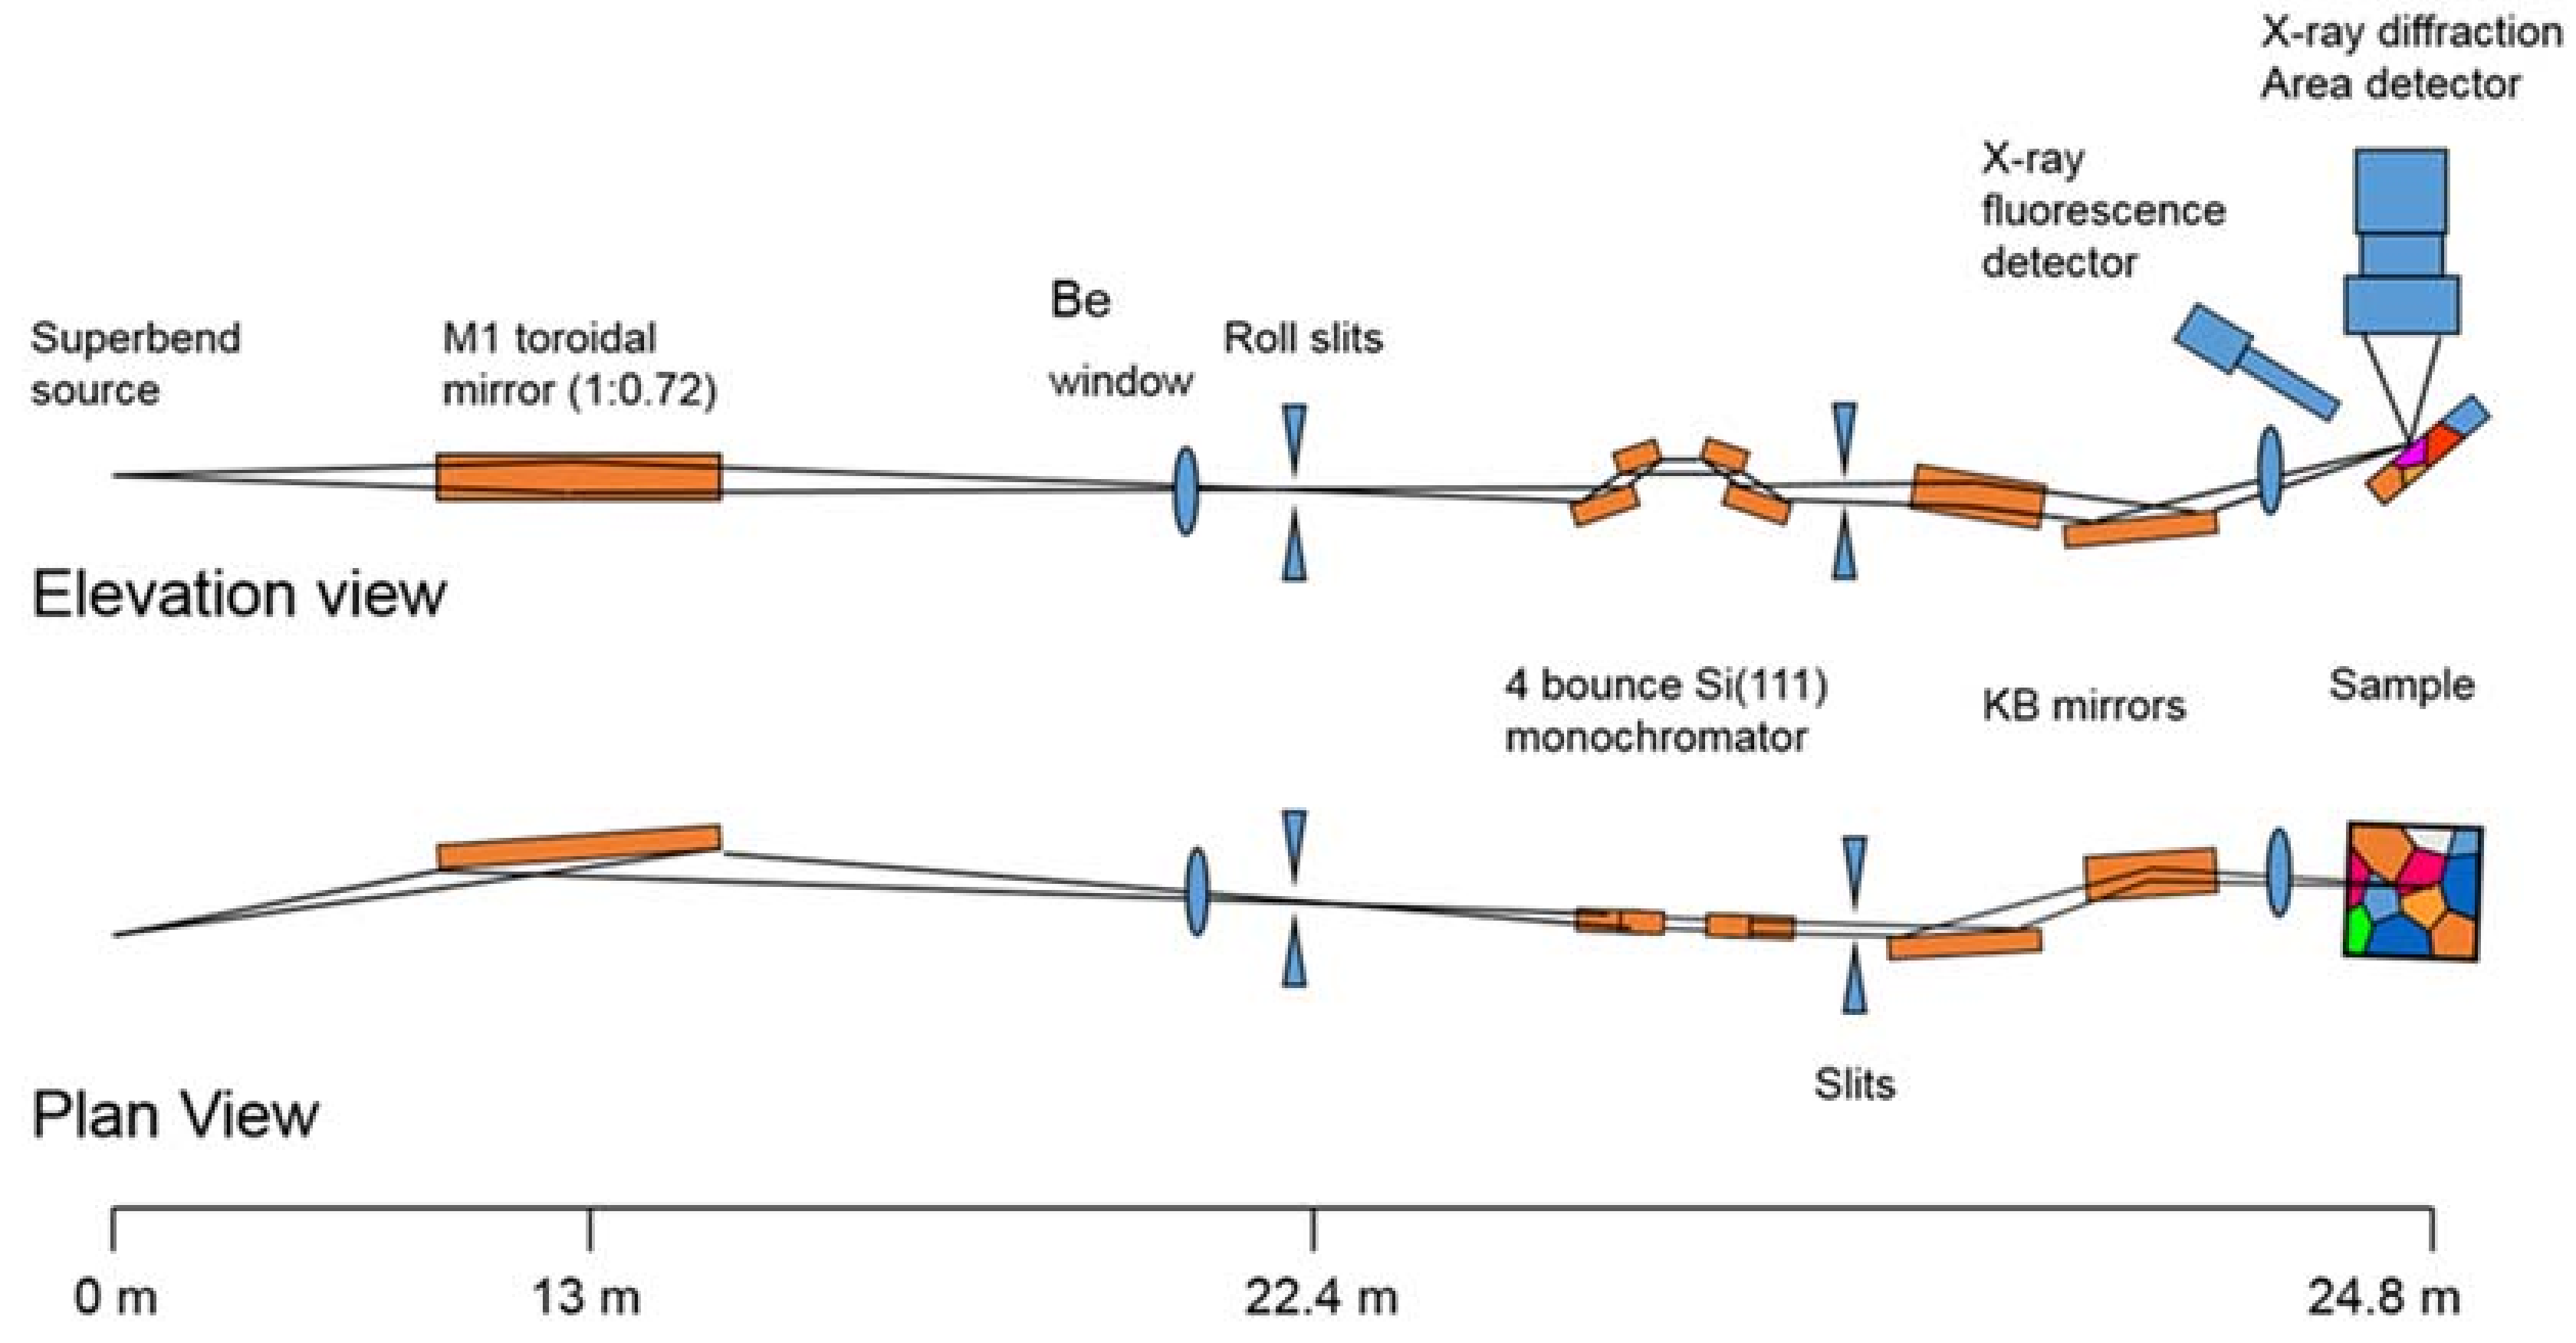
Beamline 12.2.2 derives X-rays from the 5.29 T outboard tangent point of the source magnet. The critical energy of the source is 12.7 keV, giving it a usable energy spectrum between ~8 and 35 keV. A vertically collimating mirror followed by a two-crystal Si(111) monochromator (Kohzu Precision Co., Ltd, Kawasaki Kanagawa, Japan) and a toroidal focusing mirror form the primary optics. The primary focal spot is situated within the experimental hutch at endstation 1, which hosts the single crystal program. For operation on endstation 2, the primary focus spot is re-imaged with a set of Kirkpatrick-Baez (KB) mirrors onto the sample position at endstation 2, which is in general used for powder diffraction (Figure 1). The focal spot on endstation 2 can be adjusted between 10 and 30 μm.
The original design of the beamline, installed and commissioned in 2003/2004, focused on in situ high-pressure/high-temperature powder diffraction experiments on samples within a laser-heated diamond anvil cell (LHDAC). This experiment was installed at the secondary focus spot on endstation 2. Source characteristics and user demand prompted the development of a dedicated high-pressure single crystal diffraction program at the primary focus spot (endstation 1). This is being installed and commissioned in 2017/2018 after successful high-pressure single crystal experiments on endstation 2.
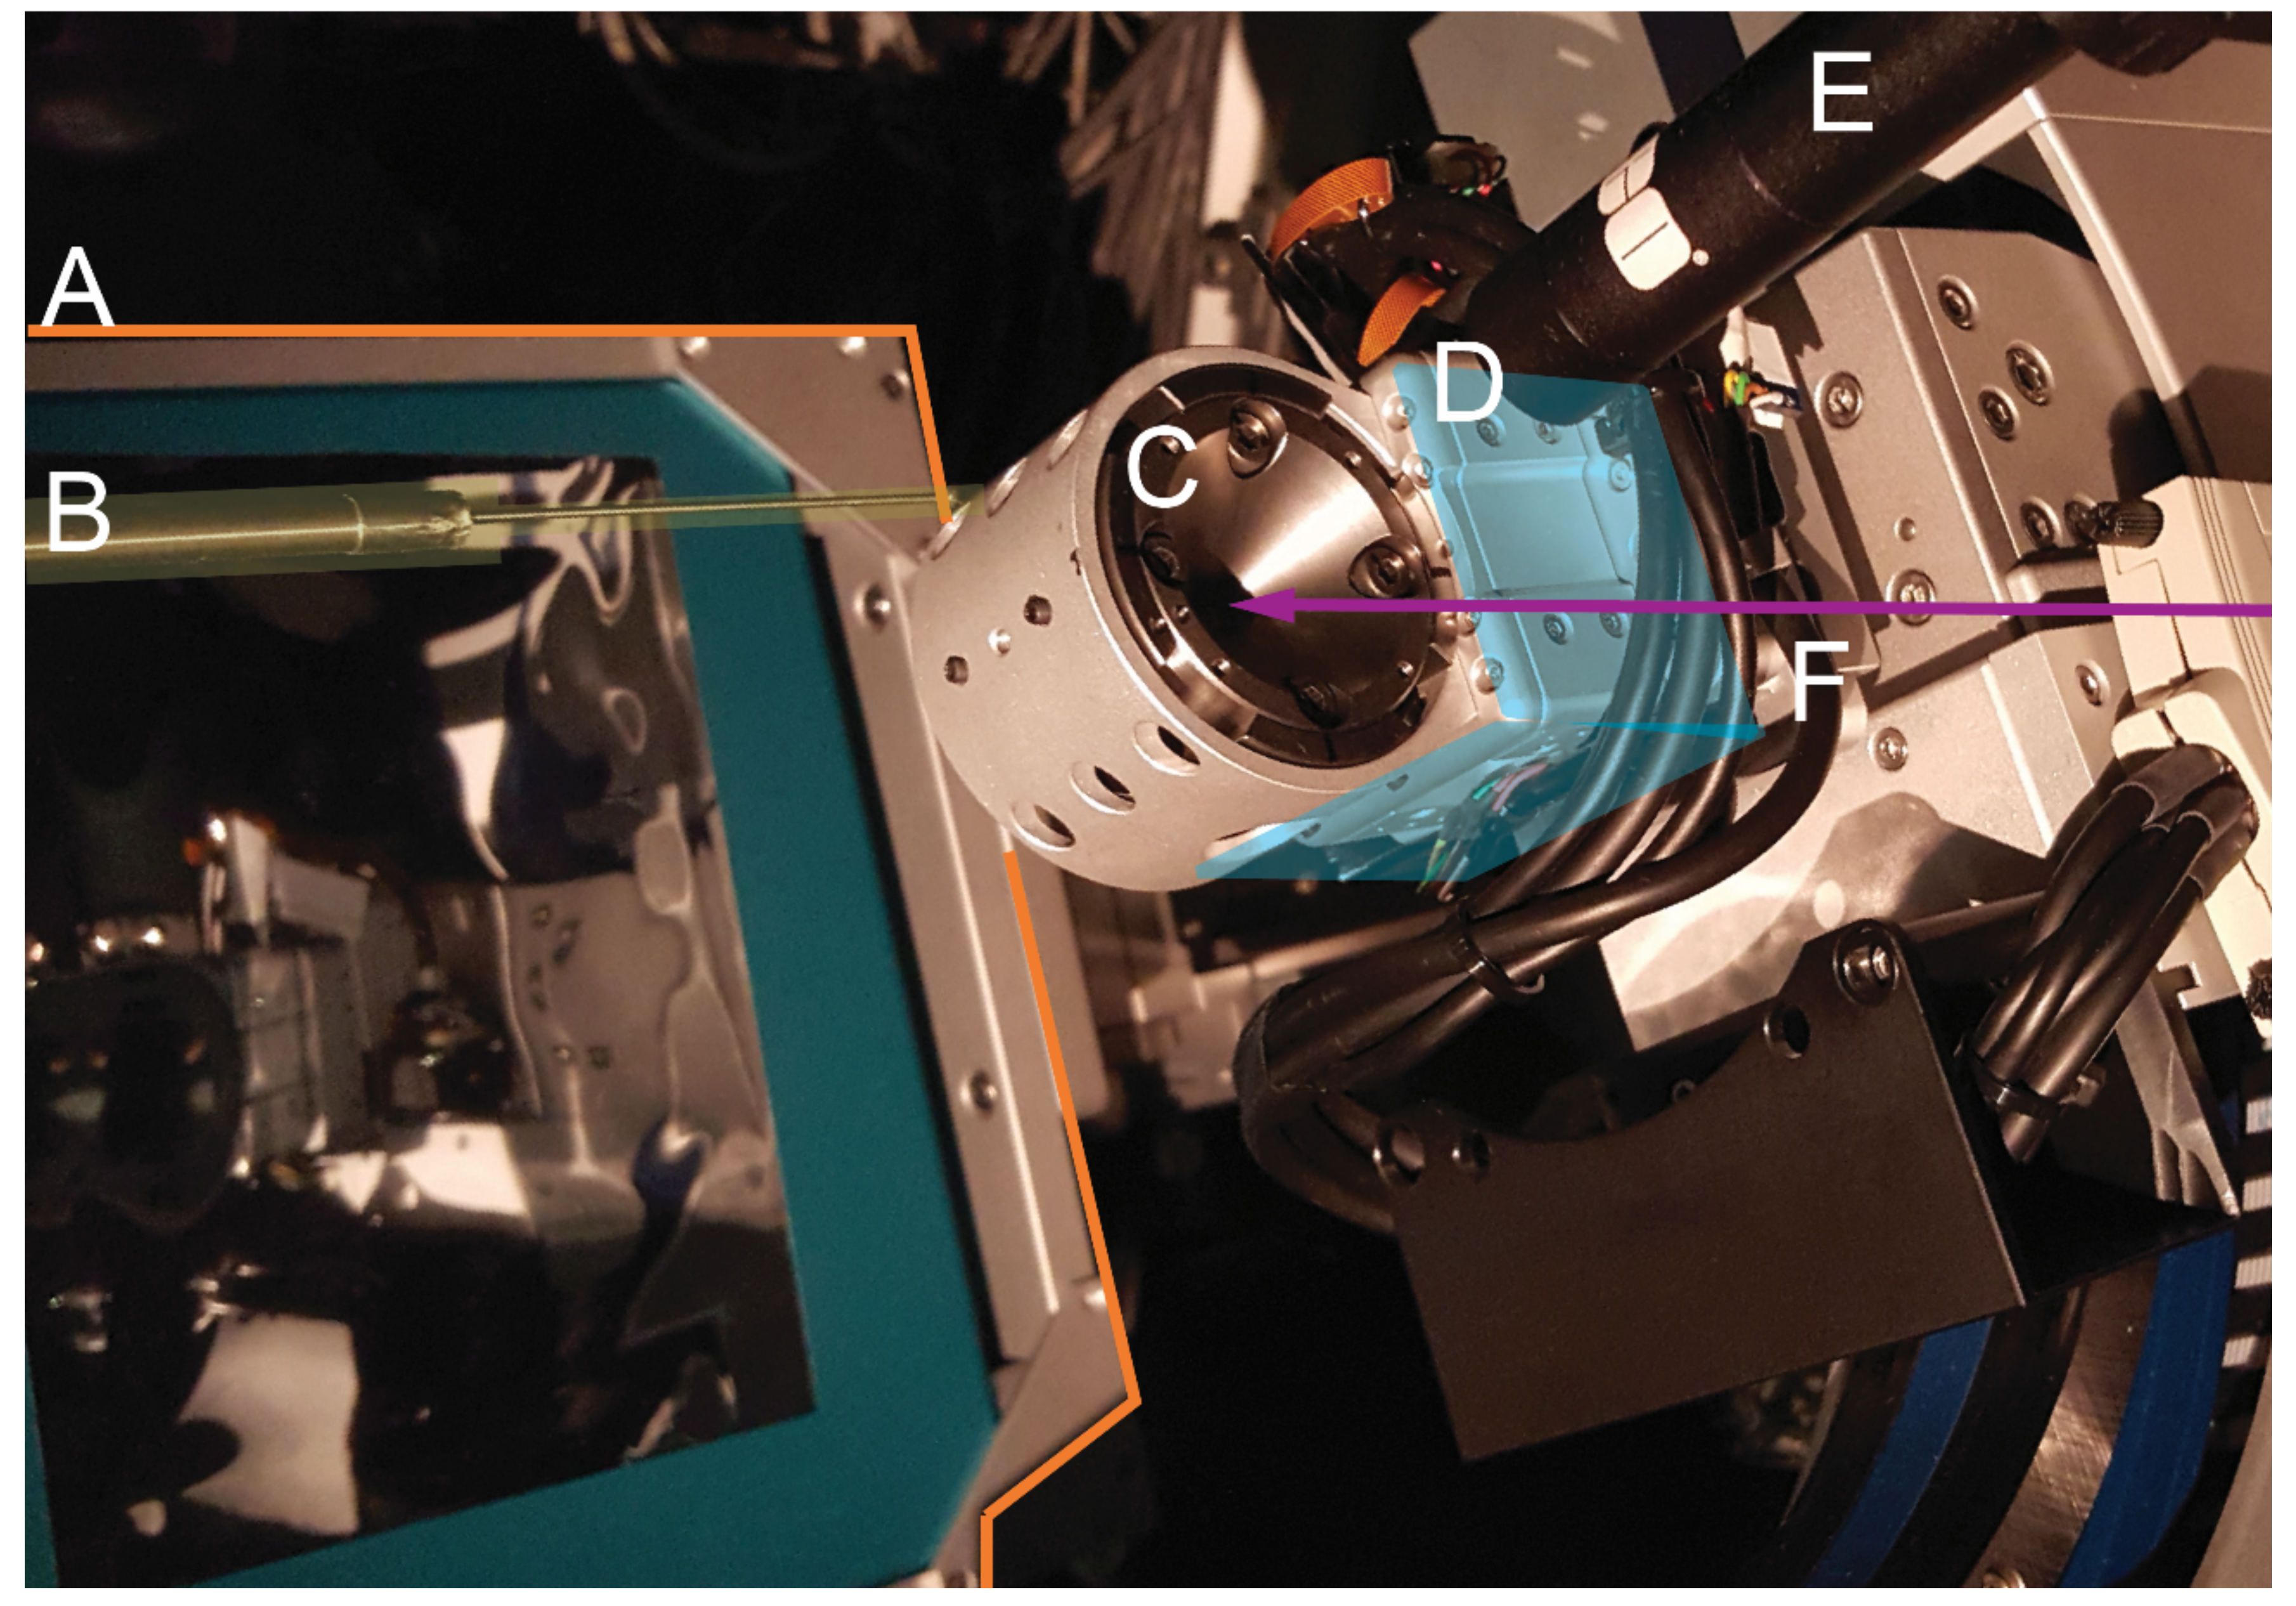
Endstation 1: A Stoe Stadivari 4-circle single crystal diffractometer (Stoe & Cie GmbH, Darmstadt, Germany) combined with a Research Detectors Inc. (RDI) CMOS 1M detector (Oakland, CA, USA) serves as the primary instrumentation for endstation 1 (Figure 2). The sample position is equipped with actively corrected xyz stages for aligning and maintaining samples weighing up to 1 kg on the 10 µm sphere of rotation. The RDI detector is optimized for 25 keV X-rays, and is capable of collecting data at 20 Hz. The entire diffractometer assembly can be aligned on the beam using two Aerotech stages (Aerotech Inc., Pitssburgh, PA, USA), which deliver transverse and vertical translation. A compact variable collimator, which was pioneered within the Berkeley Center for Structural Biology (BCSB, Berkeley, CA, USA), has been purchased. This collimator will allow the user to choose the beam to match their experiment, as well as enabling raster scanning for sample location.
Endstation 2: The secondary focus point is optimized for powder X-ray diffraction in combination with in-situ laser heating through a DAC (Figure 3). A single vertical rotation axis (φ) sitting on a xyz stage stack serves as the point of reference for the sample position. The sample is positioned onto the rotation axis with a second xyz stage on top of the φ axis. This set-up also serves as ad-hoc single crystal set up. A Mar345 image plate (marXperts GmbH, Norderstedt, Germany) and a RDI CMOS detector serve as X-ray detectors. The Mar345 is the choice for relatively slow in-situ laser heating experiments, while the RDI CMOS is almost exclusively employed for single crystal experiments on endstation 2.
This endstation was previously equipped with a Perkin Elmer (Waltham, MA, USA) detector for single crystal applications. Sample to detector calibration is performed using LaB6 and the DIOPTAS [17] software.
Optics for double-sided laser heating, pyrometry and imaging are installed on a 1 m × 1 m breadboard mounted upright and normal to the incident beam to the right of the sample position. The set-up allows for double-sided in-situ laser heating both in axial as well as radial diffraction geometry. Temperature mapping of the entire sample chamber is performed by combining the high-dynamic range intensity map of a monochromatic image and the averaged radiative spectral curve measured with a OceanOptics HR2000+ spectrometer (OceanOptics, Largo, FL, USA).
3.1.2. Powder Diffraction under Non-Ambient Conditions
Powder X-ray diffraction is in many ways one of the most straightforward material identification and characterization tools. It is thus often the method of choice to interface with ancillary sample equipment enabling the study of materials under non-ambient pressure, temperature, or atmospheric conditions. The in situ powder diffraction capabilities on beamline 12.2.2 focus on combining high temperature with high pressure (laser heating and resistive heating) on the one hand, and high temperature with non-ambient atmospheres (gas mixes) on the other hand. While the pressure-temperature combination finds most of its applications in geophysics and materials science (nano-material, super hard material), the science areas mostly seeking combining high-temperature with well-defined gas-mixes are catalysis, battery research and solid state chemistry.
In general, DACs (see Appendix B) are employed to subject samples to pressures in the range of 1–102 GPa. Powder diffraction through a DAC allows the extraction of information on P-T phase stability, bulk elasticity, as well as on plastic deformation (e.g., deformation mechanisms) and material strength. Thermo-elastic properties and phase stabilities are usually probed in an axial diffraction geometry, whereas strength and plastic deformation is measured using a radial diffraction geometry (Figure 4). In axial geometry, the DAC is aligned with its compressional axis parallel to the incoming X-ray. The X-rays are thus crossing the upstream diamond, before they are diffracted by the sample and the diffracted X-rays exit the sample assembly through the downstream diamond. The axial diffraction geometry is preferred for experiments that aim to create the most hydrostatic environment possible. Figure 5 shows raw and integrated data from an axial double-sided in-situ laser heating experiment.
3.1.3. In-Situ Laser Heating
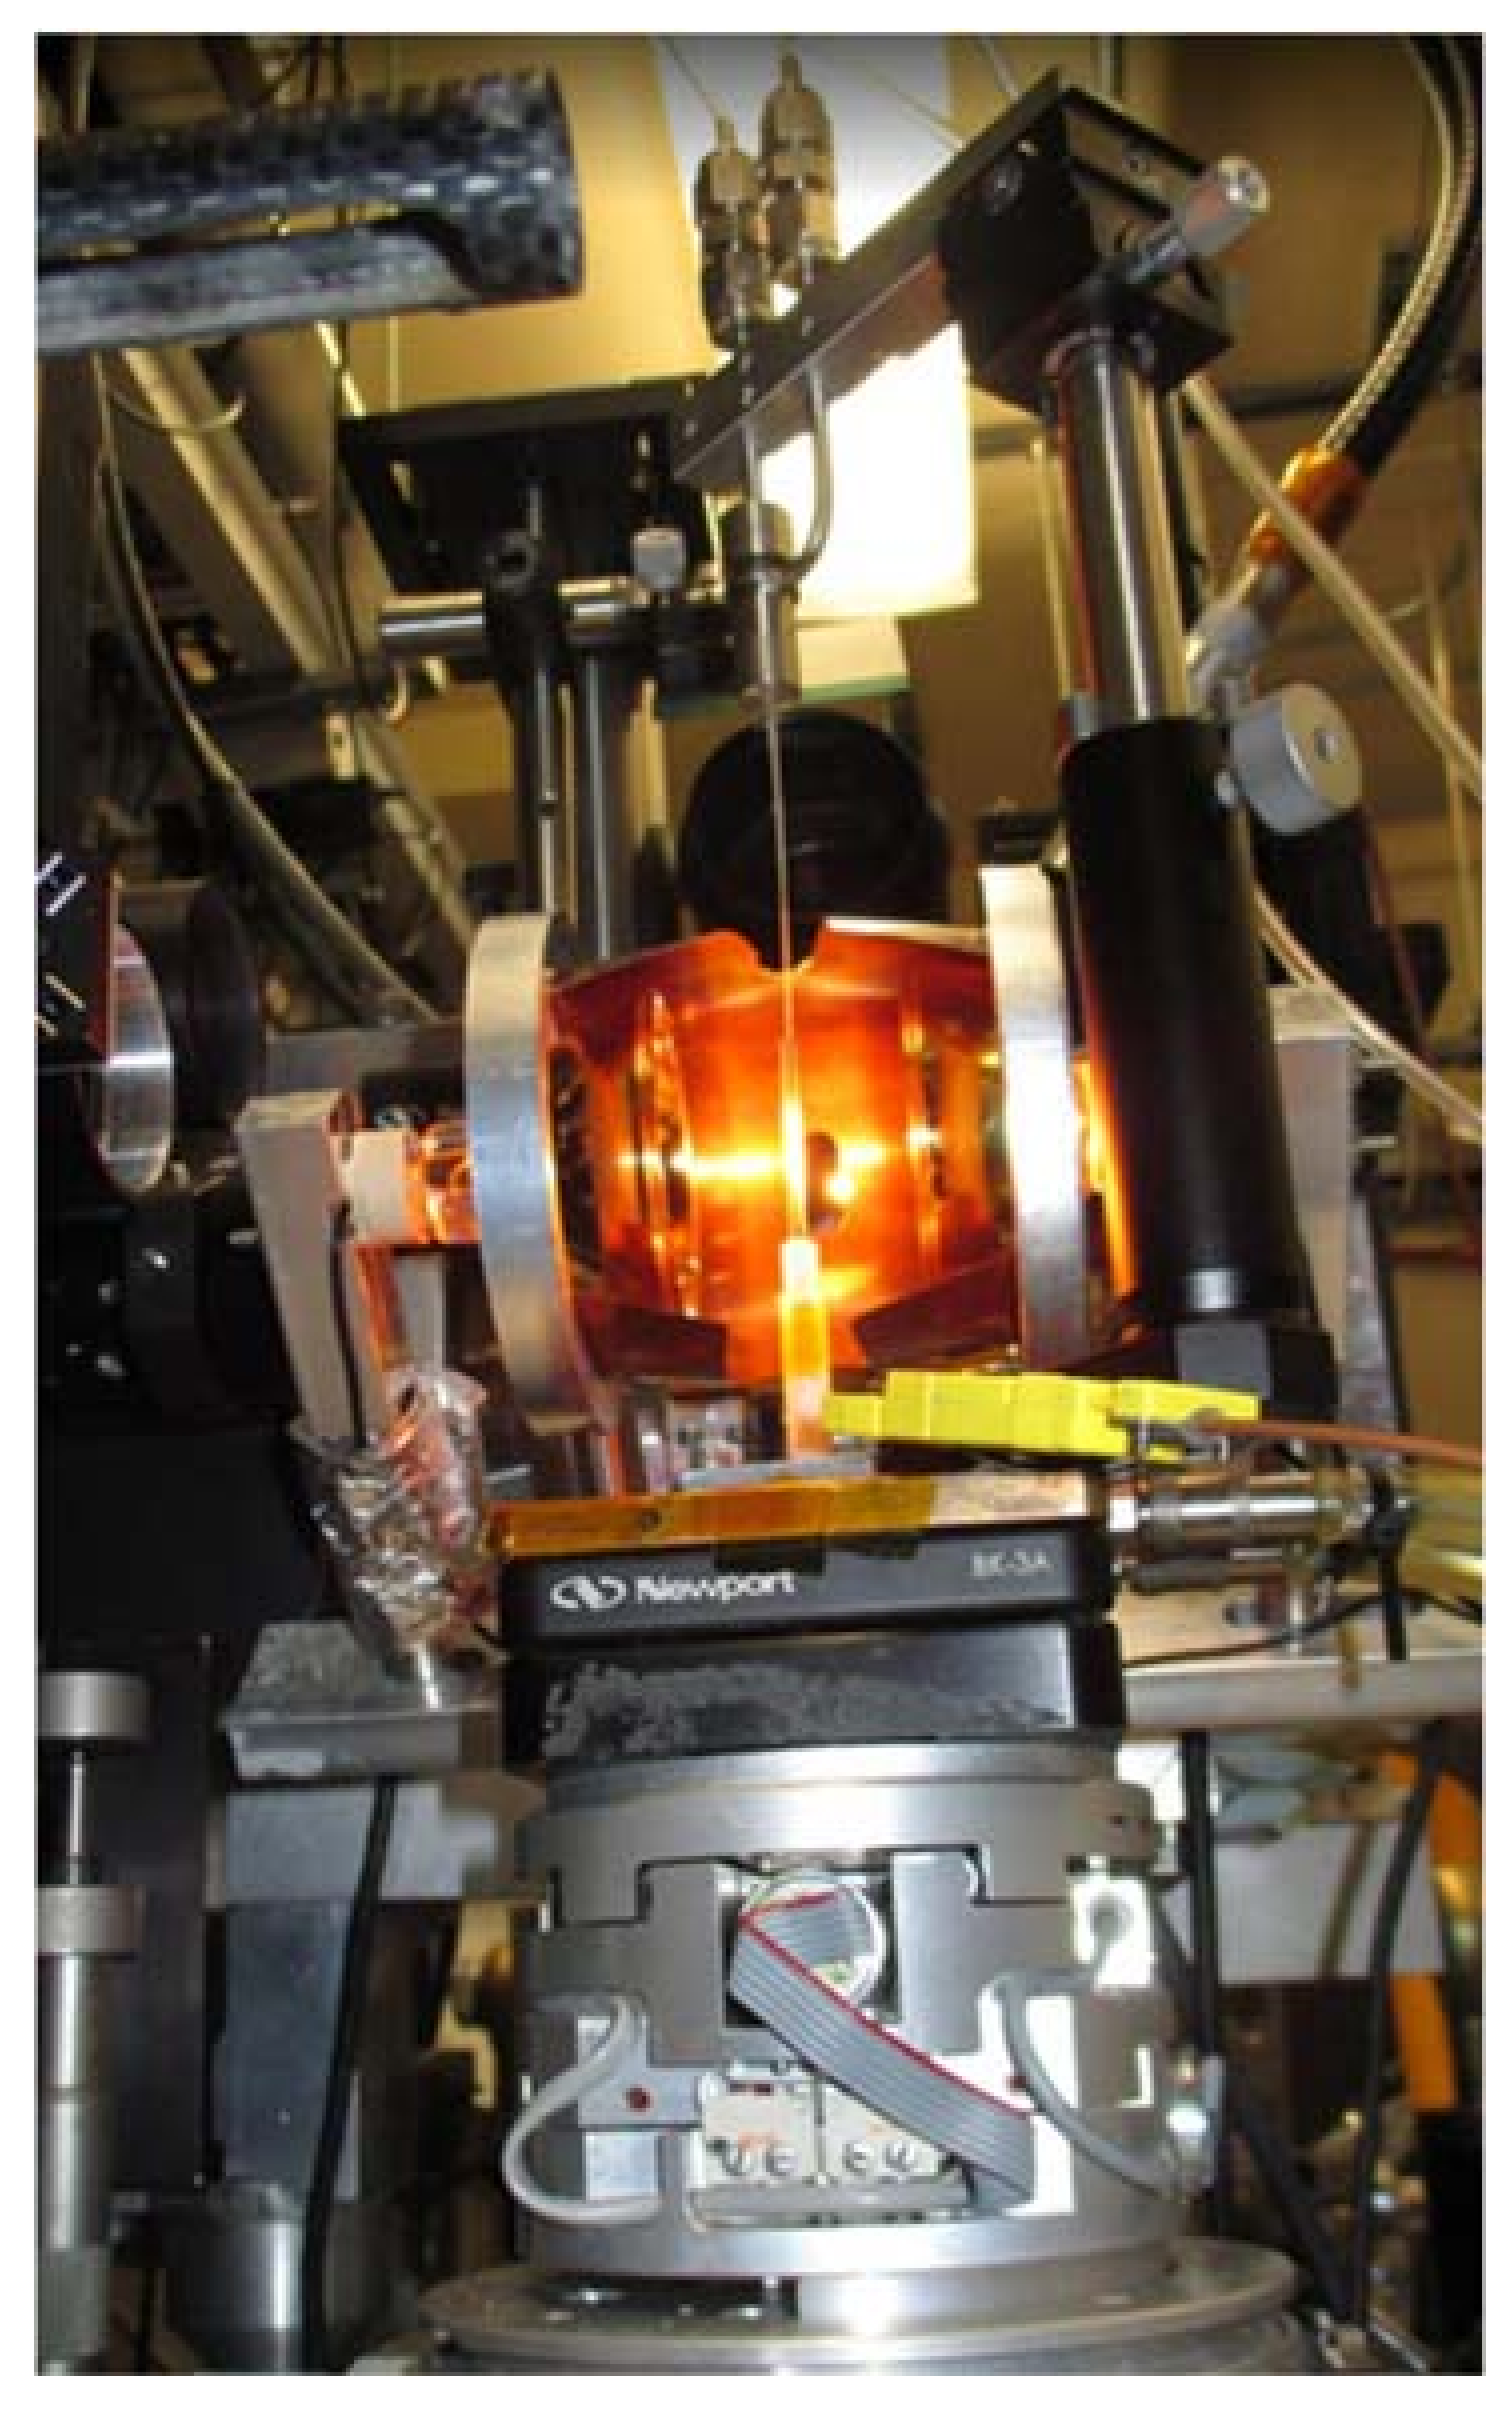
Synchrotron monochromatic powder X-ray diffraction coupled with double-sided in-situ laser heating was pioneered in the late 1990s first at the European Synchrotron Radiation Facility (ESRF) (Grenoble, France) (e.g., Fiquet et al. [18]) and soon after at other third generation synchrotron sources all over the world e.g., at Advanced Photon source (APS) (Argonne, IL, USA) [19,20], SPring-8 (Harima Science Park City, Japan) [21], and PETRA-III (Hamburg, Germany) [22]. At ALS beamline 12.2.2, a double-sided laser heating set-up was introduced in 2004 [23] and upgraded in 2014. As mentioned above, the double-sided laser-heating and pyrometric temperature measurement set-up is mounted on a 1 m × 1 m sized breadboard, which is positioned upright and orthogonal to the incoming X-ray path next to the sample position (Figure 6). The set-up allows for double-sided laser heating with instantaneous 2-dimensional temperature readings on both sides of the entire sample chamber. The ability to record full 2-dimensional temperature maps in real time allows quantification of the thermal gradients and thermal pressure effects encountered during such experiments. The potential for creating new material with interesting physical properties using combined high pressure and high temperatures as achieved in a LHDAC has been demonstrated by a series of 12.2.2 experiments, which created, among others, novel transition metal nitrides, borides, and carbides (e.g., Kaner et al. [24], Chung et al. [25], Mohammadi et al. [26], Friedrich et al. [27,28], and Santamaria-Perez et al. [29]). Equally interesting is the possibility of exploring P-T phase diagrams and thermo-elastic properties of (Earth-) materials at very high pressures and temperatures (e.g., Armentrout and Kavner [30], Nisr et al. [31]).
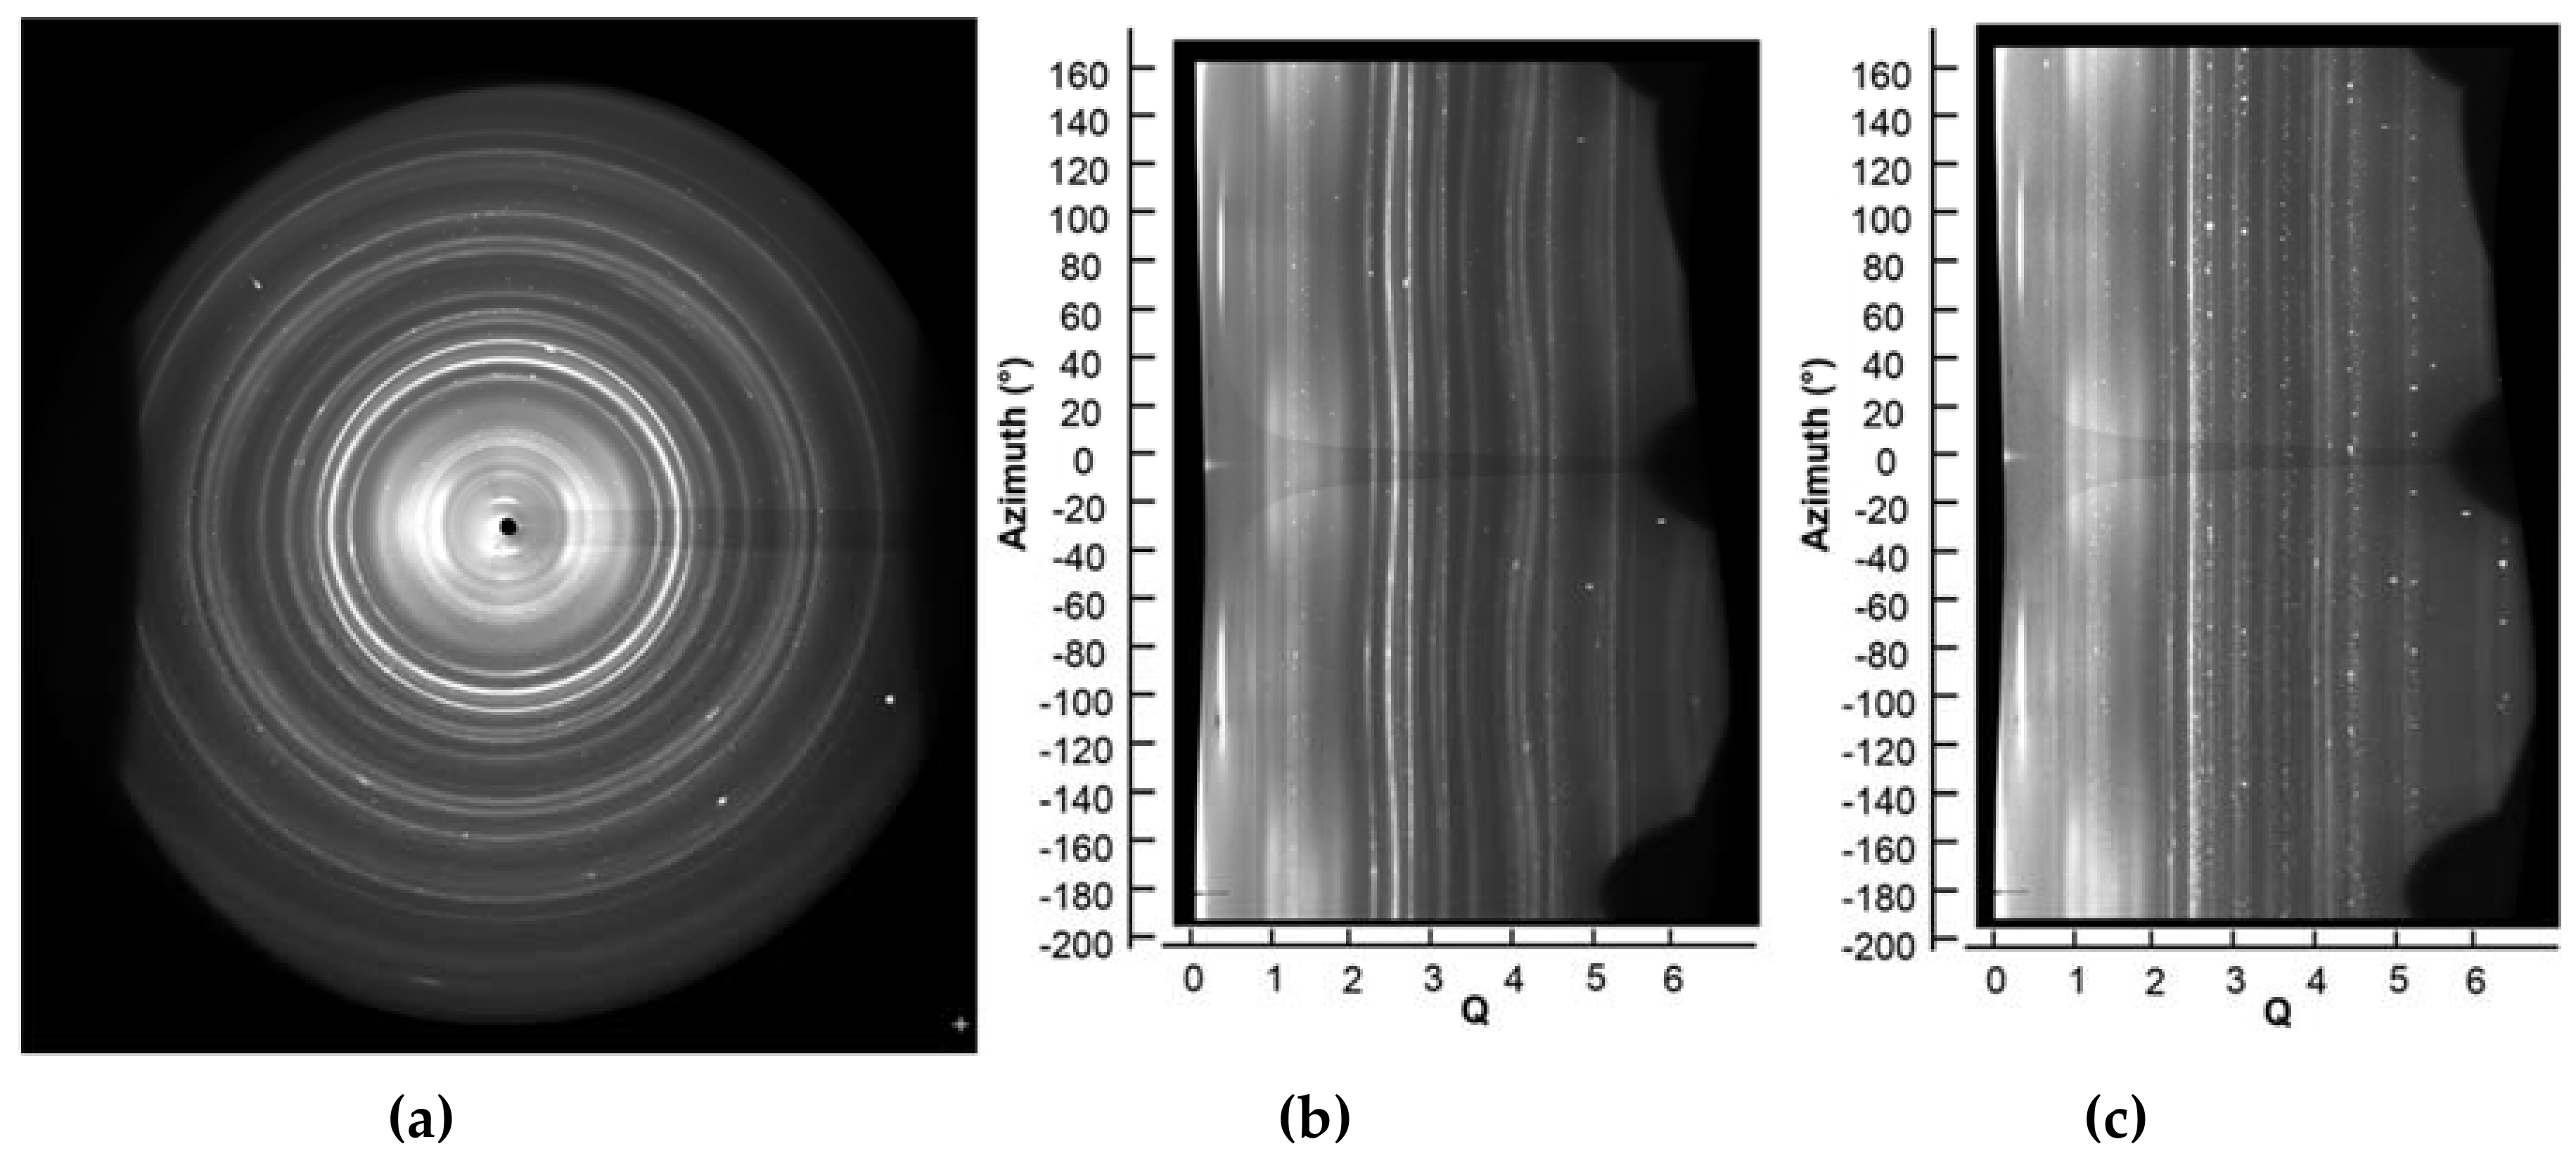
In the radial diffraction geometry, the compressional axis of the DAC is oriented perpendicular to the incoming X-ray beam (Figure 4 and Figure 7). Since X-rays enter and exit the sample chamber through the gasket material, this material needs to be X-ray transparent. Boron epoxy or Be metal are the materials of choice for X-ray transparent gaskets. The sample is loaded without a pressure medium (e.g., Figure A3a), thus creating an anisotropic stress field, usually with its strongest principal axis parallel to the applied uniaxial load. The radial geometry thus “sees” the maximum stress gradient experienced by the sample. This allows the measurement of the strength of a material through the elliptical deviation of the Debye diffraction rings from circular shape. Intensity variations along the diffraction rings/ellipses allow the measurement of lattice preferred orientation (lpo). The change of lpo in response to a varying stress field allows the deduction of the deformation mechanisms in plastic deformation events (Figure 8). Since activation energies of slip systems and therefore deformation mechanisms can be temperature dependent, 12.2.2 recently interfaced the double-sided in-situ laser heating set-up with the radial geometry. This involved redirecting the double-sided Infrared (IR) laser beam and pyrometry optics by 90 degrees in the horizontal plane. Although measuring texture and material strength has originally been developed by the Earth Science community to elucidate the plastic behavior of the Earth’s interior (e.g., Gleason and Mao [32], Miyagi et al. [33], Miyagi et al. [34], Miyagi and Wenk [35], Wenk et al. [36]), this technique has also been applied to shed light on the strength of ultra-hard and/or nano-sized material (e.g., Chen et al. [37], Xie et al. [38], Xie et al. [39]).
One of the more challenging aspects of in-situ laser heating (axial or radial geometry) is the extraction of a reliable temperature during the heating experiment. For practical aspects, this is generally done through black body pyrometry, where the Planck function is fitted against the observed thermal spectrum of the hot spot. The small dimensions associated with DAC work lead to very strong temperature gradients, which in turn can give rise for artifacts related to chromatic aberrations with even the best aligned optics. This can lead to significant errors on the temperature deduced from such a measurement [40]. Among the various strategies to avoid or correct for these artifacts, the recently upgraded set-up at ALS beamline 12.2.2 opted for the peak scaling method as suggested by Rainey and Kavner [41]. This method avoids selecting the (hottest) center of the hotspot via a pinhole or small slit and instead collects the entire hot spot into the spectrometer (Figure 9). This therefore circumvents most errors introduced by chromatic aberration by sacrificing the spatial resolution of the spectroscopic experiment. To compensate for this loss of information, a high resolution, high dynamic range monochromatic intensity image of the hotspot is converted into a temperature map, using the temperature obtained by the entire hotspot as the cost-function.
3.1.4. Resistive and Lamp Heating
Laser heating is inadequate if the goal is to combine temperatures below 1000 K with high pressure. This is mainly because temperature measurements and estimates in a LHDAC are done via pyrometry on the glowing hot sample and this effect is only visible at temperatures above ~ 1000 K. Below that temperature, any regulation or estimation of the temperature applied is not possible and conventional resistive heating has to be applied. Beamline 12.2.2 has an ongoing program to develop user friendly resistive heating capabilities (e.g. Miyagi et al. [42], Yan et al. [43]). Among the many design options for resistively heating a DAC, 12.2.2 is currently focusing on a design involving a tungsten wire around a ceramic torus, which surrounds the diamond-gasket assembly. This approach allows users to reach temperatures up to 1300 K and proves successful in exploring P-T-phase diagrams up to ~ 1000 K (e.g. Grocholski et al. [44], Geballe et al. [45], Raju et al. [46]).
In order to subject samples to high temperatures at ambient pressure, beamline 12.2.2 developed a 2-stage lamp heater (Figure 10) [47]. Two IR lamps illuminate a SiC capillary, which contains a thermocouple and a secondary quartz capillary carrying the sample. The SiC absorbs the IR heat and creates a uniform temperature field with very low spatial and temporal thermal gradients. It reproducibly creates temperatures up to 1300 K with finely controllable positive and negative ramp rates. The capillaries containing the sample powder can be connected to a mass-flow controlled gas atmosphere, which allows for time varying, well-controlled gas-atmospheres. This set-up creates excellent data in the realm of catalysis and solid state chemistry (e.g., Mattox et al. [48], Köck et al. [49]).
3.1.5. High Pressure Single Crystal Diffraction
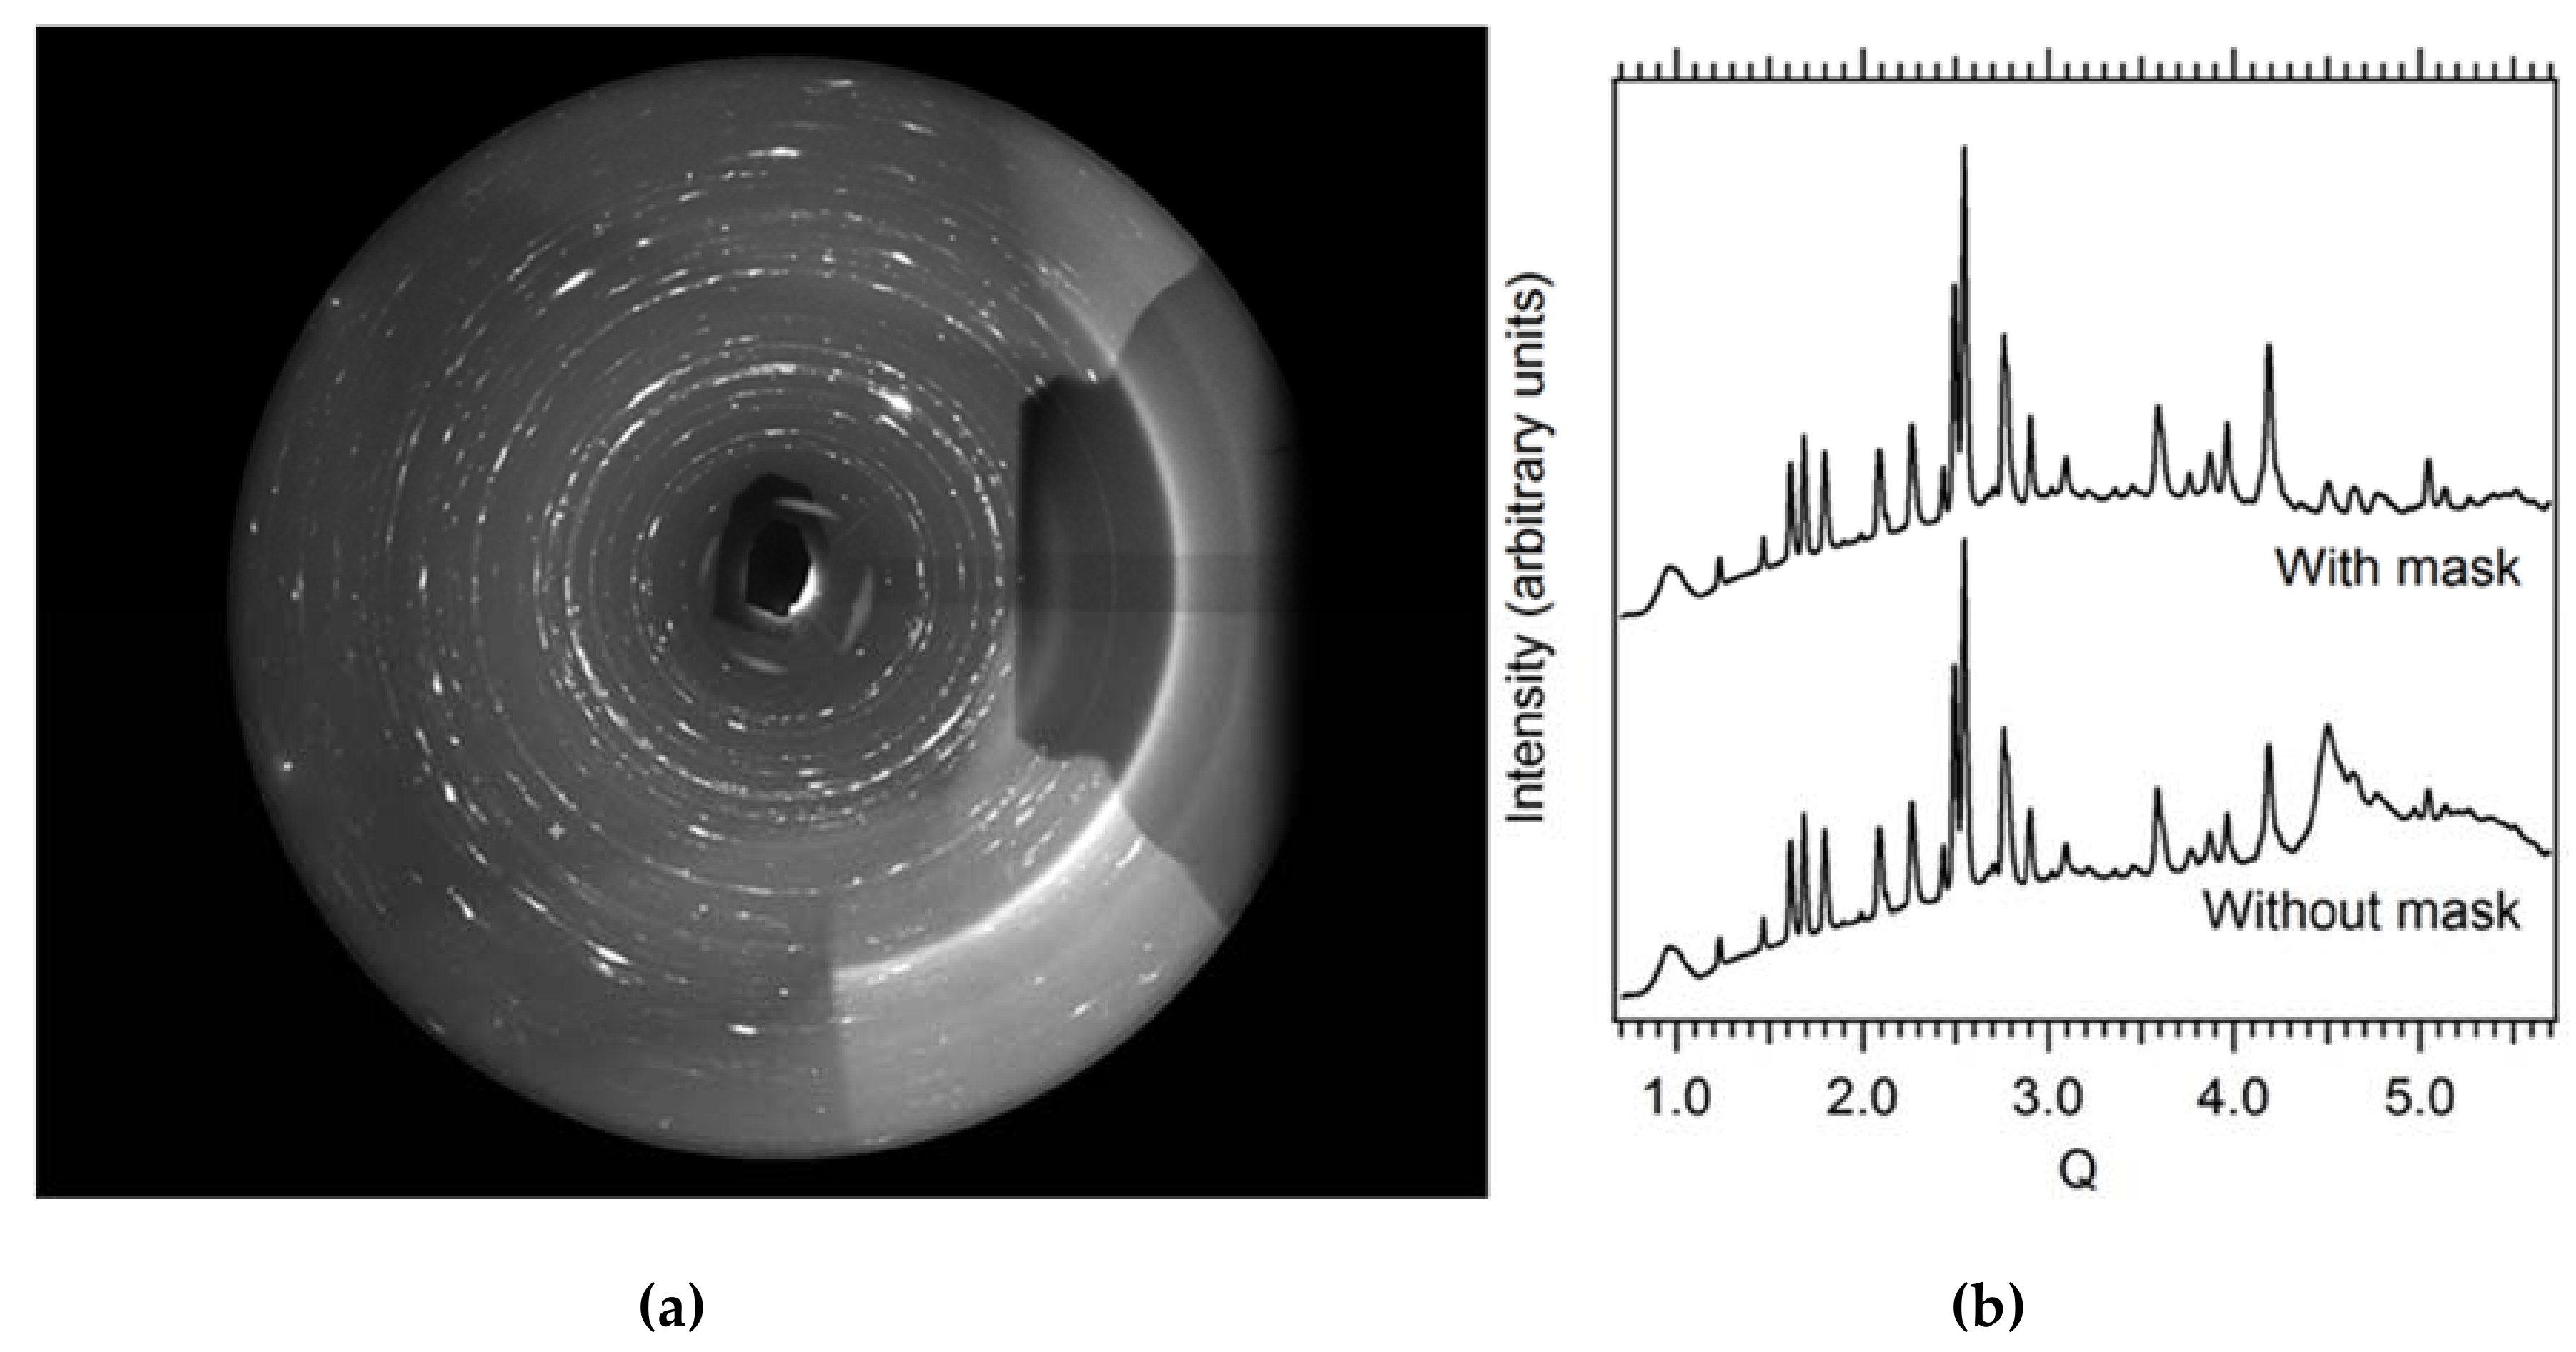
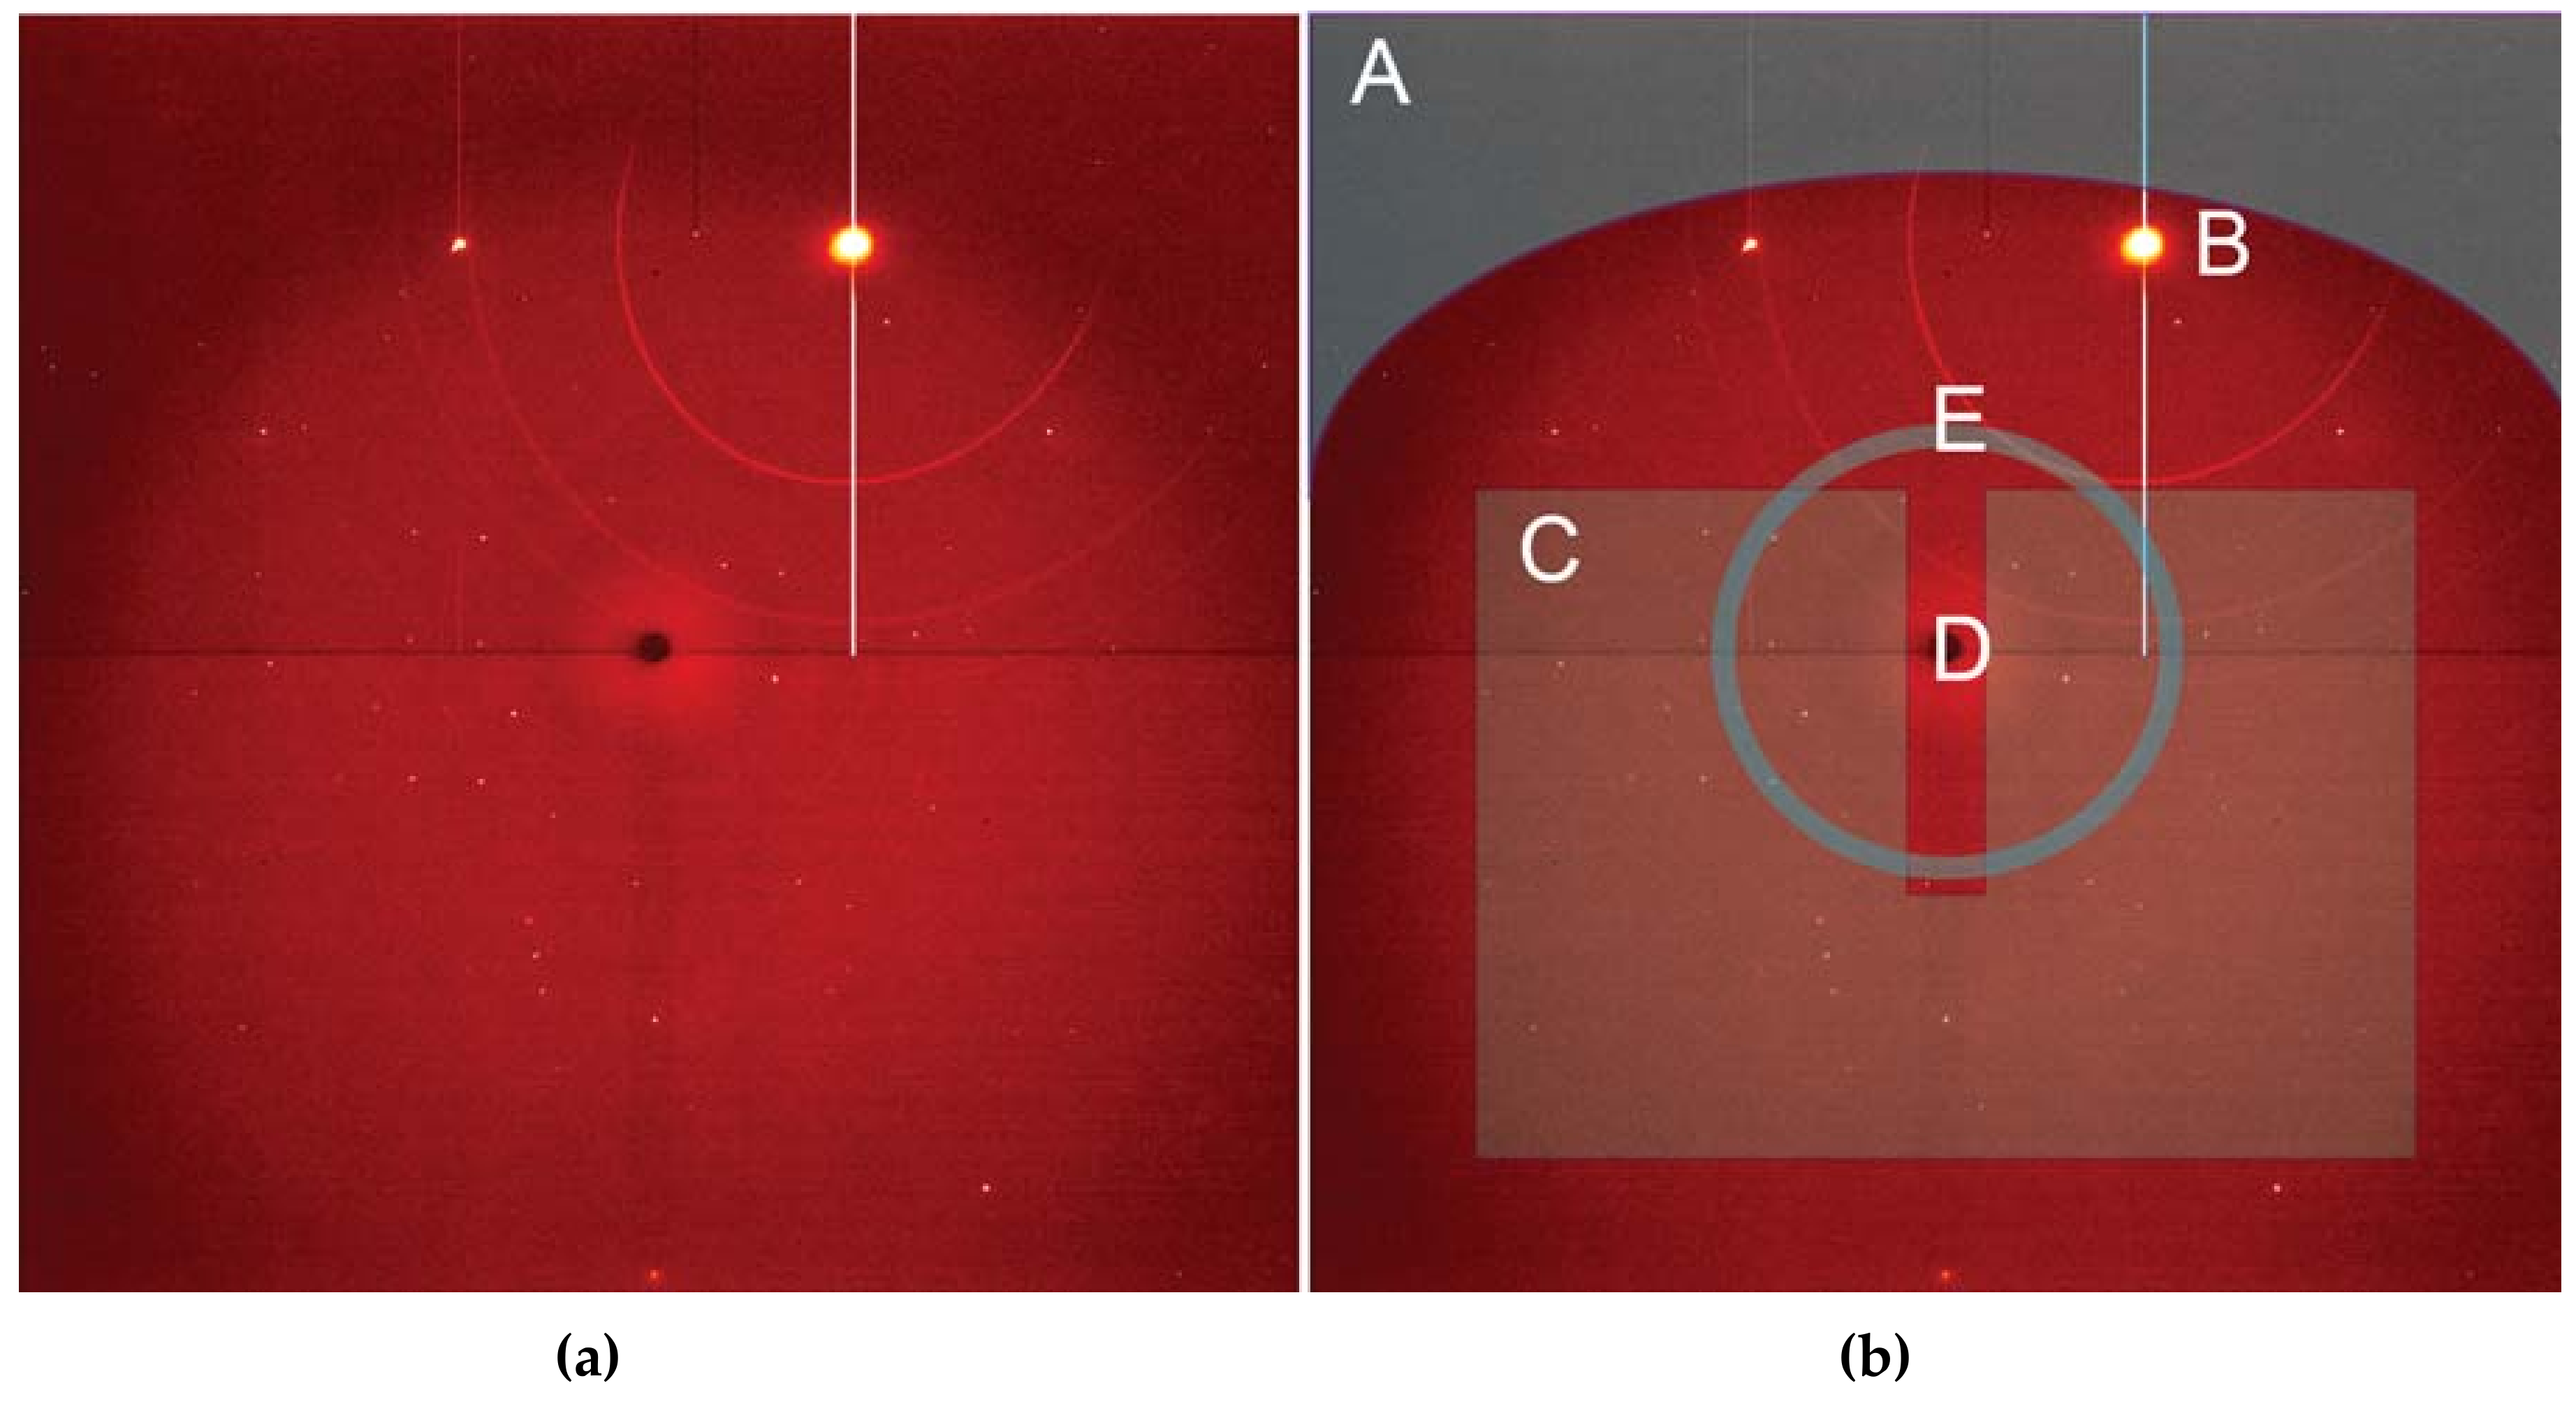
Employing a single crystal within a DAC allows an experimenter to gain greater insight into structural responses to pressure as well as to determine new structures after phase transformations. On beamline 12.2.2, the current endstation 2 system, with a single φ rotation axis coupled to the Perkin Elmer detector, has enabled user groups to explore the high-pressure behavior [50] of a wide range of samples, including minerals [51], perovskites [52], metal organic frameworks (MOFs) [53], and more. The endstation 2 system can accommodate DACs of nearly any reasonable mass and shape, but a successful single crystal experiment depends on having the largest angular opening possible. The endstation 1 system has been designed for the BX90 DAC [54], but will also accept Merrill-Bassett style DACs [55]. As the commissioning of the endstation 1 diffractometer comes to a close, users will have access to higher completeness, higher resolution single crystal data, which will give experimenters greater insight. In both cases, experimental data processing involves extensive masking of experimental features such as the DAC cell body shadow, gasket diffraction rings, diamond peaks, etc. (Figure 11). At this station, the DAC shadow and gasket powder rings can both be masked with the program ECLIPSE [56] before further data reduction.
3.2. Beamline 12.3.2
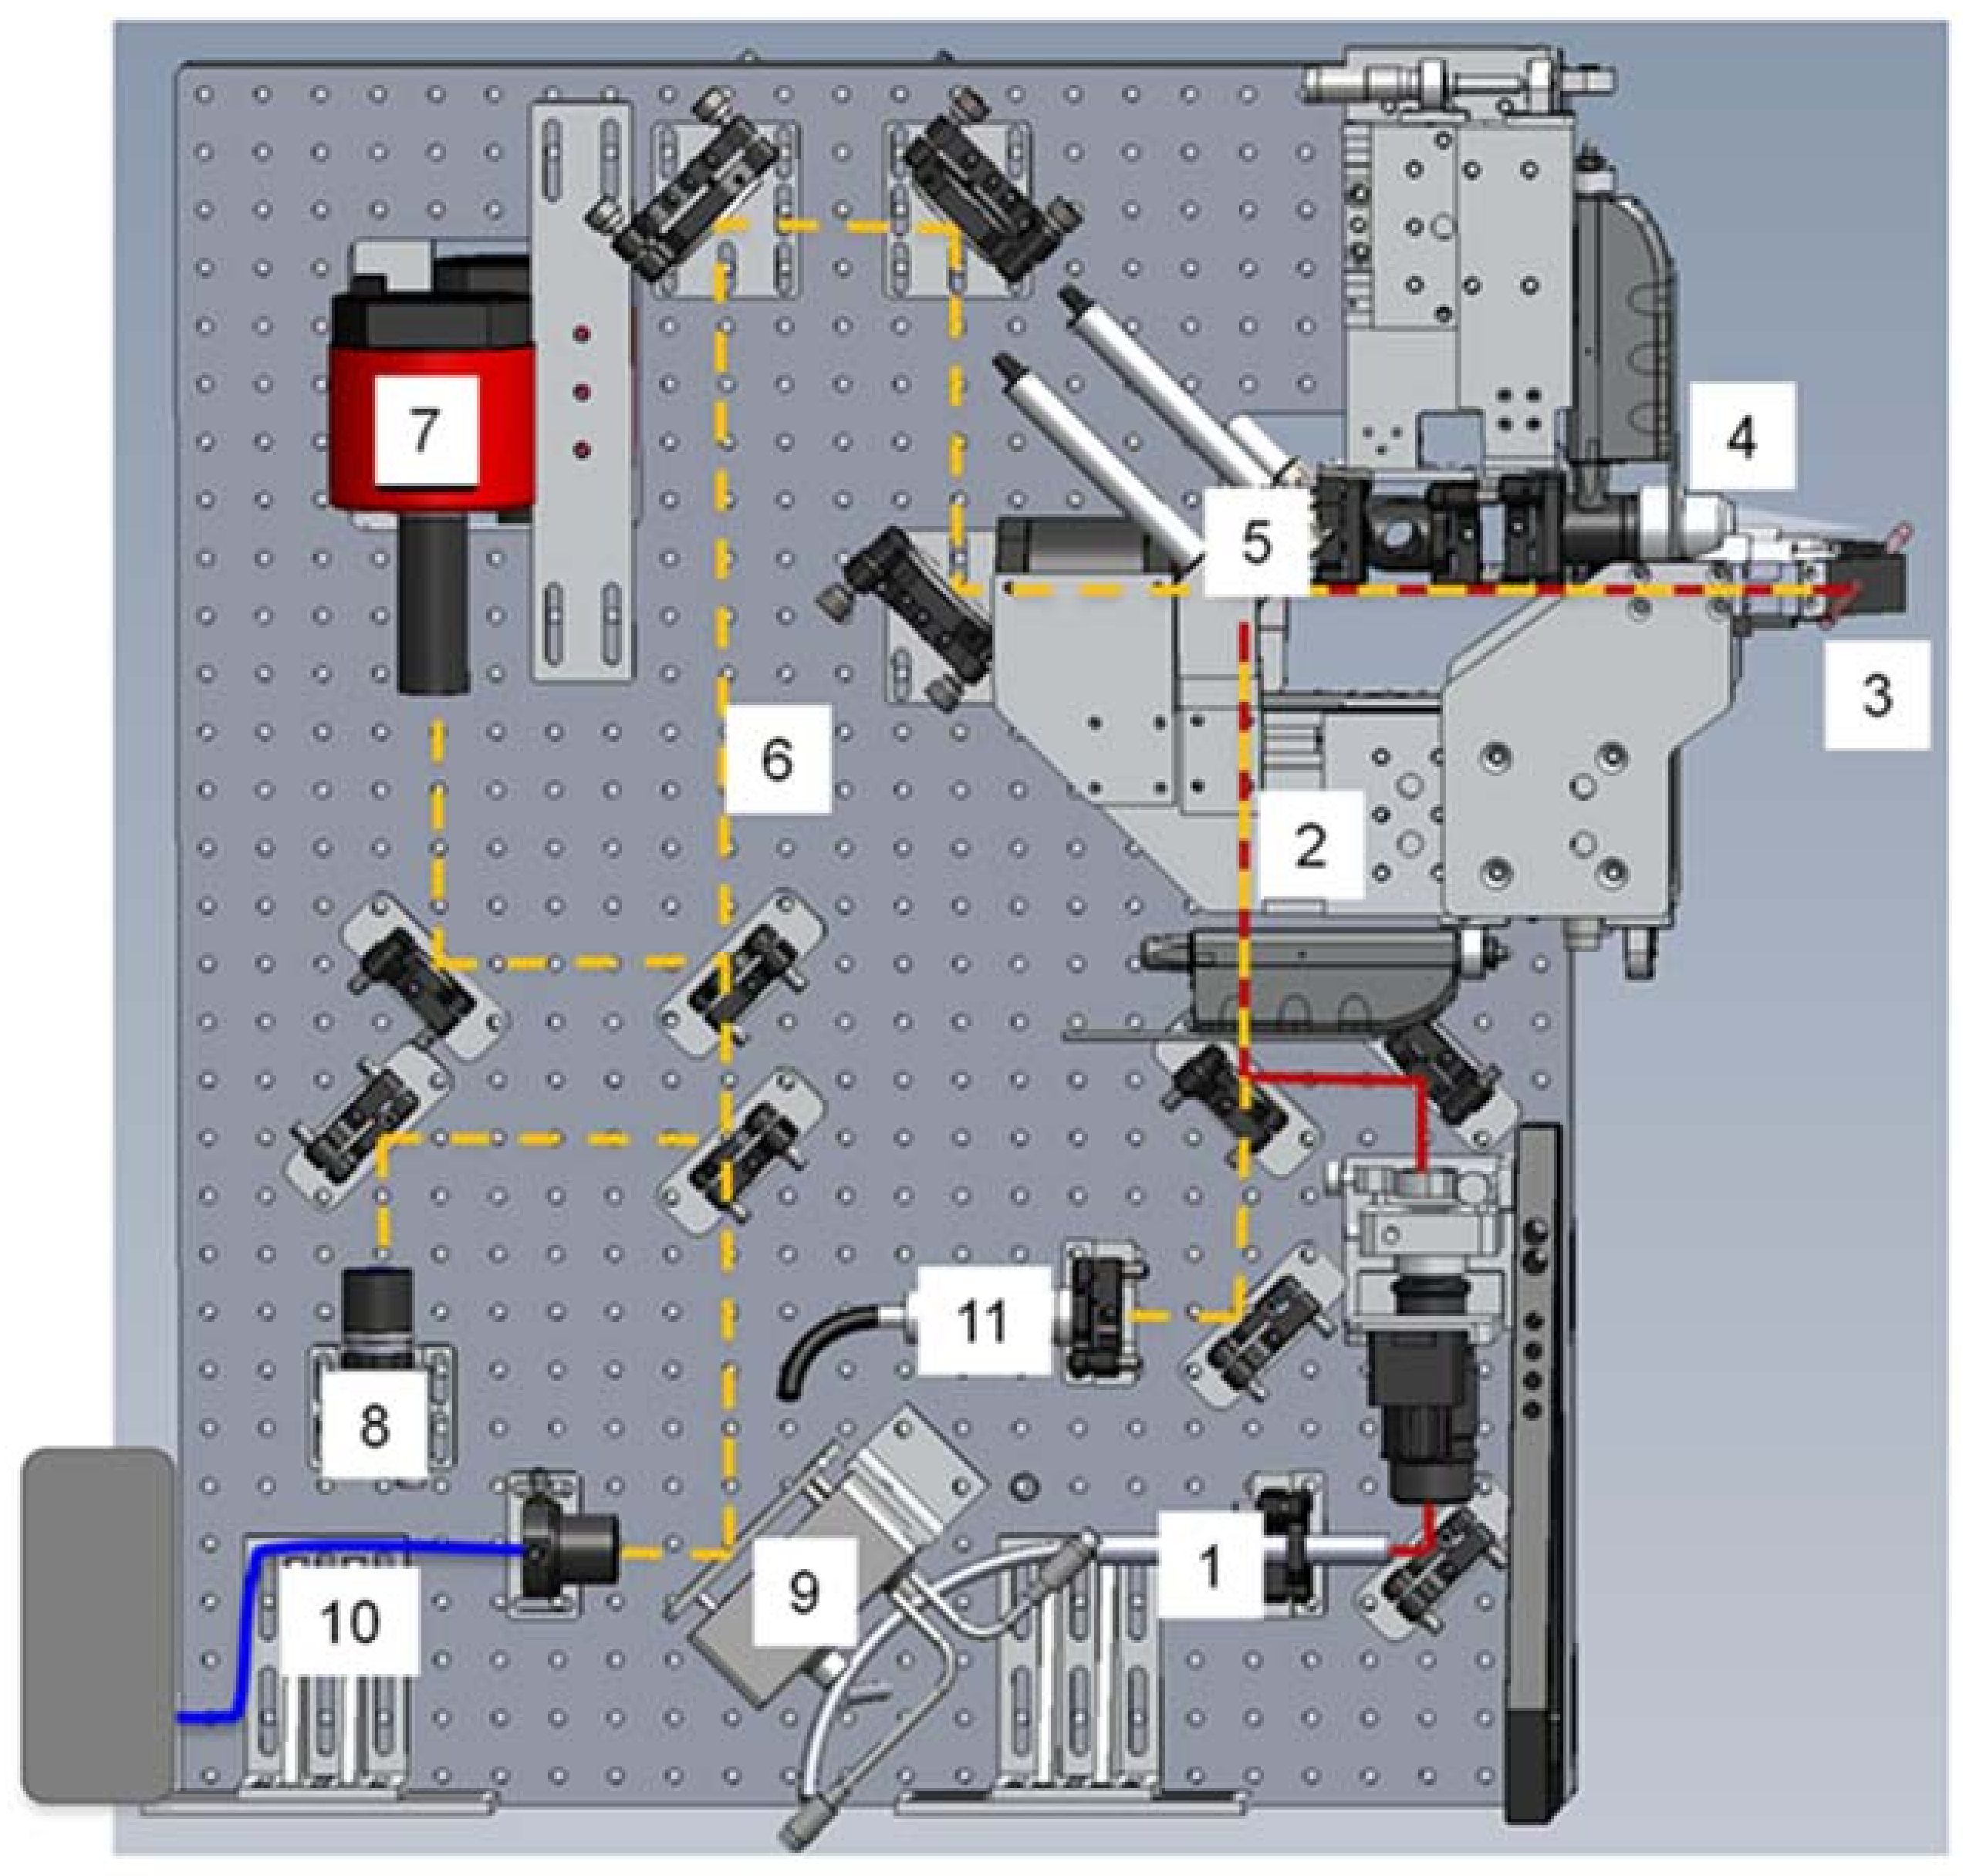
Beamline 12.3.2 was initially developed for Laue microdiffraction mapping, and was opened to users in 2009 [13,57]. The primary capabilities of the beamline focus on strain and phase mapping in two dimensions, with both Laue and monochromatic diffraction possible. The beamline sits on a 4.37 T field strength source, with critical energy near 11.5 keV, providing a usable range of 5–24 keV in the endstation. Details of the optical layout can be found in Kunz et al. [13]. Polychromatic (white) radiation from the source is refocused to the entrance of the experimental hutch where a pair of rotary slits sit, which act as a virtual source size. The X-ray beam is further focused to a nominal beam size of 1 μm × 1 μm at the sample by a pair of elliptically bent KB mirrors. Wavelength selection is provided by a 4-bounce monochromator, whose mechanism allows the monochromatic beam to be collinear to the polychromatic beam so as to illuminate the sample at the same location. This is particularly useful if a sample contains both small (effectively polycrystalline with respect to beam size) and large crystals (larger than beam size) within the diffracting volume, or if the full strain state of a single crystal must be measured (by using an energy/wavelength scan at the same location as a known single crystal diffraction pattern). As the monochromatic beam is usually limited by flux, we open the rotary slits to make the monochromatic beam dimensionally larger than the white beam, with a focused spot size of approximately 5 μm × 2.5 μm in direct transmission. Samples are positioned on a 8-motor stage (bottom x, y, and z motors for coarse positioning, one χ motor for changing the angle of incidence of X-rays onto the sample, one φ rotation stage, and top x, y, and z motors for precise sample positioning), which allows for both precise positioning at the X-ray focal point, and displacement such as for raster scanning. Diffraction data is collected on a DECTRIS Pilatus 1M detector (Dectris AG, Baden, Switzerland), which is mounted on a Huber stage allowing 90 degrees of rotational freedom and translation over more than 10 cm. Additionally, the beamline is equipped with a Vortex-EM Si drift detector (Hitachi, Ltd., Tokyo, Japan) for X-ray fluorescence (XRF) mapping (Figure 12).
Significantly more details are available in [13,57]. The combination of the 8-motor sample stage and the detector stage leads to a wide variety of possible geometries that can be employed at 12.3.2. Both reflection and transmission experiments are possible and are performed routinely. Additionally, in both modes, the sample can be raster scanned, with either diffraction or XRF data collection proceeding simultaneously. The results are 2-D maps, with each map pixel position correlated to either a diffraction pattern or elemental composition. The beamline is particularly suited for quantitatively mapping microstructure at the μm scale for grain orientation, texture, strain/stress and defect densities. Cases of interest are highly heterogeneous materials, which are typical in geo- and environmental sciences, and small samples. As both polychromatic and monochromatic radiation can be delivered onto the sample, both Laue and powder diffraction can be performed. Additionally, structure solution and refinement using Laue diffraction has been implemented for cases that are difficult to be investigated by single crystal diffraction, such as transient states, crystals inside heterogeneous matrix or ancillary equipment such as a DAC [58]. Energy dispersive diffraction is also possible by scanning the monochromator energy. The detector position is calibrated with a well-known standard; this is usually Al2O3 in the case of monochromatic experiments and Si or SiO2 (quartz) in the case of Laue experiments. The monochromator energy is periodically calibrated using the diffraction peaks of Si.
There are two primary ways in which DAC experiments proceed. For both, the χ rotation is changed to 0 degrees. The DAC, when placed on the stage, will be oriented such that the direction of uniaxial compression is completely aligned with the X-ray beam direction (Figure 13). In this orientation, the y direction of the stage is the focal direction, and scans can be performed in the xz plane. Stage positions are adjusted such that the sample is within the focal range of the beam. Typically, this necessitates adjustment in z relative to the plane of the beam, and in the y direction to focus the sample position. The final focal position is usually determined based on the diffraction of the two diamond anvils. A diffraction line scan is performed in y. The peak intensity of the diamonds is monitored, and the sample is located at the minima of both diamond diffraction signals. Once the sample is aligned, the experiment can proceed in either the radial or the axial direction, with the main difference lying in the adjustment of the detector position relative to the beam. Recorded diffraction patterns will exhibit some portion of the image that is cut off by the cell body, and strong single-crystal peaks from the diamond anvils (Figure 14). Sample peaks are then indexed using the program XMAS [59], and orientation and stress/strain can then be calculated. Although work on this beamline is more focused on ambient pressure conditions, the sample stage has the flexibility to mount diverse equipment providing possibilities for in-situ experiments such as heating, cooling, tensile strain loading and high-pressure measurements inside a DAC.
3.3. Beamline 11.3.1 and 12.2.1
The newest high-pressure diffraction beamline will be beamline 12.2.1, currently being constructed at the ALS. Beamline 12.2.1 will be the future home of the chemical crystallography beamline, which is currently housed at beamline 11.3.1. 11.3.1 has as its source a “warm” bending magnet with a field strength of 1.27 T. Despite the low critical energy of 3 keV, beamline 11.3.1 has been used successfully for high-pressure studies of chemical compounds. The beamline design of 11.3.1 is extremely simple, with only two optical components, both of which are behind the synchrotron shield wall. The channel cut Si(111) monochromator receives white beam from the source, and delivers monochromated light to the toroidal mirror, which is focused in the experimental hutch. More detail is given in Thompson et al. [60].
Beamline 12.2.1 has been constructed in the same design as other monochromatic superbend beamlines, with a collimating mirror receiving the source, a Kohzu double crystal Si(111) monochromator and a toroidal mirror focusing the beam into the experimental hutch [15]. Beamline 12.2.1 will offer double the flux at the current ambient pressure data collection energy (16 keV), but will offer three orders of magnitude more flux at 20 keV, which has limited the success of high pressure experiments on 11.3.1 in the past. The 11.3.1 experimental endstation will be moved to 12.2.1 in 2018.
The experimental endstation for 11.3.1 is extremely streamlined, to reduce the learning curve for users. A Bruker three-circle diffractometer, equipped with a Photon 2 CMOS detector (Bruker AXS, Inc., Madison, WI, USA), has been mounted to rotate about a horizontal axis. This configuration allows ambient data collection to 90° in 2θ, which corresponds to a maximum resolution of 0.37 Å-1 at 16 keV. The focal point is determined using a CdWO4 scintillator, and the rotation axis is moved to be coincident with the focal point. Single crystal high pressure experiments are done on 11.3.1 using small DACs, typically of the Merrill-Bassett design [61], equipped with Boehler-Almax cut diamonds [62]. The 11.3.1 diffractometer is controlled by the Bruker APEX3 program, which is used by many institutions in their home X-ray labs, and allows users to start collecting data almost immediately. Indexing and data reduction is also handled in APEX3, but high-pressure users need to employ additional tools, either internal to APEX3 or external (ECLIPSE [56]), to mask detector regions obscured by the DAC body. This beamline is mostly aimed at chemical crystallography, and high-pressure studies have investigated spin crossover events [63], negative linear compressibility [64], and MOF resilience under compression [65].
4. High Pressure Experiments at the Advanced Light Source
The ALS benefits from a diverse, international user base, and high-pressure science has been performed in a variety of fields. Here, we discuss a few representative DAC experiments from the last few years, divided by discipline. We have selected the examples so that all of the different diffraction techniques available at the ALS are represented: single crystal X-ray diffraction, powder diffraction and Laue diffraction.
4.1. Materials Science
Plastic deformation in polycrystalline materials, that is deformation beyond the elastic limit of the material, is fairly well understood for grain sizes down to one μm. However, plastic deformation in nanocrystallized materials is another matter. Based on the Read-Shockley model, it is conventionally believed that below a certain grain size, plastic deformation would only occur through grain boundary mediated mechanisms resulting in grain rotations rather than grain deformation [66]. According to this model, smaller grains would rotate more than larger ones. Zhou et al. [67] sought to experimentally test the theory by tracking grain rotation in ultrafine nickel nanocrystals using a DAC for exerting pressure (i.e., stress) and Laue X-ray microdiffraction to track grain rotations. The Ni samples have average crystal sizes ranging from 3 nm up to 500 nm. As the grain sizes of the nanocrystals are too small to be captured by single crystal or Laue diffraction, the net rotation effect on larger 6–8 μm embedded marker WC crystals was measured relative to the stationary diamond anvils as a function of increasing pressure. The study conducted on beamline 12.3.2 with DAC in a 90-degree (radial) geometry showed that rotation indeed increases with decreasing crystal size until a critical value of 70 nm. Below this value, an unexpected reversal in size dependence of the rotation is observed. Additional measurements using powder diffraction on beamline 12.2.2 shows that for a given pressure, texture strength increases with crystal size, indicating increasing dislocation activity in the grain interior. Based on these two observations, it is surmised that the reversal in size dependence of the grain rotation is the result of a crossover between two competing mechanisms, grain boundary dislocation mediated grain rotation and grain interior dislocation-mediated deformation.
4.2. Chemistry
High pressure single crystal diffraction is powerful because of the level of detail it provides. With high quality data, the structural response to pressure can be studied on an atom-by-atom level. Recent reports of high pressure applied to chemical compounds have been investigating compressibility [65] and other material properties [64], but also intermolecular interactions [68], spin transitions [63] and phase changes [52]. In this example, a MOF was subjected to high pressure, and then compared to the high-pressure behavior of the same MOF after it had been augmented with a reinforcing organic molecule [53].
MOFs are porous coordination polymers with inflexible organic ligands, which interconnect metal nodes. They are primarily attractive for the available internal surface area, which has applications in gas separations, transport, and storage, as well as catalysis, and structural characterization [69,70]. For MOFs to find applications in industry, they need to be fairly rugged, and be able to resist some degradation due to environmental factors, i.e., heat and pressure. In this case, Kapustin and co-workers [53] were aiming to produce a MOF that was more resistant to pressure. MOF-520, the focus of this study, is composed of aluminum-formate rings, ligated together with tripodal 1,3,5-benzenetribenzoate (btb), and was originally synthesized by Gandara et al. [71]. Single crystals of MOF-520 were loaded in a DAC with 4:1 methanol:ethanol as the pressure transmitting medium (PTM), and diffraction data were collected on beamline 12.2.2, from ambient pressure up to 2.82 GPa, at which pressure the crystal became amorphous. This amorphization is not unusual, in that the high pressure pushes the PTM into the pores, which degrades the long-range order of the crystal [72]. This invasion of PTM was quantified by examining the unit cell dimensions for an increase in volume, as well as determining the unassigned electron count using the program SQUEEZE [73]. To stabilize the MOF crystal against the high-pressure incursions of the PTM, single crystals of MOF-520 were soaked in a saturated solution of 4,4′-biphenyldicarboxylic acid (H2bpdc), which replaced the formate molecules, and cross-linked across the pores. This new ligand was chosen for its length, which closely matches the pores of MOF-520. A single crystal of this new compound, known as MOF-520-BPDC, was then subjected to high pressure.
The structures of both MOF-520 and MOF-520-BPDC are shown in Figure 15. The 100 K structures are very similar, with the BPDC unobtrusively spanning the voids (green ovals, Figure 15). Thermal expansion from 100 K to ambient temperature leaves both structures again looking very similar, with the pore size similarity shown using purple circles. The images on the far right are the structures at the maximum pressure where the crystal was still able to diffract. MOF-520 has, by 2.82 GPa, swelled with PTM, and is now showing volume decreases, along with decreasing diffraction intensity. The bottom right shows a similar looking MOF-520-BPDC structure, but the pressure is 5.33 GPa. The distortion of the BPDC ligand seems to indicate that the crystal is near failure, but this modification has doubled the high-pressure lifetime of this material. Using single crystal diffraction, Kapustin, et al. [53] were able to observe that a specific modification to a known MOF vastly improved its high pressure ruggedness.
4.3. Geoscience
One of the frontiers in modern Earth science is the quest to understand the structure and dynamics of the interior of planets and in particular the Earth. The only direct observations of the interior of the Earth come from sophisticated analysis of seismic waves created by earthquakes occurring daily across the globe with varying magnitudes. Combining accumulated measurements from across the globe over several decades’ time span allowed the establishment of a tomographic image of the Earth’s interior, revealing its radial concentric shell-like structure. Ever refining resolution of these models shows the occurrence of distinct anisotropies in wave speed at specific depths throughout the Earth, including the inner core, which mostly consists of hexagonal close-packed (hcp) iron [75,76,77]. It is surmised that this seismically observed anisotropy is rooted in preferred orientation of hcp iron crystallites in the inner core [76,77,78].
One of the important aspects of this model is the experimental determination of the strength of iron at conditions within the Earth’s core. Combining in situ X-ray diffraction in radial geometry done at ALS beamline 12.2.2 with hydrostatic nuclear resonant inelastic X-ray scattering (NRIXS) and theoretical modeling, Gleason and Mao [32] found the shear strength of hcp iron at conditions of the Earth’s center (365 GPa, 5500 K) to be ~1 GPa, i.e., about 60% weaker than previously thought [79]. This suggests that the inner core is rheologically weak, which supports dislocation creep as the dominant creep mechanism influencing deformation. In a radial diffraction experiment, a sample is subject to a uniaxial stress field and proved perpendicular to the strong compression axis of the stress tensor using X-ray diffraction. This leads to Debye cones, which vary in diffraction angle as a function of azimuthal angle. This is best visualized by ‘unrolling’ the diffraction pattern along the azimuthal angle resulting in a plot of 2θ vs azimuthal angle χ. In an unstrained material, the diffraction lines appear as straight vertical lines of even intensity. In a strained material with finite strength, the lines become wavy (an expression of the strength) and show intensities varying with azimuthal angle (an expression of preferred orientation). Careful line analysis of the variation of 2θ with azimuthal angle allows deduction of the strength of the material. The results of this experiment extrapolated to a strength of ~8 GPa at pressures of the Earth’s core (Figure 16). In order to make this experiment relevant to the inner core, the effect of temperature on the strength of hcp iron had to be taken into account. This was done by using the known temperature dependence of the shear modulus G and propagating it to the bulk strength for a range of possible temperature scenarios. The resulting extrapolation yielded a significant reduction of bulk strength t from ~8 GPa to ~1 GPa (Figure 16), implying that the strength of hcp iron is low at inner-core conditions. This has significant implications for the sort of creep mechanisms that are responsible for the observed seismic anisotropy. Dislocation velocities can be quite high, enabled by iron’s low strengths at high temperatures, and giving support to the dislocation creep model as the dominant creep mechanism in the solid inner core.
5. Conclusions
X-ray diffraction in conjunction with the diamond anvil cell has had a strong user program at the Advanced Light Source for over a decade. This has enabled high-pressure research in a wide variety of fields, including chemistry, materials science, and geophysics. The DAC is particularly well suited for synchrotron research, as its small size, combined with the transparency of diamonds in the X-ray regime, allow for easy mounting at beamlines and for incorporation into a variety of stage designs. Technique development has enabled a wide variety of experimental conditions, in addition to the basic high-pressure conditions inherent to the DAC, in particular the application of shear and uniaxial stresses, and high-temperature conditions in a wide temperature range. The DAC program at the ALS has expanded in recent years, giving users access to three beamlines with different measurement techniques and capabilities. Further development will focus on increasing the variety of single crystal DAC capabilities at the ALS, and on increasing the user friendliness of already existing techniques.
Acknowledgments
This research used resources of the Advanced Light Source, which is a Department of Energy Office of Science User Facility under contract no. DE-AC02-05CH11231.
Conflicts of Interest
The authors declare no conflict of interest.
Appendix A. X-ray Diffraction
Much has been written about the science behind X-ray diffraction, the physical meaning of X-ray diffraction data, and data collection and interpretation strategies [80,81,82,83,84,85,86,87,88]. Here we present a brief overview of the major topics in the field for readers who are unfamiliar with the technique.
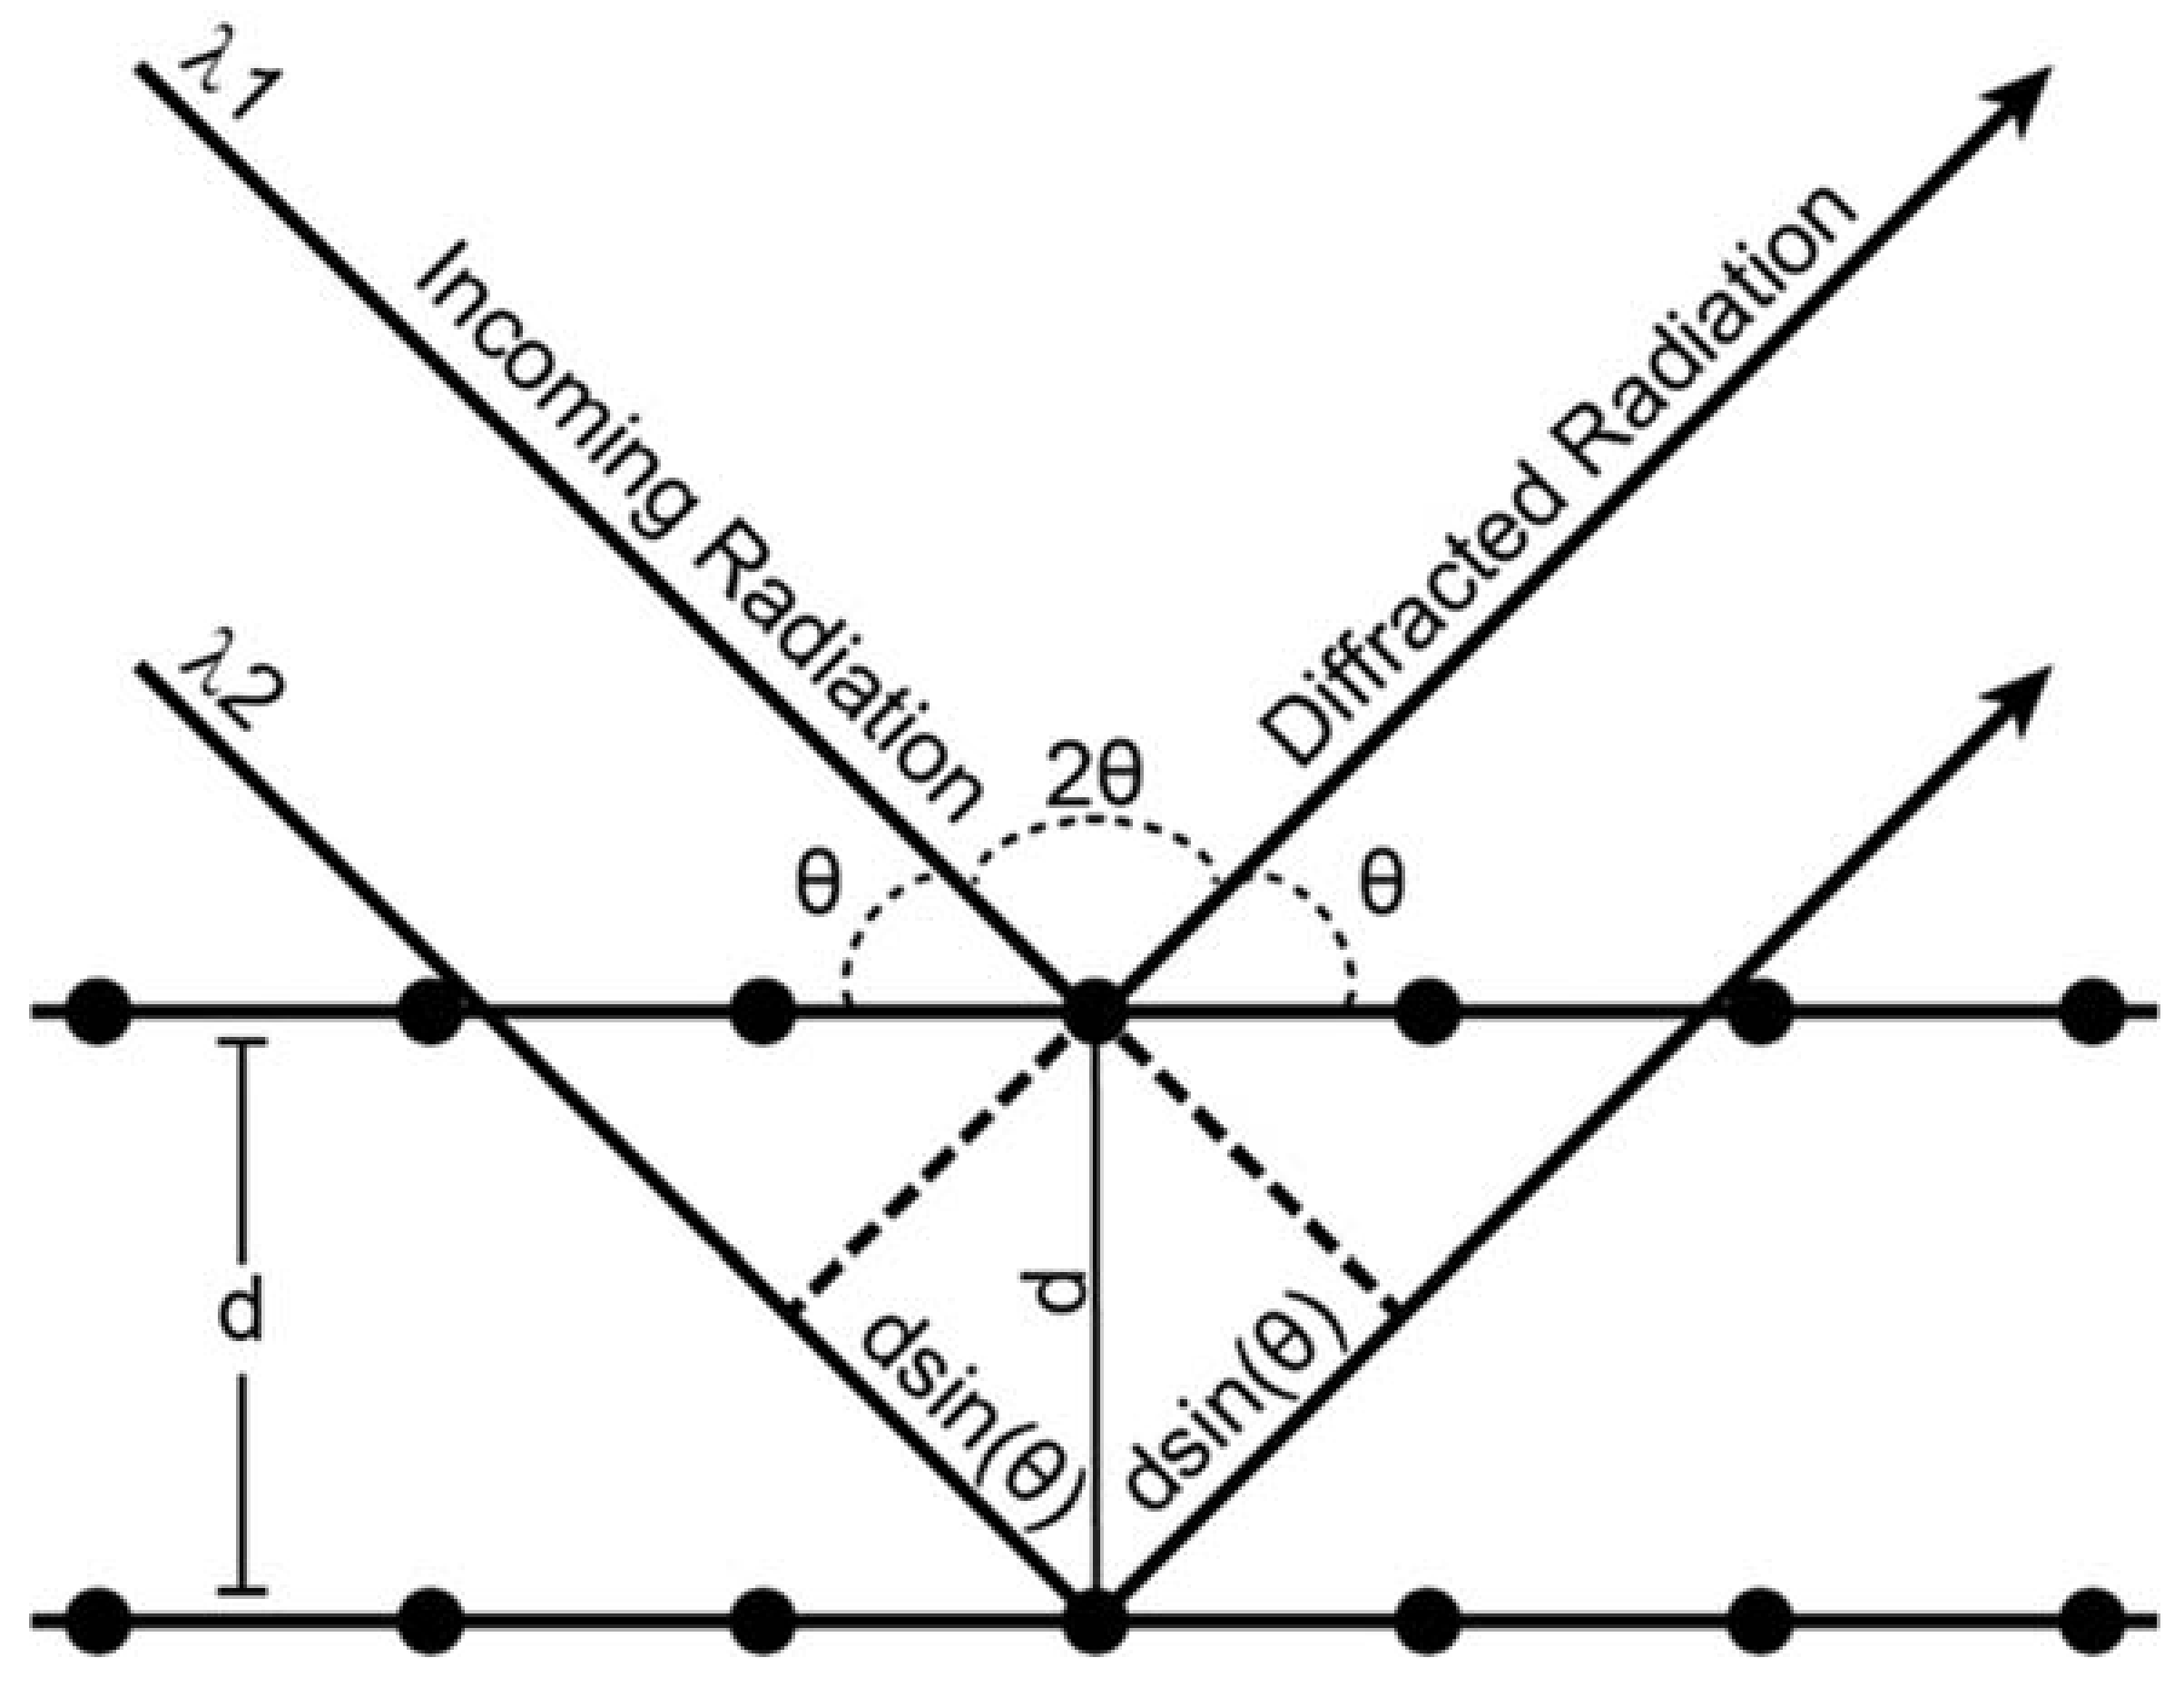
X-ray diffraction is an analytical process that provides information about crystal structure of a material. Effectively, a crystal is composed of many identical prisms (unit cells) that are stacked together in a repeating array, and each of those prisms contains atoms or molecules that are arranged in a way that can be mathematically described. Conventionally, unit cells could only possess 1,2,3,4 or 6-fold symmetry, and consequently their shape could be described uniquely using three edges (a, b, c, the lattice parameters) and three angles (α, β, γ, the lattice angles). The presence or absence of different types of symmetry elements (rotation, translation, inversion, glide planes, screw axes) defines the positions of atoms within a unit cell relative to one another. As mentioned above, X-ray diffraction is a technique whose value lies in the fact that the wavelength of X-rays is on the atomic size scale, which allows X-rays to be good probes for crystalline solid materials. Essentially, a crystalline material will coherently diffract when the distance between crystal lattice planes fulfills Bragg’s law:
where n is an integer, λ is the wavelength, dhkl is the interplanar distance of plane hkl, and θ is the angle of the diffracted beam relative to the crystal lattice plane (Figure A1). Here, h, k, and l are referred to as the Miller indices, and can be thought of as the number of times a particular plane cuts through a given edge of the unit cell. For instance, a plane whose Miller index is (100) intersects the a axis of the unit cell once, e.g., (100) is the bc plane of the unit cell, and d100 = a. A diffraction experiment occurs when any combination of λ, d, or θ is varied. The d spacing is then calculated from the observed data. Luckily, it is also mathematically related to the unit cell through the general expression:
where m, n, and o can be represented by:
Figure A1.
Schematic representation of Bragg’s law conditions.
The relationship between the d spacing, Miller indices, and the lattice parameters and angles becomes significantly simplified once symmetry considerations are taken into effect. For instance, in a cubic unit cell a = b = c and α = β = γ = 90°, and the d spacing expression described above simplifies to:
The purpose of a diffraction experiment is in essence the determination of the spatial arrangement of atoms in a crystal. This spatial arrangement can either be matched with those found in a database of known crystal structures (phase identification) or refined entirely (structure solution). Once the arrangement of atoms is obtained, information such as crystal orientation and any deviation from its ideal atomic arrangement (crystal deformation) can be determined, making X-ray diffraction a powerful tool to measure grain orientation, strain, and defect density in a sample. In order to obtain the 3-D arrangement of atoms in a crystal, however, it is clear that multiple diffraction peaks from multiple sets of equivalent atomic planes should be collected. There are several ways to bring these atomic planes into diffracting Bragg conditions, classifying the different techniques that can be used to perform a diffraction experiment.
In single crystal X-ray diffraction, the crystal is rotated (change in θ) within the beam to fulfill Bragg condition for a number of reflections. This technique typically requires a large enough isolated single crystal to be mounted on a goniometer with its center of rotation aligned with the X-ray beam. This is the technique of choice for structure solution and structure refinement, i.e.: determining the crystal structure of an unknown phase. In powder diffraction, the Bragg condition is fulfilled statistically and simultaneously for a number of atomic planes from a large number of randomly oriented crystals. Cones of diffraction, each originating from particular set of atomic planes, emanate from the sample. Collected on a 2-D area detector, the diffraction patterns therefore consist in set of rings representing the intersection of these cones with the plane of the detector (and thus are conics). Powder diffraction is typically used for phase identification, but also to measure deformation and structure solution for cases when a single crystal is not available. In Laue (or polychromatic) X-ray diffraction, the Bragg condition is satisfied simultaneously for many atomic planes by shining a polychromatic (range of λ) rather than a monochromatic (single λ) radiation onto the sample sitting at a fixed angle θ. Laue diffraction is typically used for obtaining the orientation of a crystal, but in recent years was also employed for measuring strain and structure solution. In a final method, called energy dispersive or pseudo-Laue diffraction, the Bragg condition for multiple reflections is obtained by varying the incident beam wavelength by rotating a monochromator [89].
All diffraction experiments typically proceed in the following manner. When working with an unknown sample, the sample-to-detector geometry must first be calibrated by performing an experiment on a well-defined sample, with known scattering values and known unit cell and atomic positions, such as Si, LaB6, CeO2, or similar, but the manner in which the experiment proceeds is the same for both a well-characterized and an unknown sample. Data is collected, typically through the use of a digital area detector such an X-ray charge coupled device (CCD), a pixel detector or an imaging plate, rather than a point detector or a photographic film. Then, a process called indexation occurs, where the shape of the unit cell is determined based on the angular relationships between the observed peaks (also referred to as reflections). This procedure may be greatly simplified if the experimenter has some idea of the expected unit cell type, or there are models from literature. After indexation, or peak identification, data processing diverges based on the type of diffraction experiment that is being performed. In the case of a calibrant, any deviations from the known model are attributed to the sample-to-detector geometry (assuming a known energy or energy range), and any refinements are performed to minimize geometry factors rather than unit cell or atomic positions.
Data reduction in single crystal diffraction, commonly known as integration, is the process of determining the intensity of each indexed reflection from the image data, as intensities carry information on the crystal unit cell decoration (i.e., the location, species and occupancy of atoms within the unit cell). The integrated intensities typically need to be corrected from various intensity dimming and altering effects such as the geometrical Lorentz factor, the X-ray beam polarization, and sample and environment absorption. The integrated intensities Ihkl are directly proportional to the squared modulus of the structure factors Fhkl:
where N is the number of atoms in the unit cell, fj is the atomic form factor and xj, yj, zj are the atomic coordinates inside the unit cell for atom j. The structure factor is a complex number and its phase information is lost in the modulus. There are several methods to solve this inherent “phase problem”, the description of which is beyond the scope of the present review. The Fourier transform of the structure factor provides the electron density function, which allows the determination of the atomic location and species within the unit cell and an initial structure in a process called structure solution. Once a solution is found, least squares structure refinement is performed by minimizing the differences, Δ, between the observed intensities and intensities calculated from the initial structure:
where and are the observed and calculated structure factor moduli, respectively, and the summations are over all observed reflections. In most single crystal structure refinement programs, refinement is done on F2 values, to reduce bias, and to allow the inclusion of weak reflections. Single crystal X-ray diffraction is the technique most commonly associated with X-ray crystallography.
In a powder diffraction experiment, the easiest first order application after indexing is calculating the unit cell volume, which is important in high-pressure experiments for determining properties such as the material compressibility. This can be done simply through a least squares refinement based on a number of identified peaks, or can be calculated in a more sophisticated manner through a refinement process such as a Le Bail refinement [90]. In a Le Bail refinement, the peak positions are used to determine unit cell dimensions while disregarding the relative peak intensities. In a further step, called a Rietveld refinement, the peak positions, peak profile shapes, and intensities can be used in combination with one another to model the atomic structure of the diffracting crystal, as well as other quantities such as strain [91]. It is important to note that this is merely a model, and not a solution; effectively the process refines a model to match the data as closely as possible. Distortions of the diffraction rings and their broadening can be used to estimate macroscopic and microscopic strains in the sample as well as the average coherently diffracting domain size. Incomplete rings denote texture and preferred orientation. A few textured patterns collected at different sample tilt angles are usually sufficient to determine the sample pole figure of preferred orientations [87]. Powder diffraction is most commonly used to identify phases by comparing peak positions and intensities with those calculated from a database of crystal structures such as the Inorganic Crystal Structure Database (ICSD) or the Cambridge Structural Database (CSD).
In the case of a Laue diffraction experiment, the indexation is used to determine the orientation of the unit cell with respect to the experimental geometry. The crystal structure is usually known but the crystal orientation is unknown and determined by refinement from the experimentally observed Laue reflection positions [59,92,93]. The strain tensor can be determined as well. Laue diffraction is insensitive to hydrostatic volume expansions; however, it is sensitive to deformations (shear) of the unit cell. By comparing to an undeformed unit cell, the deformation, or deviatoric strain tensor, can be calculated from the diffraction pattern directly. The full strain tensor can be determined by measuring the energy of one reflection providing the dilatational component of the strain tensor. Material plasticity can also be investigated by measuring the broadening of Laue reflections [59,94].
Clearly, the above is a very brief overview of the applications of diffraction. In principle, all data from every angle (or at every wavelength) would be collected to gain a complete picture of all diffraction from a particular sample. In reality, there are many complicating factors to both performing diffraction experiments and effectively processing the data. In the next section, we discuss the most glaring problem in high-pressure research: that all experiments must be performed in a high-pressure device, which cuts off access to the majority of diffracting peaks. Additionally, the absorption of many photons by the diamonds, and possibly by the backing plates, can lead to unusual absorption corrections and backgrounds, which further complicate data processing, particularly when atomic positions are being calculated.
Appendix B. The Diamond Anvil Cell
The diamond anvil cell (DAC) is one of the most common and versatile high-pressure devices available today. It is an opposed-anvil device that uses two flat diamonds to apply pressure to a sample. The first DAC design was reported by Weir et al. [95], but the design of the device has evolved continuously in the succeeding decades. William A. Bassett wrote a comprehensive review of the history of the DAC on the occasion of its 50th anniversary [96]. Briefly, opposed anvil devices such as piston-cylinder presses had been used to generate pressures of a few GPa prior to the invention of the DAC; however, the DAC was revolutionary in being able to produce Mbar pressures in a small hand-held device. The DAC is particularly useful because diamonds are transparent to a wide range of the electromagnetic spectrum. Consequently, they allow the user to perform a wide range of experiments, namely spectroscopy such as infrared (IR), Raman or Mössbauer, magnetization measurements (e.g., superconductive quantum interference device measurements [97]), single and powder X-ray diffraction and pair-distribution function measurements; this has been written about at length, for instance see Refs. [98,99,100,101]. The type of DAC used is heavily dictated by the type of experimental application. Here, we will focus on designs applicable to single and powder X-ray diffraction, in both the axial and the radial direction.
Appendix B.1. DAC Assembly
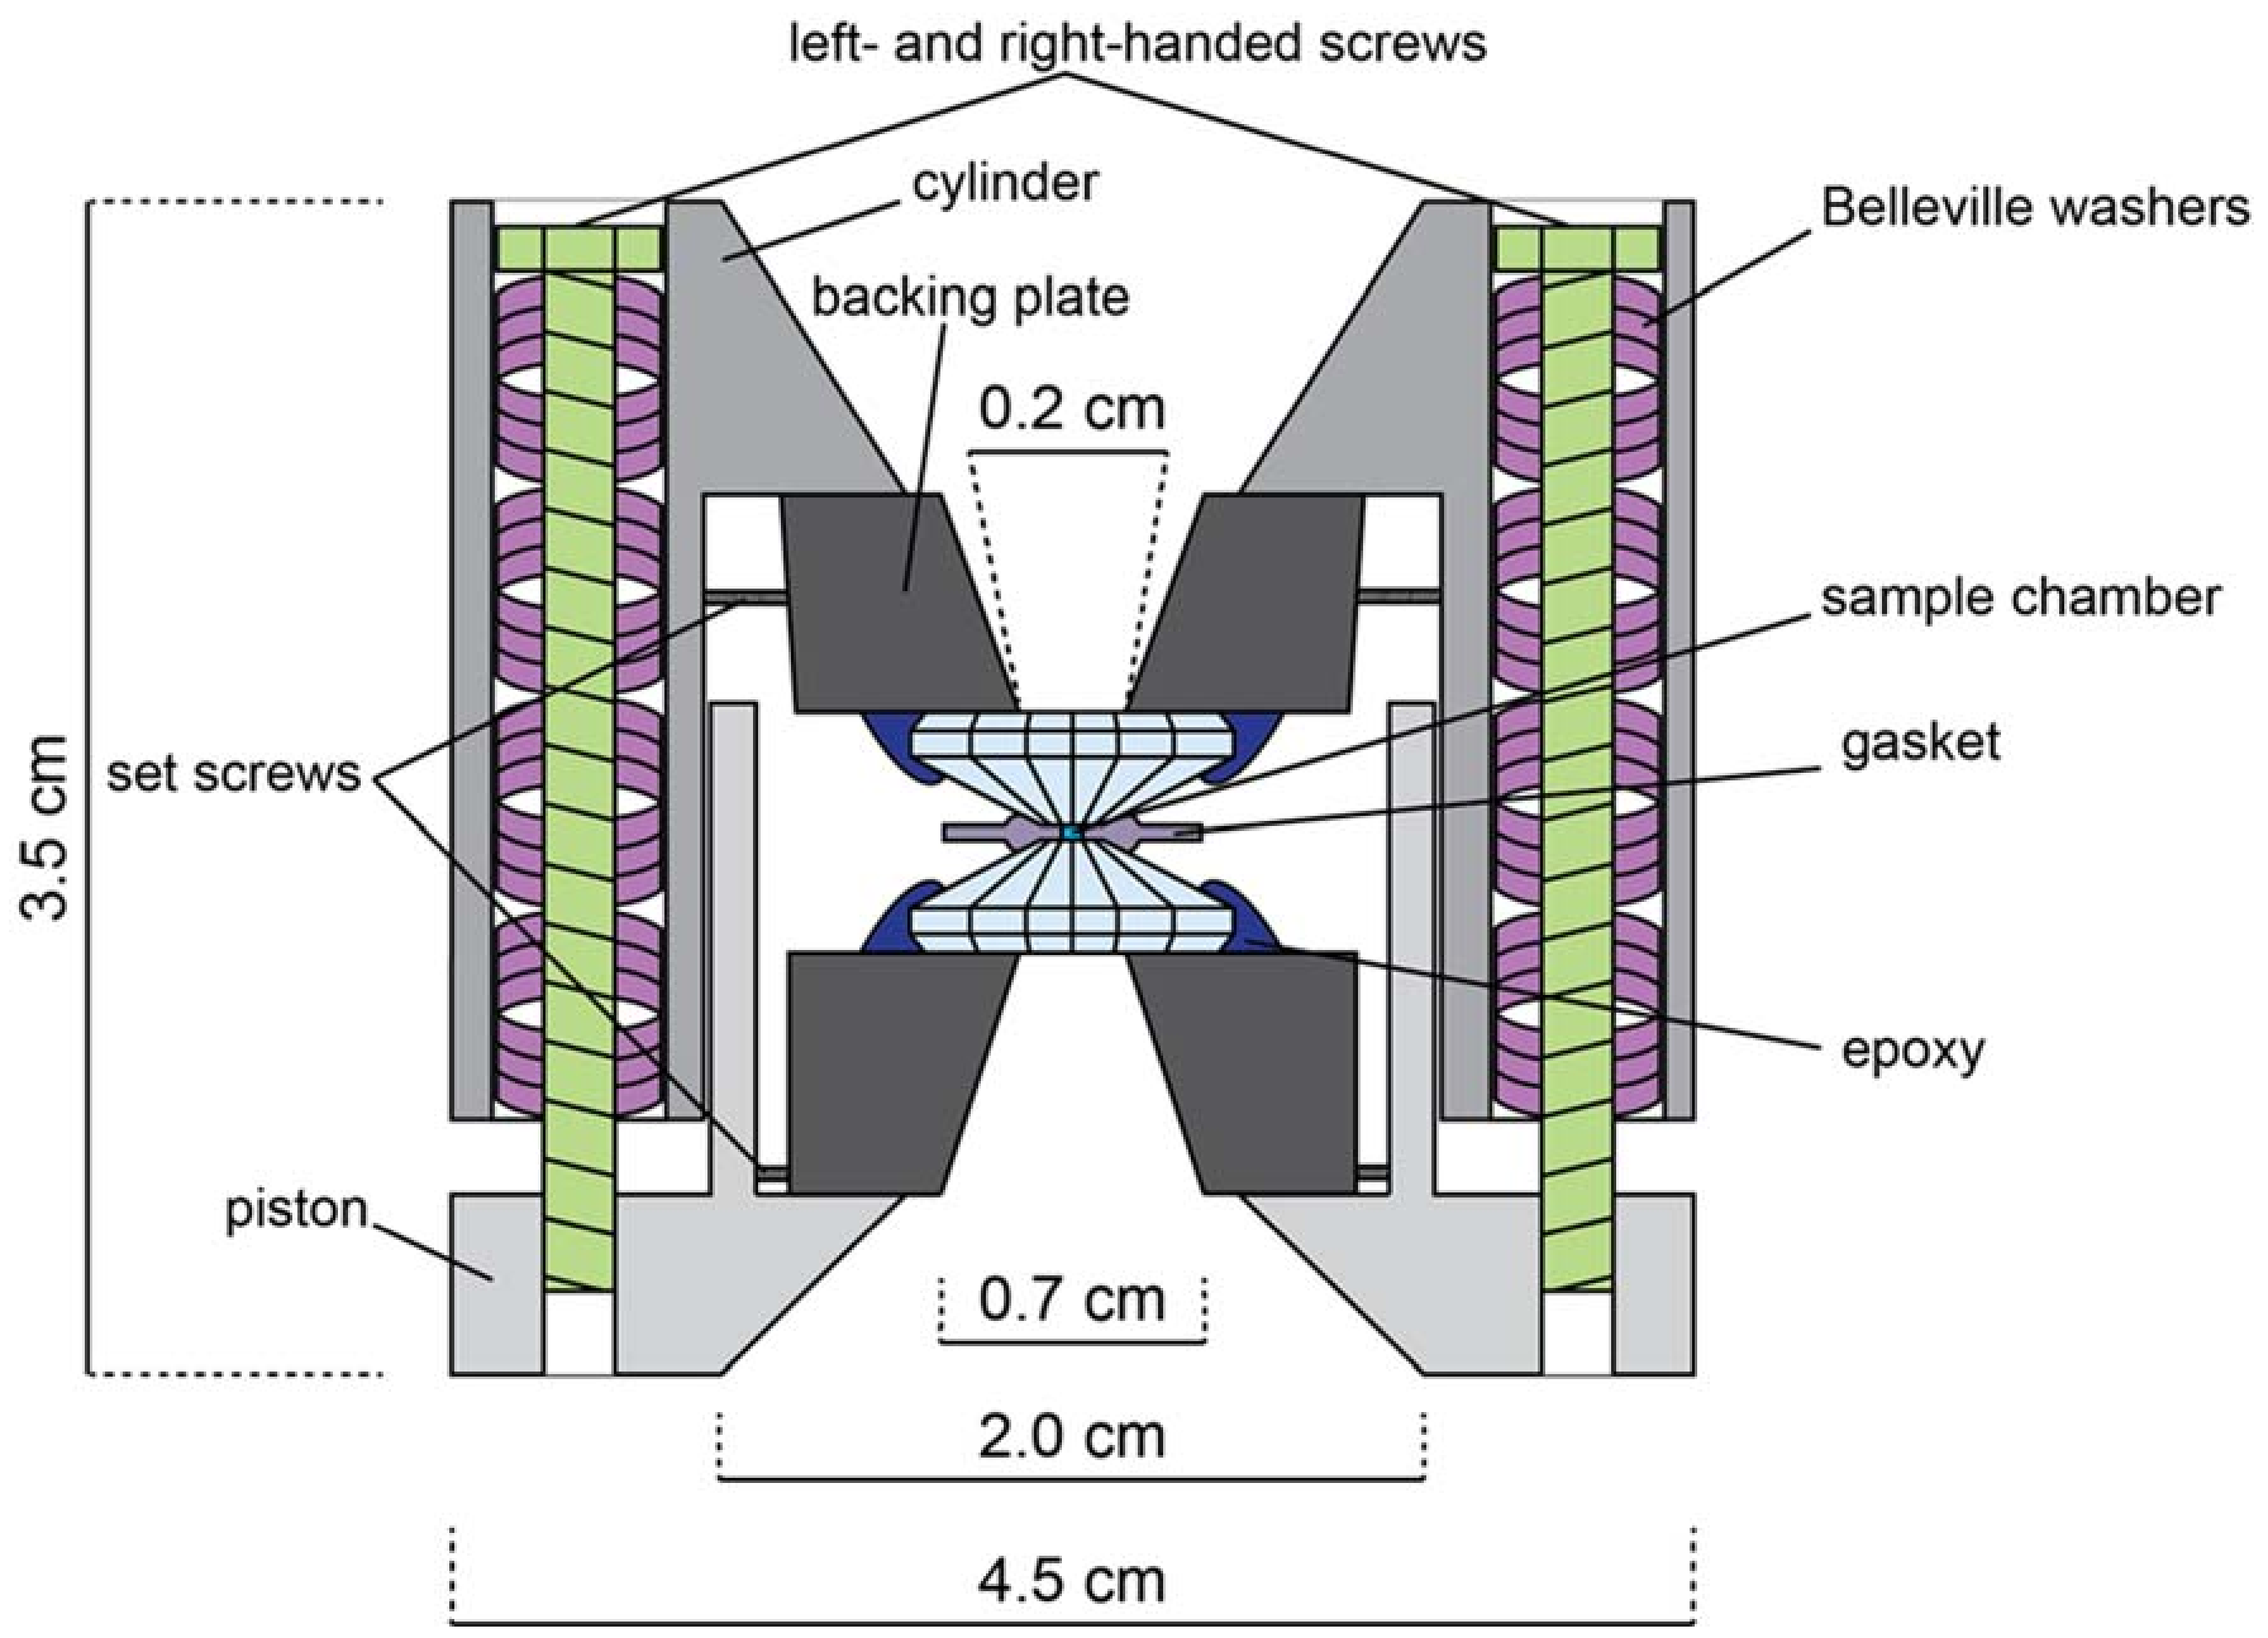
As mentioned above, the DAC is an opposed-anvil device. A typical symmetric DAC might look like the one in Figure A2. A procedure for a typical DAC assembly suitable for diffraction is outlined as follows. Natural or synthetic gem-quality diamonds (~1/4 to 1.2 carat) are attached to rigid backing plates (seats) and aligned in a piston-cylinder device such that their opposed faced (culets) are parallel and overlap precisely. The sample may or may not be embedded in a pressure-transmitting medium (depending on experimental goals) and is placed on the culet surface. A confining ring (gasket) is placed around the sample/pressure medium to prevent sample extrusion due to pressure increase. The opposing diamond anvil is then placed on top to close the cell, and pressure is provided by driving the anvils together with one of a variety of mechanisms depending on the particular DAC design. Two pairs of screws are used in the assembly presented in Figure A2, but depending on experimental requirements the number and type of screws might vary, or something such as a membrane cell might be used instead to drive the piston and cylinder together. The sample is then probed either axially (e.g., through the diamonds) or radially (e.g., through the gasket). In addition to the symmetric DAC, which is best suited for powder diffraction, there are other types of DAC designs routinely employed at the Advanced Light Source (ALS), namely the BX90- [54] and Merrill-Bassett-type [55] cells, which can be used for both powder and single-crystal diffraction. The symmetric cell allows for pressures in excess of 100 GPa, BX90 cells allow pressures up to 100 GPa, and Merrill-Bassett cells are usually only suitable below 20 GPa.
Figure A2.
Schematic illustration of a symmetric, Princeton-type diamond anvil cell (not to scale). Opening angle is 50°–90°. Both left and right-handed screws are used to prevent torque of the cell body. Belleville washers act as dampening springs when tightening the cell.
Figure A2.
Schematic illustration of a symmetric, Princeton-type diamond anvil cell (not to scale). Opening angle is 50°–90°. Both left and right-handed screws are used to prevent torque of the cell body. Belleville washers act as dampening springs when tightening the cell.
Diamond sizes vary, with culet sizes between ~800–100 μm typically employed at the ALS. In some cases, two-staged beveled designs are used, with an outer culet of larger diameter, and inner culet of smaller diameter; this design allows for higher experimental pressures compared to a non-beveled design. There are several different diamond cuts in common use, although modified brilliant cut diamonds are the most common. Alignment of the diamonds must be done as carefully as possible, with the two opposing anvils precisely aligned and parallel to one another. Otherwise, cracks can develop, leading to diamond and (more importantly) experimental failure. In some cases, other materials can be used as anvils as well. For instance, SiC is sometimes chosen because it can more cheaply be manufactured as large single crystals, and its vibrational spectrum overlaps different regions from that of diamond, allowing for different types of experiments than what may be possible with a diamond anvil [102].
Diamond backing plates are chosen based on the pressure range desired and experiment type. Typically, these are made out of steel, tungsten carbide, or cubic boron nitride. In the case of axial experiments, the backing plate design becomes crucial, as its angular opening will dictate the available Q range of the experiment, where:
In fact, restrictions on angular access represent the bane of all axial diffraction experiments, and accounting for this prior to light ever touching a sample can be the difference between a successful and a failed experiment. Of course, the angular access will also be affected by the combined height of the backing plates and the diamonds. Recent design changes in diamond design have mitigated this somewhat; for instance, Almax (Almax easyLab Inc., Cambridge, MA, USA) has recently developed a design where the diamond is receded significantly into the seats, enabling an opening angle of up to 120° at the time of this publication (the Diacell® One2DAC) [103].
In the case of radial experiments, where the light impinges onto the sample perpendicularly to the compressional direction of the DAC, the angular opening of interest is that cut into the side of piston-cylinder assembly of the DAC. There are specific types of DACs constructed for this type of experiment, namely panoramic DACs such as the Almax Diacell® PanoramicDAC. For instance, in the Almax design, the body of the DAC has three 75° azimuthal openings, allowing access to 225° (out of 360° total) worth of the azimuthal (e.g., radial) diffraction of the cell. Of course, other manufacturers might have other specifications, and groups have been known to design and machine their own DACs depending on their experimental requirements.
Another consideration is the selection of a gasket material, which must be made in such a manner as to inhibit significant plastic flow during the pressure experiment. In the case of a radial experiment, this material must also be X-ray transparent. Typically, a gasket of greater thickness than desired is preindented between the diamonds, allowing excess material to flow outward. This creates a sort of cup, which serves several purposes: it provides a measure of stability to the diamond tips while the experiment is conducted, and it creates a sort of barrier to further outward flow. A hole is then drilled in the center of the preindented region, creating the gasket. The hole size to culet ratio is dependent on the type of experimental loading desired, which is discussed in greater detail below. Usually in axial experiments, the gasket is made out of rhenium, steel, Inconel, or another metal, due to their stability and the ease with which they can be preindented. In the case of radial experiments, the gasket must be X-ray transparent, and typically some kind of epoxy material or Be is used. These suffer from brittleness, making axial experiments particularly tricky.
Two more aspects need to be considered before a sample can finally be assembled: the pressure medium (or lack thereof) and the pressure standard. Pressure media are used to provide hydrostatic stress distribution around the sample, since the DAC is otherwise a uniaxial pressure device. Several types of pressure media exist; these can broadly be divided into solids, liquids, and gasses. Solids such as NaCl or KCl are chosen because they are very soft (low bulk modulus), and so behave much more plastically than the sample. They are particularly useful as they can ensure physical separation between the diamond and the sample. This is helpful in the case of high-temperature experiments, as diamonds are good thermal conductors whereas salts are not. The physical separation between the sample and the diamond then allows the sample to heat up more successfully than if the sample is sitting directly on the diamond. Klotz et al. [104] compared the hydrostatic properties of a variety of common liquid and gaseous pressure media and found that at pressures below 10 GPa, methanol:ethanol mixtures perform extremely well, as they remain liquid (e.g., cannot shear). Above those pressures, Ne or He perform best. Although He shows the least amount of non-hydrostatic deviation, it has been found to lead to more diamond failures when used in high-temperature experiments. It is possible that its small atomic size allows it to penetrate incipient cracks more easily than a larger atom like Ne might.
Figure A3.
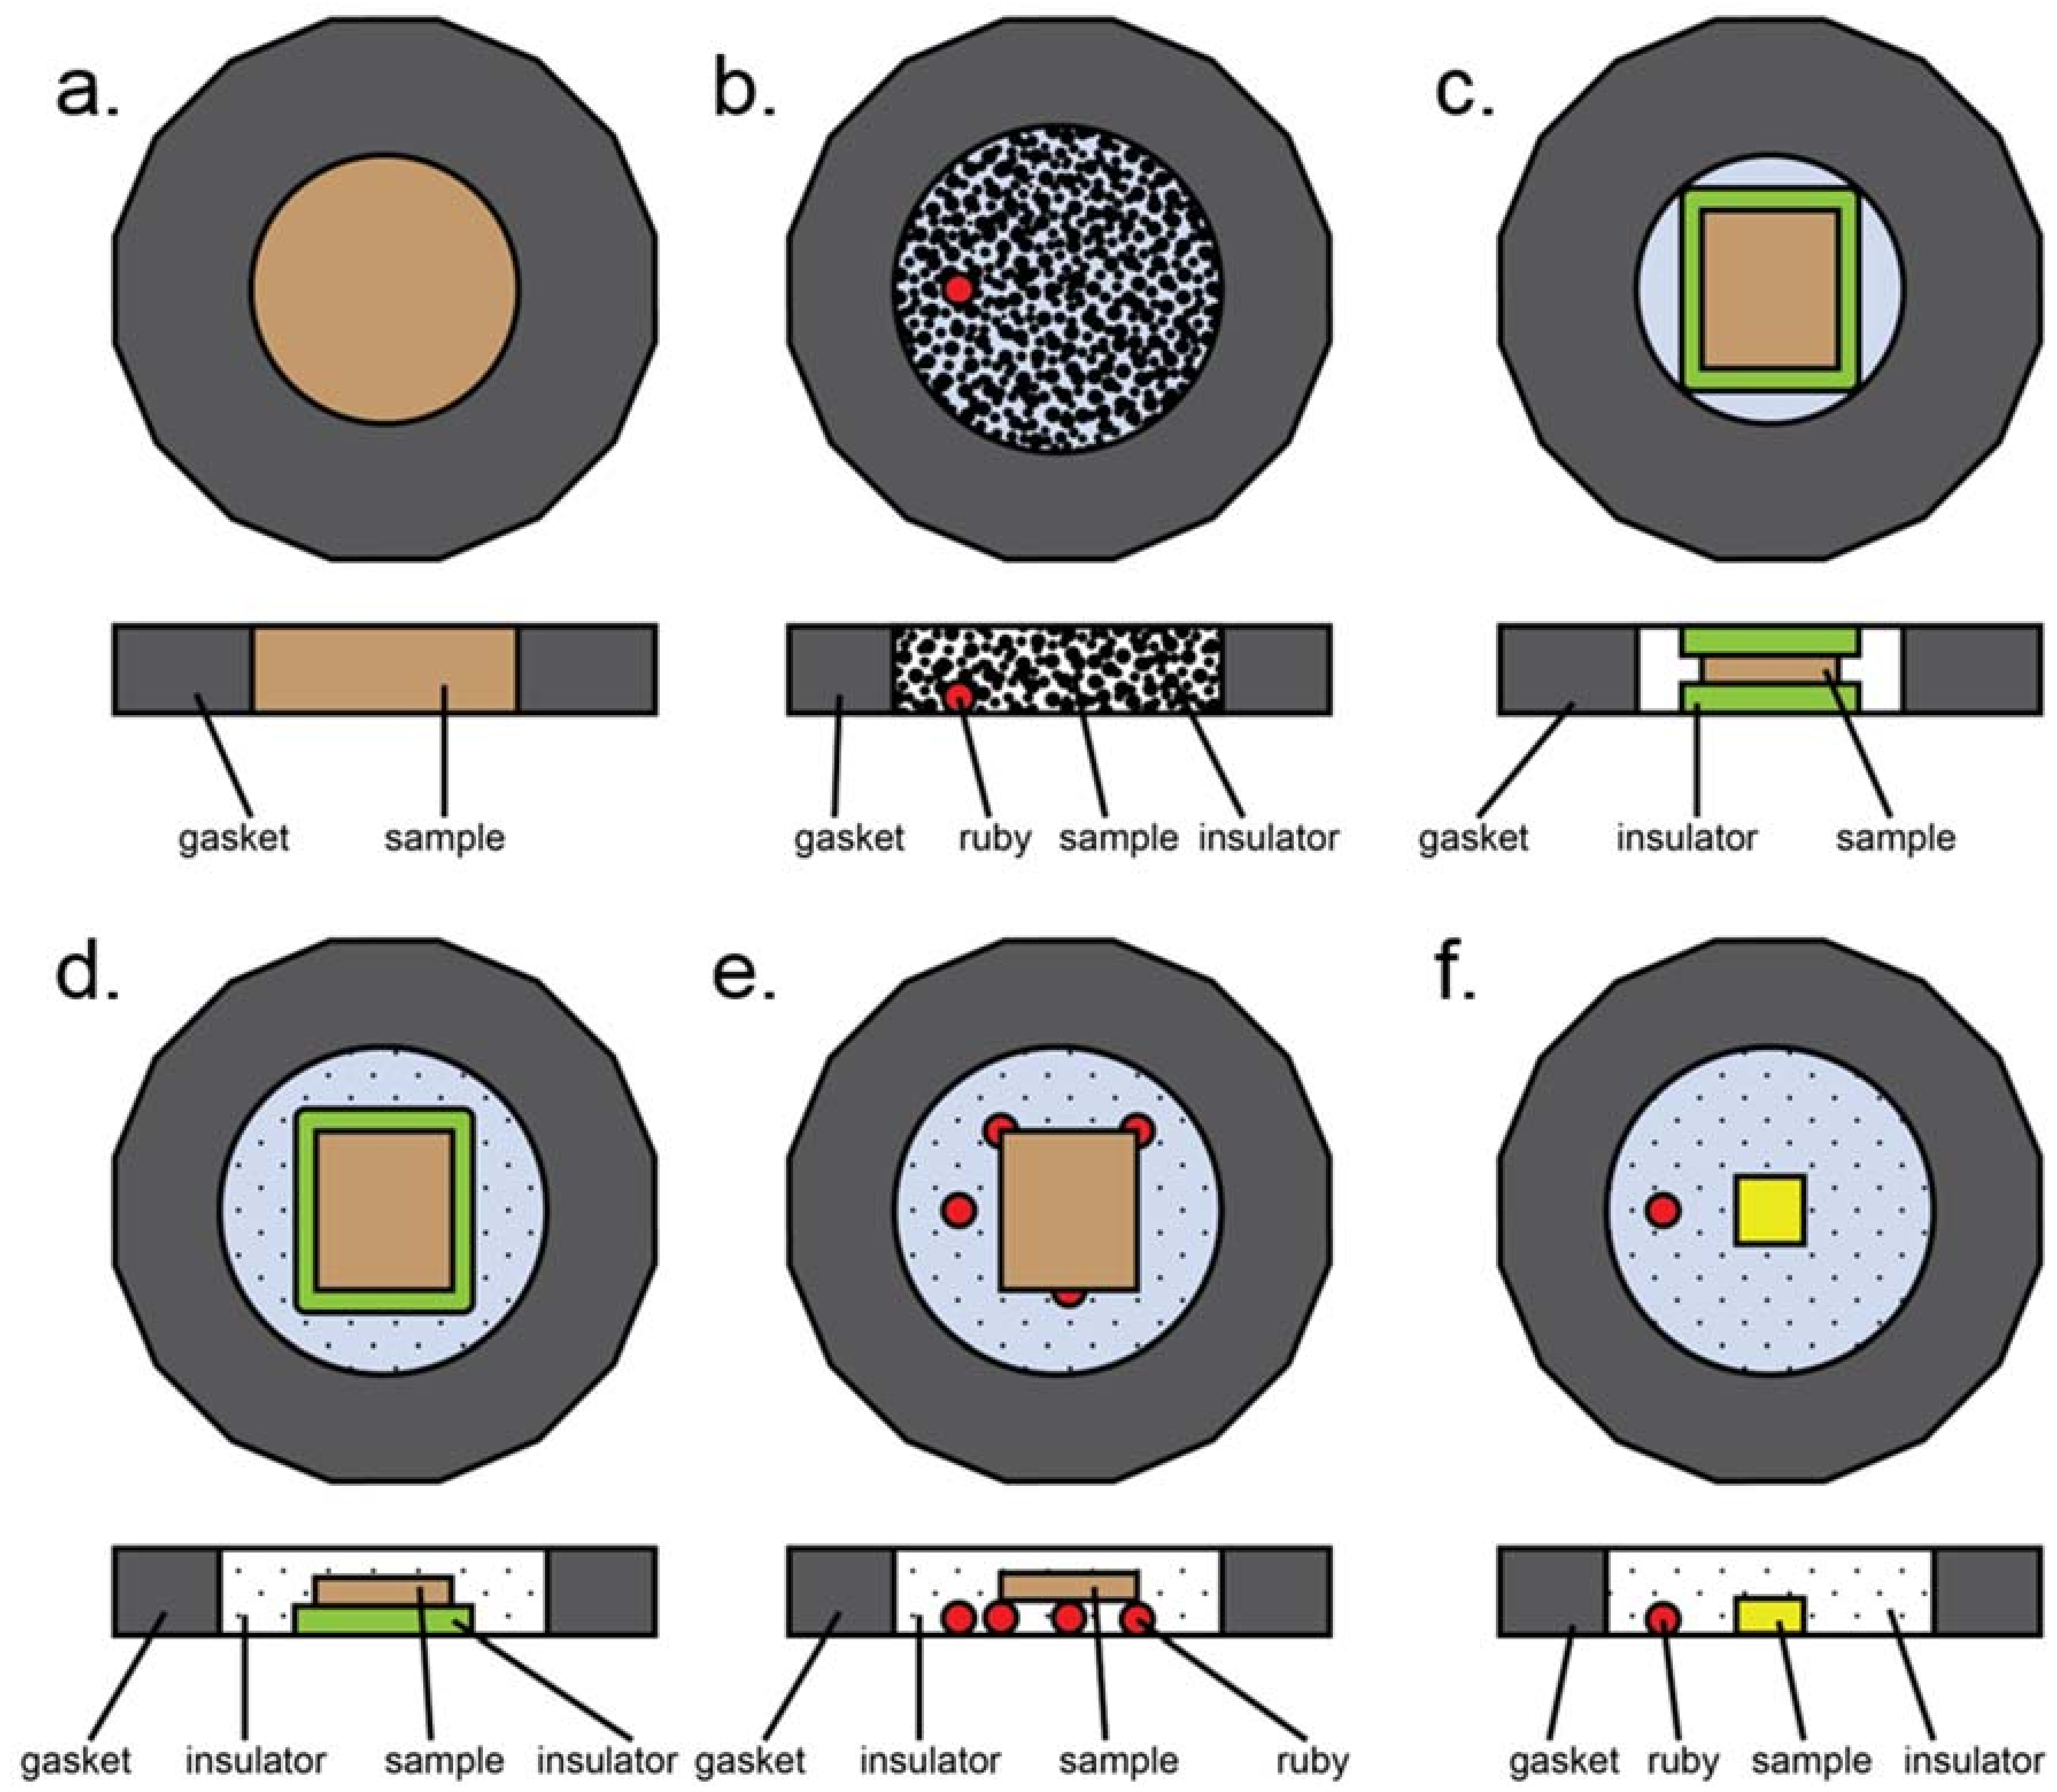
Most common loading styles in a typical diamond anvil cell experiment. Here, insulation refers to both thermal insulation and pressure media. (a) All powder sample, no insulation. (b) Loosely packed, dispersed powder. Insulation can be solid (ground in with sample), liquid, or gaseous. Ruby may be present for pressure determination. (c) Solid insulation sandwich with compacted powdered sample in the middle. Note that gasket hole is smaller than in the case of gaseous or liquid insulation due to smaller volumetric collapse upon loading. (d) Half sandwich insulation: solid layer of insulation on the bottom, compacted powder on top, gaseous or liquid insulation surrounding the assembly. (e) Compacted powder sample placed upon a tripod of other material to provide physical separation from diamonds. Rubies, sample, or glassy material may be used to form the tripod. (f) Small single crystal sample surrounded by gaseous or liquid insulator. Ruby is present for pressure measurements.
Figure A3.
Most common loading styles in a typical diamond anvil cell experiment. Here, insulation refers to both thermal insulation and pressure media. (a) All powder sample, no insulation. (b) Loosely packed, dispersed powder. Insulation can be solid (ground in with sample), liquid, or gaseous. Ruby may be present for pressure determination. (c) Solid insulation sandwich with compacted powdered sample in the middle. Note that gasket hole is smaller than in the case of gaseous or liquid insulation due to smaller volumetric collapse upon loading. (d) Half sandwich insulation: solid layer of insulation on the bottom, compacted powder on top, gaseous or liquid insulation surrounding the assembly. (e) Compacted powder sample placed upon a tripod of other material to provide physical separation from diamonds. Rubies, sample, or glassy material may be used to form the tripod. (f) Small single crystal sample surrounded by gaseous or liquid insulator. Ruby is present for pressure measurements.

Several different sample assemblies are schematically presented in Figure A3. This is not an exhaustive list, but does contain most of the common sample loading configurations. The most basic experiment involves a powder sample occupying the entire sample chamber (Figure A3a). This configuration was used in early pressure experiments, can be used for plastic deformation (e.g., Kaercher et al. [105]), and has also been used to prepare samples for nuclear resonance experiments. A variation of this involves loose, unpacked sample placed within a gasket hole which is then filled with either liquid or solid pressure medium (Figure A3b). This type of loading is useful for instance if a sample is highly anisotropic under differential strain [106], as this allows as many grains as possible to be surrounded by pressure media. In the case of a heating experiment, solid pressure media may be used to form a sandwich (Figure A3c); if this case is too non-hydrostatic, an open-faced configuration may also be used where both solid and gaseous or liquid media are employed to ensure better hydrostaticity (Figure A3d). The second case, however, runs the risk of the sample touching the upper diamond, depending on the combined thicknesses of the compacted sample and insulator relative to the gasket thickness. Physical separation from the diamond can also be achieved by means of a tripod, which can be made of rubies as in Figure A3e, or of small flakes of the sample or other materials that are known not to react with the sample during the experiment, but this loading suffers from the same problems as A3d. Finally, in the case of single crystal diffraction, a small single crystal is usually mounted directly onto the diamond and surrounded by either gaseous or liquid pressure media (Figure A3f).
One thing to note is that the gasket hole size varies depending on the loading. In the case of a gaseous or liquid pressure medium, the volume collapse upon compression can be quite large as the medium undergoes gas-to-liquid-to-solid phase transitions. This contraction generally leads to gasket instability and collapse. However, the gasket collapse is a known fact and can therefore be anticipated and planned for. One caveat is that the following is somewhat anecdotal, based on our experiences preparing these experiments successfully. We usually find that in the case of gasses or liquids, the gasket hole should be larger than in the case of a solid pressure medium. Generally, we have found that a hole 55–75% the diameter of the culet works well for liquids and gasses, and a 33–50% sized hole works well for solids. Since the solid pressure media will also be relatively soft, the gasket hole is expected to collapse somewhat in all cases, and the sample size should be smaller than the gasket hole regardless (the only exception being the loading in Figure A3a, where there is nothing but sample). Typically, we expect about a 1/3 diameter collapse from gas loading. In the case of a single crystal (Figure A3f), the sample should be significantly smaller than the gasket hole diameter.
Appendix B.2. Pressure Determination
Pressure standards of some sort are employed in all high-pressure experiments. Pressure determination is crucial for any experiment where the results are intended to be comparable to other studies. A good pressure calibrant is a material with a well-characterized pressure behavior and which does not undergo phase transitions in the pressure region of interest. In some cases, pressure media can also act as pressure standards. Indeed, diffraction pressure scales have been devised and are commonly used for NaCl and Ne (see e.g., Fei et al. [107]). A distinct pressure calibrant can also be used. Generally, pressure standards can take several forms, but commonly fall under the categories of either optical or diffraction sensors. Among optical sensors, the two most popular ones are the Raman edge of diamond (at pressures exceeding 20 GPa [108,109]) and the ruby fluorescence scale [110,111]. Diffraction standards include pressure media as mentioned above, materials such as MgO, and several metals [107,112,113,114,115].
Absolute pressure is difficult to measure; it requires knowledge of material density or volume concurrent with precise knowledge of pressure or compressibility in order to accurately determine an equation of state. Most pressure standards are derived from shock compression experiments, where shock and particle velocity measurements can constrain internal energy, pressure, and volume. Adiabatic shock compression is used to determine the 0 K isothermal compressibility of a material. Since the thermal expansion at 300 K is small compared to the compression applied in most DAC experiments, the 0 K and 300 K compression curves are assumed to be roughly equivalent [116]. An in-depth discussion of the methodology of shock experiments can be found in [116,117]. A second approach is to use ultrasonic interferometry or Brillouin scattering combined with density measurements to determine the elastic properties of materials [118], but these measurements prove difficult to perform at very high pressures and the equations of state cannot accurately be extrapolated beyond the range of the measurement. Otherwise, standards may be derived from direct comparison to one or more known shock standards [113].
The ruby fluorescence scale is a commonly used optical pressure scale [110,119,120,121]. A laser is used to excite the R1-R2 fluorescence bands of ruby (Cr-doped Al2O3), whose frequency shift has been determined as a function of pressure. Broadening and merging of the bands is an easy indicator of non-hydrostatic stress. One big advantage of this technique is that it requires a basic laser system setup, and so can be inexpensively implemented compared to other pressure determination methods. Another is that ruby does not undergo a phase transition at room temperature until pressures above 100 GPa [122,123].
For many diffraction experiments, pressure is typically determined using the equation of state of a simple cubic material such as MgO, Au, Pt, NaCl etc. Using the experimentally determined unit cell volume, the pressure can be derived using an empirical equation of state. One common approach is to use a mathematical expansion of the Eulerian strain (where the final, observed state, is a reference) to derive a pressure-volume relationship. The most commonly used is the third-order Birch-Murnaghan equation of state [124]:
where P is pressure, K is the bulk modulus, K′ is the pressure derivative of the bulk modulus, V is the unit cell volume, and the subscript 0 refers to ambient pressure. However, as Angel in [125], page 35 notes, “there is no absolute thermodynamic basis for specifying the correct form of the equation of state for solids”. Consequently, one can find many other pressure formulations, which are based on different assumptions about the relationship between volume and pressure in a compression experiment. This can lead to challenges in the intercomparison of experimental works, as different groups will employ different equation of state formulations and different empirically determined K and K′ values in their work.

Table A1.
Static compression beamlines in operation at the date of publication. XRD = X-ray diffraction. XRF = X-ray fluorescence. HPD: high-pressure device. DAC = diamond anvil cell. LVP = large volume press. PEP = Paris-Edinburgh press [126]. a. Available for commissioning only.
Table A1.
Static compression beamlines in operation at the date of publication. XRD = X-ray diffraction. XRF = X-ray fluorescence. HPD: high-pressure device. DAC = diamond anvil cell. LVP = large volume press. PEP = Paris-Edinburgh press [126]. a. Available for commissioning only.
| Synchrotron | Location | Beamlines | Technique | HPD | Energy |
|---|---|---|---|---|---|
| ALBA | Cerdanyola del Vallès, Barcelona, Spain | BL04 (MSPD) | Powder XRD | DAC | 8 – 50 keV |
| ALS [2] | Berkeley, CA, USA | 11.3.1 | Single crystal XRD | DAC | 6 – 18 keV |
| 12.2.2 | Single crystal XRD Powder XRD | DAC | 6 – 40 keV | ||
| 12.3.2 | Laue XRD Powder XRD XRF | DAC | 6 – 22 keV | ||
| APS [3] | Argonne, IL, USA | 3-ID-B,C,D | Nuclear resonant inelastic X-Ray scattering High energy resonant inelastic X-Ray scattering Synchrotron Mossbauer spectroscopy | DAC | 7 – 27 keV |
| 13-BM-C | Powder XRD Single crystal XRD | DAC | 28.6 keV | ||
| 13-BM-D | Powder XRD Single crystal XRD Brillouin Spectroscopy | DAC LVP | 4.5 – 80 keV | ||
| 13-ID-C,D | Powder XRD Single crystal XRD Raman Spectroscopy | DAC LVP | 4.9 – 75 keV | ||
| 16-BM-B | Laue XRD Radiography Viscometry | PEP DAC | 10 – 120 keV | ||
| 16-BM-D | Powder XRD Single crystal XRD X-ray absorption | DAC | 6 – 70 keV | ||
| 16-ID-B | Powder XRD Single crystal XRD | DAC | 18 – 60 keV | ||
| 16-ID-D | X-ray emission spectroscopy Nuclear resonant inelastic X-Ray scattering Synchrotron Mossbauer spectroscopy | DAC | 5 – 37 keV | ||
| Diamond [4] | Didcot, Oxfordshire, UK | I15 | Single crystal XRD Powder XRD | DAC | 20 – 80 keV |
| I19 | Single crystal XRD | DAC | 5 – 25 keV | ||
| ESRF [5] | Grenoble, France | ID06 | Powder XRD | LVP | 33 keV, 55 keV |
| ID15B | Powder XRD Single crystal XRD Diffuse X-ray scattering | DAC | 30 keV | ||
| ID18 | Nuclear resonance techniques | DAC | 7 – 80 keV | ||
| BM23 | X-ray absorption spectroscopy Powder XRD XRF | PEP | 5 – 75 keV | ||
| ID24 | X-ray absorption spectroscopy FTIR | DAC | 5 – 27 keV | ||
| ID27 | Powder XRD Single crystal XRD XRF | DAC PEP | 20 – 90 keV | ||
| NSLS-II [6] | Brookhaven, NY, USA | 28-ID-2 (XPD)a | Powder XRD | DAC | 40 – 70 keV |
| NSRRC [7] | Hsinchu, Taiwan | BL01C2 | Powder XRD | DAC | 12 – 33 keV |
| Petra-III [8] | DESY, Hamburg, Germany | P02.2 | Powder XRD Single crystal XRD XRF | DAC | 25.7 keV, 42.8 keV, 60 keV |
| Soleil [9] | Saint-Aubin, France | PSICHÉ | Laue XRD Powder XRD X-ray tomography | DAC LVP PEP | 15 – 100 keV |
| SPring-8 [10,11] | Harima Science Park City, Japan | BL04B1 | Laue XRD Radiography | LVP | 20-150 keV |
| BL10XU | Powder XRD Raman Spectroscopy Brillouin Spectroscopy | DAC | 14-61 keV |
References
- Beamline Information—en. Available online: https://www.cells.es/en/beamlines/bl04-mspd (accessed on 12 December 2017).
- Advanced Light Source Beamline Detail Archive. Available online: https://als.lbl.gov/beamlines/ (accessed on 24 October 2017).
- Beamlines Directory | Advanced Photon Source. Available online: https://www1.aps.anl.gov/Beamlines/Directory (accessed on 24 October 2017).
- Beamlines—Diamond Light Source. Available online: http://www.diamond.ac.uk/Beamlines.html (accessed on 24 October 2017).
- Matter at Extremes—ESRF. Available online: http://www.esrf.eu/UsersAndScience/Experiments/MEx (accessed on 24 October 2017).
- Photon Sciences | Beamlines | XPD: X-ray Powder Diffraction. Available online: https://www.bnl.gov/ps/beamlines/beamline.php?b=XPD (accessed on 24 October 2017).
- NSRRC Powder and Fiber X-ray Diffraction. Available online: http://efd.nsrrc.org.tw/EFD.php?num=237 (accessed on 24 October 2017).
- Extreme Conditions Beamline (ECB) P02.2. Available online: http://photon-science.desy.de/facilities/petra_iii/beamlines/p02_hard_x_ray_diffraction_beamline/ecb/index_eng.html (accessed on 24 October 2017).
- Welcome to Centre de Rayonnement Synchrotron Français | French National Synchrotron Facility. Available online: https://www.synchrotron-soleil.fr/en (accessed on 12 December 2017).
- BL04B1. Available online: http://www.spring8.or.jp/wkg/BL04B1/instrument/lang-en/INS-0000000317/instrument_summary_view (accessed on 24 October 2017).
- BL10XU. Available online: http://www.spring8.or.jp/wkg/BL10XU/instrument/lang-en/INS-0000000352/instrument_summary_view (accessed on 24 October 2017).
- Kunz, M.; MacDowell, A.A.; Caldwell, W.A.; Cambie, D.; Celestre, R.S.; Domning, E.E.; Duarte, R.M.; Gleason, A.E.; Glossinger, J.M.; Kelez, N.; et al. A beamline for high-pressure studies at the Advanced Light Source with a superconducting bending magnet as the source. J. Synchrotron Radiat. 2005, 12, 650–658. [Google Scholar] [CrossRef] [PubMed]
- Kunz, M.; Tamura, N.; Chen, K.; MacDowell, A.A.; Celestre, R.S.; Church, M.M.; Fakra, S.; Domning, E.E.; Glossinger, J.M.; Kirschman, J.L.; et al. A dedicated superbend X-ray microdiffraction beamline for materials, geo-, and environmental sciences at the advanced light source. Rev. Sci. Instrum. 2009, 80, 035108. [Google Scholar] [CrossRef] [PubMed]
- Robin, D.; Benjegerdes, R.; Biocca, A.; Bish, P.; Brown, W.; Byrne, W.; Calais, D.; Chin, M.; Corradi, C.; Coulomb, D.; et al. Successful completion of the ALS superbend project. In Proceedings of the EPAC 2002, Paris, France, 4 June 2002; pp. 215–217. [Google Scholar]
- MacDowell, A.A.; Celestre, R.S.; Howells, M.; McKinney, W.; Krupnick, J.; Cambie, D.; Domning, E.E.; Duarte, R.M.; Kelez, N.; Plate, D.W.; et al. Suite of three protein crystallography beamlines with single superconducting bend magnet as the source. J. Synchrotron Radiat. 2004, 11, 447–455. [Google Scholar] [CrossRef] [PubMed]
- Arndt, U.W.; Creagh, D.C.; Deslattes, R.D.; Hubbell, J.H.; Indelicato, P.; Kessler, E.G., Jr.; Lindroth, E.; Coolidge, X. X-rays. In International Tables for Crystallography Volume C: Mathematical, Physical and Chemical Tables; International Union of Crystallography: Chester, UK, 2006; Volume C, pp. 191–258. ISBN 978-1-4020-1900-5. [Google Scholar]
- Prescher, C.; Prakapenka, V.B. DIOPTAS: A program for reduction of two-dimensional X-ray diffraction data and data exploration. High Press. Res. 2015, 35, 223–230. [Google Scholar] [CrossRef]
- Fiquet, G.; Andrault, D.; Dewaele, A.; Charpin, T.; Kunz, M.; Haüsermann, D. P-V-T equation of state of MgSiO3 perovskite. Phys. Earth Planet Inter. 1998, 105, 21–31. [Google Scholar] [CrossRef]
- Shen, G.; Prakapenka, V.B.; Rivers, M.L.; Sutton, S.R. Structure of liquid iron at pressures up to 58 GPa. Phys. Rev. Lett. 2004, 92, 185701. [Google Scholar] [CrossRef] [PubMed]
- Meng, Y.; Shen, G.; Mao, H.K. Double-sided laser heating system at HPCAT for in situ X-Ray diffraction at high pressures and high temperatures. J. Phys. Condens. Matter 2006, 18, S1097. [Google Scholar] [CrossRef] [PubMed]
- Watanuki, T.; Shimomura, O.; Yagi, T.; Kondo, T.; Isshiki, M. Construction of laser-heated diamond anvil cell system for in situ X-Ray diffraction study at SPring-8. Rev. Sci. Instrum. 2001, 72, 1289–1292. [Google Scholar] [CrossRef]
- Liermann, H.-P.; Morgenroth, W.; Ehnes, A.; Berghäuser, A.; Winkler, B.; Franz, H.; Weckert, E. The Extreme Conditions Beamline at PETRA III, DESY: Possibilities to conduct time resolved monochromatic diffraction experiments in dynamic and laser heated DAC. J. Phys. Conf. Ser. 2010, 215, 012029. [Google Scholar] [CrossRef]
- Caldwell, W.A.; Kunz, M.; Celestre, R.S.; Domning, E.E.; Walter, M.J.; Walker, D.; Glossinger, J.; MacDowell, A.A.; Padmore, H.A.; Jeanloz, R.; et al. Laser-heated diamond anvil cell at the advanced light source beamline 12.2.2. Nucl. Instrum. Methods Phys. Res. Sect. A 2007, 582, 221–225. [Google Scholar] [CrossRef]
- Kaner, R.B.; Gilman, J.J.; Tolbert, S.H. Designing Superhard Materials. Science 2005, 308, 1268–1269. [Google Scholar] [CrossRef] [PubMed]
- Chung, H.-Y.; Weinberger, M.B.; Levine, J.B.; Kavner, A.; Yang, J.-M.; Tolbert, S.H.; Kaner, R.B. Synthesis of ultra-incompressible superhard rhenium diboride at ambient pressure. Science 2007, 316, 436–439. [Google Scholar] [CrossRef] [PubMed]
- Mohammadi, R.; Lech, A.T.; Xie, M.; Weaver, B.E.; Yeung, M.T.; Tolbert, S.H.; Kaner, R.B. Tungsten tetraboride, an inexpensive superhard material. Proc. Natl. Acad. Sci. USA 2011, 108, 10958–10962. [Google Scholar] [CrossRef] [PubMed]
- Friedrich, A.; Winkler, B.; Bayarjargal, L.; Morgenroth, W.; Juarez-Arellano, E.A.; Milman, V.; Refson, K.; Kunz, M.; Chen, K. Novel Rhenium Nitrides. Phys. Rev. Lett. 2010, 105, 085504. [Google Scholar] [CrossRef] [PubMed]
- Friedrich, A.; Winkler, B.; Juarez-Arellano, E.A.; Bayarjargal, L. Synthesis of Binary Transition Metal Nitrides, Carbides and Borides from the Elements in the Laser-Heated Diamond Anvil Cell and Their Structure-Property Relations. Materials 2011, 4, 1648–1692. [Google Scholar] [CrossRef] [PubMed]
- Santamaría-Pérez, D.; McGuire, C.; Makhluf, A.; Kavner, A.; Chuliá-Jordán, R.; Pellicer-Porres, J.; Martinez-García, D.; Doran, A.; Kunz, M.; Rodríguez-Hernández, P.; et al. Exploring the Chemical Reactivity between Carbon Dioxide and Three Transition Metals (Au, Pt, and Re) at High-Pressure, High-Temperature Conditions. Inorg. Chem. 2016, 55, 10793–10799. [Google Scholar] [CrossRef] [PubMed]
- Armentrout, M.M.; Kavner, A. Incompressibility of osmium metal at ultrahigh pressures and temperatures. J. Appl. Phys. 2010, 107, 093528. [Google Scholar] [CrossRef]
- Nisr, C.; Meng, Y.; MacDowell, A.A.; Yan, J.; Prakapenka, V.; Shim, S.-H. Thermal expansion of SiC at high pressure-temperature and implications for thermal convection in the deep interiors of carbide exoplanets. J. Geophys. Res. Planets 2017, 122, 124–133. [Google Scholar] [CrossRef]
- Gleason, A.E.; Mao, W.L. Strength of iron at core pressures and evidence for a weak Earth’s inner core. Nat. Geosci. 2013, 6, 571–574. [Google Scholar] [CrossRef]
- Miyagi, L.; Kanitpanyacharoen, W.; Kaercher, P.; Lee, K.K.M.; Wenk, H.-R. Slip Systems in MgSiO3 Post-Perovskite: Implications for D” Anisotropy. Science 2010, 329, 1639–1641. [Google Scholar] [CrossRef] [PubMed]
- Miyagi, L.; Kanitpanyacharoen, W.; Stackhouse, S.; Militzer, B.; Wenk, H.-R. The enigma of post-perovskite anisotropy: Deformation versus transformation textures. Phys. Chem. Miner. 2011, 38, 665–678. [Google Scholar] [CrossRef]
- Miyagi, L.; Wenk, H.-R. Texture development and slip systems in bridgmanite and bridgmanite + ferropericlase aggregates. Phys. Chem. Miner. 2016, 43, 597–613. [Google Scholar] [CrossRef]
- Wenk, H.-R.; Lutterotti, L.; Kaercher, P.; Kanitpanyacharoen, W.; Miyagi, L.; Vasin, R. Rietveld texture analysis from synchrotron diffraction images. II. Complex multiphase materials and diamond anvil cell experiments. Powder Diffr. 2014, 29, 220–232. [Google Scholar] [CrossRef]
- Chen, B.; Lutker, K.; Raju, S.V.; Yan, J.; Kanitpanyacharoen, W.; Lei, J.; Yang, S.; Wenk, H.-R.; Mao, H.; Williams, Q. Texture of Nanocrystalline Nickel: Probing the Lower Size Limit of Dislocation Activity. Science 2012, 338, 1448–1451. [Google Scholar] [CrossRef] [PubMed]
- Xie, M.; Mohammadi, R.; Turner, C.L.; Kaner, R.B.; Kavner, A.; Tolbert, S.H. Lattice stress states of superhard tungsten tetraboride from radial X-Ray diffraction under nonhydrostatic compression. Phys. Rev. B 2014, 90, 104104. [Google Scholar] [CrossRef]
- Xie, M.; Mohammadi, R.; Turner, C.L.; Kaner, R.B.; Kavner, A.; Tolbert, S.H. Exploring hardness enhancement in superhard tungsten tetraboride-based solid solutions using radial X-ray diffraction. Appl. Phys. Lett. 2015, 107, 041903. [Google Scholar] [CrossRef]
- Walter, M.J.; Koga, K.T. The effects of chromatic dispersion on temperature measurement in the laser-heated diamond anvil cell. Phys. Earth Planet Inter. 2004, 143–144, 541–558. [Google Scholar] [CrossRef]
- Rainey, E.S.G.; Kavner, A. Peak scaling method to measure temperatures in the laser-heated diamond anvil cell and application to the thermal conductivity of MgO. J. Geophys. Res. Solid Earth 2014, 119, 8154–8170. [Google Scholar] [CrossRef]
- Miyagi, L.; Kanitpanyacharoen, W.; Raju, S.V.; Kaercher, P.; Knight, J.; MacDowell, A.; Wenk, H.-R.; Williams, Q.; Alarcon, E.Z. Combined resistive and laser heating technique for in situ radial X-ray diffraction in the diamond anvil cell at high pressure and temperature. Rev. Sci. Instrum. 2013, 84, 025118. [Google Scholar] [CrossRef] [PubMed]
- Yan, J.; Knight, J.; Kunz, M.; Vennila Raju, S.; Chen, B.; Gleason, A.E.; Godwal, B.K.; Geballe, Z.; Jeanloz, R.; Clark, S.M. The resistive-heating characterization of laser heating system and LaB6 characterization of X-ray diffraction of beamline 12.2.2 at advanced light source. J. Phys. Chem. Solids 2010, 71, 1179–1182. [Google Scholar] [CrossRef]
- Grocholski, B.; Speziale, S.; Jeanloz, R. Equation of state, phase stability, and amorphization of SnI4 at high pressure and temperature. Phys. Rev. B 2010, 81, 094101. [Google Scholar] [CrossRef]
- Geballe, Z.M.; Raju, S.V.; Godwal, B.K.; Jeanloz, R. Clapeyron slope reversal in the melting curve of AuGa 2 at 5.5 GPa. J. Phys. Condens. Matter 2013, 25, 415401. [Google Scholar] [CrossRef] [PubMed]
- Raju, S.V.; Geballe, Z.M.; Godwal, B.K.; Kalkan, B.; Williams, Q.; Jeanloz, R. High pressure and temperature structure of liquid and solid Cd: Implications for the melting curve of Cd. Mater. Res. Express 2014, 1, 046502. [Google Scholar] [CrossRef]
- Doran, A.; Schlicker, L.; Beavers, C.; Bhat, S.; Bekheet, M.; Gurlo, A. Compact low power infrared tube furnace for in situ X-ray powder diffraction. Rev. Sci. Instrum. 2017, 88, 013903. [Google Scholar] [CrossRef] [PubMed]
- Mattox, T.M.; Groome, C.; Doran, A.; Beavers, C.M.; Urban, J.J. Anion-mediated negative thermal expansion in lanthanum hexaboride. Solid State Commun. 2017, 265, 47–51. [Google Scholar] [CrossRef]
- Köck, E.-M.; Kogler, M.; Zhuo, C.; Schlicker, L.; Bekheet, M.F.; Doran, A.; Gurlo, A.; Penner, S. Surface chemistry and stability of metastable corundum-type In2O3. Phys. Chem. Chem. Phys. 2017, 19, 19407–19419. [Google Scholar] [CrossRef] [PubMed]
- Beavers, C.M.; O’Bannon, E.F.; Doran, A.; Kunz, M.; Williams, Q. MS18-P2 Single Crystal High Pressure Diffraction at the Advanced Light Source. Found. Crystallogr. 2016, 72, s279. [Google Scholar] [CrossRef]
- O’Bannon, E.; Beavers, C.M.; Kunz, M.; Williams, Q. The high-pressure phase of lawsonite: A single crystal study of a key mantle hydrous phase. J. Geophys. Res. Solid Earth 2017, 122, 6294–6305. [Google Scholar] [CrossRef]
- Jaffe, A.; Lin, Y.; Beavers, C.M.; Voss, J.; Mao, W.L.; Karunadasa, H.I. High-Pressure Single-Crystal Structures of 3D Lead-Halide Hybrid Perovskites and Pressure Effects on their Electronic and Optical Properties. ACS Cent Sci. 2016, 2, 201–209. [Google Scholar] [CrossRef] [PubMed]
- Kapustin, E.A.; Lee, S.; Alshammari, A.S.; Yaghi, O.M. Molecular Retrofitting Adapts a Metal–Organic Framework to Extreme Pressure. ACS Cent. Sci. 2017, 3, 662–667. [Google Scholar] [CrossRef] [PubMed]
- Kantor, I.; Prakapenka, V.; Kantor, A.; Dera, P.; Kurnosov, A.; Sinogeikin, S.; Dubrovinskaia, N.; Dubrovinsky, L. BX90: A new diamond anvil cell design for X-ray diffraction and optical measurements. Rev. Sci. Instrum. 2012, 83, 125102. [Google Scholar] [CrossRef] [PubMed]
- Merrill, L.; Bassett, W.A. Miniature diamond anvil pressure cell for single crystal X-Ray diffraction studies. Rev. Sci. Instrum. 1974, 45, 290–294. [Google Scholar] [CrossRef]
- Parsons, S. ECLIPSE—Program for Masking High Pressure Diffraction Images and Conversion between CCD Image Formats. Department of Chemistry, University of Edinburg: Edinburgh, UK, 2010. [Google Scholar]
- Tamura, N.; Kunz, M.; Chen, K.; Celestre, R.S.; MacDowell, A.A.; Warwick, T. A superbend X-ray microdiffraction beamline at the advanced light source. Mater. Sci. Eng. A 2009, 524, 28–32. [Google Scholar] [CrossRef]
- Dejoie, C.; McCusker, L.B.; Baerlocher, C.; Kunz, M.; Tamura, N. Can Laue microdiffraction be used to solve and refine complex inorganic structures? J. Appl. Cryst. 2013, 46, 1805–1816. [Google Scholar] [CrossRef]
- Tamura, N. XMAS: A Versatile Tool for Analyzing Synchrotron X-ray Microdiffraction Data. In Strain and Dislocation Gradients from Diffraction; Imperial College Press: London, UK, 2014; pp. 125–155. ISBN 978-1-908979-62-9. [Google Scholar]
- Thompson, A.C.; Padmore, H.A.; Oliver, A.G.; Teat, S.J.; Celestre, R.S.; Clark, S.M.; Domning, E.E.; Franck, K.D.; Morrison, G.Y. A Simple High Performance Beamline for Small Molecule Chemical Crystallography. AIP Conf. Proc. 2004, 705, 482–485. [Google Scholar] [CrossRef]
- Moggach, S.A.; Allan, D.R.; Parsons, S.; Warren, J.E. Incorporation of a new design of backing seat and anvil in a Merrill–Bassett diamond anvil cell. J. Appl. Cryst. 2008, 41, 249–251. [Google Scholar] [CrossRef]
- Boehler, R.; Hantsetters, K.D. New anvil designs in diamond-cells. High Press. Res. 2004, 24, 391–396. [Google Scholar] [CrossRef]
- Rodríguez-Velamazán, J.A.; Fabelo, O.; Beavers, C.M.; Natividad, E.; Evangelisti, M.; Roubeau, O. A Multifunctional Magnetic Material under Pressure. Chem. Eur. J. 2014, 20, 7956–7961. [Google Scholar] [CrossRef] [PubMed]
- Woodall, C.H.; Beavers, C.M.; Christensen, J.; Hatcher, L.E.; Intissar, M.; Parlett, A.; Teat, S.J.; Reber, C.; Raithby, P.R. Hingeless Negative Linear Compression in the Mechanochromic Gold Complex [(C6F5Au)2(μ-1,4-diisocyanobenzene)]. Angew. Chem. Int. Ed. 2013, 52, 9691–9694. [Google Scholar] [CrossRef] [PubMed] [Green Version]
- Gagnon, K.J.; Beavers, C.M.; Clearfield, A. MOFs Under Pressure: The Reversible Compression of a Single Crystal. J. Am. Chem. Soc. 2013, 135, 1252–1255. [Google Scholar] [CrossRef] [PubMed]
- Shan, Z.; Stach, E.A.; Wiezorek, J.M.K.; Knapp, J.A.; Follstaedt, D.M.; Mao, S.X. Grain Boundary-Mediated Plasticity in Nanocrystalline Nickel. Science 2004, 305, 654–657. [Google Scholar] [CrossRef] [PubMed]
- Zhou, X.; Tamura, N.; Mi, Z.; Lei, J.; Yan, J.; Zhang, L.; Deng, W.; Ke, F.; Yue, B.; Chen, B. Reversal in the Size Dependence of Grain Rotation. Phys. Rev. Lett. 2017, 118, 096101. [Google Scholar] [CrossRef] [PubMed]
- Woodall, C.H.; Fuertes, S.; Beavers, C.M.; Hatcher, L.E.; Parlett, A.; Shepherd, H.J.; Christensen, J.; Teat, S.J.; Intissar, M.; Rodrigue-Witchel, A.; et al. Tunable Trimers: Using Temperature and Pressure to Control Luminescent Emission in Gold(I) Pyrazolate-Based Trimers. Chem. Eur. J. 2014, 20, 16933–16942. [Google Scholar] [CrossRef] [PubMed] [Green Version]
- Zhou, H.-C.; Long, J.R.; Yaghi, O.M. Introduction to Metal–Organic Frameworks. Chem. Rev. 2012, 112, 673–674. [Google Scholar] [CrossRef] [PubMed]
- Lee, S.; Kapustin, E.A.; Yaghi, O.M. Coordinative alignment of molecules in chiral metal-organic frameworks. Science 2016, 353, 808–811. [Google Scholar] [CrossRef] [PubMed]
- Gándara, F.; Furukawa, H.; Lee, S.; Yaghi, O.M. High Methane Storage Capacity in Aluminum Metal–Organic Frameworks. J. Am. Chem. Soc. 2014, 136, 5271–5274. [Google Scholar] [CrossRef] [PubMed]
- Graham, A.J.; Allan, D.R.; Muszkiewicz, A.; Morrison, C.A.; Moggach, S.A. The Effect of High Pressure on MOF-5: Guest-Induced Modification of Pore Size and Content at High Pressure. Angew. Chem. Int. Ed. 2011, 50, 11138–11141. [Google Scholar] [CrossRef]
- Spek, A.L. PLATON SQUEEZE: A tool for the calculation of the disordered solvent contribution to the calculated structure factors. Acta Cryst. C 2015, 71, 9–18. [Google Scholar] [CrossRef] [PubMed]
- Macrae, C. F.; Bruno, I. J.; Chisholm, J. A.; Edgington, P. R.; McCabe, P.; Pidcock, E.; Rodriguez-Monge, L.; Taylor, R.; van de Streek, J.; Wood, P.A. Mercury CSD 2.0 – new features for the visualization and investigation of crystal structures. J. Appl. Crystallogr. 2008, 41, 466–470. [Google Scholar] [CrossRef]
- Birch, F. Elasticity and constitution of the Earth’s interior. J. Geophys. Res. 1952, 57, 227–286. [Google Scholar] [CrossRef]
- Song, X. Anisotropy of the Earth’s inner core. Rev. Geophys. 1997, 35, 297–313. [Google Scholar] [CrossRef]
- Deuss, A. Heterogeneity and Anisotropy of Earth’s Inner Core. Annu. Rev. Earth Planet. Sci. 2014, 42, 103–126. [Google Scholar] [CrossRef]
- Jeanloz, R.; Wenk, H.-R. Convection and anisotropy of the inner core. Geophys. Res. Lett. 1988, 15, 72–75. [Google Scholar] [CrossRef]
- Hemley, R.J.; Mao, H.; Shen, G.; Badro, J.; Gillet, P.; Hanfland, M.; Häusermann, D. X-ray Imaging of Stress and Strain of Diamond, Iron, and Tungsten at Megabar Pressures. Science 1997, 276, 1242–1245. [Google Scholar] [CrossRef]
- Hammond, C. The Basics of Crystallography and Diffraction: Fourth Edition; International Union of Crystallography Texts on Crystallography, 4th ed.; Oxford University Press: Oxford, NY, USA, 2015; ISBN 978-0-19-873868-8. [Google Scholar]
- Giacovazzo, C.; Monaco, H.L.; Artioli, G.; Viterbo, D.; Milanesio, M.; Gilli, G.; Gilli, P.; Zanotti, G.; Ferraris, G.; Catti, M. Fundamentals of Crystallography, 3rd ed.; Giacovazzo, C., Ed.; International Union of Crystallography Monographs on Crystallography; Oxford University Press: Oxford, NY, USA, 2011; ISBN 978-0-19-957366-0. [Google Scholar]
- He, B.B. Two-Dimensional X-ray Diffraction, 1st ed.; Wiley & Sons, Inc.: Hoboken, NJ, USA, 2009. [Google Scholar]
- Shmueli, U. Theories and Techniques of Crystal Structure Determination; International Union of Crystallography Monographs on Crystallography; Oxford University Press: Oxford, NY, USA, 2007; ISBN 978-0-19-921966-7. [Google Scholar]
- Massa, W. Crystal Structure Determination, 2nd ed.; Springer-Verlag: Berlin/Heidelberg, Germany, 2004; ISBN 978-3-662-06431-3. [Google Scholar]
- Pecharsky, V.; Zavalij, P. Fundamentals of Powder Diffraction and Structural; Springer: Boston, MA, USA, 2009; ISBN 978-0-387-09579-0. [Google Scholar]
- Pickworth Glusker, J.; Trueblood, K.N. Crystal Structure Analysis: A Primer, 3rd ed.; Oxford University Press: Oxford, NY, USA, 2010; ISBN 978-0-19-957635-7. [Google Scholar]
- Structure Determination from Powder Diffraction Data, 1st ed.; David, W.I.F.; Shankland, K.; McCusker, L.B.; Baerlocher, C. (Eds.) Oxford University Press: Oxford, NY, USA, 2002; ISBN 978-0-19-850091-9. [Google Scholar]
- Mueller, P.; Herbst-Irmer, R.; Spek, A.L.; Schneider, T.; Sawaya, M. Crystal Structure Refinement: A Crystallographer’s Guide to SHELXL; International Union of Crystallography Texts on Crystallography; Oxford University Press: Oxford, NY, USA, 2006; ISBN 978-0-19-857076-9. [Google Scholar]
- Abboud, A.; Kirchlechner, C.; Keckes, J.; Conka Nurdan, T.; Send, S.; Micha, J.S.; Ulrich, O.; Hartmann, R.; Strüder, L.; Pietsch, U. Single-shot full strain tensor determination with microbeam X-ray Laue diffraction and a two-dimensional energy-dispersive detector. J. Appl. Crystallogr. 2017, 50, 901–908. [Google Scholar] [CrossRef] [PubMed]
- Le Bail, A.; Duroy, H.; Fourquet, J.L. Ab-initio structure determination of LiSbWO6 by X-ray powder diffraction. Mater. Res. Bull. 1988, 23, 447–452. [Google Scholar] [CrossRef]
- Rietveld, H.M. A profile refinement method for nuclear and magnetic structures. J. Appl. Cryst. 1969, 2, 65–71. [Google Scholar] [CrossRef]
- Marín, C.; Diéguez, E. A method of complete generation of back-reflection Laue patterns of any single crystal. J. Appl. Cryst. 1995, 28, 839–842. [Google Scholar] [CrossRef]
- Krahl-Urban, B.; Butz, R.; Preuss, E. A simplified procedure for orientation of single crystals of any structure. Acta Cryst. A 1973, 29, 86–88. [Google Scholar] [CrossRef]
- Barabash, R.I.; Ice, G.E.; Larson, B.C.; Yang, W. Application of white X-Ray microbeams for the analysis of dislocation structures. Rev. Sci. Instrum. 2002, 73, 1652–1654. [Google Scholar] [CrossRef]
- Weir, C.E.; Lippincott, E.R.; Van Valkenburg, A.; Bunting, E.N. Infrared studies in the 1- to 15-micron region to 30,000 atmospheres. J. Res. NBS A Phys. Ch. 1959, 63, 55–62. [Google Scholar] [CrossRef]
- Bassett, W.A. Diamond anvil cell, 50th birthday. High Press. Res. 2009, 29, 163–186. [Google Scholar] [CrossRef]
- Giriat, G.; Wang, W.; Attfield, J.P.; Huxley, A.D.; Kamenev, K.V. Turnbuckle diamond anvil cell for high-pressure measurements in a superconducting quantum interference device magnetometer. Rev. Sci. Instrum. 2010, 81, 073905. [Google Scholar] [CrossRef] [PubMed]
- Andrault, D.; Fiquet, G. Synchrotron radiation and laser heating in a diamond anvil cell. Rev. Sci. Instrum. 2001, 72, 1283–1288. [Google Scholar] [CrossRef]
- Boffa Ballaran, T.; Kurnosov, A.; Trots, D. Single-crystal X-ray diffraction at extreme conditions: A review. High Press. Res. 2013, 33, 453–465. [Google Scholar] [CrossRef]
- Jayaraman, A. Diamond anvil cell and high-pressure physical investigations. Rev. Mod. Phys. 1983, 55, 65–108. [Google Scholar] [CrossRef]
- Chapman, K.W.; Chupas, P.J.; Halder, G.J.; Hriljac, J.A.; Kurtz, C.; Greve, B.K.; Ruschman, C.J.; Wilkinson, A.P. Optimizing high-pressure pair distribution function measurements in diamond anvil cells. J. Appl. Cryst. 2010, 43, 297–307. [Google Scholar] [CrossRef]
- Xu, J.; Mao, H.; Hemley, R.J.; Hines, E. The moissanite anvil cell: A new tool for high-pressure research. J. Phys. Condens. Matter 2002, 14, 11543. [Google Scholar] [CrossRef]
- Siqueira, M.; (Almax easyLab, Cambridge, MA, USA); Stan, C.V.; (Advanced Light Source, Lawrence Berkeley National Laboratory, Berkeley, CA, USA). Personal communication, 2017.
- Klotz, S.; Chervin, J.-C.; Munsch, P.; Le Marchand, G. Hydrostatic limits of 11 pressure transmitting media. J. Phys. D Appl. Phys. 2009, 42, 075413. [Google Scholar] [CrossRef]
- Kaercher, P.; Speziale, S.; Miyagi, L.; Kanitpanyacharoen, W.; Wenk, H.-R. Crystallographic preferred orientation in wüstite (FeO) through the cubic-to-rhombohedral phase transition. Phys. Chem. Miner. 2012, 39, 613–626. [Google Scholar] [CrossRef]
- Stan, C.V.; Dutta, R.; White, C.E.; Prakapenka, V.; Duffy, T.S. High-pressure polymorphism of PbF2 to 75 GPa. Phys. Rev. B 2016, 94, 024104. [Google Scholar] [CrossRef]
- Fei, Y.; Ricolleau, A.; Frank, M.; Mibe, K.; Shen, G.; Prakapenka, V. Toward an internally consistent pressure scale. Proc. Natl. Acad. Sci. USA 2007, 104, 9182–9186. [Google Scholar] [CrossRef] [PubMed]
- Hanfland, M.; Syassen, K. A Raman study of diamond anvils under stress. J. Appl. Phys. 1985, 57, 2752–2756. [Google Scholar] [CrossRef]
- Akahama, Y.; Kawamura, H. Pressure calibration of diamond anvil Raman gauge to 310 GPa. J. Appl. Phys. 2006, 100, 043516. [Google Scholar] [CrossRef]
- Mao, H.K.; Xu, J.; Bell, P.M. Calibration of the ruby pressure gauge to 800 kbar under quasi-hydrostatic conditions. J. Geophys. Res. 1986, 91, 4673–4676. [Google Scholar] [CrossRef]
- Datchi, F.; Dewaele, A.; Loubeyre, P.; Letoullec, R.; Godec, Y.L.; Canny, B. Optical pressure sensors for high-pressure–high-temperature studies in a diamond anvil cell. High Press. Res. 2007, 27, 447–463. [Google Scholar] [CrossRef]
- Tange, Y.; Takahashi, E.; Nishihara, Y.; Funakoshi, K.; Sata, N. Phase relations in the system MgO-FeO-SiO2 to 50 GPa and 2000 °C: An application of experimental techniques using multianvil apparatus with sintered diamond anvils. J. Geophys. Res. 2009, 114, B02214. [Google Scholar] [CrossRef]
- Dorfman, S.M.; Prakapenka, V.B.; Meng, Y.; Duffy, T.S. Intercomparison of pressure standards (Au, Pt, Mo, MgO, NaCl and Ne) to 2.5 Mbar. J. Geophys. Res. 2012, 117, B08210. [Google Scholar] [CrossRef]
- Dorogokupets, P.I.; Dewaele, A. Equations of state of MgO, Au, Pt, NaCl-B1, and NaCl-B2: Internally consistent high-temperature pressure scales. High Press. Res. 2007, 27, 431–446. [Google Scholar] [CrossRef]
- Takemura, K.; Dewaele, A. Isothermal equation of state for gold with a He-pressure medium. Phys. Rev. B 2008, 78, 104119. [Google Scholar] [CrossRef]
- Nellis, W.J. Adiabat-reduced isotherms at 100 GPa pressures. High Press. Res. 2007, 27, 393–407. [Google Scholar] [CrossRef]
- Nellis, W. Ultracondensed Matter by Dynamic Compression; Cambridge University Press: Cambridge, UK, 2017; ISBN 978-1-108-22853-4. [Google Scholar]
- Zha, C.-S.; Mao, H.; Hemley, R.J. Elasticity of MgO and a primary pressure scale to 55 GPa. Proc. Natl. Acad. Sci. USA 2000, 97, 13494–13499. [Google Scholar] [CrossRef] [PubMed]
- Mao, H.K.; Bell, P.M.; Shaner, J.W.; Steinberg, D.J. Specific volume measurements of Cu, Mo, Pd, and Ag and calibration of the ruby R1 fluorescence pressure gauge from 0.06 to 1 Mbar. J. Appl. Phys. 1978, 49, 3276–3283. [Google Scholar] [CrossRef]
- Dewaele, A.; Loubeyre, P.; Mezouar, M. Equations of state of six metals above 94 GPa. Phys. Rev. B 2004, 70, 094112. [Google Scholar] [CrossRef]
- Dewaele, A.; Torrent, M.; Loubeyre, P.; Mezouar, M. Compression curves of transition metals in the Mbar range: Experiments and projector augmented-wave calculations. Phys. Rev. B 2008, 78, 104102. [Google Scholar] [CrossRef]
- Lin, J.-F.; Degtyareva, O.; Prewitt, C.T.; Dera, P.; Sata, N.; Gregoryanz, E.; Mao, H.; Hemley, R.J. Crystal structure of a high-pressure/high-temperature phase of alumina by in situ X-ray diffraction. Nat Mater. 2004, 3, 389–393. [Google Scholar] [CrossRef] [PubMed]
- Ono, S.; Oganov, A.R.; Koyama, T.; Shimizu, H. Stability and compressibility of the high-pressure phases of Al2O3 up to 200 GPa: Implications for the electrical conductivity of the base of the lower mantle. Earth Planet. Sci. Lett. 2006, 246, 326–335. [Google Scholar] [CrossRef]
- Birch, F. Finite Elastic Strain of Cubic Crystals. Phys. Rev. 1947, 71, 809–824. [Google Scholar] [CrossRef]
- Angel, R.J. Equations of State. Rev. Mineral. Geochem. 2000, 41, 35–59. [Google Scholar] [CrossRef]
- Besson, J.M.; Nelmes, R.J.; Hamel, G.; Loveday, J.S.; Weill, G.; Hull, S. Neutron powder diffraction above 10 GPa. Phys. B Condens. Matter 1992, 180–181, 907–910. [Google Scholar] [CrossRef]
Figure 1.
Schematic of the optical train for Advanced Light Source (ALS) beamline 12.2.2. The circa 30 m long beamline follows a two-stage focusing set-up into the experimental hutch. The primary focus spot, also situated in the experimental hutch, is also used as endstation. KB mirrors: Kirkpatrick-Baez mirrors.

Figure 2.
An annotated image of a BX90 diamond anvil cell (DAC) mounted on the Stoe Stadivari diffractometer (Stoe & Cie GmbH, Darmstadt, Germany) on beamline 12.2.2, endstation 1. (A) The Research Detectors Inc. (RDI) CMOS 1M detector (Oakland, CA, USA). (B) The beamstop. (C) The BX90 DAC. (D) Motorized DAC alignment xyz stages. (E) Off-axis sample viewing/alignment camera. (F) Idealized representation of the X-ray beam direction.

Figure 3.
Photograph of set up at endstation 2 on ALS beamline 12.2.2. A single, vertical rotation axis is centered onto the focus spot of the X-ray beam using the lower xyz stack. The upper xyz stack allows centering the sample onto the rotation axis and thus X-ray focus spot.
Figure 3.
Photograph of set up at endstation 2 on ALS beamline 12.2.2. A single, vertical rotation axis is centered onto the focus spot of the X-ray beam using the lower xyz stack. The upper xyz stack allows centering the sample onto the rotation axis and thus X-ray focus spot.
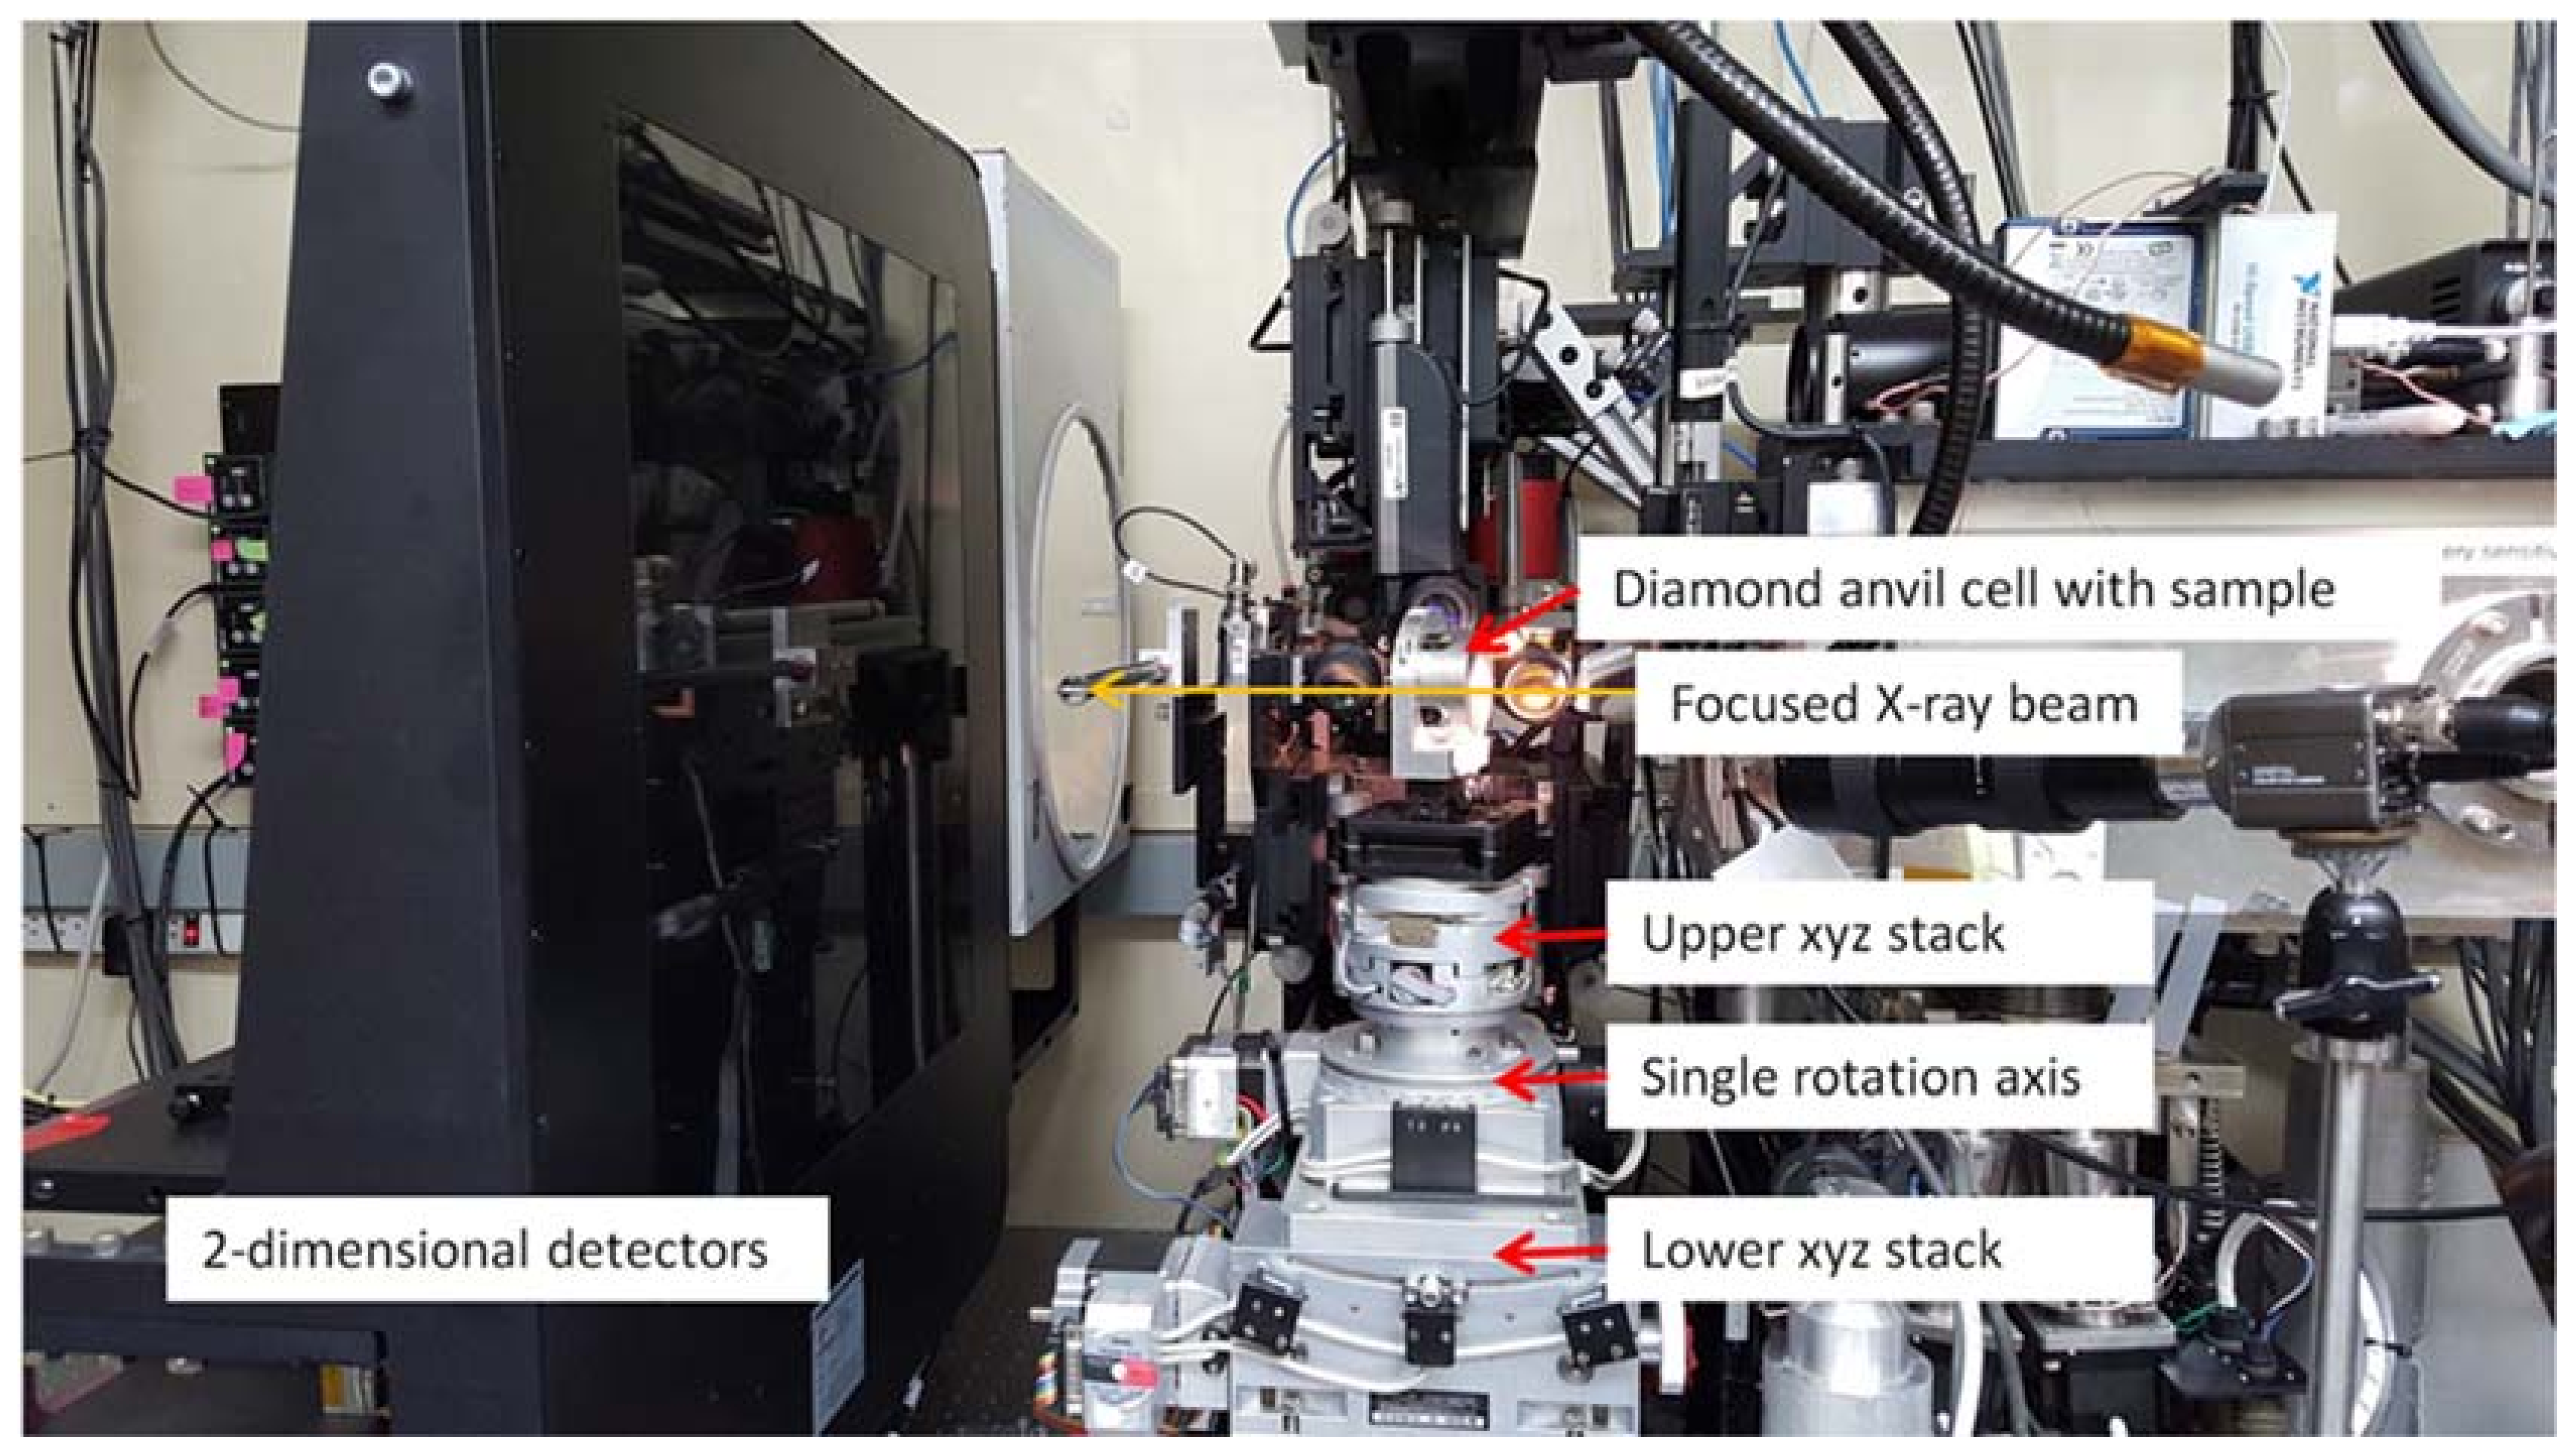
Figure 4.
Top: typical DAC setup in axial geometry. This schematic also includes schematic laser heating geometry. Bottom: DAC setup in radial geometry. Note that in radial geometry, the X-rays access the sample through the gasket, which in this set-up needs to be transparent to X-rays. Double-sided laser heating in radial geometry requires redirecting the laser beam and pyrometry optics by 90 degrees. IR: Infrared.
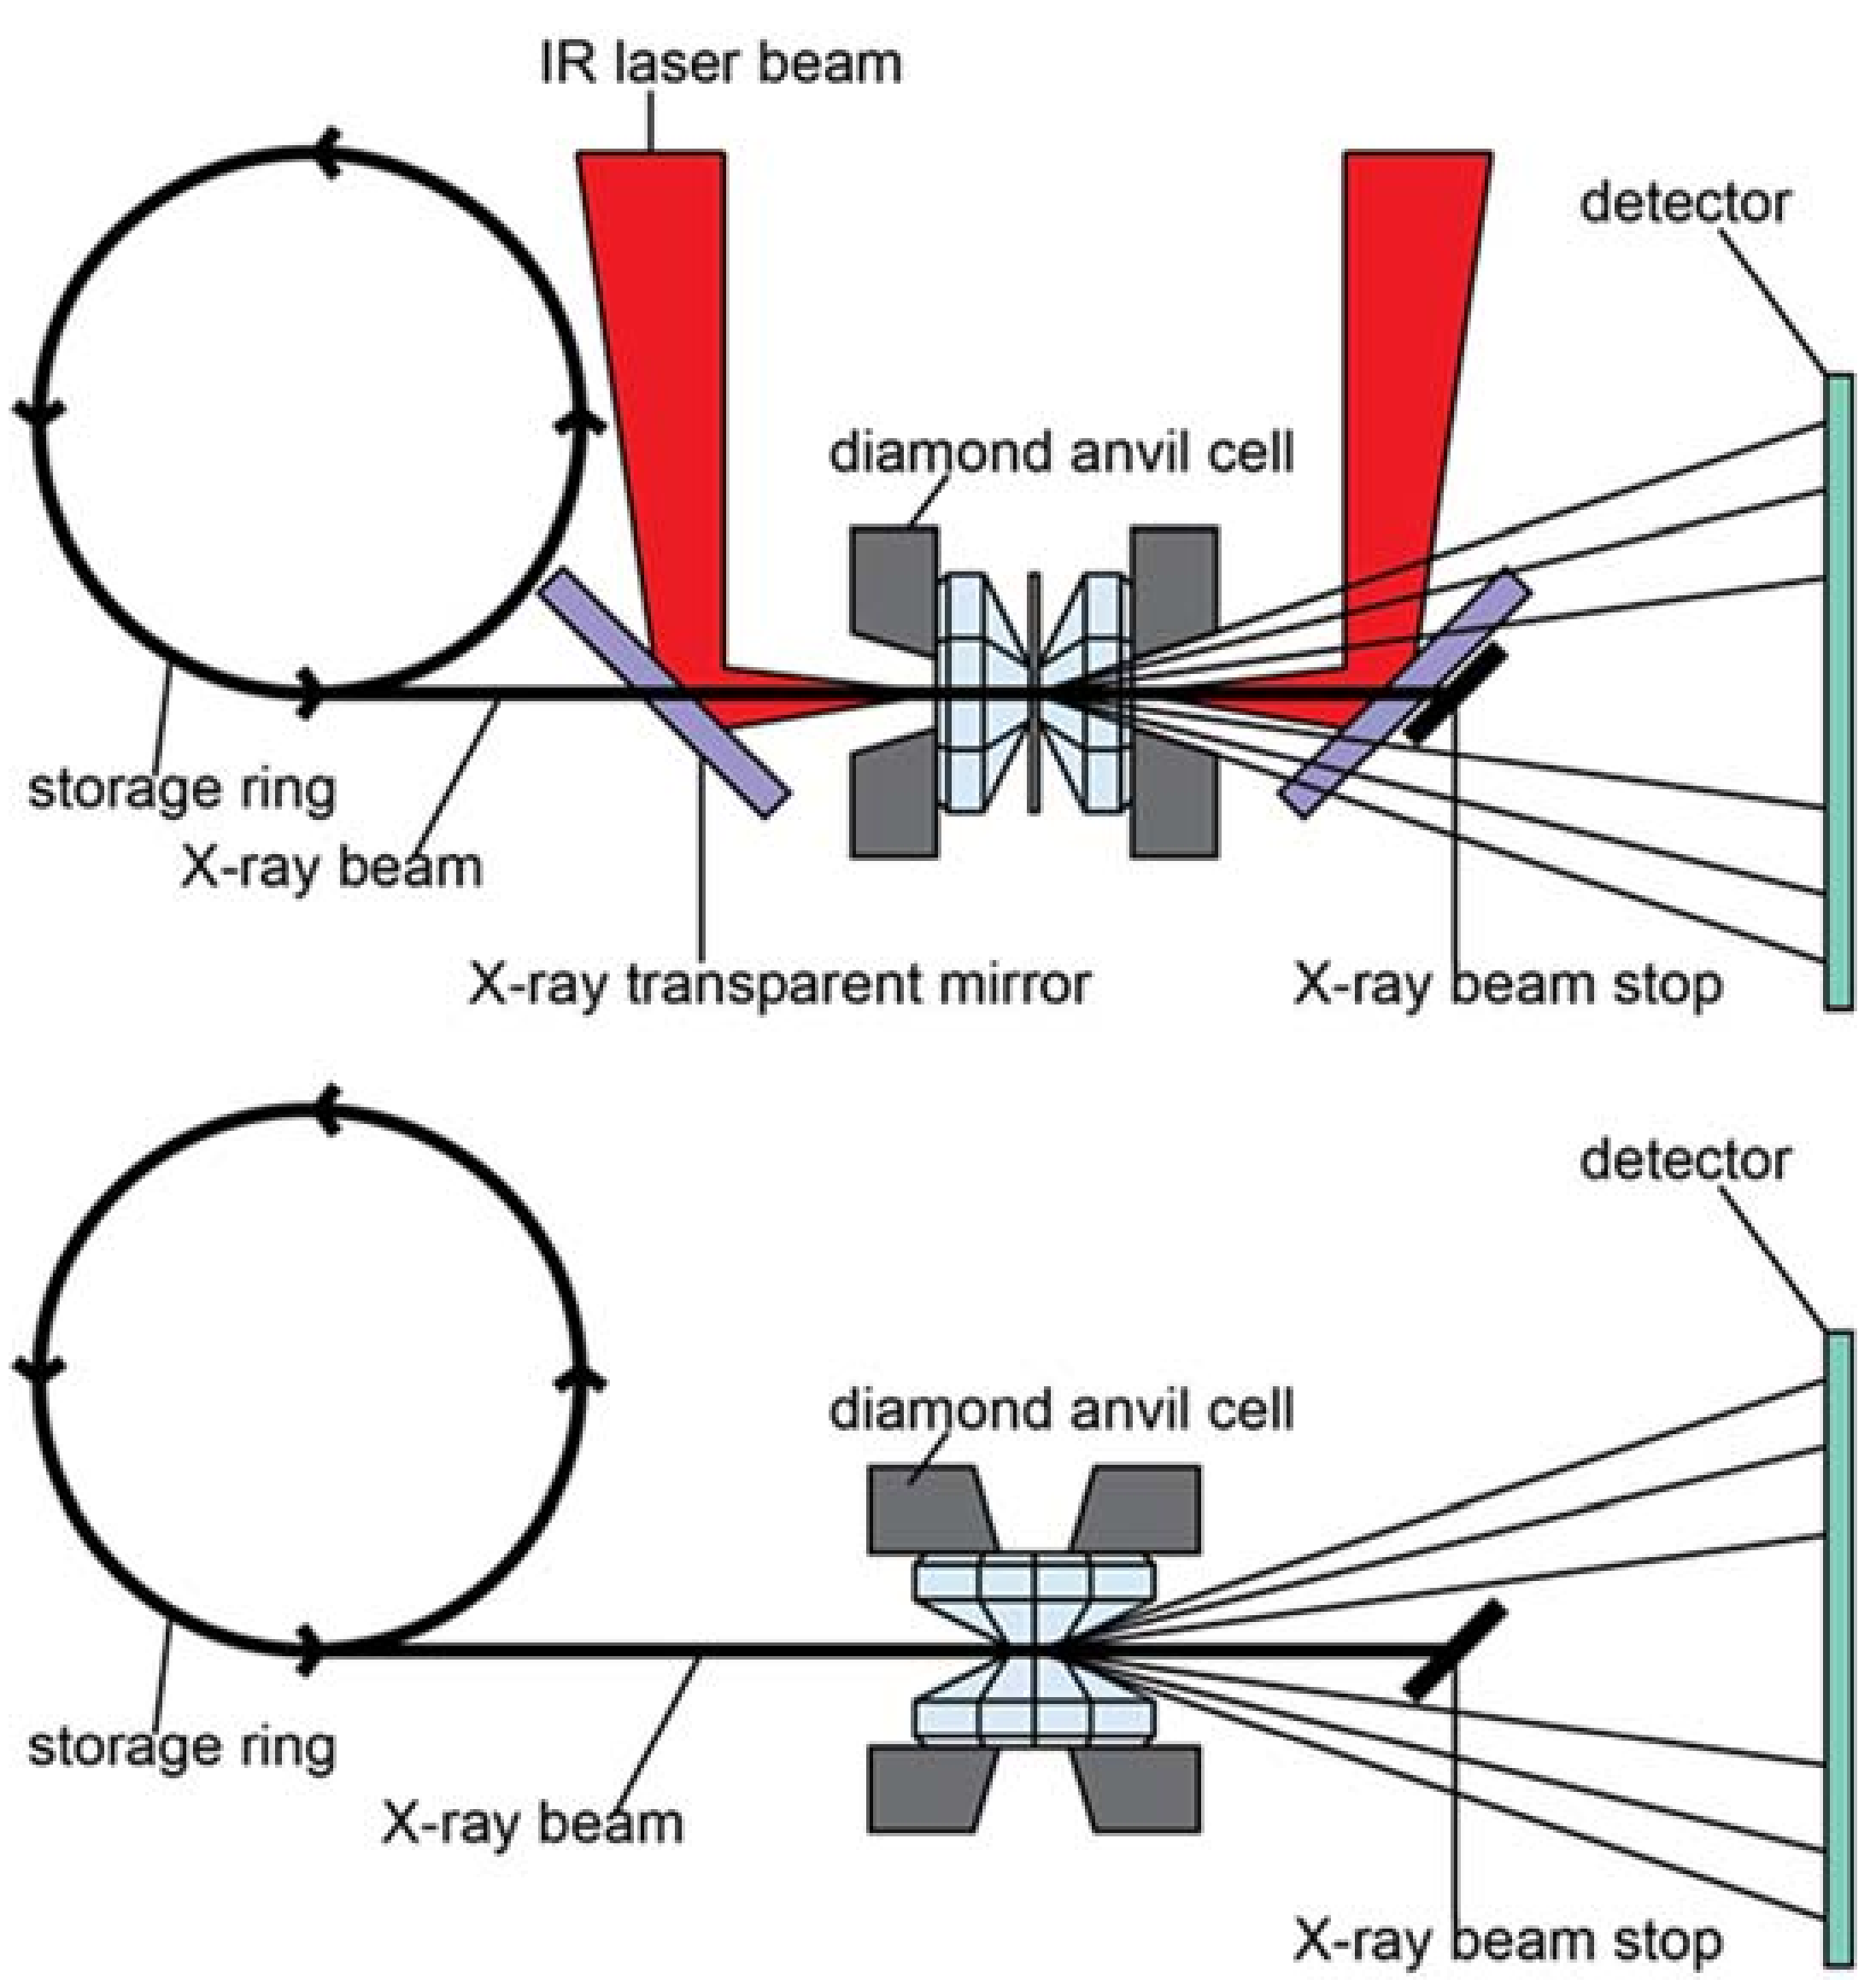
Figure 5.
(a) Typical raw high-pressure (~10 GPa) X-ray powder diffraction pattern (San Carlos olivine) collected during laser heating to ~2000 K. The shadow on the right hand side is caused by the downstream laser heating optics. The broad smooth partial rings on the right side stem from X-ray scattering on the laser mirror. Both artifacts need to be masked out for data reduction and analysis. (b) Integrated diffraction pattern with and without masking of laser heating artifacts.

Figure 6.
Schematic of optical set-up for laser heating and temperature measurement on beamline 12.2.2. (1) 1090 nm fiber laser, (2) IR path, (3) sample position, (4) 80 mm f/2.8 objective lens (5) motorized IR mirror, transparent for vis (6) image and pyrometry beam path, (7) monochromatic 16-bit camera with 700 nm notch filter, (8) 8-bit color GigE camera, (9) motorized remotely controlled mirror, (10) pyrometry signal fed into OceanOptics Jaz spectrometer (OceanOptics, Largo, FL, USA) via optical fiber, (11) light source for sample illumination.

Figure 7.
Optical set-up to rotate the double-sided in-situ laser heating by 90 degrees to enable in-situ laser heating in radial geometry on ALS beamline 12.2.2.
Figure 7.
Optical set-up to rotate the double-sided in-situ laser heating by 90 degrees to enable in-situ laser heating in radial geometry on ALS beamline 12.2.2.
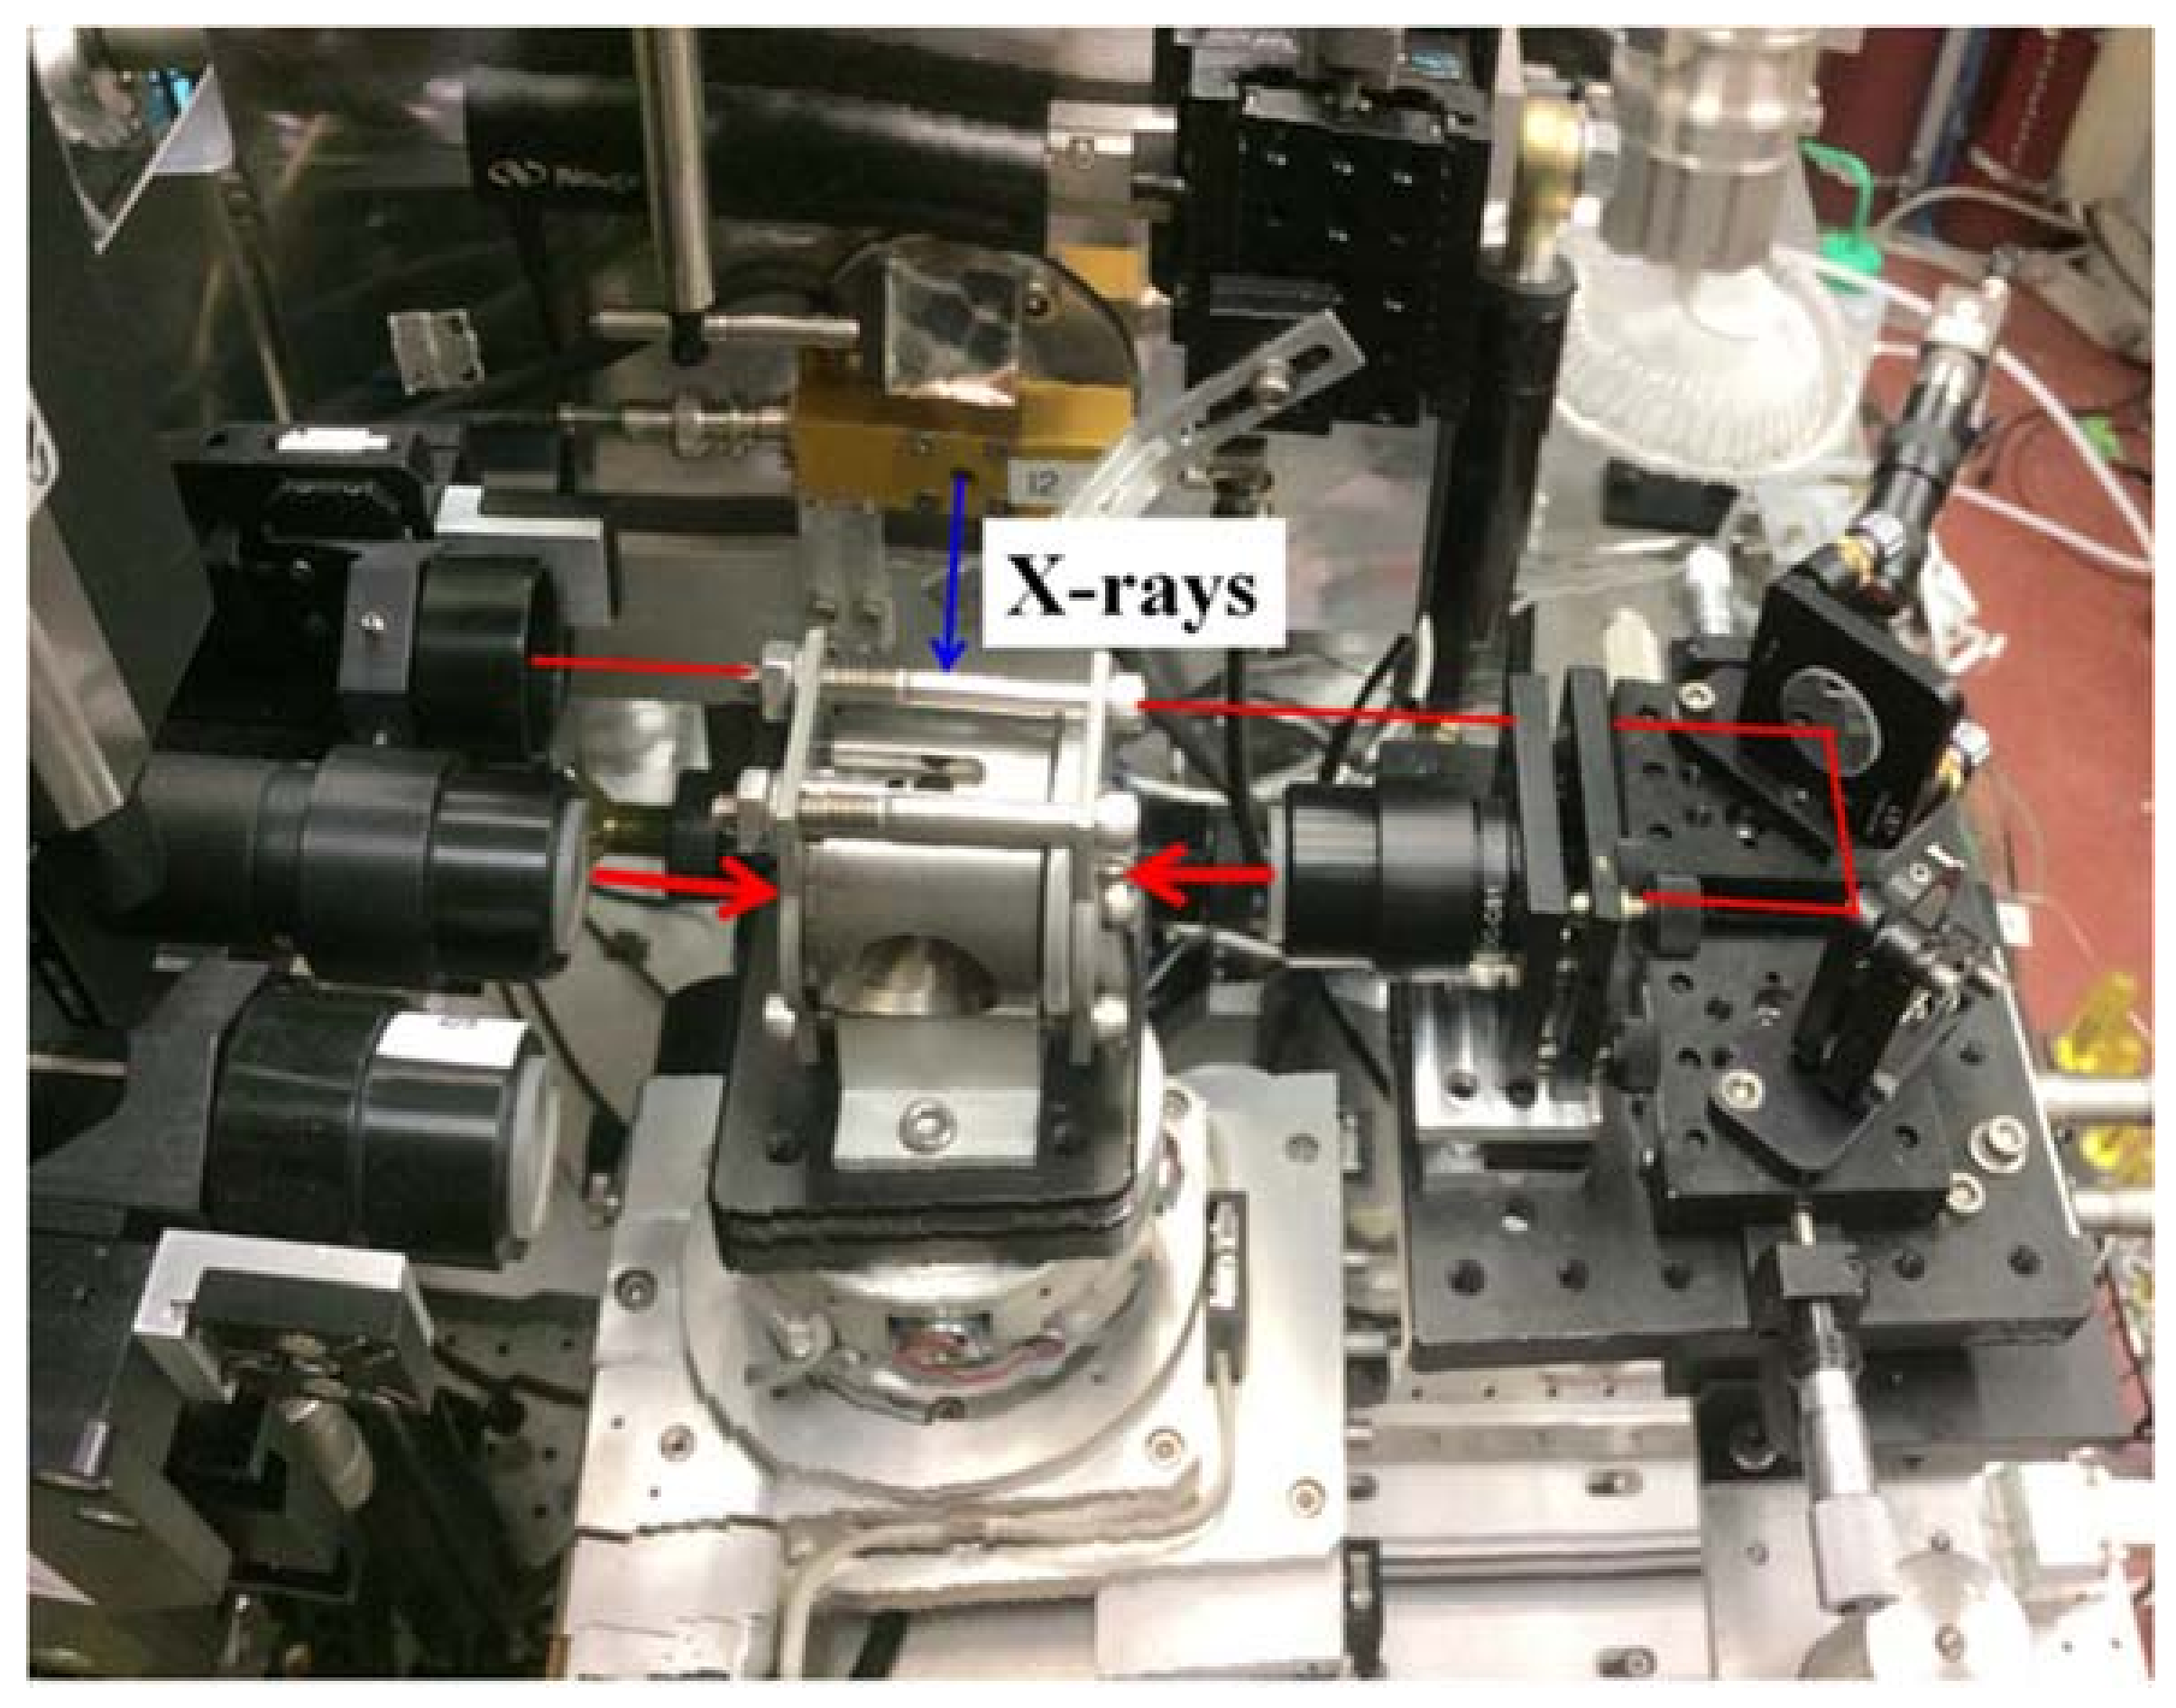
Figure 8.
Raw (a) and azimuthally integrated (b,c) data from a high-pressure powder diffraction experiment in radial geometry. (a) and (b) are the same pattern shown in different configurations, before laser heating. (c) is the same sample but the pattern was collected while laser heating. The fairly intense and structured signals at very low angle are from the X-ray transparent boron-epoxy gasket. Note how the non-isotropic stress-field coupled with the strength of the cold material leads to azimuthal dependent changes in diffraction angle. This is best seen in the ‘unrolled’ representation of the data (b). During laser heating, the strength of the material is reduced and some of the strain in the original sample disappears. At the same time, new spotty lines appear due to a temperature and pressure induced phase transition (c).

Figure 9.
Raw (a) and normalized (b) averaged thermal spectrum from hotspot. This allows the deduction of a global temperature. The temperature map (c) obtained from a monochromatic intensity map of the hotspot has the same global temperature but also shows spatial temperature resolution.
Figure 9.
Raw (a) and normalized (b) averaged thermal spectrum from hotspot. This allows the deduction of a global temperature. The temperature map (c) obtained from a monochromatic intensity map of the hotspot has the same global temperature but also shows spatial temperature resolution.
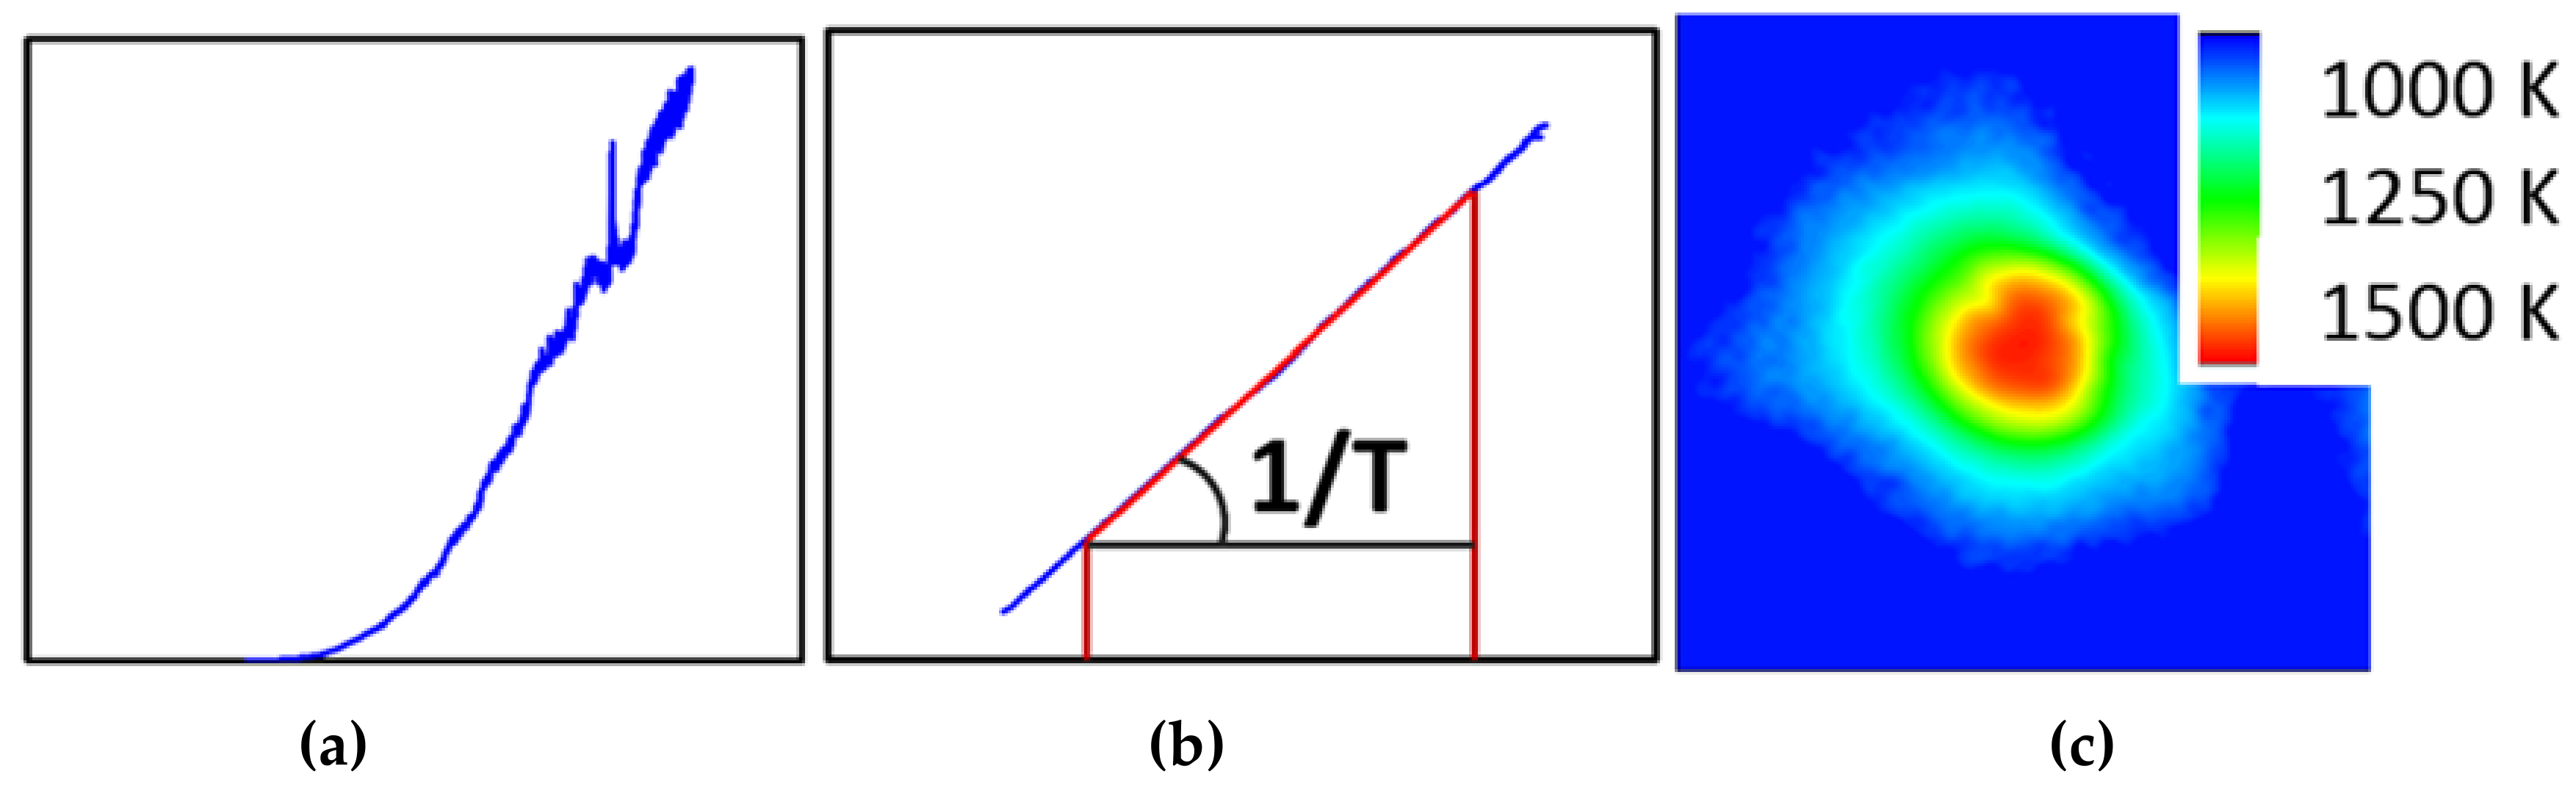
Figure 10.
Photograph of the in operando high-temperature, non-ambient atmosphere powder diffraction set-up on beamline 12.2.2. The sample, contained in a capillary, is immersed in a controlled atmosphere through mass flow controllers attached to the capillary. The sample capillary is sleeved in a SiC tube, which acts as a heat absorber and crates a homogeneous temperature field.

Figure 11.
(a) A single crystal diffraction image, and (b) the same image annotated to indicate pitfalls in single crystal data processing. A is the detector region that is shadowed by the DAC, which must be masked for data reduction. B is a diamond reflection, which can be intense enough to cause secondary diffraction rings, as in this case. Region C contains the diffraction peaks of interest. D is the shadow of the beamstop, which can also require masking. Region E highlights faint powder rings from the gasket; these will vary in intensity throughout the data collection and may also require an angle-dependent masking scheme.

Figure 12.
Schematic diagram of the beamline 12.3.2 setup.

Figure 13.
(a) Side and (b) top view of the 12.3.2 endstation with a diamond anvil cell mounted. The detector is set at 90° with respect to the direct beam. Sample centering is achieved by means of the upper motor stack. Rastering is performed in the xz direction.
Figure 13.
(a) Side and (b) top view of the 12.3.2 endstation with a diamond anvil cell mounted. The detector is set at 90° with respect to the direct beam. Sample centering is achieved by means of the upper motor stack. Rastering is performed in the xz direction.
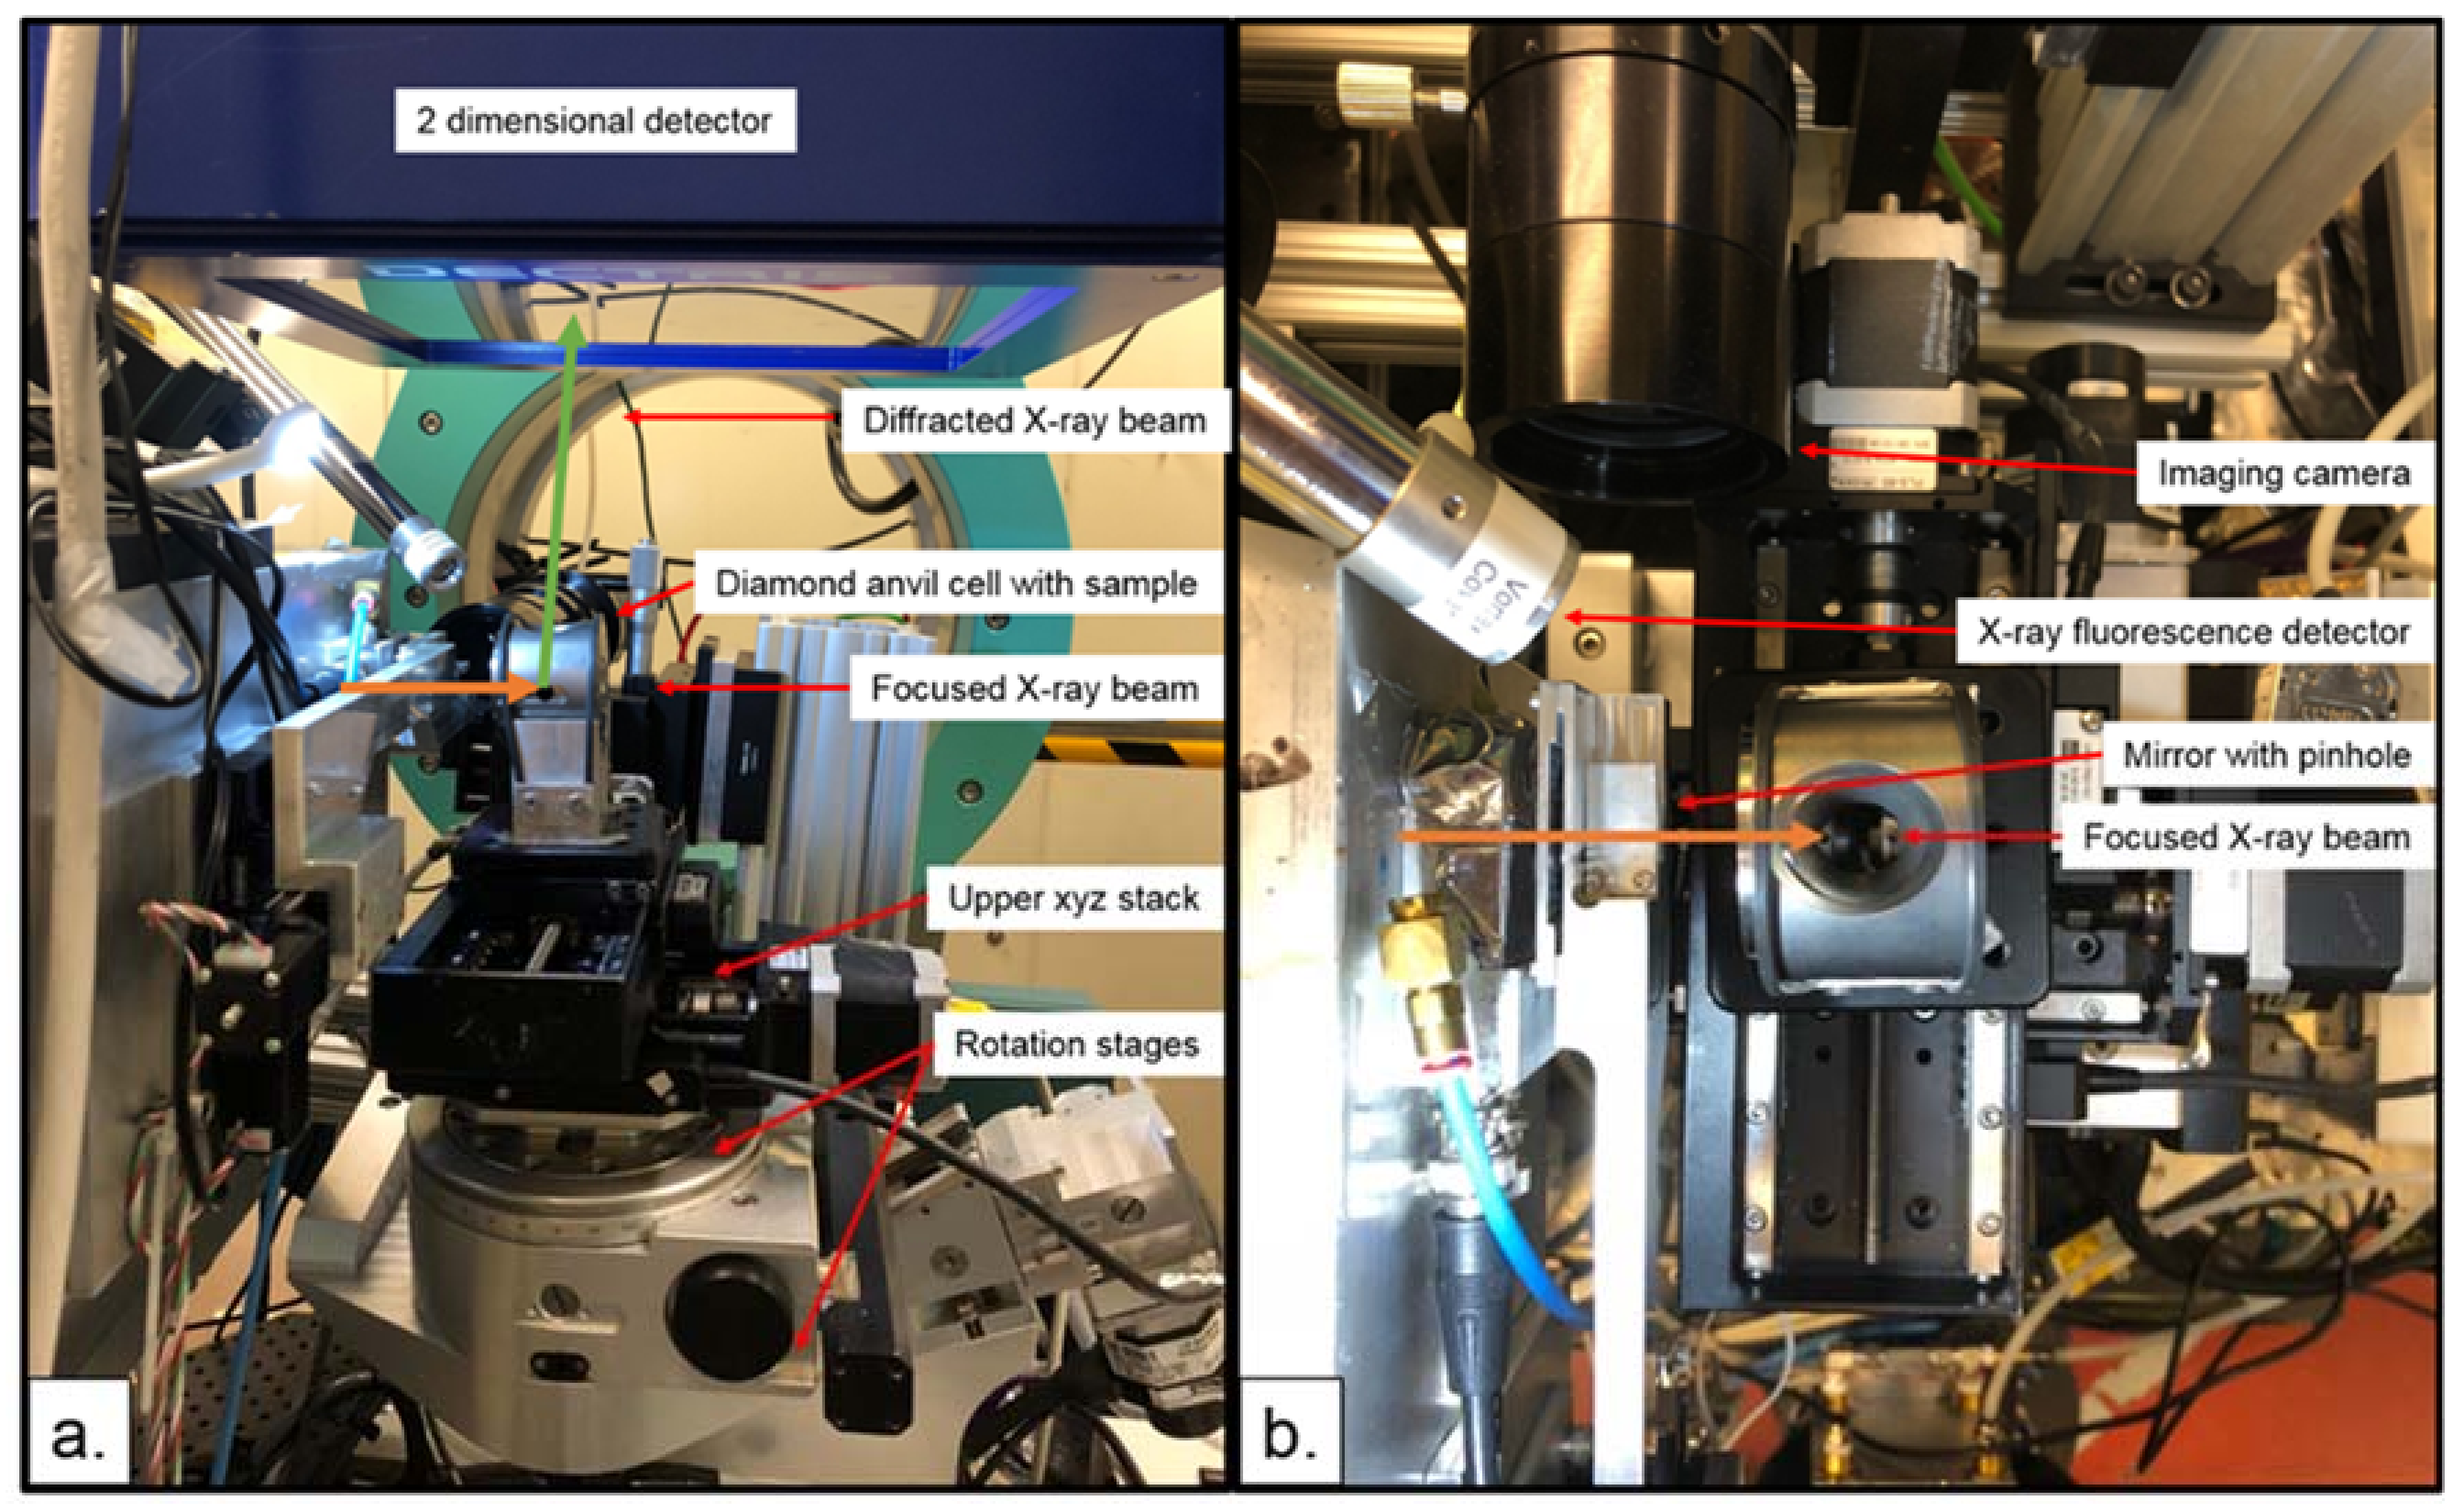
Figure 14.
Example background-subtracted Laue diffraction data in a DAC. Here, a quartz sample was compressed nonhydrostatically and diffraction was collected in 90° geometry. Diamond peaks form the most intense observable diffraction, as the diffracting volume in diamond is orders of magnitude greater than that of the sample. Quartz peaks are less intense and exhibit deformation (e.g., are not Gaussian in shape). A large portion of the detector shows null results, as diffraction at those angles is blocked by the steel DAC body.
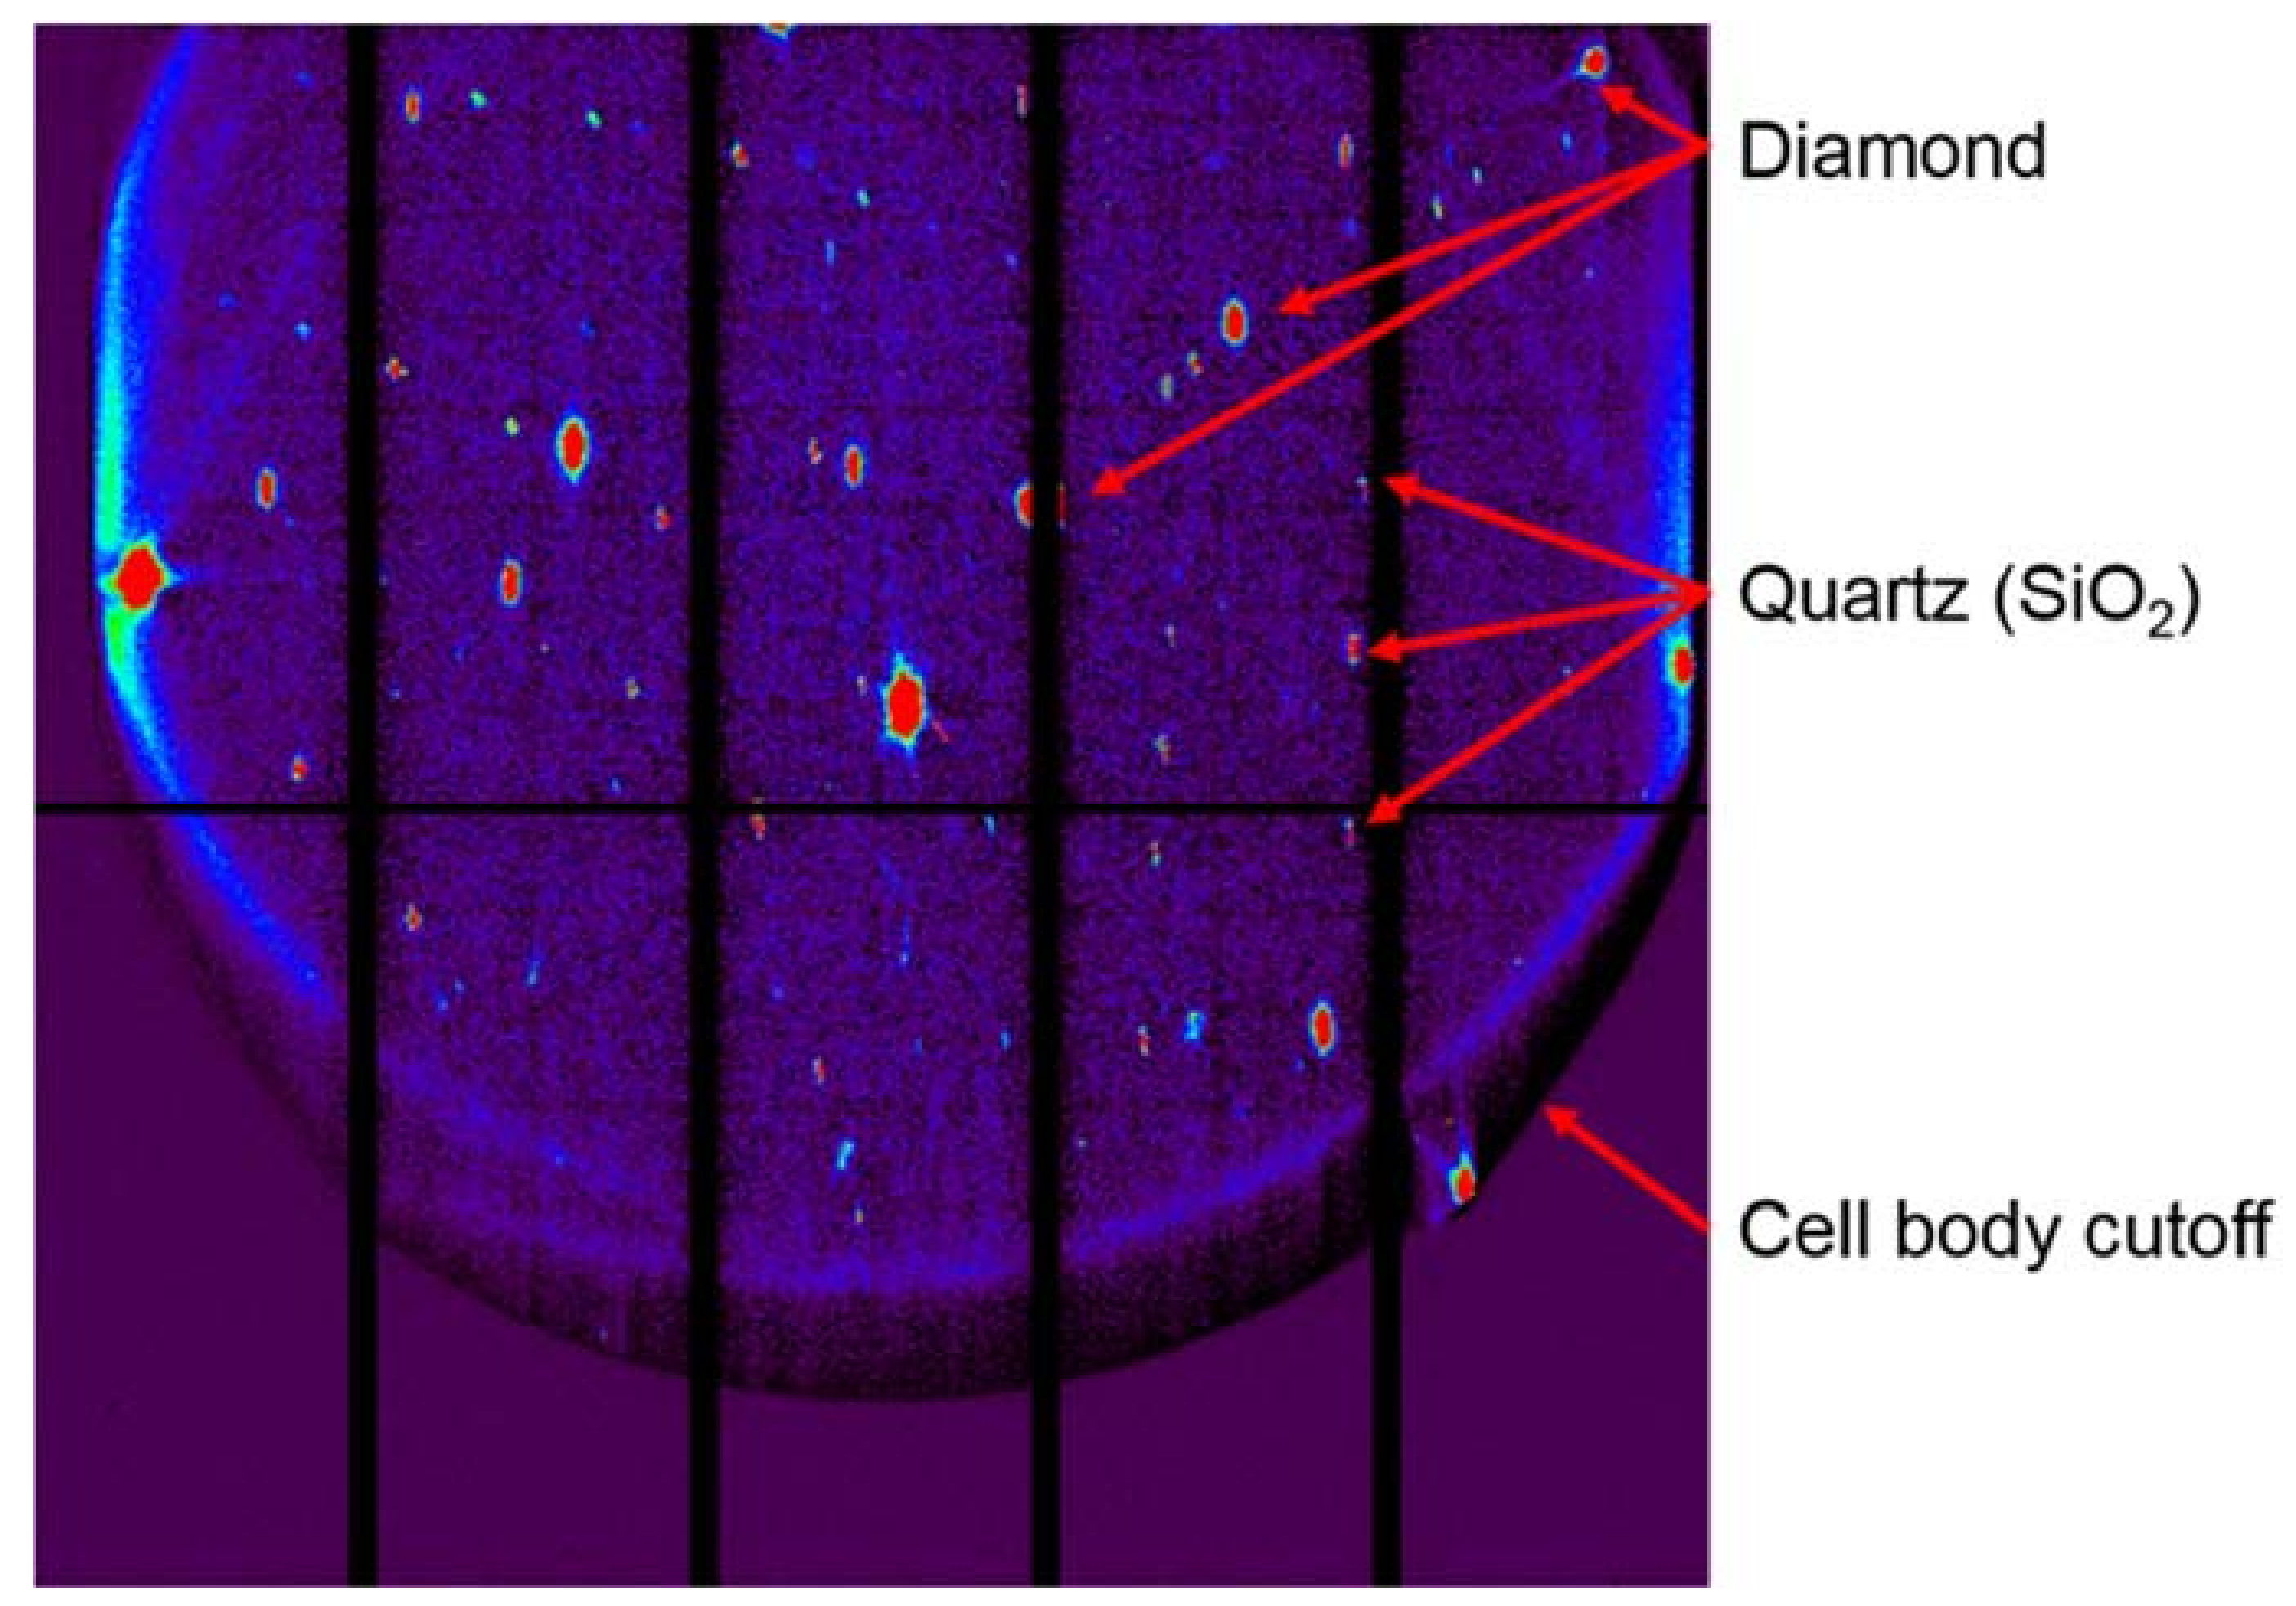
Figure 15.
Metal organic framework (MOF)-520 and MOF-520-BPDC, looking down the b-axis, at 100 K, ambient PT, and the maximum pressure reached. Aluminum atoms are shown as blue spheres, with all other atoms represented as capped sticks. Green ovals guide the eye to some of the BPDC ligands, and the purple circle serves to emphasize the pore size. Figures made in Mercury [74], using CIFs from [53].
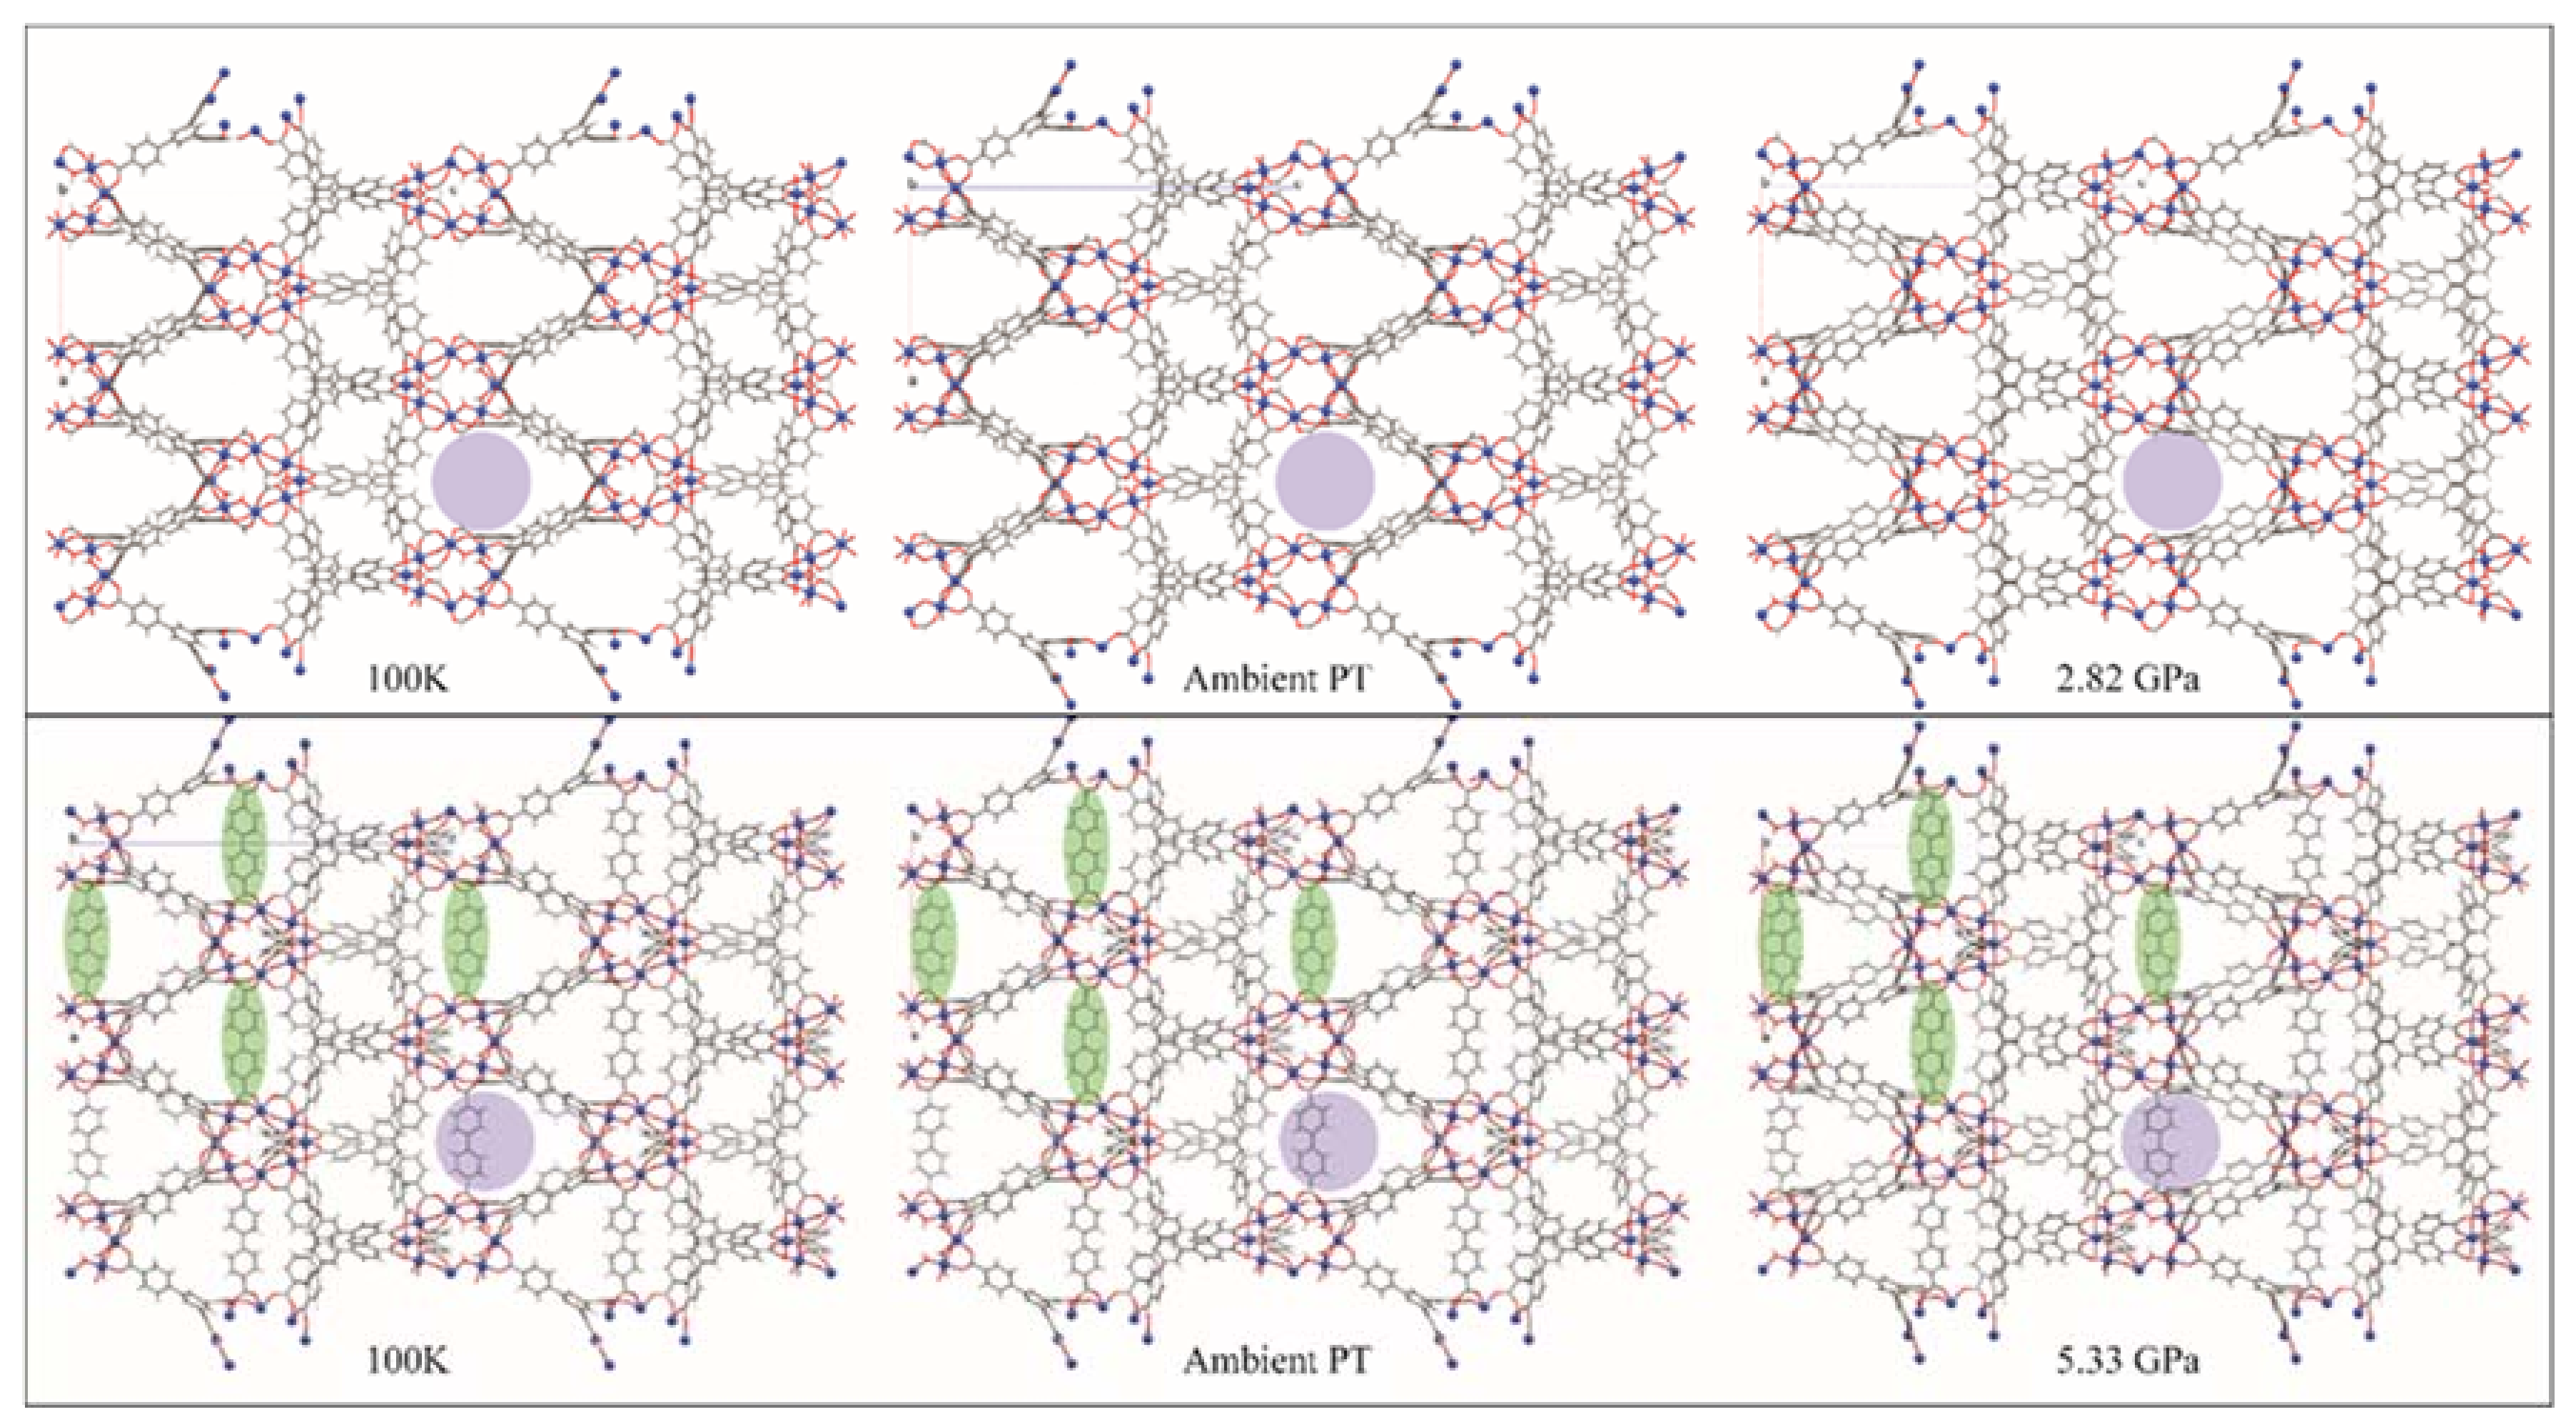
Figure 16.
(a) Strength of hcp iron versus pressure and extrapolated to core temperatures. Linear fit to data is extrapolated to pressures of Earth’s inner core. Uncertainty envelope is shown as dotted black lines. (b) Effect of temperature on bulk strength (t) of hexagonally close-packed (hcp) iron. t is calculated at two pressures corresponding to the top of the inner core (TIC; 329 GPa) and the innermost inner core (IIC; 364 GPa) over a range of temperatures (5500–6200 K), blue and red hatching, respectively. Vertical green line: approximate location of TIC. Vertical orange line: approximate location of IIC. Figure adapted from Gleason and Mao [32].
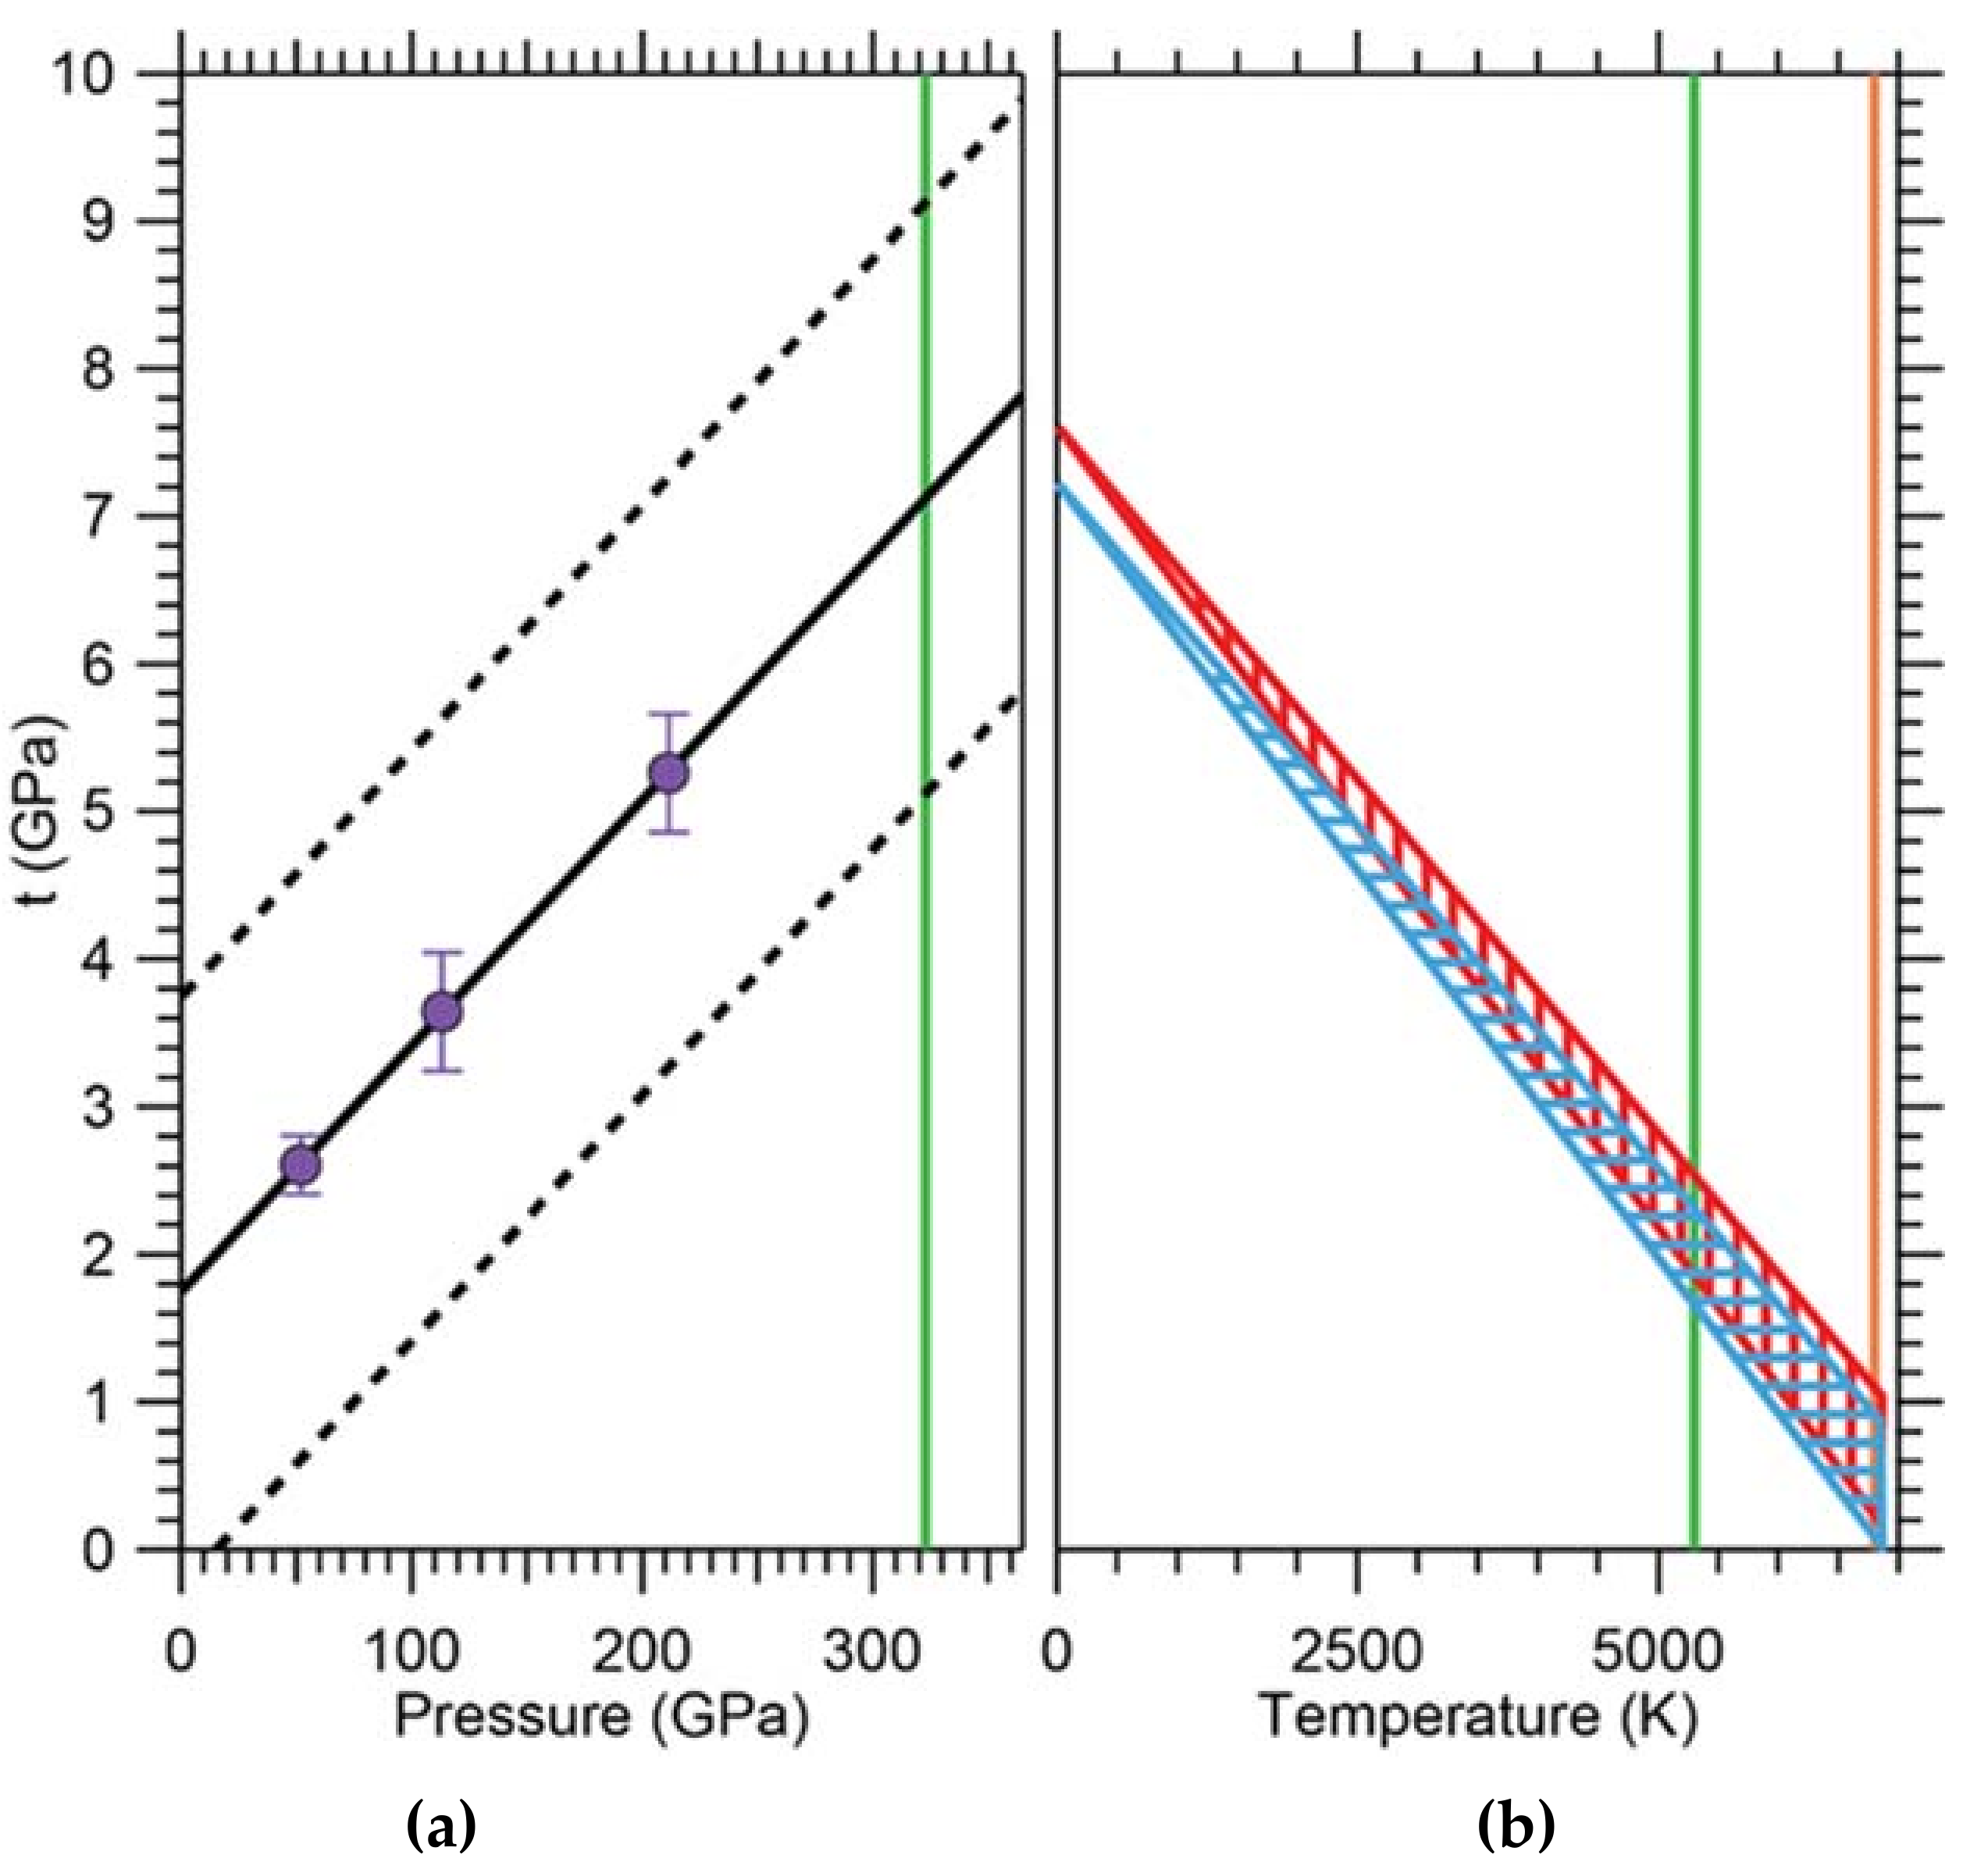
© 2018 by the authors. Licensee MDPI, Basel, Switzerland. This article is an open access article distributed under the terms and conditions of the Creative Commons Attribution (CC BY) license (http://creativecommons.org/licenses/by/4.0/).
Share and Cite
MDPI and ACS Style
Stan, C.V.; Beavers, C.M.; Kunz, M.; Tamura, N. X-Ray Diffraction under Extreme Conditions at the Advanced Light Source. Quantum Beam Sci. 2018, 2, 4. https://doi.org/10.3390/qubs2010004
AMA Style
Stan CV, Beavers CM, Kunz M, Tamura N. X-Ray Diffraction under Extreme Conditions at the Advanced Light Source. Quantum Beam Science. 2018; 2(1):4. https://doi.org/10.3390/qubs2010004
Chicago/Turabian StyleStan, Camelia V., Christine M. Beavers, Martin Kunz, and Nobumichi Tamura. 2018. "X-Ray Diffraction under Extreme Conditions at the Advanced Light Source" Quantum Beam Science 2, no. 1: 4. https://doi.org/10.3390/qubs2010004