Acetonitrile-Induced Destabilization in Liposomes


1
Department of Mechanical Systems Engineering, Graduate School of Science and Engineering Yamagata University, 4-3-16, Jonan, Yonezawa, Yamagata 992-8510, Japan
2
Department of Physics and Mathematics, College of Science and Engineering, Aoyama Gakuin University, 5-10-1 Fuchinobe, Chuo-ku, Sagamihara, Kanagawa 252-5258, Japan
*
Author to whom correspondence should be addressed.
Colloids Interfaces 2018, 2(1), 6; https://doi.org/10.3390/colloids2010006
Submission received: 25 January 2018
/
Revised: 8 February 2018
/
Accepted: 8 February 2018
/
Published: 11 February 2018
Abstract
:To understand the behavior of cellular interfaces, it is important to clarify the effect of chemical compounds on artificial cell membranes. In this study, an aqueous acetonitrile solution was mixed with a suspension of lipid vesicles, and the changes in vesicle behavior arising as a result of acetonitrile application were observed. The fast Fourier transformations (FFTs) of the membrane waviness/crinkliness of the vesicles were carried out, and the membrane thermal fluctuations were analyzed. The experimental results show that the addition of acetonitrile molecules enhances the fluctuation of lipid membranes. In particular, the mode fluctuation was significantly enhanced. This finding is expected to lead us to a further understanding of the fundamental properties of living cells.
1. Introduction
The stability and dynamic nature of biological membranes play essential roles in living cells, namely in processes such as membrane trafficking and autophagy [1]. The cell membranes as a cellular interface is one of the most important biological membranes. The physical conditions of cell membranes, for instance, influence the rate of the cell division [2]. Moreover, another literature shows that thermal fluctuation is necessary for cell division of bacteria [3]. For this reason, it is important to understand the stability and dynamic behavior of biological membranes.
Artificial model systems of biological membranes, such as liposomes and water-in-oil (W/O) droplets, are quite beneficial for studies of the dynamic behaviors of biological membranes owing to the fact that liposomes and W/O droplets can be easily prepared and possess a simple membrane structure [4,5,6]. Using such liposomes, it was shown that the surfactants, such as Triton X-100 and ethanol, with amphiphilic properties have an ability to invade the lipid bilayers and to form lipid/surfactant mixed micelles, which consequently induce destabilization and destroy the lipid bilayer structure [7].
Such studies of membrane dynamics are related to physico-chemical approaches to the construction of artificial cells and are related to applications to drug delivery systems (DDSs) [8,9,10,11]. Living cells are composed of various molecules such as lipids, proteins, and sugar chains [1], and their behaviors are complex. In addition, to control drug release using lipid membrane systems and non-biological molecules are quite difficult. Hence, it is important to elucidate the fundamental effect of various chemical compounds, including bio-inspired molecules in lipid membrane systems.
Acetonitrile is commonly known as a polar and a toxic molecule [12,13]. It has been suggested that the systemic toxic effects of acetonitrile are mainly mediated through the metabolic transformation into cyanide in the cell [12]. Hence, it is important to elucidate the physical interactions between acetonitrile and model cell membranes to clarify how the molecule affects living cells and invades the cellular interface. Nevertheless, there are few reports have shown the detailed influence of acetonitrile, compared with other organic solvents such as ethanol as shown above, on the dynamic behavior of model cell membranes [7]. A study probing the influence of acetonitrile, which has an ability to induce the phase transition of lipid bilayer membranes [14,15,16], on the mesoscopic dynamics of giant lipid vesicles via real-time observation was reported [17]. In the case of this previous study, observation was carried out, starting from the contact of vesicle suspension and acetonitrile aqueous solution, under a non-uniform distribution of acetonitrile (non-equilibrium state). The results suggested that a high concentration (>20 vol %) of acetonitrile induces an increase in the spontaneous curvature of lipid bilayers and vesicular bursting as a result of the invasion of these molecules into the outer leaflet of the lipid bilayers. However, the effect of low concentrations of acetonitrile molecules on the membrane stability and fluctuations has not yet been studied by direct observation using optical microscopy under uniformly distributed acetonitrile conditions.
In the present study, we show the mesoscopic effect of a low concentration (5 vol %) of acetonitrile on giant lipid vesicles under a uniform distribution of acetonitrile using optical microscopy, since optical microscopy is appropriate for the direct observation of the dynamic behavior of lipid membranes.
2. Materials and Methods
2.1. Materials
Acetonitrile, chloroform, and dioleoylphosphatidylcholine (DOPC) were obtained from Wako Pure Chemical Industries, Ltd. (Osaka, Japan). Rhodamine B 1,2-dihexadecanoyl-sn-glycero -3-phosphoethanolamine, triethylammonium salt (rhodamine DHPE, fluorescent lipid, nm, nm) was obtained from Invitrogen (Waltham, MA, USA). Ultra-pure water was obtained using a WT101UV Autopure system of Yamato Scientific Co., Ltd. (Tokyo, Japan).
2.2. Preparation of Giant Lipid Vesicles
The DOPC vesicles were prepared using a gentle hydration method reported in the previous studies [4,5,17]. Briefly, DOPC and rhodamine DHPE were first dissolved in chloroform and the solution was poured into a small test tube. Next, the chloroform was removed over a more than 2 h under vacuum to afford a thin lipid film at the bottom of the tube. Finally, ultra-pure water was added to the tube containing the lipid film and the sample was then incubated at 38 for more than 2 h. The concentrations of DOPC and rhodamine DHPE in the vesicles were determined to be 0.2 mM and 2 M, respectively.
2.3. Microscopic Observation
We observed the prepared lipid vesicles using methods similar to those reported in the previous study [5]. The vesicle suspension was gently mixed with an aqueous solution of acetonitrile, and the mixed suspension was incubated for more than 10 min to achieve sufficient dispersion of acetonitrile molecules (uniform dispersion of acetonitrile). The aqueous acetonitrile solution utilized in this study was prepared at two different volume fractions, 0 and 10 vol %. The concentrations of DOPC and rhodamine DHPE in the observed suspensions were 0.1 mM and 1 M, respectively, and the concentrations of acetonitrile were 0 (control) and 5 vol % acetonitrile in each experiment. The ratio of DOPC/acetonitrile was 1/10,000 by mole in the case of 5 vol % acetonitrile. We compared the dynamic behaviors of vesicles without (0 vol %) and with (5 vol %) acetonitrile. Previously, we confirmed the effect of acetonitrile with above 10 vol % [17]; hence, we set the acetonitrile concentration at 5 mol % in this study. In the next step, a small amount of the mixed suspensions was sandwiched between two glass cover slips, and the suspensions were sealed with vacuum grease. The thickness of the vacuum grease spacer was approximately 1 mm. The lipid vesicles were observed using a fluorescence microscope BX40 (Olympus, Tokyo, Japan) through a 40× objective lens at (room temperature). Video recordings of the vesicles were obtained using a digital camera DP73 (Olympus, Japan) at a frame rate of 15 fps. Each sample was exposed to light ( nm) supplied by an Hg lamp through a WIG filter set (Olympus, Japan) to excite the fluorescent dye. We observed 50 vesicles for each condition (without and with acetonitrile, 100 overall). It is considered that rotational diffusion is ignorable because we could not observe the flow and significant Brownian motion (see movies).
2.4. Extraction of Positions of Membrane Surface
The microscopic images were cut into pixels and converted to greyscale (8 bit) for certain thresholds using ImageJ (National Institute of Health, Bethesda, MD, USA) [18]. Subsequently, the pixels corresponding to the membrane surface were extracted and the positions of these pixels were recorded using a program made by the authors. Figure 1a,b show an example of a microscopic image and a representation of an extracted membrane surface. For every observed vesicle, we extracted images approximately every 1 s from video frames acquired over a certain arbitrary time range of 0–18 s (observation time). We used the focus in images of the closest video frames from every 1 s over a period of 0–18 s.
2.5. Statistical Analysis
We used a two-tailed Student’s t-test to determine the p-value for statistical analysis.
3. Results and Discussion
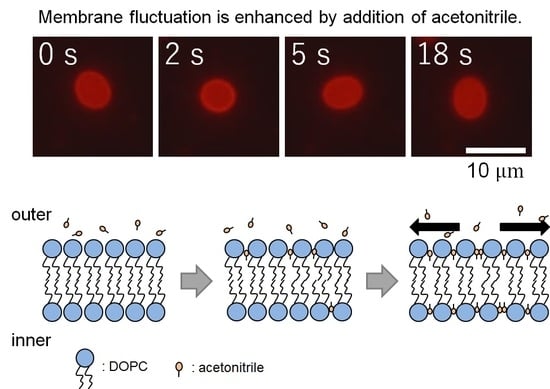
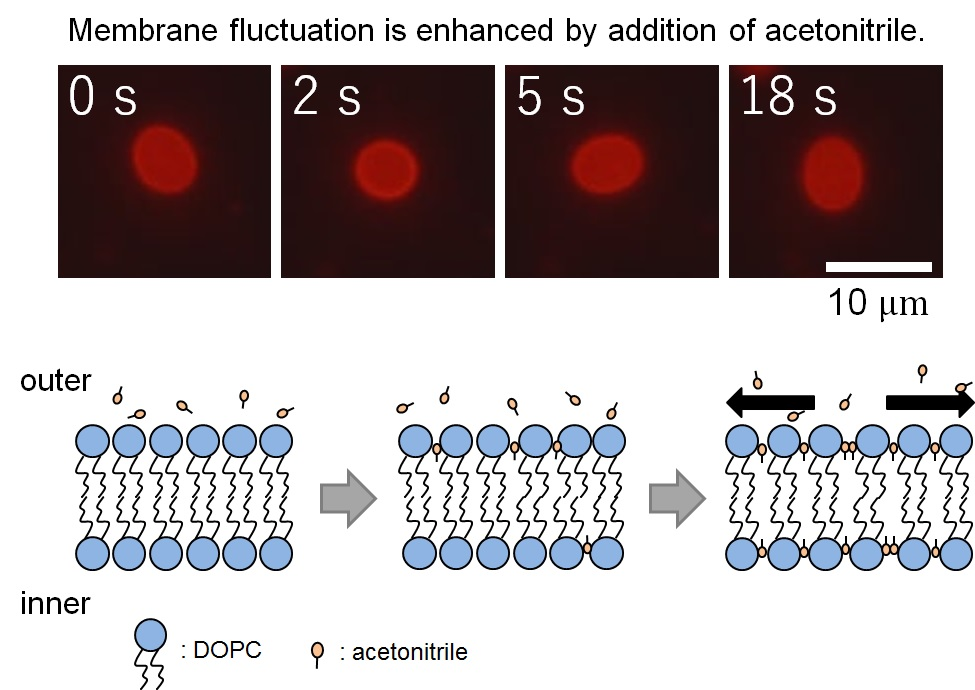
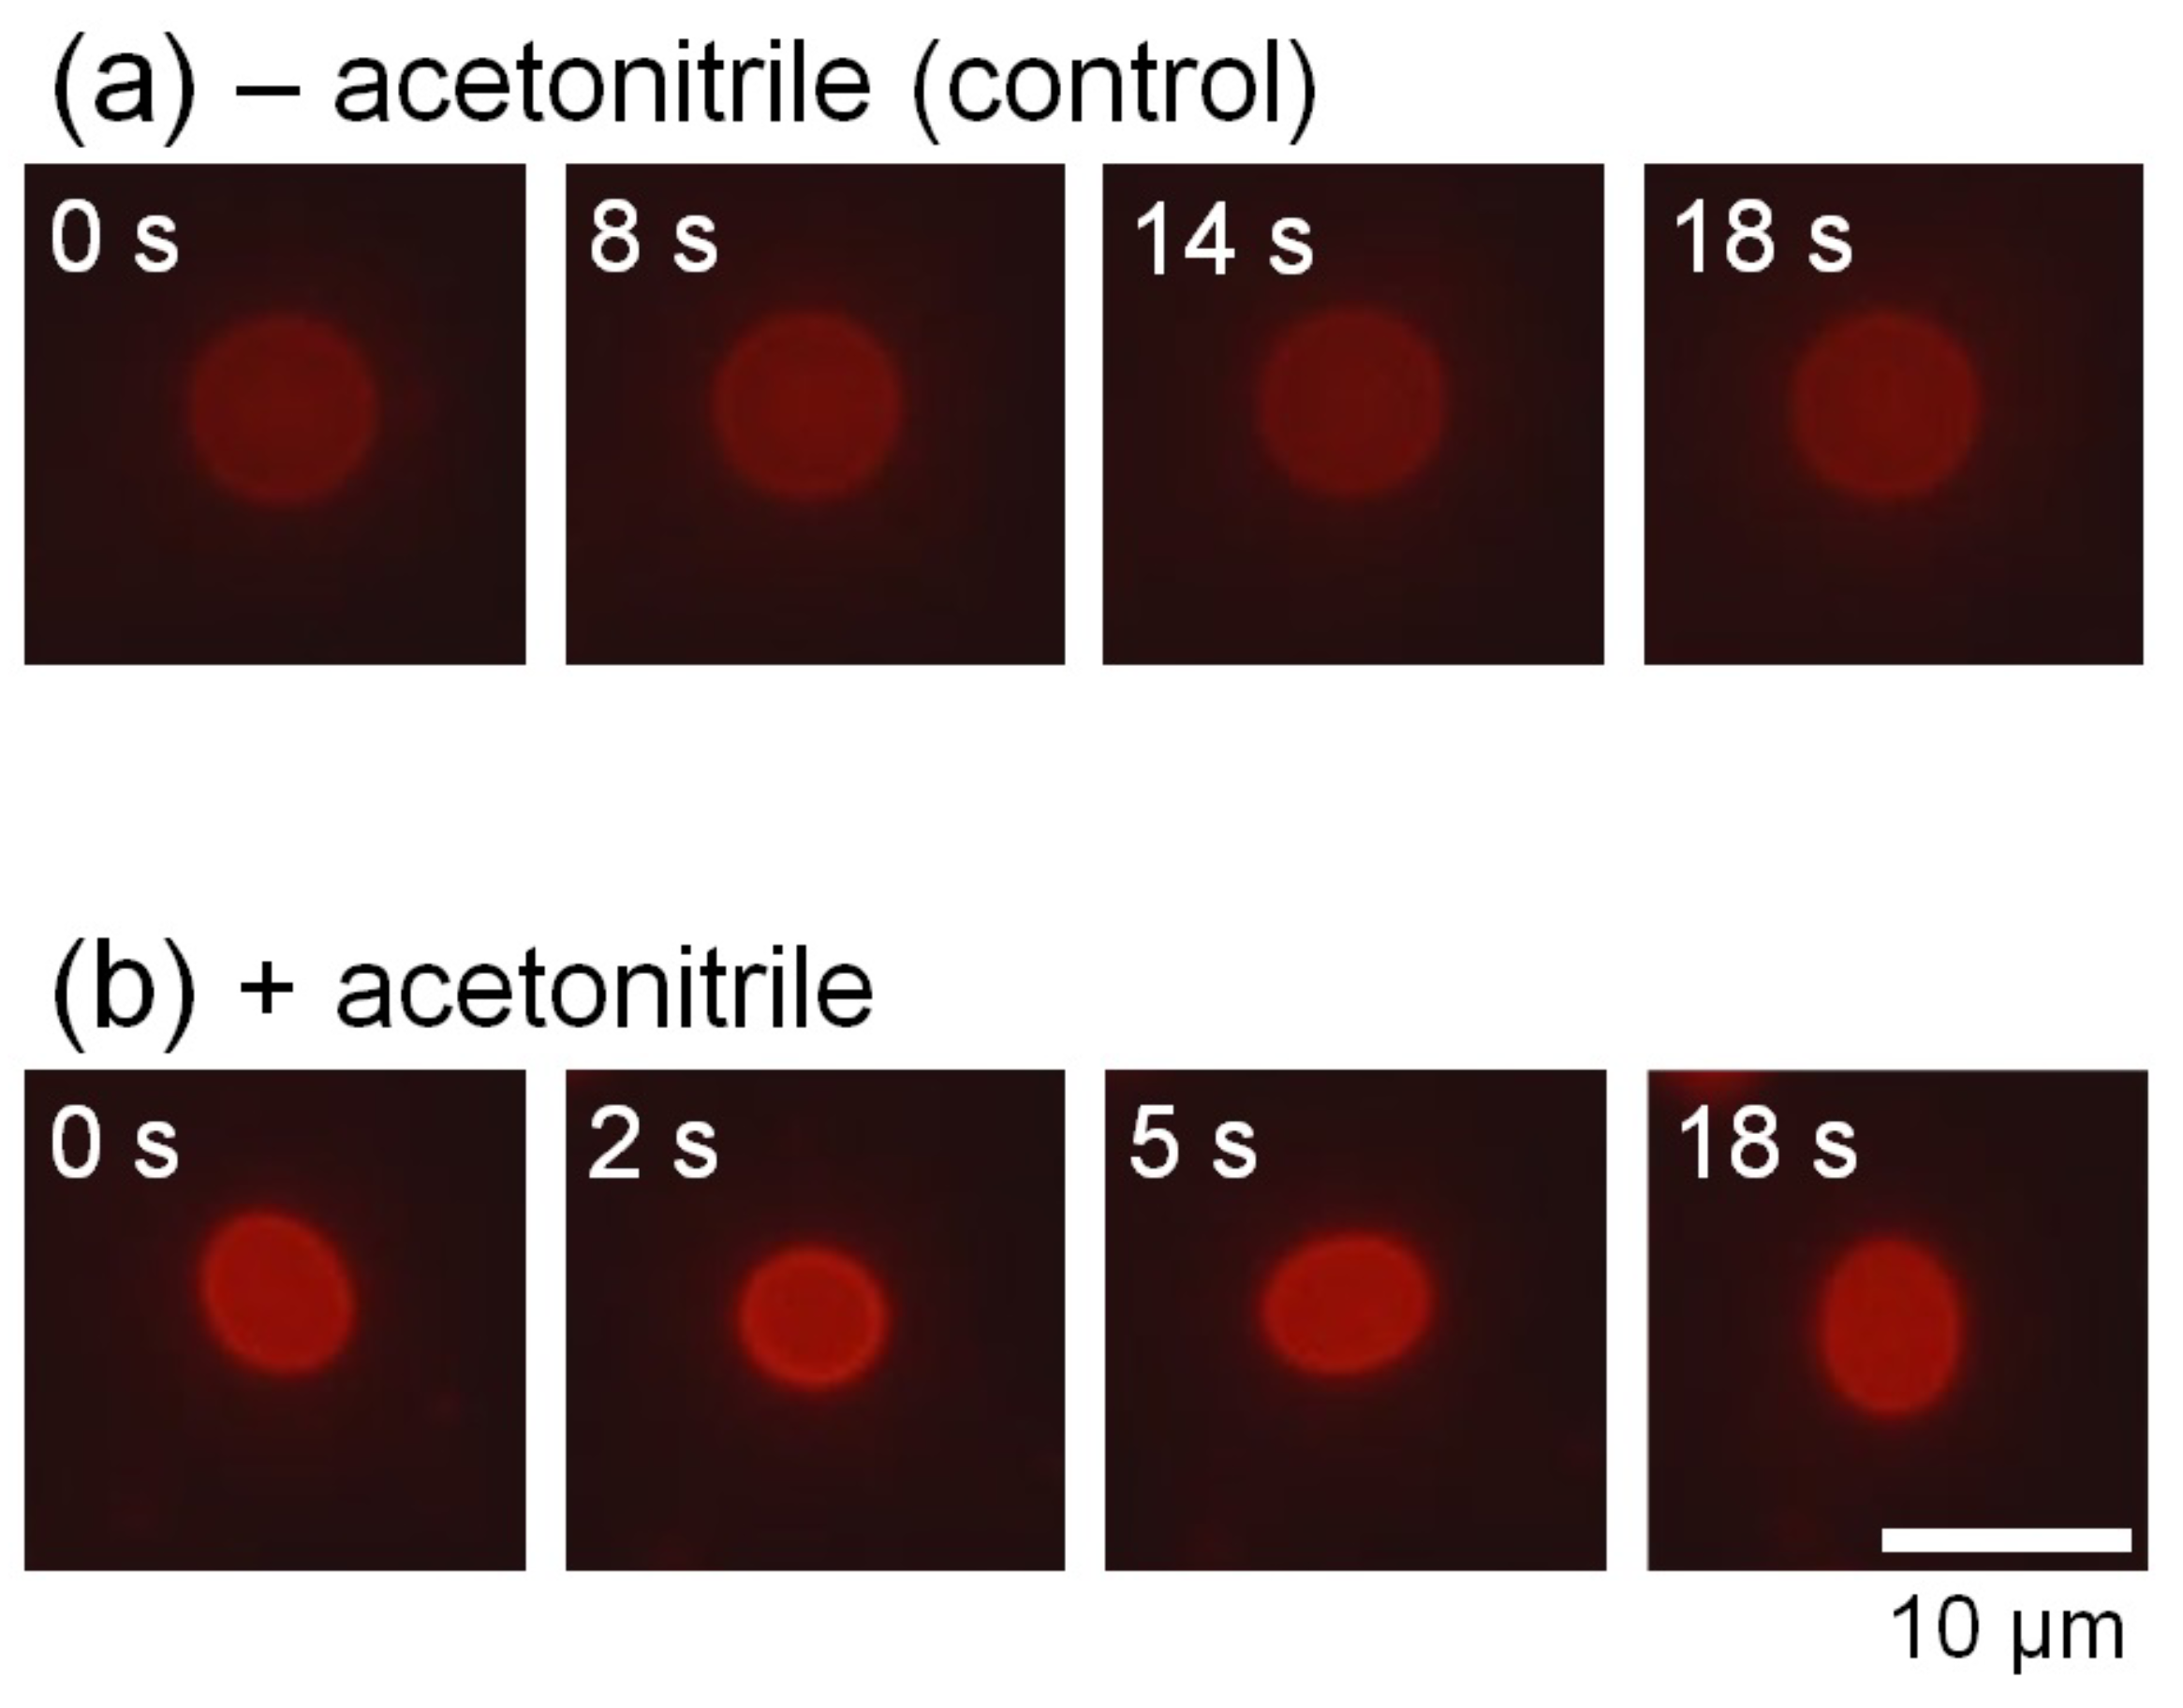
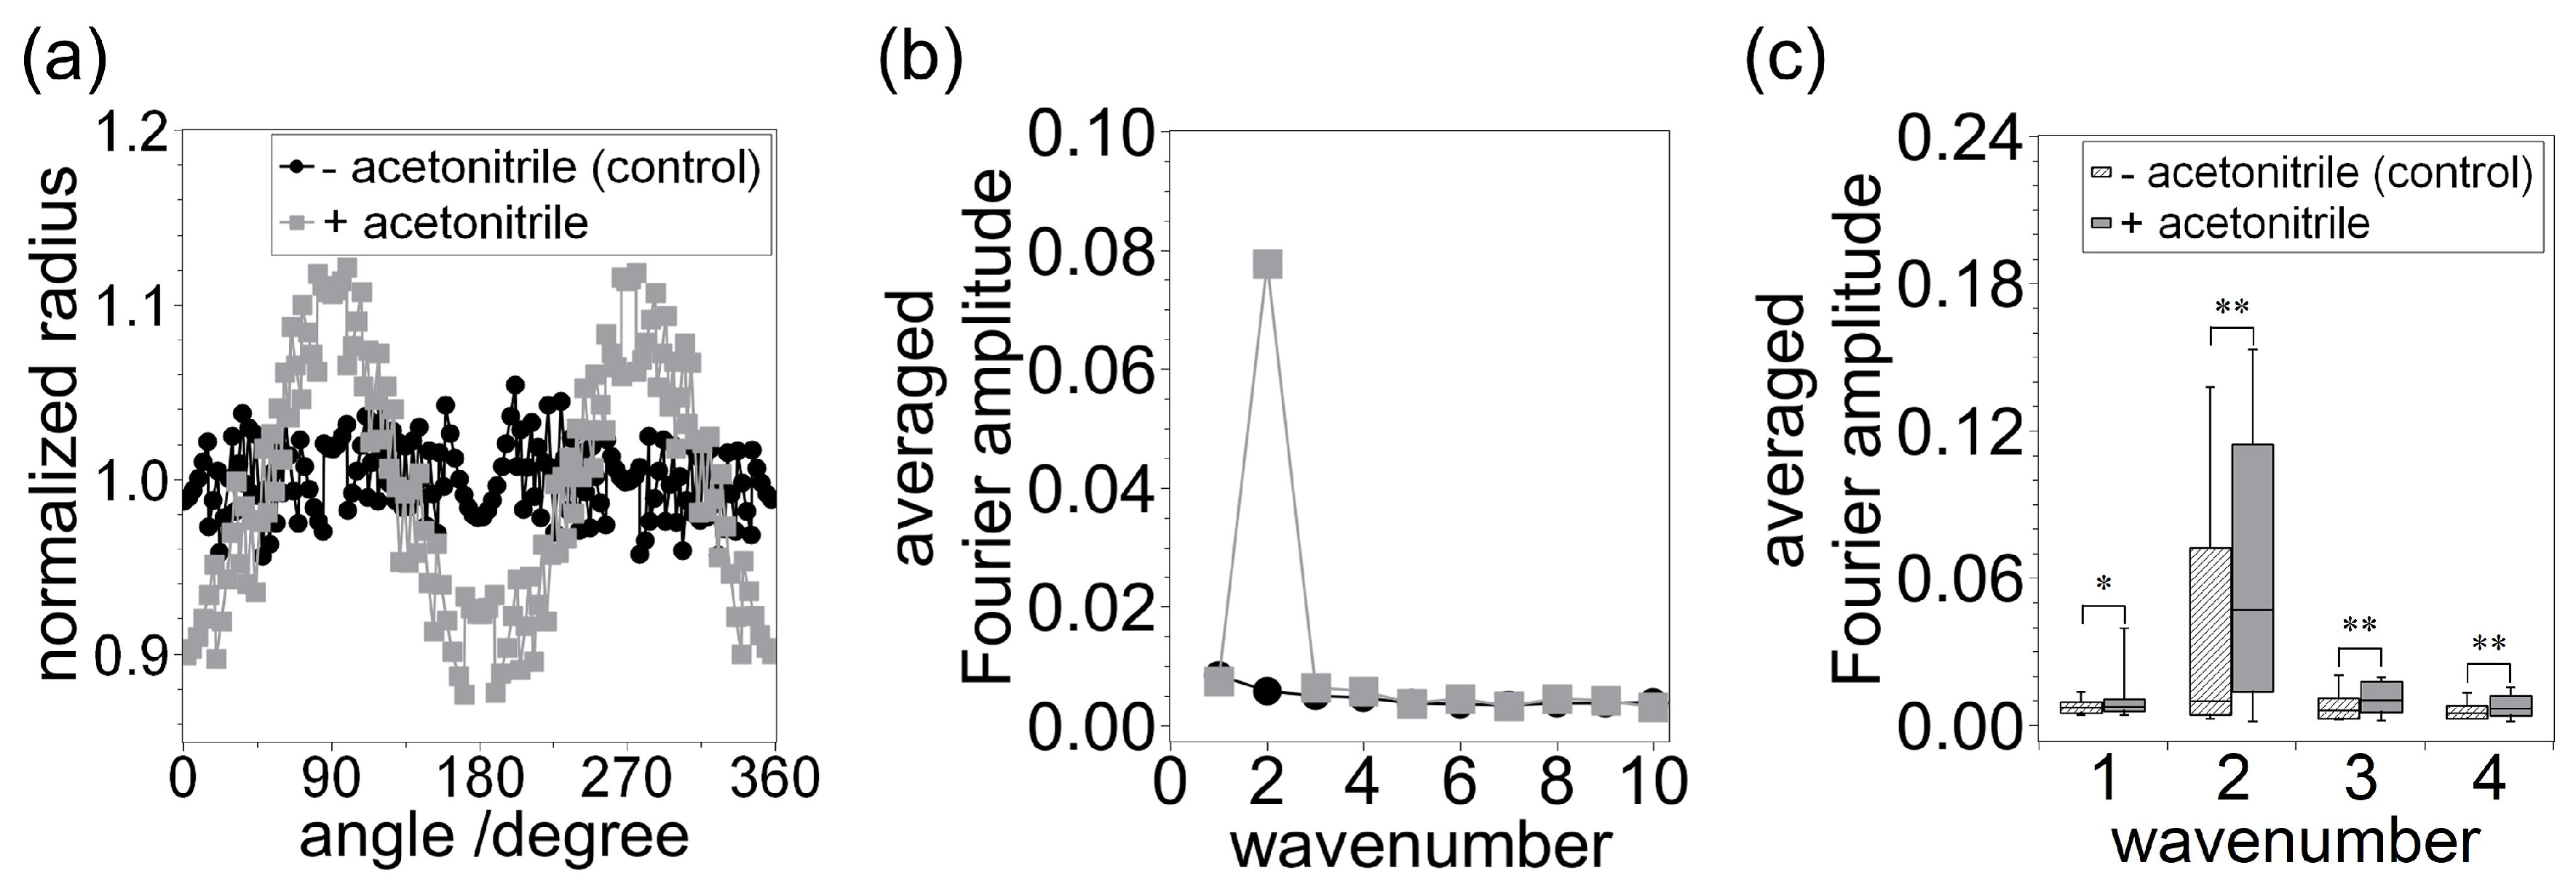
We observed the membrane thermal fluctuations in the absence (control) and presence of acetonitrile. Figure 2a,b show the typical microscopic images of membrane fluctuations obtained without and with acetonitrile molecules, respectively. In the presence of acetonitrile molecules, the vesicles significantly fluctuated, whereas the vesicles lacking acetonitrile did not display notable deformation. Figure 3a shows the radius of vesicles determined for all angles and normalized using the value of the mean distance from the center of mass of the measured membrane surface to the measured points (see Figure 1) at an arbitrary elapsed time of 18 s, corresponding to Figure 2a,b. These results demonstrated that the membrane displacement in samples with added acetonitrile (Figure 2b) was larger than in the control sample (Figure 2a). Next, we employed the fast Fourier transformation (FFT) to calculate the time-averaged Fourier amplitude of the normalized radius and to quantify the vesicular shapes, which is defined as follows:
where represents the Fourier amplitude, t is the arbitrary elapsed time, k is the wavenumber of membrane waviness/crinkliness, is the radius as a function of elapsed time and angle, is the ratio of the circle circumference to its diameter, and i is the imaginary unit. The part represents normalized radius as a function of time and angle by averaged radius. Hence, this equation represents the time-averaged value of normalized Fourier amplitudes during observation, which corresponds to amplitude at each wavenumber k at time t. Figure 3b shows the averaged values of Fourier amplitude determined as a function of wavenumber k. The range of the averaged values of Fourier amplitude is roughly 0.00–0.01, and there is no large peak for the control vesicle. In contrast, the value determined in the presence of acetonitrile has a large peak at (approximately 0.08). These results indicate that acetonitrile induces deformation into an ellipse shape in the cross section of the vesicle, and this observation is in agreement with results of studies reported previously by several groups [4,19]. To confirm the reproducibility of this phenomenon, we investigated the statistical properties of the averaged Fourier amplitudes. Figure 3c shows a box plot of the distribution of Fourier amplitude values at , 2, 3, and 4. The number of vesicles observed in each condition (without and with acetonitrile) was set at 50. The horizontal line shown inside each box represents the median value, upper and lower lines indicate the range of values in the 10 to 90 % range, and whiskers denote the range of values between the minimum and maximum values. The histograms corresponding to the data shown in Figure 3c are displayed in Figure S1 of Supplementary Materials (SM). At , 3, and 4, the distribution of the averaged values of the Fourier amplitude was shown to be in a higher range in vesicles with added acetonitrile compared with the control vesicles (). The difference in distributions at was especially remarkable, and the difference in median values determined in the absence and presence of acetonitrile was approximately 0.04. These results indicate that the cross-section-examined vesicles have a strong tendency to deform to an ellipsoidal shape (spheroid in three dimensions).
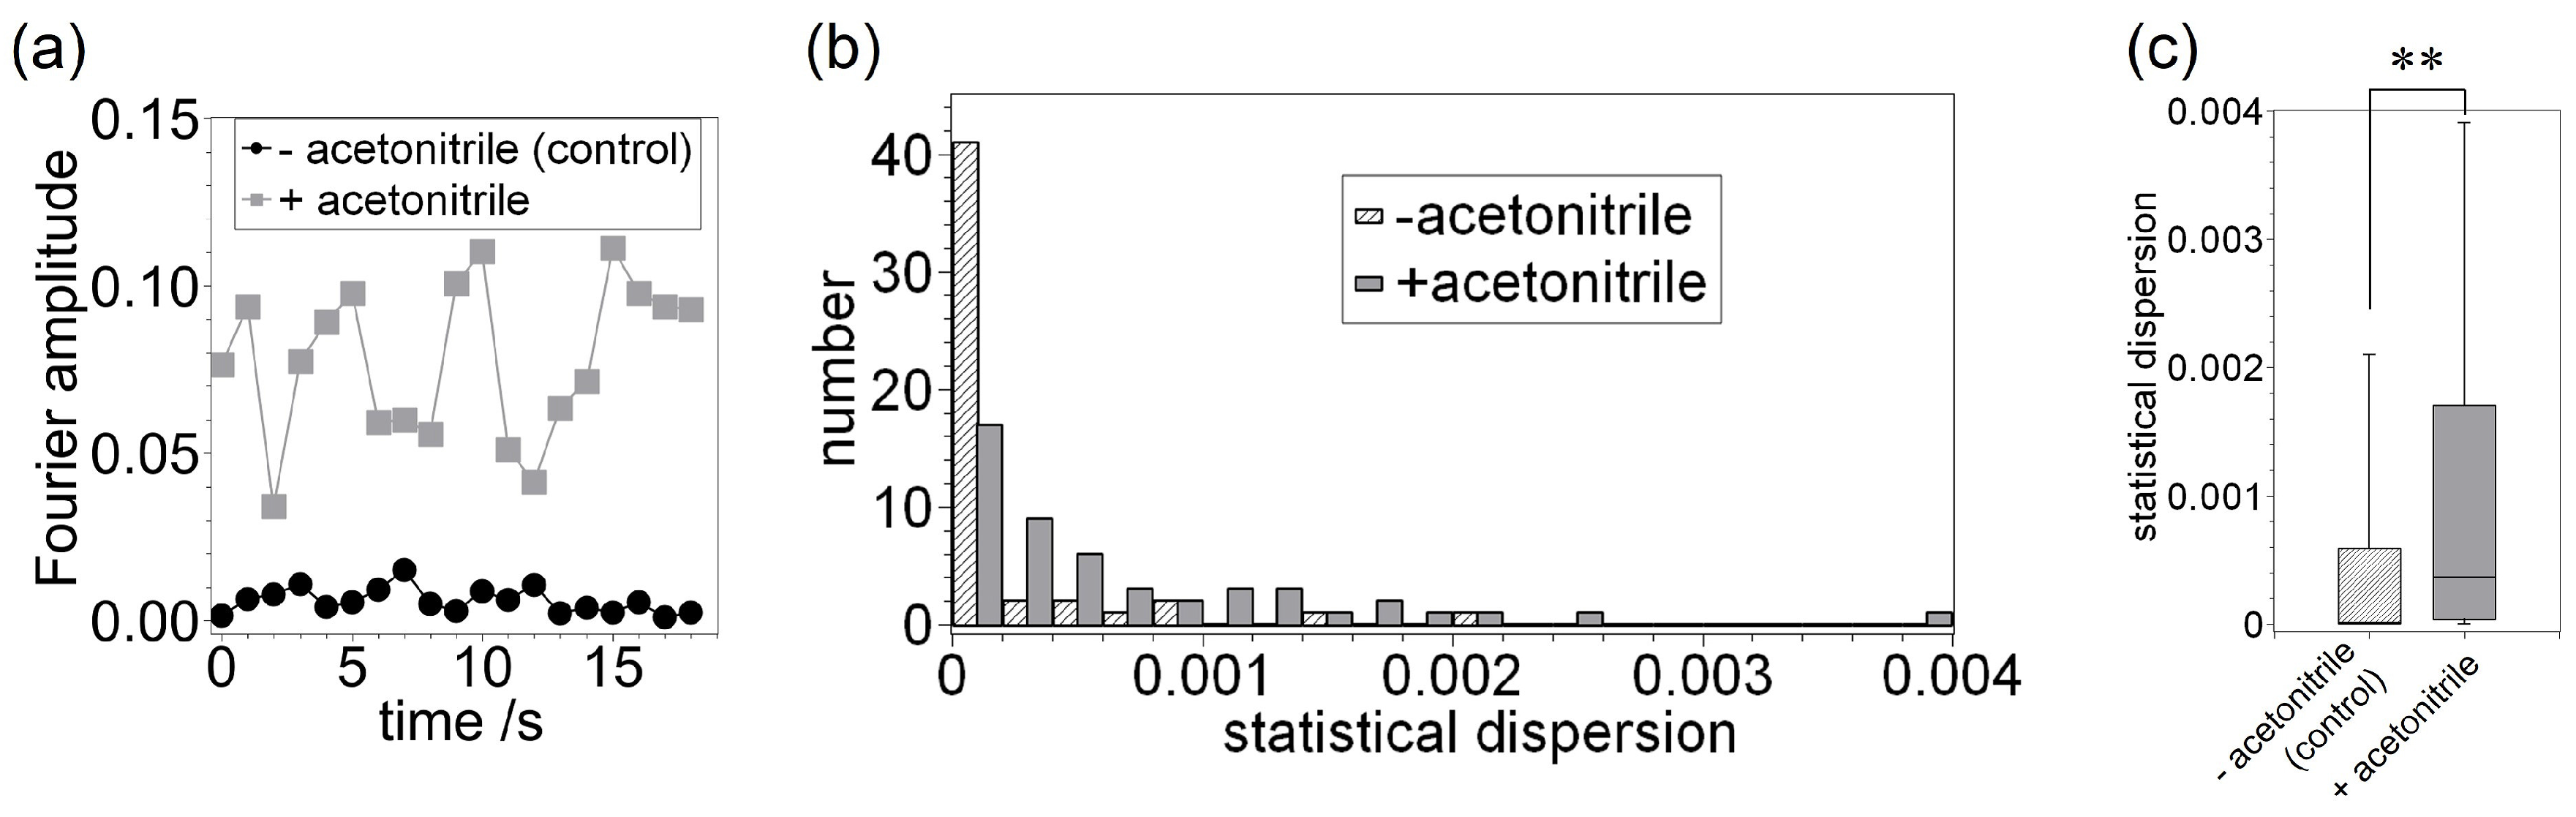
Next, we investigated the time-dependent changes in the Fourier amplitude at , as shown in Figure 4a. In the control sample, the maximum Fourier amplitude was approximately 0.02. In contrast, the Fourier amplitude was found to change significantly with elapsed time in the presence of acetonitrile and its values were in the 0.03–0.11 range. These results suggest again that the vesicle is being deformed into a fluctuating spheroidal shape as a result of the addition of acetonitrile molecules. To confirm the time-dependent tendency of the Fourier amplitude values, we analyzed the statistical dispersion of Fourier amplitude at and after an arbitrary elapsed time, which is defined as follows:
Figure 4b shows the histogram of the statistical dispersion of Fourier amplitude values at as a function of arbitrary elapsed time 0–18 s ( each). The statistical dispersion of Fourier amplitude values represents the time-dependent variation range. In all cases except for the range of 0–0.0002, the numbers in the presence of acetonitrile are higher than that in the absence of acetonitrile. Figure 4c shows the box plot distribution of such statistical dispersion, corresponding to data shown in Figure 4b. These figures also indicate that the dispersion of the Fourier amplitude in a vesicle with acetonitrile are higher and possess a wider distribution compared to those determined for the control vesicle (). This outcome suggests that the addition of acetonitrile leads to the deformation of vesicles and an enhancement of membrane thermal fluctuations. In other words, acetonitrile has an ability to destabilize membrane conditions.
It is speculated that the cause of vesicular deformation and the enhanced fluctuation of vesicles is the invasion of the acetonitrile molecules into lipid bilayers. It has been reported that such an invasion induces vesicular bursting in the case of a non-uniform distribution of acetonitrile and, compared to this study, a higher acetonitrile concentration (>20 vol %, lipid concentration was approximately the same as that of this study) [17]. With a lower concentration (such as that in this study), the acetonitrile molecules are gently inserted into the outer leaflet and are transferred to the inner leaflet at a certain rate. The acetonitrile molecules then push aside the lipids, which is main component of the bilayer vesicles. Such invasion induces an increase in the surface area of the vesicles without changing the volume and enhances the fluctuation of the vesicles with an increase of softness. The relationship between the acetonitrile concentration and the insertion rate of acetonitrile molecules into the lipid bilayer was discussed in the above-mentioned study [17].
Previous studies, via simulation, showed that small polar molecules, such as ethanol, have an ability to cross between the outer and inner leaflets of the lipid bilayer [20,21,22,23]. It has also been experimentally revealed that ethanol has an ability to invade the lipid bilayers and to destabilize the bilayer structures [7]. In addition, chloroform/water values of acetonitrile and methanol are 0.43 (experimentally determined) and −1.26 (theoretically estimated), respectively [24]. This indicates that the water solubility of acetonitrile is lower than that of methanol. In other words, acetonitrile can be relatively partitioned into lipid bilayers. Hence, it is speculated that a sufficient amount of acetonitrile molecules for membrane deformation is incorporated into the lipid bilayers. The permeability of polar molecules through the lipid bilayer is slight, but uncharged small polar molecules have an ability to move through the membrane [25]. This fact suggests that acetonitrile has an ability to move from the outside to the inside (the lumen of the vesicles) through the lipid membranes and can also be incorporated into lipid bilayers. These previous studies lead us to consider this probability in the case of acetonitrile and support the considerations described above.
The increase in the surface area of vesicles decreases the reduced volume (surface-area-to-volume ratio), which is expressed as , where V is the volume of the vesicles, and is the radius of a sphere with the same surface (A) and is defined as . A decrease in the reduced volume from 1 to 0.95 corresponds to the deformation from a sphere to ellipsoidal shape [26], and this is in good agreement with results shown in Figure 3a,b since corresponds to an ellipse shape of the cross sections of the vesicles. Hence, we consider that the cause of such behavior in such vesicles is the insertion of acetonitrile molecules into lipid bilayers.
To obtain additional detailed information, further analysis of membrane fluctuations are required. For instance, since a change in the bending modulus of lipid membranes is important information, further shape analysis is required using calculations [27,28,29,30,31]. Furthermore, we have to elucidate the effect of acetonitrile on other bio-molecules incorporated into artificial lipid bilayers, such as membrane proteins [32,33]. In such cases, vibrational spectroscopic methods, such as Raman spectroscopy, are also beneficial for obtaining information on a molecular scale [34]. The results of further experiments as well as this study may lead us to an improved understanding of the fundamental properties of cell membranes and to the establishment of new applications such as the construction of artificial cells and DDS.
4. Conclusions
In summary, we demonstrated that acetonitrile has an ability to destabilize the artificial cellular interface. We observed the lipid membranes in the absence (control) and presence of acetonitrile, performed an FFT analysis of membrane waviness/crinkliness, and investigated the membrane fluctuations. Acetonitrile was inserted into the lipid bilayer and enhanced the fluctuation of lipid membranes (especially the mode) due to an increase in the surface area of vesicles. This finding may lead to a further fundamental understanding of the physical mechanism of the dynamic behavior of cell membranes and additional bio-engineering techniques.
Supplementary Materials
The following are available online at https://www.mdpi.com/2504-5377/2/1/6/s1. Videos of membrane fluctuations in the absence (control) and presence of acetonitrioe, captions of videos, and histogram plots of the averaged Fourier amplitude of the vesicular cross section.
Acknowledgments
The authors would like to thank Masanobu Kuriyama (Aoyama Gakuin University) for his technical assistance with the membrane fluctuation analysis.
Author Contributions
Kazunari Yoshida designed the experiments and wrote the manuscript with revisions by Akito Takashima and Izumi Nishio. Ryohei Mitsumori performed the experiments and the analysis of membrane fluctuations with support by Kazunari Yoshida. Keitaro Horii partly analyzed the membrane fluctuations.
Conflicts of Interest
The authors declare no conflict of interest.
Abbreviations
The following abbreviations are used in this manuscript:
| FFT | Fourier transformation |
| W/O droplet | water-in-oil droplet |
| DOPC | dioleoylphosphatidylcholine |
| rhodamine DHPE | rhodamine B 1,2-dihexadecanoyl-sn-glycero-3-phosphoethanolamine, triethylammonium salt |
References
- Alberts, B.; Johnson, A.; Lewis, J.; Morgan, D.; Raff, M.; Roberts, K.; Walter, P. Molecular Biology of the Cell, 6th ed.; Garland Science: New York, NY, USA, 2014. [Google Scholar]
- Gudipaty, S.; Lindblom, J.; Loftus, P.; Redd, M.; Edes, K.; Davey, C.; Krishnegowda, V.; Rosenblatt, J. Mechanical stretch triggers rapid epithelial cell division through Piezo1. Nature 2017, 543, 118–121. [Google Scholar] [CrossRef] [PubMed]
- Chen, I.A. Cell Division: Breaking Up Is Easy to Do. Curr. Biol. 2009, 19, R327–R328. [Google Scholar] [CrossRef] [PubMed]
- Yoshida, K.; Fujii, Y.; Nishio, I. Deformation of Lipid Membranes Containing Photoresponsive Molecules in Response to Ultraviolet Light. J. Phys. Chem. B 2014, 118, 4115–4121. [Google Scholar] [CrossRef] [PubMed]
- Yoshida, K.; Takashima, A.; Nishio, I. Effect of Dibucaine Hydrochloride on Raft-Like Lipid Domains in Model Membrane Systems. MedChemComm 2015, 6, 1444–1451. [Google Scholar] [CrossRef]
- Yoshida, K.; Horii, K.; Saito, A.; Takashima, A.; Nishio, I. Confinement Effects on Polymer Dynamics: Thermo-Responsive Behaviours of Hydroxypropyl Cellulose Polymers in Phospholipid-Coated Droplets (Water-in-Oil Emulsion). Polymers 2017, 9, 680. [Google Scholar] [CrossRef]
- Hamada, T.; Hagihara, H.; Morita, M.; Vestergaard, M.C.; Tsujino, Y.; Takagi, M. Physicochemical Profiling of Surfactant-Induced Membrane Dynamics in a Cell-Sized Liposome. J. Phys. Chem. Lett. 2012, 3, 430–435. [Google Scholar] [CrossRef] [PubMed]
- Smith, A.M.; Harris, J.J.; Shelton, R.M.; Perrie, Y. 3D Culture of Bone-Derived Cells Immobilised in Alginate Following Light-Triggered Gelation. J. Control. Release 2007, 119, 94–101. [Google Scholar] [CrossRef] [PubMed]
- Park, C.; Lim, J.; Yun, M.; Kim, C. Photoinduced Release of Guest Molecules by Supramolecular Transformation of Self-Assembled Aggregates Derived from Dendrons. Angew. Chem. Int. Ed. 2008, 47, 2959–2963. [Google Scholar] [CrossRef] [PubMed]
- Alvarez-Lorenzo, C.; Bromberg, L.; Concheiro, A. Light-Sensitive Intelligent Drug Delivery Systems. Photochem. Photobiol. 2009, 85, 848–860. [Google Scholar] [CrossRef] [PubMed]
- Mizukami, S.; Hosoda, M.; Satake, T.; Okada, S.; Hori, Y.; Furuta, T.; Kikuchi, K. Photocontrolled Compound Release System Using Caged Antimicrobial Peptide. J. Am. Chem. Soc. 2010, 132, 9524–9525. [Google Scholar] [CrossRef] [PubMed]
- Tanii, H.; Hashimoto, K. Studies on the Mechanism of Acute Toxicity of Nitriles in Mice. Arch. Toxicol. 1984, 55, 47–54. [Google Scholar] [CrossRef] [PubMed]
- Boggild, M.; Peck, R.; Tomson, C. Acetonitrile Ingestion: Delayed Onset of Cyanide Poisoning Due to Concurrent Ingestion of Acetone. Postgrad. Med. J. 1990, 66, 40–41. [Google Scholar] [CrossRef] [PubMed]
- Kinoshita, K.; Yamazaki, M. Organic Solvents Induce Interdigitated Gel Structures in Multilamellar Vesicles of Dipalmitoylphosphatidylcholine. Biochim. Biophys. Acta (BBA)-Biomembr. 1996, 1284, 233–239. [Google Scholar] [CrossRef]
- Kinoshita, K.; Yamazaki, M. Phase Transition between Hexagonal II(HII) and Liquid-Crystalline Phase Induced by Interaction between Solvents and Segments of the Membrane Surface of Dioleoylphosphatidylethanolamine. Biochim. Biophys. Acta (BBA)-Biomembr. 1997, 1330, 199–206. [Google Scholar] [CrossRef]
- Wu, F.G.; Wang, N.N.; Tao, L.F.; Yu, Z.W. Acetonitrile Induces Nonsynchronous Interdigitation and Dehydration of Dipalmitoylphosphatidylcholine Bilayers. J. Phys. Chem. B 2010, 114, 12685–12691. [Google Scholar] [CrossRef] [PubMed]
- Yoshida, K.; Horii, K.; Fujii, Y.; Nishio, I. Real-Time Observation of Liposome Bursting Induced by Acetonitrile. ChemPhysChem 2014, 15, 2909–2912. [Google Scholar] [CrossRef] [PubMed]
- Schneider, C.A.; Rasband, W.S.; Eliceiri, K.W. NIH Image to ImageJ: 25 Years of Image Analysis. Nat. Methods 2012, 9, 671–675. [Google Scholar] [CrossRef] [PubMed]
- Ishii, K.i.; Hamada, T.; Hatakeyama, M.; Sugimoto, R.; Nagasaki, T.; Takagi, M. Reversible Control of Exo-and Endo-Budding Transitions in a Photosensitive Lipid Membrane. ChemBioChem 2009, 10, 251–256. [Google Scholar] [CrossRef] [PubMed]
- Patra, M.; Salonen, E.; Terama, E.; Vattulainen, I.; Faller, R.; Lee, B.W.; Holopainen, J.; Karttunen, M. Under the Influence of Alcohol: The Effect of Ethanol and Methanol on Lipid Bilayers. Biophys. J. 2006, 90, 1121–1135. [Google Scholar] [CrossRef] [PubMed]
- Dickey, A.N.; Faller, R. How Alcohol Chain-Length and Concentration Modulate Hydrogen Bond Formation in a Lipid Bilayer. Biophys. J. 2007, 92, 2366–2376. [Google Scholar] [CrossRef] [PubMed]
- Terama, E.; Ollila, O.H.S.; Salonen, E.; Rowat, A.C.; Trandum, C.; Westh, P.; Patra, M.; Karttunen, M.; Vattulainen, I. Influence of Ethanol on Lipid Membranes: From Lateral Pressure Profiles to Dynamics and Partitioning. J. Phys. Chem. B 2008, 112, 4131–4139. [Google Scholar] [CrossRef] [PubMed]
- Dickey, A.N.; Yim, W.S.; Faller, R. Using Ergosterol To Mitigate the Deleterious Effects of Ethanol on Bilayer Structure. J. Phys. Chem. B 2009, 113, 2388–2397. [Google Scholar] [CrossRef] [PubMed]
- Dunn, W.J.; Nagy, P.I.; Collantes, E.R. A computer-assisted method for estimation of the partition coefficient. Monte Carlo simulations of the chloroform/water log P for methylamine, methanol, and acetonitrile. J. Am. Chem. Soc. 1991, 113, 7898–7902. [Google Scholar] [CrossRef]
- Cooper, G.M. The Cell—A Molecular Approach, 2nd ed.; Sinauer Associates: Sunderland, MA, USA, 2000. [Google Scholar]
- Seifert, U.; Berndl, K.; Lipowsky, R. Shape Transformations of Vesicles: Phase Diagram for Spontaneous- Curvature and Bilayer-Coupling Models. Phys. Rev. A 1991, 44, 1182–1202. [Google Scholar] [CrossRef] [PubMed]
- Duwe, H.P.; Sackmann, E. Bending Elasticity and Thermal Excitations of Lipid Bilayer Vesicles: Modulation by Solutes. Phys. A Stat. Mech. Appl. 1990, 163, 410–428. [Google Scholar] [CrossRef]
- Pécréaux, J.; Döbereiner, H.G.; Prost, J.; Joanny, J.F.; Bassereau, P. Refined Contour Analysis of Giant Unilamellar Vesicles. Euro. Phys. J. E 2004, 13, 277–290. [Google Scholar] [CrossRef] [PubMed]
- Gracia, R.S.; Bezlyepkina, N.; Knorr, R.L.; Lipowsky, R.; Dimova, R. Effect of Cholesterol on the Rigidity of Saturated and Unsaturated Membranes: Fluctuation and Electrodeformation Analysis of Giant Vesicles. Soft Matter 2010, 6, 1472–1482. [Google Scholar] [CrossRef]
- Shi, Z.; Baumgart, T. Dynamics and Instabilities of Lipid Bilayer Membrane Shapes. Adv. Colloid Interface Sci. 2014, 208, 76–88. [Google Scholar] [CrossRef] [PubMed]
- Loftus, A.F.; Noreng, S.; Hsieh, V.L.; Parthasarathy, R. Robust Measurement of Membrane Bending Moduli Using Light Sheet Fluorescence Imaging of Vesicle Fluctuations. Langmuir 2013, 29, 14588–14594. [Google Scholar] [CrossRef] [PubMed]
- Yokoyama, Y.; Negishi, L.; Kitoh, T.; Sonoyama, M.; Asami, Y.; Mitaku, S. Effect of Lipid Phase Transition on Molecular Assembly and Structural Stability of Bacteriorhodopsin Reconstituted into Phosphatidylcholine Liposomes with Different Acyl-Chain Lengths. J. Phys. Chem. B 2010, 114, 15706–15711. [Google Scholar] [CrossRef] [PubMed]
- Negishi, L.; Mitaku, S. Electrostatic Effects Influence the Formation of Two-Dimensional Crystals of Bacteriorhodopsin Reconstituted into Dimyristoylphosphatidylcholine Membranes. J. Biochem. 2011, 150, 113–119. [Google Scholar] [CrossRef] [PubMed]
- Rieger, S.; Grill, D.; Gerke, V.; Fallnich, C. Quantitative spontaneous Raman scattering spectroscopy in artificial binary lipid membranes. J. Raman Spectrosc. 2017, 48, 1264–1269. [Google Scholar] [CrossRef]
Figure 1.
(a) A fluorescence microscopy image of a lipid vesicle. (b) Image of an extracted membrane surface points, radius (r) and angle (). The r represents a distance between a barycenter and the surface points.
Figure 1.
(a) A fluorescence microscopy image of a lipid vesicle. (b) Image of an extracted membrane surface points, radius (r) and angle (). The r represents a distance between a barycenter and the surface points.

Figure 2.
Typical time-lapse fluorescence microscopy images of vesicular fluctuations without (control) (a) and with (b) acetonitrile.
Figure 2.
Typical time-lapse fluorescence microscopy images of vesicular fluctuations without (control) (a) and with (b) acetonitrile.

Figure 3.
(a) Normalized radius of vesicles as a function of angle determined at an arbitrary time of 18 s in the absence and presence of acetonitrile, corresponding to Figure 2a,b, respectively. (b) Averaged values of Fourier amplitude determined as a function of wavenumber, corresponding to Figure 2a,b, respectively. (c) Box plot representation of the Fourier amplitude distributions at and 4. The central horizontal line in each box represents the median, upper and lower lines in each box represent the range of observed values in the 10–90% range, and whiskers denote the range from the minimum to the maximum value. The number of vesicles observed for each condition was 50. and .

Figure 4.
(a) Time-dependent Fourier amplitude at , corresponding to Figure 2a,b. (b) Histogram plot showing the statistical dispersion of time-dependent Fourier amplitude values determined without (control) and with acetonitrile. (c) Box plot of statistical dispersion distribution of time-dependent Fourier amplitude, corresponding to (b). The number of vesicles observed for each condition was 50. .

© 2018 by the authors. Licensee MDPI, Basel, Switzerland. This article is an open access article distributed under the terms and conditions of the Creative Commons Attribution (CC BY) license (http://creativecommons.org/licenses/by/4.0/).
Share and Cite
MDPI and ACS Style
Yoshida, K.; Mitsumori, R.; Horii, K.; Takashima, A.; Nishio, I. Acetonitrile-Induced Destabilization in Liposomes. Colloids Interfaces 2018, 2, 6. https://doi.org/10.3390/colloids2010006
AMA Style
Yoshida K, Mitsumori R, Horii K, Takashima A, Nishio I. Acetonitrile-Induced Destabilization in Liposomes. Colloids and Interfaces. 2018; 2(1):6. https://doi.org/10.3390/colloids2010006
Chicago/Turabian StyleYoshida, Kazunari, Ryohei Mitsumori, Keitaro Horii, Akito Takashima, and Izumi Nishio. 2018. "Acetonitrile-Induced Destabilization in Liposomes" Colloids and Interfaces 2, no. 1: 6. https://doi.org/10.3390/colloids2010006