
- Article

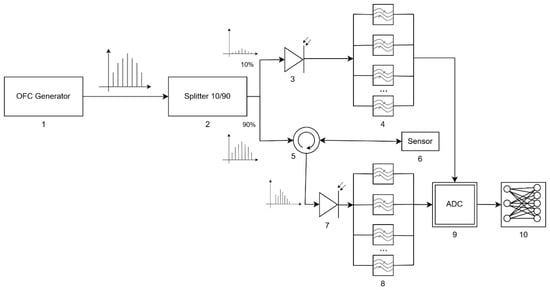
A neural-network-assisted microwave-photonic method for interrogating fiber-optic sensing elements is proposed and numerically investigated. A multi-tone optical signal (MTOS), implemented as an optical frequency comb (OFC), is used to probe the spectral response of the sensing element. Square-law photodetection converts the interaction between the OFC lines and the sensing-element spectral response into beat components at difference frequencies, whose amplitudes form a multidimensional microwave-photonic response vector (MPRV). A unified numerical model based on transfer- and scattering-matrix formalisms was developed for fiber Bragg gratings (FBGs), Fabry–Pérot interferometers (FPIs), and combined FBG–FPI structures, including temperature-induced parameter variations and additive–multiplicative noise. A fully connected artificial neural network was trained to reconstruct the sensor state directly from the MPRV, with temperature used as the target measurand in the numerical study. It is shown that reconstruction accuracy is governed primarily by the distinguishability of sensor states in the MPRV space and by the practical one-to-one nature of the spectral position–MPRV mapping, rather than by neural-network complexity. Restricting the operating range to a practically one-to-one mapping region reduced the temperature reconstruction MAE from 0.198 to 0.021 °C at an SNR of 30 dB. Under increased noise, the proposed method exhibited slower accuracy degradation than spectral-peak, fixed-calibration, correlation-matching, and residual-minimization approaches, achieving the lowest MAE of 0.312 °C at an SNR of 15 dB. The method also demonstrated reduced sensitivity to OFC line-amplitude nonuniformity and residual optical-power drift. After training, the reconstruction time did not exceed 0.1 ms, indicating the potential of the proposed approach for high-speed fiber-optic sensor interrogation without direct optical-spectrum scanning.
10 November 2026