
Precision and Accuracy Limits of Wastewater-Based Epidemiology—Lessons Learned from SARS-CoV-2: A Scoping Review

Water Research and Environmental Biotechnology Laboratory, Water Systems and Biotechnology Institute, Riga Technical University, Kipsalas iela 6A, LV-1048 Riga, Latvia
*
Author to whom correspondence should be addressed.
Water 2024, 16(9), 1220; https://doi.org/10.3390/w16091220
Submission received: 22 February 2024
/
Revised: 16 April 2024
/
Accepted: 21 April 2024
/
Published: 25 April 2024
(This article belongs to the Special Issue Wastewater-Based Epidemiology (WBE) Research)
Abstract
:Background: Wastewater-based epidemiology (WBE) has become crucial for early microbial outbreak detection and public health surveillance globally, underscored by the COVID-19 pandemic. However, despite advancements in sampling and analyses, interpreting results and estimating infection rates pose challenges. Enhancements in sewer system engineering, understanding the wastewater environment, and addressing the impact of the environment on the accuracy of results are needed. Objective: This scoping review aims to identify engineering knowledge gaps in WBE to guide future study designs. Design: Research on “wastewater-based epidemiology” involving “engineering”, published between 2015 and 2023, was extracted from the Scopus database. Results: This scoping review examines elements influencing WBE’s precision and reliability, especially in identifying and measuring SARS-CoV-2 RNA. It identifies significant effects of engineering, analytical practices, and the wastewater’s composition on WBE performance. Conclusions: This review calls for further investigation into economical evaluation methods of these factors to enhance WBE data normalization and interpretation, utilizing existing wastewater treatment plant data used for treatment control, which could be a cost-effective approach over more expensive population biomarkers. This approach, aside from SARS-CoV-2, holds potential for application to a broader number and types of diseases, as well as population consumption habits.
1. Introduction
Wastewater-based epidemiology (WBE) has gained acknowledgment as an effective method for providing early alerts on the spread of infectious diseases [1], recognition that surged during the COVID-19 pandemic in 2020 [2]. The necessity for WBE arises if real-time, accurate estimates of disease prevalence within a community can be achieved through public health data. One way to achieve this is to develop statistical correlation models between public health data and wastewater measurements. However, the correlation is watershed-specific and usually requires a large pool of data [3]. WBE has been demonstrated to be a cost-effective instrument for forecasting the spread of infections and facilitating preemptive actions that lessen the potential societal and economic repercussions of epidemiological factors while simultaneously preserving the anonymity of the individuals involved in the study [4]. To achieve this, it is necessary to develop physical models that can accurately depict how environmental factors, like water quality or flow rates, influence the outcomes. Improvement in normalization techniques via biochemical markers would be beneficial [3]. The novelty in WBE lies in its advancement and application in monitoring a wide range of biomarkers for public health, including viruses, bacteria, pharmaceuticals, illicit drugs, and lifestyle chemicals [5,6,7,8]. However, WBE has several drawbacks, including insufficient spatial resolutions and integration with existing surveillance methods, that limit its precision and, thus, wider application [9]. For instance, research conducted by Polo et al. [10] revealed multiple factors contributing to the misestimation of virus quantities in wastewater, including higher infection rates in the local area and colder weather. Conversely, virus concentrations can be underestimated when mixed with stormwater or other surface waters or due to infiltration [10]. Therefore, it is crucial to create sophisticated models that can accurately link the viral load detected at the sampling site to the actual virus presence within the community served [10]. Moreover, collecting samples for SARS-CoV-2 in wastewater, for example, from hospitals, might be affected by the diverse array of cleaning agents and disinfectants entering the sewage system [10].
The range of obstacles confronting WBE is broad, commencing with choosing optimal locations for sample collection, methods of collection, preservation of samples, and procedures for sample concentration [9]. Also critical is selecting the right analytical techniques [11]. Beyond these initial steps, several elements can influence how results are interpreted and the models are constructed to predict epidemiological trends [10]. These elements include normalizing the data collected from analyses; the specific constituents of the wastewater; and environmental factors such as the water’s temperature, pH, and conductivity, and how long it remains within the sewer network [12]. Demographic variables such as the population density, movement patterns, age demographics, economic status, and lifestyle habits (e.g., differences in behavior on working days versus weekends) significantly factor into the model [13,14]. Furthermore, the design and state of the sewerage infrastructure is important—whether it is a combined or separate system—as well as the degree of impact from industrial effluents, stormwater, and infiltration, which all significantly add to the complexity of WBE efforts [9,11,14,15]. Thus, integrating WBE with wastewater engineering not only enhances our ability to monitor and respond to diseases and population consumption habits, but also contributes to the development of smart, resilient, and public-health-informed wastewater infrastructure [10,16,17]. This interdisciplinary approach requires continuous collaboration among engineers, epidemiologists, public health officials, and policymakers to optimize the use of WBE in disease surveillance and control. This field is still evolving, and continuous research and innovation are necessary to refine these strategies and their implementation.
In this paper, a scoping review describes currently known factors that may influence WBE and approaches based on WBE, such as wastewater surveillance (WWS), early warning system (EWS), and near-source tracing (NST) results and its application in particular situations. The main goal of this review is to identify and analyze the factors that may impact the accuracy and reliability of WBE and its application in different scenarios. By addressing the research gaps in the current understanding of these factors, this review aims to provide insights into improving the precision and wider application of WBE in detecting infectious and other types of diseases and developing effective preventive measures, as well as monitoring population consumption habits. Through a systematic and comprehensive review of existing studies, this research also aims to provide a comprehensive understanding of the challenges and limitations of WBE and ultimately contribute to advancing this emerging field of study. To our knowledge, this is the pioneering review study to examine publicly accessible data on the extensive engineering aspects of WBE that influence its outcomes and interpretation.
2. Materials and Methods
We used a literature review to identify relevant publications concerning WBE based on the PRISMA approach, which stands for “Preferred Reporting Items for Systematic Reviews and Meta-analyses” [18], and its modification for scoping reviews, called PRSIMA-ScR [19]. According to the PRISMA, we applied four basic phases of procedure: (1) the identification of records, (2) the screening of abstracts and titles, (3) the eligibility assessment of full-text articles, and (4) the inclusion in this review. WBE has been applied extensively since 2008 [20], and many publications have been published, starting in 2015 [21]; therefore, in this study, the search criteria for publications were set from 2015. “Wastewater-based epidemiology” as a keyword was used for a literature search in the Scopus database search engine for documents published until the beginning of 2024. Publications from the acquired list were screened using abstracts, and 47 relevant to our study subjects were selected for further review. The following inclusion criteria were used: COVID-19, SARS-CoV-2, SARS-CoV-2 RNA detection, wastewater surveillance, early warning systems, shedding sources and rates, infectivity of RNA, wastewater sampling, sample preparation and analysis, sample normalization, wastewater composition, and environmental factors. Further studying selected publications, some referenced publications were identified and studied for points of interest linked to the main subject of this study while using the above-mentioned inclusion criteria. Searching, screening, and data charting of the articles were performed manually by one team member and then reviewed by another. While synthesizing the results, we identified relevant topics and collected information from studies that could be valuable and relevant to closing knowledge gaps on the subject.
3. Results
3.1. The Wastewater-Based Epidemiology Concept
WBE has been used for various applications, including tracking illicit drug use and virus surveillance, with the first practical implementation of WBE occurring in 2008 [20]. The application of WBE increased considerably in 2020, with the emergence of the COVID-19 pandemic. A list of 1706 publications was identified and screened, focusing on the “Engineering” subarea, resulting in 162 documents published from 2015 to 2023. The greatest share of publications was published in 2022 (52) and in 2021 (39), followed by 2023, with 36 publications (Figure 1). The analysis of the scientific documents demonstrated that almost half of the publications were authored by individuals from Europe (143), followed by Asia (59) and North America (59), with significant contributions from authors in the United States of America (46), the United Kingdom (31), Australia (30), and China (25) (Figure 2).
The observed increase in publications indicates rapidly growing interest and research activity on WBE. Peaks in publication volumes correspond with the outbreak of COVID-19, which stimulated research across various disciplines. This increase in scholarly output demonstrates the scientific community’s rapid response to emerging public health crises, illustrating the agility of research entities when addressing societal challenges. The analysis confirms that WBE inherently represents an interdisciplinary domain, receiving substantial contributions from many nations. The considerable involvement of multiple countries underscores the global importance of WBE for public health surveillance, a fact sharply recognized during the recent pandemic.
3.2. SARS-CoV-2 RNA Detection: Risks and Data Interpretation
Emerging as a critical tool in public health surveillance during the COVID-19 pandemic, WBE offers a novel approach to monitoring virus transmission in communities [4]. Recent advances in detecting SARS-CoV-2 RNA in wastewater have underscored the potential of WBE in estimating infection prevalence, capturing asymptomatic and pre-symptomatic cases that conventional clinical testing may miss [21]. This field of study integrates virological, epidemiological, and environmental engineering insights to interpret viral load data in municipal wastewater, presenting a unique vantage point for public health officials [21]. We reviewed major methodologies employed in WBE, along with the inherent uncertainties associated with these techniques and the implications for accurately assessing COVID-19 transmission dynamics. X. Li et al. [22] highlighted that two primary methodologies have been utilized to detect SARS-CoV-2 RNA, thereby assisting in the surveillance of COVID-19. Firstly, there is the method of back-calculating prevalence from the concentration of SARS-CoV-2 RNA found in wastewater samples (CRNA), which takes into account the inflow rate of wastewater treatment plants (WWTPs) and the population served or by using average water consumption figures, with feces considered the main source. Secondly, there is the process of tracking infection trends via the association between disease occurrence rates (e.g., the number of new daily or weekly cases) and CRNA.
The idea of employing WBE to estimate the number of COVID-19 cases is captivating since it operates under the premise that whether individuals with the infection show symptoms or not, and regardless of whether they have been clinically tested, as long as they excrete the virus, they can be accounted for in the aggregate infected subgroup discerned via WBE [21]. Nevertheless, the specifics regarding the origins of virus shedding and the quantity of the virus shed by patients remain ambiguous, particularly when considering various stages of infection across a broad population [23,24]. Therefore, it is impossible to estimate the number of SARS-CoV-2-shedding individuals (patients) solely based on the concentration of SARS-CoV-2 RNA in wastewater (CRNA). However, variations in CRNA are anticipated to mirror fluctuations in the shedding patient count within the serviced area [25]. Therefore, the effectiveness of WBE can be evaluated by examining the correlation between the concentration of SARS-CoV-2 RNA in wastewater (CRNA) and the number of clinically verified cases [22]. In order to accurately link the viral levels found in wastewater samples to the overall illness load and effectively correlate the concentrations of viruses detected in wastewater samples with the actual disease burden, it is imperative to gather specific data. This includes understanding the rate and mass of viral RNA shedding in feces across various stages of COVID-19 infection, examining virus survival and persistence within sewer networks, and considering the impact of sewer-specific factors such as runoff or groundwater infiltration [16]. Additional factors, like the proximity of hospitals or other institutions housing patients with COVID-19 within the catchment area, population estimates, and back-calculation methods, also play a critical role [16,22]. The precision of this association also depends significantly on the choice of sampling points and methods, the techniques used within laboratories, and the impact that the process of handling samples has on the estimations of virus concentration [16]. X. Li et al. (2021) [9] conducted a thorough investigation into uncertainties at each stage of a WBE analysis. These findings suggest that uncertainties in WBE are approximately 20–40%, particularly notable at higher infection levels when employing high-frequency flow-proportional sampling and leveraging actual water usage data for estimating population prevalence [9]. The analytical uncertainty inherent in laboratory methods emerged as a predominant factor impacting the WBE process. Furthermore, Mac Mahon et al. [16] posit that the uncertainties in the initial phases of WBE can be mitigated to a certain extent by applying engineering knowledge specific to sewer networks. This is notably the case when there has been a sustained effort toward creating a well-calibrated and validated hydraulic model of the system [16].
Although there has been a significant volume of research focused on identifying SARS-CoV-2 RNA in wastewater, determining the lowest number of COVID-19 cases within a population needed to produce a detectable viral RNA signal remains largely uncertain. Although several studies [22,26,27,28] have noted a correlation between the COVID-19 burden and WBE SARS-CoV-2 RNA levels—pinpointing a detection threshold for SARS-CoV-2 RNA in wastewater that would enable the projection of a population-based COVID-19 rate—it is currently unfeasible [29]. Nonetheless, Q. Li et al. [29] pointed out a major benefit of using WBE to monitor SARS-CoV-2 RNA compared to clinical diagnostic tests: WBE can more thoroughly detect all phases of COVID-19 within a community, encompassing asymptomatic, pre-symptomatic, and symptomatic cases [29]. Thus, WBE, as an integral element of epidemiological response strategies, stands out as a holistic tool for assessing community health and guiding interventions during a pandemic.
3.3. Wastewater Surveillance and Early Warning Systems in Communities
Beyond its fundamental concept, WBE has been harnessed in several derived approaches, including wastewater surveillance (WWS), near-source tracking (NST), and early warning systems (EWSs) [30,31,32]. These approaches represent a synergetic effort to leverage the information concealed within our sewage systems, offering a strategic advantage in identifying and keeping attention on curbing the spread of infectious diseases [30,33]. Studies implemented by Keshaviah et al. and Lazarus et al. [34,35] emphasize that sustainable wastewater surveillance necessitates effective coordination between health and safety authorities, utility services, laboratories, and researchers. Adjusting the frequency, method, and places of sampling to align with the risk levels, susceptibility of the community, characteristics of biomarkers, and particular insights informed by wastewater data can significantly increase its utility in real-world applications. By standardizing the metrics used in reporting results and combining wastewater data with health resource information, it is possible to gain a deeper understanding of community vulnerabilities, thus assisting in formulating plans to prevent healthcare systems from reaching their limits [36]. NST, according to Hassard et al. [37], is a procedure utilized within WWS that involves work within sewer drains and manholes connected to single buildings or clusters of buildings. It enables the detection of relatively small numbers of infected individuals contributing to the wastewater stream. Compared to sampling larger catchment areas within the sewer system, such as wastewater treatment plant influents, NST exhibits a higher sensitivity in identifying newly infected individuals. This heightened sensitivity can be attributed to various factors, including the size of the contributing population, dilution of the signal, and time it takes for sewage to travel from toilets to the collection points, with associated viral degradation [30]. NST has been effectively applied in educational settings such as school and university campuses, including the specific monitoring of college dormitories by gathering samples from sewer lines that exit individual buildings prior to their merging with the larger sewage systems [30,38,39]. Kapoor et al. [30] emphasized that data obtained through wastewater surveillance (WWS) for tackling COVID-19 are important and have three primary uses. Firstly, these data aid in community-level monitoring by enabling the observation of changes in SARS-CoV-2 infection rates, thereby assisting public health authorities in deciding whether adjustments to current mitigation efforts are necessary. Secondly, in environments such as specific institutions where populations are confined, WWS enables the detection of SARS-CoV-2, aiding in the decision-making process regarding the need for clinical testing and the discovery of previously unidentified COVID-19 cases within these groups. Lastly, the data from WWS play a critical role in the identification and tracking of different SARS-CoV-2 variants, which is vital for public health officials to respond appropriately by adapting mitigation strategies promptly in both open communities and closed settings [30]. This information is crucial for public health authorities to make timely decisions about adjusting mitigation efforts accordingly.
Studies have reported varying lead times in WBE, ranging from 0 to 2 days [40,41] to up to 3 weeks [28,42,43,44,45]. The lead time depends on multiple factors, including the study’s methodology and the time required for the virus to become detectable in wastewater. The multifaceted capabilities of WBE are evident in its derived approaches, which serve as critical tools in the detection and management of infectious diseases, particularly COVID-19. The integration of WWS, NST, and EWS has demonstrated an adaptive, targeted, and forward-looking capacity to gauge viral prevalence within communities and closed populations efficiently [30,34,35,37]. Collaboration among public health authorities, utility services, laboratories, and researchers is paramount, as is the fine-tuning of sampling modalities to maximize relevance and actionability. WBE’s contribution to community monitoring, closed population analyses, and variable surveillance has been underscored, proving invaluable in informing public health decisions. WBE reliably provides early insights into public health threats from viruses despite variations in detection lead times due to different factors [28,40,41,42,44,45]. As the need for better surveillance continues, WBE is a key innovation in public health, critical for early detection and protection against new infectious diseases.
3.4. Shedding Sources and Rates
WBE relies on the human body to extract various bodily fluids, including feces, urine, mucus, sputum, and sweat, each with different viral shedding rates, leading to detectable viral RNA loads in wastewater systems [16,46]. Understanding these shedding patterns is vital for accurate infection tracking and public health responses [16]. Each excreta has distinct shedding rates of SARS-CoV-2, leading to a considerable variation in viral loads present in wastewater [16]. For instance, urine samples typically exhibit viral loads ranging from 105 to 108 genome copies per L, whereas fecal samples can vary from 106 to 1011 genome copies per L. However, saliva and sputum samples have been found to range from 104 to 1014 genome copies per L (Figure 3) [46].
During the peak of a COVID-19 infection, an individual may excrete genomic copies of SARS-CoV-2 into the wastewater [46]. The RNA of SARS-CoV-2 can persist in wastewater systems and be detectable in samples collected from sewers or wastewater treatment plants [47]. These concentrations fluctuate based on the characteristics of the upstream sewer network, with global wastewater samples showing viral genome concentrations ranging from 101 to 107 genome copies per L. Typically, concentrations between 103 to 106 genome copies per L are reported [16,47]. Saawarn and Hait [48] corroborate these findings, indicating that viral RNA concentrations in sewage typically range from 102 to 106.5 genome copies per L, considering standard dilution rates. Furthermore, Riediker et al. [49] emphasize that the Delta and Omicron variants of SARS-CoV-2 require smaller doses to infect individuals than the original virus strain. Although the Omicron variant tends to have lower viral loads and shorter periods of respiratory shedding, it is considered two to three times more transmissible than the Delta variant [50]. This underscores the necessity of accounting for variant-specific waste-shedding rates and adapting public health strategies to evolving pandemic conditions. Prasek et al. [50] further elaborate on the influence of prevalent variants on waste-shedding rates. The Delta variant displayed the highest mean shedding rates, aligning with more severe disease symptoms observed in clinical settings. Conversely, the Omicron variant, typically linked with milder symptoms, showed the lowest mean shedding rates. Notably, shedding rates were more consistent during the predominance of the Omicron variant despite its lower viral loads. This underlines the variant-specific nature of waste-shedding rates and the importance of adjusting public health models to reflect these variations [50,51,52,53].
Accurate assessments of the infected population within a sewer catchment rely on estimates of SARS-CoV-2 RNA gene copies per unit weight of feces at various disease stages [27]. These estimates are based on reported values for SARS-CoV-2 in feces, with a median of 4.7 log RNA genome copies per mL [27,54]. Ali et al. [54] observed persistent shedding of virus RNA in 27% to 89% of patients, with concentrations ranging from 0.8 to 7.5 log10 genome copies per g of feces. To effectively utilize these fecal shedding concentrations, it is crucial to understand the average fecal output of individuals. Rose et al. [55] determined that the median wet mass production of feces is approximately 128 g per capita per day, with a median dry mass of 29 g per capita per day. Typically, healthy individuals defecate about 1.20 times per a 24 h period. Fiber intake was identified as a significant factor influencing fecal mass. Additionally, the study found median urine generation rates to be 1.42 L per capita per day, with a dry solids content of 59 g per capita per day. A notable component of urinary excretion is nitrogen, primarily urea, constituting over 50% of the total organic solids.
A whole-genome sequencing (WGS) analysis of wastewater samples offers another dimension of insight. Vo et al. [56] demonstrated that wastewater surveillance in a dormitory with at least three infected students among 311 residents could achieve over 95% coverage of viral genomes. A concentration of 1.1 × 10⁶ genome copies per L in wastewater was deemed sufficient for WGS. This is consistent with other studies suggesting that successful genome sequencing requires a minimum concentration of 2.8 × 10⁵ genome copies per L of wastewater [56].
The examination of SARS-CoV-2 in wastewater highlights its complexity, driven by variable shedding rates and the daunting task of detecting newly emergent strains. Embracing advanced analytical methods and incorporating detailed virological data remain crucial as we adapt our public health strategies to the dynamic nature of the pandemic, underscoring WBE’s role as a sentinel in safeguarding community health.
3.5. Infectivity of the Detected RNA
The possible existence and persistence of the SARS-CoV-2 virus in aquatic environments, especially in wastewater, have emerged as significant issues during the COVID-19 crisis [46,48,57]. There are conflicting views on whether the detection of viral RNA in wastewater implies a genuine risk of infection to humans. For instance, Bivins et al. [57] drew attention to the troubling issue of potentially infectious SARS-CoV-2 in wastewater. Additionally, Buonerba et al. [49] elaborated that finding the virus in wastewater is not directly indicative of its ability to cause infection. Despite the high concentrations of SARS-CoV-2 RNA found globally in wastewater, research indicates a scarce persistence of the virus in these aquatic environments. RNA fragments or molecules might be detected even from viral particles that are no longer active or intact; however, there is currently no established method used to estimate the count of infectious particles [58]. Giacobbo et al. [46], in their critical review, asserted that up to the time of their research, there had been no reported instances of transmission through interaction with sewage or water contaminated with the virus. A few studies [48,49,54] conducted in these aqueous matrices did not detect infectious viruses. However, Giacobbo et al. [46] indicated that SARS-CoV-2 can maintain its viability, meaning it remains infectious, for durations of up to 4.3 days in sewage and up to 6 days in water. Additionally, they mentioned that other coronavirus strains may remain viable in these environments for over a year, depending on the sample conditions. This finding is corroborated by Rimoldi et al. [59], who investigated influent and effluent samples from wastewater treatment plants and river samples in the Milano Metropolitan area. While SARS-CoV-2 RNA was detectable, its infectivity was null, indicating a natural decay of viral pathogenicity over time post-emission. Giacobbo et al. [46] suggested that the possibility of contamination mediated by contact with sewage or contaminated water cannot be completely discounted, especially considering the potential emergence of more resistant and infectious mutations of SARS-CoV-2. In addition, Tran et al. [17] echoed this sentiment, emphasizing that wastewater and sewage workers should adhere to safety precautions against SARS-CoV-2 exposure. Although SARS-CoV-2 RNA is detectable in wastewater, its presence does not confirm infectivity. Presently, detection techniques like RT-qPCR cannot differentiate between infectious viral particles and those that are not [58]. Consequently, additional studies are essential for ascertaining the survival period and possible infectiousness of the virus in these contexts and developing more precise techniques for its detection and monitoring [58].
The scientific community continues to stress the urgent need for conclusive research to ascertain the virological risks associated with SARS-CoV-2 in aqueous environments and to develop detection techniques capable of identifying infectious particles [17]. Until these uncertainties are resolved, precautionary approaches must prevail, necessitating that wastewater and sewage management include robust protocols to protect against possible SARS-CoV-2 contamination.
3.6. Wastewater Sampling
The methodology of sampling wastewater is influential in the accuracy and representativeness of the data collected for the target human population’s viral load and in detecting SARS-CoV-2 RNA in wastewater [60]. The timing and method of collecting wastewater samples are crucial due to the changes occurring across different locations and times [13]. Polo et al. [10] highlight the necessity of considering the distinct characteristics of urban and rural wastewater systems when designing surveillance programs. This study emphasizes that sampling timing is pivotal, aligning with the critical pathways where the virus will most likely be transported and detected. In comparatively large urban areas (with the longest sewer spans of about 70 km or more [61]), for instance, a 24 h delay in wastewater transit from households to centralized treatment plants can be typical. The concentration of SARS-CoV-2 RNA in influent wastewater is subject to diurnal variation, influenced by factors such as defecation frequency, timing, sampling technique, and frequency. In addition, Heaton et al. [62] suggest that defecation is most frequent in the early morning. Therefore, wastewater collected during these peak fecal loading times might contain higher levels of SARS-CoV-2 RNA. In the absence of an autosampler, it is recommended to perform targeted grab sampling during these times to enhance the probability of detecting SARS-CoV-2 RNA. Identifying peak times for fecal loadings in local areas before initiating a grab sampling campaign is vital. However, these peak times might vary between wastewater treatment facilities due to differences in sewer infrastructure [10]. Total influent flow can be used to indicate morning anthropogenic activity and fecal shedding. For effective sampling programs, Ahmed et al. [60] recommend conducting two or more 24 h composite samplings per week or a single 48 h or 72 h composite sampling per week, which aims to capture the most shedding events within a community. A minimum of weekly sampling is advised, with twice-weekly sampling on weekends for higher-resolution data. Furthermore, X. Li et al. [22] observe that while the influence of the sampling method on results is minimal, elevating the sampling frequency notably improves the correlation between SARS-CoV-2 RNA levels in wastewater and various clinically verified case numbers, such as prevalence and incidence rates.
The methodologies involved in the sampling of wastewater play a crucial role in WBE, as the decisions made regarding when, where, and how often sampling occurs substantially influence the representativeness of the viral load data obtained. Experts across studies such as Polo et al. [10], Ahmed et al. [60], Heaton et al. [62], and X. Li et al. [22] emphasize the strategic importance of customized sampling plans reflecting the geographical, infrastructural, and demographic intricacies of target populations. These recommendations outline the critical factors for consideration in constructing efficient and insightful WBE programs that aim to provide an accurate reflection of the presence of viruses in communities.
3.7. Wastewater Sample Preparation and Analysis
The effectiveness of the WBE method depends significantly on proper sample collection and storage protocol, owing to the sensitivity of virus stability [10]. With the concentration of SARS-CoV-2 in wastewater fluctuating, especially at the start and end of an epidemic, the sensitivity of detection techniques is paramount in providing timely data on the epidemic’s progress for policymakers and health professionals [60]. Sample collection and storage conditions significantly impact the detection of SARS-CoV-2 RNA signals in wastewater due to stability concerns [10]. Samples are typically transported on ice from the collection point to the laboratory and stored at 4 °C upon arrival, with concentration processes initiated within 48–72 h. The levels of SARS-CoV-2 in wastewater, anticipated to be low at the outset or during the concluding phase of an epidemic, demand detection techniques with high sensitivity. Such methods must successfully identify minimal concentrations of the virus, serving as an efficient early warning mechanism or guiding safe decisions on relaxing restrictions [60,63].
The preparation of the samples, i.e., concentration, is also crucial. Common concentration methods can include precipitation with salt or polyethylene glycol, electrostatically charged membrane filtration, and ultrafiltration [64,65,66,67,68]. Ahmed, Bertsch, and Bivins et al. [64,65,66] found that electronegative membrane filtration, particularly with the addition of MgCl2, yielded the highest mean recovery rate. Ongoing modifications aim to enhance the efficiency of these methods, such as employing ultrafiltration membranes [67].
When it comes to sample analyses, a polymerase chain reaction (PCR), particularly reverse transcription (RT-)PCR and real-time PCR, is the most commonly used method for virus detection and quantification in wastewater [64]. These PCR variations are highly sensitive and allow for the exponential amplification of genomic DNA or RNA templates. However, PCR’s enzymatic nature makes it susceptible to inhibitors found in complex samples, including stool, fecal, and environmental water samples [69]. Removing PCR inhibitors, such as humic and fulvic acids, is crucial [69]. Methods like dialysis, liquid–liquid extraction, flocculation, column-based methods, and ultrafiltration are employed, with the latter being the most effective [67]. Electropositive filters can also be used to bind microorganisms and avoid the co-purification of inhibitory substances [68].
Qiu et al. [70] published an optimized laboratory protocol for processing wastewater samples, where they identified three key factors affecting the threshold for SARS-CoV-2 RNA detection in wastewater: variability in clinical testing approaches, the impact of wastewater matrix characteristics on RT-qPCR detection, and study design considerations. The sensitivity of the method discussed shows varying results with regard to its onset, as illustrated in Figure 4. According to Mac Mahon et al. [16], the method’s sensitivity can detect as few as one infected individual per 1000 in the UK and a minimum of 10 infections per 100,000 in Japan. Ahmed and colleagues [42] estimate that detecting the virus requires between 253 and 409 positive cases per 10,000 individuals, influenced by various factors such as the targeted gene, frequency of sampling, and environmental conditions. Hart and Halden [4] put forward that the range of possible detections can vary significantly, from 1 in 114 individuals to 1 in approximately 2 million, influenced by the uniformity in wastewater, among other variables. Ali et al. [54] expressed skepticism about these optimistic figures due to uncertainties in certain influencing factors. Meanwhile, Greenwald and co-authors [71] assessed the limit for detecting cases using this method to be around 2.4 new daily cases per 100,000 individuals.
In addition, Black et al. [72] demonstrated that the likelihood of detecting the virus rose with higher numbers of confirmed infected individuals. However, this probability diminished with greater distances from the source of infection and a longer duration since the onset of the disease.
Black et al. [72] observed that detecting the virus was most probable when infected individuals were identified within the initial two weeks of their illness. This timeframe aligns with when these individuals were most likely to experience increased viral shedding and their proximity to the sampling location was within 5 km. However, Q. Li et al. [29] concluded that detecting SARS-CoV-2 RNA in wastewater with 50%, 80%, and 99% probability requires one new COVID-19 case per 9091, 4762, and 2564 individuals in a community, respectively. Thus, researchers agree on the need for systematic and standardized procedures for sample collection, storage, and processing to maintain the integrity of results. Current research efforts focus on developing methods to concentrate SARS-CoV-2 RNA, mitigate PCR inhibition, and gauge detection likelihood based on the prevalence of cases, which are central to advancing this field. While optimistic about the potential of WBE as a surveillance tool, the scientific community remains aware of the inherent uncertainties and strives to develop robust, reliable practices with proper validation and calibration.
3.8. Sample Normalization
Traditional measures using concentrations face challenges due to variations in flow rates and population sizes [73,74]. Consequently, the normalization of WBE data is a critical step in ensuring reliable comparisons between different locations and time points [74]. Data normalization is essential not only for evaluating pharmaceuticals but also for monitoring pathogens like SARS-CoV-2, which causes the COVID-19 pandemic, where it serves a critical function in surveillance efforts [75]. Due to these factors, it is essential to adjust the measured concentration values to account for differences in population sizes and flow rates. This normalization process enables dependable comparisons across different locations [20,74]. This is also widely used in WBE SARS-CoV-2 surveillance [16,76,77].
According to Maal-Bared et al. [76], normalizing WBE data involves correcting analyte measurements to counteract the variability caused by the dilution of fecal matter due to the introduction of non-sanitary sewage, stormwater, or groundwater infiltration. There is currently no agreement on which normalization parameters for WBE yield the strongest correlations and provide the earliest indication between SARS-CoV-2 WBE data and COVID-19 case trends [76]. Overall, Maal-Bared et al. [76], based on their findings, deduced that normalizing data has a minor effect on enhancing the correlations between WBE data and clinical data. In addition, additional biomarkers were identified related to the population, including creatinine, cholesterol, coprostanol, nicotine, cortisol, androstenedione, and the serotonin metabolite 5-hydroxyindoleacetic acid (5-HIAA) [78,79,80,81]. Nonetheless, analyzing all these biomarkers necessitates expertise in analytical chemistry. Concerns persist regarding applying these markers across diverse catchment areas because variable consumption or disposal practices, stability, and sorption to particulate matter introduce a high level of uncertainty [82,83]. Maal-Bared et al. [76] conducted research to assess whether normalization using the Pepper Mild Mottle virus (PMMoV) offers any benefits over other normalization parameters, such as the flow rate, reported and dynamic population sizes, biological oxygen demand (BOD), total suspended solids (TSSs), ammonia (NH3), and total phosphorus (TP). In the study, Mall-Bared et al. [76] concluded that under most conditions, either using raw concentration data or data normalized by simpler, quicker, and more cost-effective wastewater strength parameters (e.g., Total Kjeldahl Nitrogen (TKN), TP, NH3) could offer benefits comparable to those provided by normalization with PMMoV data. This conclusion aligns with the results reported by Saingam et al. and Sakarovitch et al. [81,84]. According to Maal-Bared et al. [76], widespread practice involves normalizing SARS-CoV-2 RNA concentrations using endogenous human fecal markers. This is achieved by detecting organisms or compounds unique to human feces in wastewater to gauge its human fecal content or fecal strength. Various biomarkers are employed for this purpose, including PMMoV; Bacteroides HF183, F-specific RNA bacteriophages, human 18S rRNA, crAssphage, fecal coliforms, and β-2-macroglobulin; and the neurotransmitter metabolite 5-hydroxyindole acetic acid (5-HIAA) [16,85,86]. The latter, according to Mac Mahon et al. [20,83], may be more appropriate for international comparisons since others could serve as an internal reference to manage variability between samples due to differences in wastewater dilution or processing.
Ahmed et al. [87] suggested that the prevalence of SARS-CoV-2 infection within a specific catchment area can be assessed by performing a mass balance analysis. This involves comparing the total daily count of viral RNA copies found in wastewater, as detected by RT-qPCR, with the daily amount of SARS-CoV-2 RNA copies excreted in the stool by an infected person (Equation (1)) [87].
Weidhaas et al. [27], in their study, evaluated wastewater from three plants to determine the degradation of RNA during storage at temperatures of 4 °C and −80 °C and throughout its transport in a sewer system at 10 °C and 35 °C. In these decay studies, the initial viral RNA concentrations in the wastewater ranged from 135 to 953 gene copies per mL. The findings reveal that the viral RNA exhibited a first-order decay rate between 0.09 and 0.12 per hour for 22 to 24 h at temperatures of 4, 10, and 35 °C. The RNA became undetectable after 6 h at a temperature of 35 °C, yet it remained detectable after 22 h of incubation at 4 and 10 °C, and even after 1 week at −80 °C [27].
Furthermore, X. Li et al. [9] evaluated the existing research, indicating that the decay of SARS-CoV-2 RNA in wastewater adheres to a first-order decay model over time, which can be represented by the formula shown in Equation (2) [9] below:
where Ct and C0 denote the concentrations of SARS-CoV-2 RNA in wastewater at time t and the initial time, respectively, and k represents the rate constant of decay. As the temperature of the wastewater rose from 4 °C to 37 °C, the k values shifted from 0.084 ± 0.013 per day to 0.286 ± 0.008 per day, which demonstrates that an increase in wastewater temperature significantly decreases the stability of SARS-CoV-2 RNA in wastewater (p < 0.0001) [9]. For wastewater maintained at 20 °C, similar decay rates (k value) ranging between 0.067 per day and 0.09 per day were reported by X. Li et al. [9].
The time required to achieve a 90% (one log) reduction (T90), according to Ahmed, Bertsch, and Bibby et al. [64], is shown below (Equation (3)):
To derive dynamic population estimates, as outlined by Maal-Bared et al. [76] and Wade et al. [77], specific concentrations of wastewater physicochemical properties, published per capita excretion rates for the chosen biomarker, and flow rates should be considered. The dynamic population size is determined by taking the product of the daily measured concentrations of the parameter (Xd) and the daily wastewater flow rates (QD), then dividing this by the per capita excretion rate of the biomarker reported in the literature (x mg per capita per day), as given in Equation (4) [76] below.
Maal-Bared et al. [76] outlined daily discharge rates per capita from the literature, which can be summarized as follows: TP at 1.8 g per person per day; BOD ranging from 50 to 118 g per person per day, with an average of 84 g of BOD per person per day; NH3 at 8.1 g per person per day; TSSs between 59 and 150 g per person per day, with an average of 105 g of TSSs per person per day; and TKN from 9.1 to 22.7 g per person per day, averaging at 15.9 g of TKN per person per day (Figure 5).
In the study of human nutrient emissions performed by Drecht et al. [88], a key finding is that these emissions correlate with income levels, notably via the more accurate metric of purchasing power parity (PPP) rather than market exchange rates. This relationship indicates that individuals in wealthier nations tend to have higher nitrogen (N) emissions due to dietary habits. Researchers have developed new formulae to estimate human N and phosphorus (P) emissions. The estimates suggest a significant disparity in protein N intake between low-income (<8.4 g of N/person/day) and industrialized countries (~16 g of N/person/day), with the latter being well aligned with observed data from European wastewater studies [88]. This indicates that economic status correlates with higher dietary protein intake and, consequently, higher N and P emissions.
The findings from the study by Maal-Bared et al. [76] demonstrated that normalizing with ammonia, TKN, and TP yielded the most significant differences in correlation coefficients (p-values) when performing Spearman’s rho value estimations, as outlined by von Sperling et al. [26]. This approach was followed in effectiveness by normalization using PMMoV and dynamic population estimates calculated with the same parameters. On the other hand, dynamic population estimates derived from BOD and TSSs, flow rates, and combinations of flow and population metrics resulted in weaker correlations [76].
According to Maal-Bared et al. [76], in areas with considerable tourism activity or a significant number of part-time residents, employing dynamic population size calculations could be particularly beneficial. Furthermore, the expense associated with conducting a PMMoV analysis annually for two years is roughly equal to the cost of acquiring a flowmeter, which can offer higher-quality WWTP data useful not only for WBE but also for other aspects of WWTP management [76]. According to Gudra et al. [14], the above-mentioned factors, as well as the movement of individuals, complicate the process of estimating disease prevalence via WBE, which is vital for effective crisis management. Thus, the movement of populations can significantly affect the results of WBE measurements, potentially leading to outcomes that do not accurately represent the epidemiological condition of the area in question. Gudra et al. [14] demonstrated that an accurate portrayal of the COVID-19 epidemiological status in small- and medium-sized towns could be achieved by integrating data on the detected numbers of SARS-CoV-2 RNA copies, analyses of 5-HIAA in wastewater, and mobile call detail records. This study represented the initial demonstration of using WBE for tracking COVID-19 outbreaks in Latvia, showing that integrating measurements for estimating population size, such as 5-HIAA levels and call detail record data, enhances the precision of the WBE methodology [14]. Results from the study of Holm et al. [89] over four months, which analyzed unmodified wastewater data, found that the concentration of the fecal indicator human ribonuclease P (RNase P) varied from 5.1 × 101 to 1.15 × 10⁶ copies per milliliter. The counts for PMMoV were within the range of 7.23 × 10³ to 3.53 × 10⁷ copies per milliliter, while the crAssphage ranged from 9.69 × 10³ to 1.85 × 10⁸ copies per milliliter. These findings highlighted both regional and temporal differences in the data. Holm et al. [89] concluded that when fecal indicators are employed for normalization purposes, understanding the daily flow of the sewer system at the sample location might be more crucial than accounting for rainfall.
Studies have revealed that the use of certain population biomarkers and normalization parameters may yield varying degrees of correlation with clinical data, impacting the reliability and comparability of results [5,73,75,90,91,92,93]. Moreover, environmental variables such as temperature can significantly affect the decay rate of viral RNA in wastewater, thus further influencing the normalization process and subsequent interpretation of the data [73,90,93]. The dynamic nature of population estimates also poses challenges for WBE, especially in regions with fluctuating populations due to tourism or part-time residency [14].
3.9. Wastewater Matrix and Environmental Factors
The accuracy and reliability of WBE are affected by various uncertainties [10]. Infrastructure characteristics, such as the layout and age of the sewage network, influence the dilution and residence time of pathogens like SARS-CoV-2 [16]. Numerous factors, including the physical and chemical properties of wastewater, demographic parameters, and environmental conditions, impact the detection rate and persistence of viral loads in sewage, ultimately affecting disease detection and the robustness of the WBE approach [10].
The primary area of uncertainty concerning the use of WBE for disease detection involves the configuration, age, geographic layout, and capacity of the sewage network, which can significantly influence the dilution, residence time, and persistence of the virus within the sewer system [16]. Older sewage systems often exhibit considerable leakage and infiltration issues, and in systems where sewage and stormwater are combined, heavy rainfall can lead to overflow events, resulting in the loss of viruses and significant dilution of the wastewater, which could affect the concentration of viral loads [16]. The adsorption or desorption of viruses between the liquid phase and the sewage sludge can also alter the viral content found in wastewater samples [16]. In addition to dilution, a further diminution in the viral RNA load is anticipated when feces and other human excreta enter the sewer system due to the inactivation of viruses influenced by the current environmental conditions (temperature, pH, solids content, and dissolved oxygen), as well as the presence of antagonist microorganisms (Escherichia coli, Enterococcus spp., Bacillus spp., Clostridium spp., etc.) and chemicals (i.e., detergents, disinfectants) in the sewage [16,46]. For instance, Haak et al. [13], in their study, identified various demographic factors that exhibit significant differences across these regions, including population density, levels of poverty, household income, and age distribution. Their findings offer a more tactical method for detecting disease outbreaks at the neighborhood level, demonstrating how the selection of sampling sites could be tailored according to the spatial and demographic features of different neighborhoods [13]. Furthermore, the study performed by Haak et al. [13] identified the following: (1) statistically significant hotspots appeared in suburban neighborhoods around two weeks after the emergence of significant hotspots in urban center neighborhoods; (2) locations experiencing the highest peaks in viral concentrations were typically characterized by a younger median age, higher poverty rates, lower household incomes, and greater population densities; (3) the influents of WWTPs had the strongest correlation with sampling sites situated in areas that were the most urbanized and generally nearest to the WWTPs.
According to a study performed by Domokos et al. [12], factors such as industrial discharges and rainfall events can influence virus detection. Studying physicochemical parameters, including temperature, chemical oxygen demand (COD), chloride concentrations, and electrical conductivity, can offer deeper insights into the extent of dilution. COD, in particular, is highlighted as being especially indicative of dilution levels, both in scenarios of heavy rainfall leading to high dilution and in the presence of pollutants found in industrial effluents, as noted by Lastra et al. [94]. In addition, Lastra et al. [94] identified rainfall events’ data as the primary factor responsible for dispersion together with physicochemical parameters [12]. However, Wang et al. [95] demonstrated that SARS-CoV remained viable for 14 days when kept at a temperature of 4 °C but was deactivated after just 2 days at a temperature of 20 °C. Nevertheless, at a temperature of 4 °C, SARS-CoV survived for 14 days in wastewater and at least 17 days in feces or urine. SARS-CoV is more vulnerable to disinfectants compared to Escherichia coli and f2 phage. Free chlorine is more effective in deactivating SARS-CoV than chlorine dioxide. Maintaining free residual chlorine levels above 0.5 mg/L for chlorine or 2.19 mg/L for chlorine dioxide in wastewater guarantees the total inactivation of SARS-CoV. In contrast, it does not completely inactivate E. coli and f2 phage [95].
Bivins et al. [57] mentioned that the RNA signal from SARS-CoV-2 shows greater persistence than the infectious form of SARS-CoV-2 with T90 values (time required for 1−log10 reduction) of 3.3 days versus 1.6 days in wastewater at high concentrations (105 TCID50 mL−1) and 26.2 days versus 2.1 days at low concentrations (103 TCID50 mL−1) at 20 °C. In addition, Tiwari et al.’s study [96] appears to bear some correlation with the detection rate of SARS-CoV-2, as indicated by the TSS values observed in samples where SARS-CoV-2 RNA was not detected at 305.3 ± 18.1 mg/L while the TSS value from samples with the detection of SARS-CoV-2 RNA was 393.1 ± 10.1 mg/L. The detection rate of SARS-CoV-2 RNA in wastewater did not show a significant relationship with the values of biological oxygen demand, chemical oxygen demand, total nitrogen, total phosphorus, and ammonium nitrate, according to the analysis conducted using the Mann–Whitney U test [96]. Tiwari et al., in their study [96], concluded that during events where influent flow peaks and contains runoff water, the composition of the influent might alter in such a manner that the quantities of SARS-CoV-2 are diluted within the samples. This poses a problem, particularly when the presence of SARS-CoV-2 is barely detectable, as runoff waters can lead to false-negative results in WBE studies of SARS-CoV-2 owing to the impact of dilution. The ability to detect and quantify SARS-CoV-2 RNA across different wastewater samples and within various WWTPs can be influenced by changes in the physical and chemical properties of the wastewater. For instance, the varying levels of substances that inhibit PCR among different sampling events can lead to discrepancies in the results [96].
In research performed by Petala et al. [97], a physicochemical model was developed to mimic the dynamic adsorption of SARS-CoV-2 RNA onto suspended solids, which also enabled the detection of measurable SARS-CoV-2 concentrations in wastewater by considering various factors, including the inlet flow rate, concentration of TSSs, dissolved oxygen (DO), 5-day biochemical oxygen demand (BOD5), COD, UV absorbance at 254 nm (UV254), dissolved organic carbon (DOC), ammonium, nitrates, total organic nitrogen, TP, and ortho-phosphates. By aligning the model with data obtained from actual sewer systems and COVID-19 prevalence rates in the catchment area, Petala and colleagues [97] discovered that the ratio of UV254 to DOC and DO levels exhibited the strongest correlation with changes in viral concentration in wastewater, which indicates the significant influence of humic-like substances in conjunction with DO on the adsorption and degradation of the virus within sewage systems [97].
When fitting the model with the data from real sewers and the COVID-19 prevalence in the catchment area, UV254/DOC and DO showed the highest correlation with the variation of viral concentration in wastewater, suggesting the strong impact on viral adsorption and decay in sewage caused by the presence of humic-like substances combined with DO [97].
In a study by X. Li et al. [22], the effects of environmental factors, WBE sampling design, and epidemiological circumstances on the correlation were evaluated using the same datasets. This scoping review compiled 133 correlation coefficients, which varied from −0.38 to 0.99. The relationship between COVID-19 RNA concentrations and new cases (whether daily, weekly, or future cases) was stronger than the correlation with active or cumulative cases. These correlations were likely influenced by the environmental and epidemiological conditions and the design of the WBE sampling [22].
Normalization methods are indeed paramount to enhancing the accuracy of WBE data, but no consensus has been reached regarding the most influential parameters. Research indicates that while normalization may improve data comparability, the choice of the normalization parameter can greatly affect the correlation strength with clinical datasets. Studies suggest that simpler normalization parameters could be as effective as more complex ones. Additionally, the robustness of WBE as a monitoring tool is not only limited to the chosen biomarkers but is also influenced by factors such as temperature, population mobility, and data from additional sources such as mobile call records. Moving forward, a deeper understanding of these diverse normalization methods and external factors is crucial in optimizing WBE for disease surveillance and population health management.
4. Discussion
Though many studies have detected and quantified SARS-CoV-2 RNA concentrations in wastewater (CRNA), correlation coefficients estimated within the reviewed published studies have a considerably wide range, which correspondingly leads to high uncertainty levels for estimating the actual number of infected persons within the sewerage catchment [22,27].
Thus, considering the facts collected and described in the reviewed papers, many aspects impact the results of detection and quantification of CRNA in wastewater and the interpretation of acquired results compared to the actual number of infected persons in the particular area served by the sewerage collection system, including virological, epidemiological, analytical, geographical, environmental, socio-economical, and engineering factors.
Several factors influence the study of viruses in sewer systems, including the variant of the virus, which covers aspects like shedding and infectivity rates along with the virus’s vitality and persistence within the sewer environment [12,49,50,52,98,99]. The methodology of selecting points for sampling and its procedure, which can involve choosing between flow-based and time-based sampling methods, also plays a critical role [10,12,30,60,99]. Additionally, the processes for preserving, preparing, and testing samples are crucial components of the research [64,65,66,67,68]. Methods for normalizing samples to ensure accurate results are necessary as well [16,73,74,75,76,78,79,80,81]. Socio-economic aspects within the study area, such as the median age of inhabitants, poverty rates, income levels, and population densities, can significantly affect the outcomes of such studies [16]. Lastly, the wastewater matrix and environmental elements constitute an extensive category that encompasses the sewage network’s layout, condition, and age, as well as geographical factors like climate and water temperatures, the sewer system’s capacity, dilution factors (including stormwater and infiltration), residence time in the sewer system, and the physicochemical composition of the wastewater, which may be notably affected by the presence of specific industrial wastewater [16,22,96].
The further evaluation of these factors’ impact on the precision of the results could increase the accuracy of infected person estimates using WBE and better interpretation of acquired data. However, understanding of the influence of various engineering aspects remains incomplete, necessitating further research to bridge the existing knowledge gaps [17,100,101]. Therefore, further studies are needed to address engineering issues in developing new WBE methodologies, including the following aspects:
- Appropriate normalization methods to determine the most efficient process, especially using wastewater parameters and measurements, which are used in the usual monitoring performance of most WWTPs. These include the specific wastewater amount per person, TSSs, BOD, COD, N and its forms, P and its forms, temperature, pH, conductivity, or a combination.
- Appropriate factor identification in the latter, which has a higher impact on the virus detection, quantification, and estimation of the actual number of infected persons using WBE during virus RNA transport within the sewer system.
- The transposition and interpretation of the socio-economic aspects of the wastewater composition parameters.
- Development of mathematical models for virus, bacteria, or chemical transport within sewerage systems.
Nevertheless, this scoping review also has some limitations, as not all engineering aspects can be precisely defined and described due to the multi-disciplinary context of the subject, limiting more precise searches in scientific databases. The outcomes of prospective investigations in this domain can offer novel sampling design and data analysis methodologies, along with potential tools for managing the spread of infections and pandemics. Existing available studies primarily focus on scientific findings from Europe, North America, and Asia, leaving a gap in understanding in Africa and South America [21]. Expanding the scope of these studies to include these areas would provide a more comprehensive overview of the topic across different regions.
Applying WBE may prove more cost-effective than extensive direct testing of individuals. Moreover, the knowledge garnered from these future studies could extend beyond viral detection, quantification, analyses, and interpretation, encompassing other viruses, such as the polio virus, and diverse chemicals or drugs. These findings could revolutionize public health and surveillance strategies, shaping a more comprehensive understanding of disease dynamics and facilitating more efficient interventions. However, new methodologies using routine analyses are needed for WBE to become a widely used surveillance method by water companies. For instance, wastewater matrix data (e.g., flow rate, TSSs, BOD, COD, N, and P) collected at the wastewater treatment plant for treatment process control could improve and facilitate the WBE data-normalization process.
Supplementary Materials
The following supporting information can be downloaded at: https://www.mdpi.com/article/10.3390/w16091220/s1, PRISMA-ScR checklist and flow diagram.
Author Contributions
Conceptualization, J.L. and T.J.; methodology, J.L. and T.J.; validation, B.D. and S.D.; formal analysis, B.D., S.D. and T.J.; investigation, J.L.; resources, B.D., S.D. and T.J.; data curation, J.L.; writing—original draft preparation, J.L.; writing—review and editing, J.L., B.D., S.D. and T.J.; visualization, J.L.; supervision, T.J.; project administration, B.D., S.D. and T.J.; funding acquisition, T.J. All authors have read and agreed to the published version of the manuscript.
Funding
The work was supported by the project “Platform for the COVID-19 safe work environment” (ID. 1.1.1.1/21/A/011), which is founded by European Regional Development Fund specific objective 1.1.1 “Improve research and innovation capacity and the ability of Latvian research institutions to attract external funding, by investing in human capital and infrastructure”. The project is co-financed by REACT-EU funding for mitigating the consequences of the pandemic crisis.
Data Availability Statement
Data are contained within the Supplementary Materials.
Conflicts of Interest
The authors declare no conflicts of interest.
References
- Galani, A.; Aalizadeh, R.; Kostakis, M.; Markou, A.; Alygizakis, N.; Lytras, T.; Adamopoulos, P.G.; Peccia, J.; Thompson, D.C.; Kontou, A.; et al. SARS-CoV-2 wastewater surveillance data can predict hospitalizations and ICU admissions. Sci. Total Environ. 2022, 804, 150151. [Google Scholar] [CrossRef] [PubMed]
- Gao, Z.; Gao, M.; Chen, C.H.; Zhou, Y.; Zhan, Z.H.; Ren, Y. Knowledge graph of wastewater-based epidemiology development: A data-driven analysis based on research topics and trends. Environ. Sci. Pollut. Res. 2023, 30, 28373–28382. [Google Scholar] [CrossRef] [PubMed]
- Faraway, J.; Boxall-Clasby, J.; Feil, E.J.; Gibbon, M.J.; Hatfield, O.; Kasprzyk-Hordern, B.; Smith, T. Challenges in realising the potential of wastewater-based epidemiology to quantitatively monitor and predict the spread of disease. J. Water Health 2022, 20, 1038–1050. [Google Scholar] [CrossRef] [PubMed]
- Hart, O.E.; Halden, R.U. Computational analysis of SARS-CoV-2/COVID-19 surveillance by wastewater-based epidemiology locally and globally: Feasibility, economy, opportunities and challenges. Sci. Total Environ. 2020, 730, 138875. [Google Scholar] [CrossRef]
- Hou, C.; Chu, T.; Chen, M.; Hua, Z.; Xu, P.; Xu, H.; Wang, Y.; Liao, J.; Di, B. Application of multi-parameter population model based on endogenous population biomarkers and flow volume in wastewater epidemiology. Sci. Total Environ. 2021, 759, 143480. [Google Scholar] [CrossRef] [PubMed]
- Berzina, Z.; Pavlenko, R.; Jansons, M.; Bartkiene, E.; Neilands, R.; Pugajeva, I.; Bartkevics, V. Application of Wastewater-Based Epidemiology for Tracking Human Exposure to Deoxynivalenol and Enniatins. Toxins 2022, 14, 91. [Google Scholar] [CrossRef] [PubMed]
- Tomsone, L.E.; Perkons, I.; Sukajeva, V.; Neilands, R.; Kokina, K.; Bartkevics, V.; Pugajeva, I. Consumption trends of pharmaceuticals and psychoactive drugs in Latvia determined by the analysis of wastewater. Water Res. 2022, 221, 118800. [Google Scholar] [CrossRef] [PubMed]
- Wang, H.; Xu, B.; Yang, L.; Huo, T.; Bai, D.; An, Q.; Li, X. Consumption of common illicit drugs in twenty-one cities in southwest China through wastewater analysis. Sci. Total Environ. 2022, 851, 158105. [Google Scholar] [CrossRef]
- Li, X.; Zhang, S.; Shi, J.; Luby, S.P.; Jiang, G. Uncertainties in estimating SARS-CoV-2 prevalence by wastewater-based epidemiology. Chem. Eng. J. 2021, 415, 129039. [Google Scholar] [CrossRef]
- Polo, D.; Quintela-Baluja, M.; Corbishley, A.; Jones, D.L.; Singer, A.C.; Graham, D.W.; Romalde, J.L. Making waves: Wastewater-based epidemiology for COVID-19—Approaches and challenges for surveillance and prediction. Water Res. 2020, 186, 116404. [Google Scholar] [CrossRef]
- Zhang, D.; Duran, S.S.F.; Lim, W.Y.S.; Tan, C.K.I.; Cheong, W.C.D.; Suwardi, A.; Loh, X.J. SARS-CoV-2 in wastewater: From detection to evaluation. Mater. Today Adv. 2022, 13, 100211. [Google Scholar] [CrossRef] [PubMed]
- Domokos, E.; Sebestyén, V.; Somogyi, V.; Trájer, A.J.; Gerencsér-Berta, R.; Oláhné Horváth, B.; Tóth, E.G.; Jakab, F.; Kemenesi, G.; Abonyi, J. Identification of sampling points for the detection of SARS-CoV-2 in the sewage system. Sustain. Cities Soc. 2022, 76, 103422. [Google Scholar] [CrossRef] [PubMed]
- Haak, L.; Delic, B.; Li, L.; Guarin, T.; Mazurowski, L.; Dastjerdi, N.G.; Dewan, A.; Pagilla, K. Spatial and temporal variability and data bias in wastewater surveillance of SARS-CoV-2 in a sewer system. Sci. Total Environ. 2022, 805, 150390. [Google Scholar] [CrossRef] [PubMed]
- Gudra, D.; Dejus, S.; Bartkevics, V.; Roga, A.; Kalnina, I.; Strods, M.; Rayan, A.; Kokina, K.; Zajakina, A.; Dumpis, U.; et al. Detection of SARS-CoV-2 RNA in wastewater and importance of population size assessment in smaller cities: An exploratory case study from two municipalities in Latvia. Sci. Total Environ. 2022, 823, 153775. [Google Scholar] [CrossRef] [PubMed]
- Cervantes-Avilés, P.; Moreno-Andrade, I.; Carrillo-Reyes, J. Approaches applied to detect SARS-CoV-2 in wastewater and perspectives post-COVID-19. J. Water Process Eng. 2021, 40, 101947. [Google Scholar] [CrossRef] [PubMed]
- Mahon, J.M.; Monleon, A.J.C.; Gill, L.W.; O’Sullivan, J.J.; Meijer, W.G. Wastewater-based epidemiology (WBE) for SARS-CoV-2—A review focussing on the significance of the sewer network using a Dublin city catchment case study. Water Sci. Technol. 2022, 86, 1402–1425. [Google Scholar] [CrossRef] [PubMed]
- Tran, H.N.; Le, G.T.; Nguyen, D.T.; Juang, R.S.; Rinklebe, J.; Bhatnagar, A.; Lima, E.C.; Iqbal, H.M.N.; Sarmah, A.K.; Chao, H.P. SARS-CoV-2 coronavirus in water and wastewater: A critical review about presence and concern. Environ. Res. 2021, 193, 110265. [Google Scholar] [CrossRef] [PubMed]
- Moher, D.; Liberati, A.; Tetzlaff, J.; Altman, D.G. Guidelines and Guidance Preferred Reporting Items for Systematic Reviews and Meta-Analyses: The PRISMA Statement. Ann. Intern. Med. 2009, 151, 264–269. [Google Scholar] [CrossRef] [PubMed]
- Tricco, A.C.; Lillie, E.; Zarin, W.; O’Brien, K.K.; Colquhoun, H.; Levac, D.; Moher, D.; Peters, M.D.J.; Horsley, T.; Weeks, L. PRISMA extension for scoping reviews (PRISMA-ScR): Checklist and explanation. Ann. Intern. Med. 2018, 169, 467–473. [Google Scholar] [CrossRef]
- Boogaerts, T.; Ahmed, F.; Choi, P.M.; Tscharke, B.; O’Brien, J.; De Loof, H.; Gao, J.; Thai, P.; Thomas, K.; Mueller, J.F.; et al. Current and future perspectives for wastewater-based epidemiology as a monitoring tool for pharmaceutical use. Sci. Total Environ. 2021, 789, 148047. [Google Scholar] [CrossRef]
- Elsevier. Scopus Data Base. Available online: www.scopus.com (accessed on 26 November 2023).
- Li, X.; Zhang, S.; Sherchan, S.; Orive, G.; Lertxundi, U.; Haramoto, E.; Honda, R.; Kumar, M.; Arora, S.; Kitajima, M. Correlation between SARS-CoV-2 RNA concentration in wastewater and COVID-19 cases in community: A systematic review and meta-analysis. J. Hazard. Mater. 2023, 441, 129848. [Google Scholar] [CrossRef] [PubMed]
- Li, X.; Kulandaivelu, J.; Guo, Y.; Zhang, S.; Shi, J.; O’Brien, J.; Arora, S.; Kumar, M.; Sherchan, S.P.; Honda, R.; et al. SARS-CoV-2 shedding sources in wastewater and implications for wastewater-based epidemiology. J. Hazard. Mater. 2022, 432, 128667. [Google Scholar] [CrossRef] [PubMed]
- Jones, D.L.; Baluja, M.Q.; Graham, D.W.; Corbishley, A.; McDonald, J.E.; Malham, S.K.; Hillary, L.S.; Connor, T.R.; Gaze, W.H.; Moura, I.B.; et al. Shedding of SARS-CoV-2 in feces and urine and its potential role in person-to-person transmission and the environment-based spread of COVID-19. Sci. Total Environ. 2020, 749, 141364. [Google Scholar] [CrossRef] [PubMed]
- Wu, F.; Xiao, A.; Zhang, J.; Moniz, K.; Endo, N.; Armas, F.; Bonneau, R.; Brown, M.A.; Bushman, M.; Chai, P.R.; et al. SARS-CoV-2 RNA concentrations in wastewater foreshadow dynamics and clinical presentation of new COVID-19 cases. Sci. Total Environ. 2022, 805, 150121. [Google Scholar] [CrossRef] [PubMed]
- Von Sperling, M.; Verbyla, M.E.; Oliveira, S.M.A.C. Relationship between monitoring variables. Correlation and regression analysis. In Assessment of Treatment Plant Performance and Water Quality Data: A Guide for Students, Researchers and Practitioners; IWA Publishing: London, UK, 2020; pp. 397–477. [Google Scholar] [CrossRef]
- Weidhaas, J.; Aanderud, Z.T.; Roper, D.K.; VanDerslice, J.; Gaddis, E.B.; Ostermiller, J.; Hoffman, K.; Jamal, R.; Heck, P.; Zhang, Y.; et al. Correlation of SARS-CoV-2 RNA in wastewater with COVID-19 disease burden in sewersheds. Sci. Total Environ. 2021, 775, 145790. [Google Scholar] [CrossRef] [PubMed]
- Medema, G.; Heijnen, L.; Elsinga, G.; Italiaander, R.; Brouwer, A. Presence of SARS-Coronavirus-2 RNA in Sewage and Correlation with Reported COVID-19 Prevalence in the Early Stage of the Epidemic in the Netherlands. Environ. Sci. Technol. Lett. 2020, 7, 511–516. [Google Scholar] [CrossRef] [PubMed]
- Li, Q.; Lee, B.E.; Gao, T.; Qiu, Y.; Ellehoj, E.; Yu, J.; Diggle, M.; Tipples, G.; Maal-Bared, R.; Hinshaw, D.; et al. Number of COVID-19 cases required in a population to detect SARS-CoV-2 RNA in wastewater in the province of Alberta, Canada: Sensitivity assessment. J. Environ. Sci. 2023, 125, 843–850. [Google Scholar] [CrossRef] [PubMed]
- Kapoor, V.; Al-Duroobi, H.; Phan, D.C.; Palekar, R.S.; Blount, B.; Rambhia, K.J. Wastewater surveillance for SARS-CoV-2 to support return to campus: Methodological considerations and data interpretation. Curr. Opin. Environ. Sci. Health 2022, 27, 100362. [Google Scholar] [CrossRef] [PubMed]
- Adeel, M.; Farooq, T.; Shakoor, N.; Ahmar, S.; Fiaz, S.; White, J.C.; Gardea-Torresdey, J.L.; Mora-Poblete, F.; Rui, Y. COVID-19 and nanoscience in the developing world: Rapid detection and remediation in wastewater. Nanomaterials 2021, 11, 991. [Google Scholar] [CrossRef]
- Assoum, M.; Lau, C.L.; Thai, P.K.; Ahmed, W.; Mueller, J.F.; Thomas, K.V.; Choi, P.M.; Jackson, G.; Selvey, L.A. Wastewater Surveillance Can Function as an Early Warning System for COVID-19 in Low-Incidence Settings. Trop. Med. Infect. Dis. 2023, 8, 211. [Google Scholar] [CrossRef]
- Murni, I.K.; Oktaria, V.; Handley, A.; McCarthy, D.T.; Donato, C.M.; Nuryastuti, T.; Supriyati, E.; Putri, D.A.D.; Sari, H.M.; Laksono, I.S.; et al. The feasibility of SARS-CoV-2 surveillance using wastewater and environmental sampling in Indonesia. PLoS ONE 2022, 17, e274793. [Google Scholar] [CrossRef]
- Keshaviah, A.; Hu, X.C.; Henry, M. Developing a flexible national wastewater surveillance system for COVID-19 and beyond. Environ. Health Perspect. 2021, 129, 045002. [Google Scholar] [CrossRef] [PubMed]
- Lazarus, J.V.; Romero, D.; Kopka, C.J.; Karim, S.A.; Abu-Raddad, L.J.; Almeida, G.; Baptista-Leite, R.; Barocas, J.A.; Barreto, M.L.; Bar-Yam, Y.; et al. A multinational Delphi consensus to end the COVID-19 public health threat. Nature 2022, 611, 332–345. [Google Scholar] [CrossRef] [PubMed]
- Vadde, K.K.; Al-Duroobi, H.; Phan, D.C.; Jafarzadeh, A.; Moghadam, S.V.; Matta, A.; Kapoor, V. Assessment of Concentration, Recovery, and Normalization of SARS-CoV-2 RNA from Two Wastewater Treatment Plants in Texas and Correlation with COVID-19 Cases in the Community. ACS EST Water 2022, 2, 2060–2069. [Google Scholar] [CrossRef] [PubMed]
- Hassard, F.; Lundy, L.; Singer, A.C.; Grimsley, J.; Di Cesare, M. Innovation in wastewater near-source tracking for rapid identification of COVID-19 in schools. Lancet Microbe 2021, 2, e4–e5. [Google Scholar] [CrossRef] [PubMed]
- Conway, M.J.; Kado, S.; Kooienga, B.K.; Sarette, J.S.; Kirby, M.H.; Marten, A.D.; Ward, A.S.; Abel, J.D.; King, S.; Billette, J.; et al. SARS-CoV-2 wastewater monitoring in rural and small metropolitan communities in Central Michigan. Sci. Total Environ. 2023, 894, 165013. [Google Scholar] [CrossRef] [PubMed]
- Lee, L.; Valmond, L.; Thomas, J.; Kim, A.; Austin, P.; Foster, M.; Matthews, J.; Kim, P.; Newman, J. Wastewater surveillance in smaller college communities may aid future public health initiatives. PLoS ONE 2022, 17, e270385. [Google Scholar] [CrossRef] [PubMed]
- Peccia, J.; Coleman, C.K.; LaMontagne, C.D.; Miller, M.E.; Kothegal, N.P.; Holcomb, D.A.; Blackwood, A.D.; Clerkin, T.J.; Serre, M.L. Measurement of SARS-CoV-2 RNA in wastewater tracks community infection dynamics. Nat. Biotechnol. 2020, 38, 1164–1167. [Google Scholar] [CrossRef] [PubMed]
- Dejus, B.; Cacivkins, P.; Gudra, D.; Dejus, S.; Ustinova, M.; Roga, A.; Strods, M.; Kibilds, J.; Boikmanis, G.; Ortlova, K.; et al. Wastewater-based prediction of COVID-19 cases using a random forest algorithm with strain prevalence data: A case study of five municipalities in Latvia. Sci. Total Environ. 2023, 891, 164519. [Google Scholar] [CrossRef]
- Ahmed, W.; Tscharke, B.; Bertsch, P.M.; Bibby, K.; Bivins, A.; Choi, P.; Clarke, L.; Dwyer, J.; Edson, J.; Nguyen, T.M.H.; et al. SARS-CoV-2 RNA monitoring in wastewater as a potential early warning system for COVID-19 transmission in the community: A temporal case study. Sci. Total Environ. 2021, 761, 144216. [Google Scholar] [CrossRef]
- Bibby, K.; Bivins, A.; Wu, Z.; North, D. Making waves: Plausible lead time for wastewater based epidemiology as an early warning system for COVID-19. Water Res. 2021, 202, 117438. [Google Scholar] [CrossRef] [PubMed]
- D’Aoust, P.M.; Graber, T.E.; Mercier, E.; Montpetit, D.; Alexandrov, I.; Neault, N.; Baig, A.T.; Mayne, J.; Zhang, X.; Alain, T.; et al. Catching a resurgence: Increase in SARS-CoV-2 viral RNA identified in wastewater 48 h before COVID-19 clinical tests and 96 h before hospitalizations. Sci. Total Environ. 2021, 770, 145319. [Google Scholar] [CrossRef] [PubMed]
- Krivoňáková, N.; Šoltýsov, A.; Tamáš, M. Mathematical modeling based on RT-qPCR analysis of SARS-CoV-2 in wastewater as a tool for epidemiology. Sci. Rep. 2021, 11, 19456. [Google Scholar] [CrossRef]
- Giacobbo, A.; Rodrigues, M.A.S.; Ferreira, J.Z.; Bernardes, A.M.; de Pinho, M.N. A critical review on SARS-CoV-2 infectivity in water and wastewater. What do we know? Sci. Total Environ. 2021, 774, 145721. [Google Scholar] [CrossRef]
- Kumar, M.; Jiang, G.; Kumar Thakur, A.; Chatterjee, S.; Bhattacharya, T.; Mohapatra, S.; Chaminda, T.; Kumar Tyagi, V.; Vithanage, M.; Bhattacharya, P.; et al. Lead time of early warning by wastewater surveillance for COVID-19: Geographical variations and impacting factors. Chem. Eng. J. 2022, 441, 135936. [Google Scholar] [CrossRef] [PubMed]
- Saawarn, B.; Hait, S. Occurrence, fate and removal of SARS-CoV-2 in wastewater: Current knowledge and future perspectives. J. Environ. Chem. Eng. 2021, 9, 104870. [Google Scholar] [CrossRef] [PubMed]
- Riediker, M.; Briceno-Ayala, L.; Ichihara, G.; Albani, D.; Poffet, D.; Tsai, D.H.; Iff, S.; Monn, C. Higher viral load and infectivity increase risk of aerosol transmission for Delta and Omicron variants of SARS-CoV-2. Swiss Med. Wkly. 2022, 152, 1–6. [Google Scholar] [CrossRef] [PubMed]
- Prasek, S.M.; Pepper, I.L.; Innes, G.K.; Slinski, S.; Betancourt, W.Q.; Foster, A.R.; Yaglom, H.D.; Porter, W.T.; Engelthaler, D.M.; Schmitz, B.W. Variant-specific SARS-CoV-2 shedding rates in wastewater. Sci. Total Environ. 2023, 857, 159165. [Google Scholar] [CrossRef] [PubMed]
- Sun, Y.; Wang, M.; Wei, F.; Huang, S.; Xu, J. COVID’s future: Viral multi-lineage evolution and the dynamics of small epidemic waves without seasonality in COVID-19. J. Biosaf. Biosecur. 2023, 5, 96–99. [Google Scholar] [CrossRef]
- Madewell, Z.J.; Yang, Y.; Longini, I.M.; Halloran, M.E.; Vespignani, A.; Dean, N.E. Rapid review and meta-analysis of serial intervals for SARS-CoV-2 Delta and Omicron variants. BMC Infect. Dis. 2023, 23, 429. [Google Scholar] [CrossRef]
- Ward, T.; Glaser, A.; Overton, C.E.; Carpenter, B.; Gent, N.; Seale, A.C. Replacement dynamics and the pathogenesis of the Alpha, Delta and Omicron variants of SARS-CoV-2. Epidemiol. Infect. 2023, 151, e32. [Google Scholar] [CrossRef] [PubMed]
- Ali, W.; Zhang, H.; Wang, Z.; Chang, C.; Javed, A.; Ali, K.; Du, W.; Niazi, N.K.; Mao, K.; Yang, Z. Occurrence of various viruses and recent evidence of SARS-CoV-2 in wastewater systems. J. Hazard. Mater. 2021, 414, 125439. [Google Scholar] [CrossRef] [PubMed]
- Rose, C.; Parker, A.; Jefferson, B.; Cartmell, E. The characterization of feces and urine: A review of the literature to inform advanced treatment technology. Crit. Rev. Environ. Sci. Technol. 2015, 45, 1827–1879. [Google Scholar] [CrossRef] [PubMed]
- Vo, V.; Tillett, R.L.; Chang, C.L.; Gerrity, D.; Betancourt, W.Q.; Oh, E.C. SARS-CoV-2 variant detection at a university dormitory using wastewater genomic tools. Sci. Total Environ. 2022, 805, 149930. [Google Scholar] [CrossRef] [PubMed]
- Bivins, A.; Greaves, J.; Fischer, R.; Yinda, K.C.; Ahmed, W.; Kitajima, M.; Munster, V.J.; Bibby, K. Persistence of SARS-CoV-2 in Water and Wastewater. Environ. Sci. Technol. Lett. 2020, 7, 937–942. [Google Scholar] [CrossRef] [PubMed]
- Tiwari, A.; Phan, N.; Tandukar, S.; Ashoori, R.; Thakali, O.; Mousazadesh, M.; Dehghani, M.H.; Sherchan, S.P. Persistence and occurrence of SARS-CoV-2 in water and wastewater environments: A review of the current literature. Environ. Sci. Pollut. Res. 2022, 29, 85658–85668. [Google Scholar] [CrossRef] [PubMed]
- Rimoldi, S.G.; Stefani, F.; Gigantiello, A.; Polesello, S.; Comandatore, F.; Mileto, D.; Maresca, M.; Longobardi, C.; Mancon, A.; Romeri, F.; et al. Presence and infectivity of SARS-CoV-2 virus in wastewaters and rivers. Sci. Total Environ. 2020, 744, 140911. [Google Scholar] [CrossRef] [PubMed]
- Ahmed, W.; Bivins, A.; Bertsch, P.M.; Bibby, K.; Choi, P.M.; Farkas, K.; Gyawali, P.; Hamilton, K.A.; Haramoto, E.; Kitajima, M.; et al. Surveillance of SARS-CoV-2 RNA in wastewater: Methods optimization and quality control are crucial for generating reliable public health information. Curr. Opin. Environ. Sci. Health 2020, 17, 82–93. [Google Scholar] [CrossRef]
- Qasim, S.R. Wastewater Treatment Plants Planning, Design, and Operation, 2nd ed.; Technomic Publishing Company: Boca Raton, FL, USA, 1998. [Google Scholar]
- Heaton, K.W.; Radvan, J.; Cripps, H.; Mountford, R.A.; Braddon, F.E.M.; Hughes, A.O. Defecation frequency and timing, and stool form in the general population: A prospective study. Gut 1992, 33, 818–824. [Google Scholar] [CrossRef]
- Ahmed, W.; Bertsch, P.M.; Bivins, A.; Bibby, K.; Farkas, K.; Gathercole, A.; Haramoto, E.; Gyawali, P.; Korajkic, A.; McMinn, B.R.; et al. Comparison of virus concentration methods for the RT-qPCR-based recovery of murine hepatitis virus, a surrogate for SARS-CoV-2 from untreated wastewater. Sci. Total Environ. 2020, 739, 139960. [Google Scholar] [CrossRef]
- Ahmed, W.; Bertsch, P.M.; Bibby, K.; Haramoto, E.; Hewitt, J.; Huygens, F.; Gyawali, P.; Korajkic, A.; Riddell, S.; Sherchan, S.P.; et al. Decay of SARS-CoV-2 and surrogate murine hepatitis virus RNA in untreated wastewater to inform application in wastewater-based epidemiology. Environ. Res. 2020, 191, 110092. [Google Scholar] [CrossRef]
- Jafferali, M.H.; Khatami, K.; Atasoy, M.; Birgersson, M.; Williams, C.; Cetecioglu, Z. Benchmarking virus concentration methods for quantification of SARS-CoV-2 in raw wastewater. Sci. Total Environ. 2021, 755, 142939. [Google Scholar] [CrossRef] [PubMed]
- Karim, M.R.; Rhodes, E.R.; Brinkman, N.; Wymer, L.; Fout, G.S. New electropositive filter for concentrating enteroviruses and noroviruses from large volumes of water. Appl. Environ. Microbiol. 2009, 75, 2393–2399. [Google Scholar] [CrossRef]
- Dejus, B.; Ozols, R.; Strods, M.; Laicans, J.; Zajakina, A.; Roga, A.; Fridmanis, D.; Juhna, T. Performance Evaluation of Wastewater Concentration Device: Analysis of Recovery Rate for Implementing SARS-CoV-2 Wastewater-Based Epidemiology. Chem. Eng. Trans. 2023, 98, 273–278. [Google Scholar] [CrossRef]
- Kitajima, M.; Ahmed, W.; Bibby, K.; Carducci, A.; Gerba, C.P.; Hamilton, K.A.; Haramoto, E.; Rose, J.B. SARS-CoV-2 in wastewater: State of the knowledge and research needs. Sci. Total Environ. 2020, 739, 139076. [Google Scholar] [CrossRef]
- Schrader, C.; Schielke, A.; Ellerbroek, L.; Johne, R. PCR inhibitors-occurrence, properties and removal. J. Appl. Microbiol. 2012, 113, 1014–1026. [Google Scholar] [CrossRef]
- Qiu, Y.; Yu, J.; Pabbaraju, K.; Lee, B.E.; Gao, T.; Ashbolt, N.J.; Hrudey, S.E.; Diggle, M.; Tipples, G.; Maal-Bared, R.; et al. Validating and optimizing the method for molecular detection and quantification of SARS-CoV-2 in wastewater. Sci. Total Environ. 2022, 812, 151434. [Google Scholar] [CrossRef] [PubMed]
- Greenwald, H.D.; Kennedy, L.C.; Hinkle, A.; Whitney, O.N.; Fan, V.B.; Crits-Christoph, A.; Harris-Lovett, S.; Flamholz, A.I.; Al-Shayeb, B.; Liao, L.D.; et al. Tools for interpretation of wastewater SARS-CoV-2 temporal and spatial trends demonstrated with data collected in the San Francisco Bay Area. Water Res. X 2021, 12, 100111. [Google Scholar] [CrossRef] [PubMed]
- Black, J.; Aung, P.; Nolan, M.; Roney, E.; Poon, R.; Hennessy, D.; Crosbie, N.D.; Deere, D.; Jex, A.R.; John, N.; et al. Epidemiological evaluation of sewage surveillance as a tool to detect the presence of COVID-19 cases in a low case load setting. Sci. Total Environ. 2021, 786, 147469. [Google Scholar] [CrossRef]
- Hsu, S.Y.; Bayati, M.B.; Li, C.; Hsieh, H.Y.; Belenchia, A.; Klutts, J.; Zemmer, S.A.; Reynolds, M.; Semkiw, E.; Johnson, H.Y.; et al. Biomarkers selection for population normalization in SARS-CoV-2 wastewater-based epidemiology. Water Res. 2022, 223, 118985. [Google Scholar] [CrossRef]
- Rainey, A.L.; Liang, S.; Bisesi, J.H.; Sabo-Attwood, T.; Maurelli, A.T. A multistate assessment of population normalization factors for wastewater-based epidemiology of COVID-19. PLoS ONE 2023, 18, e0284370. [Google Scholar] [CrossRef] [PubMed]
- Oloye, F.F.; Xie, Y.; Challis, J.K.; Femi-Oloye, O.P.; Brinkmann, M.; McPhedran, K.N.; Jones, P.D.; Servos, M.R.; Giesy, J.P. Understanding common population markers for SARS-CoV-2 RNA normalization in wastewater—A review. Chemosphere 2023, 333, 138682. [Google Scholar] [CrossRef] [PubMed]
- Maal-Bared, R.; Qiu, Y.; Li, Q.; Gao, T.; Hrudey, S.E.; Bhavanam, S.; Ruecker, N.J.; Ellehoj, E.; Lee, B.E.; Pang, X. Does normalization of SARS-CoV-2 concentrations by Pepper Mild Mottle Virus improve correlations and lead time between wastewater surveillance and clinical data in Alberta (Canada) comparing twelve SARS-CoV-2 normalization approaches. Sci. Total Environ. 2022, 856, 158964. [Google Scholar] [CrossRef] [PubMed]
- Wade, M.J.; Lo Jacomo, A.; Armenise, E.; Brown, M.R.; Bunce, J.T.; Cameron, G.J.; Fang, Z.; Farkas, K.; Gilpin, D.F.; Graham, D.W.; et al. Understanding and managing uncertainty and variability for wastewater monitoring beyond the pandemic: Lessons learned from the United Kingdom national COVID-19 surveillance programmes. J. Hazard. Mater. 2022, 424, 127456. [Google Scholar] [CrossRef] [PubMed]
- Chen, C.; Kostakis, C.; Gerber, J.P.; Tscharke, B.J.; Irvine, R.J.; White, J.M. Towards finding a population biomarker for wastewater epidemiology studies. Sci. Total Environ. 2014, 487, 621–628. [Google Scholar] [CrossRef] [PubMed]
- Gracia-Lor, E. Measuring biomarkers in wastewater as a new source of epidemiological information: Current state and future perspectives. Environ. Int. 2017, 99, 131–150. [Google Scholar] [CrossRef] [PubMed]
- Choi, P.M.; Rodríguez-Mozaz, S.; Corominas, L.; Petrovic, M. Wastewater-based epidemiology biomarkers: Past, present and future. TrAC-Trends Anal. Chem. 2018, 105, 453–469. [Google Scholar] [CrossRef]
- Saingam, P.; Li, B.; Quoc, B.N.; Jain, T.; Bryan, A.; Winkler, M.K.H. Wastewater surveillance of SARS-CoV-2 at intra-city level demonstrated high resolution in tracking COVID-19 and calibration using chemical indicators. Sci. Total Environ. 2023, 866, 161467. [Google Scholar] [CrossRef] [PubMed]
- Rico, M.; Andrés-Costa, M.J.; Picó, Y. Estimating population size in wastewater-based epidemiology. Valencia metropolitan area as a case study. J. Hazard. Mater. 2017, 323, 156–165. [Google Scholar] [CrossRef]
- Kasprzyk-Hordern, B.; Sims, N.; Farkas, K.; Jagadeesan, K.; Proctor, K.; Wade, M.J.; Jones, D.L. Wastewater-based epidemiology for comprehensive community health diagnostics in a national surveillance study: Mining biochemical markers in wastewater. J. Hazard. Mater. 2023, 450, 130989. [Google Scholar] [CrossRef]
- Sakarovitch, C.; Schlosser, O.; Courtois, S.; Proust-Lima, C.; Couallier, J.; Pétrau, A.; Litrico, X.; Loret, J.F. Monitoring of SARS-CoV-2 in wastewater: What normalization for improved understanding of epidemic trends? J. Water Health 2022, 20, 712–726. [Google Scholar] [CrossRef] [PubMed]
- Wilder, M.L.; Middleton, F.; Larsen, D.A.; Du, Q.; Fenty, A.; Zeng, T.; Insaf, T.; Kilaru, P.; Collins, M.; Kmush, B.; et al. Co-quantification of crAssphage increases confidence in wastewater-based epidemiology for SARS-CoV-2 in low prevalence areas. Water Res. X 2021, 11, 100100. [Google Scholar] [CrossRef] [PubMed]
- Bivins, A.; Crank, K.; Greaves, J.; North, D.; Wu, Z.; Bibby, K. Cross-assembly phage and pepper mild mottle virus as viral water quality monitoring tools—Potential, research gaps, and way forward. Curr. Opin. Environ. Sci. Health 2020, 16, 54–61. [Google Scholar] [CrossRef]
- Ahme, W.; Angel, N.; Edson, J.; Bibby, K.; Bivins, A.; O’Brien, J.W.; Choi, P.M.; Kitajima, M.; Simpson, S.L.; Li, J.; et al. First confirmed detection of SARS-CoV-2 in untreated wastewater in Australia: A proof of concept for the wastewater surveillance of COVID-19 in the community. Sci. Total Environ. 2020, 728, 138764. [Google Scholar] [CrossRef] [PubMed]
- Van Drecht, G.; Bouwman, A.F.; Harrison, J.; Knoop, J.M. Global nitrogen and phosphate in urban wastewater for the period 1970 to 2050. Glob. Biogeochem. Cycles 2009, 23, 1–19. [Google Scholar] [CrossRef]
- Holm, R.H.; Nagarkar, M.; Yeager, R.A.; Talley, D.; Chaney, A.C.; Rai, J.P.; Mukherjee, A.; Rai, S.N.; Bhatnagar, A.; Smith, T. Surveillance of RNase P, PMMoV, and CrAssphage in wastewater as indicators of human fecal concentration across urban sewer neighborhoods, Kentucky. FEMS Microbes 2022, 3, xtac003. [Google Scholar] [CrossRef] [PubMed]
- Thai, P.K.; O’Brien, J.W.; Banks, A.P.W.; Jiang, G.; Gao, J.; Choi, P.M.; Yuan, Z.; Mueller, J.F. Evaluating the in-sewer stability of three potential population biomarkers for application in wastewater-based epidemiology. Sci. Total Environ. 2019, 671, 248–253. [Google Scholar] [CrossRef] [PubMed]
- O’Brien, J.W.; Banks, A.P.; Novic, A.J.; Mueller, J.F.; Jiang, G.; Ort, C.; Eaglesham, G.; Yuan, Z.; Thai, P.K. Impact of in-Sewer Degradation of Pharmaceutical and Personal Care Products (PPCPs) Population Markers on a Population Model. Environ. Sci. Technol. 2017, 51, 3816–3823. [Google Scholar] [CrossRef] [PubMed]
- Pandopulos, A.J.; Bade, R.; Tscharke, B.J.; O’Brien, J.W.; Simpson, B.S.; White, J.M.; Gerber, C. Application of catecholamine metabolites as endogenous population biomarkers for wastewater-based epidemiology. Sci. Total Environ. 2021, 763, 142992. [Google Scholar] [CrossRef]
- Li, Y.; Miyani, B.; Zhao, L.; Spooner, M.; Gentry, Z.; Zou, Y.; Rhodes, G.; Li, H.; Kaye, A.; Norton, J.; et al. Surveillance of SARS-CoV-2 in nine neighborhood sewersheds in Detroit Tri-County area, United States: Assessing per capita SARS-CoV-2 estimations and COVID-19 incidence. Sci. Total Environ. 2022, 851, 158350. [Google Scholar] [CrossRef]
- Lastra, A.; Botello, J.; Pinilla, A.; Urrutia, J.I.; Canora, J.; Sánchez, J.; Fernández, P.; Candel, F.J.; Zapatero, A.; Ortega, M.; et al. SARS-CoV-2 detection in wastewater as an early warning indicator for COVID-19 pandemic. Madrid region case study. Environ. Res. 2022, 203, 111852. [Google Scholar] [CrossRef] [PubMed]
- Wang, X.W.; Li, J.S.; Jin, M.; Zhen, B.; Kong, Q.X.; Song, N.; Xiao, W.J.; Yin, J.; Wei, W.; Wang, G.J.; et al. Study on the resistance of severe acute respiratory syndrome-associated coronavirus. J. Virol. Methods 2005, 126, 171–177. [Google Scholar] [CrossRef] [PubMed]
- Tiwari, A.; Lipponen, A.; Hokajärvi, A.M.; Luomala, O.; Sarekoski, A.; Rytkönen, A.; Österlund, P.; Al-Hello, H.; Juutinen, A.; Miettinen, I.T.; et al. Detection and quantification of SARS-CoV-2 RNA in wastewater influent in relation to reported COVID-19 incidence in Finland. Water Res. 2022, 215, 118220. [Google Scholar] [CrossRef] [PubMed]
- Petala, M.; Dafou, D.; Kostoglou, M.; Karapantsios, T.; Kanata, E.; Chatziefstathiou, A.; Sakaveli, F.; Kotoulas, K.; Arsenakis, M.; Roilides, E.; et al. A physicochemical model for rationalizing SARS-CoV-2 concentration in sewage. Case study: The city of Thessaloniki in Greece. Sci. Total Environ. 2021, 755, 142855. [Google Scholar] [CrossRef]
- Champredon, D.; Becker, D.; Peterson, S.W. Emergence and spread of SARS-CoV-2 variants of concern in Canada: A retrospective analysis from clinical and wastewater data. BMC Infect. Dis. 2024, 24, 139. [Google Scholar] [CrossRef] [PubMed]
- Bertels, X.; Demeyer, P.; Van den Bogaert, S.; Boogaerts, T.; van Nuijs, A.L.N.; Delputte, P.; Lahousse, L. Factors influencing SARS-CoV-2 RNA concentrations in wastewater up to the sampling stage: A systematic review. Sci. Total Environ. 2022, 820, 153290. [Google Scholar] [CrossRef] [PubMed]
- Kostoglou, M.; Petala, M.; Karapantsios, T.; Dovas, C.; Roilides, E.; Metallidis, S.; Papa, A.; Stylianidis, E.; Papadopoulos, A.; Papaioannou, N. SARS-CoV-2 adsorption on suspended solids along a sewerage network: Mathematical model formulation, sensitivity analysis, and parametric study. Environ. Sci. Pollut. Res. 2021, 29, 11304–11319. [Google Scholar] [CrossRef]
- Jiang, G.; Liu, Y.; Tang, S.; Kitajima, M.; Haramoto, E.; Arora, S.; Choi, P.M.; Jackson, G.; D’Aoust, P.M.; Delatolla, R.; et al. Moving forward with COVID-19: Future research prospects of wastewater-based epidemiology methodologies and applications. Curr. Opin. Environ. Sci. Health 2023, 33, 100458. [Google Scholar] [CrossRef]
Figure 1.
Number of publications of WBE and engineering by year (2015–2023) [16].
Figure 1.
Number of publications of WBE and engineering by year (2015–2023) [16].

Figure 2.
Number of publications of WBE and engineering by country (2015–2023) [16].
Figure 2.
Number of publications of WBE and engineering by country (2015–2023) [16].


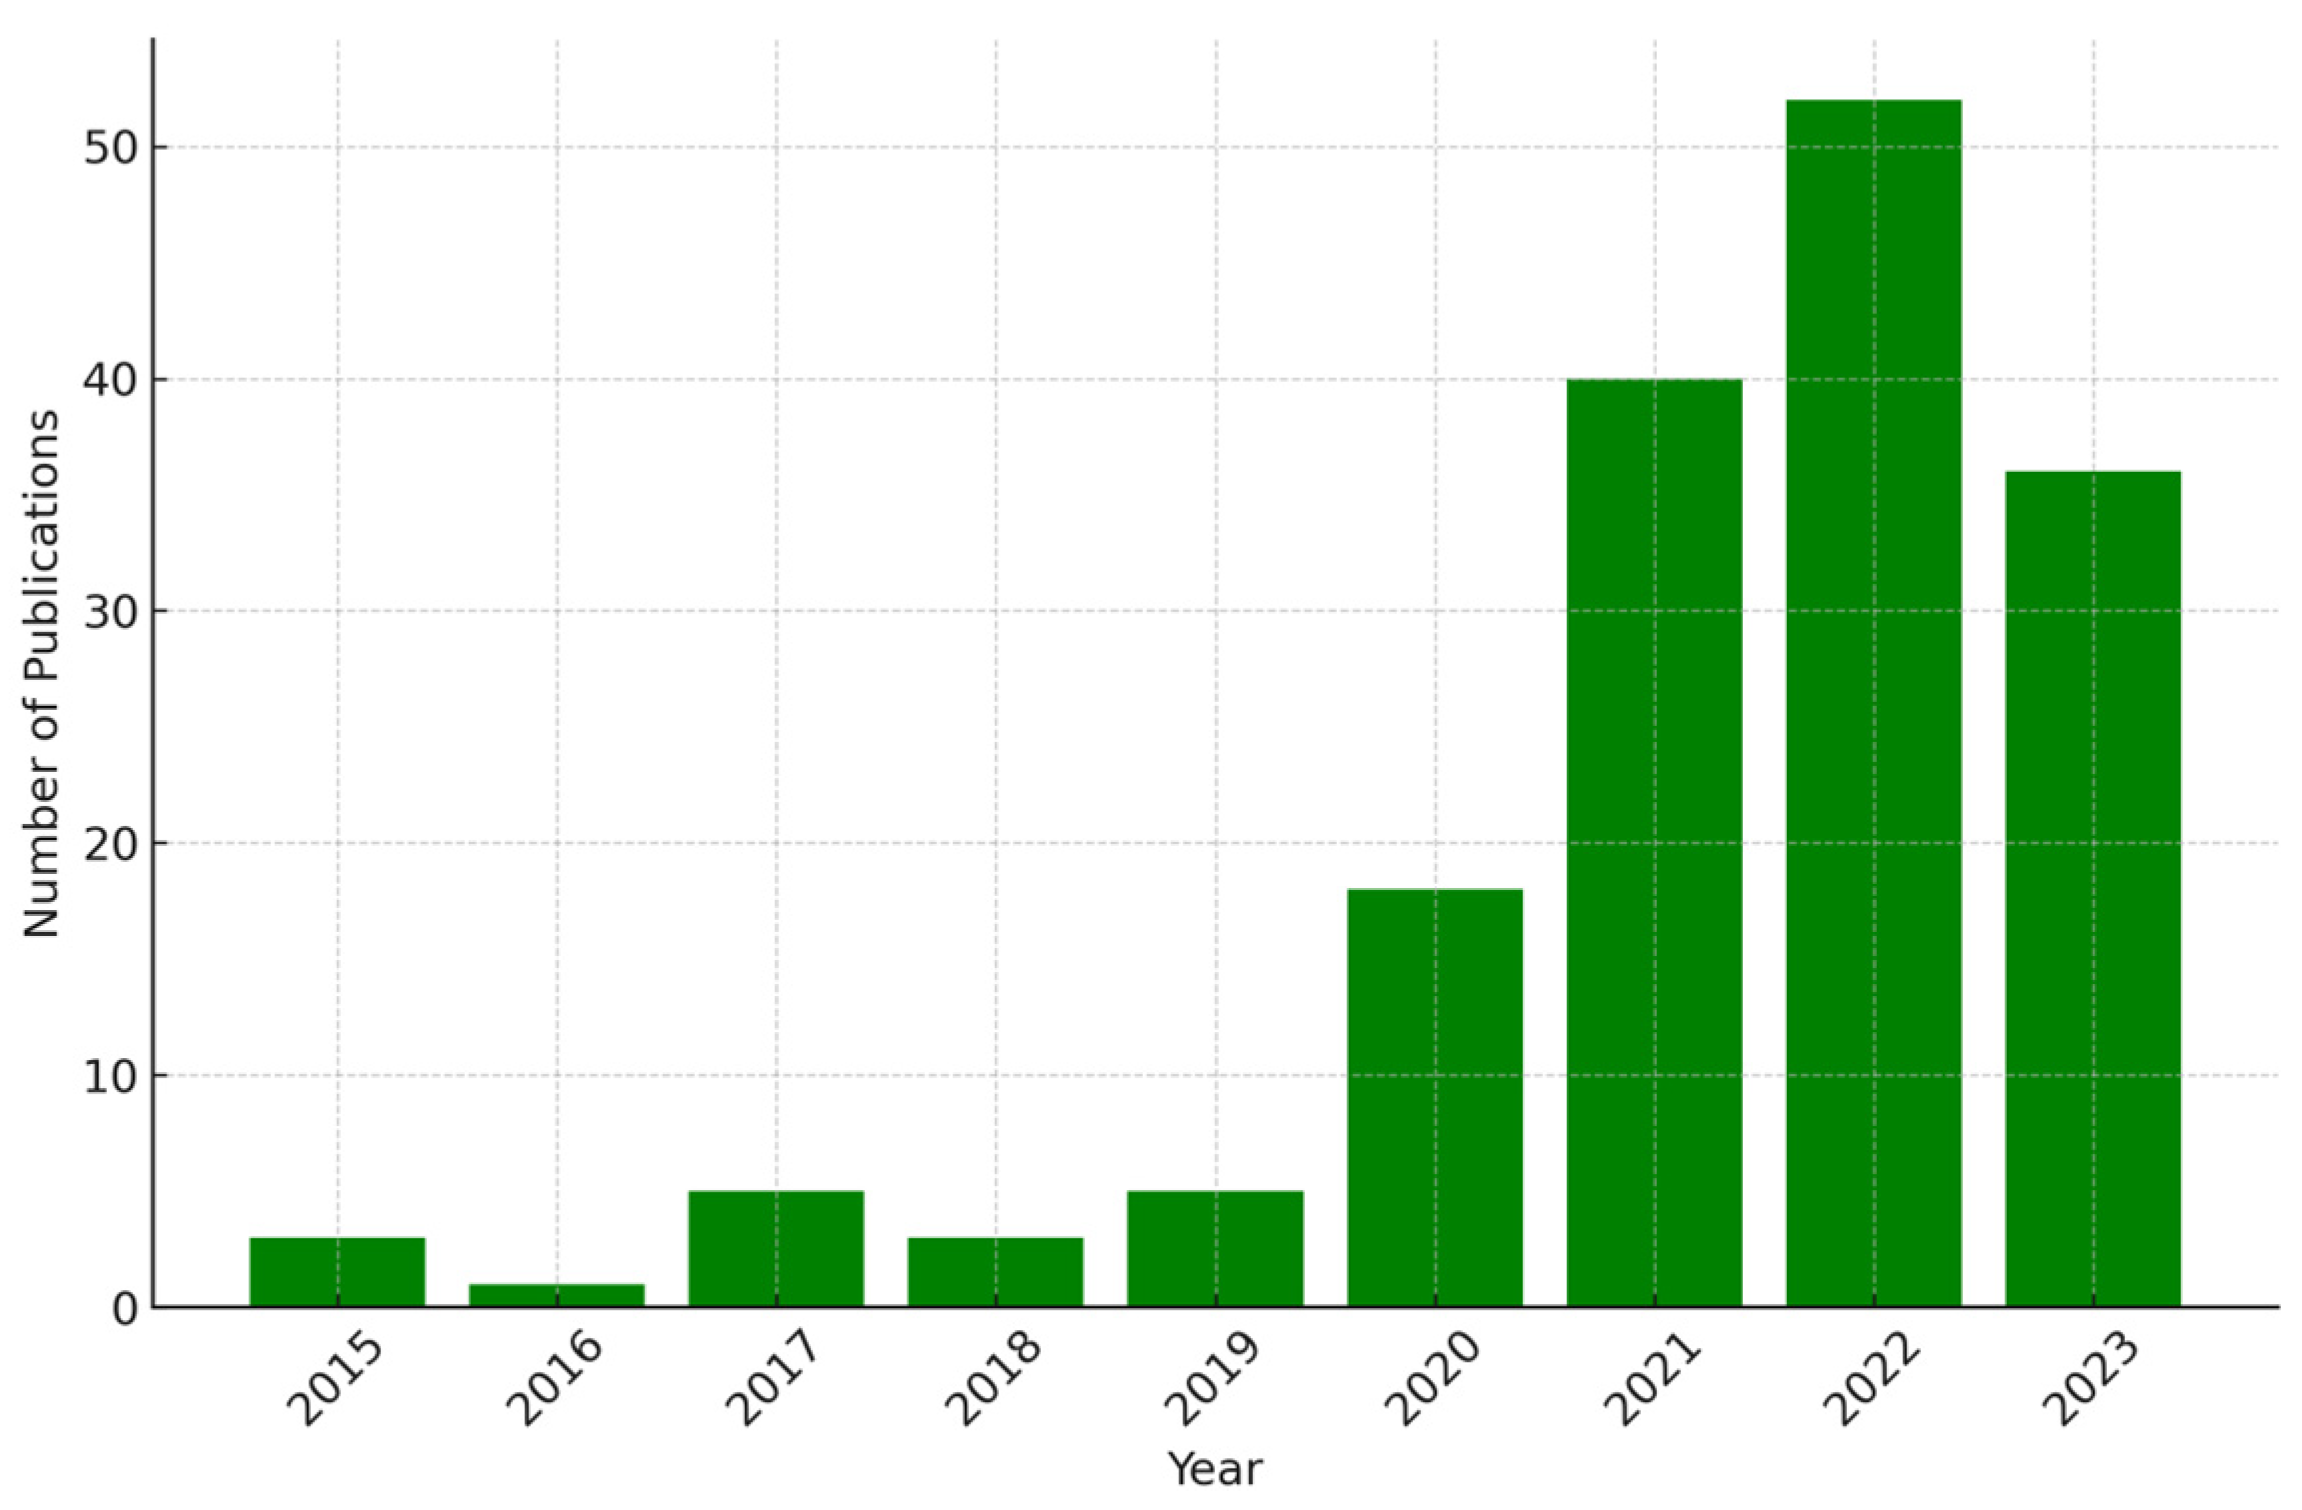
Figure 4.
Sensitivity of detection infected individuals per 1000 inhabitants [4,16,42,54,70]. Data index: 1, 2—[16]; 3, 4—[42]; 5, 6—[4]; 7—[70].

Figure 5.
Daily discharge per capita: TSSs—total suspended solids (gTSSs/person*day), BOD5—five-day biological oxygen demand (gBOD5/person*day), TKN—total Kjeldahl nitrogen (gTKN/person*day), NH3—total ammonia nitrogen (gNH3/person*day), TP—total phosphorus (gTP/person*day) [76].
Figure 5.
Daily discharge per capita: TSSs—total suspended solids (gTSSs/person*day), BOD5—five-day biological oxygen demand (gBOD5/person*day), TKN—total Kjeldahl nitrogen (gTKN/person*day), NH3—total ammonia nitrogen (gNH3/person*day), TP—total phosphorus (gTP/person*day) [76].

Disclaimer/Publisher’s Note: The statements, opinions and data contained in all publications are solely those of the individual author(s) and contributor(s) and not of MDPI and/or the editor(s). MDPI and/or the editor(s) disclaim responsibility for any injury to people or property resulting from any ideas, methods, instructions or products referred to in the content. |
© 2024 by the authors. Licensee MDPI, Basel, Switzerland. This article is an open access article distributed under the terms and conditions of the Creative Commons Attribution (CC BY) license (https://creativecommons.org/licenses/by/4.0/).
Share and Cite
MDPI and ACS Style
Laicans, J.; Dejus, B.; Dejus, S.; Juhna, T. Precision and Accuracy Limits of Wastewater-Based Epidemiology—Lessons Learned from SARS-CoV-2: A Scoping Review. Water 2024, 16, 1220. https://doi.org/10.3390/w16091220
AMA Style
Laicans J, Dejus B, Dejus S, Juhna T. Precision and Accuracy Limits of Wastewater-Based Epidemiology—Lessons Learned from SARS-CoV-2: A Scoping Review. Water. 2024; 16(9):1220. https://doi.org/10.3390/w16091220
Chicago/Turabian StyleLaicans, Juris, Brigita Dejus, Sandis Dejus, and Talis Juhna. 2024. "Precision and Accuracy Limits of Wastewater-Based Epidemiology—Lessons Learned from SARS-CoV-2: A Scoping Review" Water 16, no. 9: 1220. https://doi.org/10.3390/w16091220
Note that from the first issue of 2016, this journal uses article numbers instead of page numbers. See further details here.