Abstract
Mo-Si-B alloys are one of the most promising candidates to substitute Ni based superalloys in gas turbines. The optimization of their composition can be achieved more effectively using multi-scale modeling of materials behavior and structural analysis of components for understanding, predicting, and screening properties of new alloys. Nevertheless, this approach is dependent on data on the properties of the single phases in these alloys. The focus of this investigation is Mo3Si, one of the phases in typical Mo-Si-B alloys. The effect of 100 h annealing at 1600 °C on phase stability and microhardness of its three near-stoichiometric compositions—Mo-23Si, Mo-24Si and Mo-25Si (at %)—is reported. While Mo-23Si specimen consist only of Mo3Si before and after annealing, Mo-24Si and Mo-25Si comprise Mo5Si3 and Mo3Si before annealing. The latter is then increased by the annealing. No significant difference in microhardness was detected between the different compositions as well as after annealing. The creep properties of Mo3Si are described at 1093 °C and 1300 °C at varying stress levels as well as at 300 MPa and temperatures between 1050 °C and 1350 °C. Three constitutive models were used for regression of experimental results—(i) power law with a constant creep exponent, (ii) stress range dependent law, and (iii) power law with a temperature-dependent creep exponent. It is confirmed that Mo3Si has a higher creep resistance than Moss and multi-phase Mo-Si-B alloys, but a lower creep strength as compared to Mo5SiB2.
1. Introduction
The development of new materials, that can operate at increasing temperatures in combustion chambers of gas turbine engines, is getting more important. At the moment the single crystal Ni based superalloys are used for this application at ~1100 °C with hot spots of ~1200 °C, which is ~90% of their melting point [1]. Thereby, the heat resistance of Ni based superalloys could not have been increased significantly in recent years. This causes huge challenges in the development of gas turbine engines to meet the demanding requirements. Thus, alternative materials have to be developed in order to achieve a significant increase in operating temperatures in combustion chambers. The high solidus temperature of Mo-Si-B alloys makes them one of the most promising material classes for this approach. Detailed reviews on the properties of Mo-Si-B alloys and their phases are given in [1,2,3]. The best combination of properties was found in three-phase alloys consisting of Moss, Mo3Si, and Mo5SiB2. Moss provides the ductility and both intermetallic phases are responsible for adequate creep and oxidation resistance under certain circumstances [1,2,3].
Multi-phase materials for structural application beyond the capability of Ni base superalloys should provide an adequate balance of ambient and ultra-high temperature properties for critical components. The fracture toughness of polycrystalline Mo3Si and Mo5SiB2 at room temperature is ~3 MPa⋅m1/2 [4,5]. The low plasticity of these phases is caused by low symmetry of the crystal structures of these phases, which inhibits plastic deformation through dislocation formation and motion [3]. Another reason for low fracture toughness of Mo5SiB2 is anisotropy of the coefficient of thermal expansion along c- and a-axes, which encourages the development of internal residual stresses [3]. However, the multi-phase Mo-Si-B alloys with volume fractions of ductile Moss ≥ 30% provide improved fracture toughness, because the plastic deformation of the ductile phase consumes significantly more energy, which leads to toughening by crack arrest and bridging. The common value of fracture toughness for Mo-Si-B alloys is in the range 7–15 MPa⋅m1/2 [2,6,7,8,9,10,11,12,13]. The alloys with coarse Moss particles forming a continuous network possess even improved fracture toughness of 15–21 MPa⋅m1/2 [9,11,14], which meets the required minimum fracture toughness for materials beyond Ni base superalloys of 20 MPa⋅m1/2 stablished by Bewlay et al. [15].
High temperature application of new material is often limited by its creep properties. Different Mo-Si-B alloys have a creep strength of 50–190 MPa at a creep rate of 2 × 10⁻⁸ s−1 at 1200 °C [12,16,17,18]. Creep properties are mainly determined by on the fraction of the intermetallic phases and microstructure. Alloying can extremely increase the creep strength. Thus, alloying with Nb increased creep strength of Mo-12Si-8.5B (at %) from (extrapolated) 75 MPa to 260 MPa for Mo-19.5Nb-12Si-7.5B (at %) at a creep rate of 2 × 10⁻⁸ s−1 at 1200 °C. For more detailed comparison creep properties in wider range should be considered, especially at higher stresses. Such comparison for some well-known alloys and results of this study are given in Section 3.3.1. Bewlay et al. [19,20] suggested that the creep strength should be greater than 170 MPa at a creep rate of 2 × 10⁻⁸ s−1 at 1200 °C for Nb alloys beyond Ni based superalloys for turbine applications. Schneibel [21] adjusted this goal for alloys with different density and set the value of 250 MPa at a creep rate of 2 × 10⁻⁸ s−1 at 1200 °C for Mo-Si-B alloys for high temperature application beyond Ni base superalloys. Thus Mo-Si-B alloys can reach the required creep strength. Nevertheless, different microstructure strategies are optimal for balanced ductility vs. creep strength. Therefore, a profound material design is needed for Mo-Si-B alloys to achieve the optimal properties.
However, the development of new alloys is extremely time- and cost-consuming. To reduce the costs required for experimental analysis, multi-scale modeling of materials behavior and structural analysis of components of creep behavior can be performed [22,23,24]. In addition, appropriate creep models are required for the structural analysis of turbine blades. The constitutive behavior of new alloys can be predicted with material modeling using different kinds of homogenization of their per-phase properties. For this approach, the properties of these phases are often in demand. Additionally, there is still a lack in property data for the phases being present in Mo-Si-B alloys. Therefore, this work is dedicated to the investigation of the creep properties of the Mo3Si phase in order to overcome the lack in available data.
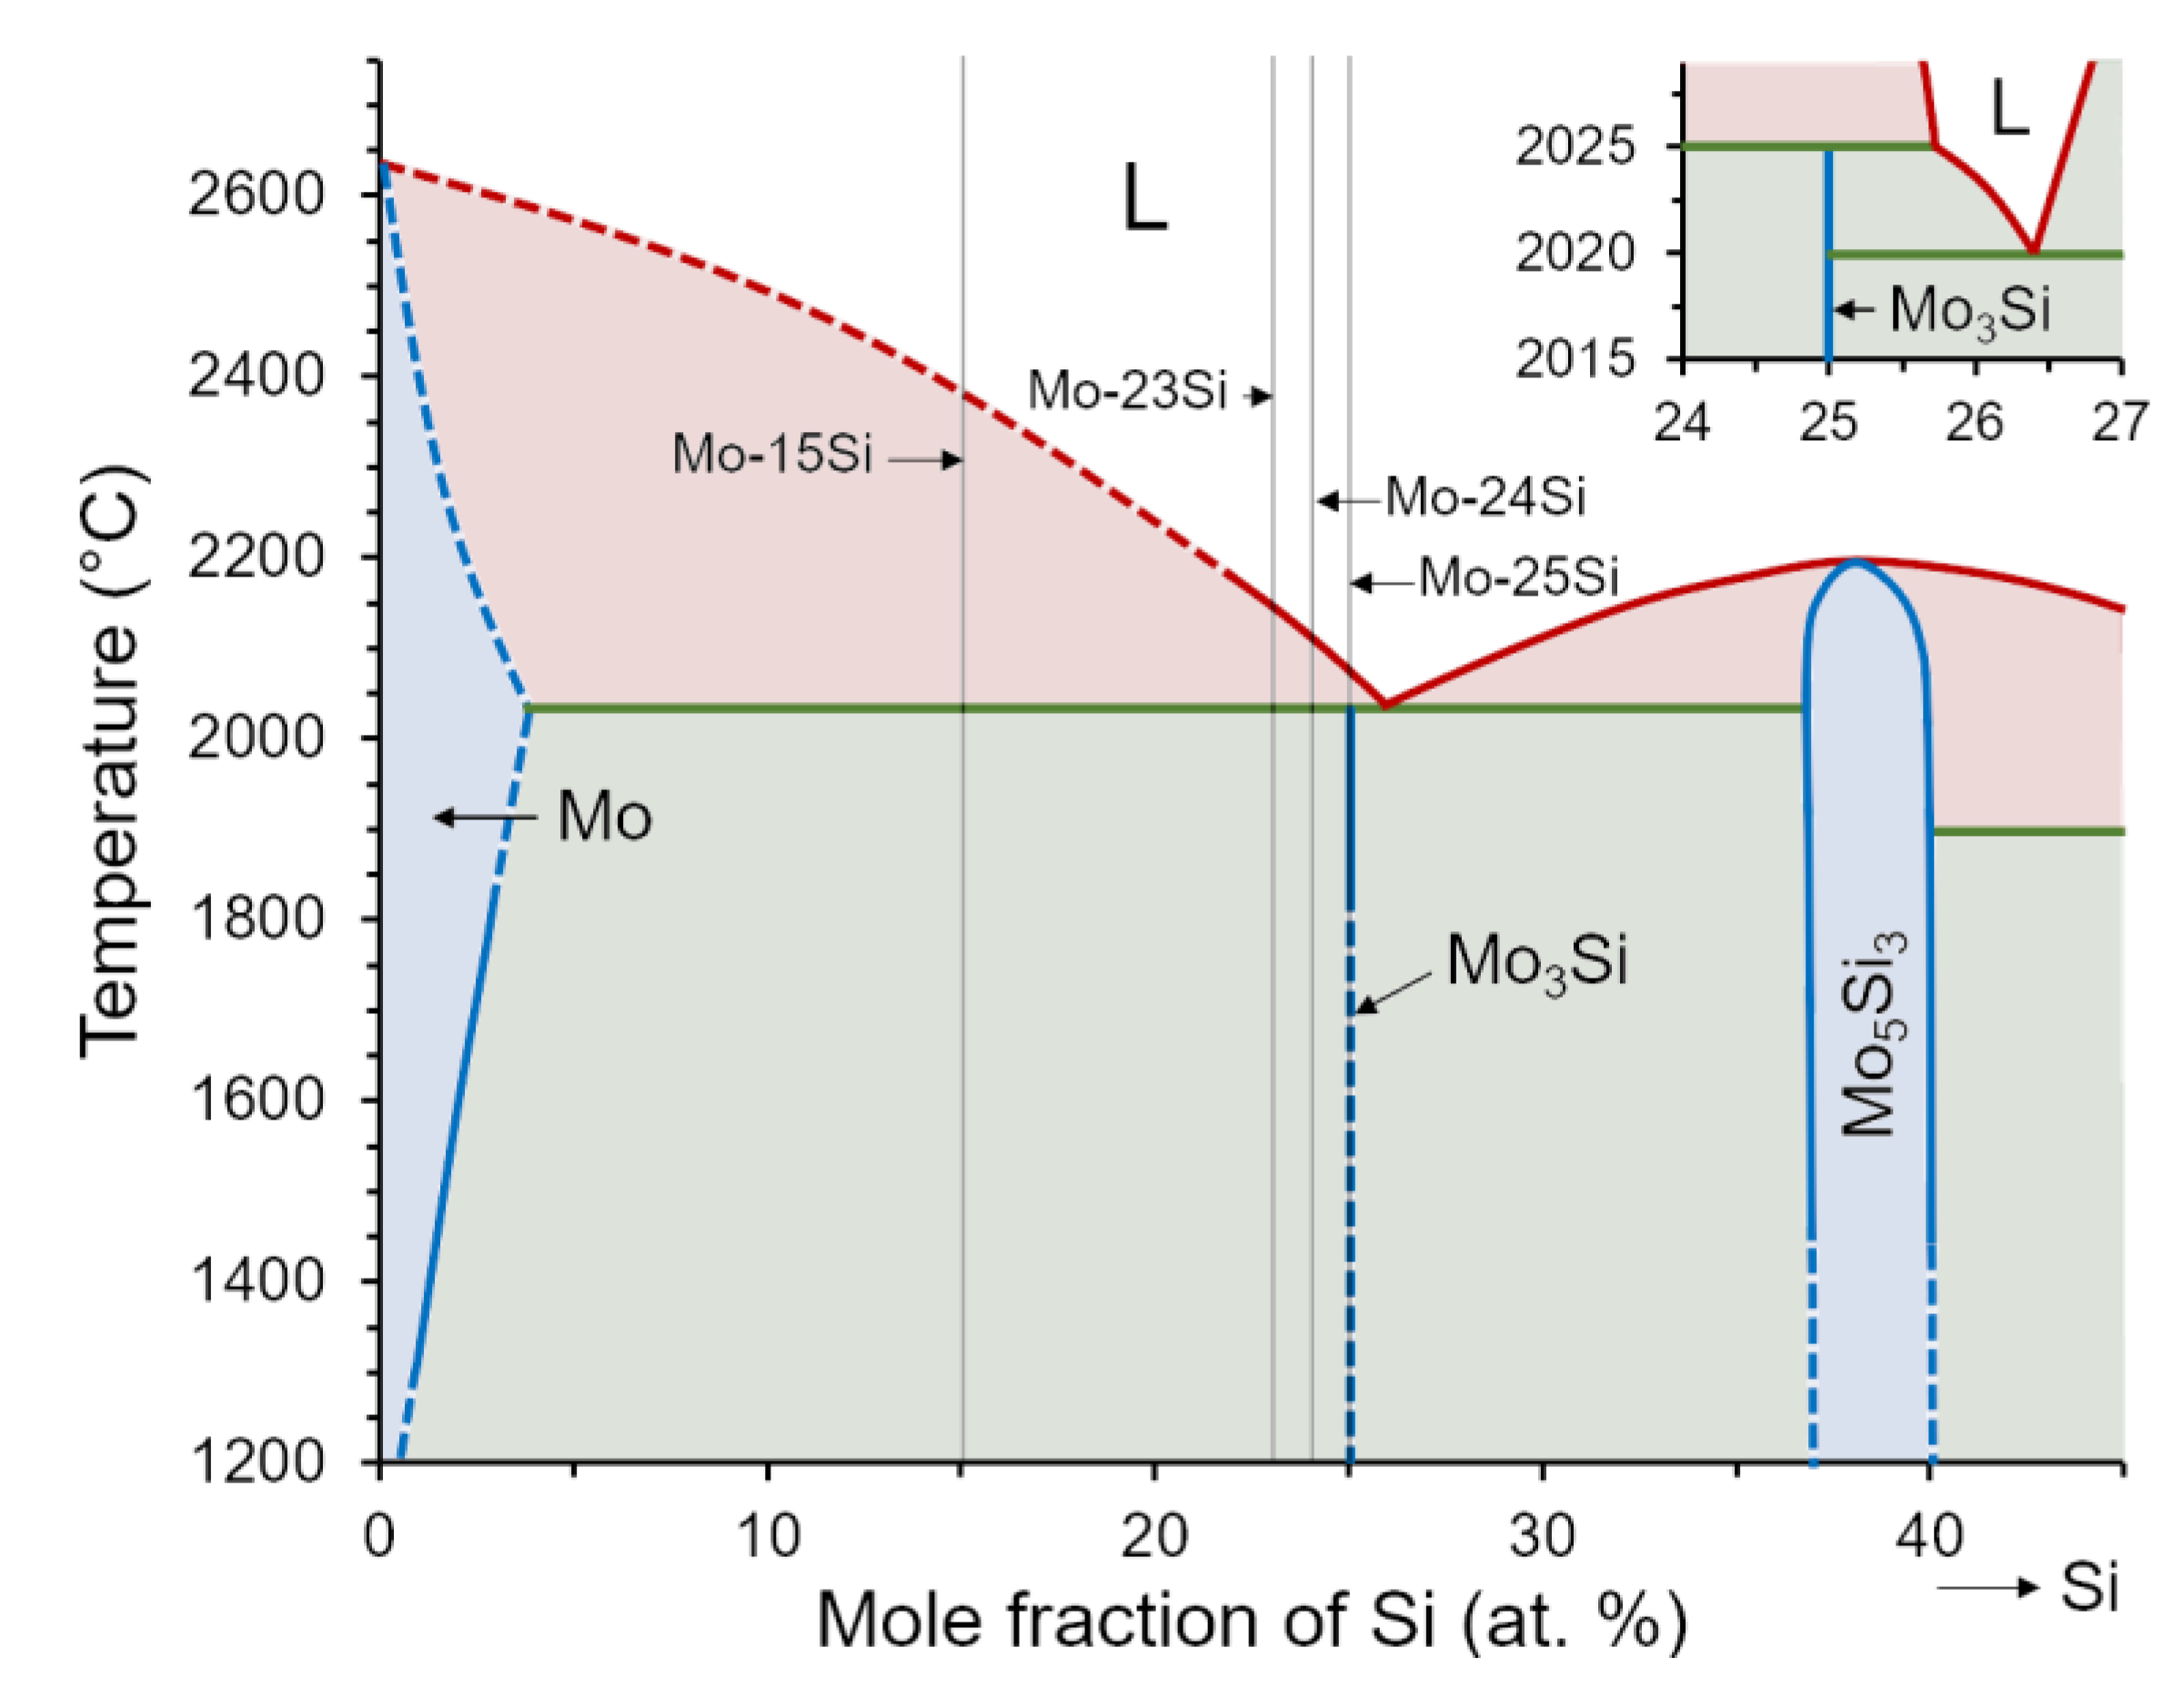
A section of the binary Mo-Si phase diagram is shown in Figure 1. According to it the solid solution Moss has a maximum solubility of approximately 4 at % Si at the peritectic temperature of 2025 °C. The melting point of Mo is 2623 °C. The cubic intermediate phase Mo3Si with 25 at % Si decomposes peritectically in reaction L + Moss ↔ Mo3Si at 2025 °C with isotherm between 4 and 25.72 at %. The eutectic reaction L ↔ Mo3Si + Mo5Si3 occurs at 2020 °C with eutectic point of 26.4 at % Si and isotherm between 25.72 and 37 at %. The tetragonal intermediate phase Mo5Si3 with 37.5 at % Si is solidified congruently in reaction L ↔ Mo5Si3 at 2180 °C. The phase diagram range with higher Si content is not relevant for this study.
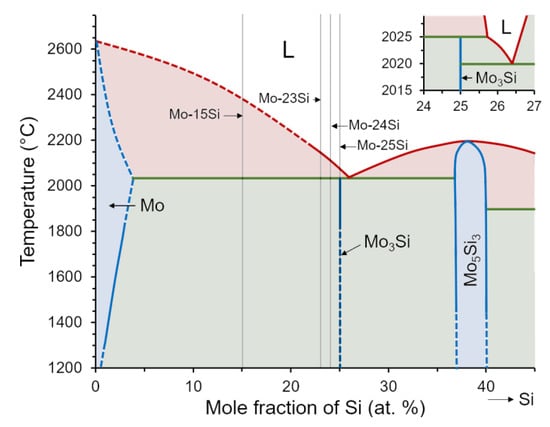
Figure 1.
A section of the binary Mo-Si phase diagram reprinted according to data from [25], representing the alloy compositions investigated in the present study as well as Mo3Si and Mo5Si3 phases. Inset—a section of the binary Mo-Si phase diagram representing peritectic reaction L + Moss ↔ Mo3Si and eutectic reaction L ↔ Mo3Si + Mo5Si3. Grey vertical lines—alloy compositions investigated in the present study; red curves—solidus; blue curves—liquidus; green lines—reaction isotherm. Solid curves—experimental results. Dashed curves—extrapolated phase boundaries into metastable regions of the phase diagram.
Therefore Rosales and Schneibel [4] considered, that Mo3Si is not a real line compound and slightly off-stoichiometric as it is single-phase only in a small composition range near Mo-24Si. Thus, the dependence of the phase stability on slight variations in the Mo to Si ratio was assessed by analyzing the microstructure of different near-stoichiometric specimens. Additionally, the microhardness was determined in order to comment on the presence of internal stresses, which might influence the mechanical properties. Also, Gnesin, I. and Gnesin, B. [26] indicated Mo3Si with X-ray microanalysis and reported, that it exists in a small compositional region of 22.33 ± 0.34 – 23.6 ± 0.56 at %.
2. Materials and Methods
First, three near-stoichiometric compositions Mo-23Si, Mo-24Si, and Mo-25Si (Figure 1) were produced. All elemental and phase proportions are indicated in atomic percent in this paper. The intention of selecting these compositions was to analyze the phase stability after annealing as well as potential internal stresses caused by arc melting by determining the microhardness before and after annealing. These results allowed the selection of the appropriate chemical composition and manufacturing route of the Mo3Si specimens intended for the investigation of the creep properties.
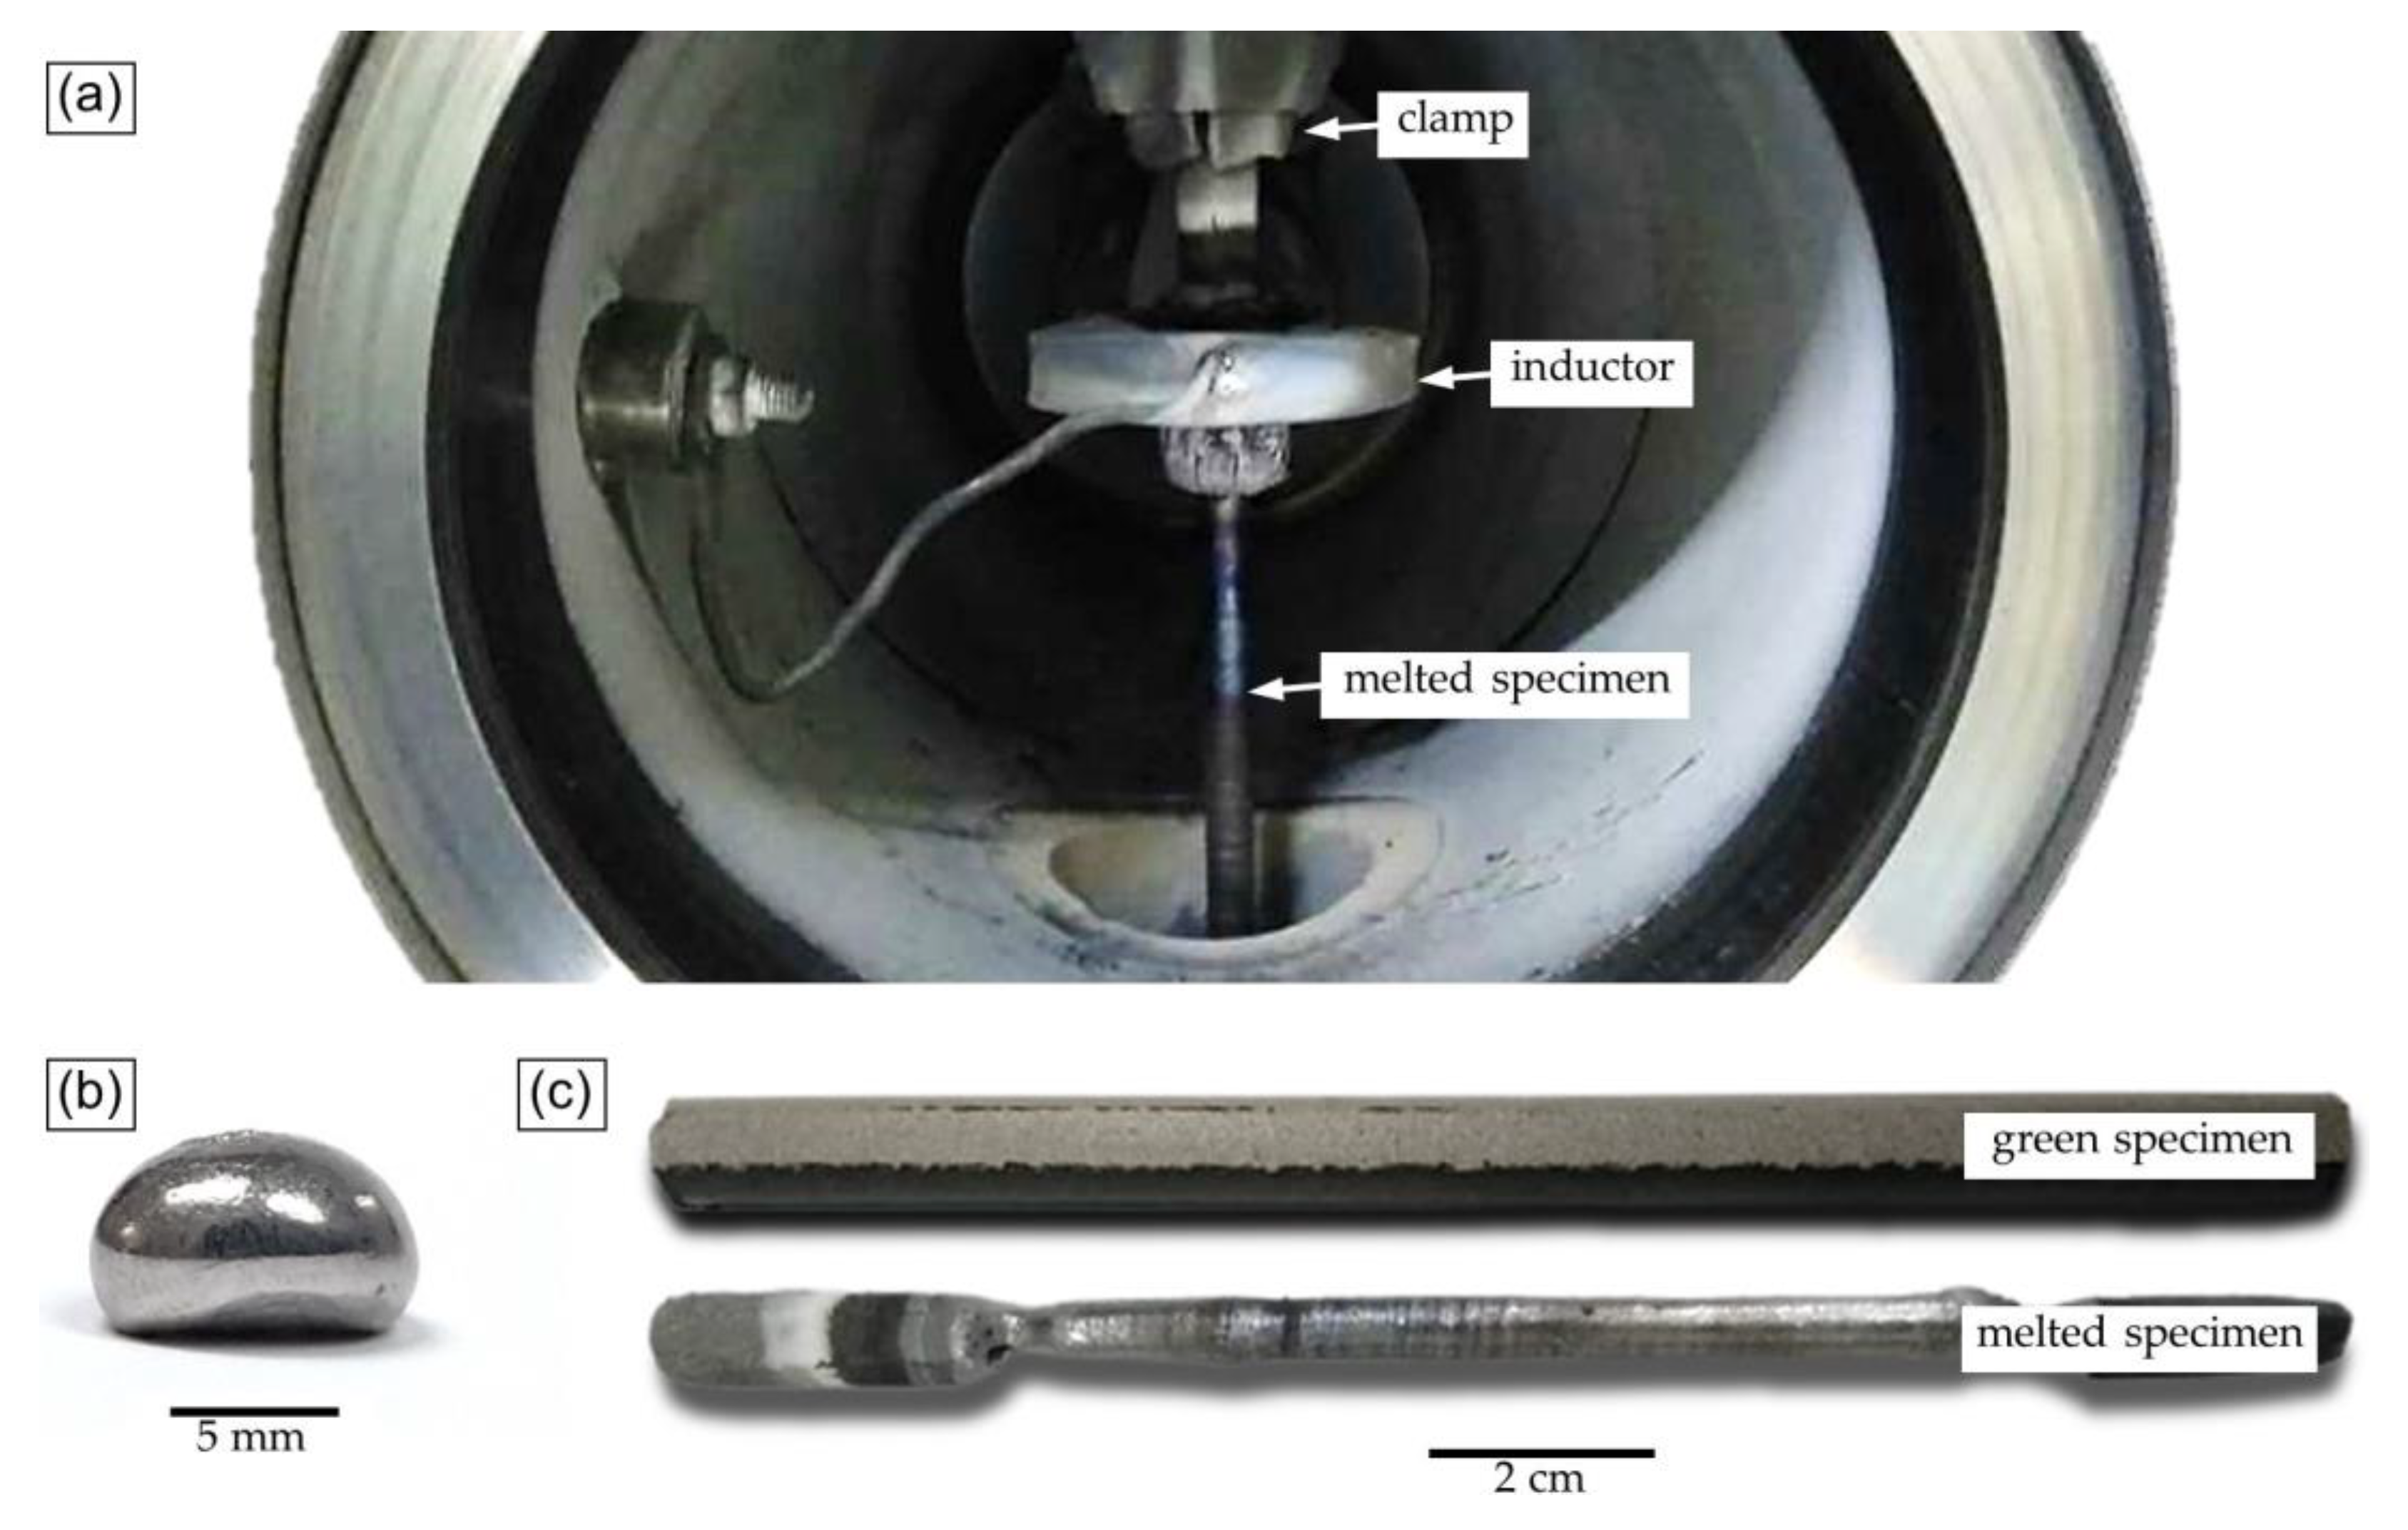
Buttons with a mass of ~5 g with compositions Mo-23Si, Mo-24Si, and Mo-25Si were processed from high purity bulk materials of Mo and Si by arc melting and re-melting five times in an arc melter MAM-1 (Edmund Buehler GmbH, Bodelshausen, Germany). Therefore, a water-cooled copper crucible was used and a high purity Ar atmosphere established. Prior to melting, a Zr getter was melted to reduce residual oxygen from the process chamber. A specimen after arc-melting is shown in Figure 2b. Afterwards, these buttons were cut in four pieces using electrical discharge machining (EDM). One specimen of each composition was annealed at 1600 °C for 100 h in a flowing Ar atmosphere. Macroscopic surface of specimens before and after annealing has not changed.
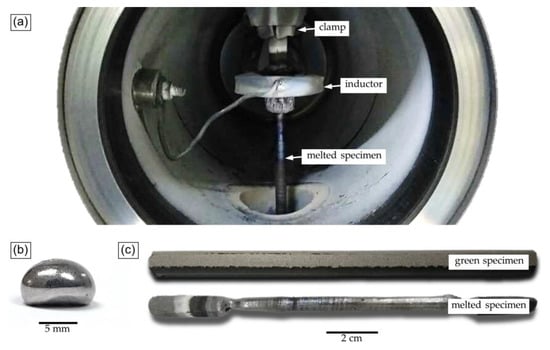
Figure 2.
Processing: (a) crucible-free zone melting chamber, (b) specimen after arc-melting, (c) specimen before and after zone melting.
The specimen with composition Mo-15Si was produced from the mixture of elemental high purity powders of Mo and Si by crucible-free zone melting of compacted powders [27,28]. This composition leading to a multi-phase microstructure (Figure 1) was selected to investigate the microhardness of the Mo3Si phase in an alloy and to compare it with the microhardness of the above-mentioned single-phase specimens. Thus, the floating zone melting method was selected to achieve a coarse microstructure providing the possibility for micro indentation in single grains. A green rod was cold pressed from the powder mixture in a hydraulic press in sectional powder compaction tool for extra-long specimens. After that it was processed in a heated zone melting device Crystal-206 (Yoshkar-Ola, ME, Russian Federation) equipped with an induction-type heater in a high purity He atmosphere using solidification rates of 60 mm/h (Figure 2a). The resulting specimen was ~80 mm in length, having a diameter of ~7 mm. A specimen before and after crucible-free zone melting is shown in Figure 2c. The specimens were cut by EDM parallel and perpendicular to the growth direction in order to investigate the microstructure and determine the microhardness.
For the characterization of the microstructure, the specimens were embedded in cold hardening epoxy Demotec 15 Plus (DEMOTEC, idderau, Germany). Then, they were ground with SiC abrasive paper of grit P600, P800, P1200, and P2400 and polished with diamond suspensions with a particle size of 3 μm and 1 μm. In order to improve phase contrast, chemical polishing was carried out with a solution consisting of 98 mL O.P.S. (oxide polishing suspension) + 1 mL H2O2 + 1 mL NH3.
The microstructure was quantitatively evaluated using scanning electron microscopes (SEM) FEI XL30 (Hillsboro, OR, USA) and Zeiss EVO 15 (Oberkochen, Germany) both equipped with EDX (energy dispersive X-ray). The SEM images were typically obtained in the backscattered electron (BSE) mode, but the images of cracks were obtained in secondary electrons (SE) mode for morphological representation of the surface. Macrostructure analysis was carried out on a ZEISS Stemi 2000 C stereo microscope (Oberkochen, Germany) equipped with ZEISS AxioCam MRC camera (Oberkochen, Germany). X-ray diffraction (XRD) measurements were performed using an PANalytical X’pert Powder X-ray diffractometer (Almelo, The Netherlands) with a Cu-Kα beam. The phase identification was obtained using the analysis software HighScore Plus, version: 3.0e (3.0.5) dated 30/01/2012; produced by: PANalytical B.V. (Almelo, The Netherlands).
Vickers microhardness measurements were carried out with a Leica VM HT hardness tester (Vienna, Austria) at a load of 500 g and a holding time of 15 s. Standard deviations were calculated from 30 measurements each.
For compressive creep tests specimens of Mo-23Si were manufactured with the same technique as described first in this section, which is same as for the previous analyses of this composition. The specimens were cut to dimensions of 2.5 × 2.5 × 3.75 mm3 by EDM. All creep tests were carried out under constant true stresses in a Zwick universal testing machine Z100 (Ulm, Germany) equipped with a Maytec furnace (Singen, Germany). The creep strength was evaluated in a flowing Ar/H2 atmosphere for the tests under 1200 °C and in vacuum (<10−4 Pa) for the tests at 1200 °C and above. In this study, the secondary creep stage characterized with minimum creep rate is discussed. Although this approach does not allow an estimate of the time to creep fracture, it provides a comparable parameter to assess the creep performance and, thus, is frequently used in the early stages of alloy and component design. Consequently, the investigation of the creep properties using step loading is permissible. This means that if the samples were free of any sign of damage after reaching the constant steady-state creep rate for the current constant stress level, another stress level was applied for further investigation. In this way, the specimens were loaded with 1 to 3 loading steps depending on the stress level.
3. Results and Discussion
3.1. Microstructure
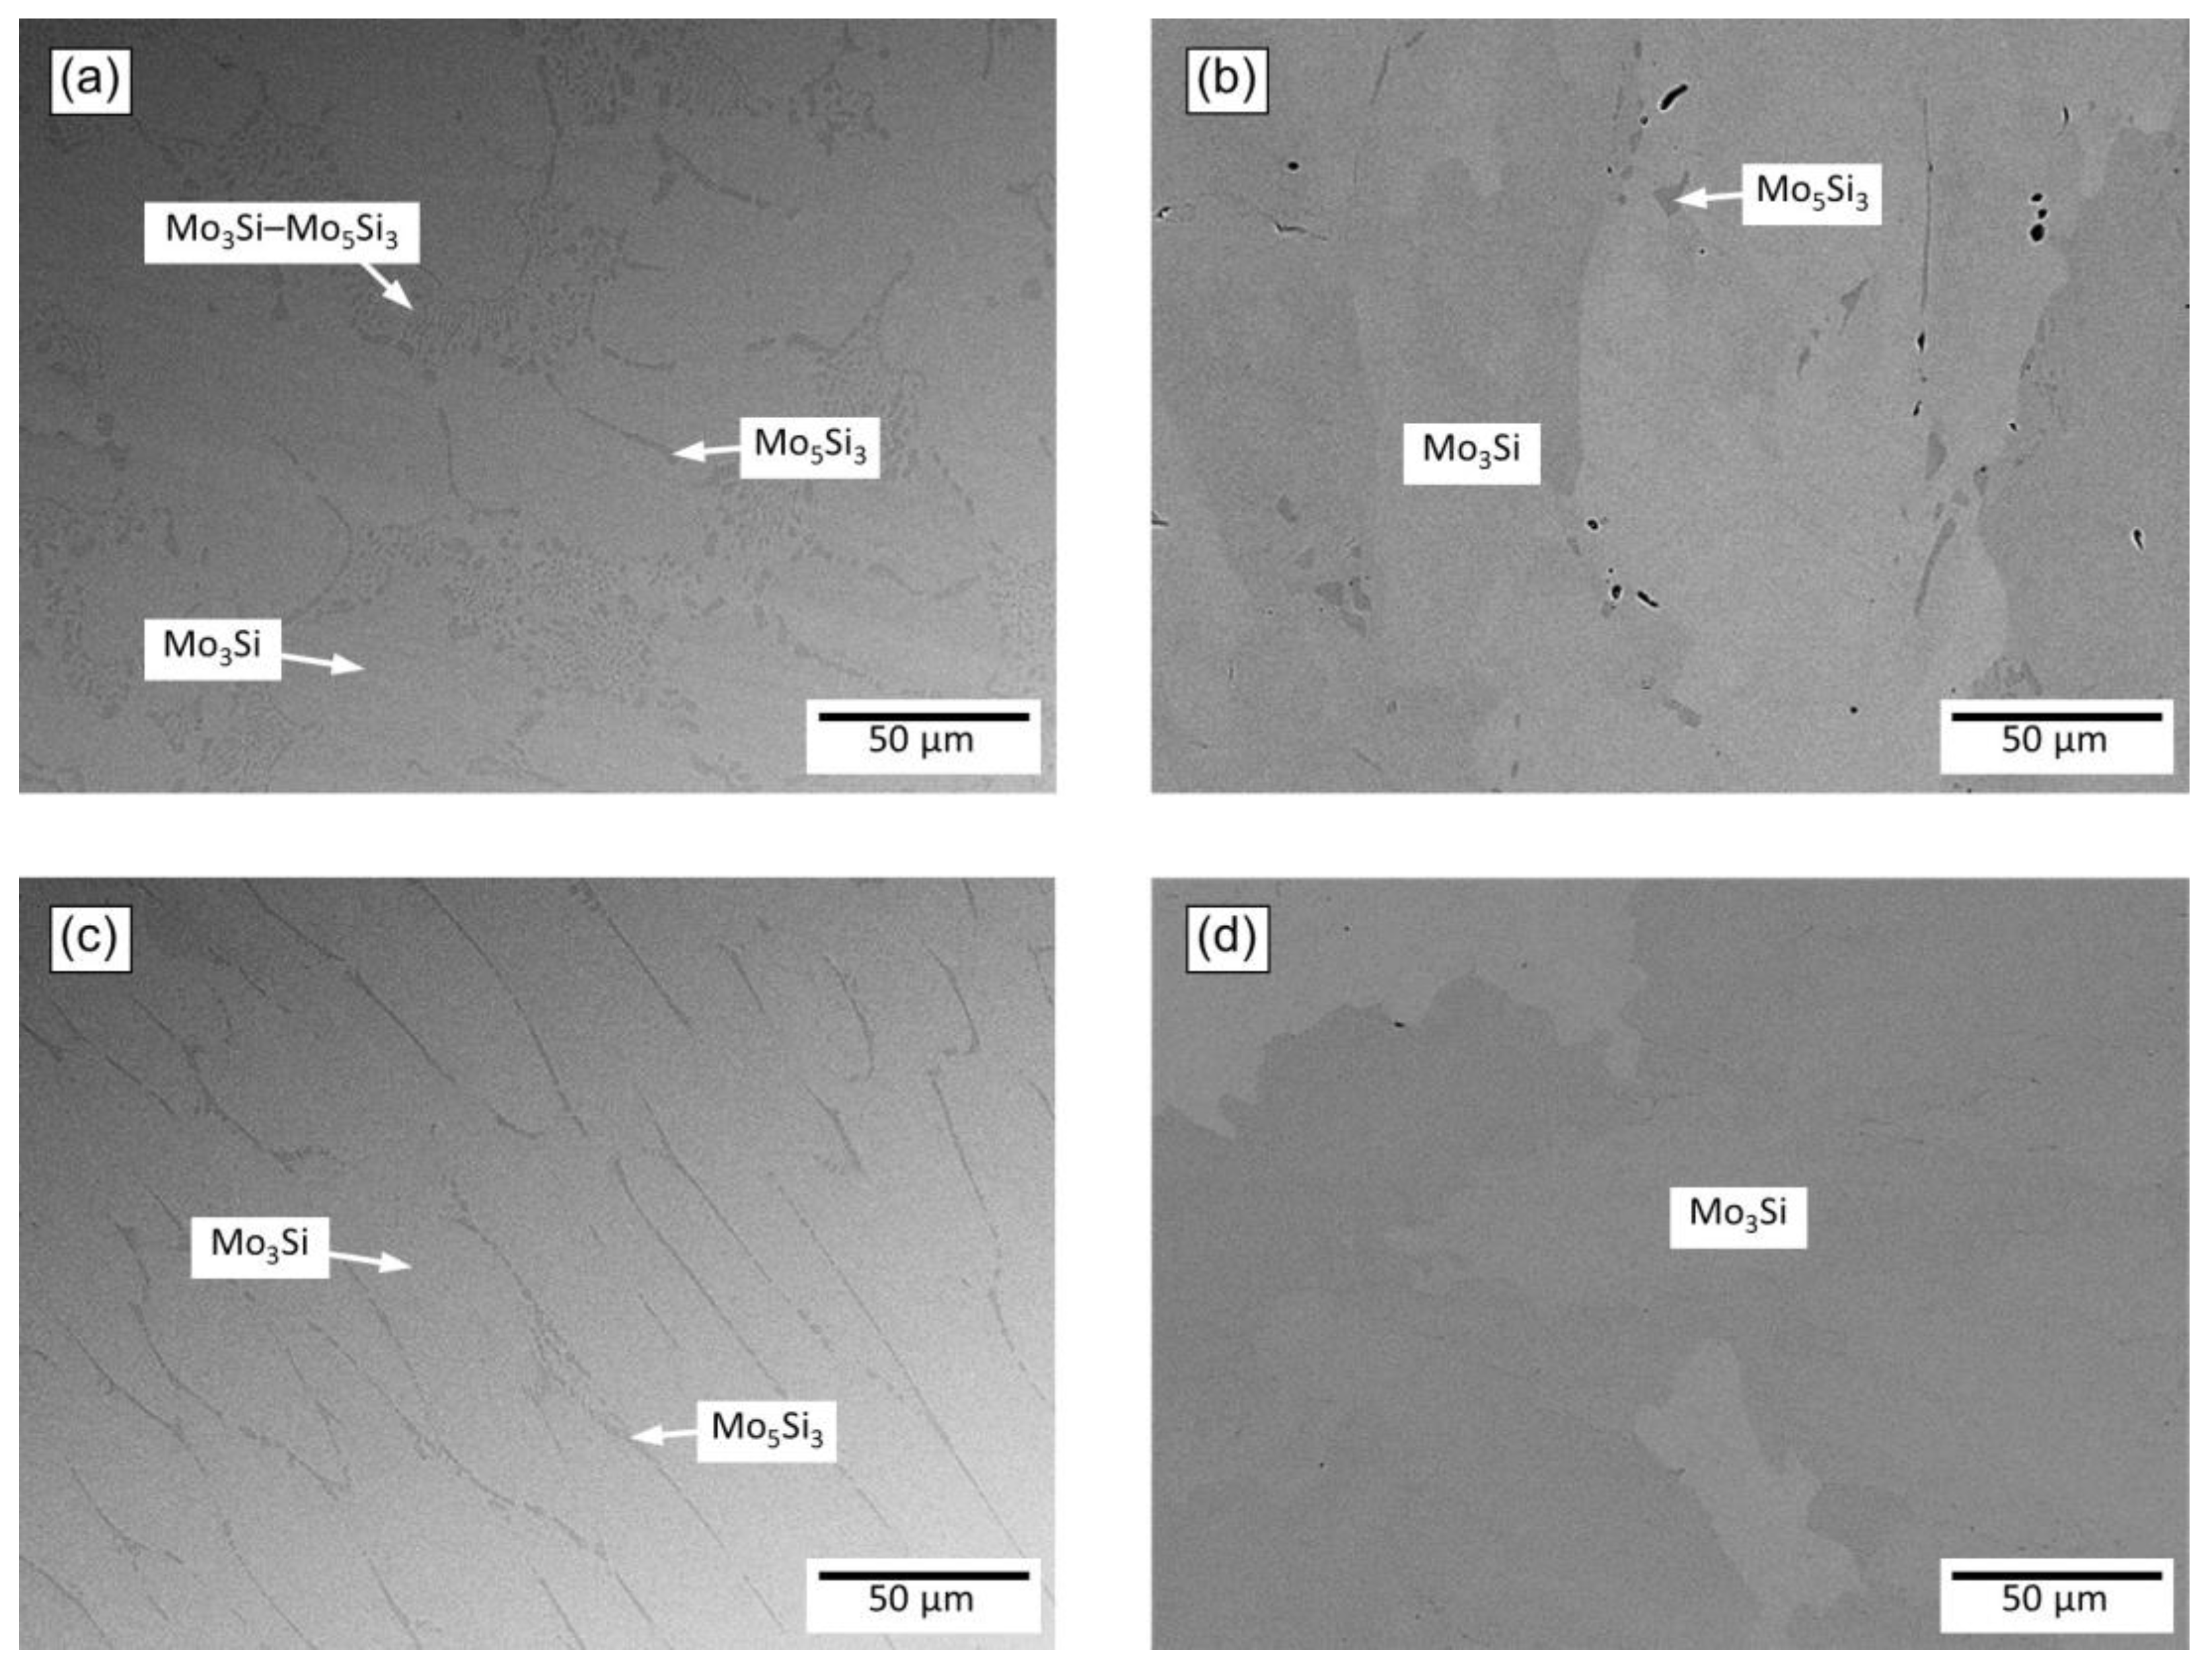
The microstructures of Mo-25Si, Mo-24Si, and Mo-23Si after arc-melting (before annealing) are shown in Figure 3a,c,d, respectively. The results of the EDX area analysis of the elemental composition of the specimens were in good agreement with the alloy composition weighted in.
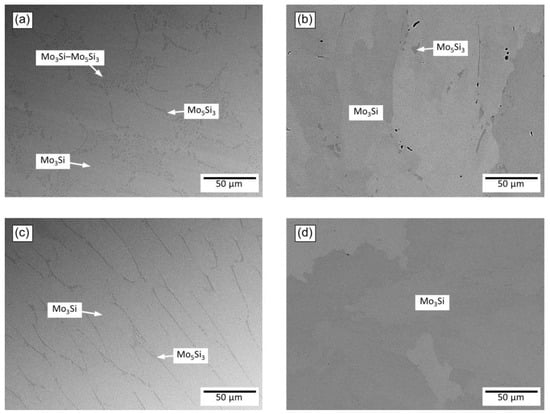
Figure 3.
Microstructures of Mo-25Si after (a) arc-melting and (b) 100 h annealing at 1600 °C as well as (c) Mo-24Si and (d) Mo-23Si after arc-melting.
It is revealed by EDX analysis that the lighter phase consists of ~23% Si and the darker of ~35% Si in all specimens, which correlates with the phases Mo3Si and Mo5Si3 but is not exactly stoichiometric. This is in accordance to [4] reporting that the Mo3Si phase is not stoichiometric. Besides the fact that the Mo5Si3 phase may be non-stoichiometric as well, it should be considered that the inclusions of Mo5Si3 are exceedingly small. Thus, it is likely that ad- and subjacent regions are detected as well during the EDX point analyses influencing the results.
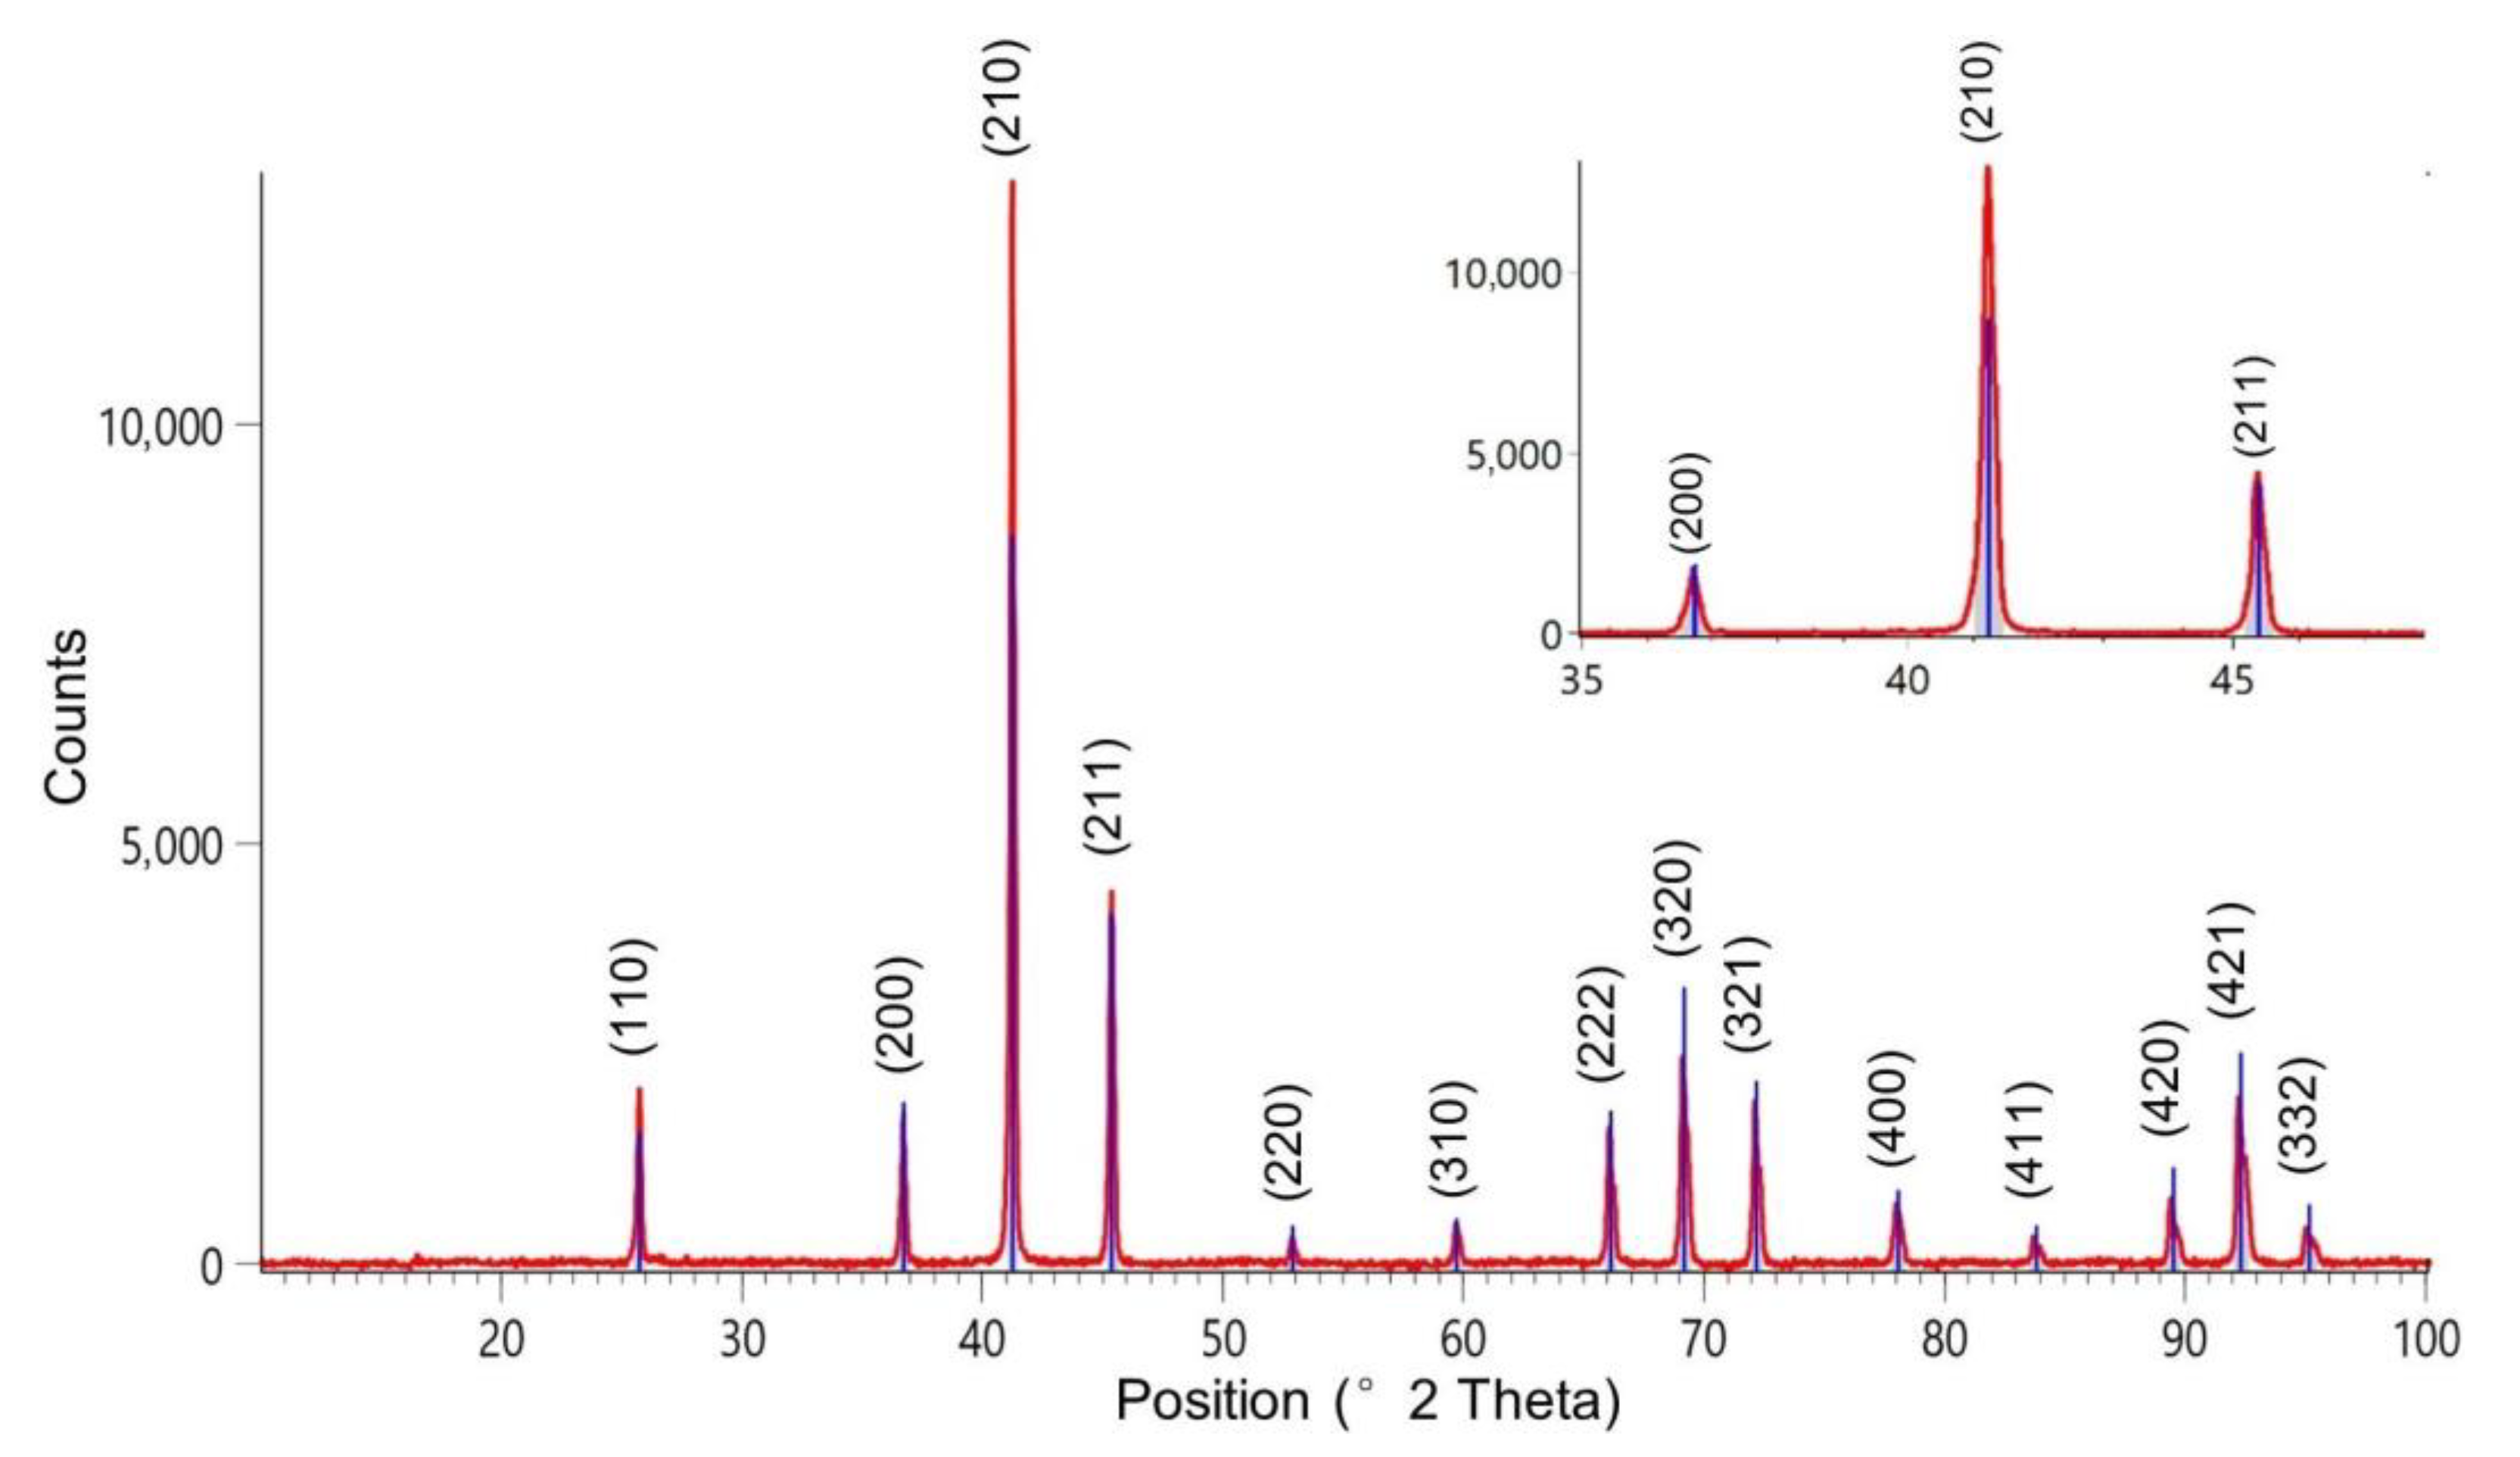
Note that the amount of Mo5Si3 phase along the grain boundaries is different for Mo-25Si, Figure 3a, and Mo-24Si, Figure 3c, namely increased in the latter alloy. This is caused by higher content of silicon in Mo-25Si specimen. Additionally, Mo-25Si has eutectic regions of Mo5Si3–Mo3Si. The microstructure of Mo-23Si, Figure 3d reveals only Mo3Si phase as also confirmed by XRD analysis, which shows only intensities typical for of Mo3Si. Figure 4 shows measured XRD pattern of Mo-23Si. Figure 3b represents Mo-25Si after 100 h annealing at 1600 °C comprising significantly less Mo5Si3 phase than before annealing. Mo-24Si consists solely of Mo3Si phase after annealing and have the similar microstructure as Mo-23Si before annealing (Figure 3d). The microstructure of Mo-23Si has not changed after annealing and, as before, consists solely of Mo3Si phase. Thus, the composition Mo-23Si is used for creep testing since it corresponds to single-phase Mo3Si and it seems to have reached a thermodynamically stable state after annealing.
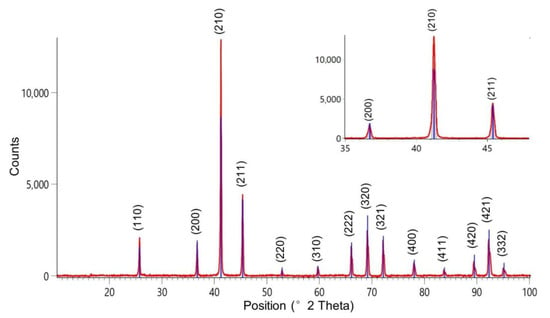
Figure 4.
XRD pattern of Mo-23Si. Red curve—measured pattern of Mo-23Si. Inset—highest peaks. Blue lines—reference pattern for Mo3Si in ICDD 2004 database (Ref. Code 00-051-00764, ICDD Grant in Aid, Baker, I.).
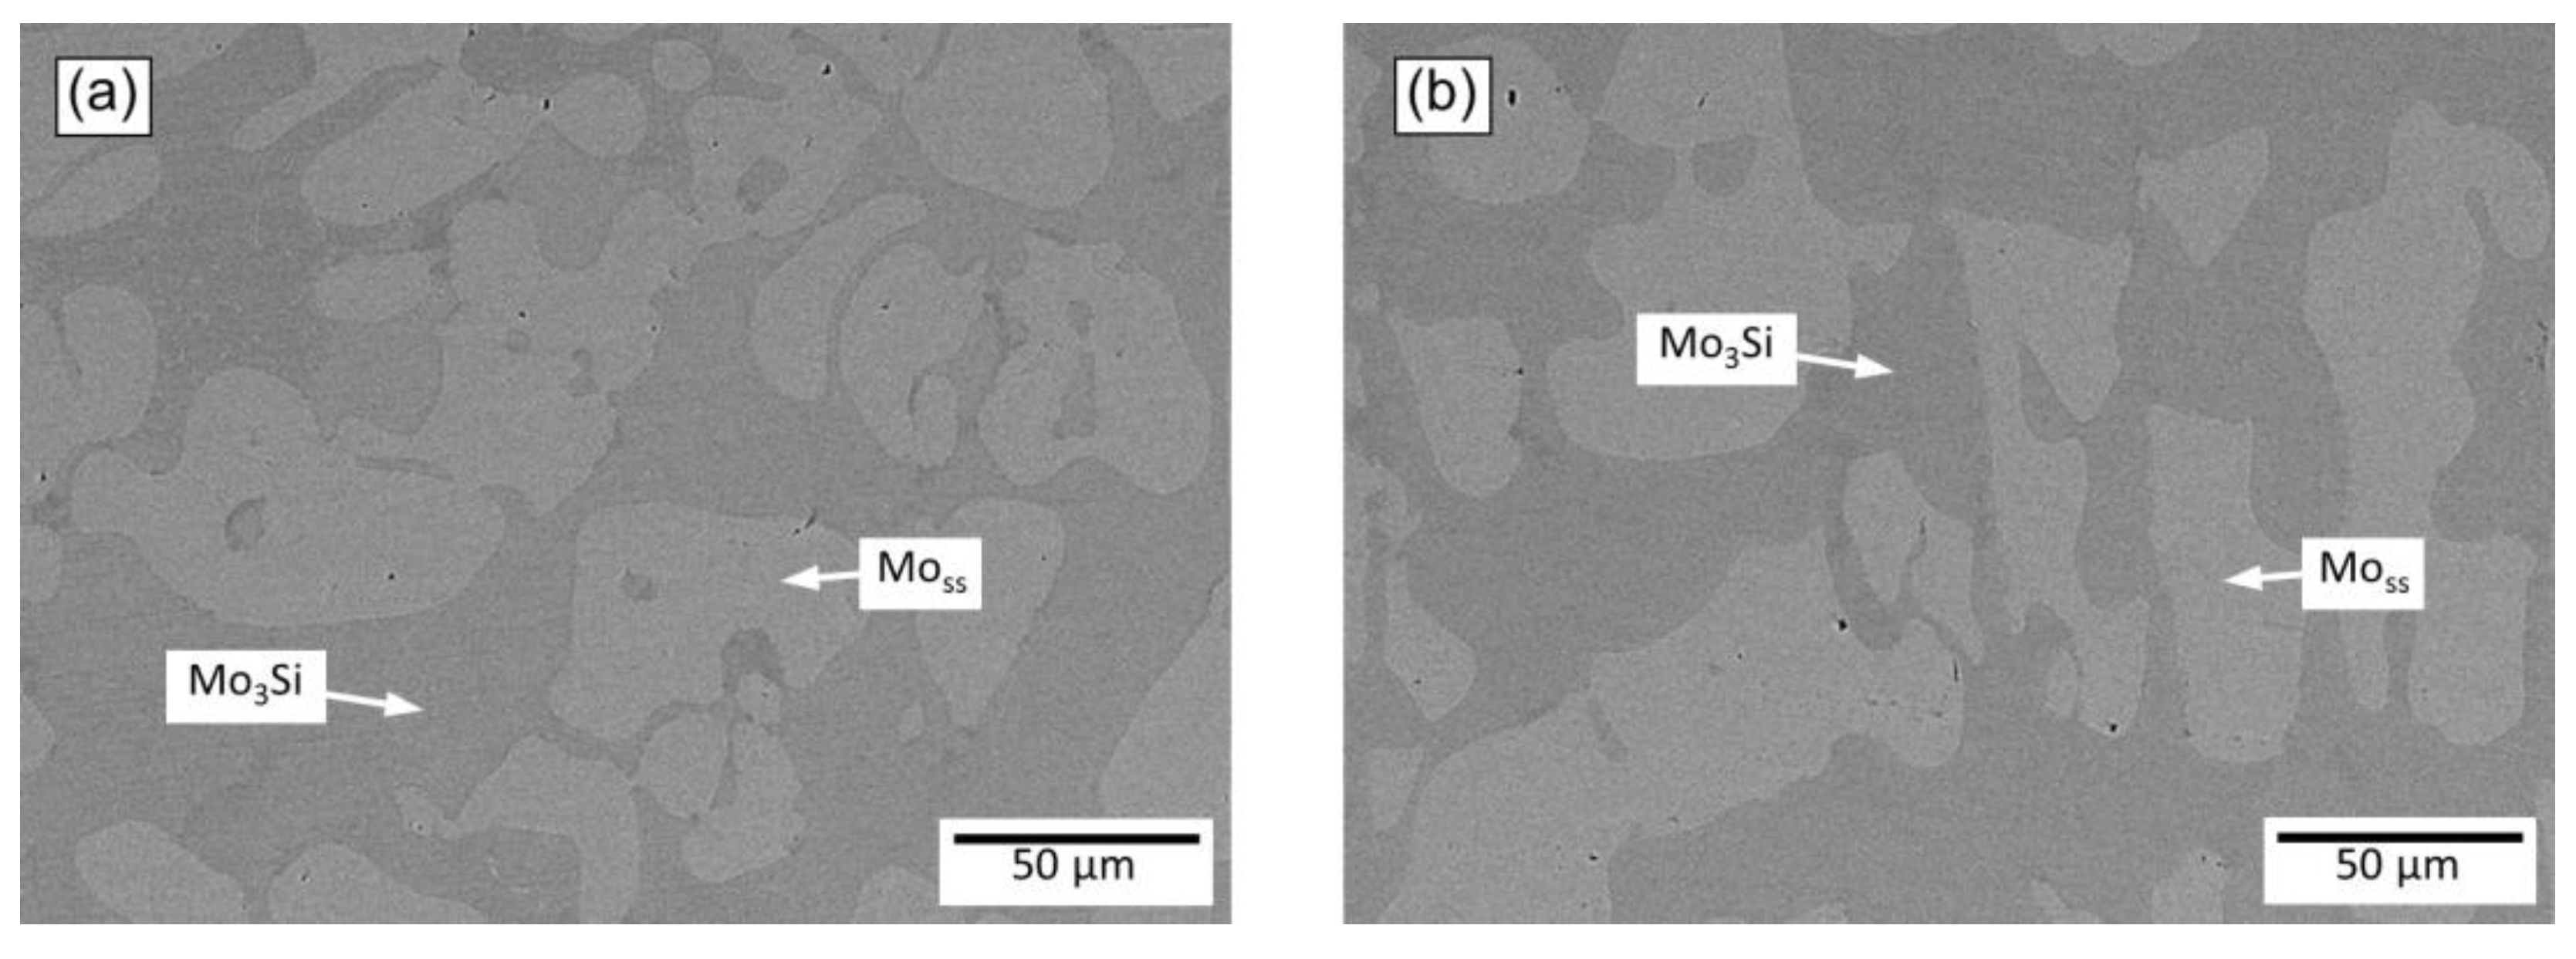
Mo-15Si specimen was manufactured by zone melting in order to achieve a coarse microstructure enabling the determination of the microhardness of the Mo3Si phase in the alloy. The achieved microstructure meets the requirements (Figure 5) and consist of coarse grains of primarily solidified Moss and the matrix phase Mo3Si. There is no significant difference observed between samples oriented parallel and perpendicular to the growth direction. The results of the EDX area analysis were in good agreement with the alloy composition weighted in. According to the EDX point analyses, the Si content in the darker phase is found to be ~22% and in the brighter ~7.4%, which might be related to Mo3Si and supersaturated Moss [29], the latter is expected to be reduced by homogenization heat treatment.

Figure 5.
The microstructure of Mo-15Si after zone melting: (a) perpendicular and (b) parallel to the growth direction.
3.2. Microhardness
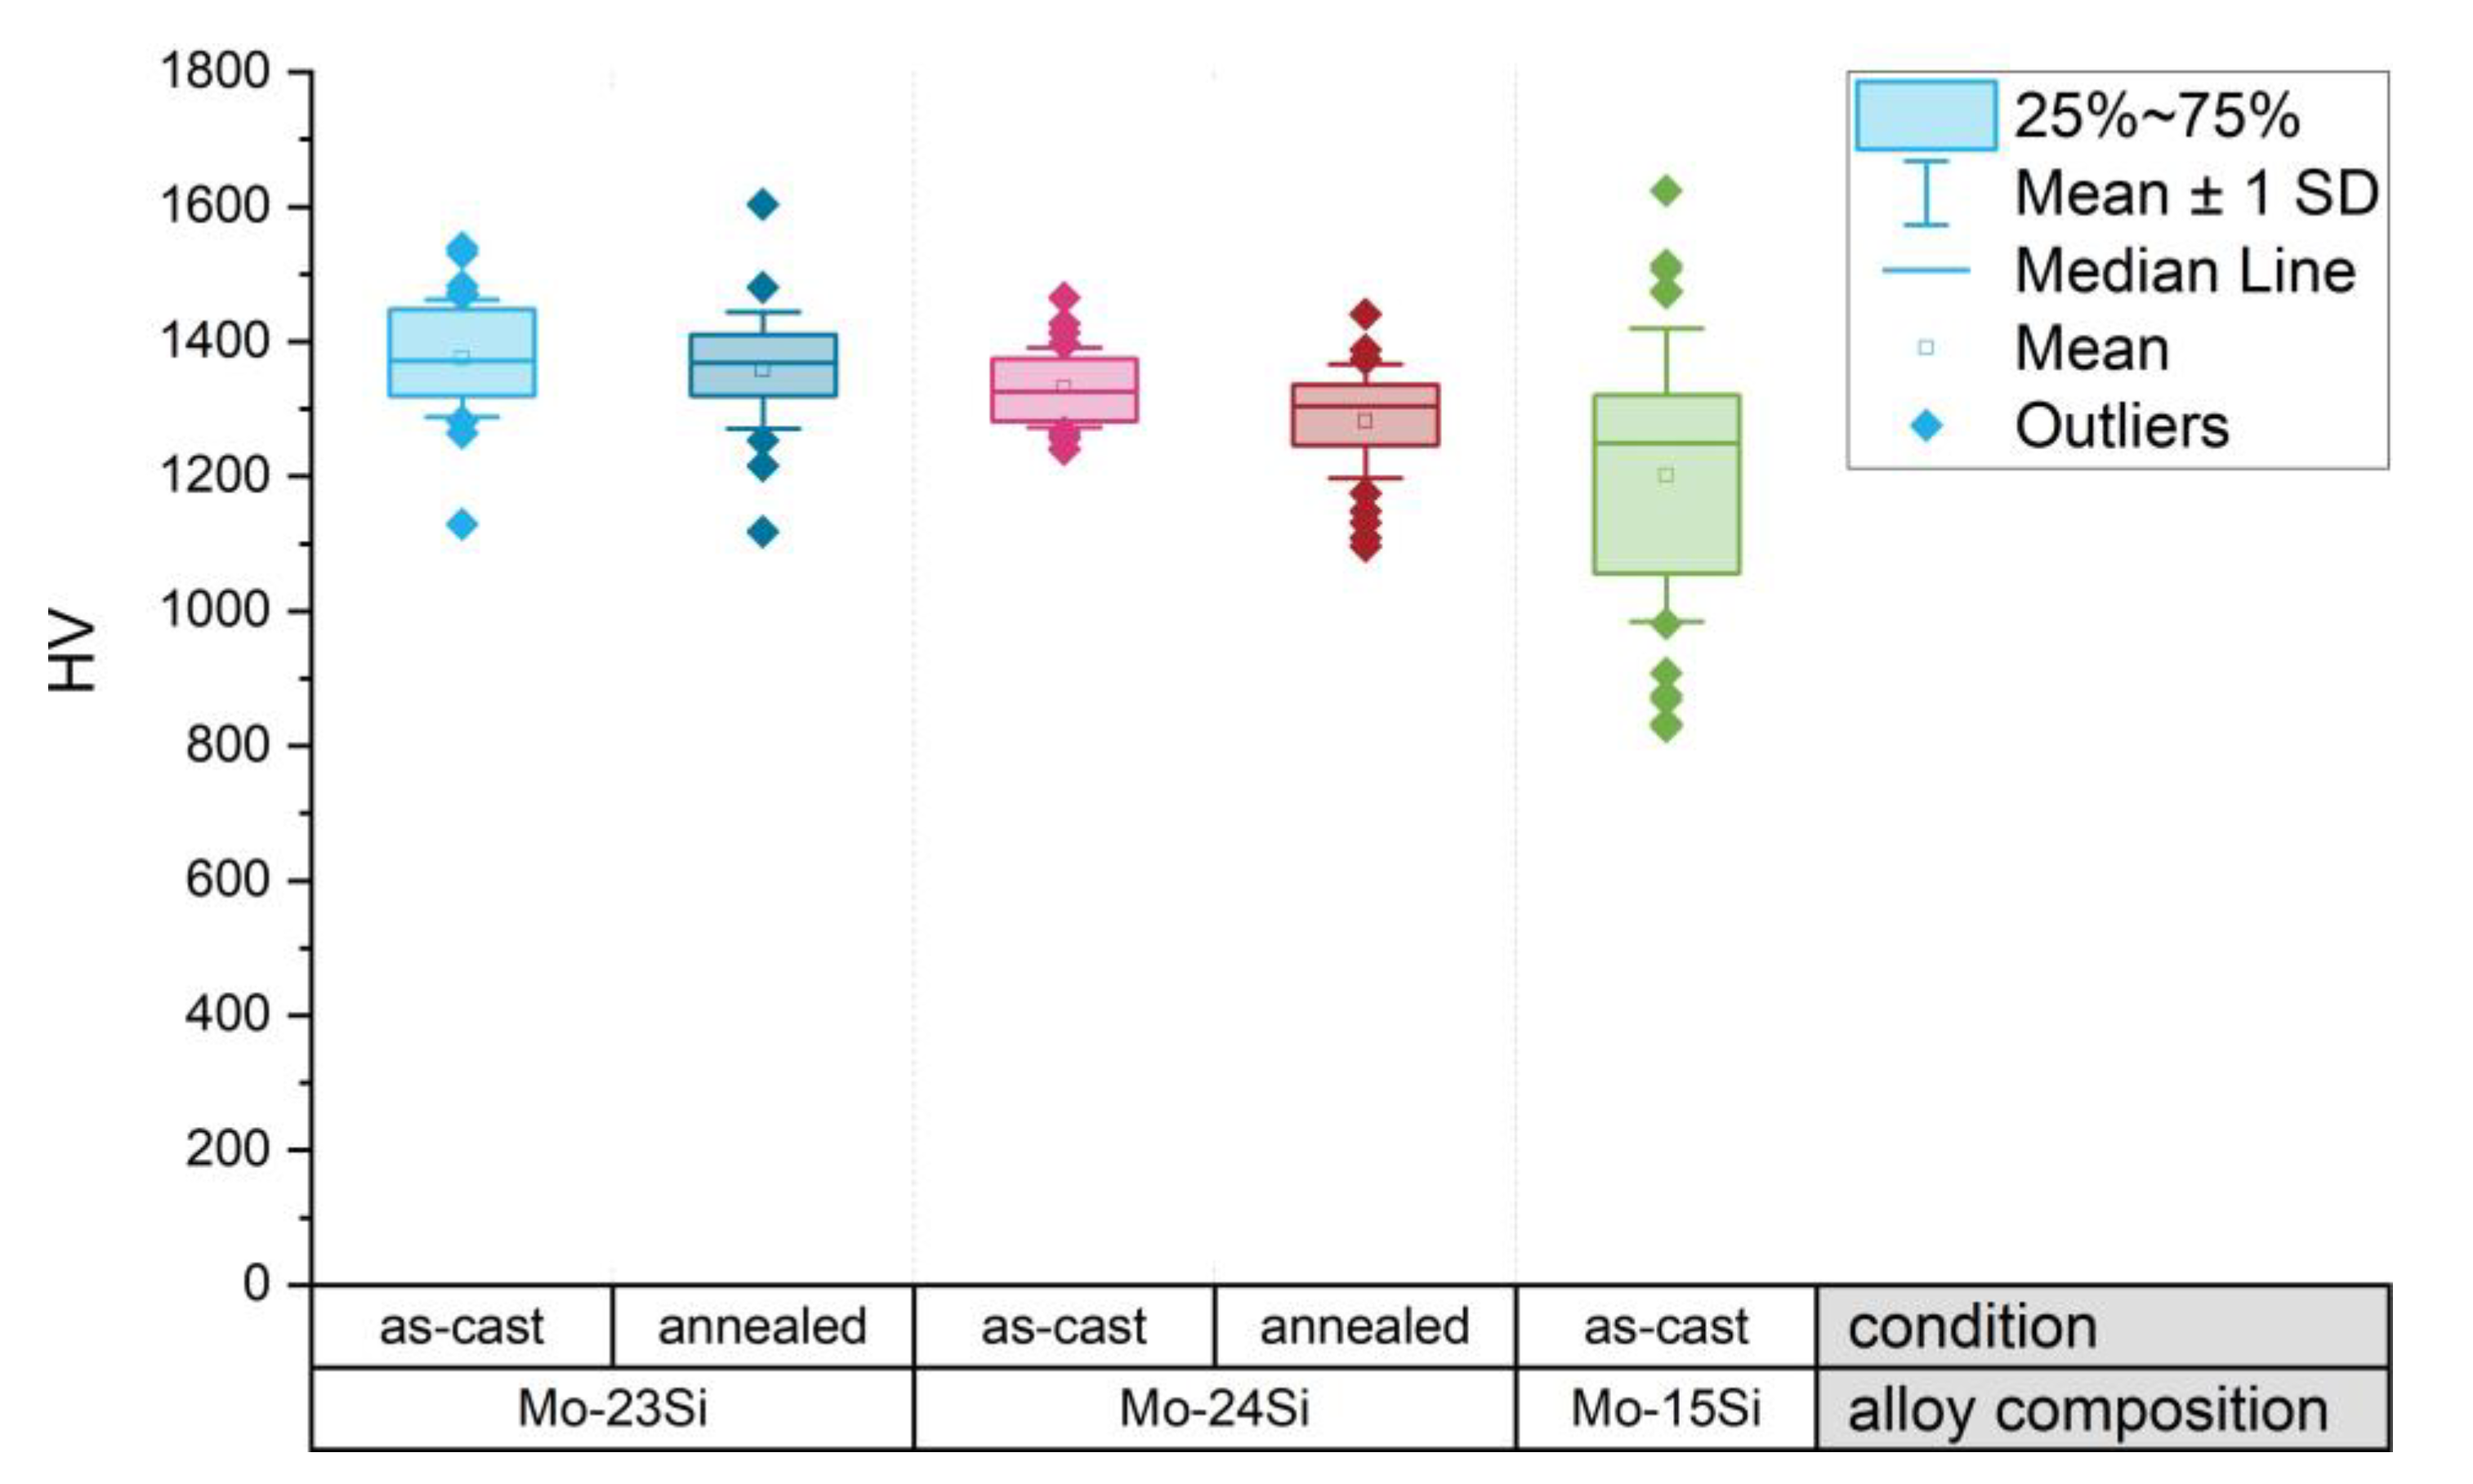
The results of the microhardness measurements are presented in Figure 6. The slight difference in microhardness observed for Mo-23Si and Mo-24Si does not allow for sound interpretations as significant scatter in data needs to be considered. Additionally, there is no significant change in microhardness before and after 100 h annealing at 1600 °C, which is in accordance with the non-significant change in microstructures due to the annealing. In general, the measured value of the Mo3Si microhardness for all specimens is HV 0.5 = 1336 ± 87, which is in very good agreement to the data reported in [4] after 24 h annealing at 1600 °C as well as after 2 h annealing at 1200 °C. The independence of the microhardness on different annealing regimes indicates that no significant modifications of the local chemical compositions as well as no internal stress relief occurs during annealing, which leads to the assumption that no significant internal stresses are present after the arc melting, which might influence the mechanical properties.
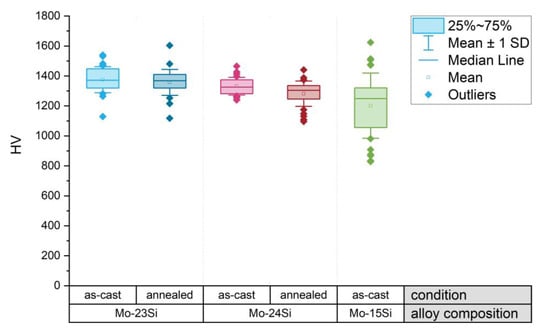
Figure 6.
Microhardness of Mo3Si in different alloy compositions in as-cast state and after annealing for 100 h at 1600 °C.
In the two-phase alloy Mo-15Si, the measured microhardness in the Mo3Si grains is HV 0.5 = 1201 ± 217. Note the considerably increased standard deviation, which might be caused by subjacent, comparatively weak Moss grains affecting the measurement (microhardness, measured in Moss grains in the same specimen with alloy composition Mo-15Si, is HV 0.5 = 702 ± 45). Generally, the microhardness of Mo3Si measured in this alloy is similar to the results for the single-phase specimens.
3.3. Constant Load Compressive Creep Tests
3.3.1. Experimental Results
The investigated variation in the minimum creep rates of the Mo3Si specimens is represented in Figure 7 and compared to pure Mo [30,31], Moss [18], and Mo5SiB2 [32] as well as to some Mo-Si-B alloys [33,34]. Note that in study [18] the creep properties were studied in tensile mode. Nevertheless, similar compressive and tensile creep behavior was reported [16,18]. Thus, it is assumed that the creep response of Mo3Si, which is one of the phases in Mo-Si-B alloys with low plasticity, does not differ in tensile and compressive tests and can be compared to those results.

Figure 7.
Creep properties of Mo3Si at (a) intermediate and (b) high temperatures in comparison to pure Mo [30,31], Moss [18], Mo5SiB2 [32], and Mo-Si-B alloys [33,34], including fitting with power creep law with constant creep exponent. (c) Arrhenius plot for Mo3Si at 300 MPa.
The achieved results confirm the conception on the properties of the phases in Mo-Si-B alloys [1,2,3], which was described in the introduction. So, Mo3Si exhibits significantly lower creep rates than Moss, which in turn are much lower than the creep rates of the pure Mo. Additionally, Mo3Si has lower creep rates than Mo-Si-B alloys, which typically include the weaker Moss phase. The creep properties of polycrystalline Mo5SiB2 have only been studied at 1500 °C, but even at this temperature Mo5SiB2 has lower creep rates than Mo3Si at 1300 °C. In all specimens, a brittle failure type was observed. It is clear that the damaged samples were not used for further stress-step-tests. Some examples of the cracks in the specimens and damaged samples after creep tests are displayed in the Figure 8. The brittle manner of fracture indicates high brittleness of Mo3Si even at high temperatures. The problem is that brittle materials absorb less energy before breaking or fracturing. Thus, material fails suddenly instead of deforming or straining under load when a brittle failure occurs and this can happen with only a small load, impact force, or shock. Therefore Mo-Si-B alloys should have enough ductile Moss which is able to bridging or arresting cracks.

Figure 8.
Specimens after creep tests: (a) and (b) cracks in the specimens, (c) damaged sample.
Conclusively, Mo3Si is characterized by a lower creep rates than Moss but a higher compared to Mo5SiB2 (Figure 7), which should be considered for novel alloy design.
To describe the creep behavior in a wide stress range, various response functions have been proposed. Overviews are presented in [30,35,36]. In this study, the variation in the creep rate with applied stress under different temperature was fitted with three constitutive equations—(i) a Norton power law, (ii) a stress range dependent constitutive model, as described in [37], and (iii) power law with temperature-dependent creep exponent as described in [38].
3.3.2. Regression with Power Law with Constant Creep Exponent
The most common way to fit the variation of the creep rate in the stationary creep regime for metallic alloys is a power law also known as Norton’s law
where is the minimum creep rate, A and n are material constants, and σ is the applied stress. For analysis and comparison of properties the dependence of the creep rate on the applied stress is commonly plotted in a graph with double logarithmic scale also called Norton-plot, like in Figure 7a,b. For non-isothermal test conditions, the Norton law coefficient A is generally analyzed in terms of an Arrhenius equation
where B is material constant, T is the test temperature, Q is the apparent activation energy for the mechanism involved in the deformation process (usually close to the activation energy for self-diffusion) and R is the gas constant.
The constants and accuracy (R-squared values, ), determined according to the regression with the Equation (1) of the two isothermal cases, at 1093 °C and 1300 °C, are specified in Table 1, fitting curves are plotted in Figure 7a,b. For a case of constant stress σ = 300 MPa an activation energy of Q = 542 kJ/mol was determined. The corresponding Arrhenius-plot with experimental data and fitted curve ( = 0.988) is plotted in Figure 7c. The determined activation energy is close to the activation energy for integrated diffusion in Mo3Si, calculated from the growth kinetics data, = 502 kJ/mol [39]. As the curves at 1093 °C and 1300 °C show different slopes, of 4.6 and 1.3, it is not possible to fit all experimental data at once with the Equation (1) using (2) for the Norton law coefficient A. Thus, other constitutive equations are discussed in Section 3.3.3 and Section 3.3.4, which allow the consideration of the change in the slope.

Table 1.
Results of regression with power law Equation (1).
3.3.3. Regression with Stress Range Dependent Constitutive Model
Another way to describe the stationary creep behavior was described in [37] and suggests that the minimum creep rate is the sum of the linear and the power law stress functions. In this case, the constitutive equation would be
where n, and are material constants. For non-isothermal conditions, the material constants and must be replaced by Arrhenius type temperature functions, thus
where a and b are material constants, and are activation energies. The values of and represent the point on the Norton plot, in which the extended curves of linear and power law creep would intersect. The parameter n represents the slope of the power law range.
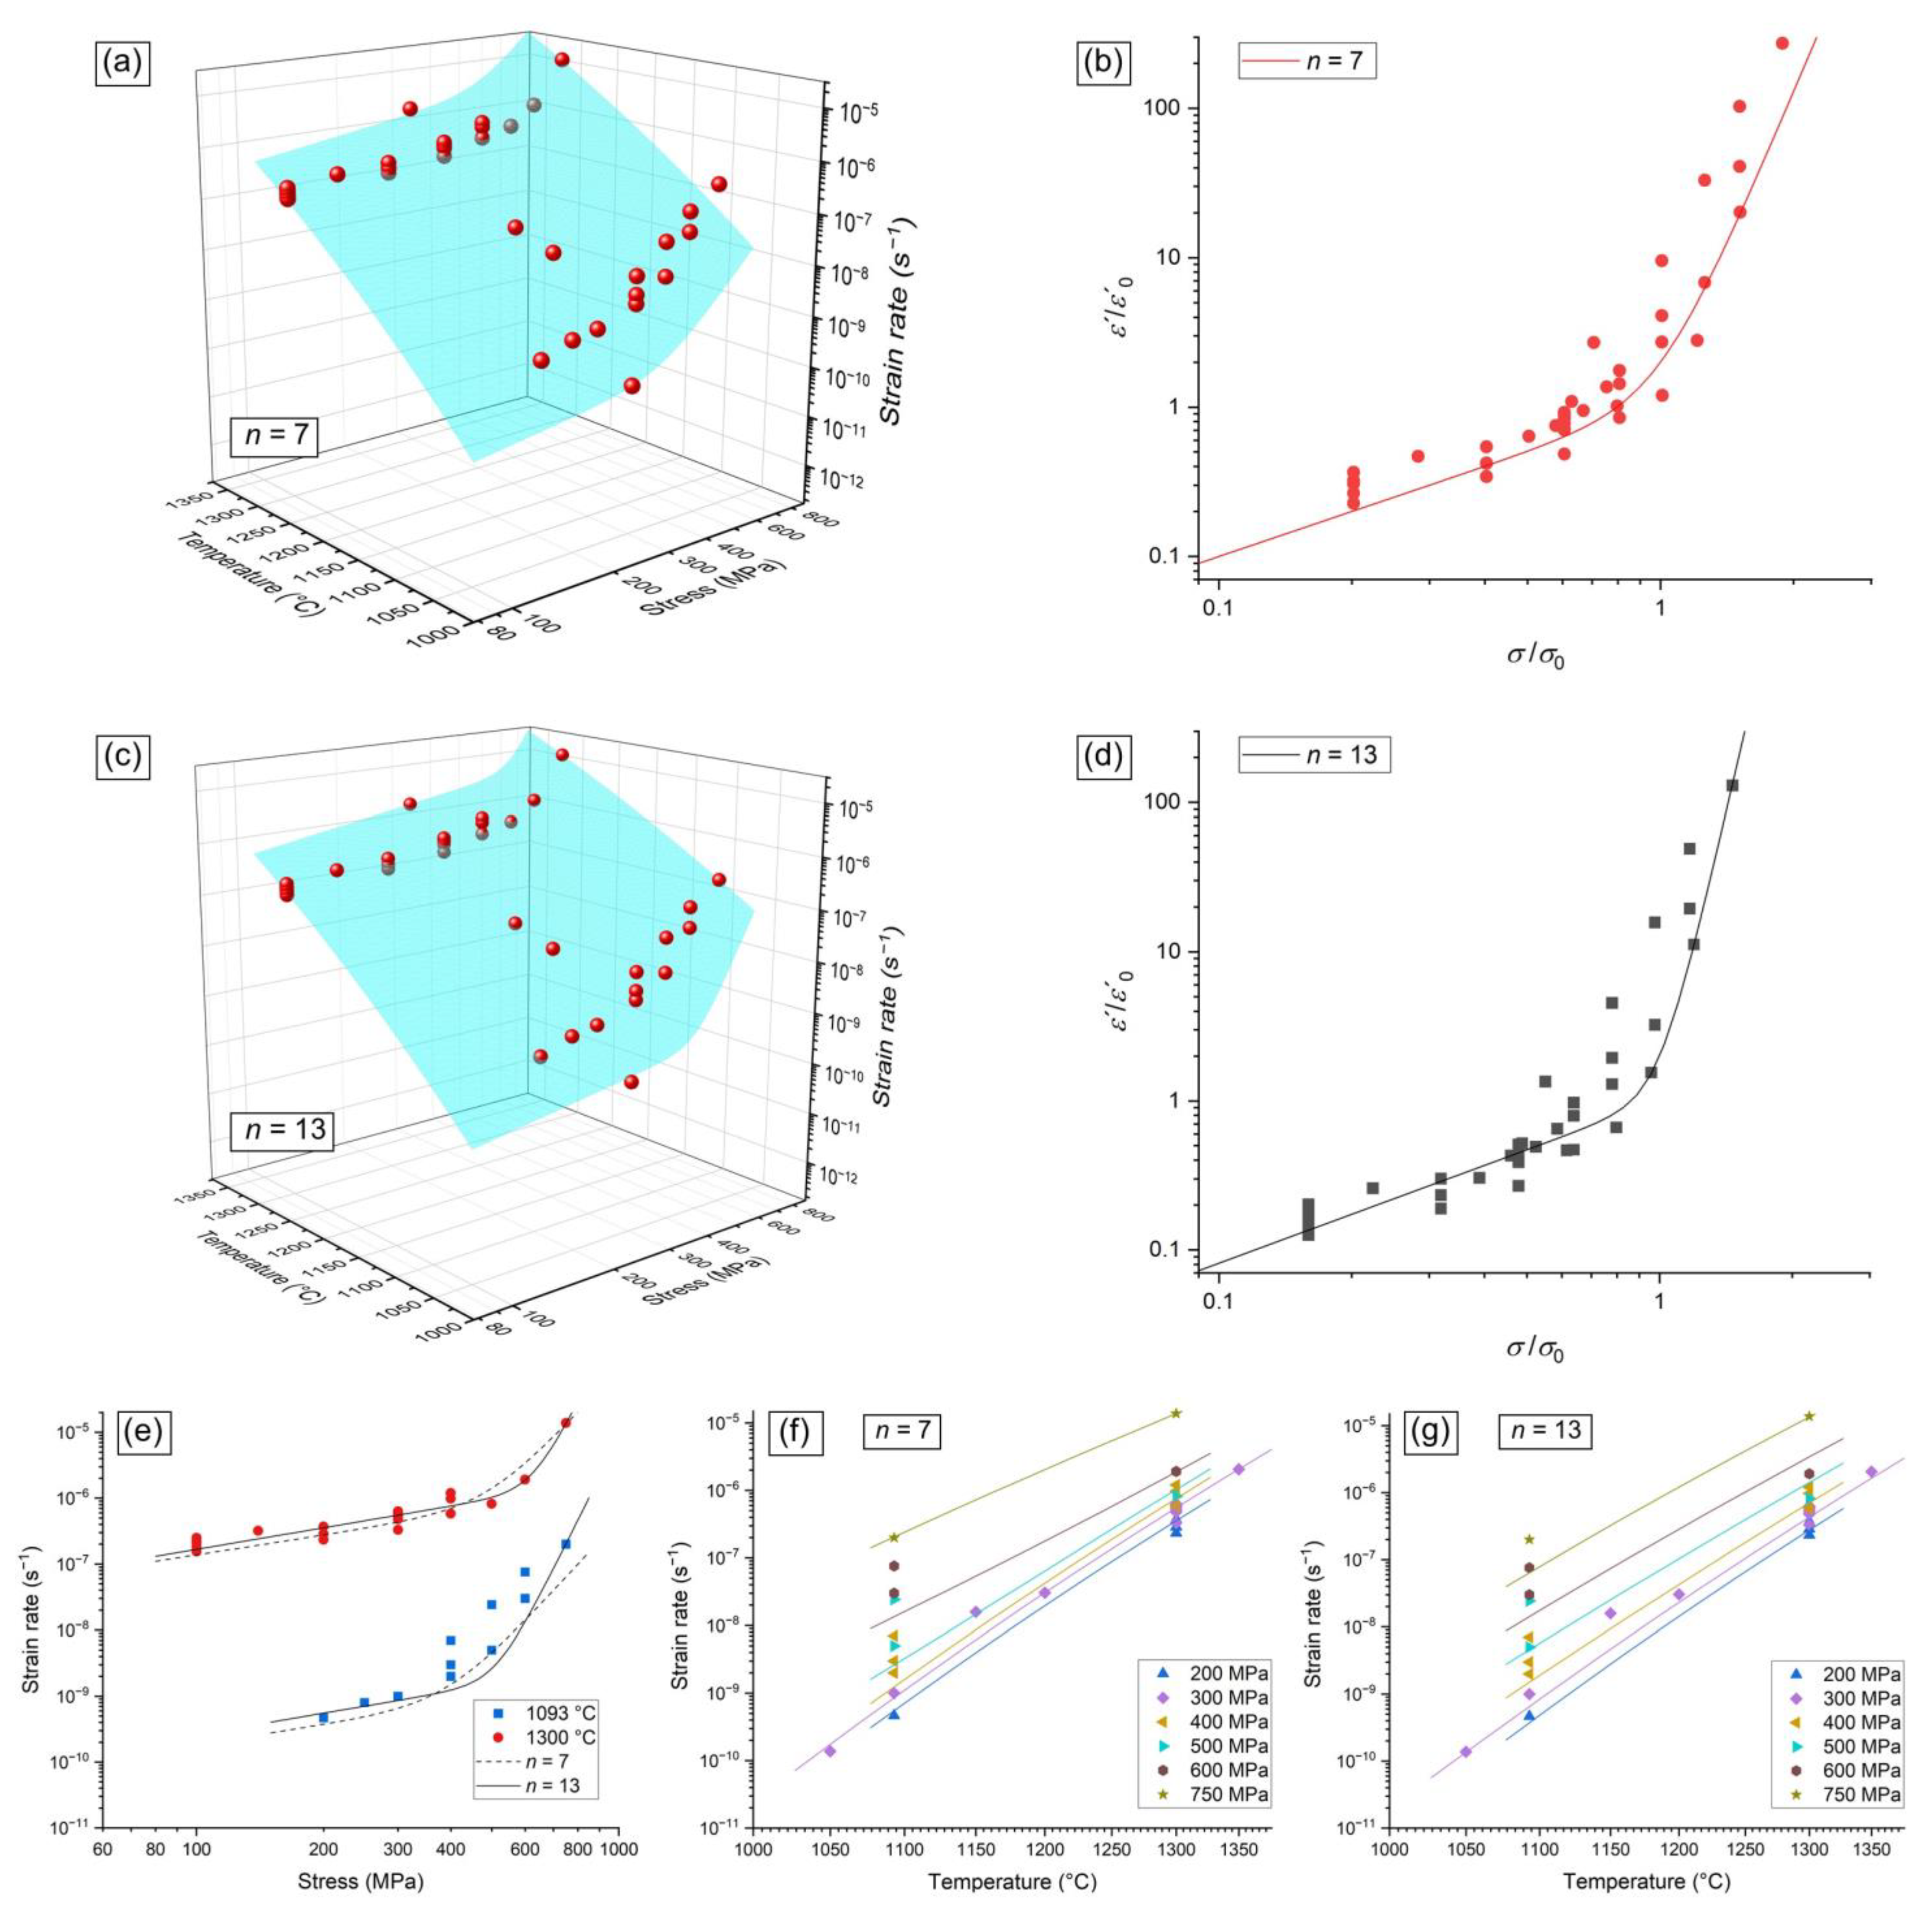
The constants and accuracy (R-squared values, ) determined according to regression with stress range dependent constitutive model are specified in Table 2 and the fitting results are plotted on Figure 9. Despite the ability to describe the typical transition from linear to power law creep, not enough data are available in the power law range in order to determine the constants accurately. Thereby, the results fit with a good accuracy for n = 7 as well as for n = 13 (R-squared values are 0.981 and 0.998, respectively). Although the R-squared value for n = 13 is slightly higher, it cannot be concluded that it describes the properties better, because this value is determined by the several points at high stress levels and the further trend of the curve is not defined without data at higher stresses. Thus, a more detailed analysis of the properties at higher stresses is recommended for more accurate analysis taking into account the experimental deviations.

Table 2.
Results of regression with stress range dependent constitutive model (3) using (4).
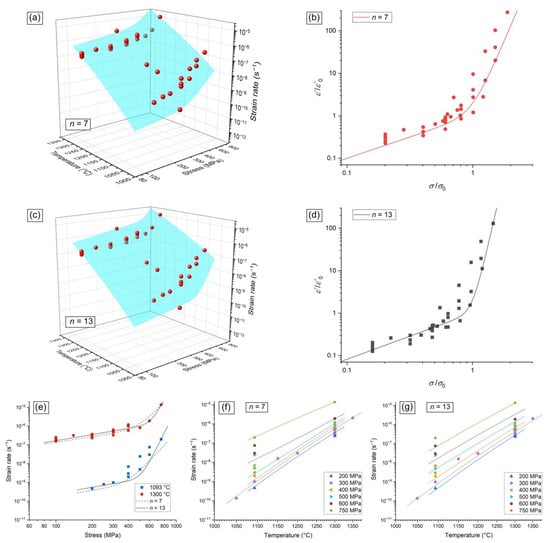
Figure 9.
Fitting the experimental results with stress range dependent constitutive model: (a) and (b) n = 7; (c) and (d) n = 13; (e) comparison n = 7 and n = 13; (f) and (g) Arrhenius plot for n = 7 and n = 13, respectively.
3.3.4. Regression with Power Law Using Temperature-Dependent Creep Exponent
Another model to describe the stationary creep properties was proposed in [38]. It suggests that for non-isothermal conditions the creep exponent n in Equation (1) varies directly as a function of the absolute temperature and can be replaced by the temperature-dependent function:
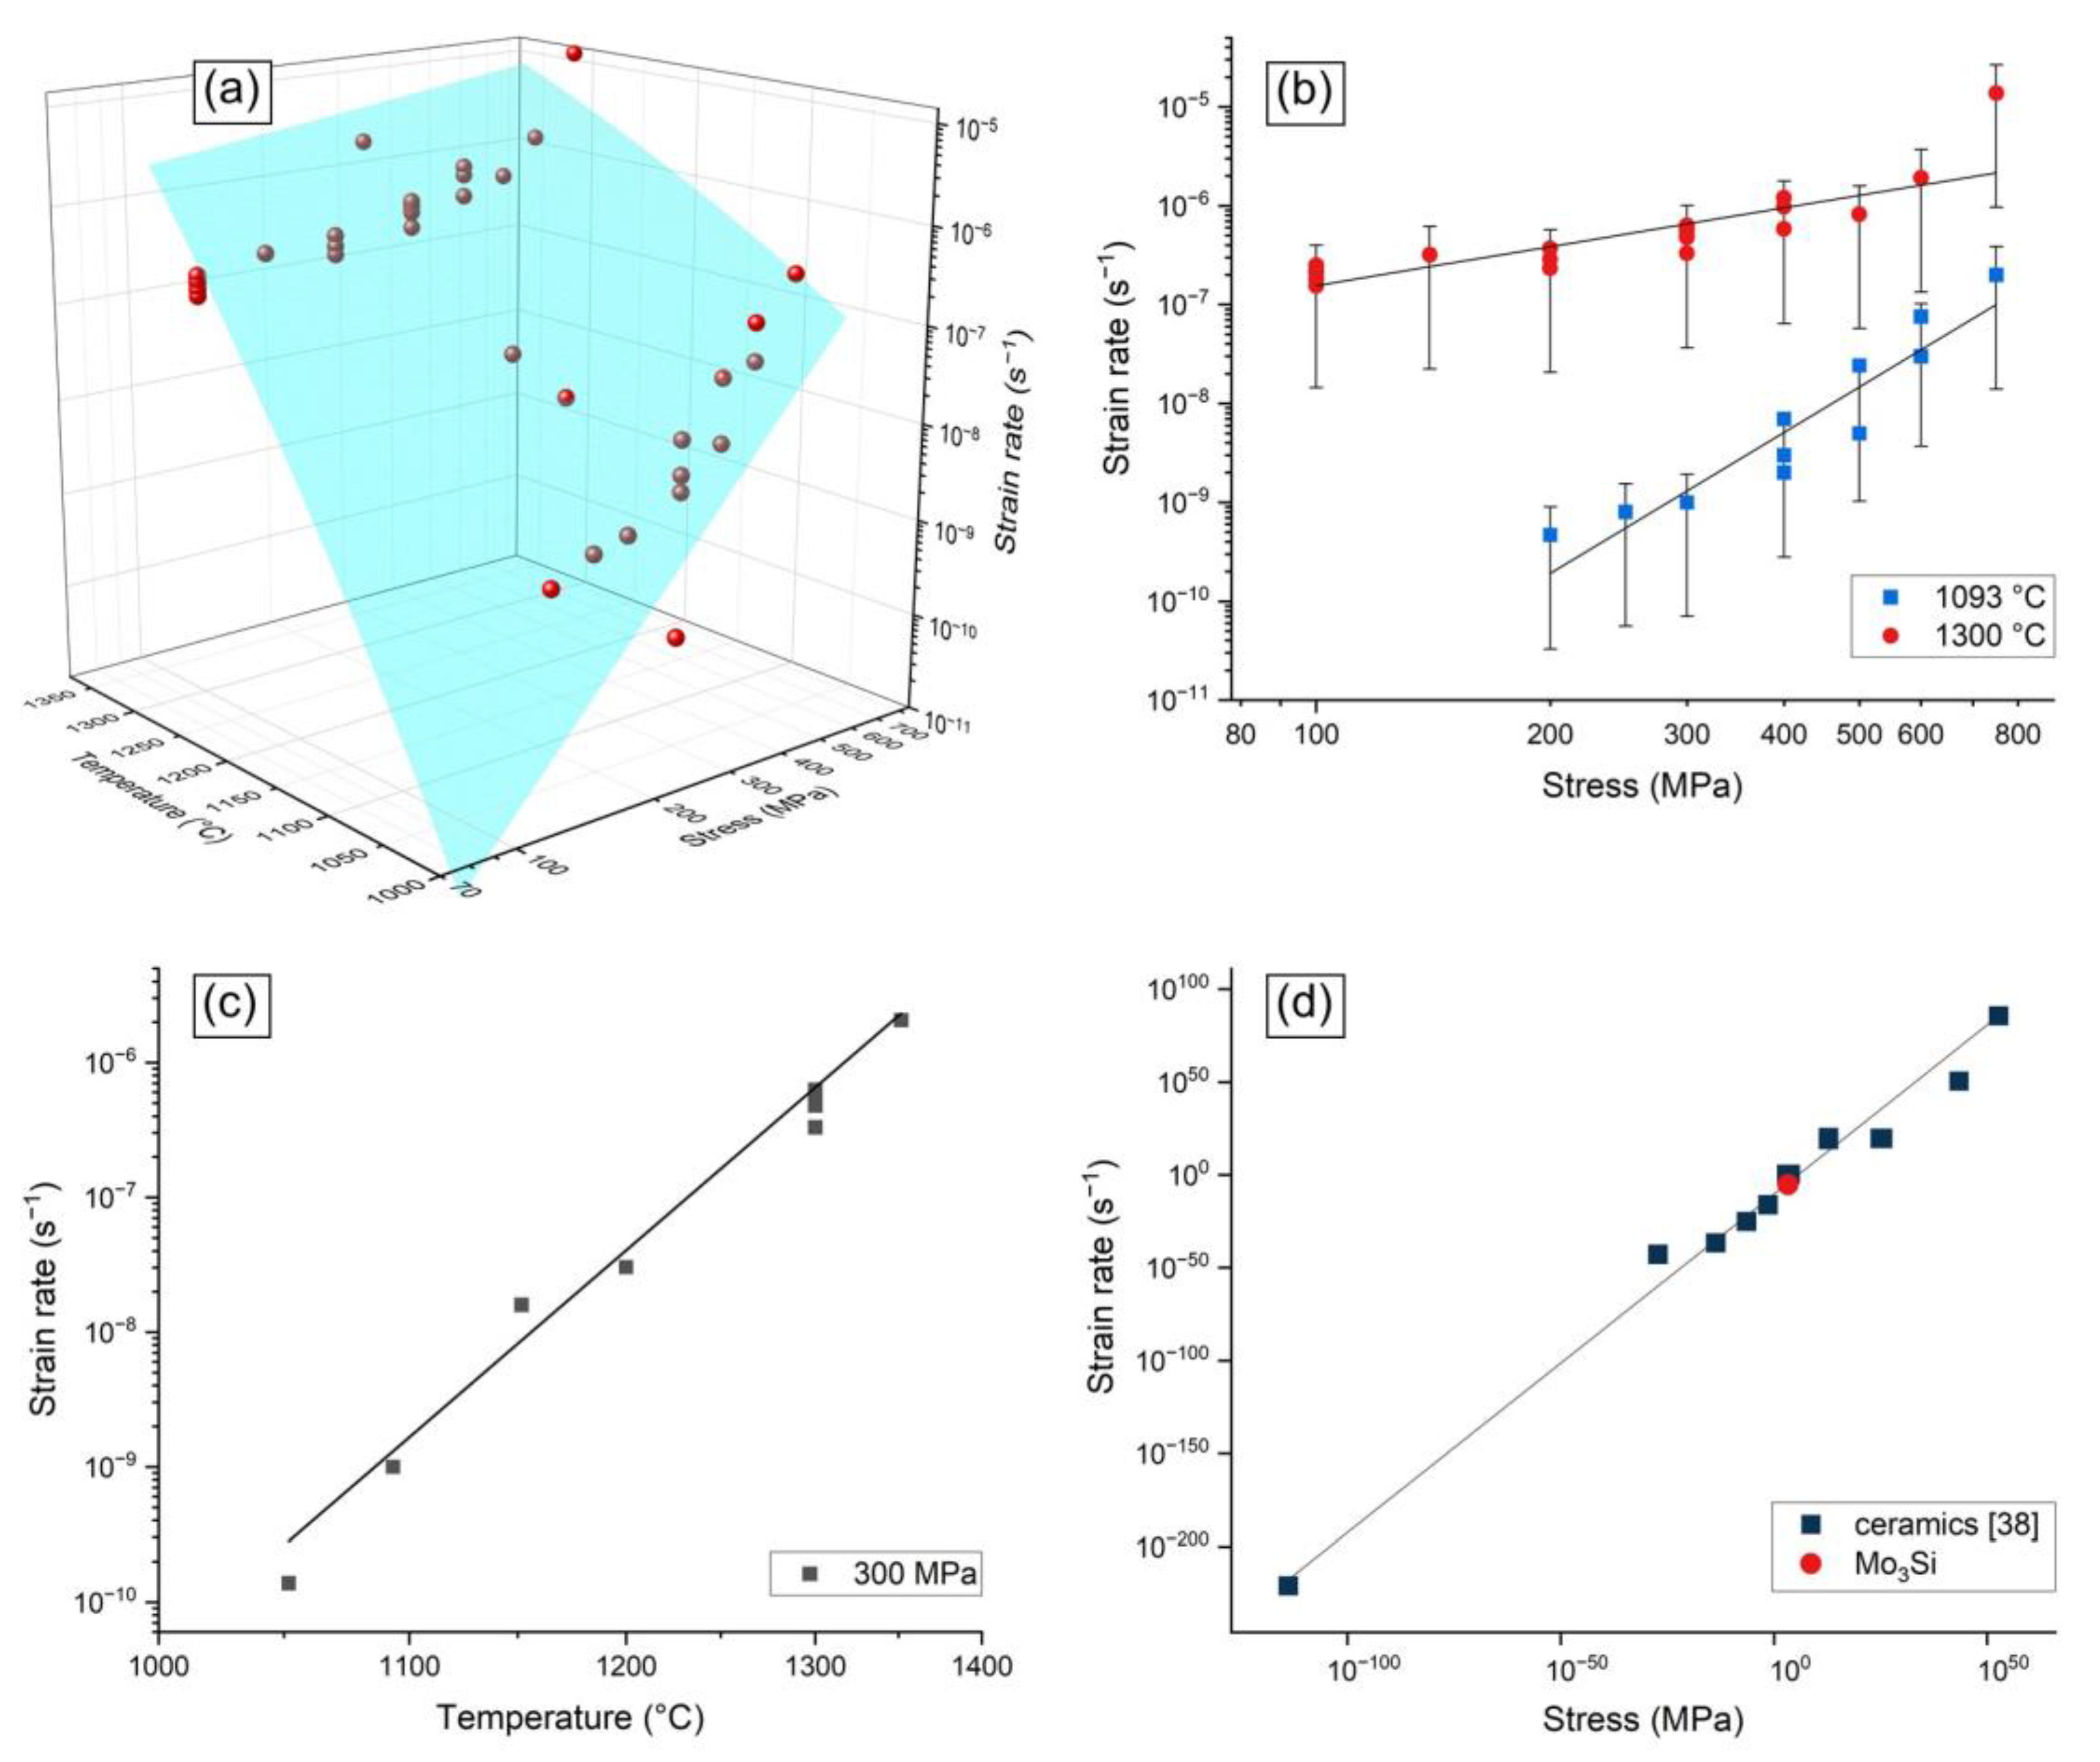
where c and d are material constants. This correlation implies that all isothermal curves representing the variation of the strain rate versus the applied load intersect at the same point, named the pivot point (, ). The pivot point depends on the material but is interrelated for the same class of materials. Figure 10d represents this correlation for different oxide ceramics and spinel. This relation as well as linearity between n and 1/T was verified in [38] with an incredibly good accuracy using experimental data for 27 materials.
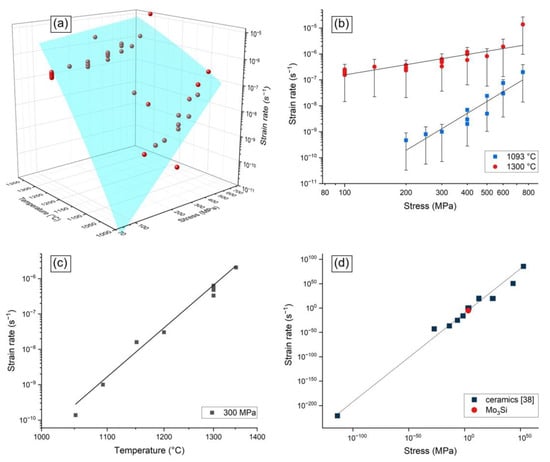
Figure 10.
Fitting the experimental results with power law with temperature-dependent creep exponent: (a) 3D plot; (b) Norton plot; (c) Arrhenius plot; (d) determined pivot point in the plot showing the relation of creep rate vs. stress in pivot points for different ceramic materials [38].
The constants determined according to regression with power law using temperature-dependent creep exponent (in Equations (1), (2), and (5)) are B = 3.45 × 1064 , c = −21, d = 35,653 K, Q = 2227 kJ/mol with accuracy (R-squared values) = 0.956. The fitting curves are plotted in Figure 10a–c. The fitting curves are remarkably similar to Section 3.3.2 as the model can be transformed to the same equation for isothermal cases. The determined pivot point is = 6.36 × 10⁻⁶ s−1 and = 1840 MPa and generally lies on the characteristic curve of pivot points for ceramic materials, described in [38], as shown in Figure 10d.
For each stress level, only 1–6 experiments were carried out. Thus, the accurate determination of standard deviation value was not possible. Therefore, 30% of the mean value was used as error bars in the Figure 10b in order to describe the significance of more data for accurate statistical analysis in more detail. More data points would allow a more accurate regression analysis and describe the properties of the alloys more precisely.
4. Discussion on Creep Mechanism
Generally, creep occurs as a result of diffusion and dislocation motion. At low stresses dislocation density is quite low. Thus, the portion of creep deformation carried by dislocations becomes insignificant. The deformation caused by diffusion can be described with linear dependence of strain rate on stress (power law with stress exponent equal to 1), whereby the dislocation creep is commonly described with power law. Thereby, as soon as dislocation creep mechanism is significant, the creep rate increases much faster as diffusion creep rate and accordingly with higher stresses the value of dislocation creep is not significant anymore [40].
Both diffusion and dislocation motion can cause the deformation along the grain boundaries as well as through the grain bulk. With increasing stress and overall creep rate, the proportion of grain boundary deformation becomes smaller. In the case of sufficiently high stresses, the grain boundary slip is insignificant with regard to the overall deformation [40].
In general, speculations about the dominant creep mechanism can be made based on the value of creep stress exponent [41]. However, the precise conclusions about creep mechanism can be made only after investigation of dislocation motion under creep deformation in a wide range of stresses and temperatures. In this study, three different constitutive models were used for regression of experimental results. The further discussion of calculated stress exponents with different constitutive models would be divided in two cases
- Regressions with (i) power law with constant creep exponent and with (ii) power law with temperature-dependent creep exponent
- regression with stress range dependent constitutive model.
4.1. Regressions with (i) Power Law with Constant Creep Exponent in Section 3.3.2 and with (ii) Power Law with Temperature-Dependent Creep Exponent in Section 3.3.4
In Section 3.3.2, each isothermal case was considered separately and the stress exponent for each isotherm was calculated. As the exponents at 1093 °C and 1300 °C are significantly different, they were combined in Section 3.3.4 with the function of temperature (Equation (5) using additional data achieved at different temperatures at 300 MPa. This enables the possibility to extrapolate the results for other temperatures in a small range. Nevertheless, the solution of this function for stress exponent at 1093 °C and 1300 °C provides similar values as in Section 3.3.2. Thus, the discussion of the possible creep mechanisms would be the same. For better lucidity, the values of the stress exponent from Section 3.3.4, in which each isothermal case is considered separately, are used in further discussion.
At 1300 °C, the stress exponent of 1.3 (Table 1) was determined. As mentioned above, stress exponent with value of 1 (linear function) is characteristic for diffusion creep, which occurs at lower stresses. The calculated value is slightly higher, which is caused by several points at higher stresses, leading to the speculation that there could be a transition in mechanism in the faster creep rate regime. This assumption was considered in the regression with stress range dependent law.
At higher temperatures, the diffusion passes through the volume of crystal (bulk diffusion, Nabarro–Herring creep). At lower temperatures, when bulk diffusion is slow, grain-boundary diffusion takes over (Coble creep). In our case Coble creep is more likely, as 1300 °C is ~68% of melting temperature of Mo3Si (ratio T/Tm in K). Note, that the last point is an assumption, which should be considered carefully before its verification by an investigation of the dislocation’s motion under creep deformation.
At 1093 °C, the stress exponent of 4.6 was determined, which corresponds to dislocation creep controlled by dislocation climb [41]. This conclusion is based on the equivalence of the activation energies of creep and self-diffusion. In addition, factors influencing self-diffusion, such as phase transformation, superimposed hydrostatic pressure, etc., similarly affect creep rates. In our case dislocation core diffusion is more likely, than dislocation bulk diffusion, as 1093 °C is ~59% of melting temperature of Mo3Si (ratio T/Tm in K). Also here, the last assumption should be discussed carefully with regard to the necessary quantitative verification of dislocation motion.
Higher creep rate at 1093 °C as at 1300 °C can be explained by higher transition stress from linear to power law creep, which will be further explained by discussing the results of regression with stress range dependent law.
4.2. Regression with Stress Range Dependent Constitutive Model in Section 3.3.3
In this model, it was assumed that creep proceeds linearly (with creep stress exponent 1) at lower stresses and with power law creep exponent at least >1 (for most materials it is >3) at higher stresses. The extended lines of linear and power law creep would intersect in the transition point in the Norton plot with strain rate and stress , described with Equation (4).
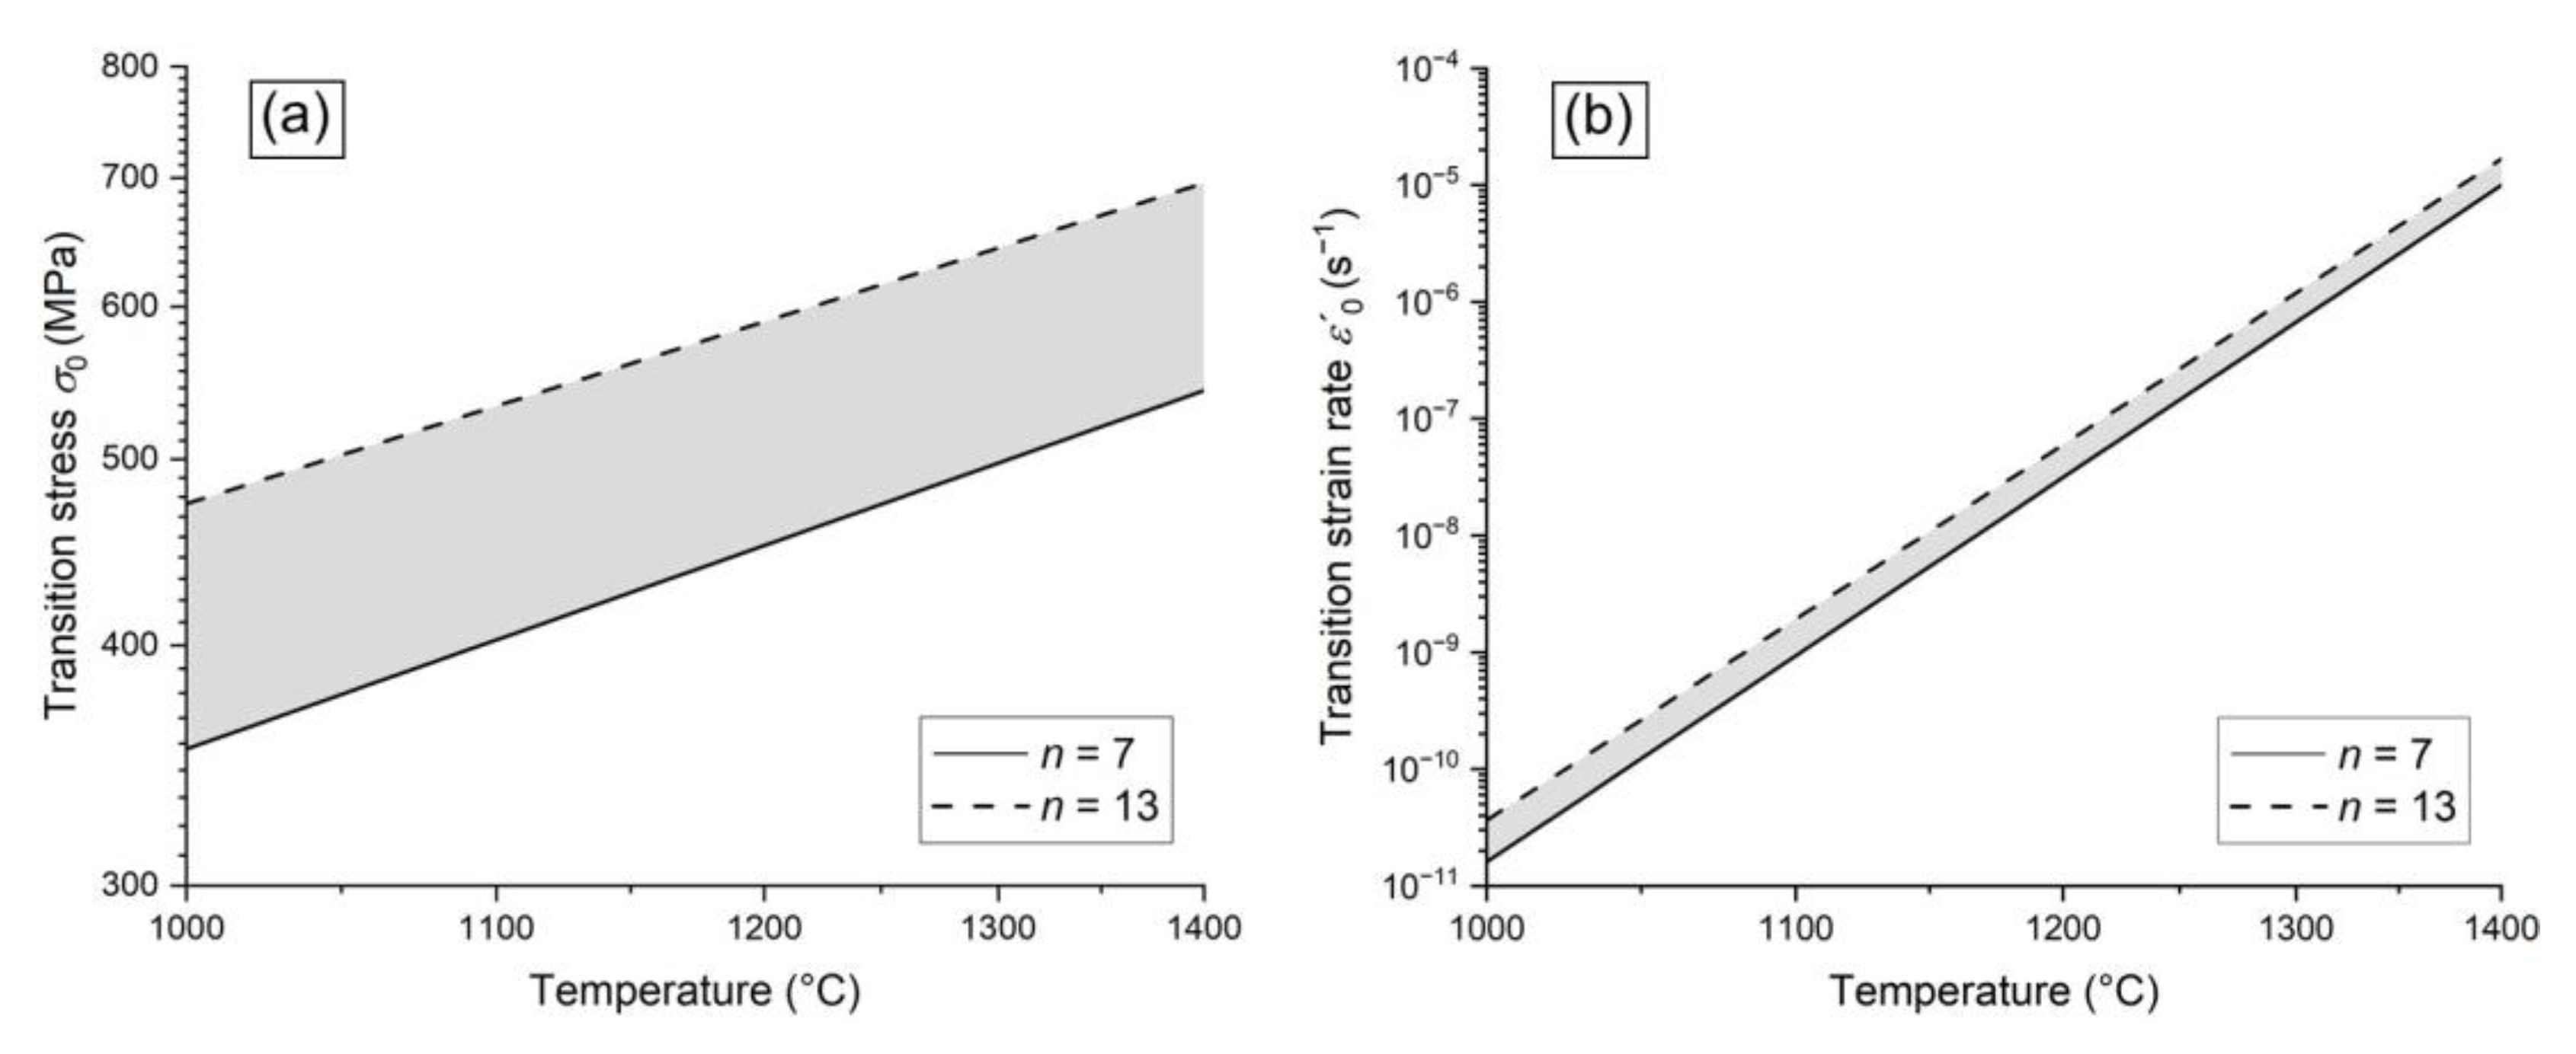
As described in the previous discussion of the results of other regression models, the linear regime at lower stresses corresponds to diffusion creep. The most likely diffusion mechanism at investigated temperatures is Coble creep, but this assumption should be taken with great caution. Note, that at higher temperatures the stress range of linear creep is wider, as transition occurs at higher stresses and strains, what follows from the Equation (4) with Arrhenius type temperature functions for and . The variation of and with temperature is shown in Figure 11.
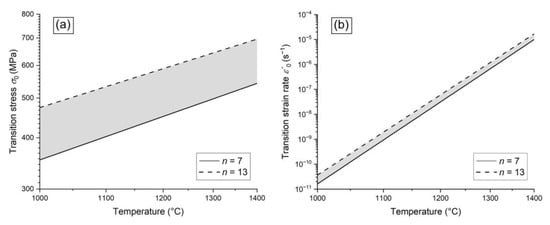
Figure 11.
Variation of transition stress (a) and transition strain rate (b) with temperature.
As described in Section 3.3.3, the wide range of constants in the power law range would provide a good fit with experiment, as not enough data are available in the power law range. Two options, both with good accuracy, n = 7 and n = 13, were presented. The mechanism of steady-state creep deformation with stress exponents > 7 is not clearly resolved [41]. The most likely mechanism is dislocation climb facilitated by short path diffusion of vacancies through the large number of dislocation cores generated at high applied stresses [41]. Controlling mechanism for such stress exponent was also supposed to be a vacancy diffusion caused by vacancy supersaturation by Sherby and Burke [42], breakup of subgrain walls by Pharr [43] and cross slip or cutting of forest dislocations by Poirier [44].
5. Conclusions
Microstructure and microhardness of three near-stoichiometric compositions of Mo3Si (Mo-23Si, Mo-24Si, and Mo-25Si, at %) produced by arc melting were compared before and after 100 h annealing at 1600 °C. It was confirmed that Mo-23Si composition consists only of Mo3Si phase, which remains unaffected by the subsequent annealing. Both compositions, Mo-25Si and Mo-24Si, comprise small amount of Mo5Si3 along the grain boundaries after processing, which completely dissolved in Mo-24Si and partially in Mo-25Si during annealing. Additionally, as-cast Mo-25Si contains small regions of Mo3Si–Mo5Si3 eutectic, which are not present anymore after annealing as well. No significant change was identified in the microhardness of Mo3Si in these specimens, even when comparing different compositions or conditions (before and after annealing). The microhardness was determined to be HV 0.5 = 1336 ± 87, which corresponds to the data published in [4]. Thus, the composition Mo-23Si was chosen for further creep investigation as it showed phase stability with the highest Mo3Si content. Additionally, this value was compared to the microhardness determined for the Mo3Si phase in a two-phase zone-melted alloy Mo-15Si. Conclusively, the properties of the Mo3Si phase in the alloy and in single-phase specimen are similar.
For the investigation of the creep properties of Mo3Si, compression creep tests at 1093 °C and 1300 °C at varying stresses as well as at 300 MPa in the temperature range between 1050 and 1350 °C were performed. The results confirm the concept of the properties of the phases in Mo-Si-B alloys as described in the introduction and in [1,2,3]. It is found that Mo3Si possesses a higher creep response than Moss and Mo-Si-B alloys, but a lower creep response than single-phase Mo5SiB2. The results were fitted to three constitutive models: power law with constant creep exponent, stress range dependent, and power law with temperature-dependent creep exponent. The regression using these methods showed good agreement with the experimental data in the studied stress range. However, additional experimental research is needed for extrapolation of the properties to higher stresses levels.
Author Contributions
Conceptualization, O.K., M.K., and K.N.; Methodology, O.K., M.K., and K.N.; Formal analysis, O.K.; Investigation, O.K., S.O., I.B., T.W., and N.S.; Resources, M.K. and K.N.; Data curation, O.K., S.O., T.W., and N.S.; Writing—original draft preparation, O.K.; Writing—review and editing, O.K., S.O., I.B., K.N., and M.K.; Visualization, O.K.; Supervision, M.K. and K.N.; Project administration, O.K.; Funding acquisition, O.K., M.K., and K.N. All authors have read and agreed to the published version of the manuscript.
Funding
This research was supported by Landesgraduierten-Stipendium (State Graduate Scholarship) funded by Ministry of Science and Economy of Saxony-Anhalt according to GradFG and GradFVO of 04.02.2016 and the Research Training Group 1554/2—Micro-Macro-Interactions in Structured Media and Particle Systems (financed by DFG (Deutsche Forschungsgemeinschaft/German Research Foundation). Hardness measurements were performed in the framework of the DFG project 438070774. Financial support of the Methodisch-Diagnostisches Zentrum Werkstoffprüfung (MDZWP/Methodical-Diagnostic Center for Materials Testing) e.V., Magdeburg, Germany is greatly acknowledged.
Data Availability Statement
The data presented in this study are available on request from the corresponding author.
Acknowledgments
The authors would like to thank Martin Heilmaier and Alexander Kauffmann from Karlsruhe Institute of Technology KIT, Germany for providing access to the high temperature creep tests under vacuum.
Conflicts of Interest
The authors declare no conflict of interest. The funders had no role in the design of the study; in the collection, analyses, or interpretation of data; in the writing of the manuscript, or in the decision to publish the results.
Nomenclature and Abbreviations List
| Abbreviations | |
| BSE | backscattered electrons |
| EDM | electrical discharge machining |
| EDX | energy dispersive X-Ray |
| SE | secondary electrons |
| SEM | scanning electron microscope |
| XRD | X-ray diffraction |
| Latin Letters | |
| A | material constant |
| a | material constant |
| B | material constant |
| b | material constant |
| c | material constant |
| d | material constant |
| E | Young modulus |
| n | material constant |
| Q | activation energy for the mechanism involved in the deformation process |
| Qa | activation energy of linear creep |
| Qb | activation energy of power law creep |
| R | gas constant |
| R-squared values | |
| T | test temperature |
| Tm | melting temperature |
| Greek Letters | |
| minimum creep rate | |
| material constant | |
| εp | pivot point creep rate |
| σ | stress |
| σ0 | material constant |
| σp | pivot point stress |
References
- Lemberg, J.A.; Ritchie, R.O. Mo-Si-B Alloys for Ultrahigh-Temperature Structural Applications. Adv. Mater. 2012, 24, 3445–3480. [Google Scholar] [CrossRef]
- Dimiduk, D.M.; Perepezko, J.H. Mo-Si-B Alloys: Developing a Revolutionary Turbine-Engine Material. MRS Bull. 2003, 28, 639–645. [Google Scholar] [CrossRef]
- Mitra, R. 5-Molybdenum silicide-based composites. In Intermetallic Matrix Composites; Mitra, R., Ed.; Woodhead Publishing: Cambridge, UK, 2018; pp. 95–146. ISBN 978-0-85709-346-2. [Google Scholar]
- Rosales, I.; Schneibel, J.H. Stoichiometry and Mechanical Properties of Mo3Si. Intermetallics 2000, 8, 885–889. [Google Scholar] [CrossRef]
- Zhang, L.; Pan, K.; Lin, J. Fracture Toughness and Fracture Mechanisms in Mo5SiB2 at Ambient to Elevated Temperatures. Intermetallics 2013, 38, 49–54. [Google Scholar] [CrossRef]
- Liu, C.T.; Schneibel, J.H.; Heatherly, L. Processing, Microstructure, and Properties of Multiphase Mo Silicide Alloys. MRS Online Proc. Libr. OPL 1998, 552. [Google Scholar] [CrossRef]
- Schneibel, J.H.; Liu, C.T.; Easton, D.S.; Carmichael, C.A. Microstructure and Mechanical Properties of Mo–Mo3Si–Mo5SiB2 Silicides. Mater. Sci. Eng. A 1999, 261, 78–83. [Google Scholar] [CrossRef]
- Schneibel, J.H.; Kramer, M.J.; Ünal, Ö.; Wright, R.N. Processing and Mechanical Properties of a Molybdenum Silicide with the Composition Mo–12Si–8.5B (at %). Intermetallics 2001, 9, 25–31. [Google Scholar] [CrossRef]
- Schneibel, J.H.; Kramer, M.J.; Easton, D.S. A Mo–Si–B Intermetallic Alloy with a Continuous α-Mo Matrix. Scr. Mater. 2002, 46, 217–221. [Google Scholar] [CrossRef]
- Choe, H.; Schneibel, J.H.; Ritchie, R.O. On the Fracture and Fatigue Properties of Mo-Mo3Si-Mo5SiB2 Refractory Intermetallic Alloys at Ambient to Elevated Temperatures (25 °C to 1300 °C). Metall. Mater. Trans. A 2003, 34, 225–239. [Google Scholar] [CrossRef]
- Kruzic, J.J.; Schneibel, J.H.; Ritchie, R.O. Fracture and Fatigue Resistance of Mo–Si–B Alloys for Ultrahigh-Temperature Structural Applications. Scr. Mater. 2004, 50, 459–464. [Google Scholar] [CrossRef]
- Schneibel, J.H.; Tortorelli, P.F.; Ritchie, R.O.; Kruzic, J.J. Optimization of Mo-Si-B Intermetallic Alloys. Metall. Mater. Trans. A 2005, 36, 525–531. [Google Scholar] [CrossRef]
- Mitra, R.; Srivastava, A.K.; Eswara Prasad, N.; Kumari, S. Microstructure and Mechanical Behaviour of Reaction Hot Pressed Multiphase Mo–Si–B and Mo–Si–B–Al Intermetallic Alloys. Intermetallics 2006, 14, 1461–1471. [Google Scholar] [CrossRef]
- Choe, H.; Chen, D.; Schneibel, J.H.; Ritchie, R.O. Ambient to High Temperature Fracture Toughness and Fatigue-Crack Propagation Behavior in a Mo–12Si–8.5B (at %) Intermetallic. Intermetallics 2001, 9, 319–329. [Google Scholar] [CrossRef]
- Bewlay, B.P.; Jackson, M.R.; Gigliotti, M.F.X. Niobium Silicide High Temperature In Situ Composites. In Intermetallic Compounds—Principles and Practice; John Wiley & Sons, Ltd.: London, UK, 2002; pp. 541–560. ISBN 978-0-470-84585-1. [Google Scholar]
- Schneibel, J.H.; Lin, H.T. Creep Properties of Molybdenum Silicide Intermetallics Containing Boron. Mater. High Temp. 2002, 19, 25–28. [Google Scholar] [CrossRef]
- Hasemann, G.; Kaplunenko, D.; Bogomol, I.; Krüger, M. Near-Eutectic Ternary Mo-Si-B Alloys: Microstructures and Creep Properties. JOM 2016, 68, 2847–2853. [Google Scholar] [CrossRef]
- Jain, P.; Kumar, K.S. Tensile Creep of Mo–Si–B Alloys. Acta Mater. 2010, 58, 2124–2142. [Google Scholar] [CrossRef]
- Bewlay, B.P.; Jackson, M.R.; Subramanian, P.R.; Zhao, J.-C. A Review of Very-High-Temperature Nb-Silicide-Based Composites. Metall. Mater. Trans. A 2003, 34, 2043–2052. [Google Scholar] [CrossRef]
- Bewlay, B.P.; Jackson, M.R.; Zhao, J.-C.; Subramanian, P.R.; Mendiratta, M.G.; Lewandowski, J.J. Ultrahigh-Temperature Nb-Silicide-Based Composites. MRS Bull. 2003, 28, 646–653. [Google Scholar] [CrossRef]
- Schneibel, J.H. Beyond Nickel-Base Superalloys. In Processing and Fabrication of Advanced Materials XIII, Proceedings of the Conference Organized by National University of Singapore [NUS], Singapore Institute of Manufacturing Technology, Co-Sponsored by American Society for Materials International (ASM Int.) (The Materials Information Society, USA), Singapore, 6–8 December 2004; Gupta, M., Srivatsan, T.S., Lim, C.Y.H., Varin, R.A., Eds.; Stallion Press: Singapore, 2005; Volume 2, pp. 563–574. ISBN 981-05-3000-5. [Google Scholar]
- Kauss, O.; Tsybenko, H.; Naumenko, K.; Hütter, S.; Krüger, M. Structural Analysis of Gas Turbine Blades Made of Mo-Si-B under Transient Thermo-Mechanical Loads. Comput. Mater. Sci. 2019, 165, 129–136. [Google Scholar] [CrossRef]
- Kauss, O.; Naumenko, K.; Hasemann, G.; Krüger, M. Structural Analysis of Gas Turbine Blades Made of Mo-Si-B Under Stationary Thermo-Mechanical Loads. In Advances in Mechanics of High-Temperature Materials; Naumenko, K.D., Krüger, M., Eds.; Advanced Structured Materials; Springer: Cham, Switzerland, 2020; Volume 117, pp. 79–91. ISBN 978-3-030-23868-1. [Google Scholar]
- Krüger, M.; Kauss, O.; Naumenko, K.; Burmeister, C.; Wessel, E.; Schmelzer, J. The Potential of Mechanical Alloying to Improve the Strength and Ductility of Mo–9Si–8B–1Zr Alloys—Experiments and Simulation. Intermetallics 2019, 113, 106558. [Google Scholar] [CrossRef]
- Gokhale, A.B.; Abbaschian, G.J. The Mo-Si (Molybdenum-Silicon) System. J. Phase Equilibria 1991, 12, 493–498. [Google Scholar] [CrossRef]
- Gnesin, I.; Gnesin, B. Composition of the Mo-Mo3Si Alloys Obtained via Various Methods. Int. J. Refract. Met. Hard Mater. 2020, 88, 105188. [Google Scholar] [CrossRef]
- Bolbut, V.; Bogomol, I.; Loboda, P.; Krüger, M. Microstructure and Mechanical Properties of a Directionally Solidified Mo-12Hf-24B Alloy. J. Alloys Compd. 2018, 735, 2324–2330. [Google Scholar] [CrossRef]
- Bolbut, V.; Bogomol, I.; Bauer, C.; Krüger, M. Gerichtet erstarrte Mo-Zr-B-Legierungen. Mater. Werkst. 2017, 48, 1113–1124. [Google Scholar] [CrossRef]
- Ha, S.-H.; Yoshimi, K.; Maruyama, K.; Tu, R.; Goto, T. Compositional Regions of Single Phases at 1800 °C in Mo-Rich Mo–Si–B Ternary System. Mater. Sci. Eng. A 2012, 552, 179–188. [Google Scholar] [CrossRef]
- Frost, H.J.; Ashby, M.F. Deformation-Mechanism Maps: The Plasticity and Creep of Metals and Ceramics; Pergamon Press: Oxford, UK, 1982; ISBN 978-0-08-029338-7. [Google Scholar]
- Hasemann, G.; Bogomol, I.; Schliephake, D.; Loboda, P.I.; Krüger, M. Microstructure and Creep Properties of a Near-Eutectic Directionally Solidified Multiphase Mo–Si–B Alloy. Intermetallics 2014, 48, 28–33. [Google Scholar] [CrossRef]
- Hayashi, T.; Ito, K.; Ihara, K.; Fujikura, M.; Yamaguchi, M. Creep of Single Crystalline and Polycrystalline T2 Phase in the Mo–Si–B System. Intermetallics 2004, 12, 699–704. [Google Scholar] [CrossRef]
- Hasemann, G. Microstructure and Properties of Near-Eutectic Mo-Si-B Alloys for High Temperature Applications. Ph.D. Thesis, Otto-von-Guericke-Universität, Magdeburg, Germany, 2017. [Google Scholar]
- Schneibel, J.H. High Temperature Strength of Mo–Mo3Si–Mo5SiB2 Molybdenum Silicides. Intermetallics 2003, 11, 625–632. [Google Scholar] [CrossRef]
- Naumenko, K.; Altenbach, H. Foundations of Engineering Mechanics. In Modeling of Creep for Structural Analysis; Springer: Berlin/Heidelberg, Germany, 2007; ISBN 978-3-540-70834-6. [Google Scholar]
- Penny, R.K.; Marriott, D.L. Design for Creep, 2nd ed.; Springer: Dordrecht, The Netherlands, 1995; ISBN 978-0-412-59040-5. [Google Scholar]
- Naumenko, K.; Altenbach, H.; Gorash, Y. Creep Analysis with a Stress Range Dependent Constitutive Model. Arch. Appl. Mech. 2009, 79, 619–630. [Google Scholar] [CrossRef]
- Iost, A. The Correlation between the Power-Law Coefficients in Creep: The Temperature Dependence. J. Mater. Sci. 1998, 33, 3201–3206. [Google Scholar] [CrossRef]
- Prasad, S.; Paul, A. Growth Mechanism of Phases by Interdiffusion and Atomic Mechanism of Diffusion in the Molybdenum–Silicon System. Intermetallics 2011, 19, 1191–1200. [Google Scholar] [CrossRef]
- Maier, H.J.; Niendorf, T.; Bürgel, R. Handbuch Hochtemperatur-Werkstofftechnik: Grundlagen, Werkstoffbeanspruchungen, Hochtemperaturlegierungen Und-Beschichtungen; Springer Vieweg: Berlin, Germany; Springer Fachmedien Wiesbaden GmbH: Wiesbaden, Germany, 2019; ISBN 978-3-658-25314-1. [Google Scholar]
- Murty, K.L.; Gollapudi, S.; Ramaswamy, K.; Mathew, M.D.; Charit, I. Creep deformation of materials in light water reactors (LWRs). In Materials Ageing and Degradation in Light Water Reactors; Elsevier: Paris, France, 2013; pp. 81–148. ISBN 978-0-85709-239-7. [Google Scholar]
- Sherby, O.D.; Burke, P.M. Mechanical Behavior of Crystalline Solids at Elevated Temperature. Prog. Mater. Sci. 1968, 13, 323–390. [Google Scholar] [CrossRef]
- Pharr, G.M. Some Observations on the Relation between Dislocation Substructure and Power Law Breakdown in Creep. Scr. Metall. 1981, 15, 713–717. [Google Scholar] [CrossRef]
- Poirier, J.P. Is Power-Law Creep Diffusion-Controlled? Acta Metall. 1978, 26, 629–637. [Google Scholar] [CrossRef]
Publisher’s Note: MDPI stays neutral with regard to jurisdictional claims in published maps and institutional affiliations. |
© 2021 by the authors. Licensee MDPI, Basel, Switzerland. This article is an open access article distributed under the terms and conditions of the Creative Commons Attribution (CC BY) license (http://creativecommons.org/licenses/by/4.0/).

