Proceeding Paper

Fuzzy Logic Modeling for Integrating the Thematic Layers Derived from Remote Sensing Imagery: A Mineral Exploration Technique †

by
Milad Sekandari
1 and
Amin Beiranvand Pour
2,*
1
Department of Mining Engineering, Shahid Bahonar University of Kerman, Kerman 76169-13439, Iran
2
Institute of Oceanography and Environment (INOS), Universiti Malaysia Terengganu (UMT) Universiti Malaysia Terengganu (UMT), Kuala Nerus 21030, Terengganu, Malaysia
*
Author to whom correspondence should be addressed.
Presented at the 2nd International Electronic Conference on Mineral Science, 1–15 March 2021; Available online: https://iecms2021.sciforum.net/.
Environ. Sci. Proc. 2021, 6(1), 8; https://doi.org/10.3390/iecms2021-09349
Published: 25 February 2021
(This article belongs to the Proceedings of The 2nd International Electronic Conference on Mineral Science)

Abstract

:
In this study, fuzzy logic modeling was implemented to fuse the thematic layers derived from principal components analysis (PCA) in order to generate mineral prospectivity maps. Advanced Spaceborne Thermal Emission and Reflection Radiometer (ASTER) and WorldView-3 (WV-3) satellite remote sensing data were used. A spatial subset zone of the Central Iranian Terrane (CIT), Iran was selected in this study. The PCA technique was implemented for the processing of the datasets and for the production of alteration thematic layers. PCA4, PCA5, and PCA8 were selected as the most rational alteration thematic layers of ASTER for the generation of a prospectivity map. The fuzzy gamma operator was used to fuse the selected alteration thematic layers. The PCA3, PCA4, and PCA6 thematic layers (most rational alteration thematic layers) of WV-3 were fused using the fuzzy AND operator. Field reconnaissance, X-ray diffraction (XRD) analysis, and Analytical Spectral Devices (ASD) spectroscopy were carried out to verify the image processing results. Subsequently, mineral prospectivity maps were produced showing high-potential zones of Pb-Zn mineralization in the study area.

1. Introduction

Remote sensing satellite imagery has been applied to detect alteration minerals, specifically dolomite and gossan zone [1,2,3,4,5,6,7]. A variety of image processing techniques have been used to map hydrothermal alteration minerals. However, previous researchers had not attempted to fuse the most rational thematic layers to generate a comprehensive mineral prospectivity map for sediment-hosted Pb-Zn exploration. Fuzzy logic modeling has been successfully used for mineral prospectivity mapping in metallogenic provinces. Fuzzy logic modeling for mineral prospectivity mapping typically incorporates three main stages, including the fuzzification of evidential data, the logical combination of fuzzy evidential maps with the support of an inference network and proper fuzzy set operations, and the defuzzification of fuzzy mineral prospectivity output in order to aid its interpretation [8]. The Central Iranian Terrane (CIT) area (Figure 1) contains great potential for carbonate-hosted Pb-Zn deposits [9]. At present, there has been no comprehensive study conducted to map hydrothermal alteration mineral zones in this area. In this research, ASTER and WorldView-3 (WV-3) satellite remote sensing data were used for prospectivity mapping. The main objective of this analysis was to apply principal components analysis (PCA) to ASTER and WV-3 data in order to generate mineral prospectivity maps using fuzzy logic modeling.

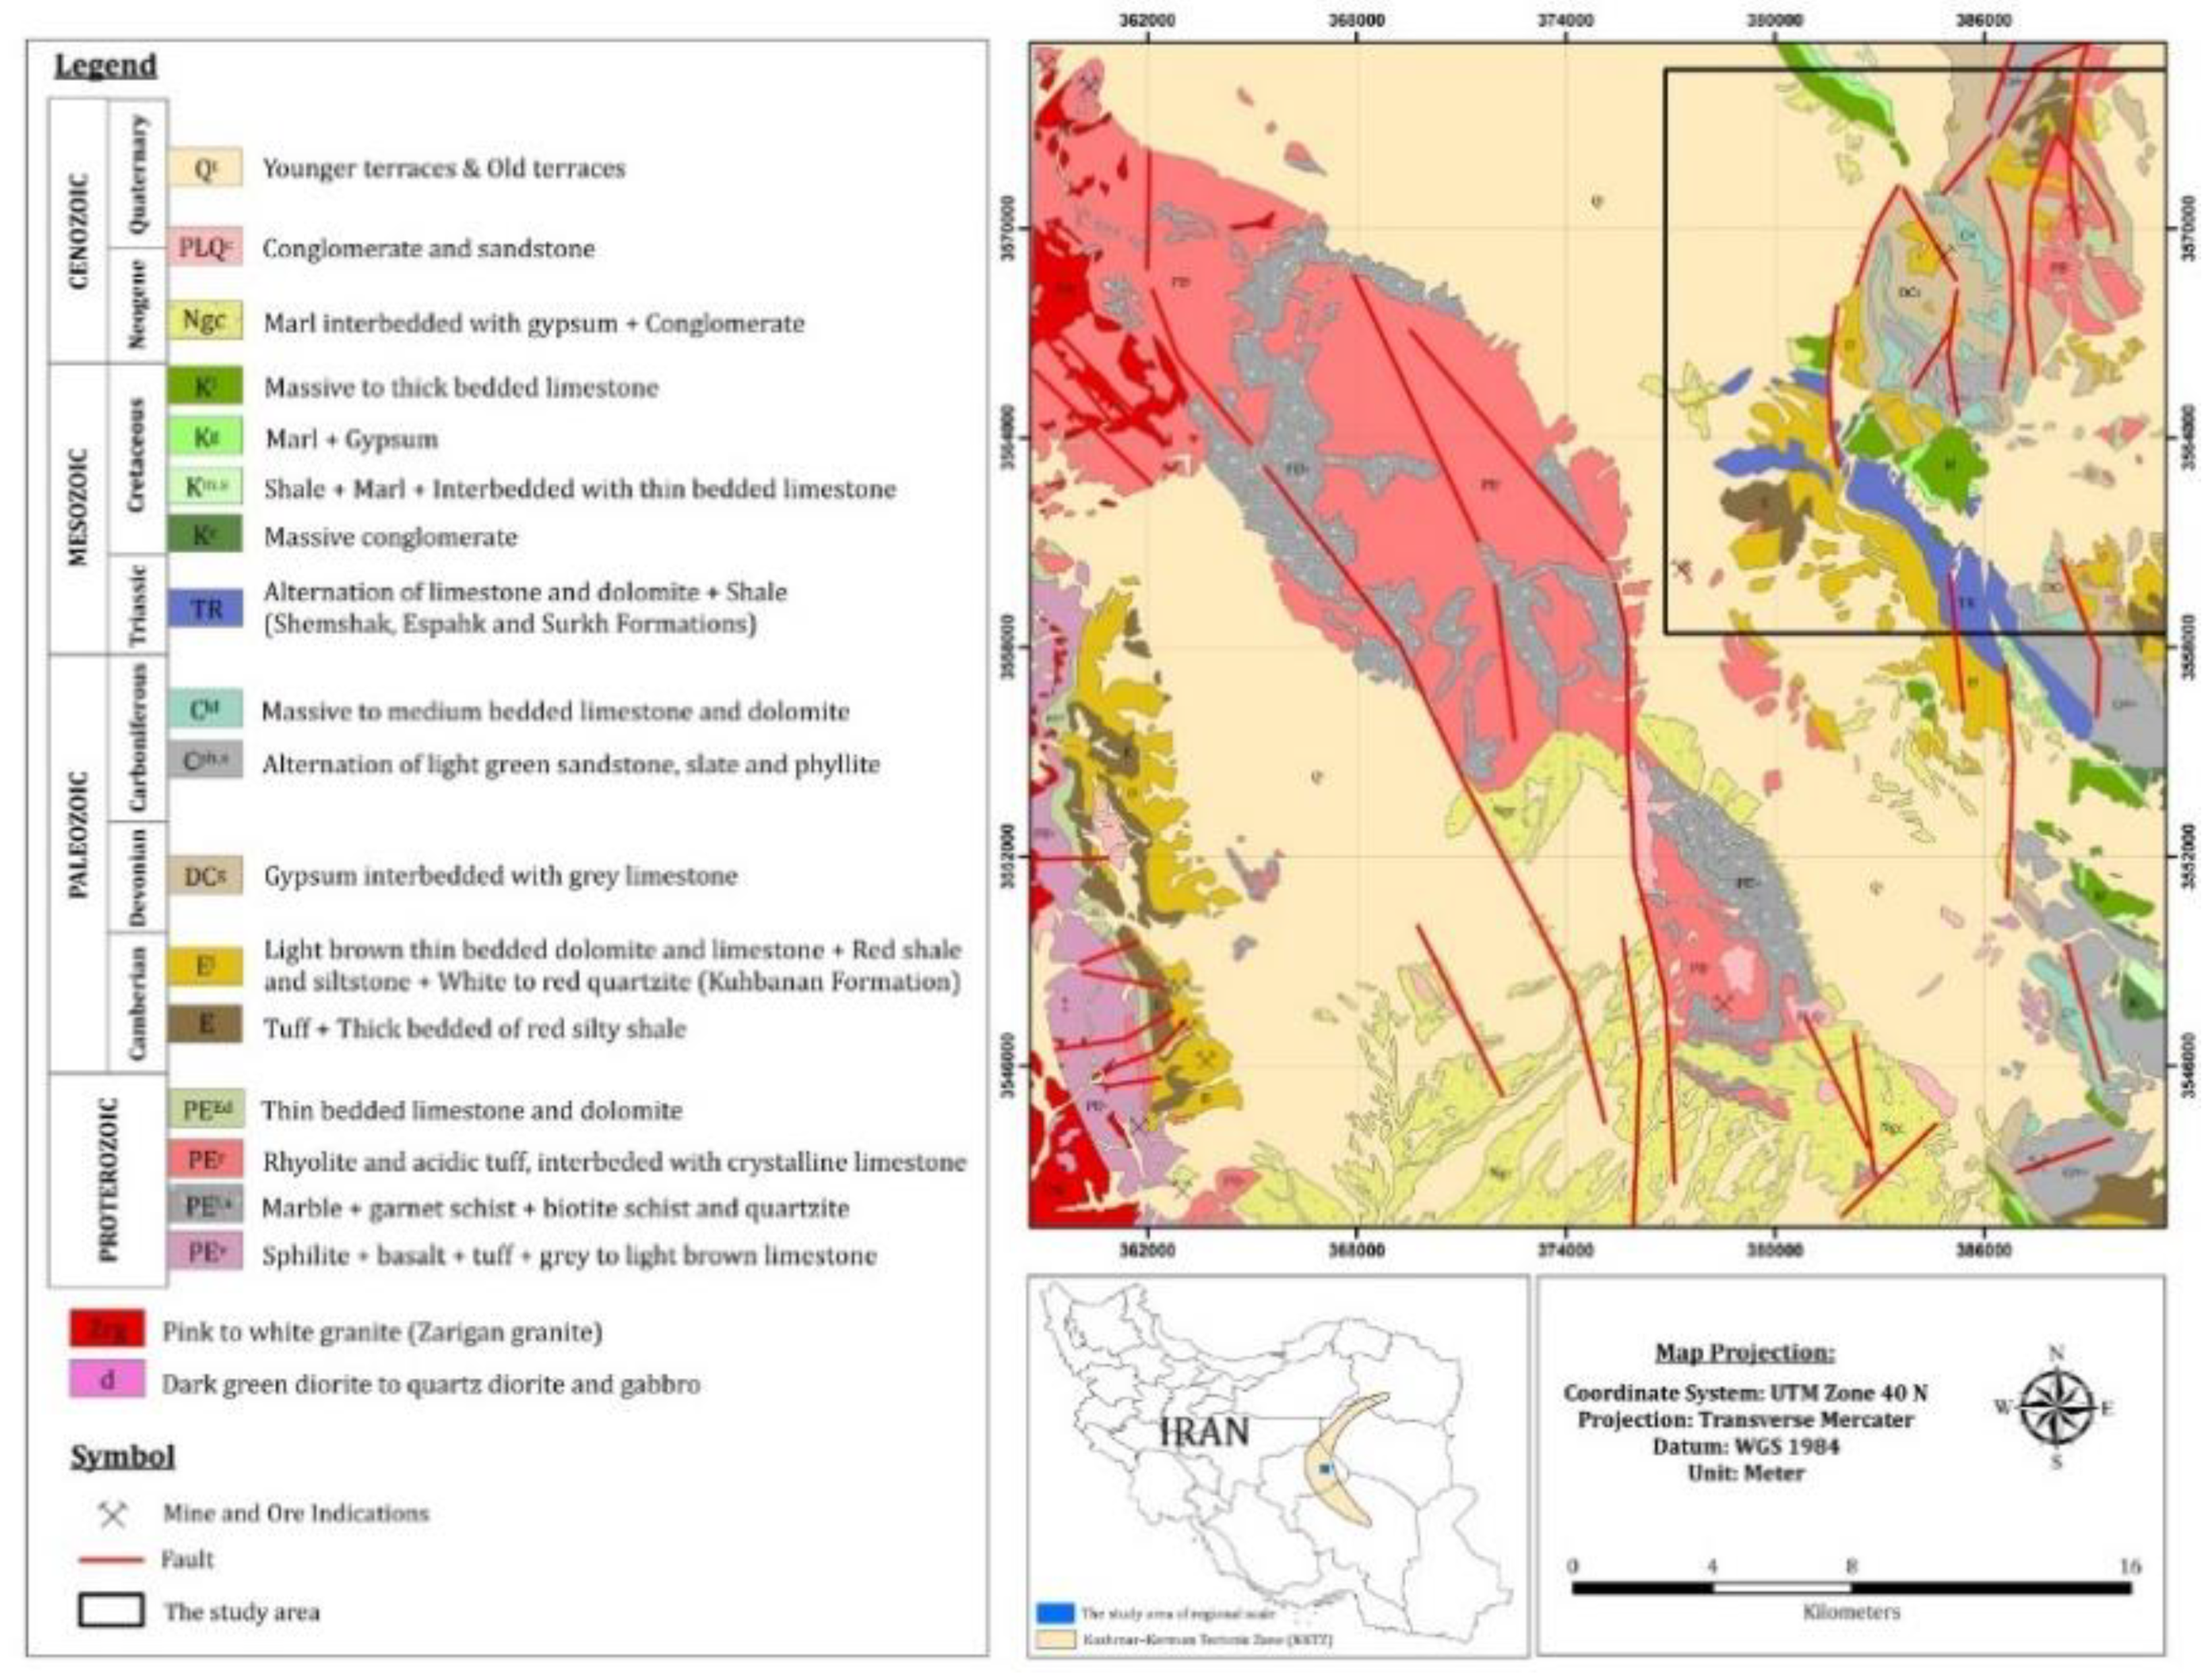
2. Geological Setting of the Study Area

Three fault systems are documented in the CIT area, including the Nayband and Nehbandan faults, Poshteh-Badam and Kalmard faults, and the Kuhbanan and Rafsanjan faults. The occurrence of magmatism in the area is associated with a back-arc extension zone [10]. The sediment-hosted Pb-Zn mineralization in the study area is formed during synchronous faulting activities with sedimentation, detrital sedimentation associated with faulting activities, the replacement of rhyolitic volcanic rocks, and the formation of rift sediments and subsidence [10].

3. Materials and Methods

3.1. Data Characteristics

ASTER and WV-3 were utilized in this analysis. ASTER has three bands in the visible and near-infrared (VNIR) region (0.52 to 0.86 μm), six bands in the shortwave infrared (SWIR) region (1.6 to 2.43 μm), and five bands in the thermal infrared (TIR) region (8.125 to 11.65 μm) with 15 m, 30 m, and 90 m spatial resolutions, respectively [11]. The ASTER strip size is 60 km. WV-3 has eight spectral bands in the VNIR wavelength region (1.24 m spatial resolution) and eight spectral bands in the SWIR region (3.7 m spatial resolution) with a strip size of 13 km [12]. An ASTER scene cloud-free level 1T product and level 2A WV-3 data covering the study area were processed in this study.

3.2. Image Processing

3.2.1. Principal Components Analysis (PCA)

PCA is a mathematical technique that transforms a quantity of correlated variables into a number of uncorrelated linear variables called PCs [13]. In this analysis, the PCA method was implemented based on covariance matrix to ASTER (VNIR + SWIR bands) and WV-3 (VNIR bands) for identifying hydrothermal alteration mineral assemblages in the study area. Table 1A,B shows the eigenvector matrix for the selected bands of the remote sensing datasets.

3.2.2. Fuzzy Logic Modeling

Fuzzy logic modeling was proposed by Zadeh [14]. It is a form of many-valued logic in which the truth values of variables can be any real number between 0 and 1, inclusive [15]. A fuzzy set A is a set of ordered pairs:
A = { ( x ,   µ A ( x ) )   |   x   ϵ   X }
where µA (x) is the membership function or membership grade of x in A. µA (x) maps x to the membership space (M), where M contains only the two points 0 and 1. The range of µA (x) is [0, 1], where zero expresses non-membership and one expresses full membership [14]. A set of fuzzy membership values is stated in a continuous series from 0 to 1.

3.2.3. Fieldwork Data and Laboratory Analysis

GPS survey, X-ray diffraction (XRD) analysis, and Analytical Spectral Devices (ASD) spectroscopy were carried out in the study area and performed on the samples collected from the main lithological units exposed, respectively.

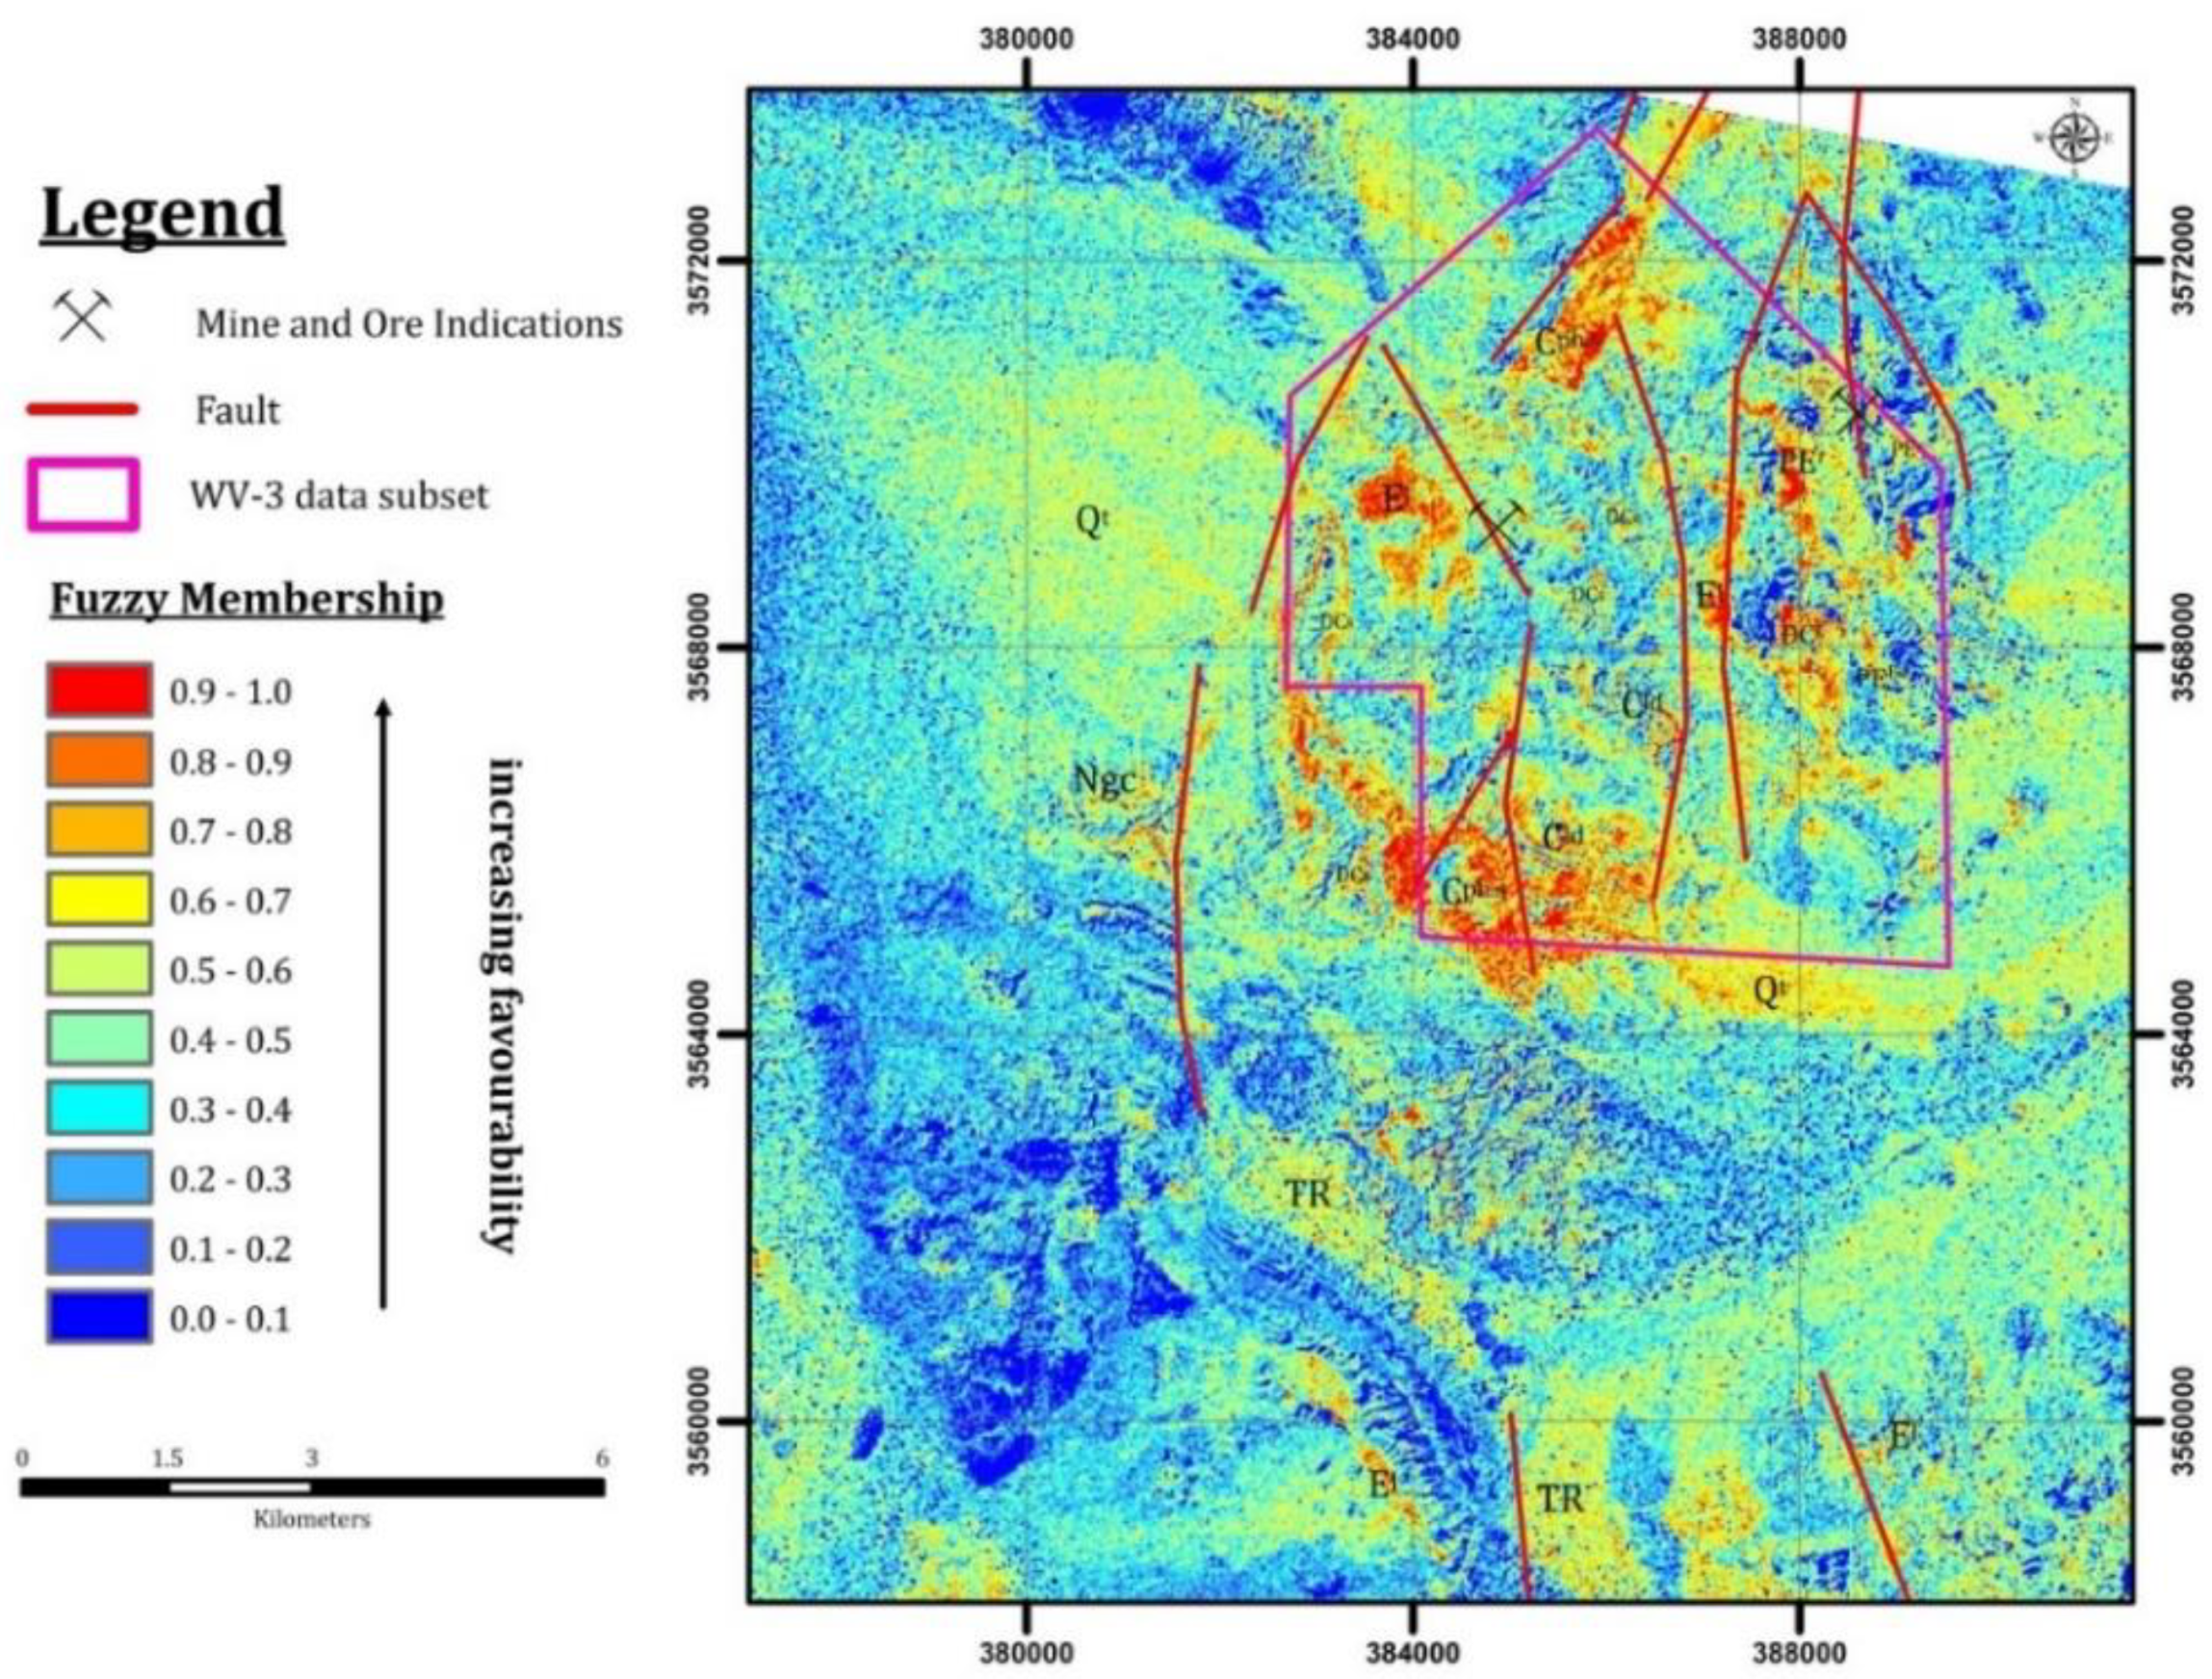
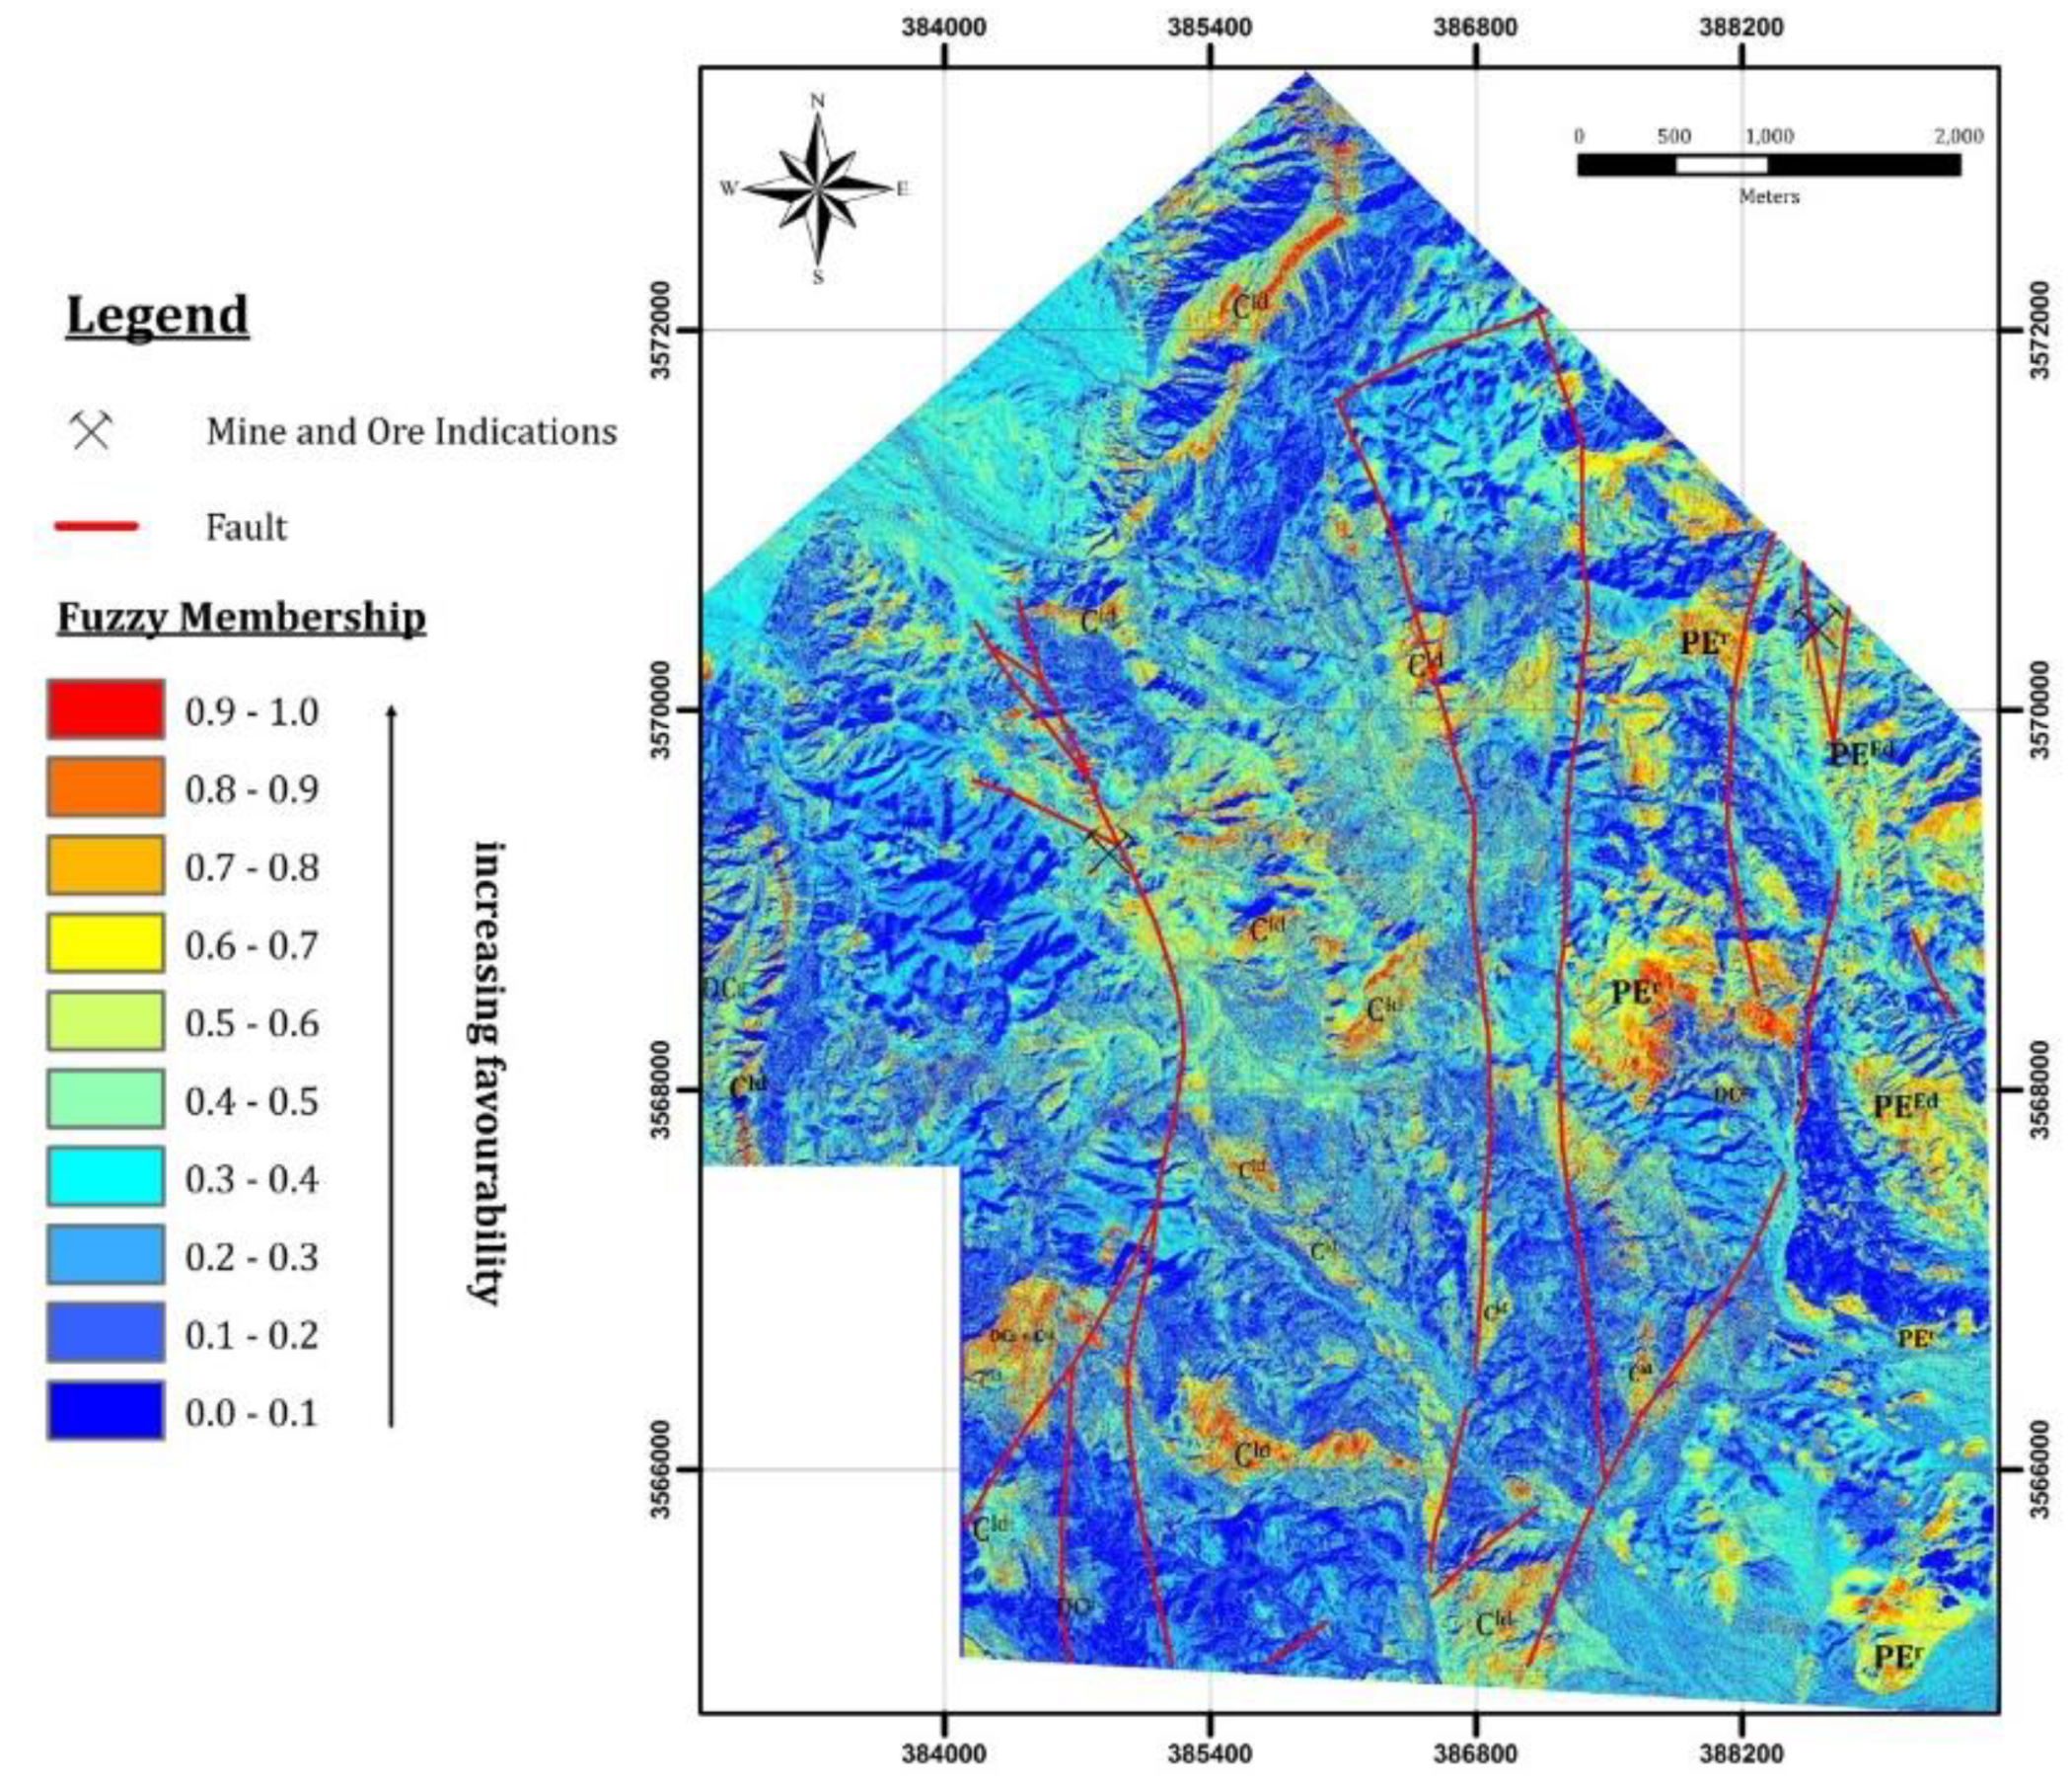
4. Results and Discussion

The PCA technique was also implemented on the spatial selected subset of ASTER for mapping alteration minerals. The eigenvector matrix for ASTER VNIR + SWIR bands is shown in Table 1A. The PC3 has 0.555288 loading in band 4 and −0.635404 loading in band 8. The chlorites and carbonate show high reflectance at about 1.6 μm (band 4 of ASTER), while showing absorption features at 2.350 μm (band 8 of ASTER) [16,17]. Therefore, the PC3 is considered here as a thematic layer. The PC4 has −0.657125 loadings in band 2 and 0.626671 loadings in band 4 (Table 1A). Iron oxide/hydroxide minerals are illustrated by strong absorption at 0.40 to 1.10 μm and reflection at about 1.60 μm [18]. Seeing the spectral location of bands 2 and 4 of ASTER, it can be seen that the PC4 image can be considered as a thematic layer. PC5 shows 0.544534 loading in band 4, −0.437342 loading in band 6, and −0.556429 loading in band 9 (Table 1A). The sulfate minerals display absorption features at 2.20 to 2.50 μm (Clark, 1999), corresponding to bands 6 to 9 of ASTER. Consequently, sulfate minerals can be mapped in the PC5 image as a thematic layer. Carbonate minerals have diagnostic CO3 spectral absorptions near 2.35 μm, which can be significantly used to identify carbonate-bearing rocks [19]. The carbonate minerals such as calcite and dolomite show distinctive narrow absorption features around 2.35 μm analogous to band 8 (2.295–2.365 μm) of ASTER data (Mars and Rowan, 2010). Thus, the PC8 image has information related to the spatial distribution of dolomite. PC8 has 0.469109 loading in band 4 and 0.336338 loading band 5, in addition to 0.870266 loading in band 7 (Table 1A). The PC8 image was also considered as a thematic layer.
The PCA statistical results for the WV-3 bands indicates that PC3, PC4, and PC6 can be considered as thematic layers for mapping iron-stained alteration, dolomite/Fe2+, and Fe3+ oxides, respectively. The PC3 has −0.598506 loading in band 2 and 0.661001 loading in band 5 (Table 1B) for mapping iron-stained alteration. PC4 shows 0.345377 loading in band 2 and 0.631659 loading in band 4 as well as −0.509311 loading in band 7 (Table 1B) for the identification of dolomite/Fe2+. PC6 contains −0.427799 in band 2 and −0.515988 loading band 3, as well as 0.646312 loading in band 5 (Table 1B) for mapping Fe3+ oxides.
Mineral prospectivity maps were produced from alteration thematic layers using a fuzzy-logic model (Table 2). The alteration thematic layers of ASTER were integrated using the fuzzy gamma operator (γ = 0.6) (Table 2). The ASTER prospectivity map shows the high value (0.7 to 1.0) of the favorability index as prospective zones (Figure 2). However, the highest value (0.9 to 1.0) of the favorability index can be considered as the high prospective zones for Pb-Zn mineralizations, which overlap with documented Pb-Zn occurrences alongside fault systems (Figure 2).
Figure 3 shows the prospectivity map derived from the alteration thematic layers of WV-3 data. The fuzzy AND operator was implemented to fuse the selected alteration thematic layers (Table 2). The highest value (0.8 to 1.0) of the favorability index was obtained for few parts, and a high value (0.6 to 0.9) of the favorability index was obtained in some parts of the study area. The Pb-Zn mineralization zones contain a high favorability index value (0.6 to 1.0) and also connect to fault systems at the local scale (Figure 3). Accordingly, the most favorable/prospective zones for Pb-Zn mineralization in the study area are in fault contact zones with impermeable lithological units.
Argillic alteration, sericitic zones, iron oxides, and dolomitization were during fieldwork. Several surface expressions of hematite, malachite, pyrite, galena, and sphalerite were observed. The surface expression of Pb-Zn mineralization was typically detected in the fault contact of dolomite with other lithological units in several parts of the study area. The XRD analysis revealed the presence of quartz, dolomite, calcite, muscovite, chlorite, gypsum, albite, illite, jarosite, and malachite. The ASD analysis for shale, gypsum, dolomite, and calcite was measured, and shows some typical absorption features about 1.40 μm attributed to OH/H2O stretching, 1.90 μm related to H2O stretching, 2.20 μm due to the combination of the OH-stretching fundamental with Al-OH bending mode (Al-rich phyllosilicates). The absorption feature near 2.20 μm is related to the S-O bending mode and there are absorption features related to Fe2+ at 0.9 to 1.2 μm and CO3 at 2.35 μm.

5. Conclusions

ASTER and WV-3 were processed to generate mineral prospectivity maps for the CIT area. The PC3, PC4, PC5, and PC8 of ASTER mapping the spatial distribution of Mg-Fe-OH/CO3 minerals, iron oxide/hydroxides, OH/S-O/CO3-bearing minerals, and dolomitization were considered as thematic layers. The PC3, PC4 and PC6 images of WV-3 identifying iron-stained alteration, dolomite/Fe2+, and Fe3+oxides were considered as thematic layers. The fuzzy-logic model was used to produce mineral prospectivity maps using alteration thematic layers, including the PC4, PC5, and PC8 layers of ASTER and PC3, PC4, and PC6 thematic layers of WV-3. As a result, the most favorable/prospective zones for Pb-Zn mineralization in the study area were identified, and can be considered for future exploration field campaigns.

Institutional Review Board Statement

Not applicable.

Informed Consent Statement

Not applicable.

Data Availability Statement

Not applicable.

References

  1. Govil, H.; Gill, N.; Rajendran, S.; Santosh, M.; Kumar, S. Identification of new base metal mineralization in Kumaon Himalaya, India, using hyperspectral remote sensing and hydrothermal alteration. Ore Geol. Rev. 2018, 92, 271–283. [Google Scholar] [CrossRef]
  2. Pour, A.B.; Hashim, M.; Hong, J.K.; Park, Y. Lithological and alteration mineral mapping in poorly exposed lithologies using Landsat−8 and ASTER satellite data: North-eastern Graham Land, Antarctic Peninsula. Ore Geol. Rev. 2019, 108, 112–133. [Google Scholar] [CrossRef]
  3. Pour, A.B.; Park, Y.; Crispini, L.; Läufer, A.; Hong, J.K.; Park, T.-Y.S.; Zoheir, B.; Pradhan, B.; Muslim, A.M.; Hossain, M.S.; et al. Mapping Listvenite Occurrences in the Damage Zones of Northern Victoria Land, Antarctica Using ASTER Satellite Remote Sensing Data. Remote. Sens. 2019, 11, 1408. [Google Scholar] [CrossRef]
  4. Pour, A.B.; Park, T.-Y.S.; Hong, J.K.; Muslim, A.M.; Läufer, A.; Crispini, L.; Pradhan, B.; Zoheir, B.; Rahmani, O.; Hashim, M.; et al. Landsat−8, Advanced Spaceborne Thermal Emission and Reflection Radiometer, and WorldView−3 Multispectral Satellite Imagery for Prospecting Copper-Gold Mineralization in the Northeastern Inglefield Mobile Belt (IMB), Northwest Greenland. Remote. Sens. 2019, 11, 2430. [Google Scholar] [CrossRef]
  5. Pour, A.B.; Park, Y.; Park, T.-Y.S.; Hong, J.K.; Hashim, M.; Woo, J.; Ayoobi, I. Regional geology mapping using satellite-based remote sensing approach in Northern Victoria Land, Antarctica. Polar Sci. 2018, 16, 23–46. [Google Scholar] [CrossRef]
  6. Pour, A.B.; Hashim, M.; Park, Y.; Hong, J.K. Mapping alteration mineral zones and lithological units in Antarctic regions using spectral bands of ASTER remote sensing data. Geocarto Int. 2017, 33, 1281–1306. [Google Scholar] [CrossRef]
  7. Pour, A.B.; Park, T.-Y.S.; Park, Y.; Hong, J.K.; Zoheir, B.; Pradhan, B.; Ayoobi, I.; Hashim, M. Application of Multi-Sensor Satellite Data for Exploration of Zn–Pb Sulfide Mineralization in the Franklinian Basin, North Greenland. Remote. Sens. 2018, 10, 1186. [Google Scholar] [CrossRef]
  8. Kim, Y.-H.; Choe, K.-U.; Ri, R.-K. Application of fuzzy logic and geometric average: A Cu sulfide deposits potential mapping case study from Kapsan Basin, DPR Korea. Ore Geol. Rev. 2019, 107, 239–247. [Google Scholar] [CrossRef]
  9. Rajabi, A.; Rastad, E.; Canet, C. Metallogeny of Cretaceous carbonate-hosted Zn–Pb deposits of Iran: Geotectonic setting and data integration for future mineral exploration. Int. Geol. Rev. 2012, 54, 1649–1672. [Google Scholar] [CrossRef]
  10. Samani, B.A. Metallogeny of the Precambrian in Iran. Precambrian Res. 1988, 39, 85–106. [Google Scholar] [CrossRef]
  11. Abrams, M.; Tsu, H.; Hulley, G.; Iwao, K.; Pieri, D.; Cudahy, T.; Kargel, J. The Advanced Spaceborne Thermal Emission and Reflection Radiometer (ASTER) after fifteen years: Review of global products. Int. J. Appl. Earth Obs. Geoinform. 2015, 38, 292–301. [Google Scholar] [CrossRef]
  12. Kuester, M. Radiometric Use of WV−3 Imagery; Technical Note; DigitalGlobe: Westminster, CO, USA, 2016; p. 12. [Google Scholar]
  13. Gupta, R.P.; Tiwari, R.K.; Saini, V.; Srivastava, N. A simplified approach for interpreting principal component images. Adv. Remote Sens. 2013, 2, 111–119. [Google Scholar] [CrossRef]
  14. Zadeh, L.A. Fuzzy sets. Inform. Control 1965, 8, 338–353. [Google Scholar] [CrossRef]
  15. Novák, V.; Perfilieva, I.; Močkoř, J. Mathematical Principles of Fuzzy Logic; Kluwer Academic: Dordrecht, The Netherlands, 1999; ISBN 978-0-7923-8595-0. [Google Scholar]
  16. Mars, J.C.; Rowan, L.C. ASTER spectral analysis and lithologic mapping of the Khanneshin carbonate volcano, Afghanistan. Geosphere 2011, 7, 276–289. [Google Scholar] [CrossRef]
  17. Mars, J.C.; Rowan, L.C. Spectral assessment of new ASTER SWIR surface reflectance data products for spectroscopic mapping of rocks and minerals. Remote. Sens. Environ. 2010, 114, 2011–2025. [Google Scholar] [CrossRef]
  18. Hunt, G.R.; Ashley, R.P. Spectra of altered rocks in the visible and near infrared. Econ. Geol. 1979, 74, 1613–1629. [Google Scholar] [CrossRef]
  19. Clark, R.N. Spectroscopy of rock and minerals and principles of spectroscopy. In Remote Sensing for the Earth Sciences: Manual of Remote Sensing 3; Rencz, A.N., Ed.; John Wiley Sons: New York, NY, USA, 1999; pp. 3–58. [Google Scholar]
Figure 1. Geological map of the study area (modified from the Chadormalo geological map, 1:100,000 sheet No:71, Geological Survey and Mineral Exploration of Iran (GSMEI)). The black rectangle delimits ASTER imagery.
Environsciproc 06 00008 g001
Figure 2. Mineral prospectivity map derived from selected ASTER alteration thematic layers.
Environsciproc 06 00008 g002
Figure 3. Mineral prospectivity map derived from selected WV-3 alteration thematic layers.
Environsciproc 06 00008 g003
Table 1. Eigenvector matrix derived from PCA for the selected bands of the remote sensing datasets used in this study. (A) ASTER bands (VNIR + SWIR); (B) WV-3 band (1 to 8 VNIR).
(A) EigenvectorBand 1Band 2Band 3Band 4Band 5Band 6Band 7Band 8Band 9
PCA 10.3063760.3541560.3579990.3739470.3279570.3511860.3127600.2948170.311584
PCA 2−0.506185−0.503027−0.3777100.1758560.2715550.2703020.2404920.2478160.226041
PCA 3−0.277958−0.0206330.2325130.5552880.1180130.231883−0.218093−0.635404−0.202253
PCA 4−0.123343−0.657125−0.6266710.6266710.2193780.135436−0.037673−0.233067−0.106928
PCA 5−0.005336−0.013068−0.0496880.544534−0.082811−0.4373420.1804060.400661−0.556429
PCA 60.269821−0.5165540.2331990.285564−0.309355−0.3657530.067872−0.1457240.518769
PCA 7−0.2094530.529334−0.4646170.294560−0.485018−0.017691−0.005474−0.0498710.367733
PCA 80.027679−0.0397070.0007250.4691090.336338−0.003040−0.8702660.4090420.160571
PCA 90.152864−0.2390130.0983480.029191−0.6326610.637281−0.0285380.205046−0.244409
(B) EigenvectorBand 1Band 2Band 3Band 4Band 5Band 6Band 7Band 8
PCA 1−0.314986−0.330951−0.348156−0.359256−0.364601−0.367182−0.369097−0.370119
PCA 20.6559260.4545100.183457−0.046042−0.154854−0.251952−0.320189−0.370709
PCA 3−0.331273−0.5985060.354295−0.1296460.661001−0.2207960.3414200.108973
PCA 4−0.2449610.3453770.1455610.6316590.0122670.368220−0.509311−0.142316
PCA 5−0.3846330.2791510.433976−0.0928080.081588−0.370014−0.1425440.187618
PCA 60.236442−0.427799−0.515988−0.0656700.6463120.2487150.0432570.095274
PCA 70.257771−0.301701−0.070317−0.3890550.4716940.225588−0.4276910.035215
PCA 80.174655−0.5609470.307690−0.163685−0.3327550.1088190.068151−0.001993
Table 2. Fuzzification parameters for the thematic layers.
Data OriginInput LayerDetectionMembership TypeFuzzy Operator
ASTER DatasetPC4Iron oxide/hydroxide mineralsLinearGamma
(γ = 0.6)
PC5OH/S-O/CO3-bearing minerals
PC8Dolomite
WorldView-3 DatasetPC3All iron oxidesLinearAND
PC4Dolomite/Fe2+ oxides
PC6Fe3+ oxides
Publisher’s Note: MDPI stays neutral with regard to jurisdictional claims in published maps and institutional affiliations.

