1. Introduction
Pellets are important feedstock for the production of plastic items [
1]. They are typically less than 5 mm in size with a regular round or ovoid shape [
2] and can be mistaken for food by marine organisms including birds, fish and crustaceans [
3,
4,
5]. Spillages of microplastics, particularly during transportation and in loading and offloading areas [
6], make them available to organisms in the marine environment.
The consumption of pellets has been reported to result in adverse effects, including intestinal blockages, which lead to nutrient deficiency [
7,
8]. Pellets have been found in commercially important fish, e.g., king mackerel (
Scomberomorus cavalla) and the Brazilian sharpnose shark (
Rhizoprionodon lalandii) [
9]. Due to their size, pellets have a large surface-area-to-volume ratio, which is associated with increased sorption of compounds, including metals [
10,
11,
12], and they may act as vectors of toxins [
13,
14]. They may also contribute to the bioaccumulation of environmental toxins, also known as contaminants, up the foodweb. This is particularly so if they can absorb contaminants, such as metals, in higher than background concentrations. Although some metals are required by the body in trace amounts, all metals have the potential to be toxic to organisms in high concentrations [
15]. Metals behave differently in different organisms, and most metals tend to bind with ligands through either sulphur or oxygen as donor atoms [
16]. As a result, metals can be accumulated by organisms in high concentrations [
17].
Nonetheless, the rate of metal enrichment on pellets is not well investigated. Although pellets have been generally reported as being inert [
18,
19], Ashton, Holmes, and Turner [
12] found evidence of metal accumulation on pellets at concentrations up to 10 times the background level for some metals, which highlighted the possible role of pellets as metal conduits in the marine ecosystem. In industrial areas, such as harbours, where background metal concentrations are high [
20], pellets can potentially accumulate metals at high concentrations. Information in the literature on pellet concentrations in Durban Harbour is limited to one publication in which microplastics concentration in the sediment and water column was reported [
21].
A storm event in October 2017 when 49 tons of pellets were spilled in Durban Harbour, South Africa [
22] offered the opportunity to monitor the accumulation of metal on pellets over a period of 6 months. This study was conducted at Wilson’s Warf in Durban Harbour (
Figure 1), close to where the spill occurred. This part of the harbour is used mainly for recreational purposes as it is close to restaurants and is accessible to informal fishermen.
After the spill, beached pellets were visible along the strandline in Durban Harbour, exceeding 100 m
−2 in most places. The spill thus provided material that was easily collectible (because of quantity), had a specific known date of immersion, and stayed in the area for a prolonged period. Since pellets had also been collected before the spill, there was an opportunity to investigate and compare the rate of metal accumulation in newly deposited pellets and older pellets of unknown immersion time. Furthermore, few studies on the time-integrated accumulation of metals in pellets have been reported globally [
9].
2. Materials and Methods
Following the pellet spill in Durban Harbour, pellets were collected from Durban Harbour every month from October 2017 to March 2018 using latex gloves and Ziploc bags. Pellets collected prior to September 2017 during regular clean-up events were used as aged pellets, and visibly degraded pellets were specifically chosen for comparison. Pellets were air-dried and kept at room temperature (19 to 28 °C). New and aged pellets were stored separately in clean centrifuge tubes pending use for the analyses. Pellets recovered after the spill were mainly white discs with a primary diameter of 5 ± 0.5 mm and mass averaging at 24 ± 1.3 mg.
Sediment used in toxicity testing was collected sub-tidally in Durban Harbour. In the laboratory, samples were sieved using a 500 µm mesh to remove extraneous particulate matter. Three replicate samples were collected over a six-month period to a depth of 10 cm using a single metal corer with an internal diameter of 50 mm. This was performed to determine the temporal influence on metal concentration in Durban Harbour sediment. After collection, the sediment was stored in plastic containers, which were acid-washed prior to use at 4 °C. Prior to use in the toxicity tests, sediment was left at room temperature for a minimum of 24 h to return to room temperature.
Aged samples were mainly discs and cylindrical but were yellowing/browning with time. Primary diameters ranged from 1 to 6 mm. Analysis of randomly selected pellets (
n = 7) by Fourier transform infrared (FTIR) photo-acoustic spectroscopy (Bruker IFS 66 FTIR coupled with an MTEC 300 photoacoustic cell) confirmed that pellets collected after the spill were polyethylene (
Table 1) (
Figure 2) with matching frequency peaks to pure polyethylene under FTIR. The samples were analysed as received, without previous treatment. The analyses were performed in triplicate and used the average spectra (4000–450 cm
−1). For comparison purposes, non-polyethylene pellets were excluded from this study. (With dented of cracked pellets, there was browning wherever there were cuts/dents, but whole pellets were not cut to expose the interior of the pellet, i.e., digestions were conducted on whole pellets).
2.1. Experimental Methods
After being air-dried, aged and newly spilled pellets were measured (
Figure 3) and weighed. Metal digestion of three replicate pellets collected each month was conducted following [
24]. Concentrated sulphuric/nitric acid (H
2SO
4/HNO
3) digestion at a ratio of 1:3 was Twyman [
24] used to digest one gram of pellets. Sulphuric acid 60% (3 mL) was added to a glass beaker containing pellets and then placed on a hotplate until it volatilised and reduced to 0.5 mL. A watch glass was placed on top of the beaker to avoid foaming during heating. Thereafter, 10 mL 55% nitric acid was added. Heating continued until the pellet dissolved or a clear solution appeared.
Pellet samples were then removed from the hotplate and placed under a fume hood for 5 min to cool down. The sample was filtered through 0.45 µm nylon syringe filters of 25 mm diameter into a 25 mL volumetric flask. The total volume was made up to 25 mL using double distilled water. Thereafter, 15 mL of the solution was transferred into polypropylene vials with screw caps and refrigerated at 4 °C until further analysis.
2.2. Metal Analysis
Samples were analysed for Al, Pb, Cd, Cr, Co, Fe, Cu, Mn, Ni, and Zn using an Inductively Coupled Plasma-Optical Emission Spectrometer (Perkin Elmer_ OptimaTM 5300 with Dual View, Billerica, MA, USA). Fifteen mL solution was pumped in full quantitative mode at 2.5 mL−1 through the mini column where the analyte was retained. When the injection valve was switched, a stream of 1 mol L−1 hydrochloric acid flowing at 1.5 mL min−1 eluted the metal retained. The eluate was taken directly into the nebulizer system of the ICP-OES, and the analytical response was recorded as the peak height. Blanks were run after every 10 samples. Toronto Harbour Sediment (TH-2) certified reference materials were used to test for the analytical efficiency of Cu and Zn. Three of the most sensitive analytical wavelengths were considered, and the one that produced optimum (within 10%) certified reference material (CRM) results was finally selected for the analysis.
The surface characteristics of selected pellets were examined by scanning electron microscopy–energy-dispersive X-ray spectroscopy (SEM–EDS). Pellets were sputter-coated with a thin film in an EMITECH K 450X high vacuum gold-coating unit before being attached to the SEM with adhesive tape. Samples were photographed using a JEOL JSM-6100 operated at 20 kV. Qualitative elemental analysis was performed using an Oxford Instruments Inca 200 system. ANOVA was used to determine differences in metal concentrations between months and between newly added and aged pellets.
Enrichment factors (EF) were computed for each date using Equation (1):
where (Me)p and (Me)s represent the
w/
w concentrations of a metal in the composite pellet sample and sediment, respectively, and Aluminium (Al) is used to normalise for particle grain size effects or the extent of Al coverage of the plastic.
3. Results
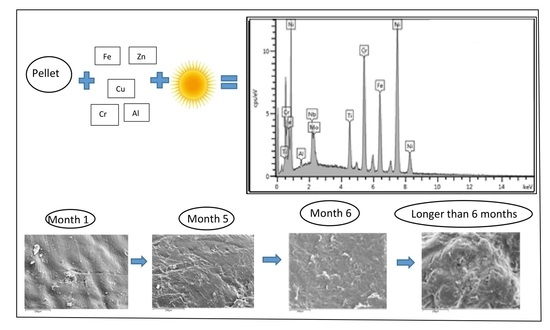
Scanning electron microscopy indicated that pellets collected within one month of the spill appeared to have a relatively smooth surface with minor imperfections, whereas beached pellets collected before the spill were notably degraded, exhibiting crevices with entrapment of particulate matter (
Figure 4). The SEM showed aged pellets to have cracks (
Figure 4A) while newer pellets appeared smooth with little or no abrasion (
Figure 4B). After five months in the environment, pellets showed signs of surface abrasion (
Figure 4C), and at six months, the surface of the pellets showed signs of deterioration (
Figure 4D). Aged pellets also showed what appeared to be diatoms (
Figure 5A), and bacterial/fungal growth on the surface of the plastic was noted after two months of exposure to the environment (
Figure 5B). Bacterial growth seemed to increase considerably from November, the second month of exposure, to February (
Figure 5B,C). After six months, both bacterial infestation and pellet deterioration were evident (
Figure 5D). EDS spectra of pellets (
Figure 5D) showed high concentrations of metal in newer pellets compared to aged pellets, possibly as a result of increased biological infestation on the surface of the plastic.
Metal concentrations in sediment and their standard deviations were within 10% of certified metal concentrations from Toronto (
Table 2). Except for Fe, metal concentrations were found to be greater in pellets (
Table 3) than in the sediment (
Table 4) for all months. While this was expected, metal concentration in pellets was still within an order of magnitude of sediment concentrations (
Table 4). In the case of Fe, November–January showed metal concentrations in sediment exceeding concentrations in pellets. The overall metal concentration was higher on pellets collected prior to the spill than after the spill. Metal concentrations were found to increase with time on micropellets, but metal equilibrium in pellets had not been reached by the end of the 6-month exposure period. ANOVA results showed no significant difference in metal concentrations between months (
Table 5); however, there was a significant difference between aged and newly introduced pellets (
Table 6).
Metal concentrations in pellets showed no linear increase over time. The highest concentrations of Aluminium, Chromium, Iron, and Zinc were measured on pellets collected within the first month of the spill (October), and for Copper, the highest concentration was from pellets collected a month after the spill, in November.
Values of Enrichment Factors shown in
Table 4 indicate clear enrichment of pellets for some metals but no enrichment for others, including those pellets collected prior to the spill. Although ten metals were tested for in this study (Al, Pb, Cd, Cr, Co, Fe, Cu, Mn, Ni, and Zn), only five are reported (Al, Fe, Cr, Zn and Cu) as the rest were not detected in this part of the harbour. ‘The concentration of metal in different points of the surface of the pellets was not controlled. The differences found could, therefore, be due to non-homogeneous distribution of the contaminants.’
Table 3 shows the temporal variation of metal accumulation in sediment, highlighting that sediment concentration of metals is not consistent, which may also affect metal accumulation in pellets over time.
4. Discussion
The FTIR confirmed that the pellets used in this study were made of polyethylene, which is a polymer used in 80% of pre-production plastic [
25]. The findings of this study are, therefore, important in understanding the potential of a large proportion of plastic debris to accumulate trace metals. Pellets in Durban Harbour accumulate some metals in higher concentrations than background sediment concentrations. Chromium and iron, however, did not accumulate on pellets. This may be attributed to Cr being available only in trace amounts in the Durban Harbour sediments, thus leading to minimal accumulation in pellets. While iron is found in high background concentrations in sediments, it is also one of the key reactive elements in marine sediments and is highly subject to phase transformations by redox processes [
26,
27], which may impair its rate of accumulation on pellets. Holmes, Turner, and Thompson [
13] similarly found metal concentration to be higher in pellets than in sediment. Ashton, Holmes, and Turner [
12], however, found metal concentration in extraneous materials, which included sediment and fungal fragments, to be higher than that in pellets. The authors attributed their findings to the larger surface-area-to-volume ratio in extraneous material as compared to pellet polymers. Due to their relatively smooth surface, virgin pellets are not expected to reach high metal concentrations. Fotopoulou (2012) found the high accumulation of metals in virgin pellets to be surprising as the plastic polymer surface exhibits no inherent acid-base properties. Once in an aquatic medium, however, plastic polymers are likely to acquire a charge more rapidly [
28]. The high affinity of metal to virgin pellets in this study may be attributable to the polarity of their surface. This, however, does not necessarily result in stable metal accumulation. With aged pellets, increased accumulation of metals in pellets becomes more important than with virgin pellets [
28].
Apart from Cr and Fe, metals reported in this study showed high concentration in pellets shortly after the spill, and then a decrease was noticed, which was subsequently followed by a more gradual increase in metal concentration. It is unclear whether metal concentration on the pellet was originally high or whether there may have been accumulation shortly after the spill. It is evident, however, that metal concentration in pellets did not follow a linear pattern in this study. This finding may suggest that once equilibrium with the water or sediment is reached, metal adhesion on pellets slows down or even reverses. Although there was no significant difference in pellet metal concentrations between monthly samples, the significant difference of metals between aged and newly introduced pellets suggests an increase in the metal accumulation with time. The high metal concentration in pre-spill pellets, however, suggests that metals may accumulate in pellets over prolonged periods. According to Öz, Kadizade, and Yurtsever [
29], the sorption of metals to microplastics may be influenced by the physical properties of microplastics, the size of pores and surface area. Plastics may sorb and desorb metals over time, and the hydrophobicity of plastic polymers and large surface area influence metal susceptibility in microplastics (Munier and Bendell [
30]). For these reasons, concentrations of metals on plastic debris in the marine environment increased over time without reaching a saturation concentration even after 12 months (Rochman, Hentschel and Teh [
31]). With time, however, other factors, such as biofouling, may result in loss of metal from the surface of the pellet, a process referred to as desorption by Munier and Bendell [
30]. Thus, plastic polymers may act as both a sink and a source of metal. Furthermore, over prolonged periods, deterioration of the pellet results in increased surface area, which may allow for accumulation to once again take place for some metals.
Aged pellets tend to have a larger surface area than virgin pellets as a result of cracks and crevices formed from plastic degradation [
13]. Because of their hydrophobic nature, pellets tend to attract other hydrophobic compounds [
32], such as some metallic compounds. Unlike with fragmented microplastics, the surface of virgin pellets is initially very smooth [
2], which might make it difficult for metals to accumulate on their surface. The highest recorded concentrations in pellets remain those of aged pellets, i.e., pellets collected before the spill.
When grooves and crevices develop, they cause the metal accumulated in the pellets to be less likely to desorb from the plastic toward aqueous material [
12]. Furthermore, biofouling may have also played a role in decreased surface metal concentration on pellets, as a higher diatom presence and bacterial growth were also observed on the surface of pellets with increased exposure in the environment. While Turner and Holmes [
28] attributed the decrease in metal adsorption in pellets to biofouling, the accumulation of metals on the surface of the pellet may also be caused by increased surface area and may have contributed to the increase in surface metal concentration in pellets. Holmes, Turner and Thompson [
13] also reported on the interactions of metals with virgin and aged pellets and concluded that short-term metal sorption is attributed to organic matter, while long-term metal accumulation in pellets incorporated the ageing of the pellet. Considering the enrichment factor equation, deviation of Al-normalised trace metals from a unit value (1) suggests that metal accumulation by pellets is not only a result of adherence or absorption of background metals on pellets (at least when beached), i.e., other factors such as biofouling can also play a role. The mechanism of metal absorption in microplastics can all contribute to increased metal accumulation in pellets [
33,
34,
35]. Although both Cu and Zn, which both showed enrichment on pellets, are essential in organisms, they can be harmful in high concentrations (Callow, 1995). The results of this study raise concern that the accumulation of Cu and Zn in pellets may be reflective of other micro and macroplastics ability to concentrate and transport these metals in the marine environment. The type of bacterial/fungal strains coating these plastic polymers is unknown, which may pose a threat to the natural biodiversity within the harbour, particularly if the bacterial strain is invasive such as
Geosmithia morbida and Raffaelea lauricola [
36,
37]. Furthermore, in a high-nutrient medium, excess bacterial growth may cause eutrophication and may also negatively affect the existing biodiversity. This can further impact the already degraded ecological status of Durban Harbour. Metal concentrations in pellets recorded prior to the spill all showed concentrations higher than those recorded after the spill in all samples. This suggests that after six months of this study, an equilibrium in metal concentration had not been reached in pellets.
Pellets, therefore, are an apparent challenge to the ecological health of Durban Harbour and can contribute to increased metal toxicity over prolonged exposure. Policy makers and management of the harbour should take proactive measures to address the plastic pandemic in the harbour and to ensure that there are policies in place to deal with similar crises in future. The role of biofouling on the degradation of plastic may be an interesting question for future studies, given that degradation and biological growth seem to occur concurrently.


