1. Introduction
Determining the mechanical properties of heterogeneous rock mass presents a major challenge in rock mechanics. Heterogeneous rock mass consists of two or more lithological members that have different properties. A limited number of studies have examined the mechanical properties of the heterogeneous rock mass that have dealt with examining uniaxial compressive strength (UCS) of composite samples. Tziallas et al. [
1] were the only ones who conducted a triaxial test for only one volumetric participation of the weaker rock material.
Tziallas et al. [
1] investigated flysch formations composed of sandstone and siltstone. Based on the proportion of certain lithological members in the rock mass, they formed composite samples of a certain ratio of sandstone and siltstone and simulated the actual condition in the rock mass in the laboratory. Duffault [
2] published the study about modeling and simulation of heterogeneous rock mass by introducing the new term, “sandwich” (individual or multiple) rock mass. Goodman [
3] emphasized in his book that rock materials that consist of at least two lithological members and have different geomechanical properties are, in fact, the complex geotechnical problem. On the other hand, Z. Mohamed et al. [
4] were the first ones who recently investigated UCS on composite samples. This study includes composites of sandstone and shale aimed at simulating tropical conditions that rule the area. Composite samples with the 10%, 20%, and 30% participation of weaker material of the overall sample height were prepared for the study, while gypsum was used as a bonding material between rock material discs. Liu et al. [
5] examined composite samples comprised of rocks with different strengths and coals to determine the strength of the pillars of underground facilities formed in the rock mass. In their study, Berisavljević et al. [
6] investigated how the strength of composite samples composed of sandstone and siltstone for building slopes on the state highway is changing. Liang et al. [
7] were doing laboratory analysis on natural samples in layers consisting of salt rock and anhydrite to estimate the strength of rock material for building the storage of liquids, gases, and solid waste material. Greco et al. [
8] investigated composite samples that contained different combinations of granite, marble, and limestone from Vicenza, from which the pillars and walls of the Cathedral were built to define strength parameters and mechanism of failure. Intact rock properties
σci and
mi for homogeneous rock mass should be carefully considered. Using the hard rock properties to determine the overall strength of the rock mass is not appropriate. On the other hand, using the intact properties of the weak rock is too conservative as the hard rock skeleton certainly contributes to the overall rock mass strength. Marinos and Hoek [
9] suggested proportions of intact strength parameters
σci and
mi for estimating heterogeneous rock mass properties. Marinos [
10] suggested modified proportions of values for heterogeneous rock types to be considered for the “intact rock” properties (
σci and
mi) determination based on Marinos and Hoek [
9].
This study aims to investigate the influence of variations in the volumetric participation of weaker rock material on the strength parameters of a heterogeneous rock mass, based on the results of laboratory tests of UCS and triaxial test of composite samples. This paper presents the methodology for determining the mechanical properties, UCS, and triaxial compressive strength or triaxial test on many composite samples with different participation of weaker rock material—altered dacite.
2. Geological Settings and Materials
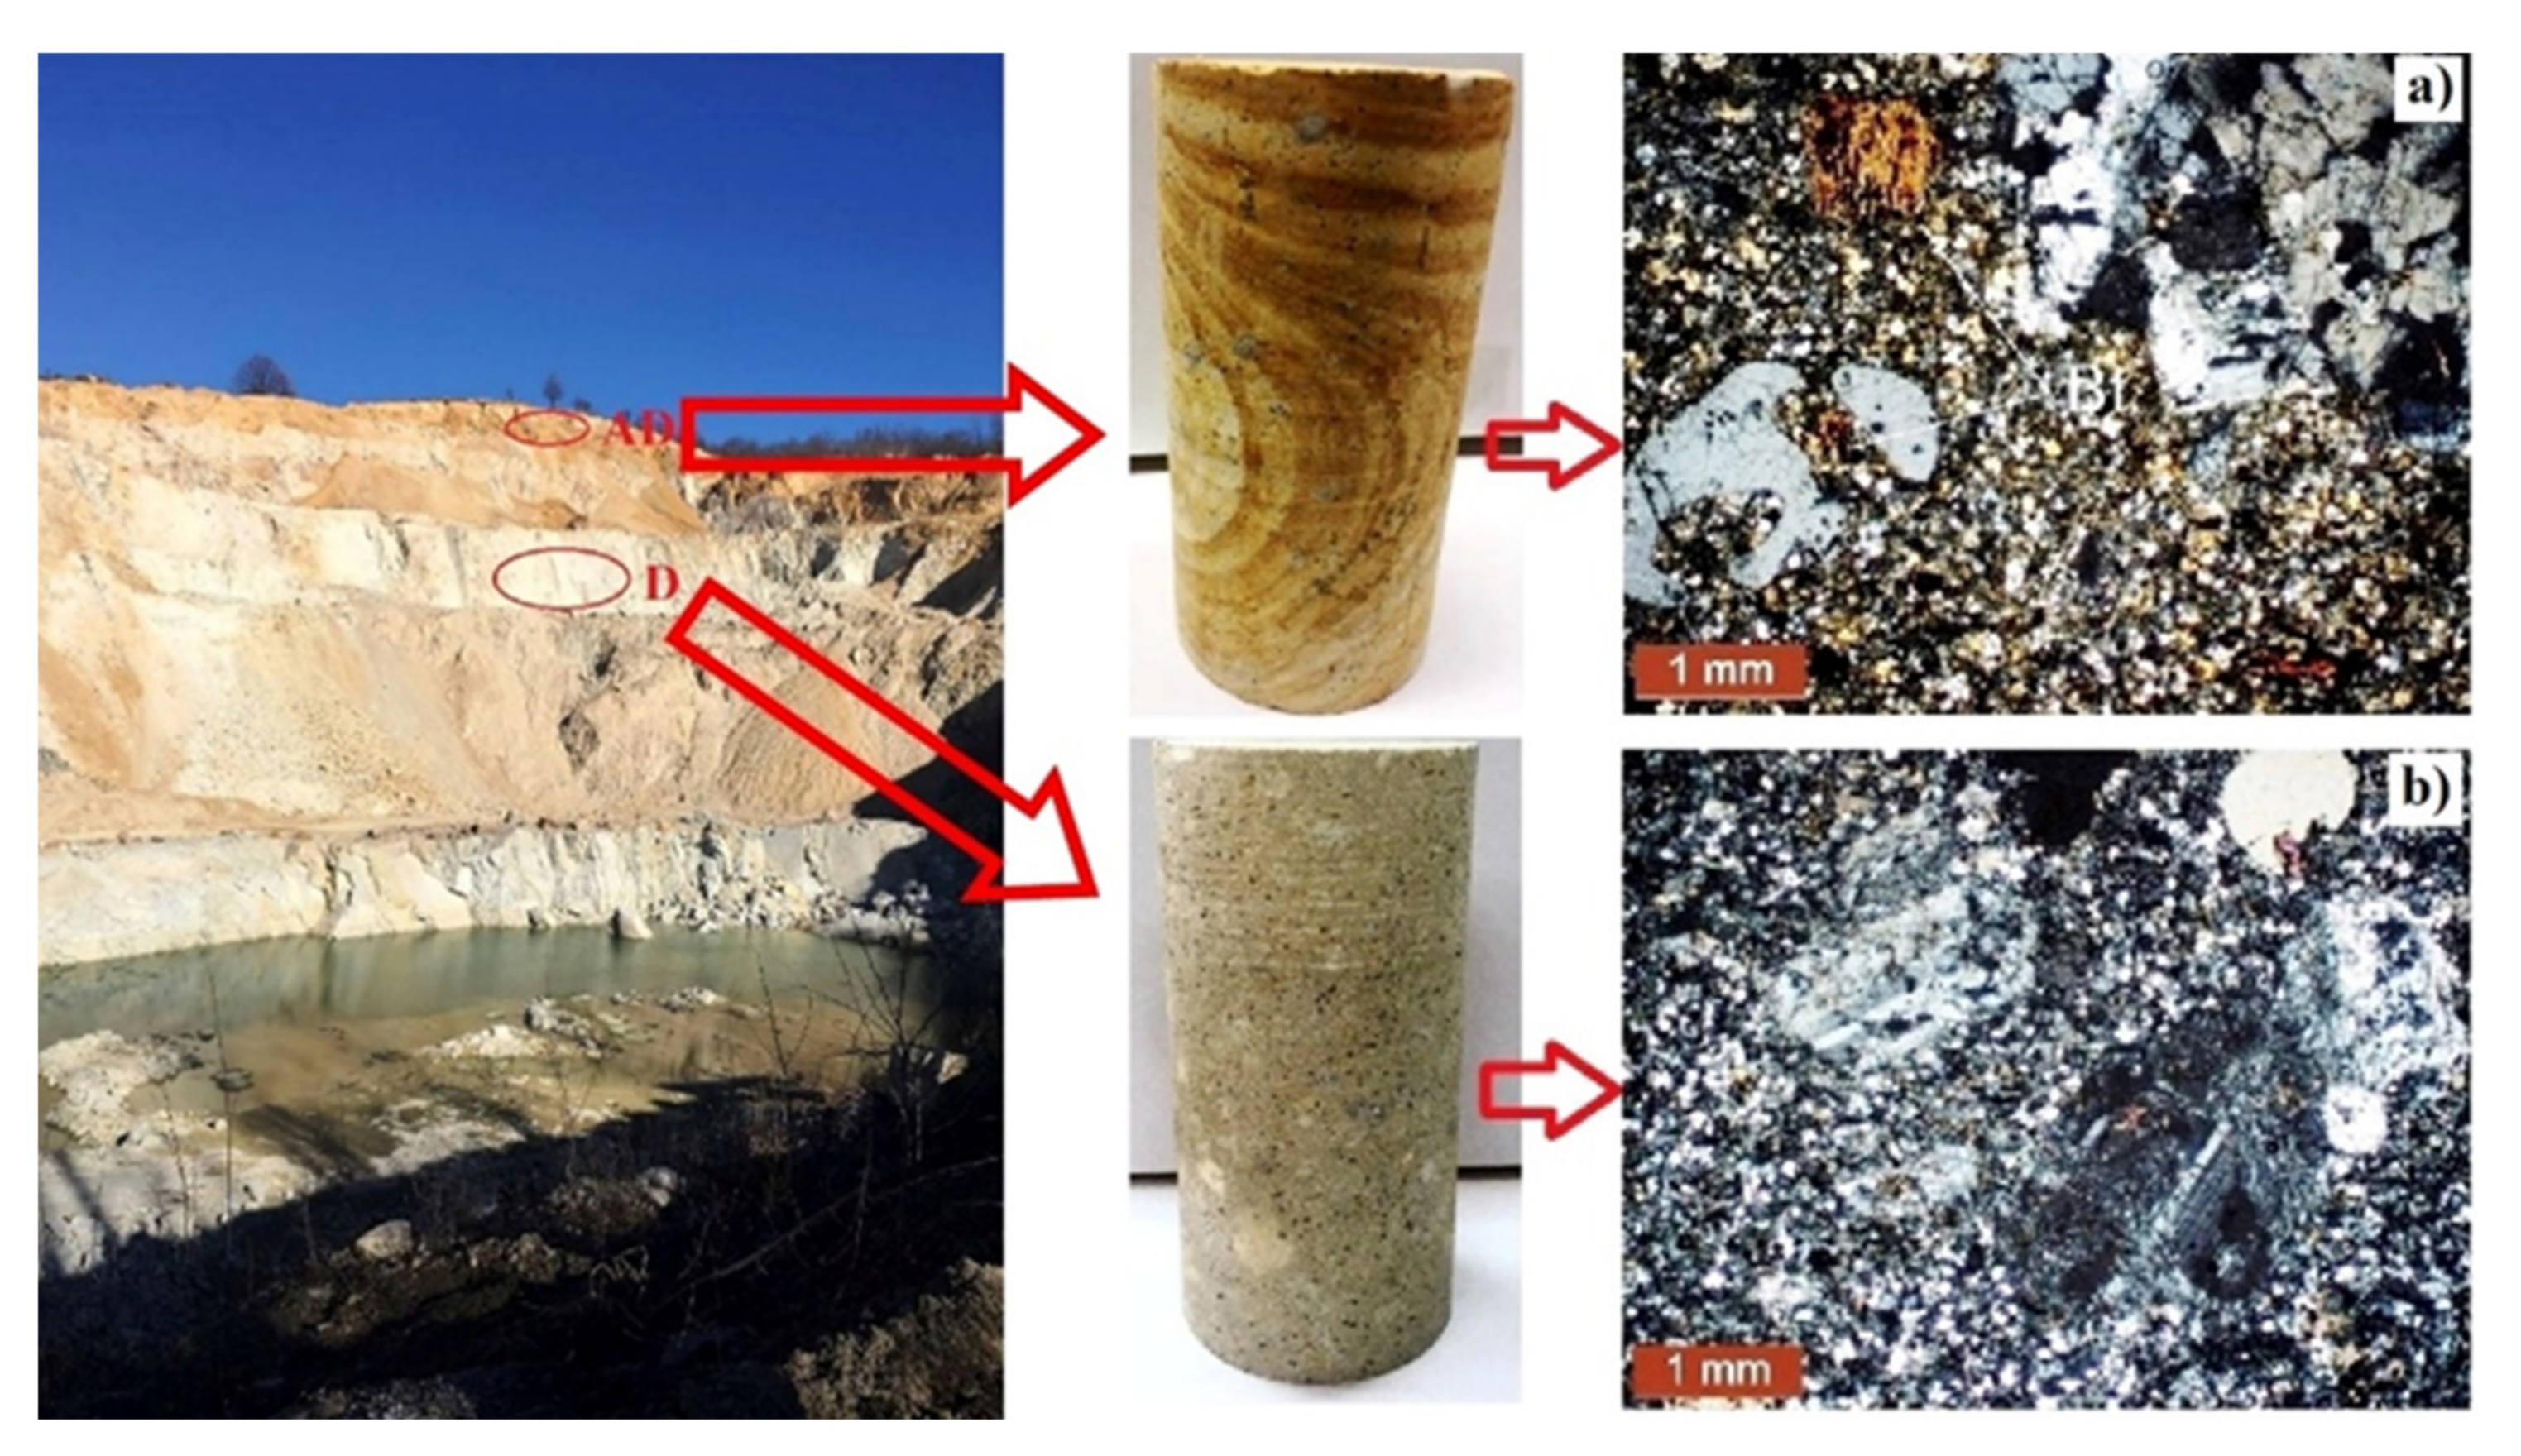
Dacite deposit, “Ćeramide,” belongs to the Rudnik–Ljig volcanic area, within which three larger masses of effusive rocks have been isolated. However, Sarmatian quartzite-dacite effusive with accompanying pyroclastics predominates within the volcanic area [
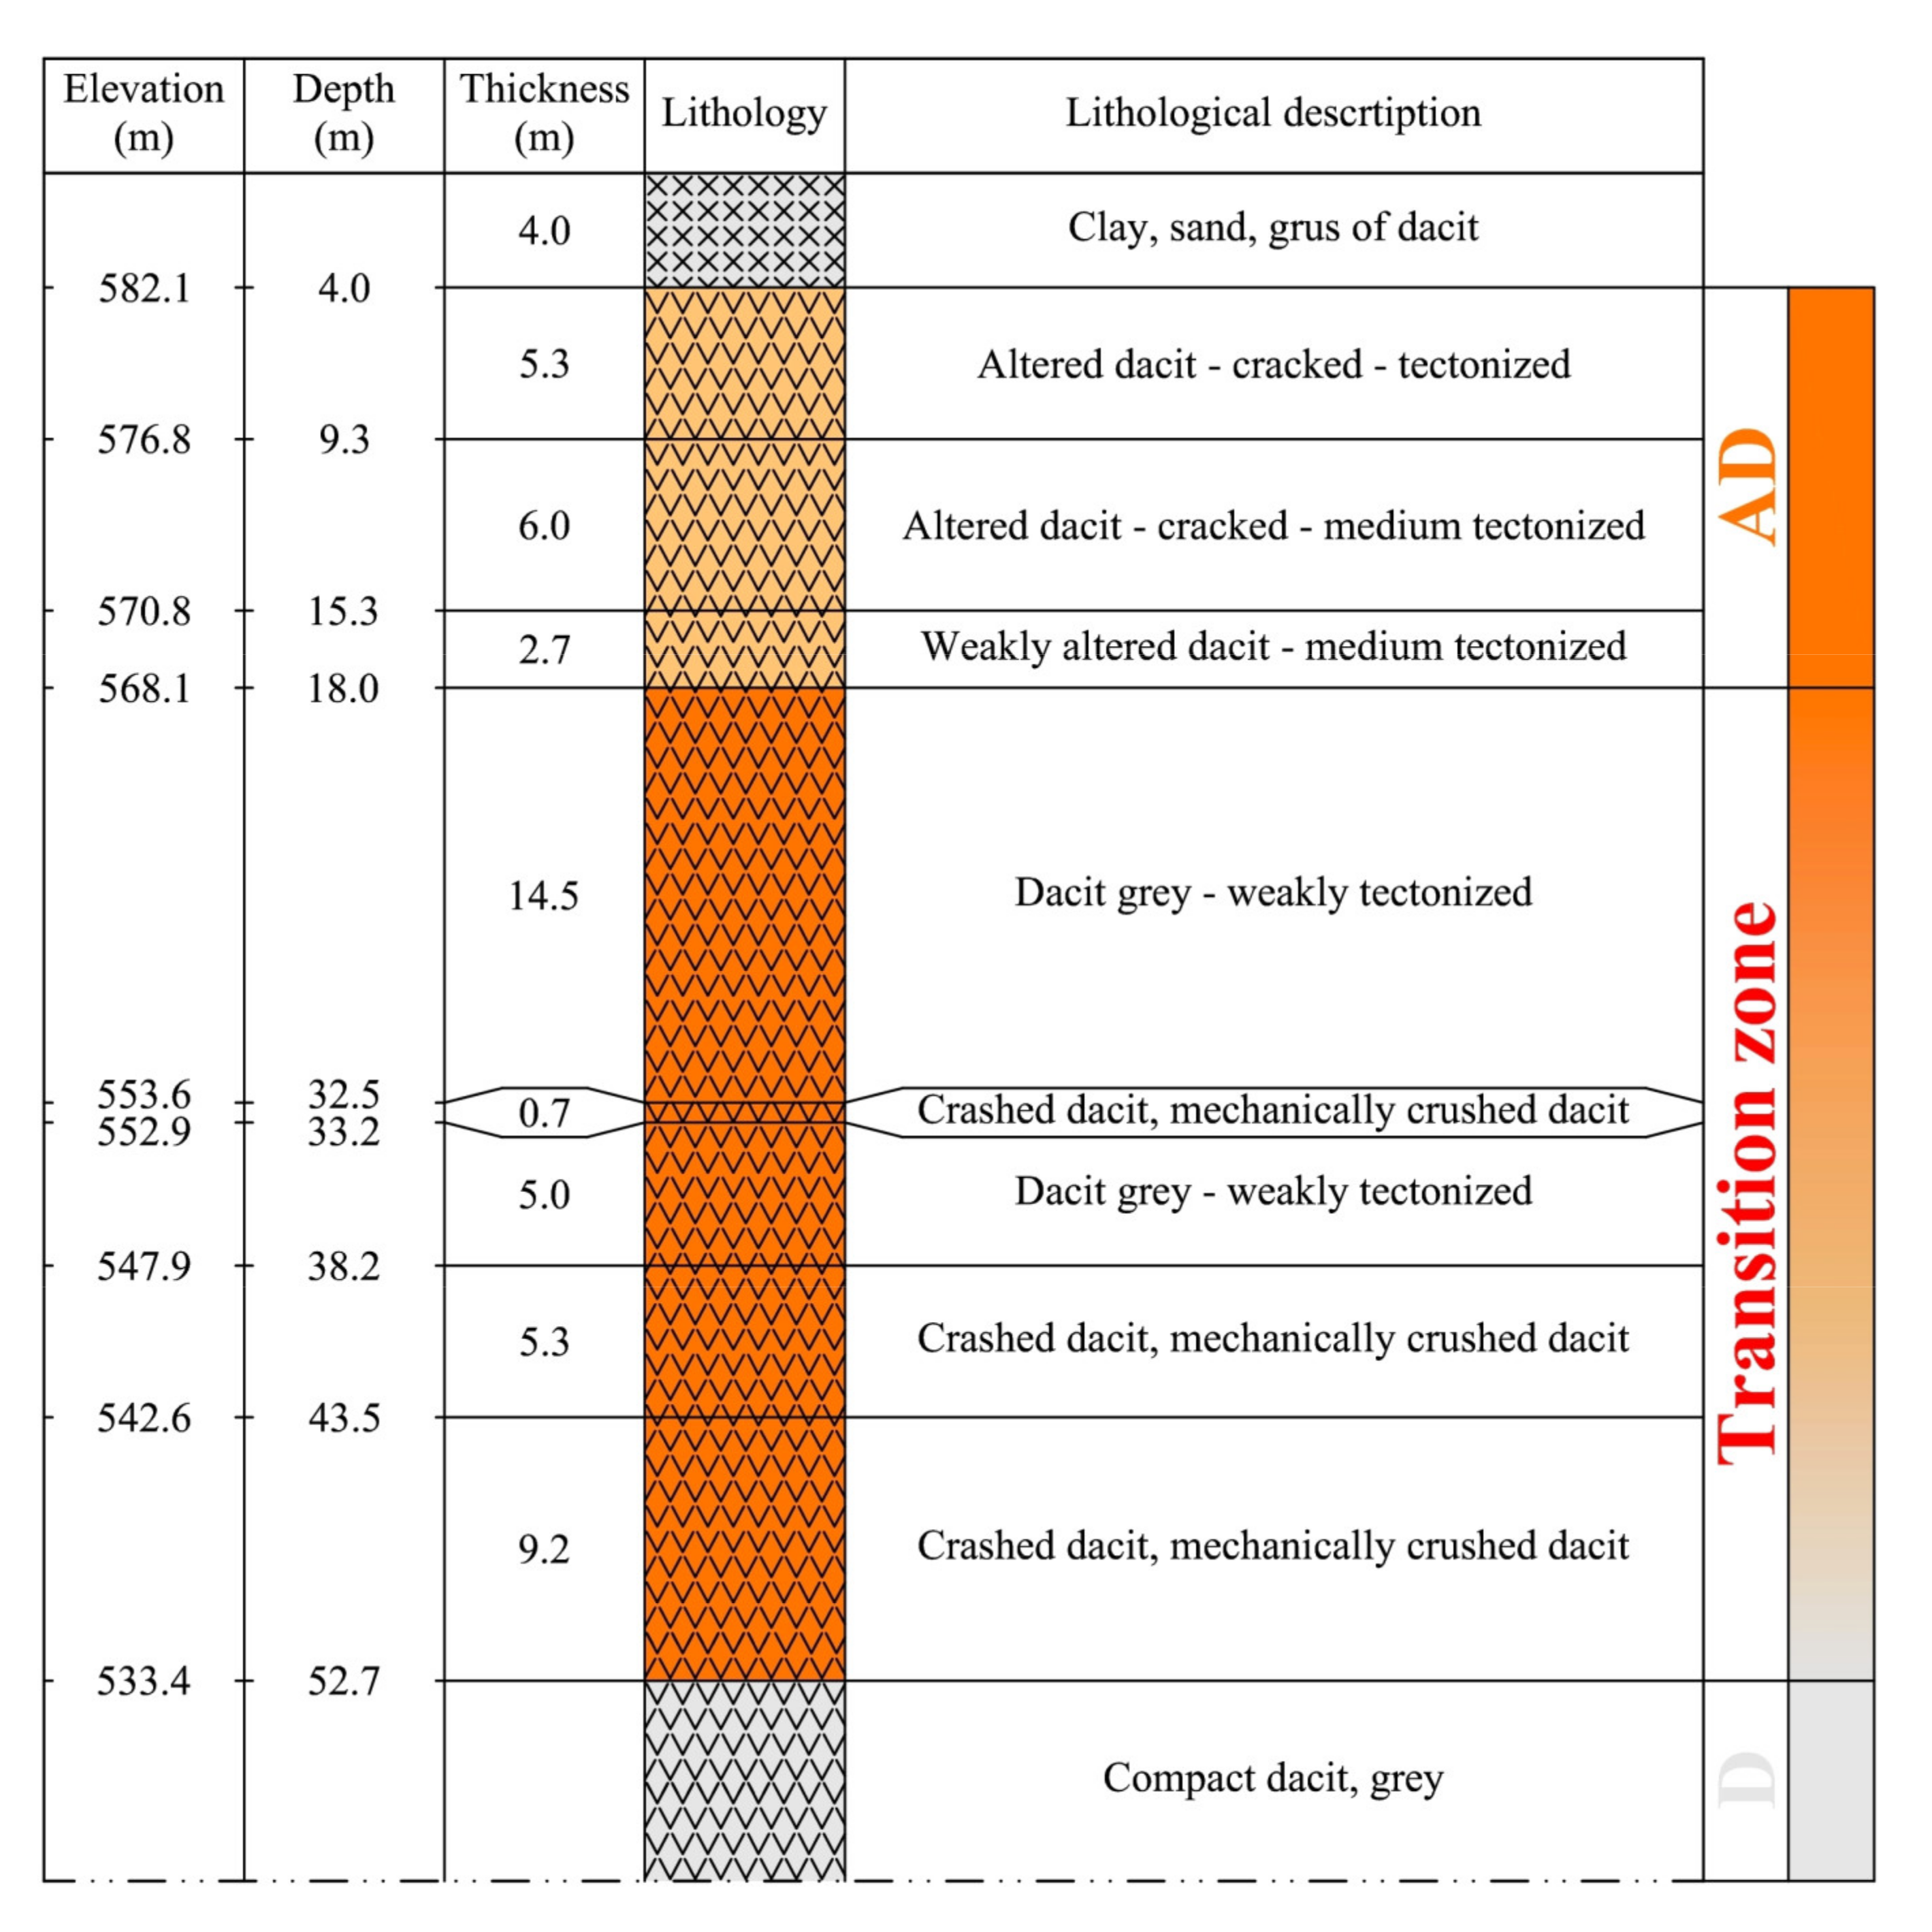
11]. Dacite deposit is of simple geological structure and essentially contains three categories of Dacite rocks and Cretaceous flysch sediments. Nevertheless, dacite is grusified in the near-surface part, followed by a zone of altered dacite. The zone of altered dacite (AD) is yellowish due to the pronounced limonitization of biotite. After the altered dacite, there is compact dacite (D) of gray color, porphyry structure with pronounced large phenocrysts of feldspar.
Precise determination of the boundary between altered dacite and dacite was impossible through analyzing the available geological documentation, core mapping from the exploration boreholes, and the open pit slopes. However, the importance of the genesis and properties of the rock material in this zone (extrusive igneous rocks) concluded that the alterations in the rock mass occurred gradually (
Figure 1). Subsequent interpretation of geological structure (
Figure 1) singled out three zones: altered dacite, transitional zone, and compact dacite. The transition zone represented the interval in which there was a gradual alteration in the rock mass (dacite–altered dacite) and was defined from the mapped lower part of the altered dacite to the mapped upper part of the dacite.
Test samples D and AD undoubtedly show the same structural-textural characteristics, as well as the mineral composition. Only the intensities of secondary alterations, calcification, limonitization, and chlorination are different (
Figure 2). The analyzed rock material samples have a holocrystalline porphyry structure with microcrystalline base mass and phenocrysts of quartz, plagioclase, sanidine, biotite, and hornblende. The accessory ingredients are apatite, zircon, and metallic minerals, while the secondary minerals are calcite, sericite, chlorite, and iron oxides/hydroxides. Mineralogical-petrographic analysis of D and AD samples showed that sanidine and quartz predominate in D. The strength parameters of the rock material are affected mainly by the content and size of quartz crystals. So, as the content of smaller quartz particles increases, the compressive strength increases. In the AD sample, the process of quartz resorption is pronounced, and biotite occurs in idiomorphic to hypidiomorphic laminated particles. In addition, the separation of metallic minerals is observed along cleavage planes. The presence of some “washed-up” laminated particles of biotite indicates that the rock was exposed to hydrothermal solutions. It was determined that AD has a yellow-pale brown to greyish color due to noticeable limonitization, which weakened the bond between individual mineral grains and significantly affected the strength of the rock material.
Knowledge of mineralogical-petrographic characteristics of rock material is essential when testing mechanical properties. The results of previous research show that the values compressive strength of rock material is significantly influenced by microstructural characteristics, the most important of which are: the participation of the main mineral elements [
12], mineral grain size [
13], arrangement of mineral grains and their shape [
14], mutual contact between individual mineral grains [
15], and level of alteration [
16]. In the analyzed samples D and AD, it was observed that the mechanical properties of the rock material are affected mainly by the mineralogical and petrographic characteristics of quartz and biotite.
Exploration works were based primarily on exploratory drilling, geological mapping, and laboratory tests. During these studies, four boreholes were drilled, with a total drilling length of 535 m, and the average depth per borehole was 133 m [
11].
3. Methodology of Laboratory Tests of Strength Parameters of Heterogeneous Rock Mass
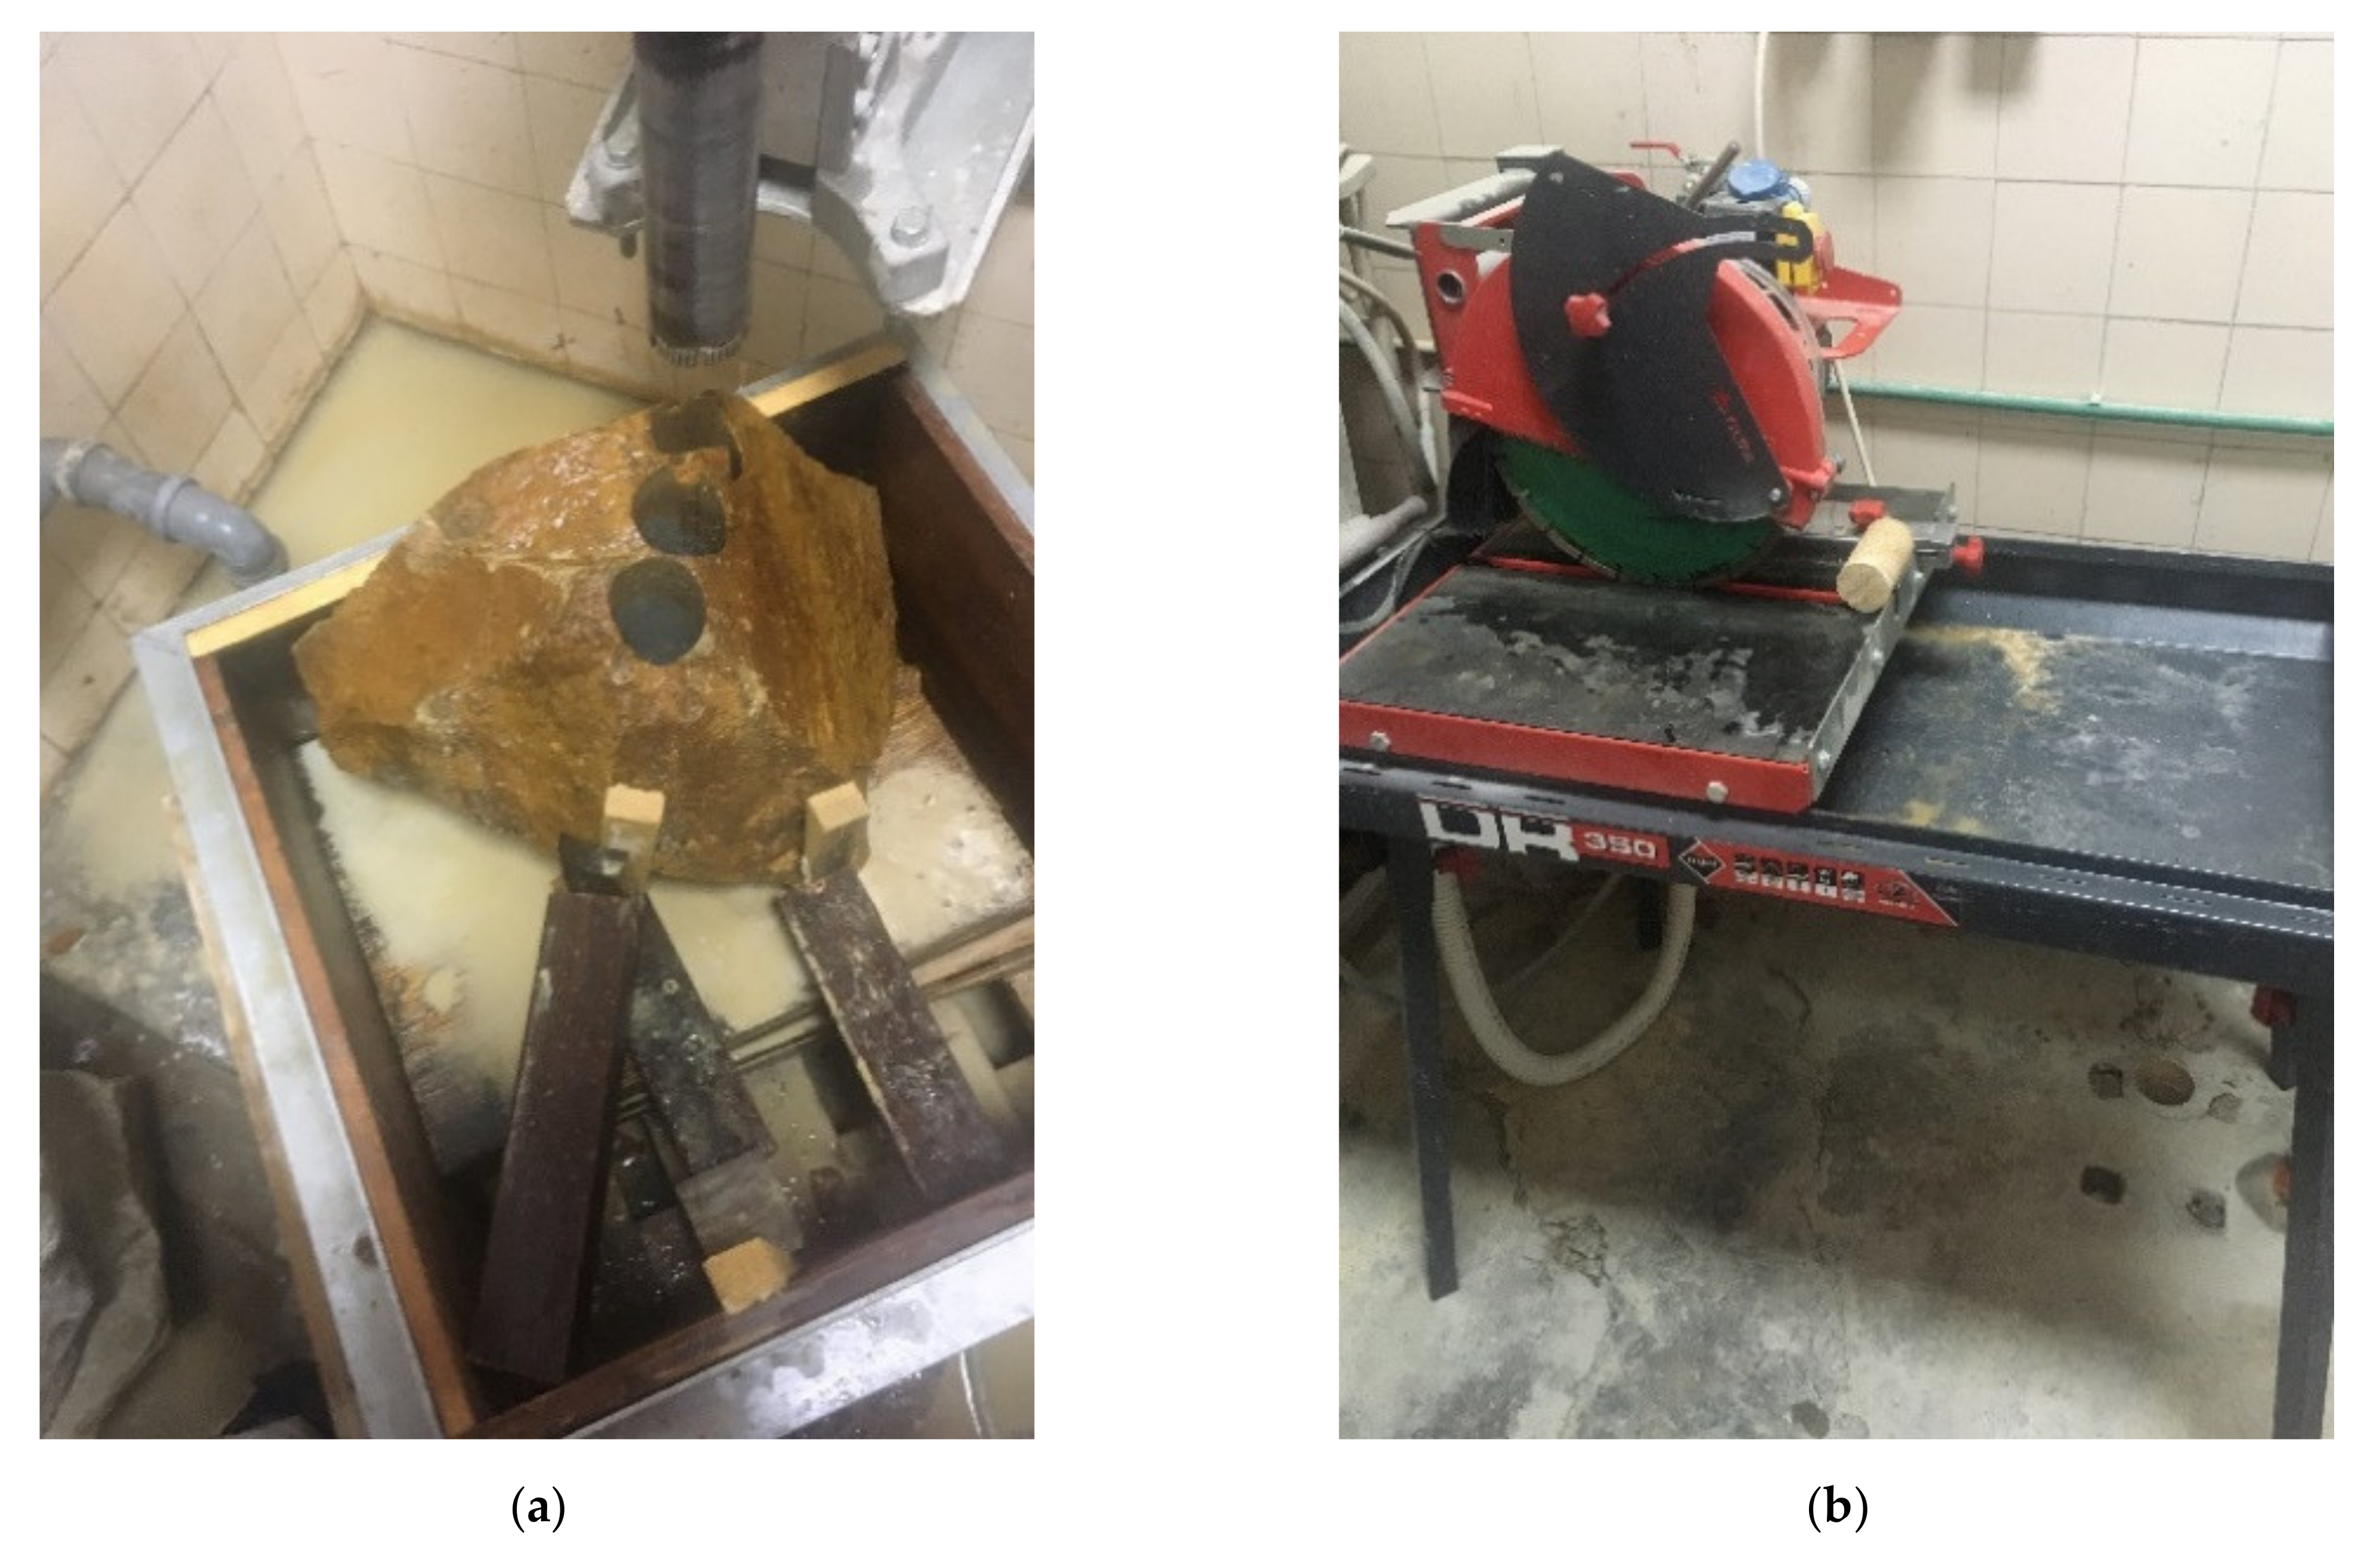
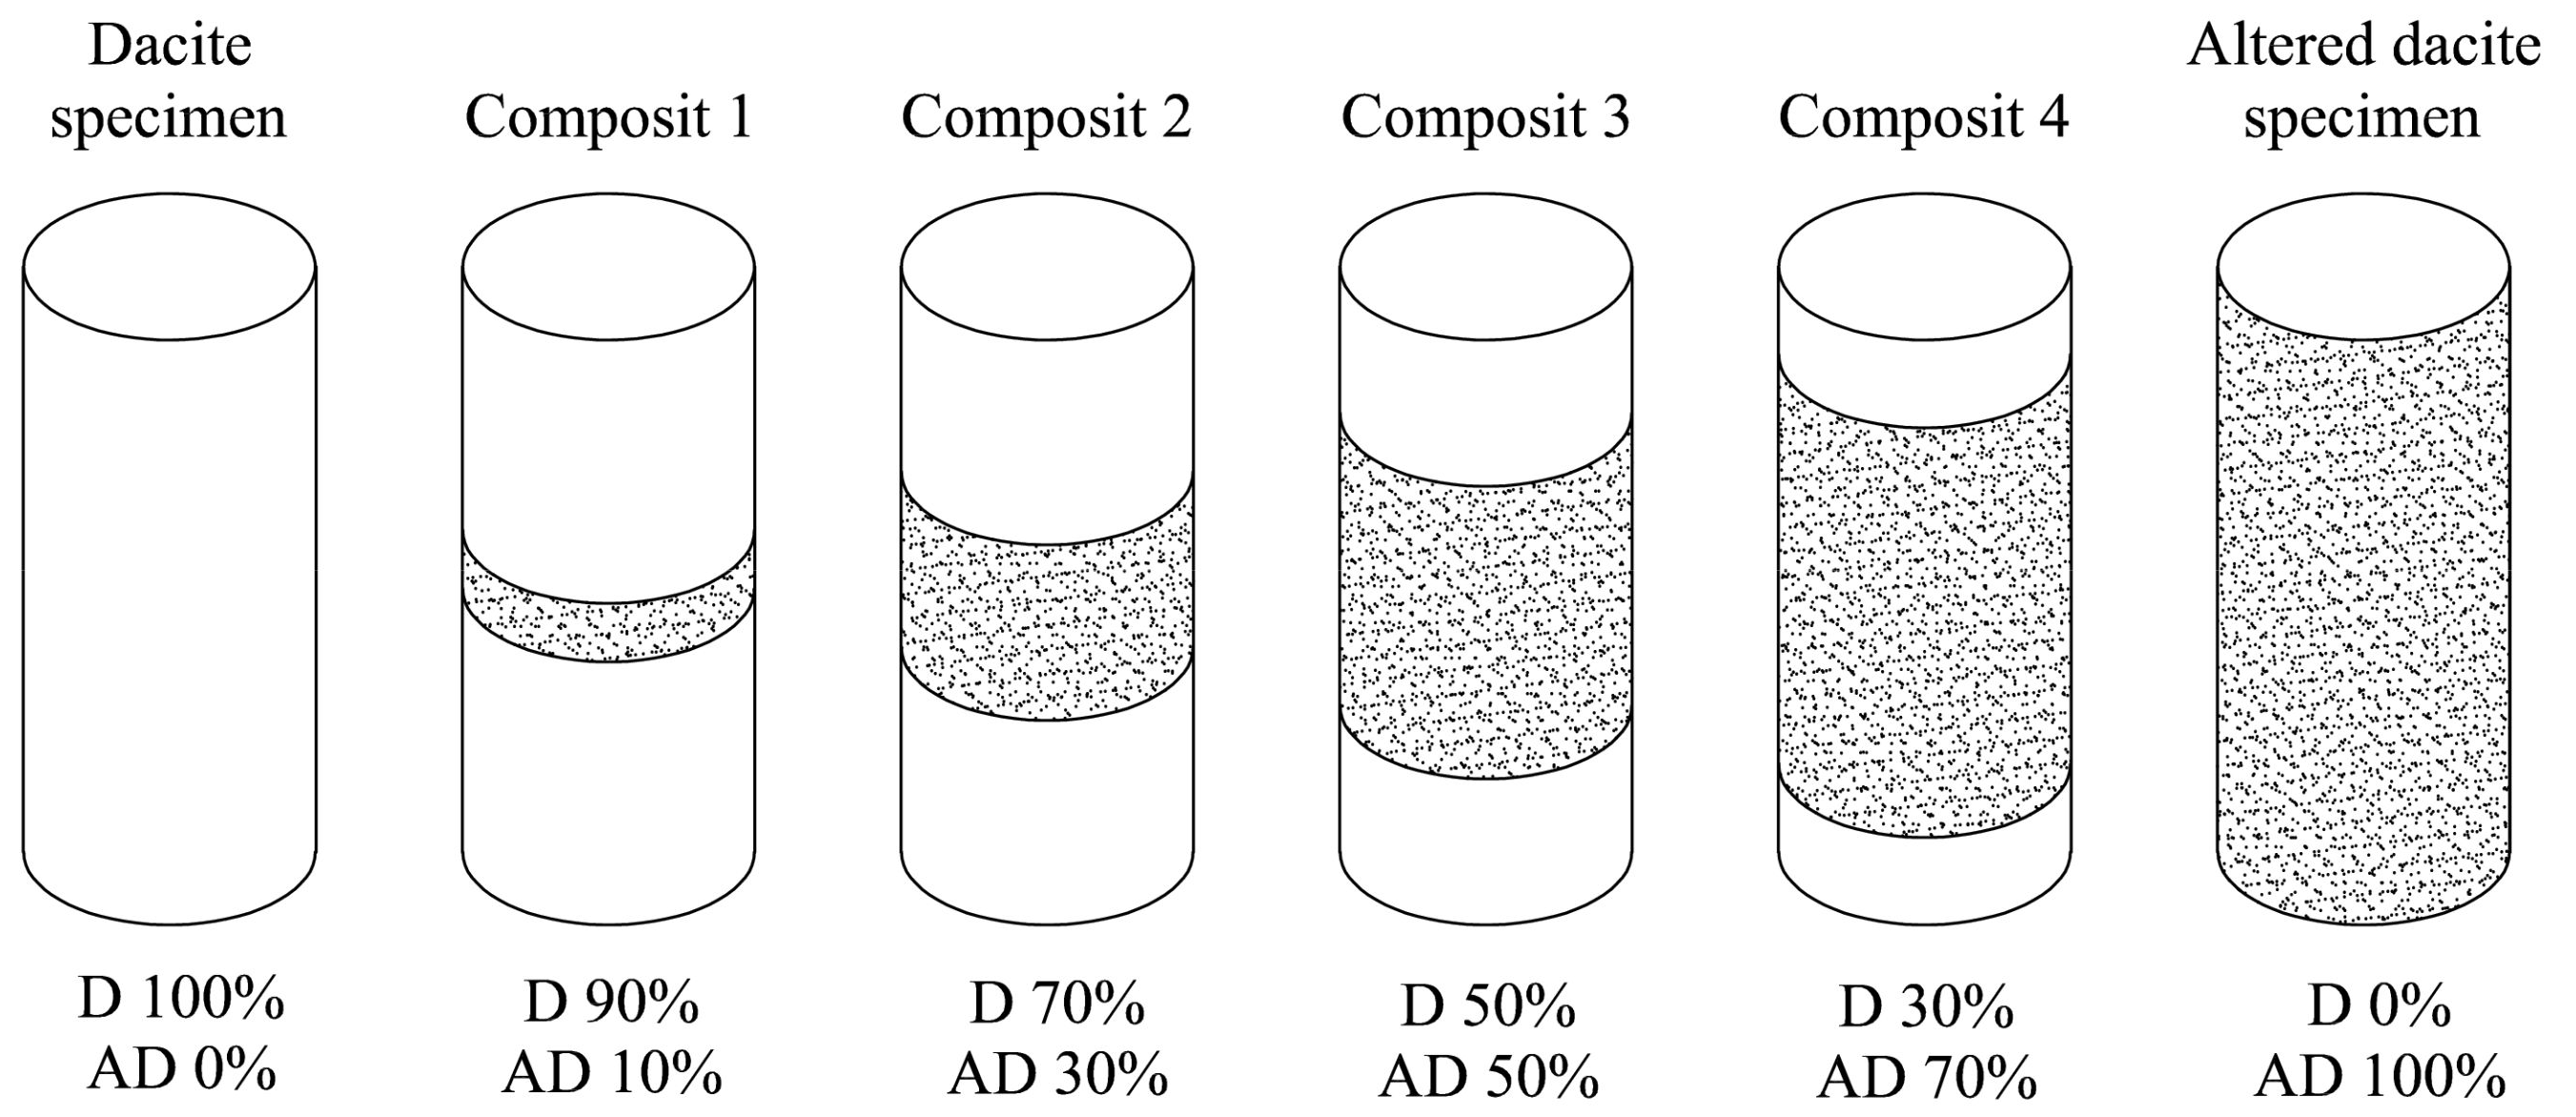
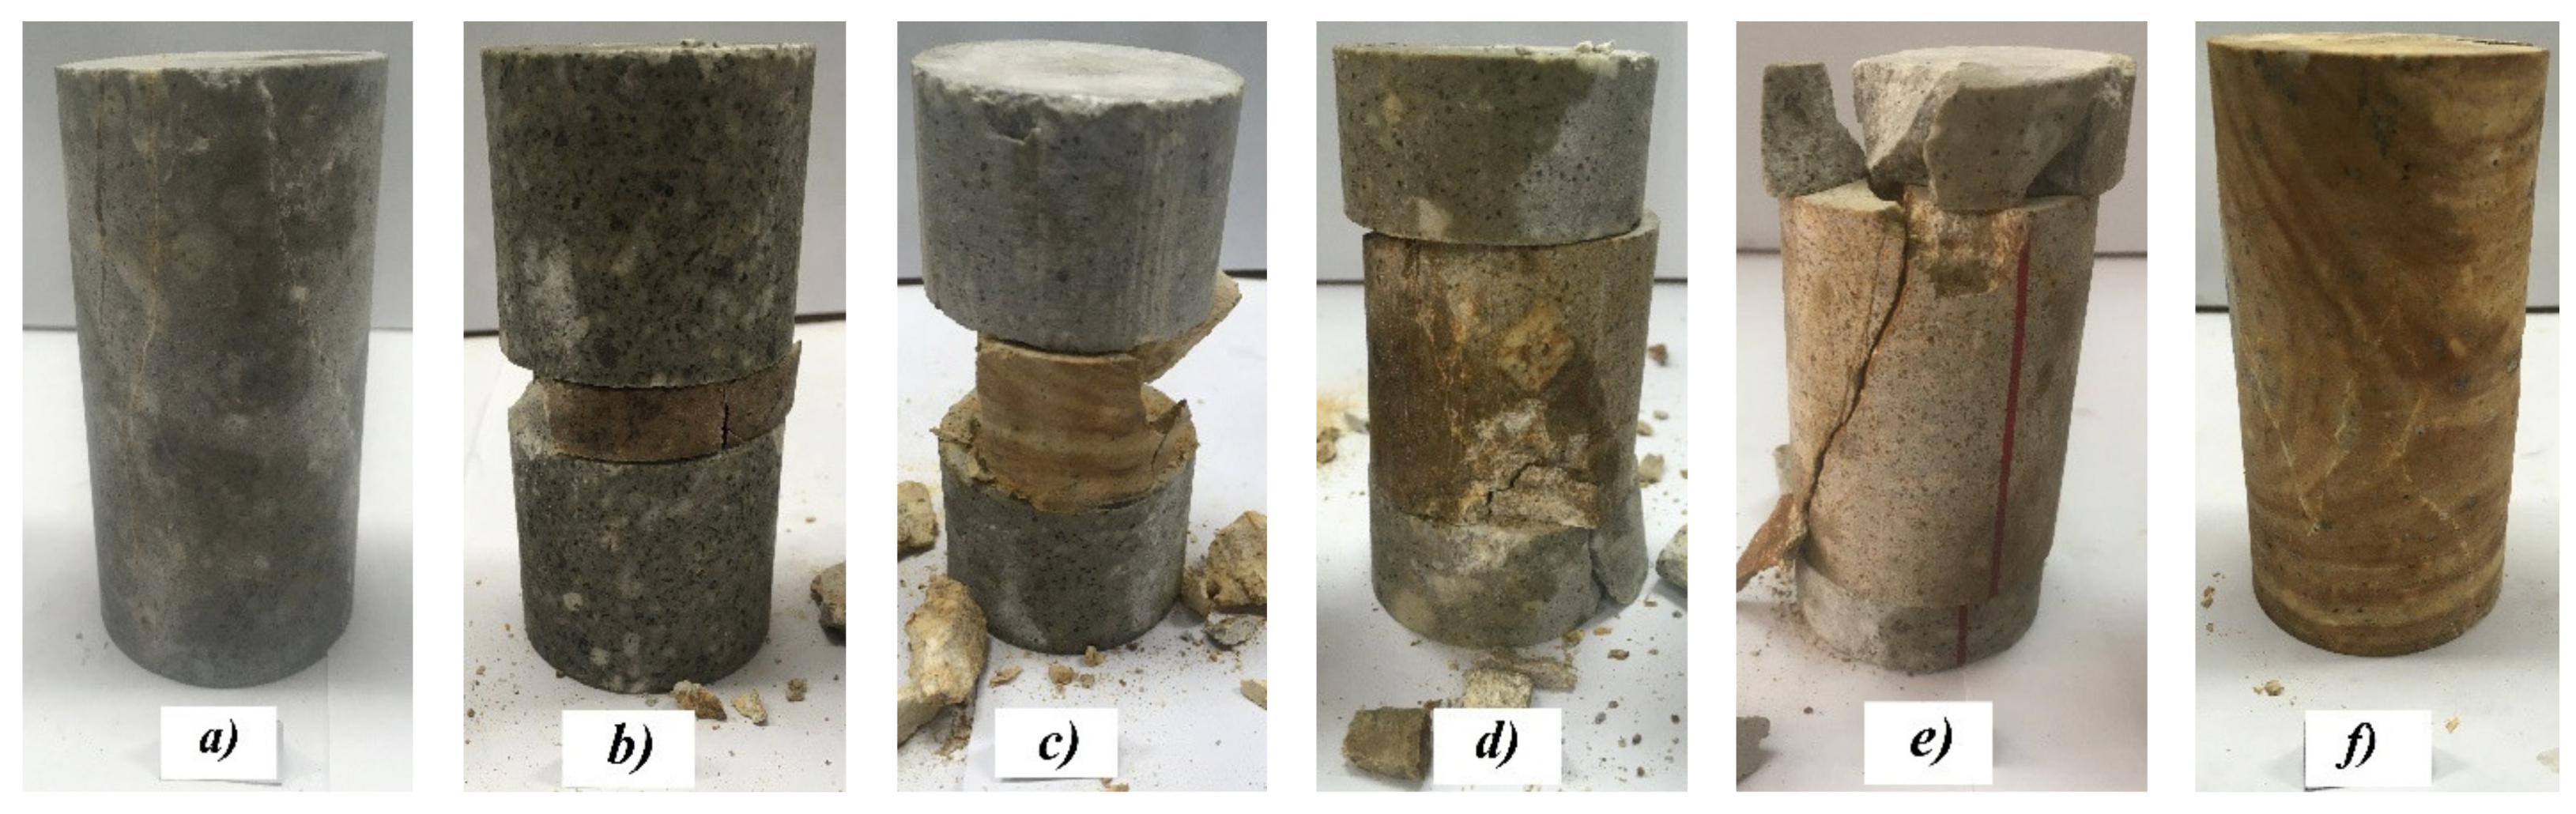
Laboratory tests of UCS and triaxial test were performed on samples of homogeneous material and composite samples, for which formation blocks of undisturbed rock material (maximum dimensions of 30 cm × 30 cm × 30 cm) were used. Rock block samples of altered dacite were taken from the open pit bench at an elevation of 575 m a.s.l. and dacite at an elevation of 505 m a.s.l. (
Figure 2), hermetically wrapped in polyethylene bags and transported to the laboratory. The composite specimens were prepared according to the procedure proposed by Tziallas et al. [
1]. Cylindrical samples, 54 mm in diameter, of rock material were extracted by a high-quality laboratory coring machine with a diamond bit. The ends of the specimens and discs were then cut, polished, and shaped to the required height and diameter ratio with tolerances according to the American Society for Testing and Materials—ASTM [
17] (
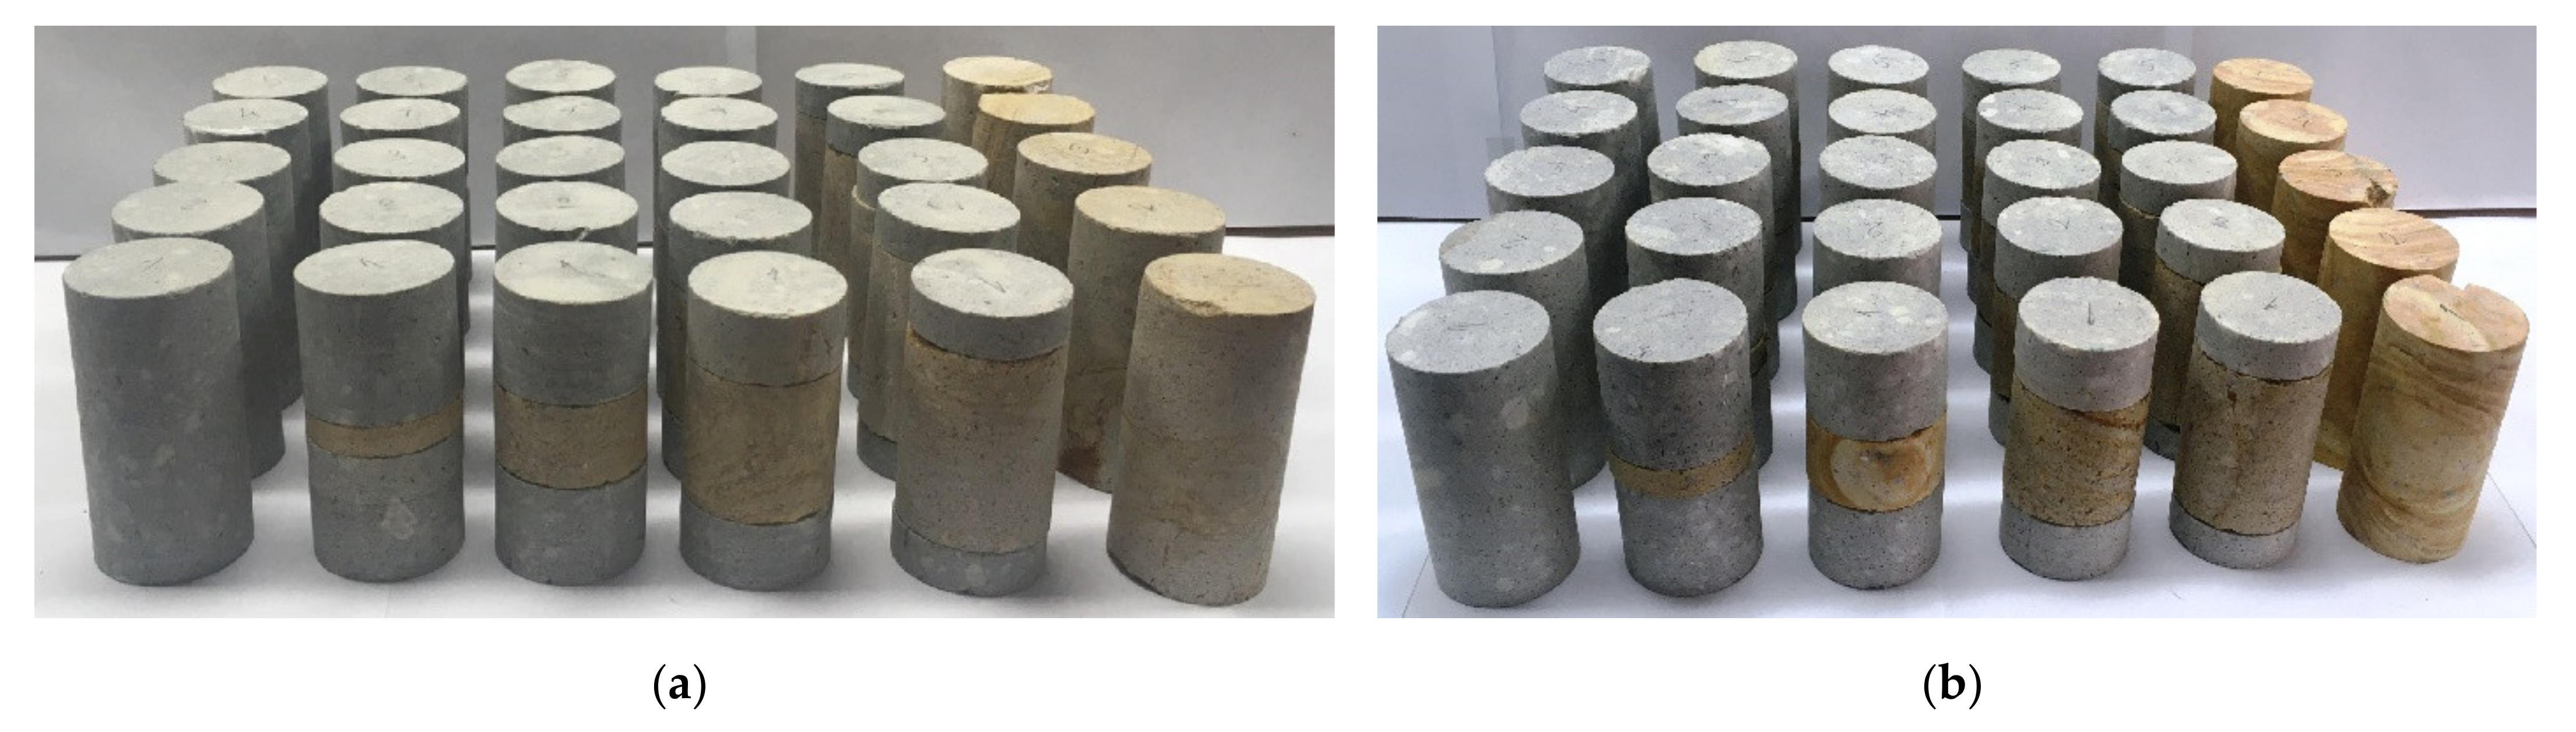
Figure 3). Due to the previously shown procedure, monolithic rock material (100% D and 100% AD) specimens and discs of rock material were prepared. Discs of rock material were used to form groups of composite specimens that contained 10%, 30%, 50%, and 70% volumetric participation of weaker material (altered dacite) (
Figure 4). It is essential to point out that no bonding material was used between the discs of rock material during the formation of composite samples. Using plaster to connect separate discs [
4] was shown as inadequate due to plaster failure at lower loads, causing the discs to displace and introducing non-uniform stress distribution throughout the disc interfaces. Tziallas et al. [
1] found that the use of plaster to connect separate discs is unnecessary, considering the pattern of the fracture surfaces and the fact that no displacements of the discs were observed, even at higher compressive loads. These findings are used in the present study.
The dimensions of the specimens used in the UCS test differ depending on the recommendations and standards (ASTM and International Society for Rock Mechanics and Rock Engineering—ISRM). According to ASTM [
17], the diameter of the specimen must not be less than 47 mm (ASTM) with a height to diameter ratio of 2–2.5:1, and the duration of the experiment should be 2–15 min. ISRM [
18] suggested that the diameter of the specimen should not be less than 54 mm (ISRM), while the ratio of height and diameter should be 2.5–3:1, with the duration of the experiment from 5–10 min. According to the recommendations from previous studies [
1,
6], the diameter of the specimen for UCS testing was 54 mm, whereas the height and diameter ratio of the specimen ranged from 2–2.5:1. This research, in addition to the UCS tests, also conducted triaxial tests. Therefore, specimens with a diameter of 54 mm with a ratio of height and diameter of 2:1 were formed. In total, 60 specimens were prepared for laboratory tests, 30 for UCS tests, and 30 specimens for triaxial tests (
Figure 5).
Nevertheless, UCS tests were performed on a hydraulic compression testing frame with sufficient pressure capacity and capable of applying a force perpendicular to the specimen base. UCS is calculated according to the following equation:
where:
P—maximum force at the moment of failure,
A—specimen’s cross-section area.
Triaxial tests were carried out by the current ISRM recommendations for this type of test [
19]. A triaxial test was performed for five different values of confining pressures (
σ3), namely, 5, 10, 15, 20, and 30 MPa. Considering that information on “in-situ” stress conditions was not available for this research, the values of confining pressures (
σ3) were defined according to the recommendations given by Hoek and Brown [
20], where the values for the range of confining pressure are 0<
σ3 < 0.5
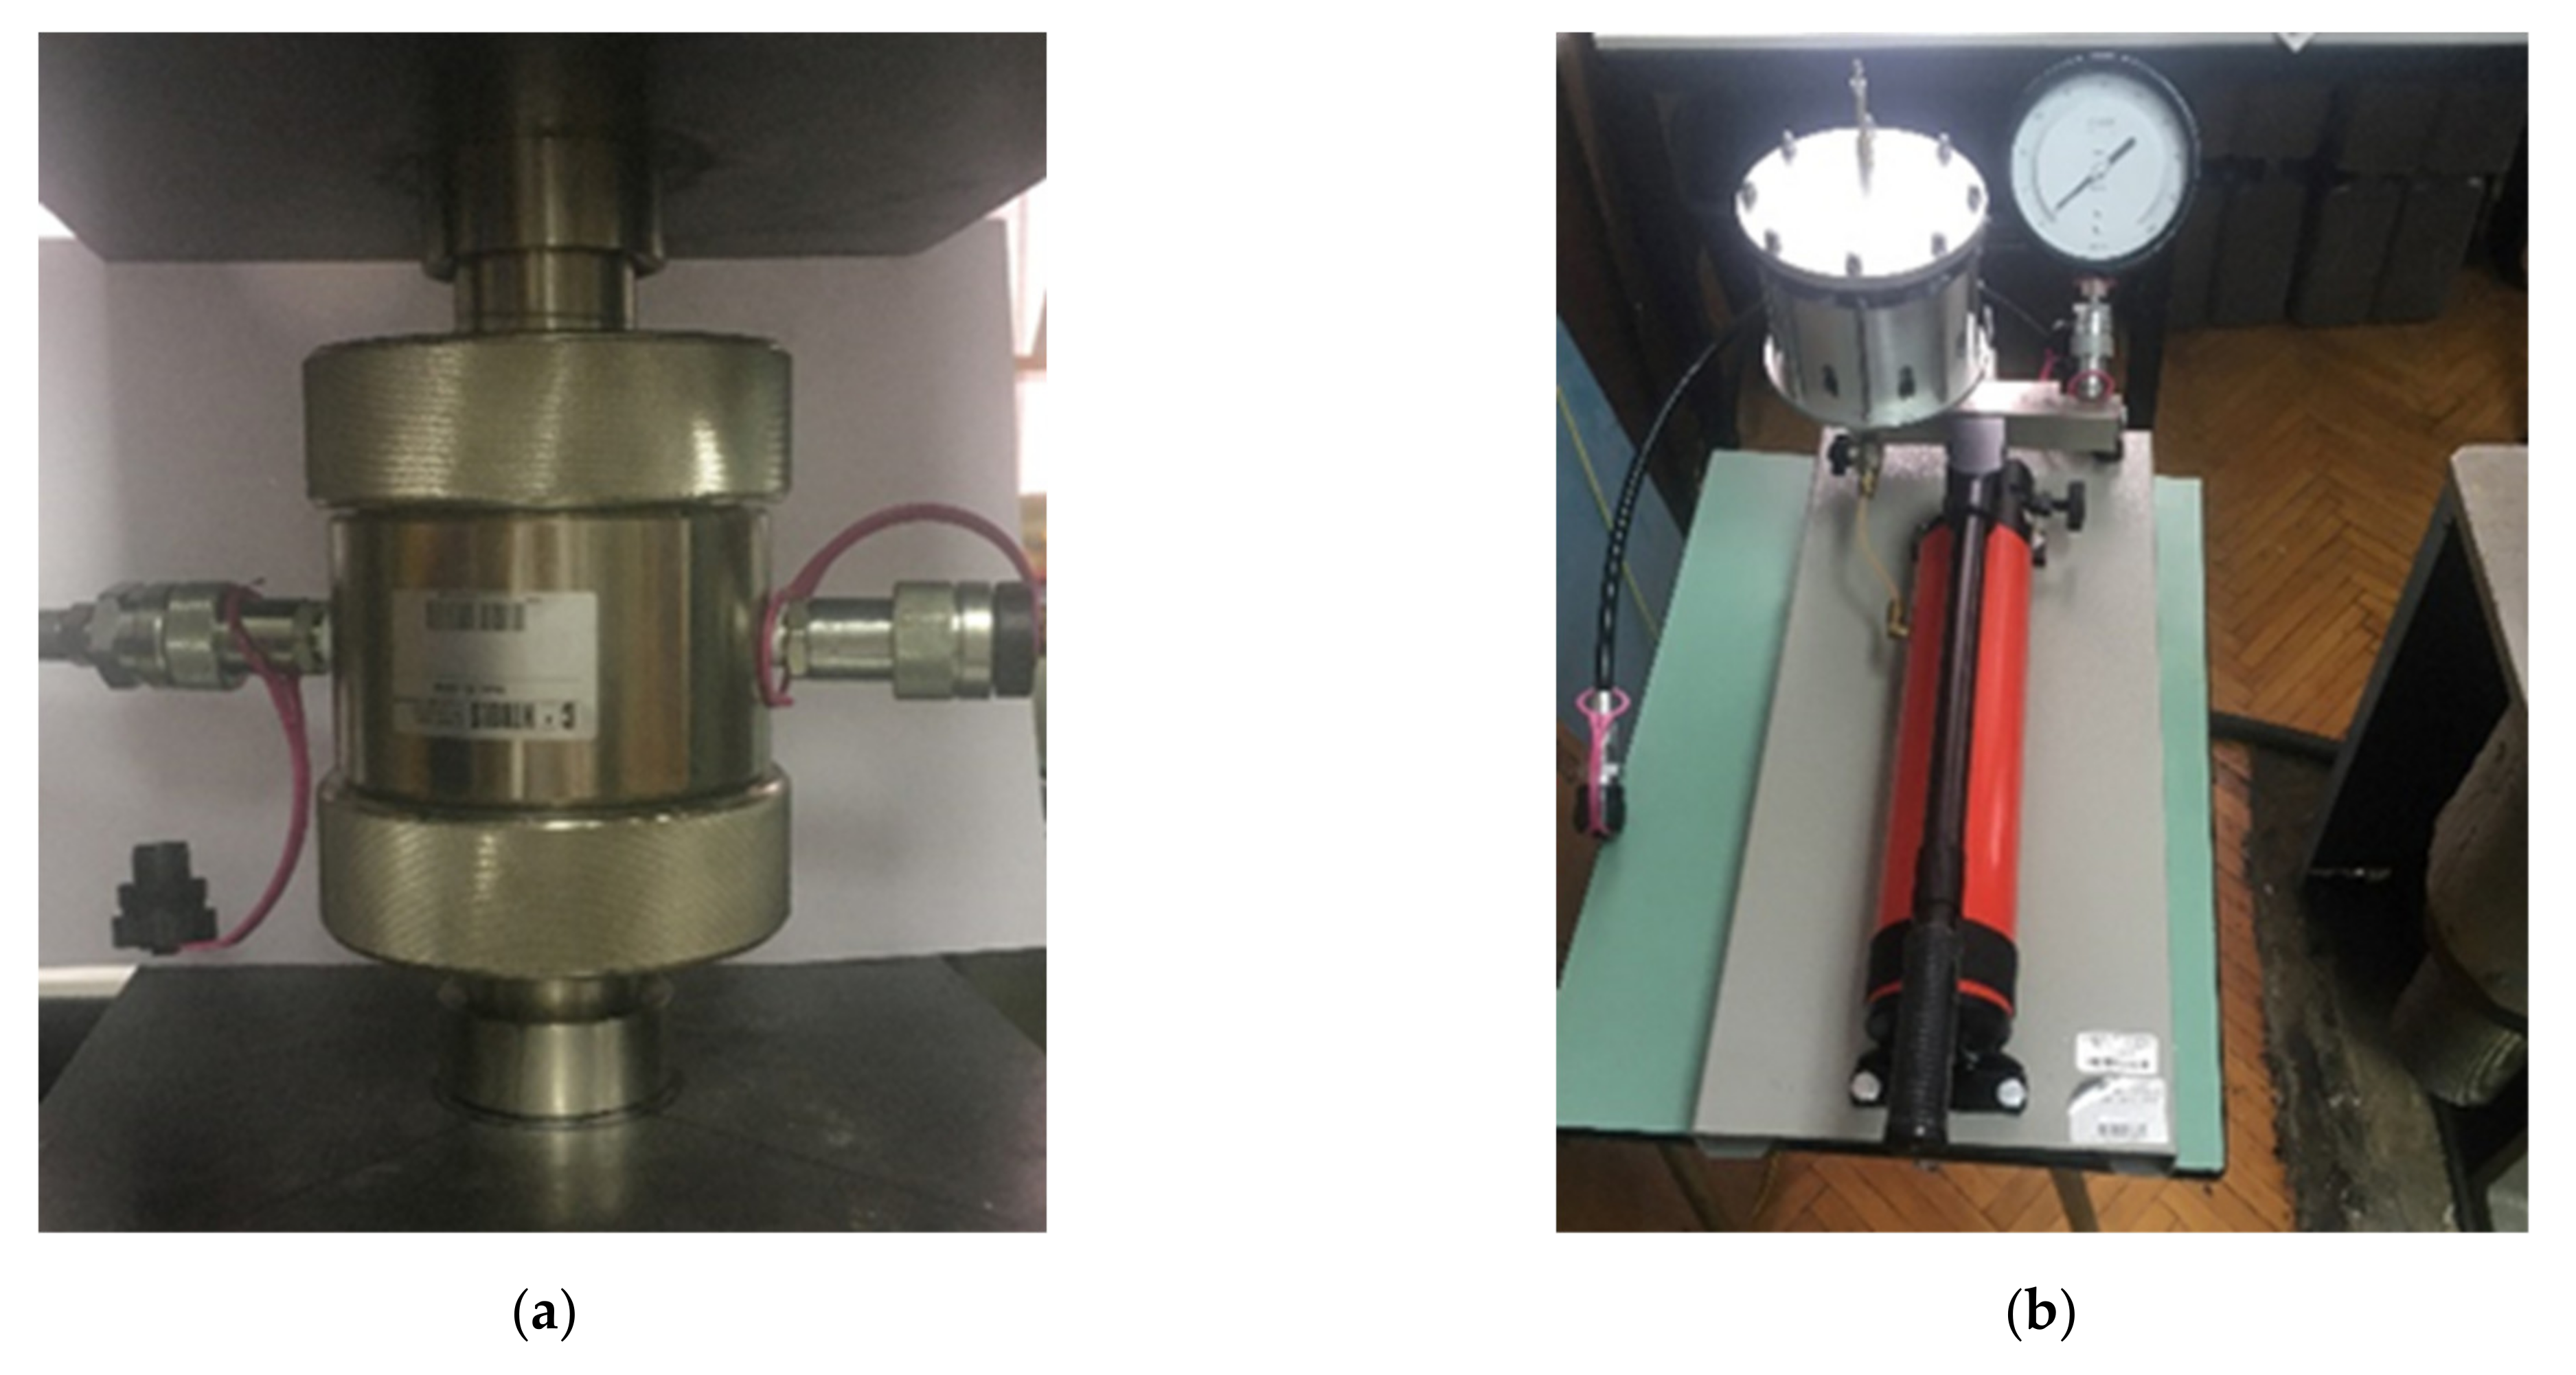
σci. During the test, the specimen first led to the hydrostatic stress state, i.e., with the increase in the confining pressure, the axial load of the sample increased in parallel until the hydrostatic state was reached for the set value of the sample of the confining pressure. During the test, the axial loads of the sample to achieve the hydrostatic state were: 11.5; 22.9; 34.4; 45.8; 68.7 kN. After reaching the hydrostatic state, a further increase in the axial load was outstretched until the failure while maintaining a constant confining pressure. The equipment for testing the triaxial test consisted of a standard Hoek triaxial cell diameter of 54 mm. The integral part consisted of pistons with spherical seats for load transfer, leading caps, and a rubber sealing sleeve (
Figure 6a). Consequently, after placing the sample in the cell and connecting the manual confining pressure system (
Figure 6b), the testing of rock material in triaxial conditions was performed.
The UCS and triaxial testing duration ranged from 5–10 min, with a stress rate of 0.1–0.3 kN/s. The specimens were tested at room temperature of 20 ± 2 °C, and the time between field extraction of samples and the laboratory testing was no longer than 15 days.
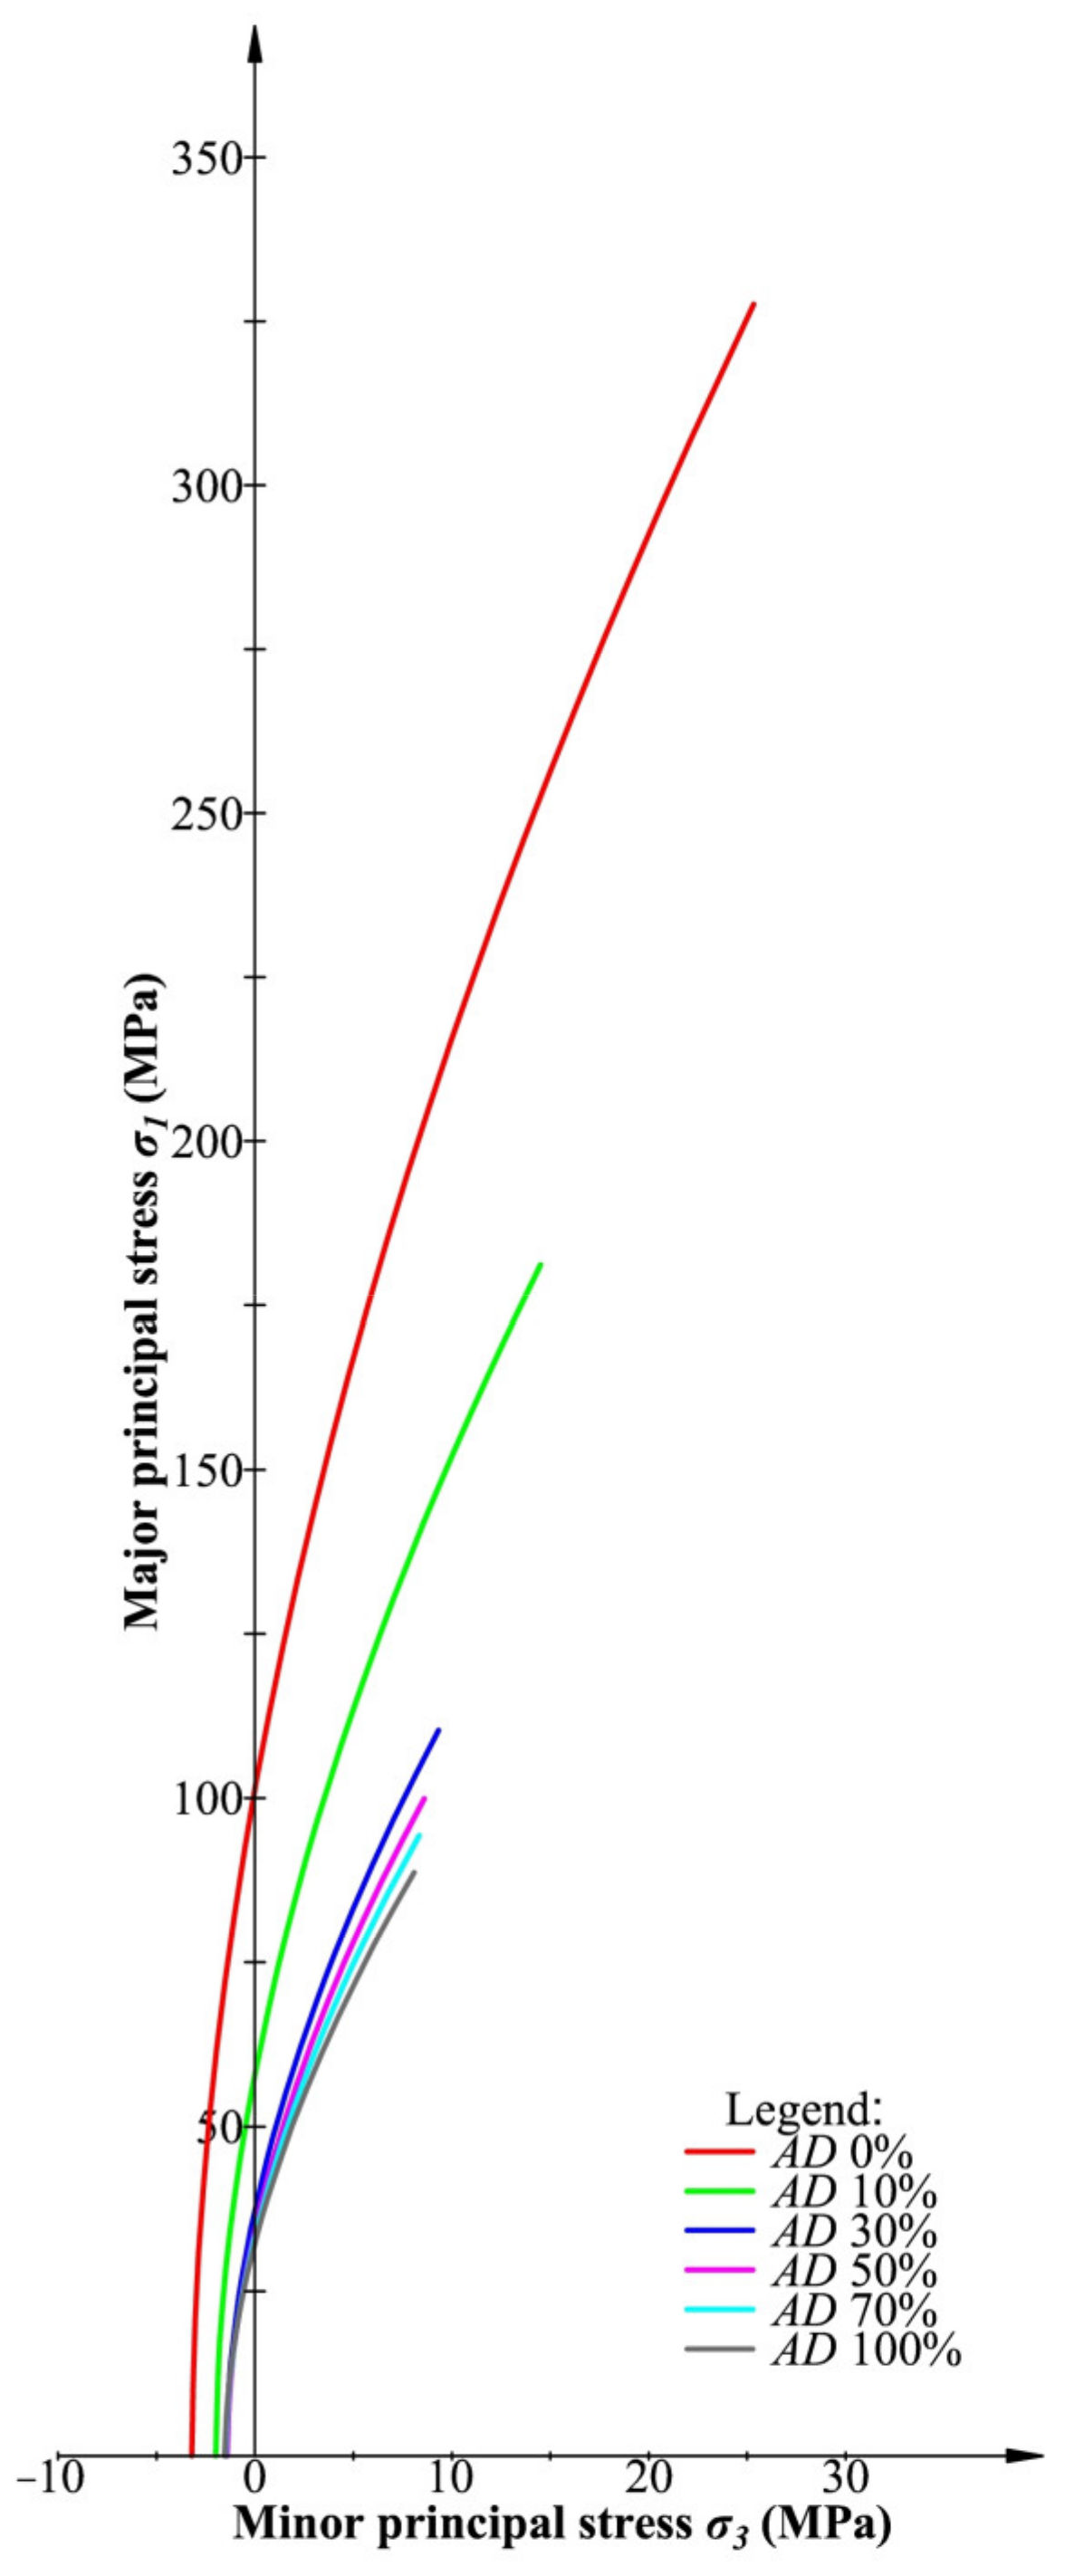
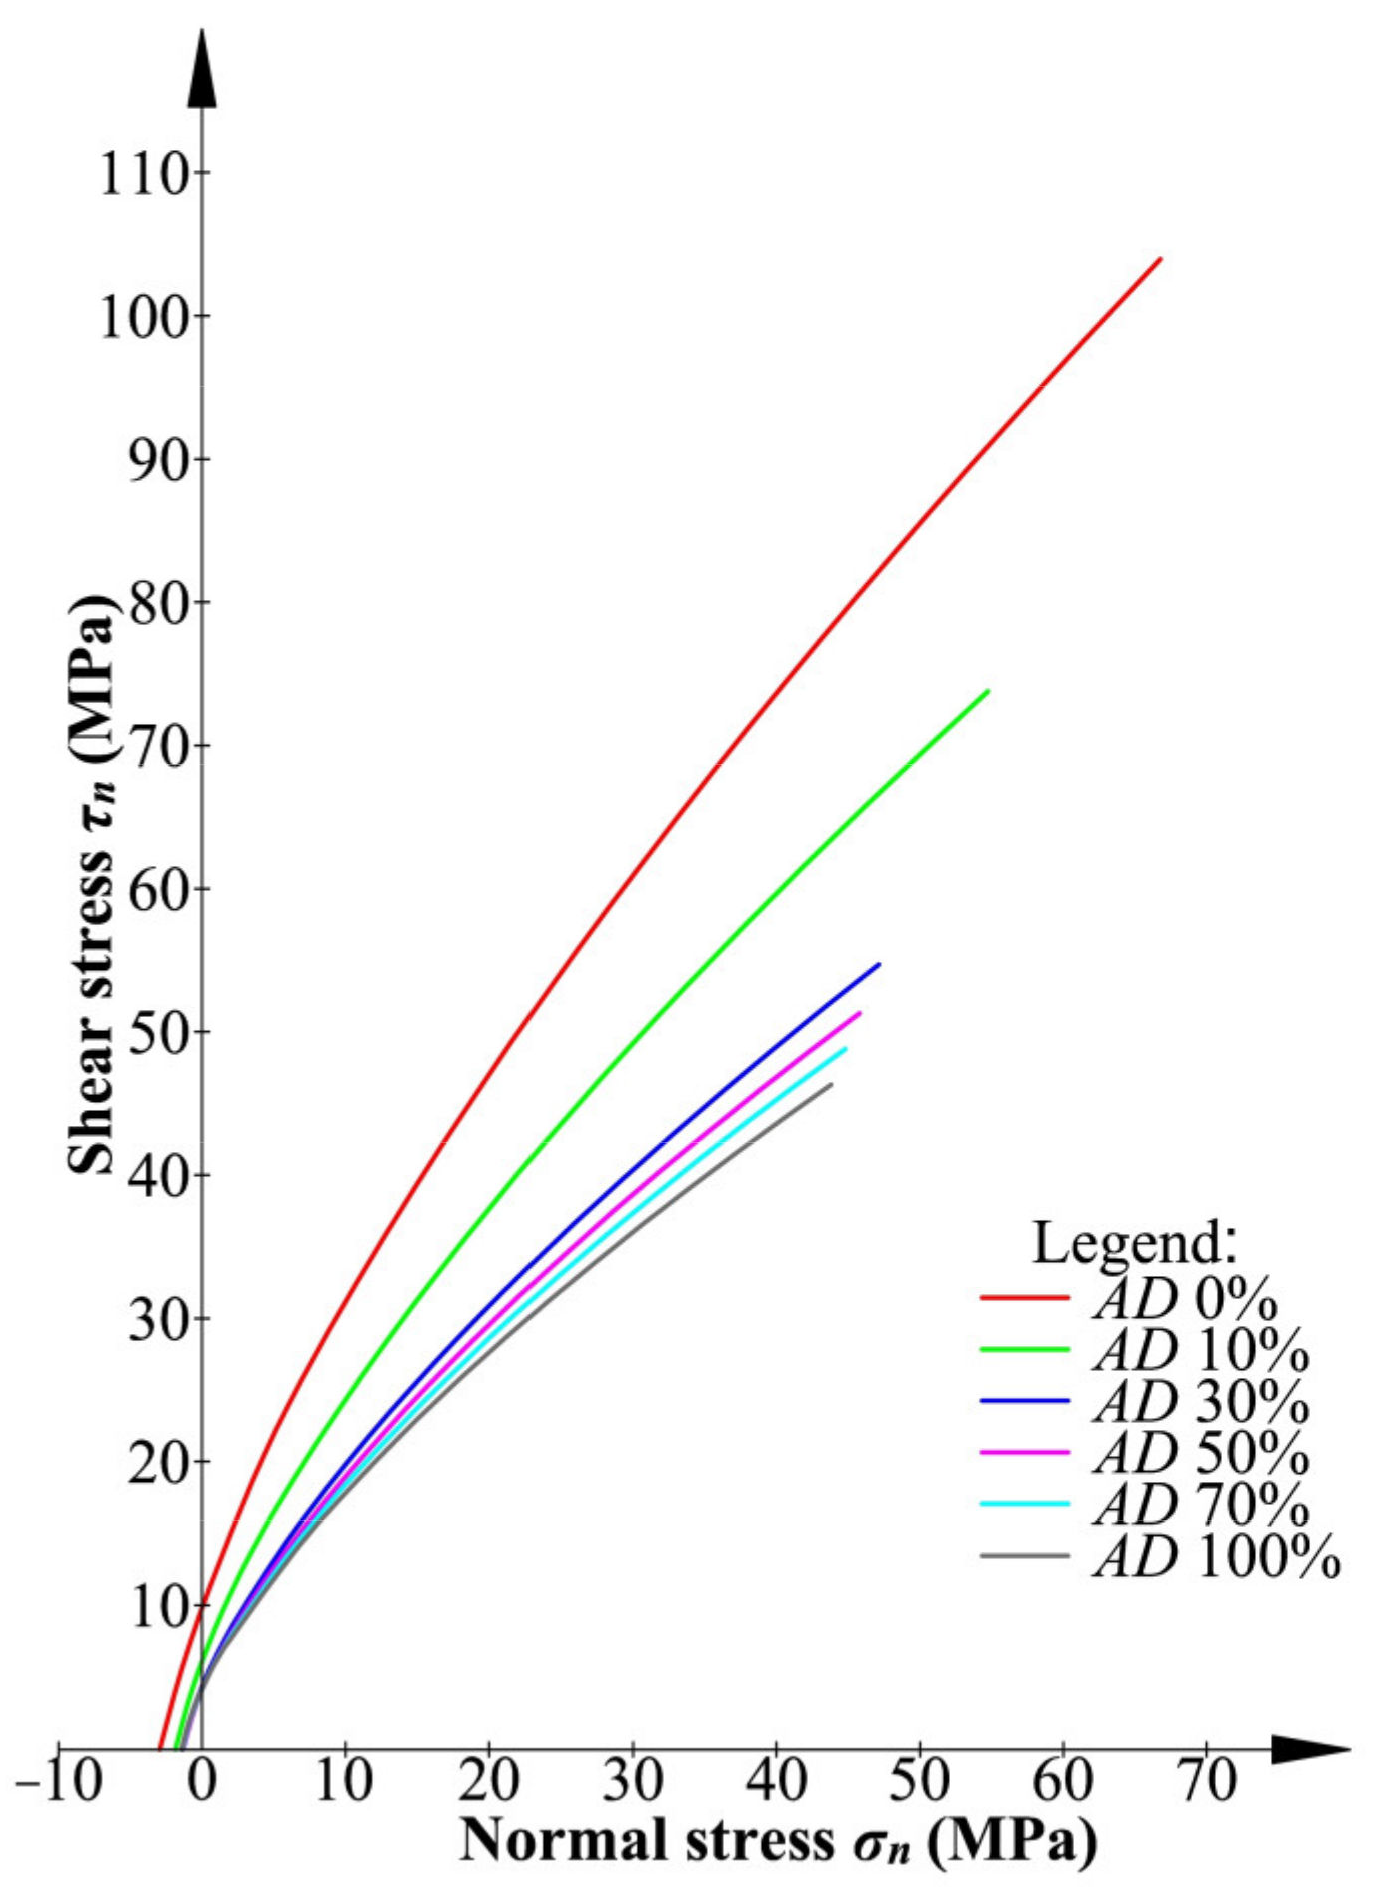
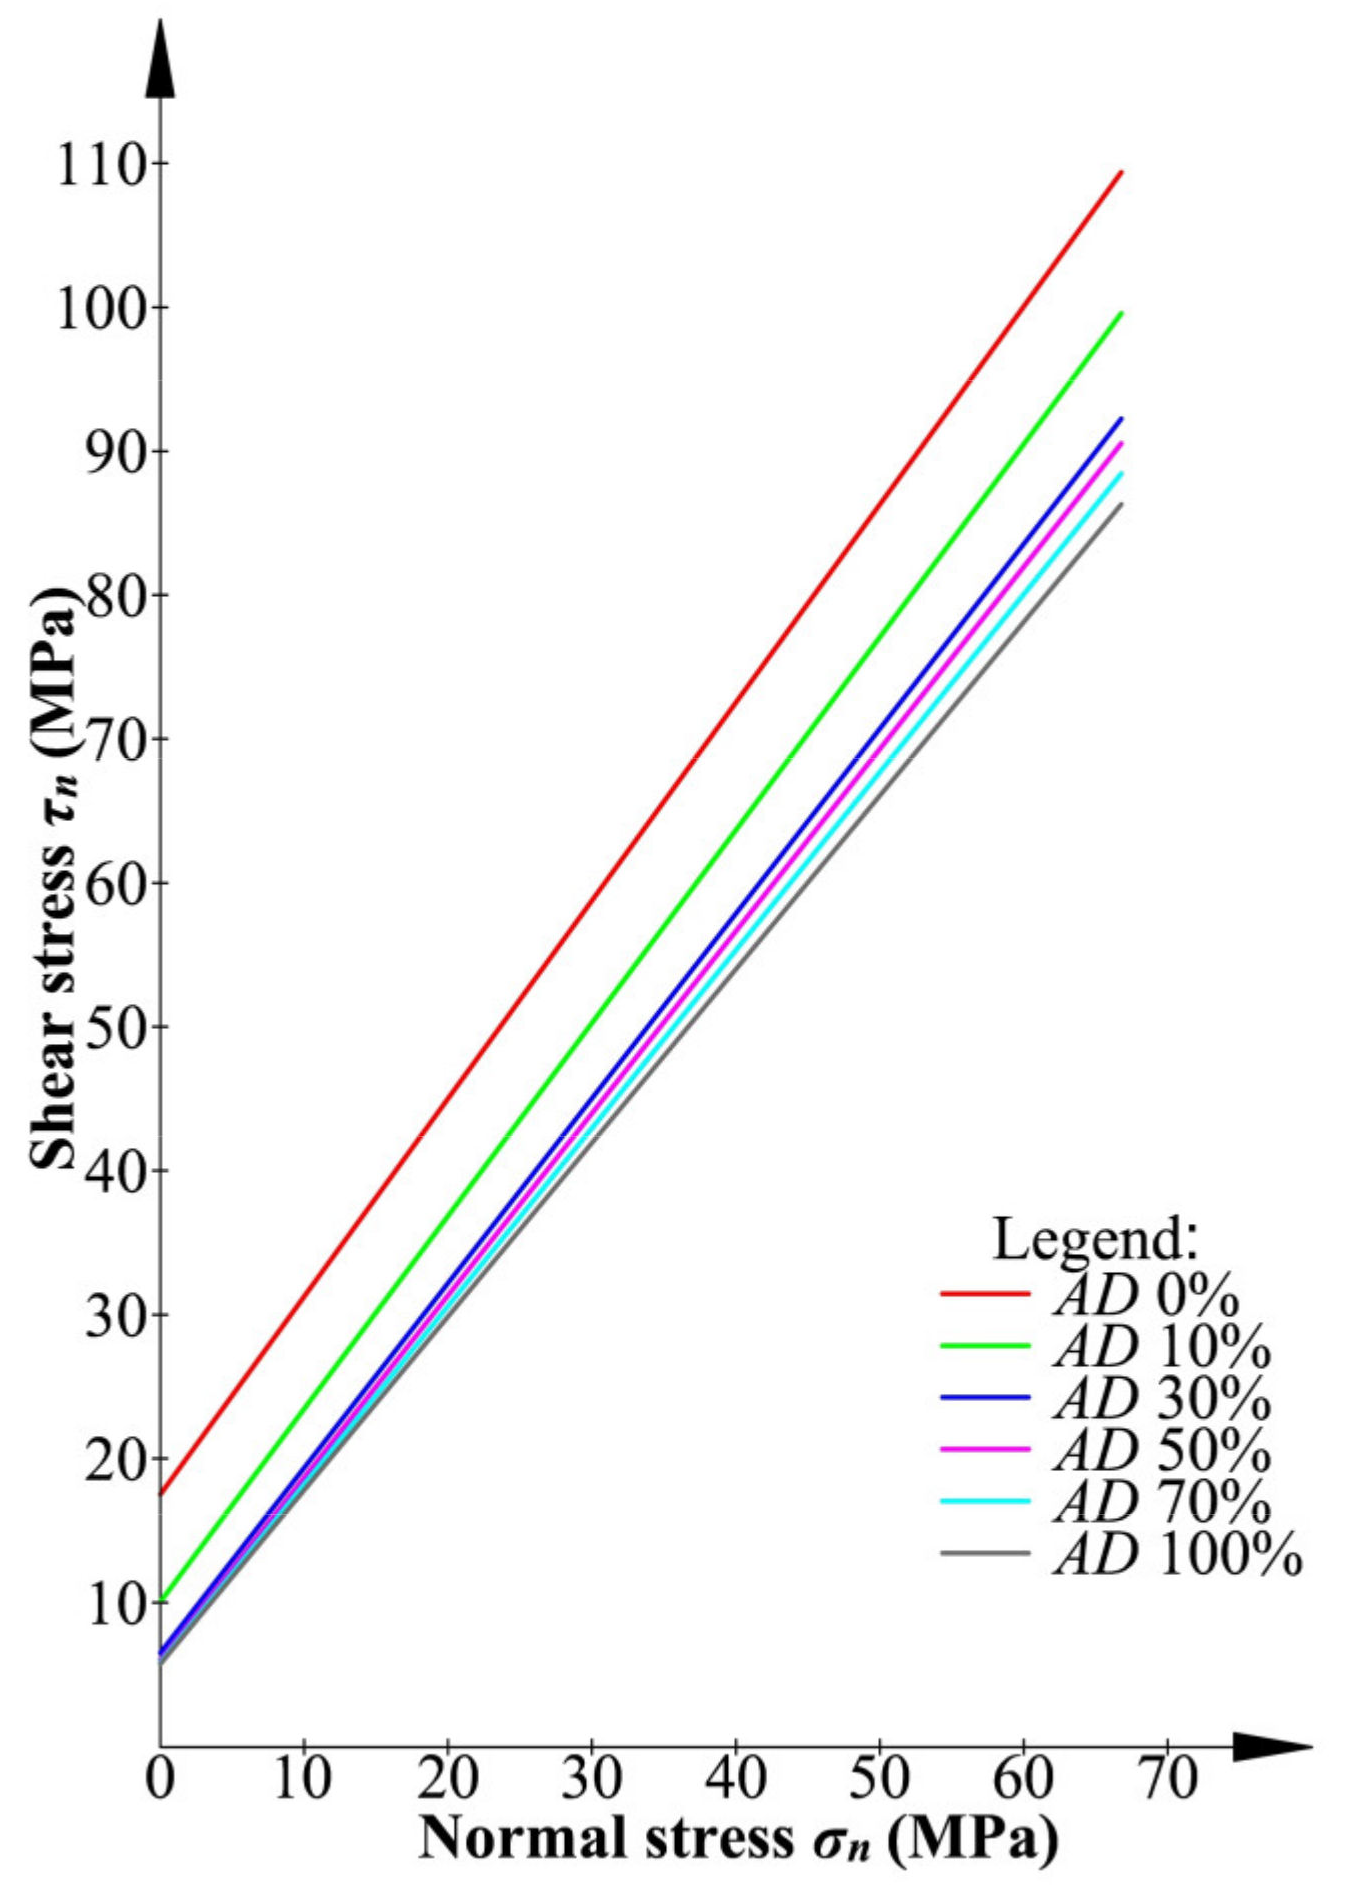
The values of horizontal σ3 and vertical σ1 stress were obtained based on the registered values of the confining and axial load that led the sample to failure along the known surface of the specimen. Analysis and calculation of rock material strength parameters were performed by the generally accepted Hoek–Brown, and Mohr–Coulomb failure criteria.
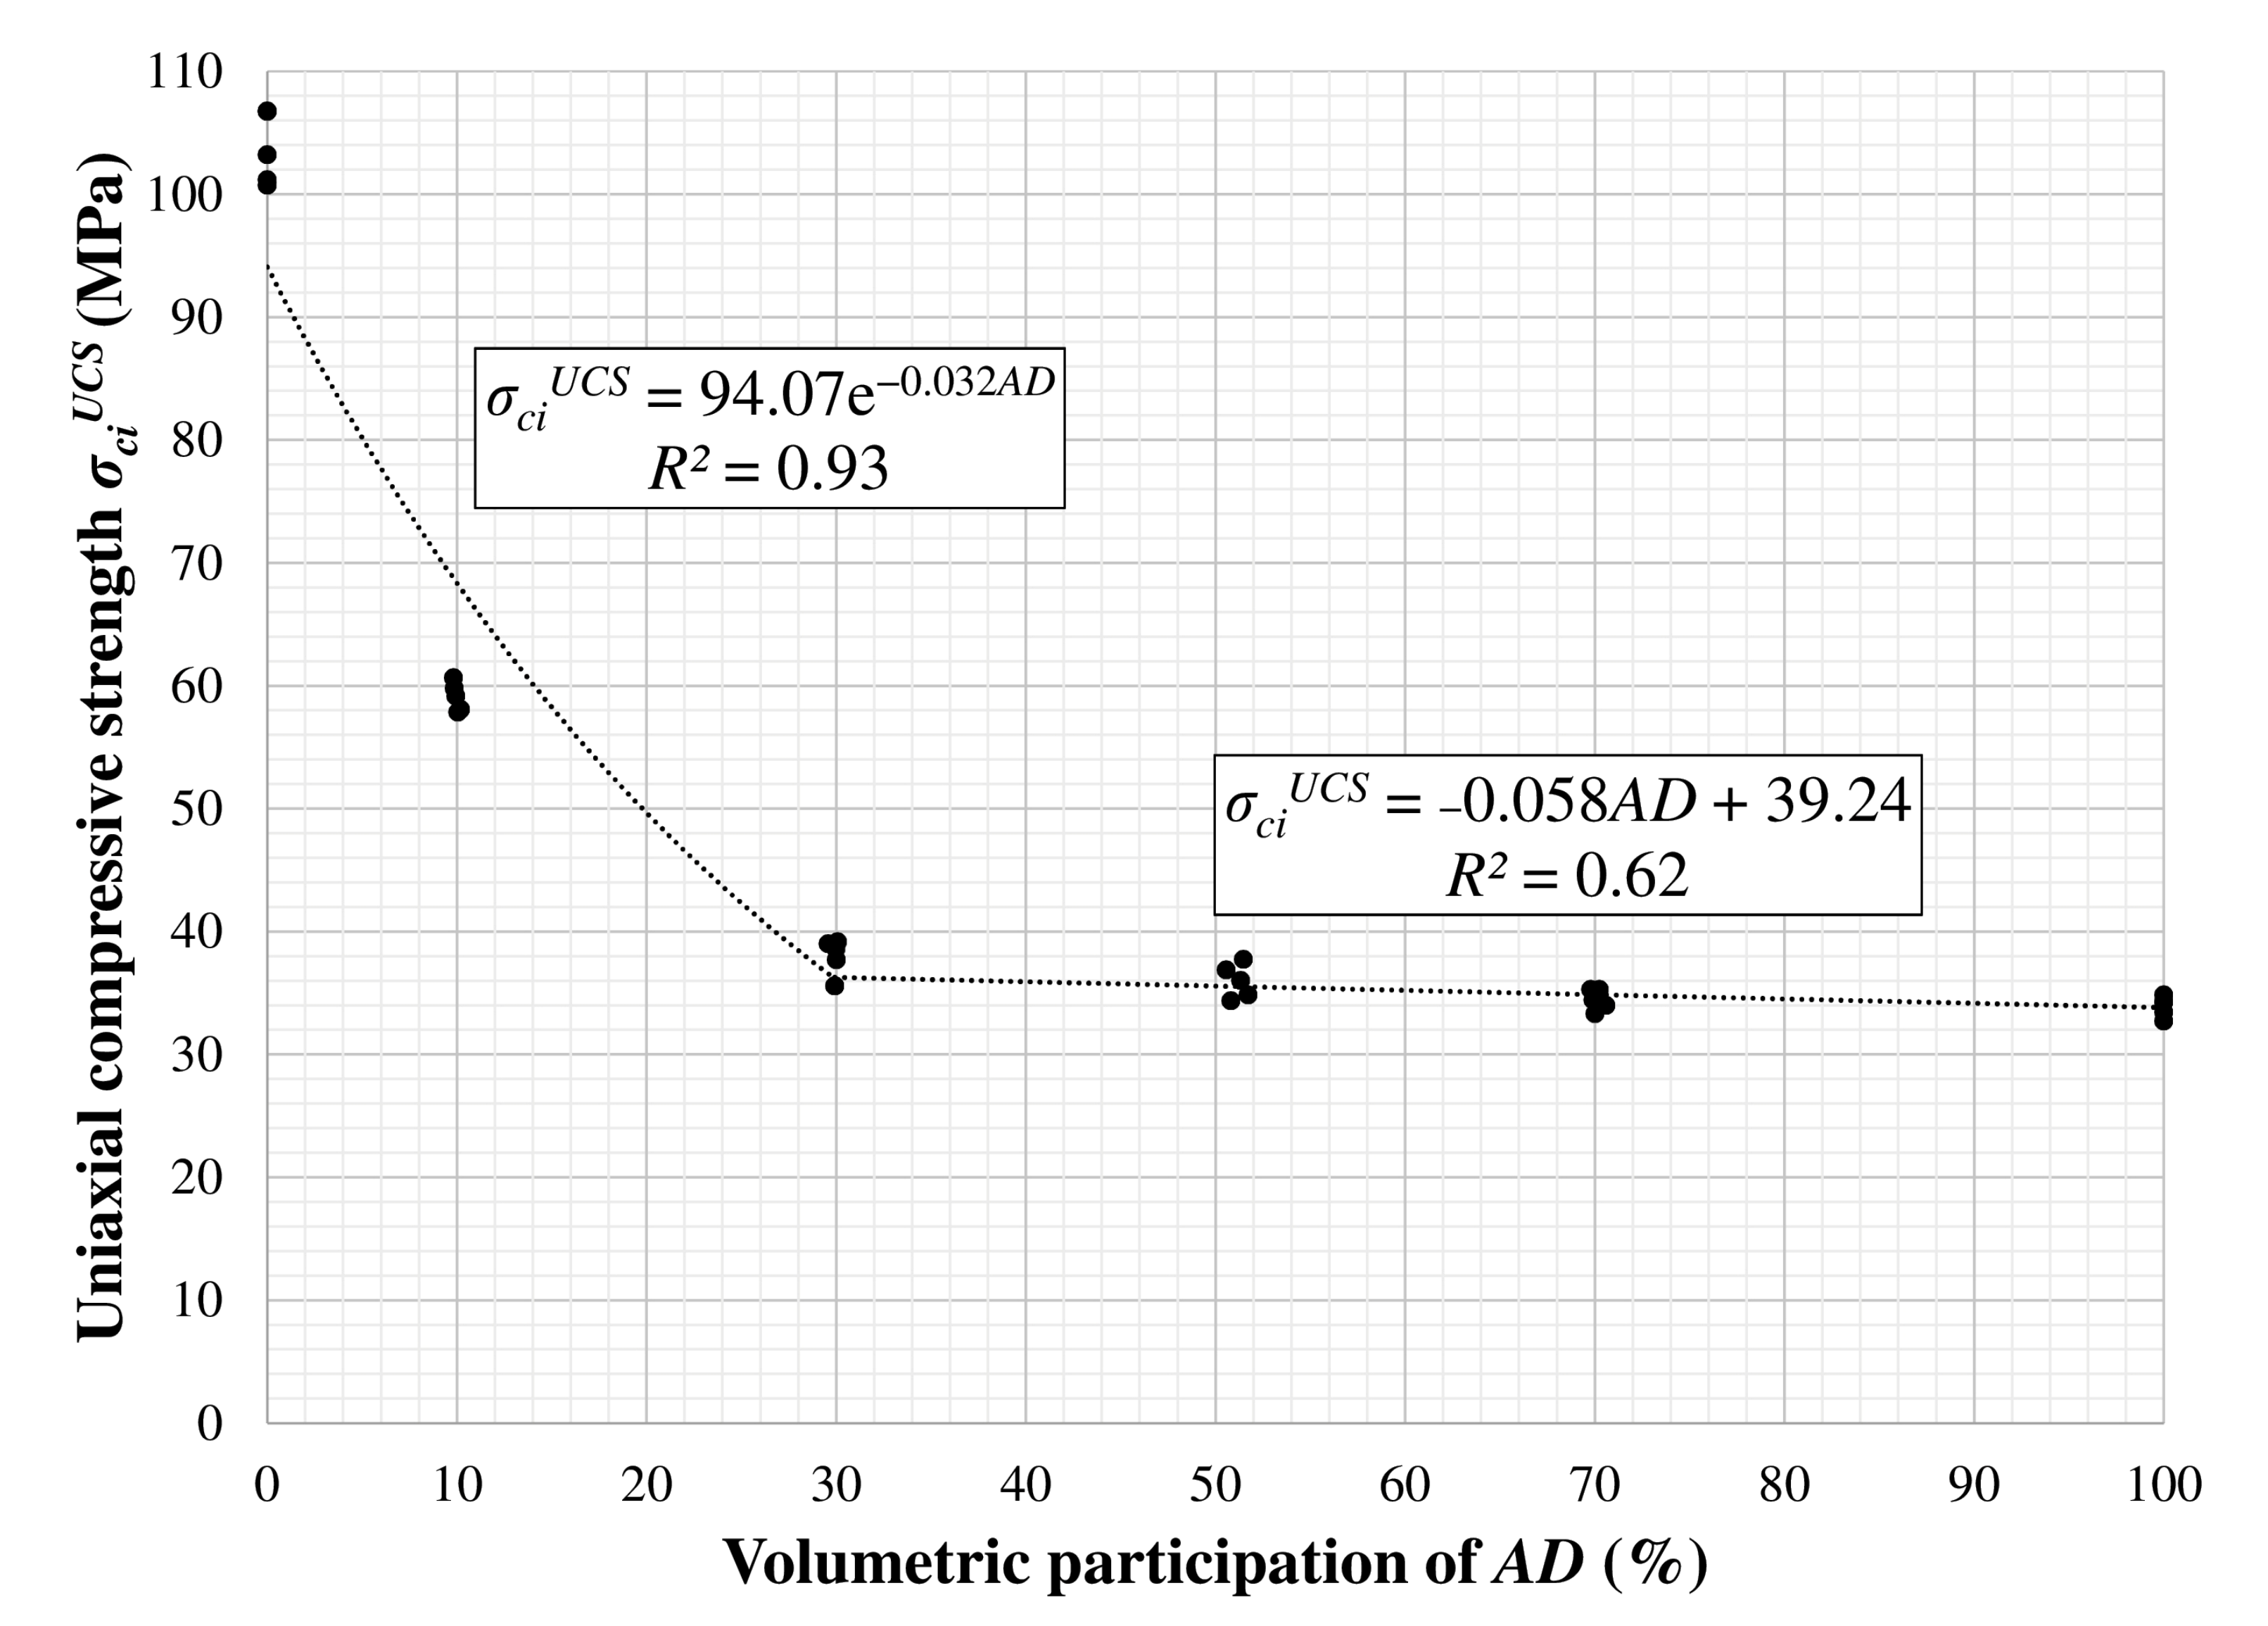
5. Discussion
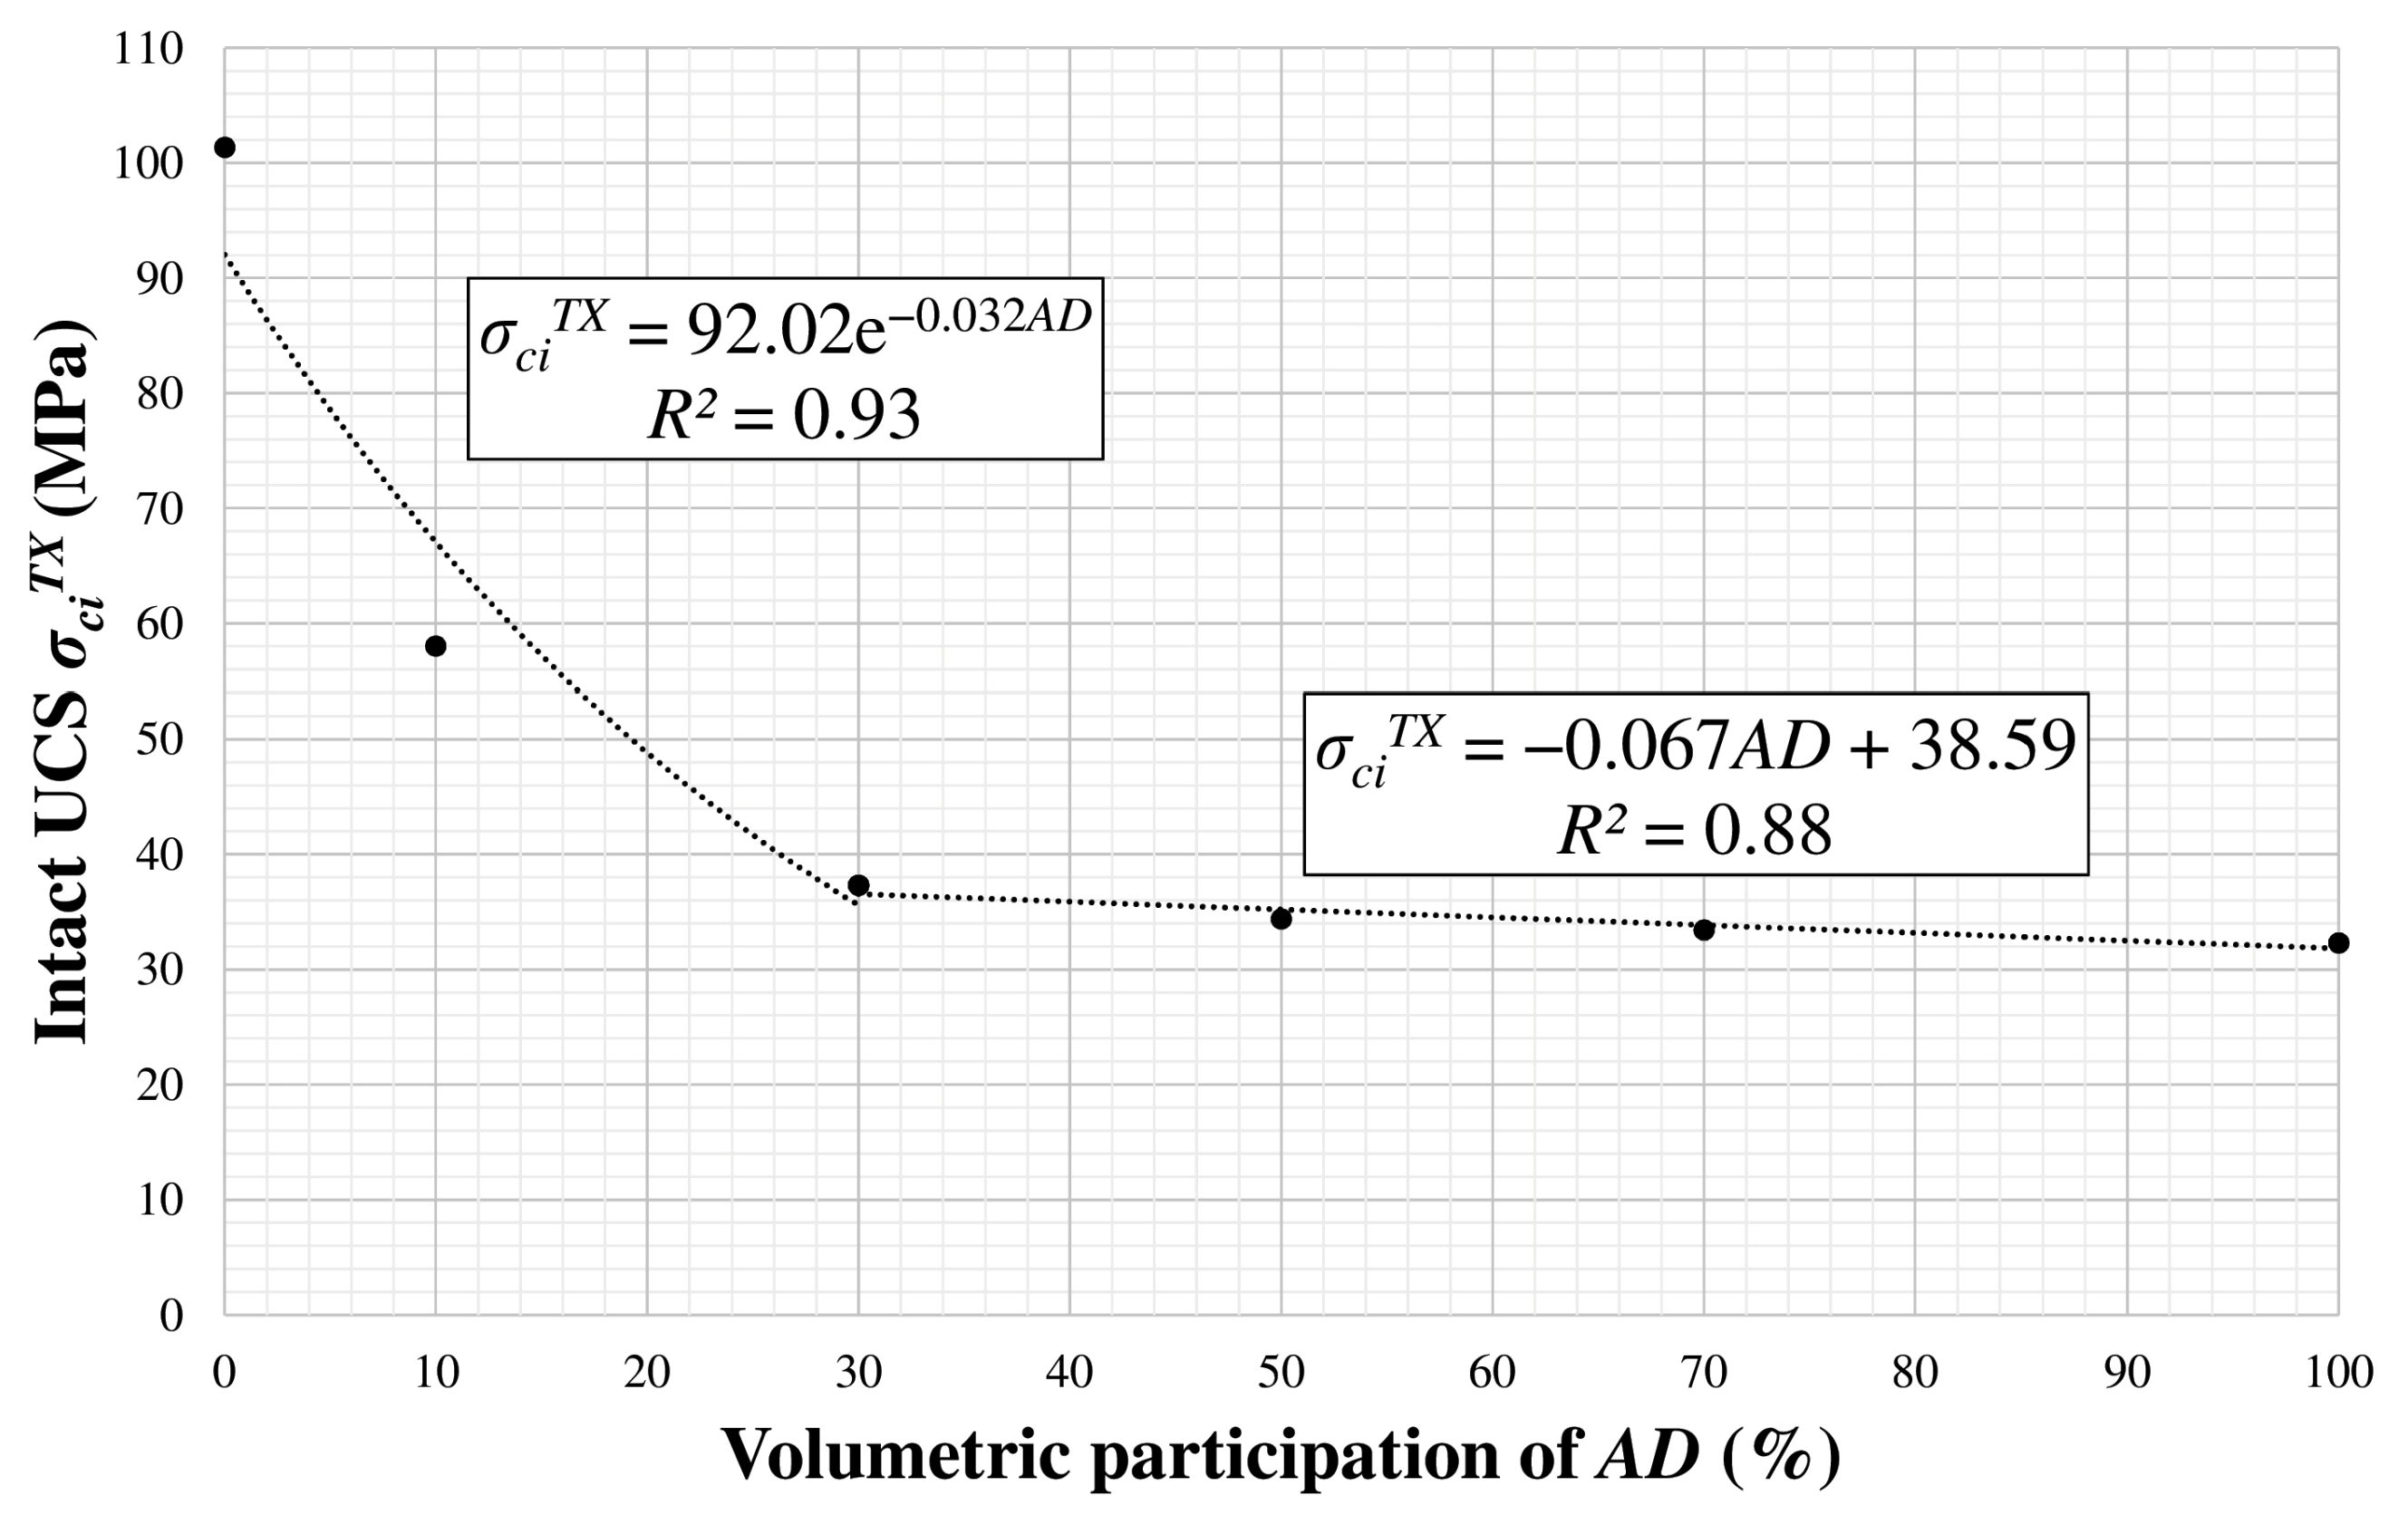
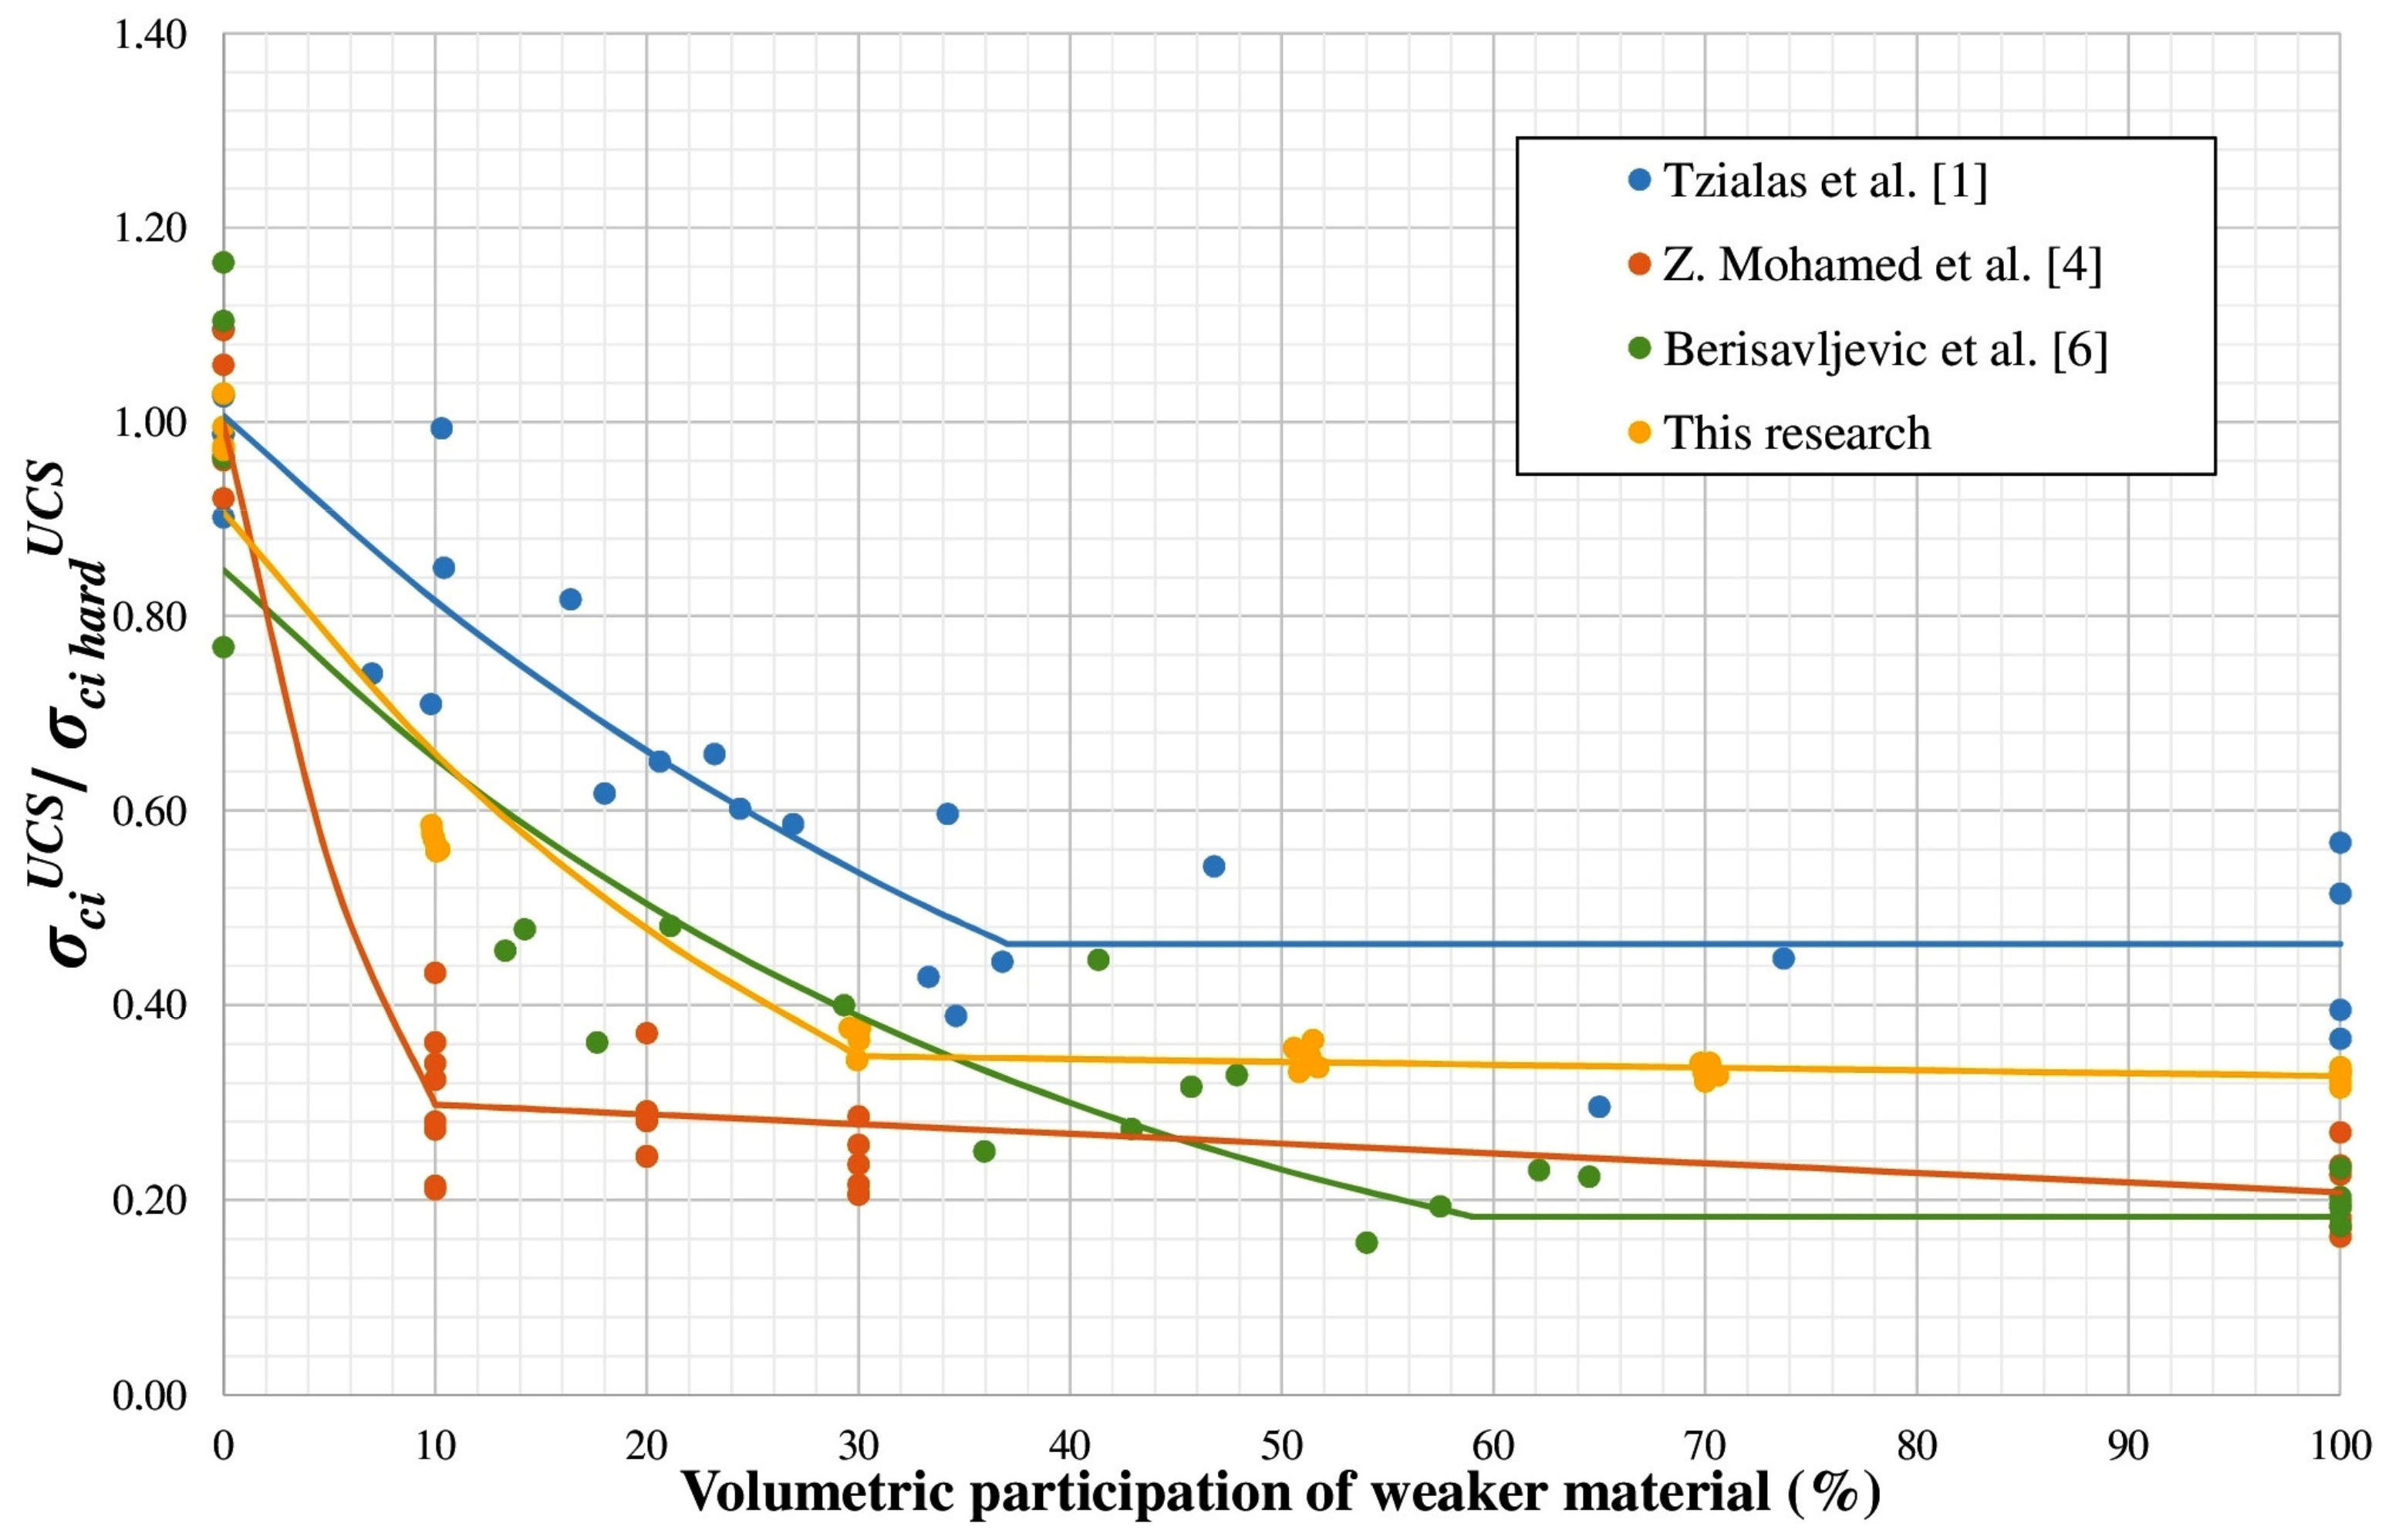
This study includes laboratory UCS and triaxial tests of the composite specimens consisting of dacite and altered dacite, which have not been investigated so far. In previous studies, to make the composite specimens test results comparable, the intact UCS of each composite specimen (
σciUCS) were normalized by the more robust material average intact UCS (
σci hardUCS), giving the ratio
σciUCS/
σci hardUCS. This study determined the higher values of compressive strength of dacite and altered dacite rock material. The same approach was applied in this paper. Based on the previously presented analysis procedure, the comparison of the present results and the results of previous research and testing of composite samples [
1,
4,
6] are shown in
Figure 15.
Tziallas et al. [
1] have emphasized that the strength decrease gradient directly depends on the hard and weak rock materials’ intact UCS ratio. This study shows a ratio of
σci hardUCS/
σci weakUCS = 2.2 and a moderate strength decrease gradient to about 38% of weaker rock material, leading the values to be approximately equal to intact UCS of weaker rock material. On the other hand, in Z. Mohamed et al. [
4] study, the ratio was
σci hardUCS/
σci weakUCS = 4.4 and strength decrease has a steeper gradient to about 10% of weaker rock material, where the strength decreases by about 70%. Afterward, it linearly decreases to 100% of the compressive strength of the weaker rock material. Finally, the Berisavljević et al. [
6] study ratio was
σci hardUCS/
σci weakUCS = 5. Although this ratio is higher than in two previous studies, the strength decrease has a lower gradient to about 59% of weaker rock material, where the strength decreases by about 70%, and later, the values were approximately equal to intact UCS of weaker rock material. In the present study, the ratio is
σci hardUCS/
σci weakUCS = 3.1, and strength decrease has a steeper gradient up to 30% of weaker rock material, after which it almost linearly decreases to 100% of the value of weaker rock material.
The comparison between the results of this study with the previous one (
Figure 16) shows that the strength decreases in Tziallas et al. [
1] and Berisavljević et al. [
6] have the same gradient in the range of 0% to 30%, and it is a slightly lower gradient compared to this study. However, Z. Mohamed et al. [
4] study showed a much steeper strength decrease gradient, i.e., a large difference in strength was determined for specimens with 0 and 10% of the weaker rock material. Thus, the exponential trendline in Tziallas et al. [
1] ends at 37% of the weaker rock material, and the ratio
σciUCS/
σci hardUCS = 0.47. In Z. Mohamed et al. [
4], it ends at 10% of the weaker rock material and the ratio
σciUCS/
σci hardUCS = 0.30, while in Berisavljević et al. [
6], the exponential trendline ends at 59% of the weaker rock material and the ratio
σciUCS/
σci hardUCS = 0.18. In the present study, the exponential trendline ends at a value of 30% of the weaker rock material and the ratio
σciUCS/
σci hardUCS = 0.34. After the stated values, in Tziallas et al. [
1] and Berisavljević et al. [
6], the ratio
σciUCS/
σci hardUCS is constant up to 100% of the weaker rock material, while in Z. Mohamed et al. [
4] study, the
σciUCS/
σci hardUCS ratio decreases linearly. In the present study, the strength decrease is significantly lesser than the one determined by Z. Mohamed et al. [
4], concluding the
σciUCS/
σci hardUCS ratio is approximately constant.
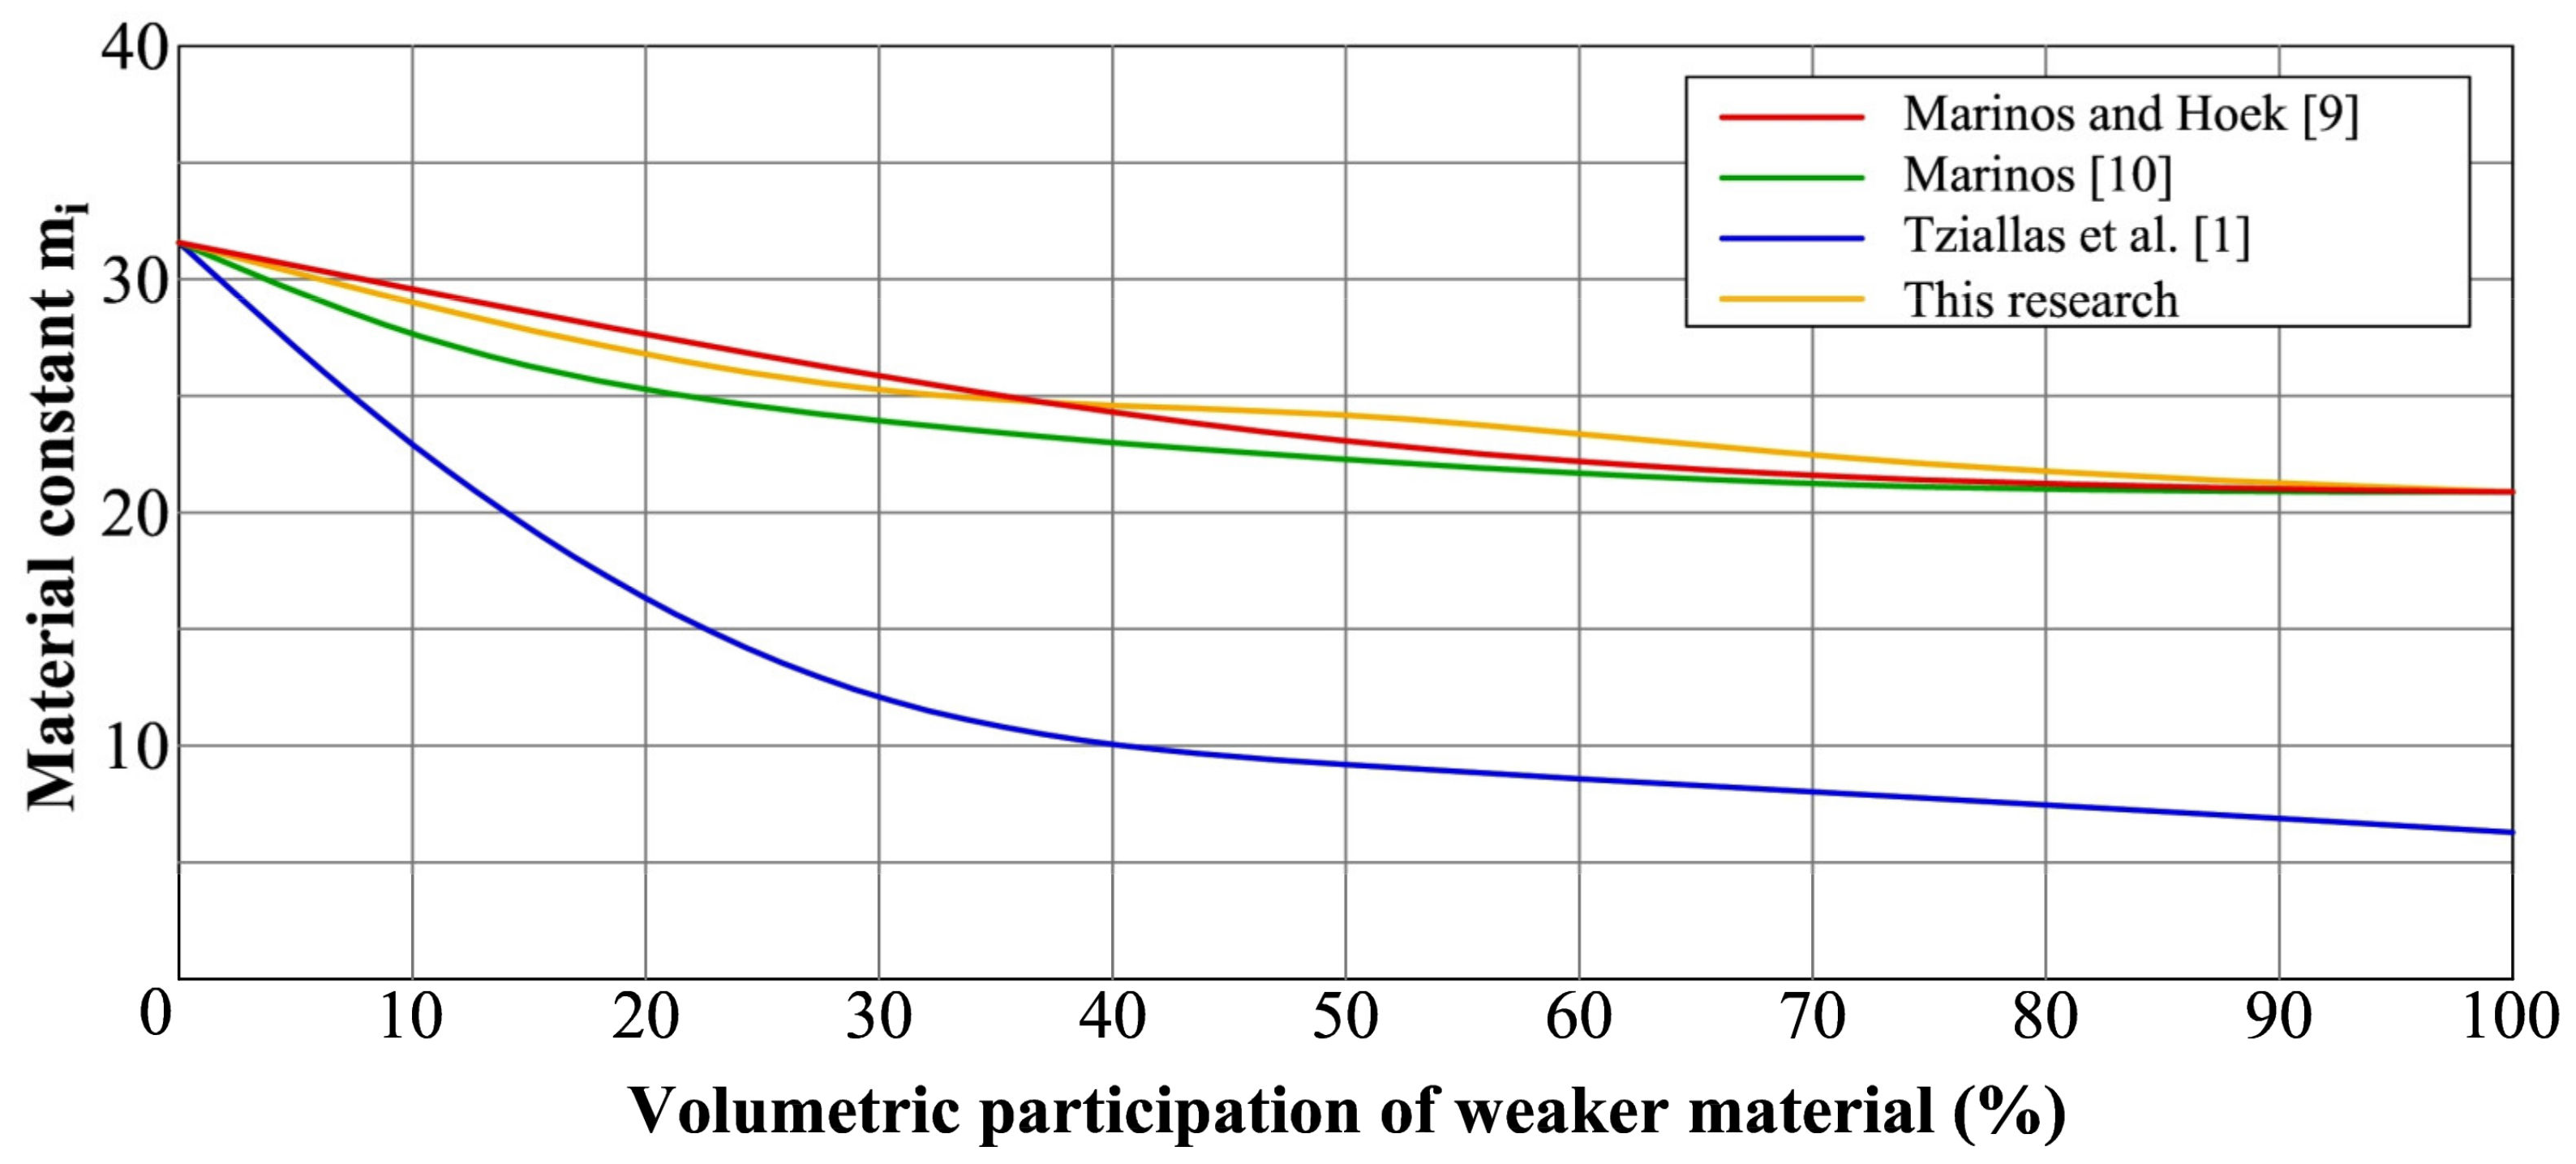
Marinos and Hoek [
9] proposed a practical method for determining the intact strength properties of a heterogeneous rock mass. The authors suggested that it is not appropriate to use properties of stronger rock material to determine the overall strength of heterogenous rock mass. They also suggested that using the intact properties of the weaker rock material only is too conservative. Consequently, it is advised that the strength properties of the heterogeneous rock mass should be determined as the weighted average of
σci and
mi of intact strength properties of stronger and weaker rock material depending on their participation in the rock mass. In addition, when estimating the strength parameters of the heterogeneous rock mass, it is proposed to use the stronger rock material strength values reduced by 20% to 60%, depending on its participation and the structure of the heterogeneous rock mass. Based on these recommendations, the intact strength properties of a heterogeneous rock mass
σci and
mi were determined for 0%, 50%, and 100% of the weaker rock material (altered dacite) volumetric participation. The dependence of the
σci and
mi parameters and the altered dacite volumetric participation is presented in
Figure 16 and
Figure 17.
Marinos [
10] expanded and modified the original practical method for determining the intact strength properties of a heterogeneous rock mass. In this method, too, the strength properties of a heterogeneous rock mass
σci and
mi are determined as the weighted average of
σci and
mi of intact strength properties of stronger and weaker rock materials depending on their participation in the rock mass. Accordingly, the recommendation was to use the stronger rock material strength values reduced by 10% to 40%, depending on its participation and the structure of the heterogeneous rock mass when estimating the strength parameters of the heterogeneous rock mass. The values of intact strength properties of a heterogeneous rock mass
σci and
mi for 0%, 10%, 30%, 50%, 70%, and 100% of the weaker rock material (altered dacite) participation determined based on these recommendations are shown in
Figure 16 and
Figure 17.
Tziallas et al. [
1] performed triaxial laboratory tests of a group of composite specimens with around 16% of the weaker rock material participation. Based on the performed test results, the intact UCS
σci and constant
mi were determined according to the Hoek–Brown failure criterion. In addition, the authors proposed an equation that can be used to estimate the values of the constant
mi depending on weaker rock material volumetric participation expressed as Equation (8). According to the proposed dependence for
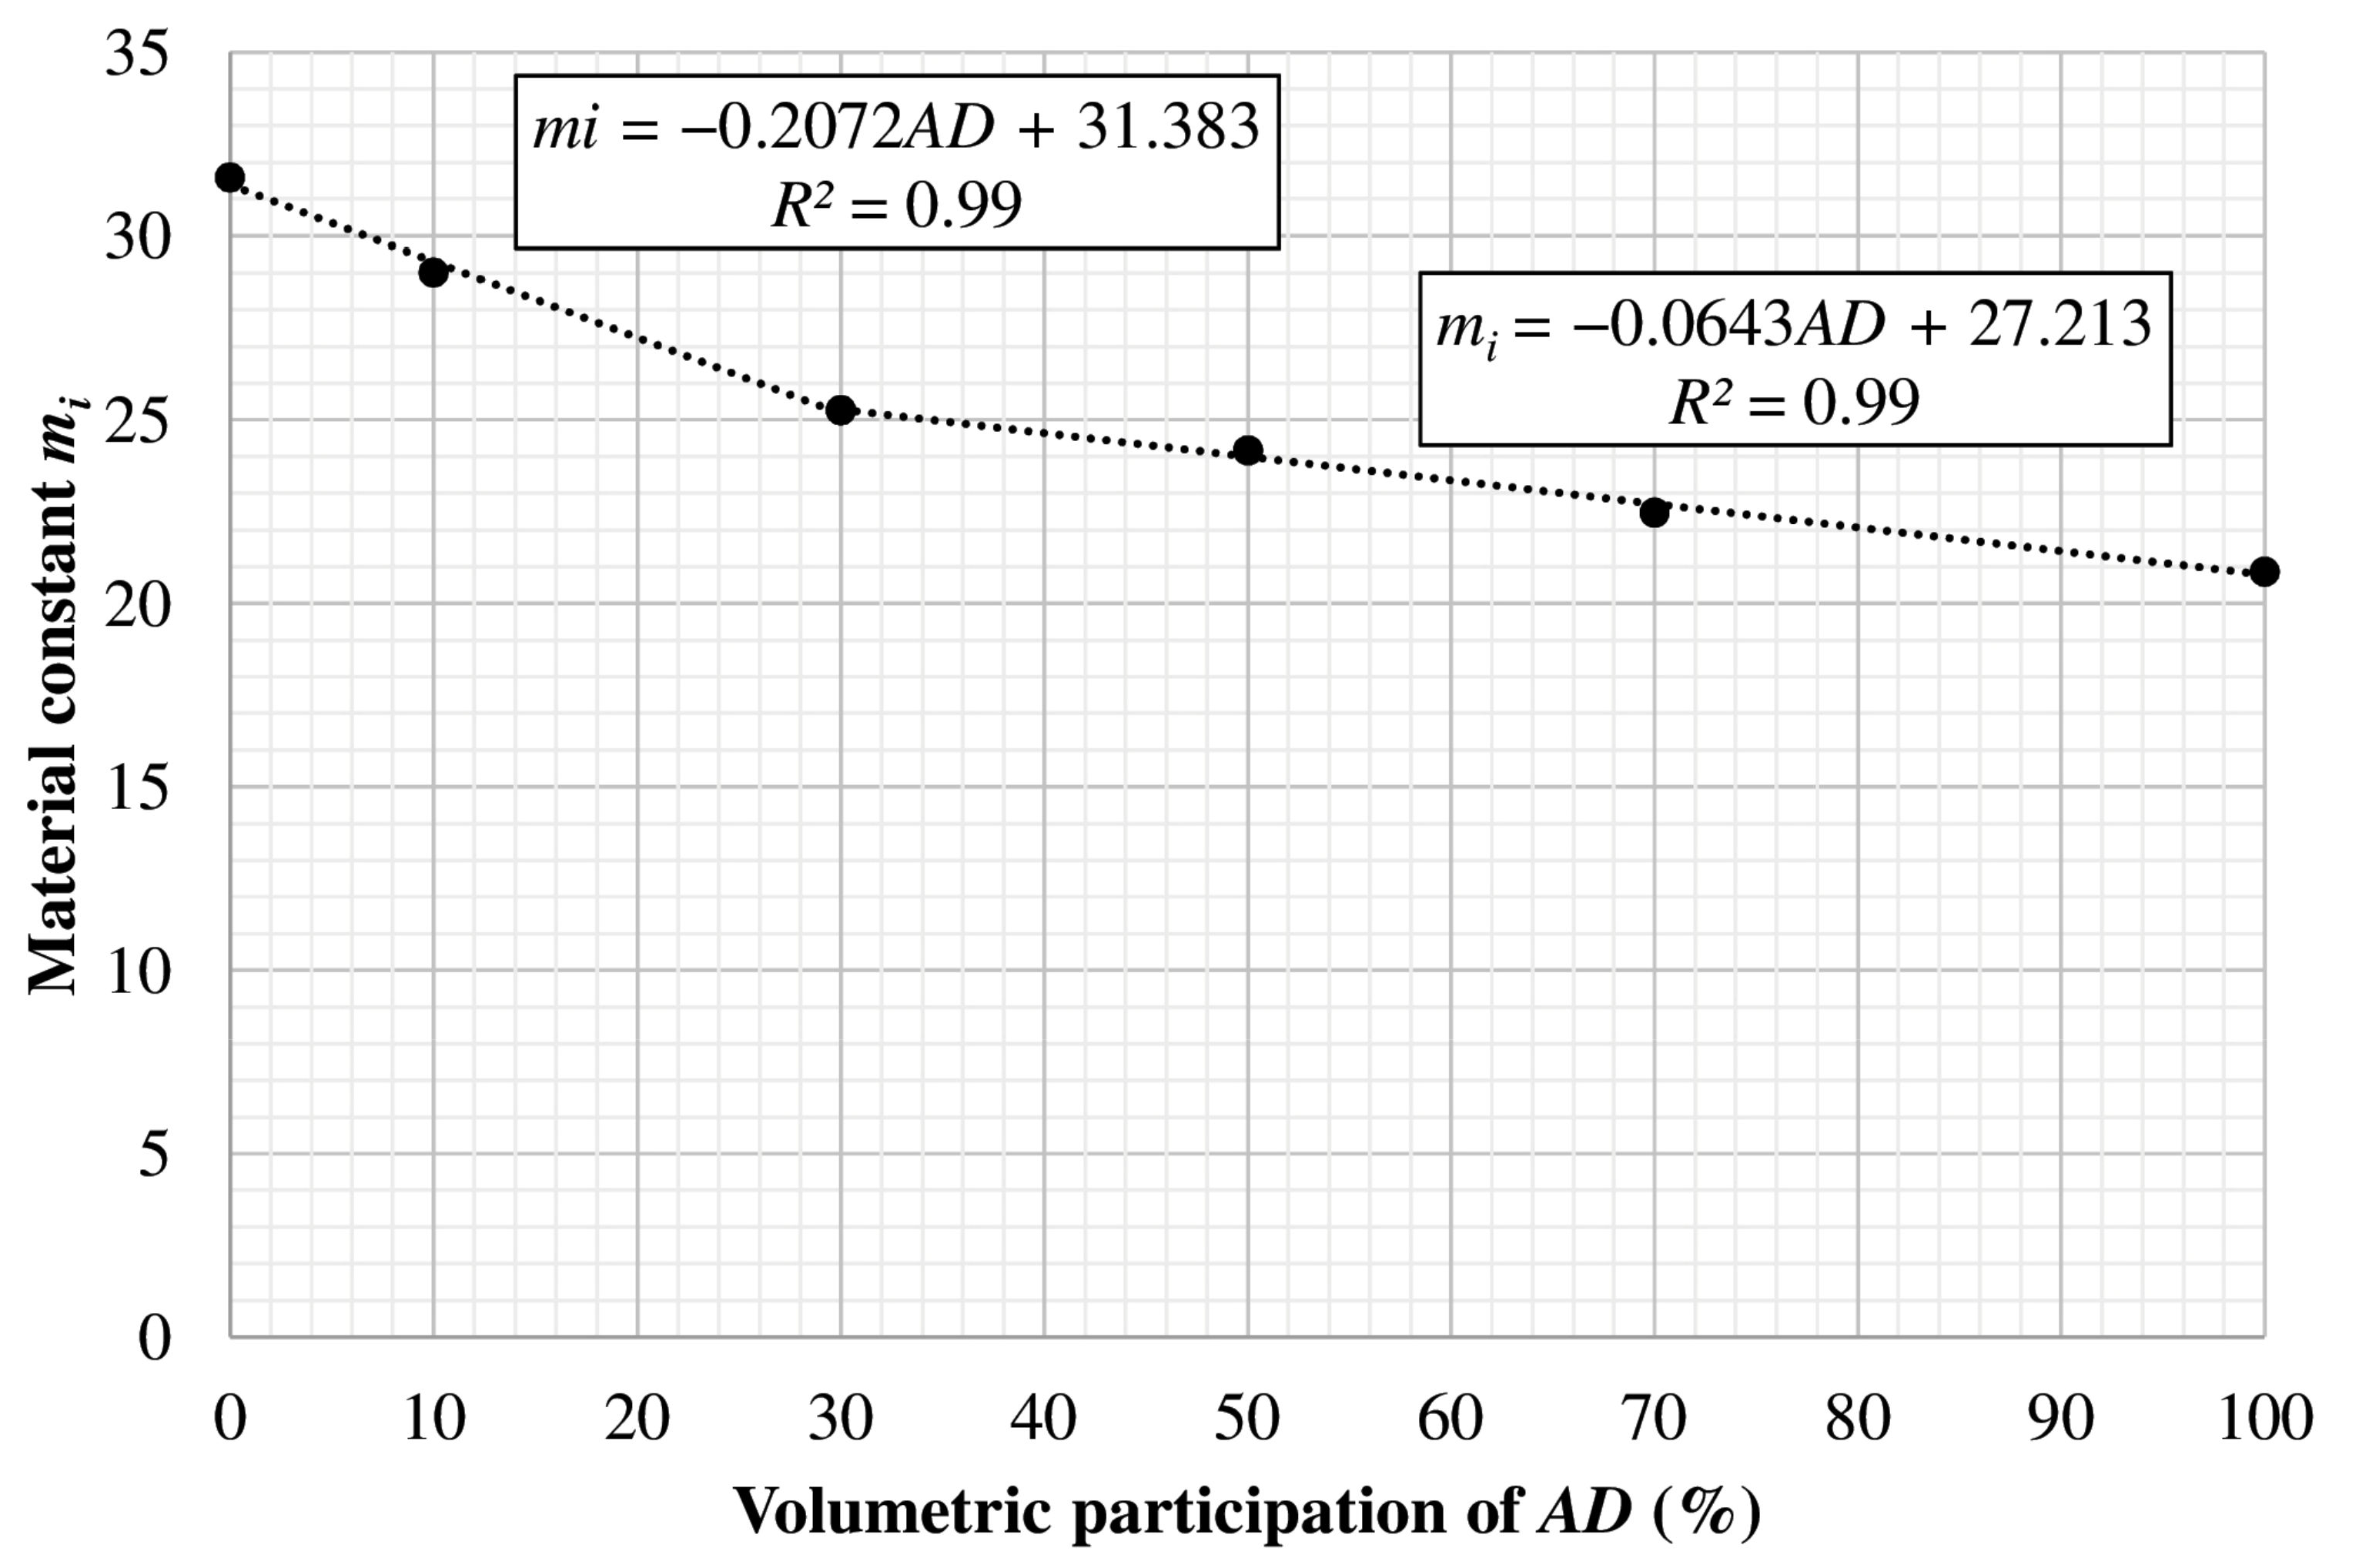
mi, for the present study, the dependence of the constant
mi and volumetric participation of the weaker rock material is as Equation (9). The values of the constant
mi for 0%, 10%, 30%, 50%, 70%, and 100% of the weaker rock material (altered dacite) volumetric participation determined based on the previously presented equation are shown in
Figure 16.
where:
SL—volumetric participation of siltstone [
1],
AD—volumetric participation of altered dacite.
By analyzing the comparison of the present study results and the recommendations given in the presented literature [
9,
10], it can be observed that the intact UCS
σci determined in these studies are significantly lower than the values determined based on the Marinos and Hoek [
9] and Marinos [
10] practical methods (
Figure 16). The previous conclusion indicates that the application of these practical methods for estimating the
σci has certain limitations and that both methods overestimate the values of intact UCS
σci. On the other hand, the constant
mi determined by the present study significantly correlates to the values determined according to practical methods given by Marinos and Hoek [
9], and Marinos [
10] (
Figure 17). Therefore, applying both of these practical methods for constant
mi estimation is justified, so in this way, one can obtain a realistic estimation of the heterogeneous intact rock mass constant
mi. The constant
mi determined using the procedure proposed by Tziallas et al. [
1] is significantly lower than the values determined by the present study.
Marinos and Hoek [
9] proposed values of the constant
mi for intact rock by the rock group, while for dacite, the recommended value for
mi = 25 ± 3. In the present study, the values of constant
mi varied from 20.871 to 31.581. However, the overall interval of constant
mi values refers to dacite and altered dacite and the transition zone between these two rock materials. Based on the dependence of the constant
mi and the altered dacite (
AD%) volumetric participation (
Figure 17), the overall interval of the
mi value can be divided into two intervals. The first interval includes values for 0% to 30% of altered dacite (
AD%) volumetric participation, where the constant is
mi ranges from 20.871 to 25.267. However, the second interval includes values for 30% to 100% of altered dacite (
AD%) volumetric participation, where the constant
mi ranges from 25.267 to 31.581.
6. Conclusions
In order to define the influence of lithological heterogeneity on the Hoek–Brown failure criterion parameters, uniaxial compressive strength and triaxial tests on specially prepared composite specimens of rock material were performed. Composite specimens were meant to represent the transitional zone. They also comprised dacite and altered dacite discs with different volumetric (thickness) ratios. Consequently, monolith specimens consisting of dacite and altered dacite were made.
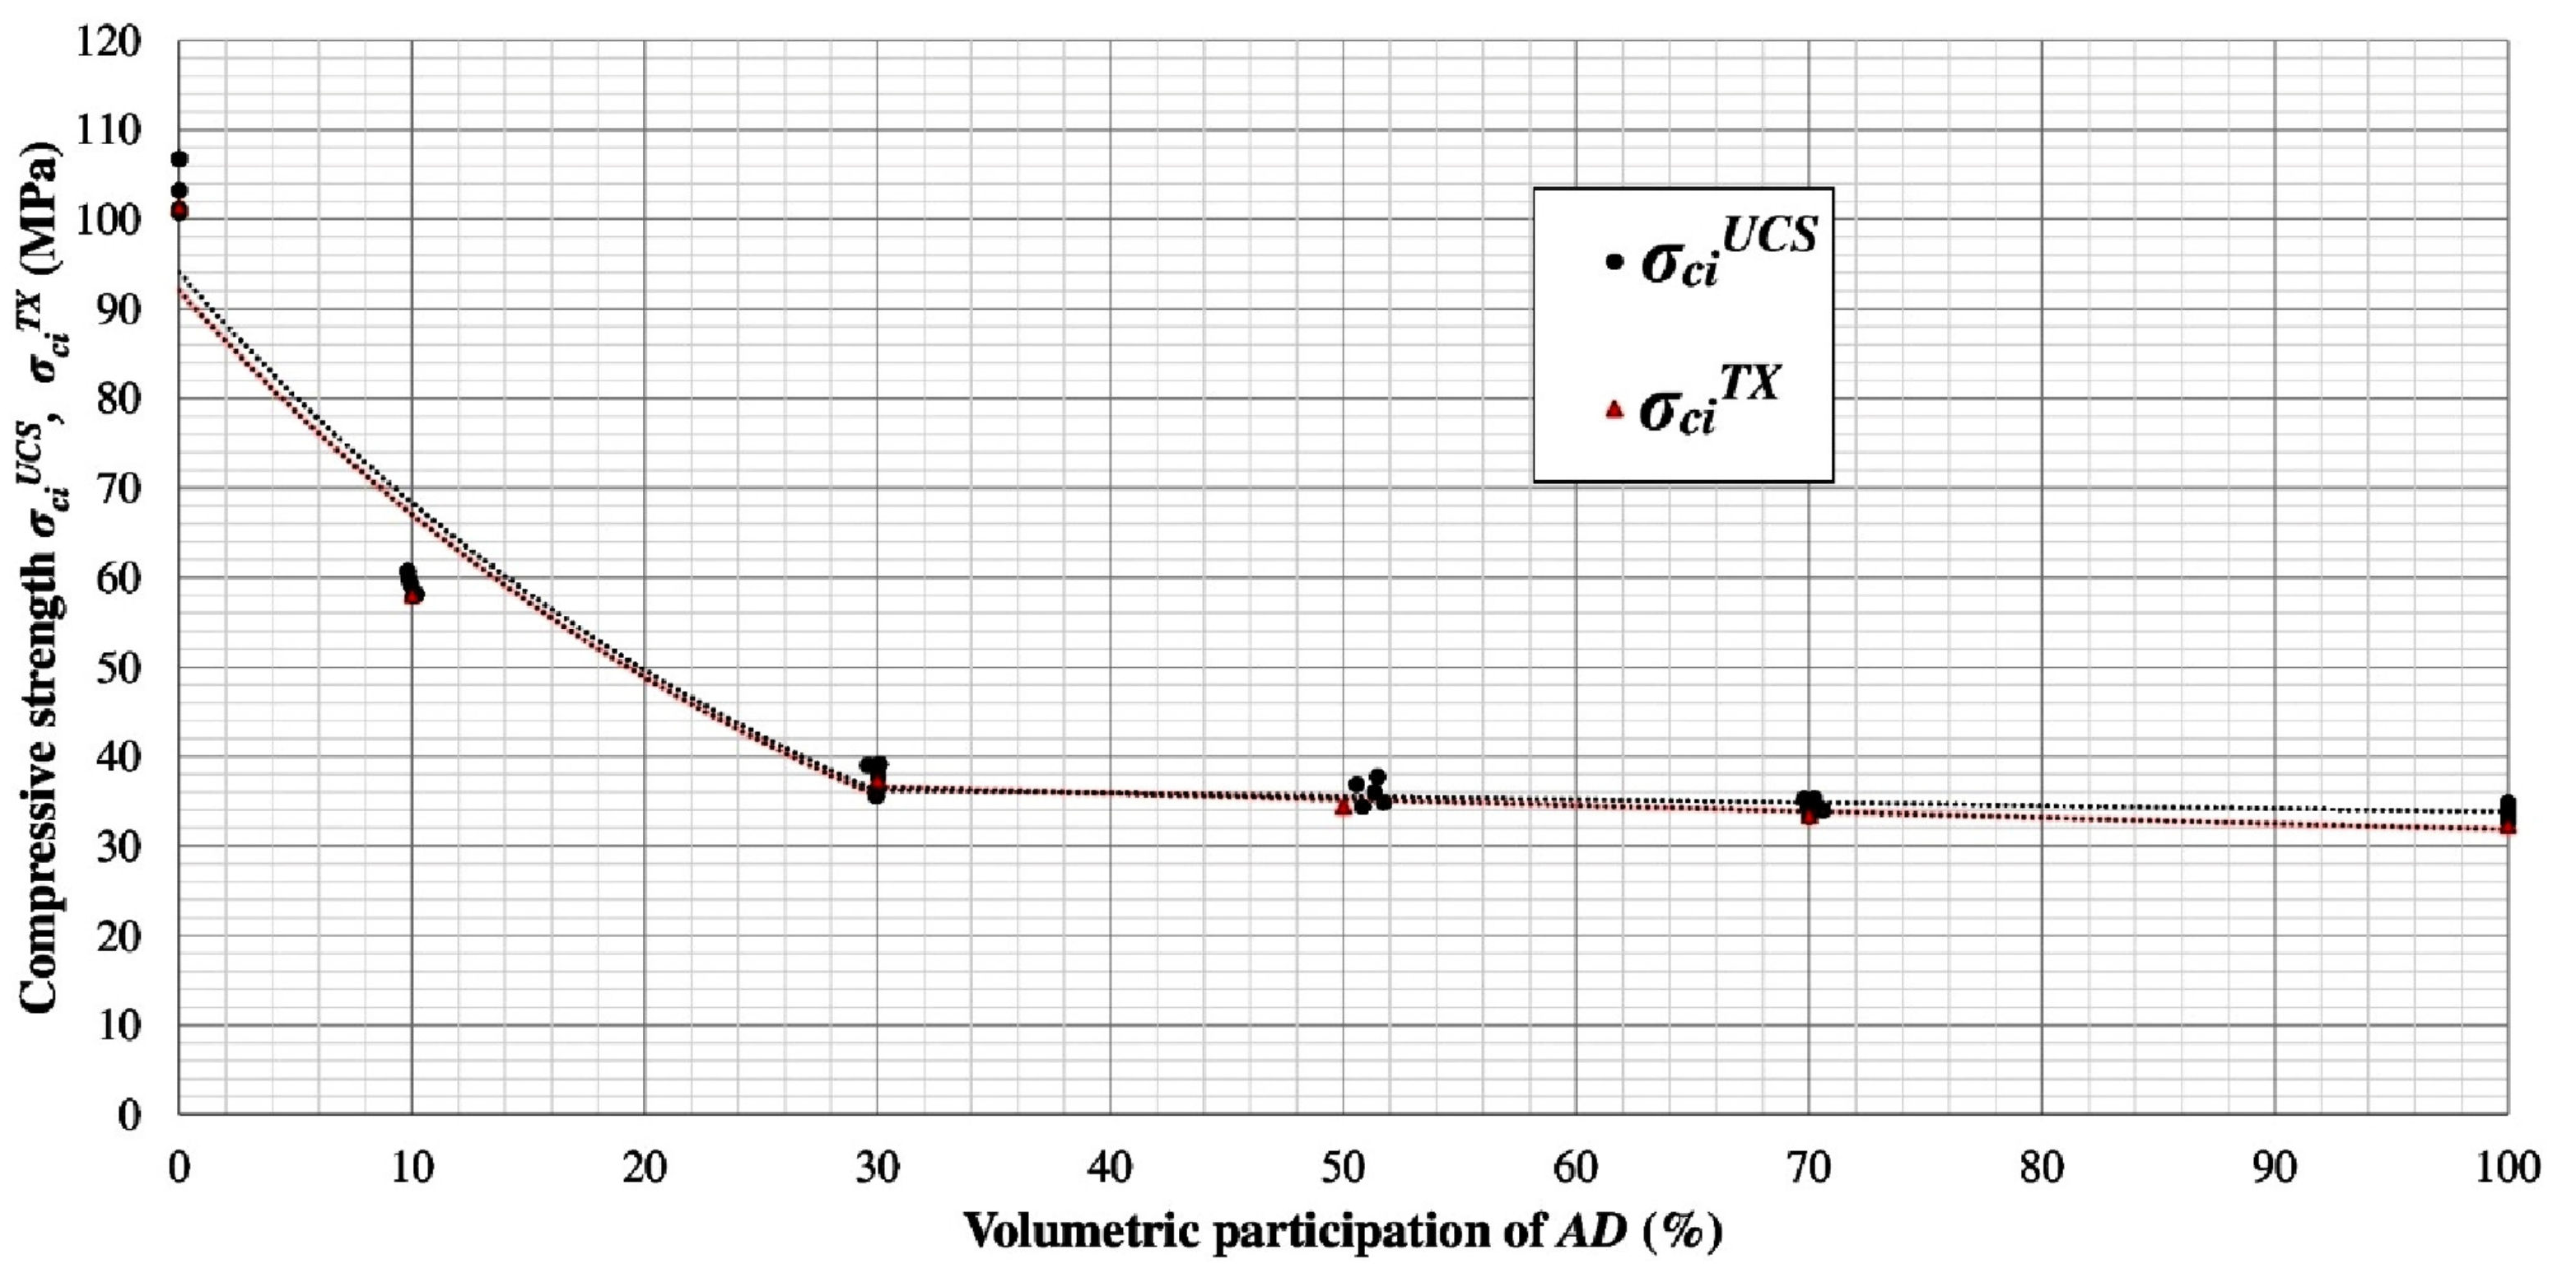
According to the test results, both UCS-
σciUCS and intact UCS-
σciTX dependence on altered dacite (
AD%)-volumetric participation can be divided into two zones. The first zone includes test results of dacite specimens (0% AD) and composite specimens with 10% and 30% volumetric participation of altered dacite. In this zone, the UCS-
σciUCS and intact UCS-
σciTX decreases exponentially from the initial value (100%) to around 37%. In the second zone, the composite specimens with 30% and more volumetric participation of altered dacite show slightly reduction of UCS-
σciUCS and intact UCS-
σciTX and are approximately equal to the altered dacite UCS-
σciUCS and intact UCS-
σciTX (
Figure 18).
The gradient of the strength decrease (as indicated by the
σci hardUCS/
σci weakUCS ratio and
σci hardTX/
σci weakTX) did not match the findings of Tziallas et al. [
1] and Berisavljević et al. [
6]. The reasons for this should be sought in the effect of rock material mineralogical-petrographic composition and micro-heterogeneity (heterogeneity on the level of mineral grains of individual rock types).
The values of the constant mi are calculated based on triaxial tests results, and the overall interval of constant mi values could be generally expressed as mi = 26 ± 6. The overall interval of constant mi values refers to dacite and altered dacite and the transition zone between these two rock materials and can be divided into two intervals. Namely, for the first interval (0% to 30% of AD), it is possible to define the value of the constant mi = 28 ± 3, which refers to dacite. However, for the second interval (30% to 100% AD), the constant value is mi = 23 ± 3, which refers to altered dacite. The presented values of constant mi indicate that a detailed assessment of the rock material alteration degree is essential when estimating the constant mi value.
The suggested methodology for determining heterogeneous rock mass strength parameters and presented rock material strength parameters depends on determining the influence of rock material heterogeneity on the values UCS-σciUCS, intact UCS-σciTX, and constant mi. However, intact UCS-σciTX and constant mi dependences define more reliable rock material strength parameter values that can be used, along with rock mass classification systems, as a basis for assessing rock mass input parameters necessary for geotechnical stability analysis and detailed design solutions.


 ,
, 


